truck shovel productivity the historical …summit.sfu.ca/system/files/iritems1/15566/robin...
TRANSCRIPT
TRUCK SHOVEL PRODUCTIVITY
THE HISTORICAL AND FUTURE STRATEGIC ADVANTAGE FOR
TECK COAL
by
Robin Sheremeta
Bachelor of Applied Science Mining and Mineral Process Engineering
University of British Columbia, 1985
PROJECT SUBMITTED IN PARTIAL FULFILLMENT OF
THE REQUIREMENTS FOR THE DEGREE OF
MASTER OF BUSINESS ADMINISTRATION
In the MBA Program
of the
Faculty
of
Business Administration
© Robin Sheremeta 2015
SIMON FRASER UNIVERSITY
Fall 2015
All rights reserved. However, in accordance with the Copyright Act of Canada, this work
may be reproduced, without authorization, under the conditions for Fair Dealing.
Therefore, limited reproduction of this work for the purposes of private study, research,
criticism, review and news reporting is likely to be in accordance with the law,
particularly if cited appropriately.

i
Approval
Name: Robin Sheremeta
Degree: Master of Business Administration
Title of Project: Truck Shovel Productivity; the Historical and Future
Strategic Advantage for Teck Coal
Supervisory Committee:
___________________________________________
Dr. Ian P. McCarthy
Senior Supervisor
Professor in Technology & Operations Management
Associate Dean, Graduate Programs
___________________________________________
Dr. Michael Parent, MBA, PhD, ICD.D
Second Reader
Professor & Director-Centre for Corporate Governance &
Risk Management
Date Approved: Augusr 6th, 2015
ii
Abstract
The coal business unit of Teck will move over 300 million bank cubic metres of material
or approximately 800 million tonnes in 2015 using a fleet of large haul trucks and shovels. The
mining and maintenance costs alone to move this material will be approximately $1.3 billion.
The cost of loading and hauling the material will be approximately half that cost and represents
the single largest cost of producing steelmaking coal. This thesis will focus on truck/shovel
productivity in the coal business unit of Teck as this represents one of the most significant areas
of opportunity for cost reduction. A 10% improvement in truck/shovel productivity could yield a
return approaching $100 million. I have identified significant gaps in the relative performance
between the operations and identified the operation that consistently demonstrates the highest
performance. That performance is a result of both a high level of operating standards as well as a
culture that has long embraced productivity as a core value. I am proposing that Teck consolidate
and expand on the work done to identify best practice in truck/shovel productivity at the
Greenhills operation. Further, I am proposing that we leverage the process used in developing a
culture of safety in Teck to develop a framework for developing a culture of productivity across
both the coal business unit and Teck as a company.
iii
Acknowledgements
I wish to thank all the professors at SFU for their instruction, guidance and support over
the past several years. The MBA program has provided me valuable insight into the many
aspects of my field and industry. Teck and I are better for the experience.
I would also like to thank Teck for providing me this opportunity. It is truly appreciated.
I was supported and encouraged throughout the program and this helped balance what was a
considerable load.
Finally, I would like to thank my family and in particular, my wife Clare for their
patience and support throughout.
iv
Table of Contents
Approval ........................................................................................................................................... i
Abstract .......................................................................................................................................... ii
Acknowledgements ....................................................................................................................... iii
Table of Contents ........................................................................................................................... iv
List of Figures ................................................................................................................................ vi
1: Introduction ................................................................................................................................ 1
2: The nature of Pricing Cycles in the Steelmaking Coal Industry ........................................... 4
2.1 The first major pricing cycle in the modern steelmaking coal industry .................................. 4
2.2 The second major pricing cycle in the modern steelmaking coal industry ............................. 8
3: The Analysis – the Steelmaking Coal Industry at this Stage of the Market Cycle ............. 11
3.1 Industry Definition ................................................................................................................ 11
3.1.1 Products: ................................................................................................................... 11 3.1.2 Customers: ................................................................................................................ 11 3.1.3 Competitors: ............................................................................................................. 12 3.1.4 Geographic area: ...................................................................................................... 13 3.1.5 Summary of Industry Definition: ............................................................................. 14
3.2 Industry Dynamics: ............................................................................................................... 14
3.2.1 Potential Entrants: .................................................................................................... 15 3.2.2 Substitutes: ............................................................................................................... 16 3.2.3 Supplier Power: ........................................................................................................ 17 3.2.4 Buyer/Customer Power: ........................................................................................... 18 3.2.5 Regulators: ............................................................................................................... 19 3.2.6 Complementors: ....................................................................................................... 20 3.2.7 Industry Competitors: ............................................................................................... 21
3.3 Gap Analysis ......................................................................................................................... 22
3.3.1 Cost of Capital and Capital Invested: ....................................................................... 22 3.3.2 Sales Volume: .......................................................................................................... 23 3.3.3 Price: ........................................................................................................................ 23 3.3.4 Average Cost: ........................................................................................................... 23
3.4 Chapter Summary .................................................................................................................. 25
4: The Response - Establishing the Opportunity for Profit through Productivity ................. 26
4.1 Fixed times ............................................................................................................................ 27
4.1.1 Operating Strategy.................................................................................................... 28 4.1.2 Operator Skill and Engagement ............................................................................... 29 4.1.3 Summary of fixed time analysis ............................................................................... 29
4.2 Variable times ....................................................................................................................... 30
4.3 Operational characteristics and techniques that maximize truck shovel productivity ........... 31
4.4 Proposed Response to establish best practice across Teck .................................................... 32

v
5: The Implementation Plan ........................................................................................................ 34
5.1 Establishing a Sense of Urgency ........................................................................................... 34
5.1.1 Engage the unions .................................................................................................... 35 5.1.2 Identify the common enemy ..................................................................................... 35 5.1.3 Leverage the history of steelmaking coal ................................................................. 36 5.1.4 Summary of “Creating a Sense of Urgency” ............................................................ 36
5.2 Forming a Powerful Guiding Coalition ................................................................................. 36
5.3 Creating a Vision ................................................................................................................... 37
5.4 Communicating the Vision .................................................................................................... 37
5.5 Empowering others to act on the vision ................................................................................ 38
5.6 Planning and creating short term wins .................................................................................. 39
5.7 Consolidating improvements and Institutionalizing new approaches ................................... 39
6: Conclusion ................................................................................................................................. 40
References ..................................................................................................................................... 41
vi
List of Figures
Figure 2-1: Demand and Oversupply stages of First Major Pricing Cycle ...................................... 5
Figure 2-2: Survival Phase of First Major Pricing Cycle ................................................................. 6
Figure 2-3: Demand and Oversupply Phase of Second Major Pricing Cycle .................................. 8
Figure 2-4: Rapid Market Response in Second Major Pricing Cycle .............................................. 9
Figure 3-1: Overview of primary competitors in the seaborne steelmaking coal market ............... 12
Figure 3-2: Regions where steelmaking coal is produced and where reserves are present ............ 13
Figure 3-3: Porter's Five Forces Model of Current Steelmaking Coal Industry
Competitiveness ........................................................................................................... 14
Figure 3-4: Consolidation of Canadian steelmaking coal mining industry .................................... 15
Figure 3-5: Finished steel consumption per capita ......................................................................... 17
Figure 3-6: Comparison of Permitting Process from the 1970's to Current ................................... 20
Figure 3-7: Components to Profit ................................................................................................... 22
Figure 3-8: Breakdown of Cost Components ................................................................................. 24
Figure 4-1: Comparative Fixed Times ........................................................................................... 27
Figure 4-2: Comparative Variable Times ....................................................................................... 30
Figure 5-1: Quote from Andrew Mackenzie, CEO BHP Billiton .................................................. 35

1
1: Introduction
Teck is a diversified resource company committed to responsible mining and mineral
development. Headquartered in Vancouver, Canada, Teck is the second largest seaborne exporter
of steelmaking coal, a top ten copper producer in the Americas and the third largest producer of
zinc concentrate. Teck’s steelmaking coal operations are all located in Western Canada with five
operations concentrated in the Southeast British Columbia and one in Northwest Alberta. These
six operations combined move approximately 300 million bank cubic metres of material to
produce approximately 27 million tonnes of steelmaking coal per year. This material is moved
using large-scale mining equipment; predominately haul trucks ranging from 218 tonnes to the
largest available class, 363 tonnes.
Teck competes in a world commodity market for steelmaking coal. This market is cyclic
in that the supply demand balance can and has shifted from periods of strong demand with limited
supply (i.e. high margin period) to weak demand with excessive supply (i.e. low margin period).
The aim of Teck is to maximize the profit associated with their long life steelmaking coal
reserves independent of the market cycle they find themselves in. The problem Teck faces is that
operating strategies can vary significantly depending on the nature of the cycle at any given time
and to move from one strategy to another is often challenging.
Teck is currently in the most significant downturn the industry has faced in the last 15
years. This has developed much quicker than anyone anticipated after what was the most
profitable period the industry had seen since the late 1970s. The problem Teck faces is the rapid
expansion of steelmaking coal capacity globally during the high margin period has now lead to a
massive oversupply and consequently the industry now finds itself in a very challenging market
characterized by low pricing on all qualities of steelmaking coal.
To compete in this over supplied and highly competitive market, Teck must now produce
coal at the lowest possible cost. The majority of costs required to produce a marketable product
are associated with the mining phase of the operations; specifically, the truck and shovel process.
During the high margin cycle from 2003 to 2012, Teck made significant investments in its coal
business unit, predominately in the truck and shovel category; larger class truck fleets and larger
shovels were purchased at several operations. The process plants were also upgraded and
expanded and the business unit was preparing for what was believed to be a longer term strong

2
market cycle for steelmaking coal. This rapid expansion of capacity of the entire industry has
created both a problem and an opportunity now for Teck.
The problem is that the productivity of the truck/shovel mining activity has declined from
historical levels despite the advantage that larger, newer equipment should give the operations.
This is arguably an unintended consequence of the drive to increase absolute production to
maximize profit by delivering as much coal to market as possible. In this operating strategy,
productivity is a secondary consideration to production since the value of the extra tonne of coal
produced outweighs the cost of getting that tonne of coal; consequently, productivity tends to fall
as a natural outcome of the strategy.
Exasperating the shift in focus away from productivity has been the high turnover of
experienced operators and supervisors to the oil sands in northern Alberta. The high price oil and
the rapid expansion of that industry has attracted many of our most talented employees and
consequently, we have lost much of the experience that lead to high historical productivities.
The opportunity now is that Teck has invested in operating assets that are not being
utilized as productively as they could be. In a low margin period, this gap between the current
operating performance and the theoretical operating performance means that Teck can be
producing its product at a much lower net cost. This allows Teck the opportunity to become more
competitive in what has become a highly competitive market. In other words, the last tonne of
coal produced can no longer be considered independent of all the other production as there is
limited capacity for the market to absorb the available world supply of steelmaking coal. There is
only so much coal the market can absorb and every tonne of coal must now be produced at the
lowest possible cost to maximize the margin available.
With this background, the remainder of my thesis is structured as follows:
In Chapter 2 I examine the nature of the market in steelmaking coal, reflecting back on
the historical cycles and the impact on Teck’s coal business unit. This is critical context to
building an understanding of what the risk of failure is to the organization and it will be an
integral part of a strategy to engage employees in a mission to improve productivity.
In Chapter 3 I present an industry analysis of the steelmaking coal industry with the
purpose of identifying the correct operating strategy for this current market cycle and supporting
the case for a focus on productivity. This analysis represents the technical “proof” for this
strategy and will be important in establishing future context for the next series of cycles.

3
In Chapter 4 I outline the response Teck should take to the current market cycle. I will
identify the potential gap between the operations in key operating metrics. This chapter will also
identify the key drivers behind truck shovel productivity and propose an implementation plan for
closing the gap across the business unit.
In Chapter 5 I outline an implementation plan based on the work of John P. Kotter on
transformational change and on the strategy developed in Teck to create a culture of safety. I
strongly believe that as with safety, productivity is as much about culture as it is about the
technical skills. Knowing how to do something is only effective if people actually believe it is
important. Leadership and commitment will be critical to the success of this strategy and
leveraging our experience with culture change will be an important aspect of the project.
4
2: The nature of Pricing Cycles in the Steelmaking Coal
Industry
I am going to explain in this chapter the nature of the cycles that occurred between the
70s and current era and the opportunities these cycles create for Teck. Understanding the nature
of these cycles is critical to understanding the operating strategies that Teck must adopt to
compete in the steelmaking coal industry. It is only by applying the correct operating strategy as
quickly as possible that Teck will be able to achieve its objective of maximizing the value of the
Coal business unit to the organization.
2.1 The first major pricing cycle in the modern steelmaking coal
industry
There have been two major historical cycles in the steel industry, driven by world
economic conditions that have led to significant structural change in the steelmaking coal
industry. The first cycle followed a very distinct pattern that generally consisted of three phases.
The first phase was one of rapid growth in the steel industry, which led to strong demand
for steelmaking coal; I will call this the demand phase. Through the first half of the 70s, world
economies were expanding and we saw Japan and Korea rapidly advance their steel industry in
response. They required steelmaking coal from around the world to fuel this growth in steel and
they looked to Canada and Australia for new supply. The opportunity for the steelmaking coal
industry was significant and in Canada, projects were advanced in Southeast British Columbia as
these new markets opened up. Further development occurred in Northeast British Columbia
spurred by direct investment from the Japanese steel industry. The same dynamics existed in
Australia and their steelmaking coal industry was also rapidly expanding. In this phase, the
steelmaking coal industry had the opportunity for exceptional returns if they could develop their
reserves quickly; therefore, the cost of developing and operating the mines were secondary to the
value created by production capacity.
The second phase occurred when the steel industry rate of growth levelled off trapping
the steelmaking coal industry with more developed supply than the steel industry could consume;
I will call this the over-supply phase. The problem for the steelmaking coal industry is it takes a
considerable amount of time and resources to develop the projects. The other problem is that the
demand projections are extremely difficult to predict given the complexity of world economies.
These two factors ultimately lead to a massive over supply that took shape in the late 70s to early

5
80s. The steelmaking coal industry now had to respond to the collapse of pricing for its product
in the face of massive capital investment in the infrastructure established through the demand
phase. The outcome was a consolidation of the steelmaking coal industry and a drive to reduce
operating costs to keep the remaining supply competitive. The first and second phases are
illustrated in figure 2-1.
Figure 2-1: Demand and Oversupply stages of First Major Pricing Cycle
Source: Teck internal presentation prepared by author, data from Teck Resources Limited, 2015
The opportunity for the steelmaking coal industry was they could still generate
reasonable margins if they could reduce their costs from the base they had created in the demand
phase. Because of the inefficiencies associated with the push to maximize production at all costs,
most companies were still able to make significant margins in the early stages of phase 2.
The third phase was essentially the period of rebalancing that followed the over-supply
phase as the industry came to terms with the market it created; I will call this the survival phase.
In this phase, operating efficiency and productivity were critical to the success and sometimes

6
survival of companies in the steelmaking coal industry. Margins were very narrow and it was
only the most productive mines that were able to produce returns from their assets. The problem
with this phase is that no one knew how long it would last and because of the low returns and
uncertain future, there was very little investment made in the operating assets. The opportunity
lay in a view that the companies that could survive this stage would eventually enjoy a resurgence
of demand for steelmaking coal. Unfortunately, this phase lasted approximately 16 years as
illustrated in figure 2-2.
Figure 2-2: Survival Phase of First Major Pricing Cycle
Source: Teck internal presentation prepared by author, data from Teck Resources Limited, 2015
The survival phase from the late 80s to early 2000s is the particular focus of my thesis. I
believe that during the consolidation period of the early 90s and the subsequent single-minded
focus on productivity for over a decade, some operations in Southeast British Columbia (the Elk
Valley) established a level of productivity that was arguably the highest in the industry. In
particular, the Greenhills mine stood out. This operation had actually gone through a bankruptcy

7
and closure in 1991. Fording Coal acquired the assets and restarted the mine in 1992. Fording
invested in new, more productive mining equipment and hired back the best operators from the
previous workforce. With new equipment and an opportunity to bring Greenhills back to a
competitive position in the market, the employees at Greenhills embraced an operating strategy of
achieving the highest possible productivity at the lowest possible costs. Not only did they set a
standard for operating practice but they developed a culture of productivity that still exists today.
Summarizing the first cycle, there were three phases characterized by strong demand,
oversupply and survival. The strong demand phase led to a strategy of rapid growth in the
steelmaking coal industry. The subsequent oversupply phase led to consolidation in the
steelmaking coal industry as companies attempted to remain competitive. The strategy during
this phase was to remain competitive while retaining the capacity to meet a change in demand.
The final survival stage occurred when the industry came to terms with the reality that demand
was not going to increase in a predictable way and their strategy would have to be a focus on
productivity to remain competitive in a low margin environment. Many companies failed to
improve their competitive position through productivity and cost control and instead fell back on
short term strategies like reducing strip ratio and haul distance at the expense of long-term
viability. Ultimately, these strategies lead to significant consolidation in the industry as
companies went bankrupt and often what could have been economic reserves were no longer
viable without significant investment.
8
2.2 The second major pricing cycle in the modern steelmaking coal
industry
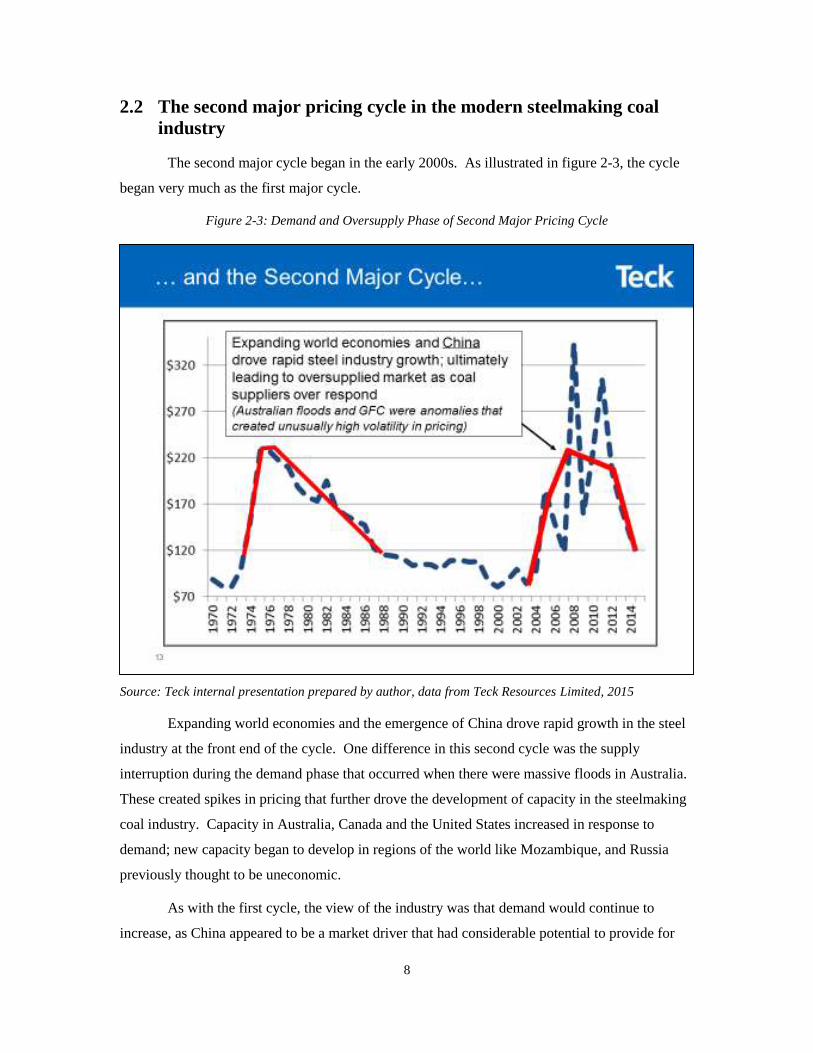
The second major cycle began in the early 2000s. As illustrated in figure 2-3, the cycle
began very much as the first major cycle.
Figure 2-3: Demand and Oversupply Phase of Second Major Pricing Cycle
Source: Teck internal presentation prepared by author, data from Teck Resources Limited, 2015
Expanding world economies and the emergence of China drove rapid growth in the steel
industry at the front end of the cycle. One difference in this second cycle was the supply
interruption during the demand phase that occurred when there were massive floods in Australia.
These created spikes in pricing that further drove the development of capacity in the steelmaking
coal industry. Capacity in Australia, Canada and the United States increased in response to
demand; new capacity began to develop in regions of the world like Mozambique, and Russia
previously thought to be uneconomic.
As with the first cycle, the view of the industry was that demand would continue to
increase, as China appeared to be a market driver that had considerable potential to provide for

9
exceptional returns in the steelmaking coal industry. However, as with the first cycle, the
momentum of supply growth in the steelmaking coal industry has overshot the demand reality of
the steel industry as world economies have slowed and China has retreated from the market. This
has put us in the second phase of oversupply and now the industry must respond quickly to
remain viable. There is a fundamental difference this time in that the change from demand
growth to oversupply has occurred very quickly. In fact, the rate is approximately eight times
faster as illustrated figure 2-4.
Figure 2-4: Rapid Market Response in Second Major Pricing Cycle
Source: Teck internal presentation prepared by author, data from Teck Resources Limited, 2015
To go from the highest pricing level to the lowest has taken only 3 years where it had
taken approximately 25 years in the first cycle.
The problem this rapid change in pricing has created for the steelmaking coal industry
and for Teck is that there has not been nearly as much time to adjust strategy to match the market
conditions. In fact, there is still debate within the organization as to what the appropriate strategy
should be because the industry is uncertain whether this is a pause in the demand cycle or the
beginning of the survival cycle. If China returns to a higher pace of growth in the economy then
10
demand should improve; however, if China has peaked and will now see slow growth, the
steelmaking coal industry will have to survive until the next major demand cycle.
The opportunity for Teck is that the knowledge of high productivity and low cost
operations still exists in the organization and if we can transfer that knowledge quickly and
effectively, Teck will be able to compete in what has become a highly competitive market for
steelmaking coal while still maintaining the capacity to respond to a new growth cycle. This
second condition is critical. We must not be forced to reduce strip ratio and haul distance as the
only response to lowering operating costs. I believe that many companies will chose to respond
this way but those that can retain their reserve capacity will generate significant returns when the
market rebalances. Teck must be one of those companies.

11
3: The Analysis – the Steelmaking Coal Industry at this Stage
of the Market Cycle
In this chapter, I present a deeper understanding of the steelmaking coal industry and
develop a technical case for the strategy Teck should be pursuing in this time. Specifically, I
explain the criticality of reducing operating costs through productivity improvements and why
this must be the dominate strategy in this current market.
3.1 Industry Definition
3.1.1 Products:
The coal mining industry is essentially split between thermal coal and metallurgical or
steelmaking coal. Thermal coal is the most abundant source of low cost energy in the world and
is predominately used for power generation. Steelmaking coal is coal that is used in a blast
furnace to create the heat and reduction environment to transform iron into steel. Unlike thermal
coal, steelmaking coal is concentrated in just a few regions of the world primarily Australia,
Canada, China, Russia, Mozambique and the United States. Steelmaking coal has a broad range
of qualities and characteristics and customers will blend coals from any number of regions and
sources to optimize the operation of their blast furnaces. The highest quality steelmaking coals
are called hard coking coals and are able to form coke which is a main component used in the
blast furnace. The lower quality steelmaking coals are called semi-hard, semi-soft and soft
coking coals and they are blended with the high quality coking coals to optimize the coke from a
cost and blast furnace efficiency point of view. The lowest quality coals are not used in coke but
are pulverized and injected into the blast furnace for their heat content. All ranges of qualities
can be used to substitute each other in the process depending on the operating strategies of the
steel mills.
3.1.2 Customers:
The coal mining industry serves the steel making industry that employs blast furnace
technology to make 2/3 of the world’s steel (the other 1/3 is produced though electric arc
technology). Most major economies around the world have steelmaking industries and Teck
markets coal predominately into Korea, Japan, Taiwan, Europe, and China and to a lesser extent
into India, Brazil and the United States. Some customers do not have a source of domestic supply
of hard coking coal (e.g. Korea, Japan, Taiwan, and India) and must rely on import. Some
12
customers have strong supply chains internal to their country and can vary the quantity of
domestic versus import (e.g. China and the United States). All customers of the steelmaking coal
industry use coal for the purpose of making steel.
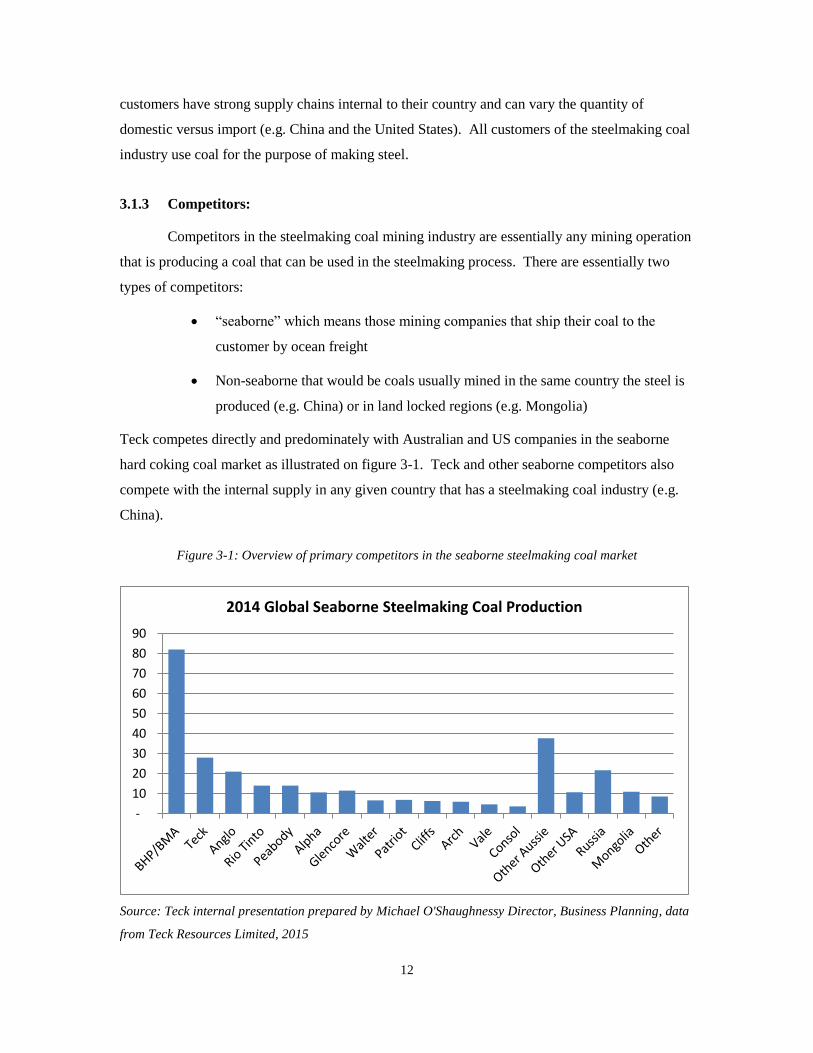
3.1.3 Competitors:
Competitors in the steelmaking coal mining industry are essentially any mining operation
that is producing a coal that can be used in the steelmaking process. There are essentially two
types of competitors:
“seaborne” which means those mining companies that ship their coal to the
customer by ocean freight
Non-seaborne that would be coals usually mined in the same country the steel is
produced (e.g. China) or in land locked regions (e.g. Mongolia)
Teck competes directly and predominately with Australian and US companies in the seaborne
hard coking coal market as illustrated on figure 3-1. Teck and other seaborne competitors also
compete with the internal supply in any given country that has a steelmaking coal industry (e.g.
China).
Figure 3-1: Overview of primary competitors in the seaborne steelmaking coal market
Source: Teck internal presentation prepared by Michael O'Shaughnessy Director, Business Planning, data
from Teck Resources Limited, 2015
-
10
20
30
40
50
60
70
80
90
2014 Global Seaborne Steelmaking Coal Production

13
3.1.4 Geographic area:
The geographic area for the steelmaking coal industry is defined by the availability of
coal reserves. There are specific regions of the world illustrated in figure 3-2 where hard coking
coal is present:
Australia – largest reserves in the world; supplies greater than 100 million tonnes
annually to export market
Canada – Southeast BC and to a lesser extent Northeast BC and Alberta; supplies
approximately 30 million tonnes to export
United States – supplies approximately 50 million tonnes
Mozambique – newly developed region supplying less than 5 million tonnes
annually but anticipated to grow.
China – predominately Shanxi province supplying approximately 600 million
tonnes to domestic steel industry
All these regions and the companies operating within the regions compete directly with Teck in
the steelmaking coal market.
Figure 3-2: Regions where steelmaking coal is produced and where reserves are present
Source: Teck internal presentation prepared by Teck Marketing, data from Teck Resources Limited, 2015

14
3.1.5 Summary of Industry Definition:
The important aspects to the industry definition is that globally, there are relatively few
suppliers of high quality hard coking coal. Further, there are relatively few regions of the world
where high quality hard coking coal exists. There is an established view that the relatively
scarcity of reserves and a growing global demand for steel as emerging economies develop has
and will continue to create opportunities for substantial financial returns for companies that have
effective operating strategies.
3.2 Industry Dynamics:
The steelmaking coal industry has changed significantly from the 60s and 70s to what it
has become today. To understand the reasons for those changes and the implications to the
industry going forward, we have to look at the forces affecting the industry competitiveness.
Figure 3-3 below outlines a basic overview of Porter’s (augmented) five forces acting on the
industry today and the subsequent sections will explore in detail.
Figure 3-3: Porter's Five Forces Model of Current Steelmaking Coal Industry Competitiveness
Source: prepared by author, 2015

15
3.2.1 Potential Entrants:
The steelmaking coal industry has significant barriers to entry and there are a few
structural reasons for this. There was a period of consolidation in the mining industry driven by
low prices/margins that occurred during the 90s and into the 2000s. The industry in Canada was
a good example of this as illustrated in figure 3-4.
Figure 3-4: Consolidation of Canadian steelmaking coal mining industry
Source: Teck internal presentation prepared by Michael O'Shaughnessy Director, Business Planning, data
from Teck Resources Limited, 2015
As a result, just a few major producers (as illustrated previously in figure 3-1) now
dominate the industry. This gives those producers significant advantage in terms of economies
of scale and a potential entrant would have difficulty bringing the scale needed to compete in this
market.

16
Another barrier to entry is the product differentiation that occurs in the steelmaking coal
industry. Before a coal is used in the steel making process, it must go through rigorous testing by
the steel mill that plans to use it. This is because every steel mill uses a variety of sources and
qualities of coal to produce a stable and predictable coke for the blast furnace. The consequences
of introducing a coal that might disrupt the process in the furnace are so high that the steel mills
are extremely conservative in their coke design. Therefore, before a new coal blend is used it
usually takes years to work through the testing and marketing phases to where it becomes a
regular product in their blend. This presents challenges to existing suppliers of steelmaking coal
and for new entrants with no previous history, the challenges would be even greater.
Another barrier to entry for the steelmaking coal industry is the access to coal reserves
and the logistic challenges to reach new reserves. As previously shown in figure 3-2, there are
few steelmaking coal regions in the world. The dominant mining companies already in the
market control the established regions. That leaves remote regions like Elga in Russia and Tolgoi
in Mongolia or less stable regions like Moatize in Mozambique and Maruwai in Indonesia to be
developed. In addition to the remote and politically sensitive consideration, coal is a bulk
commodity and requires significant rail and port infrastructure for the scale of the operations and
distance to transport. That infrastructure is well established for the regions of the world currently
in the market; however, the undeveloped regions require that development to occur before they
can competitively bring their product to the seaborne market.
3.2.2 Substitutes:
The threat of substitution in the steelmaking coal industry is considered low. Substitution
can occur in essentially three ways. The first is the use of lower quality coals to reduce the need
for the more expensive high quality hard coking coals. This process is well established in the
steel industry and is called pulverized coal injection or PCI. While continued optimization is still
occurring, there is a limit to how far a steel mill can go with PCI technology. Evidence suggests
that in the high pricing period of 2003 to 2013 when the demand for hard coking coal exceeded
supply, the steel mills responded by advancing this technology as far as they could. Today, the
ratios of PCI coal to hard coking coal appear to have reached a maximum in most steel mills.
The second substitution threat is the actual process of making steel. Electric arc furnaces
are used instead of blast furnaces to convert scrap and iron (primarily recycling) through an
electric process to steel. These are high cost projects and require low cost electricity inputs to
compete with blast furnace technology. While they represent an alternative to traditional

17
technologies for steel making, they have not influenced the demand for steel making coal in a
material way.
The third substitution threat is the demand for steel. Figure 3-5 shows finished steel
consumption per capita to illustrate the potential growth that will occur in China and India when
considering the positions of developed economies like Japan, Korea, Germany and the United
States. While there is increasing substitution of steel in industries like the automotive industry,
the overall demand for steel will continue to grow as nations like China and India move to
industrialize and urbanize.
Figure 3-5: Finished steel consumption per capita
Source: bhpbilliton analyst presentation sourced from World Bank, government Statistics for Taiwan, IISI,
2015
3.2.3 Supplier Power:
The steelmaking coal industry like any other mining industry requires significant inputs
and supplier power is quite high. The four primary categories considered in this study are labour,
logistics support (ie. Rail and port infrastructure), major consumables (diesel fuel, tires, etc.), and
equipment manufactures.

18
Mining equipment has become more efficient as trucks and shovels have gotten larger
and more productive however this is counter balanced by the existing and future coal reserves
becoming higher strip ratio and more difficult to mine (i.e. Longer haul distances required to
move the increasing amounts of waste rock). Therefore, the need for labour has not diminished
and combined with the demands from competing industries (like the oil sands in Northern
Alberta) for skilled labour, the coal mining industry continues to be challenged in this area. This
has resulted in relatively high labour rates and is a condition that is expected to continue until a
transformational technology such as autonomous equipment or in pit crushing/conveying
becomes a competitive alternative to labour.
Logistics is a critical component in the supply chain. There is little competition in the
rail industry in Canada with only two main competitors and access to the main coal region in
Southeast BC is effectively only served by Canadian Pacific Railway. The situation is similar
with the ports with only three options being available to coal producers. Many mining companies
have taken ownership of the logistic chain to mitigate the imbalance in supplier power; however,
there are significant hurdles to overcome with this strategy. Teck does own the Neptune port and
that provides some advantage on the port side but rail service continues to be a constraint that is
difficult to overcome.
The mining industry is a very high consumer of energy and therefore, requires significant
inputs like diesel. In addition, many components of the equipment used in mining wear like tires,
truck boxes, buckets, etc. and these consumables have to be constantly replaced. Fortunately, the
market for these products is broad enough that the suppliers do not enjoy significant power
beyond the normal supply/demand influences. Tires was an exception for a period of time
however this has come back into balance as the mining industry has slowed down and the mining
tire industry increased capacity over the last cycle.
Finally, equipment manufactures supply the major pieces of equipment like trucks and
shovels to the mining industry. As with the major consumables, during the period or rapid
growth in the mining industry from 2003 to 2013, equipment suppliers enjoyed significant power
however, that has since come back to balance along the same lines as tires did.
3.2.4 Buyer/Customer Power:
Buyers in the steelmaking coal industry currently have significant power. There are a
few dominant steelmaking companies in the world and they have established very strong
positions when it comes to what coals they will purchase and from where. Japanese steel mills
19
have traditionally worked together to strengthen their buying power for raw materials although
that has weakened in the last decade as they have moved to be more independent. Because of the
consolidation in the coal mining industry, the remaining coal producers sell significant volumes
into just a few primary buyers strengthening the buyers’ position.
Another strategy that has been employed by the steel producing companies since the 70s
has been to invest in the coal companies they buy from. The Japanese Steel Mills were
instrumental in the late 70s, early 80s in opening up the Northeast Coal region in Canada. This
helped secure supply of hard coking coal and lead to an oversupply condition that persisted for
the next decade. Posco Corporation in Korea helped open the Greenhills mine in the early 80s
with a 20% stake; in 2004, they also invested in the Teck Elkview Mine along with the Japanese
company NSSMC to a combined position of 5%. Posco also has ownership positions in
coalmines in Australia. China Investment Corporation purchased approximately 17.5% of Teck’s
outstanding Class B subordinate voting shares in 2009 tying China into an indirect ownership
position for not only steelmaking coal but also copper, zinc and oil.
The buyers were challenged in the period from 2003 to 2013 due to rapid growth in steel
production and limited supply of hard coking coal; however, the advantage has shifted back to the
buyers and until the market comes back into balance, they will enjoy this position.
3.2.5 Regulators:
The regulatory system has become much more challenging in the mining industry from
the perspective of permitting. Figure 3-6 below gives a sense of the change that has occurred
over the last three decades.

20
Figure 3-6: Comparison of Permitting Process from the 1970's to Current
Source: Teck internal presentation prepared by Michael O'Shaughnessy Director, Business Planning, data
from Teck Resources Limited, 2015
Where operations could move from permitting to production in a relatively short time and
cost in the 70s, it now requires years and millions of dollars to bring an operation through the
permitting process even for expansion of existing operations. This is not only burden on the
active mining companies but a significant barrier to entry for new companies and regions.
3.2.6 Complementors:
Many coal companies, primarily in Australia, also supply iron ore to the same steel mills
to which they sell their coal. BHP Billiton has been particularly successful at this strategy. They
are able to leverage the combined inputs and shift advantage from one to another depending on
market cycles. This is a good strategy in general and Teck has explored the possibility of adding
iron ore to their portfolio for this purpose many times.

21
3.2.7 Industry Competitors:
The rivalry among the existing steelmaking coal companies is an interesting one to
assess. The industry is highly competitive; however, a few factors indicate there should be a
lower rivalry than one might expect. Historically, there were many companies in the steelmaking
coal business as the industry was being developed in the 60s and 70s. Then a period of
consolidation occurred due to a prolonged low pricing (over supply) market (mid 80s to late 90s).
Many companies went bankrupt and entire regions like the Appalachian region in the United
States essentially left the market. Today one company dominates the industry. The consolidated
company BHP Billiton (which used to be the separate companies BHP, BMA and Billiton) holds
almost fifty percent of the market. The remaining market is divided between 4 or 5 key
companies. Teck is the second largest exporter of seaborne hard coking coal behind BHP. The
text “Strategy and the Business Landscape” suggests “the more concentrated the industry, the
more likely that competitors will recognize their mutual interdependence and so will restrain
their rivalry.” The text goes on to say, “the presence of one dominant competitor rather than a
set of equally balanced competitors may less rivalry.” Both these conditions appear to exist in
the coal mining industry.
While the factors above would indicate a lower rivalry, other structural attributes in the
coal mining industry tend to increase rivalry. The current coal industry is capital intensive with
high fixed costs and excess capacity in a slow growth state. Despite some product differentiation,
this is leading to high level of rivalry in the market between producers.
Finally, the barriers to exiting the industry are high and many companies place very high
strategic value in their positions. BHP is a good example of this as they produce both
steelmaking coal and iron ore. Further, there is evidence to suggest that BHP has been actively
engaged in over supplying the market for some period of time in an effort to further strengthen
their strategic position as a producer at the bottom of the cost curve. Therefore, the current state
of the coal mining industry is one characterized by very high rivalry among the few existing
firms.

22
3.3 Gap Analysis
To determine the best strategy for Teck with the current and future state of the coal
mining industry, the components to profit will be examined in detail. Figure 3-7 below will be
used to guide the process:
Source: prepared by author, 2015
3.3.1 Cost of Capital and Capital Invested:
The cost of capital is affected by supplier power. In this case, it would be the cost of
replacing existing equipment for the purpose of lowering operating costs or adding equipment for
the purpose of increasing production. Teck invested heavily between 2003 and 2013 in
equipment and infrastructure and are currently in a good position to avoid excessive capital
requirements. Therefore, this is a low impact factor.
If we consider the rivalry’s position on capital invested, most major companies applied
the same strategy over the same period Teck did, investing heavily in their coal producing assets.
As with Teck, there is evidence to suggest that most companies have curtailed capital investment
as they try to maximize the return on their investments in this current cycle.
Figure 3-7: Components to Profit
23
3.3.2 Sales Volume:
The demand for steelmaking coal is still reasonably high despite the over supplied market
and slower growth in China. There are limited substitutes and the potential growth in the steel
industry going forward is still considerable. Teck is currently able to sell all the coal they can
produce as evidenced by 2014 being a record sales year. Unfortunately, the same condition exists
for most of the coal mining industry so again, there is no strategic advantage for Teck in
increasing production/sales volume other than maintaining market share and minimizing
operating costs.
3.3.3 Price:
The price for coal is really driven by the dominant company in the industry that being
BHP. The market waits until BHP settles a price with their key customers and then that sets the
stage for the rest of the companies to negotiate for price based on relative qualities of their
products. Further, the buyers are currently in a strong position with an over supplied market
which creates a barrier to entry for new developments (this is illustrated in Figure 10 in the R&E).
Teck has little influence on pricing despite being the second largest exporter of steelmaking coal
so there is very limited opportunity for any strategy on pricing.
3.3.4 Average Cost:
Average cost is a function of supplier power and rivalry. From the supplier side, Teck
has made good progress in the last decade with suppliers. Teck has long-term contracts with their
logistics chain, which represents the single largest supplier cost. Teck also implemented a
strategic sourcing initiative approximately 5 years ago to negotiate long-term stable pricing
mechanisms for key inputs like diesel and tires. Teck continues to look for opportunities to lower
input costs but we have locked in most contracts with major suppliers leaving limited potential
for significant gains.
Summarizing the gap analysis, capital is not a significant factor, sales volumes are at
capacity, pricing is essentially out of our control and there is not much more we can do with
suppliers; therefore, the most effective way to increase profit in this environment is to reduce
operating costs. Figure 3-8 shows the breakdown of what makes up the average cost to produce
coal at Teck.

24
Figure 3-8: Breakdown of Cost Components
Source: Teck internal presentation prepared by Michael O'Shaughnessy Director, Business Planning, data
from Teck Resources Limited, 2015
At approximately $27 per metric tonne of product, loading and hauling (i.e.
Shovel/truck) is by far the most significant profit-determining factor within direct control of the
company. Hauling in particular represents $20 per metric tonne and is the single highest
operating cost associated with an activity. Unfortunately, haulage costs will continue to increase
as strip ratios increase and as mines continue to go deeper and subsequently have to haul material
further away. In fact, distances have almost doubled since 2004.
The same conditions exists for the most part among Teck’s rivals in the industry. One
strategic advantage Teck has going into this current state of the industry is that historical
operations that Teck now own competed effectively on operating costs in a much more
constrained market over a longer period of time in the past. The period from the early 90s to
2003 was characterized by relatively low demand in an over supplied market and therefore
margins for the coal industry were very small. Success and sometimes survival depended on

25
being able to operate at high productivities and low costs. Few mines were as low cost and as
highly productive during this era than the Greenhills and Fording River mines. This operational
knowledge still exists today and we have the benchmark performance of the past to access the
gap. We also have made considerable progress in this area over the last two years so we have
some momentum refocusing the operations on this critical factor.
3.4 Chapter Summary
The steelmaking coal market is characterized as being in an oversupplied state that could
last for years. Based on the industry analysis, Teck faces a highly competitive environment
where suppliers and particularly buyers hold significant power. Further, the main competitors in
this market are reasonably stable leading to high rivalry. This will continue until the higher cost
producers, mainly in the United States, begin to leave the market.
Based on the gap analysis, the dominant strategy for Teck should be to focus on reducing
its operating costs to maximize profit. With limited cash being produced from the Teck Coal
business unit and low capital availability in general (due to investments in other business units),
focus should be on maximizing the effectiveness of existing assets. Truck shovel productivity is
the critical component of average cost in the one profit factor that Teck has the most control.
To summarize, I believe Teck needs to identify the critical components in its truck shovel
system that determine productivity; Teck needs to establish the benchmark performance the
organization should be operating at; and finally, Teck needs to implement a program that releases
the value of that performance. Teck will maximize its profit in this current market cycle if their
strategy is to maximize the productivity of the assets they currently manage.
26
4: The Response - Establishing the Opportunity for Profit
through Productivity
In this chapter, I am going to use the benchmarking we do between the operations to
identify what the potential gap is between what the highest performing operations achieve and
where the other operations currently perform.
Many different factors determine truck productivity. Certainly, the physical
characteristics of the equipment (e.g. size of truck, engine horsepower, gear ratios, etc.) and the
physical constraints of the operating environment (e.g. haul distance, grade of ramps,
intersections, etc.) will set the baseline for how productive the haul trucks can be. There are
essentially two configurations in the coal business unit. The three larger operations employ truck
fleets consisting of larger class Komatsu 930e and Caterpillar 797 haul trucks. The three smaller
operations employ truck fleets consisting of Komatsu 830e and Caterpillar 793 haul trucks. For
the purpose of this thesis, I am only focusing on the actual productivity related components of the
process. There are many other components involving maintenance and operating efficiency (this
is a measure of the delays in operating that occur due to scheduled breaks, shift change, blasting,
shovel moves, etc.). The areas of focus will be on cycle times both fixed and variable and the
factors that determine the effectiveness of these times.

27
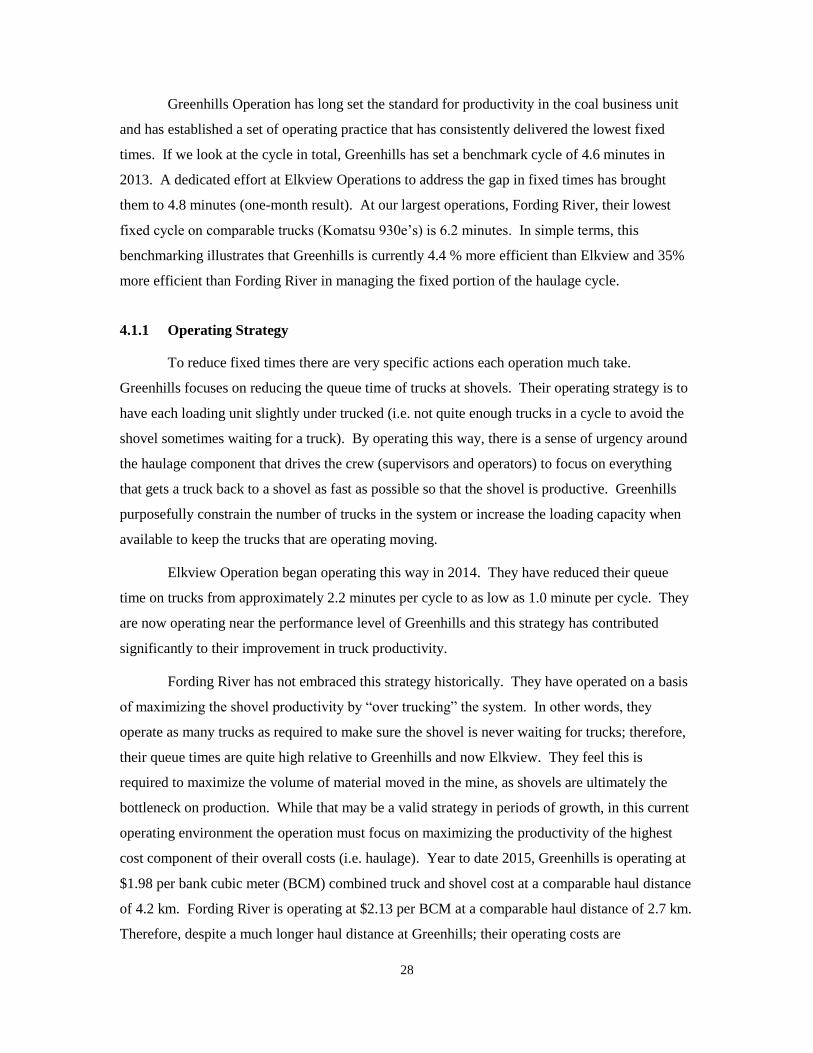
4.1 Fixed times
Fixed times are those times the truck is not actively hauling material or returning to the
shovel empty. Figure 4-1 below shows the relative fixed times in the larger operations:
Figure 4-1: Comparative Fixed Times
Source: Teck Resources Limited, 2015
The fixed times are made up of the following components:
loading - time it takes for shovel to load the truck
spot - time it takes the haul truck to position under the shovel
queue - time the truck is waiting for the previous truck being loaded to leave the
loading zone
waiting on dump - time the truck is waiting for the dump zone to be cleared for
entry
dump – time it takes the truck to dump its payload at the spoil
28
Greenhills Operation has long set the standard for productivity in the coal business unit
and has established a set of operating practice that has consistently delivered the lowest fixed
times. If we look at the cycle in total, Greenhills has set a benchmark cycle of 4.6 minutes in
2013. A dedicated effort at Elkview Operations to address the gap in fixed times has brought
them to 4.8 minutes (one-month result). At our largest operations, Fording River, their lowest
fixed cycle on comparable trucks (Komatsu 930e’s) is 6.2 minutes. In simple terms, this
benchmarking illustrates that Greenhills is currently 4.4 % more efficient than Elkview and 35%
more efficient than Fording River in managing the fixed portion of the haulage cycle.
4.1.1 Operating Strategy
To reduce fixed times there are very specific actions each operation much take.
Greenhills focuses on reducing the queue time of trucks at shovels. Their operating strategy is to
have each loading unit slightly under trucked (i.e. not quite enough trucks in a cycle to avoid the
shovel sometimes waiting for a truck). By operating this way, there is a sense of urgency around
the haulage component that drives the crew (supervisors and operators) to focus on everything
that gets a truck back to a shovel as fast as possible so that the shovel is productive. Greenhills
purposefully constrain the number of trucks in the system or increase the loading capacity when
available to keep the trucks that are operating moving.
Elkview Operation began operating this way in 2014. They have reduced their queue
time on trucks from approximately 2.2 minutes per cycle to as low as 1.0 minute per cycle. They
are now operating near the performance level of Greenhills and this strategy has contributed
significantly to their improvement in truck productivity.
Fording River has not embraced this strategy historically. They have operated on a basis
of maximizing the shovel productivity by “over trucking” the system. In other words, they
operate as many trucks as required to make sure the shovel is never waiting for trucks; therefore,
their queue times are quite high relative to Greenhills and now Elkview. They feel this is
required to maximize the volume of material moved in the mine, as shovels are ultimately the
bottleneck on production. While that may be a valid strategy in periods of growth, in this current
operating environment the operation must focus on maximizing the productivity of the highest
cost component of their overall costs (i.e. haulage). Year to date 2015, Greenhills is operating at
$1.98 per bank cubic meter (BCM) combined truck and shovel cost at a comparable haul distance
of 4.2 km. Fording River is operating at $2.13 per BCM at a comparable haul distance of 2.7 km.
Therefore, despite a much longer haul distance at Greenhills; their operating costs are

29
significantly lower on the combined fleet than Fording River. Comparing overall mining plus
maintenance costs (i.e. reflective of overall mining system), Greenhills is operating at $3.68 per
BCM versus Fording River at $4.24 per BCM. This difference of $0.56 per BCM applied to
Fording Rivers’ annual material movement of approximately 100 million BCM would yield a
savings of approximately $50 million if Fording River were to apply the appropriate strategy.
4.1.2 Operator Skill and Engagement
Other factors affect the fixed time portion of the cycle like the time it takes the shovel to
load a truck and the time it takes a truck operator to position at the shovel. These factors are
primarily a reflection of the skill of the operator as opposed to the operating philosophy of the
mine. Therefore, there is significant opportunity in focusing on the skills of the operators. The
average shovel operator at Greenhills takes 1.9 minutes to load a truck. The average shovel
operator on a comparable shovel at Elkview takes 2.1 minutes to load a comparable truck and at
Fording River 2.4 minutes. There would be significant improvement in operating costs if
Elkview and Fording River could reduce the time it takes to load a haul truck and this is primarily
a reflection of the skill of the operator and their engagement. This requires focusing specifically
on this aspect of shovel productivity (i.e. load time) as opposed to overall shovel production (i.e.
how much does the shovel move per operating hour). The savings is generated by reducing the
time the truck is non-productive (i.e. not moving). Shovel operators must be engaged in this
imperative. I believe that one of the underlying advantages Greenhills has had with shovel
operators is that they effectively engaged them. Shovel operators are taken to their equipment at
the beginning of the shift by the supervisor. They were given the supervisor’s channel on the
radio so that they would be involved in operating decisions during the shift. These simple
engagement strategies motivate an operator to perform at their best.
Similarly, the time it takes an operator of a haul truck to position at the shovel is largely
determined by the skill of the operator. This requires training, observation and reinforcement.
Greenhills focuses considerable attention on ensuring that the truck operators are very skilful in
this activity. While it is not as significant a portion of the fixed cycle, it is one that reinforces the
sense of urgency the organization needs to have around truck productivity.
4.1.3 Summary of fixed time analysis
The most significant impact an operation can have on the fixed time of the haulage cycle
is applying the appropriate operating strategy. Greenhills is applying a strategy of slightly under

30
trucking their shovels in order to focus the supervisors and operators on maximum efficiency in
the overall truck cycle and reducing the costs of moving material. Fording River is applying a
strategy of over trucking their shovels to maximize the volume of material they move and their
costs are reflective of this strategy. Elkview has adjusted their operating strategy along the lines
of Greenhills and their costs have come down to comparable levels. Fording River must adjust
their operating strategy to be competitive in this current market.
4.2 Variable times
Variable times are the portion of the cycle where the haul truck is either actively hauling
material to the spoil or returning to the shovel for the next load. Figure 4-2 shows the
Figure 4-2: Comparative Variable Times
Source: Teck Resources Limited, 2015
variable times of the cycles combined with the fixed times (non-travel). The variable times are
highly dependent on the haul profile the trucks are running (distance and grade) making it more
difficult to benchmark the operations. Coal has developed a relatively simple comparative using
the effective flat haul distance. This is an estimate of the effect of grade on the haul distance and

31
is used to compare one operation to another. If we take the 2014 result at Elkview of 9.6 minutes
loaded haul plus 7.0 minutes empty return to at an EFH distance of 5.7 km (one way so double),
we could represent as an average speed of 41.2 km/hr. The result at Greenhills in 2014 would be
7.9 minutes loaded haul plus 5.4 minutes empty return to at an EFH distance of 4.7 km, we could
represent as an average speed of 42.4 km/hr. The result at Fording River in 2014 would be 7.3
minutes loaded haul plus 6.2 minutes empty return to at an EFH distance of 4.0 km, we could
represent as an average speed of 35.6 km/hr. Elkview and Greenhills are quite similar but
Fording River is 16% slower than Greenhills.
One important limitation in this benchmark is the inaccuracy of the “effective flat haul”
estimate. We have long recognized that at best, the indicator approximates relative performance
at an operation and is not a good comparative to other operations. Therefore, I am proposing that
we develop a more accurate model based on the systems we use in Engineering to calculate truck
productivity for planning purposes. This model would integrate the actual haul profiles in the
field with the operating data collected from our truck dispatch system (WENKO) and would
ultimately produce a much more accurate measure of relative performance between the sites.
This work was initiated early in 2015 and will be complete by the third quarter. Once we have an
effective model for comparing operating performance by site, we will be in a better position to
gauge the potential value gap.
While the measure of the variable component to truck productivity is more difficult, the
focus is clear. The roads must be designed and maintained to allow the operators to safely
operate the truck at its maximum capability. The operators must be trained to know what the safe
operating envelope of the truck is how to operate in that range. Finally, the operators must be
motivated and engaged in the maximizing the speed of the haul trucks. As outlined in the
previous section on fixed times, this last component is supported by a strategy of slightly under
trucking the system. The operator knows that the shovel will be waiting for them and will be
motivated to complete their cycle as quickly as possible.
4.3 Operational characteristics and techniques that maximize truck
shovel productivity
There was a time when truck shovel productivity was an integral part of the business.
Unfortunately, the factors that lead to this success were never well documented. Instead, the
techniques were passed from supervisor to supervisor in the field. Two main factors eventually
eroded the operations standards. The first is the high turnover of supervisors and operators
32
caused by expansion in the oil sands in Alberta. Because the coal patch in South-eastern British
Columbia is close and because the experience was so high, the oil industry was able to attract
many of our most talented supervisors and operators with higher compensation packages than we
could offer. The other factor was that we were in a period of growth accompanied by high profit
and as I wrote earlier, productivity was not as important; we could simply buy whatever
equipment we needed to meet the production requirements.
One operation that managed to retain the operating standard that they had established
through the lean years was Greenhills. This was clearly demonstrated in the sections above on
fixed and variable times. They set a standard in the early 90s that has put them consistently at the
top end of performance relative to their peers. Previous studies have shown them to be top
performers globally as well. They have maintained this position in the industry for over three
decades despite turnover of hourly and staff employees. In 2015, Greenhills established a project
to identify and document the operating practice associated with truck/shovel productivity. They
followed a change management process lead by their operating excellence team at site and
created a “Supervisor’s Book of Standards”. The methodology and output is a model for all other
operating sites in Teck to follow. This body of work has been shared with the other operations
and must now be integrated into their operating practice. The practices outlined will address
many of the technical aspects of maximizing truck productivity and will also have an impact on
the cultural aspects.
4.4 Proposed Response to establish best practice across Teck
Greenhills has established a highly productive system and the work they have done to
document the practices associated with that system have established a starting point for the
business unit. I am proposing that we build off the work that Greenhills has done. We will put
together a team comprising of representatives from each business unit in Teck. Specifically,
Coal, Red Dog (Zinc), Highland Valley (Copper) and South America (Copper). The team would
consist of General Manager, Superintendent, General Foreman and dispatcher levels. This team
will develop a process which would include site visits of 3 to 4 days to review operating practice
and confirm best practice.
The first deliverable would be a manual of truck/shovel best practices similar to
Greenhill’s work but more comprehensive and inclusive of other operations’ experience. This
manual would outline both the technical aspects of best practice and the cultural aspects. This
document will ensure that the critical aspects of truck and shovel productivity are not lost when

33
the market cycle turns to growth again and more importantly, will support the coal business unit’s
effort to remain competitive in this current market cycle.
The second deliverable will be a summary of where each site is on the scale for each best
practice and a list developed by each site of opportunities for 2016 and beyond. This will ensure
that the organization is aware of and focusing on those aspects that will yield the greatest benefit.
The Chief Operating Officer has endorsed this project and I have been assigned to lead
the effort.

34
5: The Implementation Plan
We have established that truck shovel productivity is critical to Teck’s profitability in this
difficult market cycle and we have identified a baseline of operating techniques that can achieve
the highest level of performance. Further, I have outlined the project Teck has assigned to me
through the Chief Operating Officer that will complete the best practice manual and identify the
gaps in the organization. Now I will outline an approach for transferring this capability across
Teck.
Achieving world-class performance is as much about the culture of the operation as it is
about the technical capability. Teck has a considerable amount of experience in culture change
having implemented a transformational change strategy in safety in 2009. The approach Teck
took to creating a culture of safety essentially followed the eight-step framework described by
Kotter (1995). I am proposing that we develop a transformation strategy for truck productivity
using a similar model to what we executed successfully with safety. In the following sections, I
will outline the framework for the strategy.
5.1 Establishing a Sense of Urgency
This is Kotter’s view on sense of urgency:
“When is the urgency rate high enough? From what I have seen, the answer is when
about 75% of a company’s management is honestly convinced that business as usual is totally
unacceptable. Anything less can produce very serious problems later on in the process.”
There is no question that Teck recognizes that business as usual is not acceptable. In
chapter 2, I demonstrated that the average price for coal today is the lowest it has been since the
bottom of the previous major cycle. Further, our operating costs are now much higher than they
were in the first major cycle due to the increase in regulatory and environmental requirements.
Our industry is in crisis and many companies will struggle to compete. The current market
conditions have provided more than enough incentive to focus on productivity; however, there are
a number of factors that interfere with the message delivered to the workforce. The General
Manager at each operation presents regularly to the crews on the market conditions so that people
have a full understanding of the state of our industry. The feeling being that an informed
workforce is an engaged workforce. Unfortunately, the unions believe that this is a tactic aimed
at undermining their bargaining position and they counter by campaigning against the
information. Specifically, the unions try to down play the market conditions and point to Teck’s
35
strength in the other business units. The “back and forth” resembles a political campaign and the
average employee is left trying to interpret what the real message is. In the end, the effort to
engage employees in a productivity imperative is muted. The following subsections outline the
steps I think are necessary in building a sense of urgency in the organization.
5.1.1 Engage the unions
In this time, we must establish a sense of urgency throughout the business unit that is
reflective of the state of our industry. The unions have recognized that the industry is struggling
but they must be brought to the table on this issue. We need them to stand with the company as
we work to engage the workforce. If we can engage the unions effectively, then our employees
will get a consistent message and we will be able to create the sense of urgency required
throughout the business unit to drive productivity strategies. To do this, we will have to develop
an engagement strategy with the senior levels of the various union organizations we deal with.
Further, we will have to deal with them collectively as opposed to keeping the relationship split
between the locals. Ultimately, we must create a sense that we are all in this together.
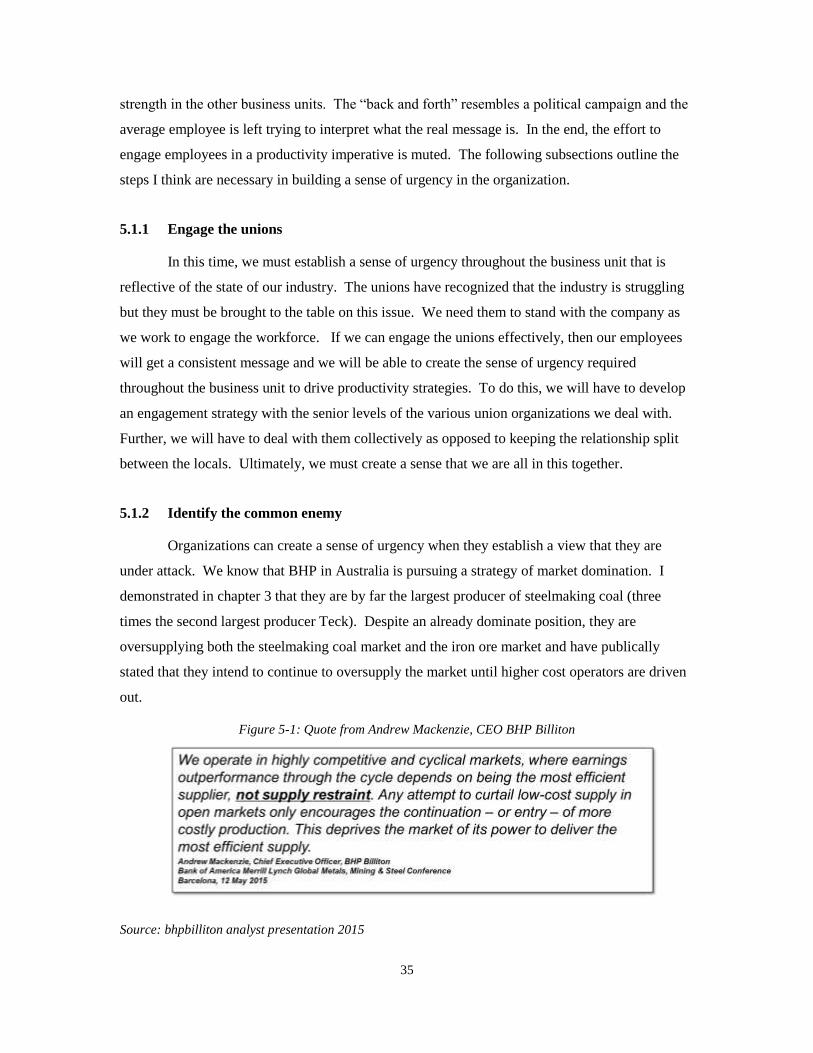
5.1.2 Identify the common enemy
Organizations can create a sense of urgency when they establish a view that they are
under attack. We know that BHP in Australia is pursuing a strategy of market domination. I
demonstrated in chapter 3 that they are by far the largest producer of steelmaking coal (three
times the second largest producer Teck). Despite an already dominate position, they are
oversupplying both the steelmaking coal market and the iron ore market and have publically
stated that they intend to continue to oversupply the market until higher cost operators are driven
out.
Figure 5-1: Quote from Andrew Mackenzie, CEO BHP Billiton
Source: bhpbilliton analyst presentation 2015

36
Clearly, BHP represents a “common enemy” to our organization and we should portray
this view to our stakeholders and in particular to the unions and to our employees.
5.1.3 Leverage the history of steelmaking coal
Building a communications strategy around the history of the industry could also be an
effective tool in creating a sense of urgency. As I explored in Chapter 2, we could be in a low
pricing environment for an extended period and because the transition has occurred so rapidly, it
is imperative that we adjust to this new environment as quickly as possible. Many employees
believe that this is just another cycle that will come and go as they always have; therefore, they
do not see the urgency with this one. What they do not realize is that there are really two types of
cycles. The minor cycles that regularly occur in the world market as supply/demand responds to
the established economies and the major cycles that occur when major economic change occurs
like the emergence of China. These major cycles have a significant impact on our industry both
good and bad and employees must understand these implications.
5.1.4 Summary of “Creating a Sense of Urgency”
We can create a sense of urgency through an effective communication strategy with our
employees and this will require cooperation with the unions and the use of resources internally to
develop the communication package. The sooner we establish this communication strategy, the
sooner we can establish the sense of urgency the organization must have in these times. It is
imperative that all stakeholders recognize this crisis and that Teck transforms its focus from
growth to productivity.
5.2 Forming a Powerful Guiding Coalition
When Teck initiated its culture of safety transformation, there was a team put together to
lead both the development and execution of the strategy. That team had the passion, commitment
and experience to drive the transformation through the necessary stages to where we can say we
have established a solid foundation for a culture of safety. Kotter’s view on a powerful guiding
coalition is:
“Companies that fail in phase two usually underestimate the difficulties of producing
change and thus the importance of a powerful guiding coalition. Sometimes they have no history
of teamwork at the top and therefore undervalue the importance of this type of coalition.
37
Sometimes they expect the team to be led by a staff executive from human resources, quality, or
strategic planning instead of a key line manager. No matter how capable or dedicated the staff
head, groups without strong line leadership never achieve the power that is required.”
We have people in the organization that have that same level of passion and experience
around productivity. They need to be brought together to form the guiding coalition this strategy
will require. The ideal team will have experts in operating practice, specifically leadership from
the front line. This was the lesson we learned with the transformation in safety. We did not
engage the front line leaders as effectively as we should have. The team will also have experts in
change management, communications, and organizational strategy. Further, this team will have
representatives from the workforce and from the unions. Again, there was a view that the
transformation strategy for safety would have been more effective if we had of engaged the
unions in the development of the program. We can leverage this view to help bring the unions
into this strategy. This diverse team will be tasked with advancing the strategy to the workforce
and they will play an integral role in creating the engagement necessary to be successful.
5.3 Creating a Vision
The vision for safety was quite clear and easy to communicate to every employee in
Teck. Creating a vision around truck shovel productivity may be a bit more elusive but it is an
important component in the strategy. I believe that we need a vision that speaks to the pride our
operators should have in job they do. In my experience, the best operators are those that want to
be the best. They are competitive and get a lot of job satisfaction from demonstrating their
capability every day. The guiding coalition should create and endorse a vision that might look
something like “we are proud to be the most productive miners in the world”. The important part
is that the team put together to drive this strategy be the team that creates the vision. This will
create better engagement with both the team and with the employees.
5.4 Communicating the Vision
Communicating the vision proved one of the most important stages in the safety
transformation. Kotter writes:
“Communication comes in both words and deeds, and the latter are often the most
powerful form. Nothing undermines change more than behavior by important individuals that is
inconsistent with their words.”
38
In safety, we communicated the vision through an experiential model that involved
sessions with small groups of employees. I am proposing we do something similar with
productivity. The structure of the session would be similar in that we would incorporate the work
around communicating the sense of urgency at the front end. Then we would build an
understanding of our current position and the vision we have of what we can be. Finally, we
would engage the group in a process of identifying the steps we need to take to get there. In
chapter 4, I outlined much of the work that will inform this stage. These sessions would be held
with small groups of operators and supervisors and would be facilitated by senior leadership at
the operations. This would represent the “words” part of Kotter’s model.
The “deeds” will come from the leadership the supervisors provide in the field. We have
provide extensive leadership training with our front line supervision over the last three years and
they should be more than capable in demonstrating behaviours consistent with the messages we
will provide employees. In general, the drive for productivity is something that has come
reasonably easy to the supervisors so this should be a low risk area in the strategy but one that
must be guided by the coalition.
5.5 Empowering others to act on the vision
As Kotter wrote, this stage will involve getting rid of obstacles to change, changing
systems that undermine the vision and encouraging non-traditional ideas, activities and actions.
One system that is not in alignment with the vision is our compensation structure. While we have
incentive plans based on productivity and profit sharing, these plans are not incorporated into the
employee contracts. As a result, the unions do not recognize them and employees do not actively
engage in them. They consider the plans outside their control and there is a level of distrust with
the program given the perception that the company can change at any time.
I am proposing what has been a very “non-traditional” idea in Teck about hourly
compensation. Traditionally both the company and the union have preferred any productivity or
profit based compensation to be executed outside of contract. The company prefers this because
they have more control of the program and do not have negotiate the terms. The union prefers
this because philosophically, they do not believe in this form of compensation. One reason is
they do not believe hourly employees should be exposed to the variability of company financial
performance. I believe another reason is that they are threatened by any strategy that more
closely aligns employees’ interest with the company’s interest. They have demonstrated that
same behaviour with our safety strategies. It is my opinion that the unions we deal with are still

39
entrenched in a “power based” relationship and struggle with any strategy that they feel may
erode their power base. We need to break down these barriers to engagement and align our
compensation strategy with productivity. I am proposing that we take the existing productivity
and profit sharing components that are outside the contract and incorporate them into contract
during the current rounds of bargaining. We have an opportunity at this time to take a bold step
towards aligning hourly employees and their unions with our objectives through a compensation
strategy that is appropriate in this economic climate and future climates. There would be two
parts to the strategy. The first is a variable pay component that is linked to the operating cash
margin of the operation they are employed at. The second is a share distribution that an employee
receives on a regular basis that is also linked to the operating cash margin. This strategy
accomplishes two key goals. The first is a direct link to productivity through operating margin.
The second is a link to ownership in the company.
If we can successfully move down this path, in time, we will be able to build a
relationship with the unions that is not so based on power but rather on mutual interests.
5.6 Planning and creating short term wins
This is an area I believe Teck is already actively engaged in and has very effective
strategy established. Key performance metrics are well understood and benchmarked and
managers are held to account for their site’s performance through regular reviews and
compensation. I will not explore this stage in this thesis, as it is not our area of weakness. I
believe the opportunity to fully succeed at this stage will come from executing the
recommendations I have made in the preceding stages.
5.7 Consolidating improvements and Institutionalizing new
approaches
This approach will establish best practice in truck/shovel productivity and it will engage
employees at all levels of the organization. I outlined in chapter 4 a process that will establish a
manual of best practice around truck productivity. The documented understanding of what drives
productivity both from a technical perspective and from a cultural perspective will be critical to
sustaining that effort in the future. As with safety, the technical knowledge alone is not enough;
we need to know what motivates people to engage in a productivity imperative. Further, we need
to support that engagement through our words and our actions. Again, as with safety, effective
leadership will be critical to building this culture.

40
6: Conclusion
The Teck coal business unit is under extreme pressure to remain competitive in what is
now the worst down turn the steel making coal industry has experienced since the 1980s. There
are few areas left to improve our cost position short of major structural change that could affect
the long-term viability of the organization. The one area that represents the greatest single cost
and therefore, the single greatest opportunity is truck/shovel productivity. Exceptional
truck/shovel productivity kept Southeast coal operations competitive in the 1990s. That focus on
productivity not only allowed the operations to survive a two-decade downturn but eventually
lead to exceptional returns when the steelmaking coal market improved.
It is my belief, that Teck must implement a strategy that leverages historical capability
and develops a culture of productivity across the operations. This thesis has outlined both a
project that has been initiated to identify best practice and the associated gaps as well as a proven
strategy to create transformation change in the organization. By combining the technical
knowledge of truck/shovel productivity with the force of a cultural shift to productivity, we will
not only remain competitive but will be in a position to deliver exceptional financial returns to
Teck in the future.

41
References
Kotter, J. P. (1995). Leading change: Why transformation efforts fail. Harvard business
review, 73(2), 59-67.
Greenhills “Book of Standards”: this is an internal document in Teck developed by Greenhills
outlining the best practice from their perspective on truck shovel productivity.
“The Process of Creating a Culture of Safety at Teck”: this is an internal document in Teck
used to provide background and historical perspective on the development and execution of
the Courageous Safety Leadership strategy. This strategy was first introduced to coal in 2005
and became a corporate standard in 2009 guiding the cultural transformation in safety for
Teck.