truancy intervention: a study of dallas independent …/67531/metadc4880/m2/1/high... · serious...
TRANSCRIPT

TRUANCY INTERVENTION: A STUDY OF DALLAS INDEPENDENT SCHOOL
DISTRICT PARTICIPANTS IN THE DALLAS CHALLENGE TRUANCY AND CLASS C
ENFORCEMENT CENTER
James John Fairchild Jr., B.S.
Thesis Prepared for the Degree of
MASTER OF SCIENCE
UNIVERSITY OF NORTH TEXAS
August 2005
APPROVED: Tory Caeti, Major Professor Eric Fritsch, Committee Member Peggy Tobolowsky, Committee Member Robert W. Taylor, Chair of the Department of
Criminal Justice David W. Hartman, Dean of the School of
Community Service Sandra L. Terrell, Dean of the Robert B.
Toulouse School of Graduate Studies

Fairchild, James John, Jr. Truancy Intervention: A Study of Dallas Independent
School District Participants in the Dallas Challenge Truancy and Class C Enforcement
Center. Master of Science (Criminal Justice), August 2005, 96 pp., 77 tables,
references, 50 titles.
This research examines agency data for participants in a truancy intervention
program. Previous literature provides mostly descriptive information and fails to
examine the effects of truancy intervention efforts. The analysis provides a profile of
truant participants referred to the program and factors that correlate to successful
completion of the program requirements. The results will be applicable to the study
program as evaluation research and will be generalized for application to other truancy
programs. Directions for future truancy research will be suggested based on the need
to continue to evaluate truancy reduction efforts

ii
TABLE OF CONTENTS
Page LIST OF TABLES AND GRAPHS .................................................................................iv Chapters
1. INTRODUCTION ..................................................................................... 1 Risk and Protective Factors for Juvenile Delinquency Truancy as a Risk Factor for Juvenile Delinquency Overview of the Dallas Challenge Truancy and Class C Enforcement Center Program Overview of Remaining Chapters
2. LITERATURE REVIEW ......................................................................... 11
Truancy: What Is It? Truants: Who Are They? Truancy Prevention: What Is Being Done? Common Themes in Truancy Prevention Truancy: What Does It Cost?
3. METHODOLOGY .................................................................................. 24
Population to be Studied Data Collection Variables to be Examined Statistical Analysis Generalizability
4. ANALYSIS ............................................................................................. 33
Participant Overview School Related Variables Family Related Variables Personal Related Variables Profile of a Truant Juvenile Comparison of Successful and Unsuccessful Completion Groups
iii
Crosstabulation and Means Comparison Results for Demographic and Truancy Center Related Variables Crosstabulation Results for School Related Variables Crosstabulation and Means Comparison Results for Family Related Variables Crosstabulation and Means Comparison Results for Personal Related Variables Summary of Variables That Indicate a Change in Successful Completion of Truancy Center Program Requirements
5. CONCLUSIONS AND DISCUSSION..................................................... 82
Limitations Associated with Research Conclusions Implications of Analysis Results Generalization of Results to the Truancy Center and Beyond Future Research in Truancy Prevention and Intervention
REFERENCES............................................................................................................ 93
LIST OF TABLES AND GRAPHS
Page Table 1 – Variables Included in Analysis....................................................................... 29 Graph 1 – Completion of Truancy Center Requirements by Sex .................................. 33 Graph 2 – Gender of Participants by Age...................................................................... 34 Graph 3 – Gender of Participants by Age and Ethnicity ................................................ 34 Graph 4 – Grade Level at Intake ................................................................................... 35 Graph 5 – Number of Grades Failed ............................................................................. 36 Table 2 – Parent Has Been Called to School for Juvenile’s Behavior ........................... 37 Table 3 – Parental Estimation of Juvenile # of Absences.............................................. 37 Table 4 – Juvenile Has Been Suspended/Expelled....................................................... 37 Table 5 – Juvenile has a Learning Disability ................................................................. 38 Table 6 – Juvenile is in Special Education Classes ...................................................... 38 Table 7 – Juvenile with Learning Disability in Special Education Classes..................... 39 Table 8 – Parent/Guardian That Juvenile Lives With .................................................... 39 Table 9 – Is Parent/Guardian Married ........................................................................... 39 Table 10 – Parent Employed......................................................................................... 40 Table 11 – Spouse Employed ....................................................................................... 40 Table 12 – Family has Medical Insurance ..................................................................... 40 Table 13 – Family Member with Criminal Involvement/Arrest ....................................... 40 Table 14 - # of Children in the Household ..................................................................... 41 Table 15 – Age Eligible Children Enrolled in School ..................................................... 41 Table 16 – Previously in Counseling/Treatment............................................................ 42
iv
Table 17 – Previous Dallas Challenge Referral............................................................. 42 Table 18 – Juvenile Reported Any Abuse ..................................................................... 42 Table 19 – Juvenile Reported Emotional Abuse ........................................................... 42 Table 20 – Juvenile Reported Physical Abuse .............................................................. 43 Table 21 – Juvenile Reported Sexual Abuse ................................................................ 43 Table 22 – Juvenile is Currently Employed ................................................................... 43 Table 23 – Juvenile Has Been Fired From a Job .......................................................... 43 Table 24 – Juvenile Has Use Nicotine........................................................................... 44 Table 25 – Juvenile Has Use Alcohol............................................................................ 44 Table 26 – Juvenile Has Used Marijuana...................................................................... 44 Table 27 – Juvenile Has Used Hard Drugs ................................................................... 45 Table 28 – Parental Knowledge of Alcohol Use ............................................................ 45 Table 29 – Parental Knowledge of Drug Use ................................................................ 45 Table 30 – Parental Knowledge of Marijuana Use ........................................................ 45 Table 31 – Parental Knowledge of Hard Drug Use ....................................................... 46 Table 32 – Parental Knowledge of Juvenile Involvement in Drug Sales ....................... 46 Table 33 – Exclusion from Logistic Regression for Missing Responses........................ 49 Table 34 – Variables Included in Regression and Significance..................................... 49 Table 35 – Regression Model Predicted Outcome for Successful/Unsuccessful
Completion............................................................................................................. 50 Table 36 - Completion Status and Sex Crosstabulation ................................................ 51 Table 37 - Completion Status and Ethnicity of Juvenile Crosstabulation....................... 52 Table 38 – Completion Status by Sex and Ethnicity Crosstabulation............................ 52 Table 39 – Comparison of Mean Age by Completion Status......................................... 54
v
Table 40 - Completion Status and Previous Dallas Challenge Referral Crosstabulation
............................................................................................................................... 54 Table 41 - Completion Status and Parental Estimation of Absences Crosstabulation .. 55 Table 42 – Completion Status and Juvenile Suspended/Expelled Crosstabulation ...... 57 Table 43 – Completion Status and Parent Has Been Called to School Crosstabulation57 Table 44 – Completion Status by Parent Called and Juvenile Suspended/Expelled
Crosstabulation ...................................................................................................... 58 Table 45 - Completion Status and Juvenile Has a Learning Disability Crosstabulation 58 Table 46 - Completion Status and Juvenile is in Special Education Classes
Crosstabulation ...................................................................................................... 59 Table 47 - Completion Status and Number of Grades Failed Crosstabulation .............. 59 Table 48 - Completion Status and Juvenile Involvement in Extra-Curricular Activities
Crosstabulation ...................................................................................................... 60 Table 49 - Completion Status and Parent/Guardian Marital Status Crosstabulation ..... 61 Table 50 - Completion Status and Family Member That Juvenile Lives with
Crosstabulation ...................................................................................................... 62 Table 51 - Completion Status and Parent Employment Crosstabulation....................... 63 Table 52 - Completion Status and Parent Spouse Employment Crosstabulation.......... 64 Table 53 – Comparison of Number of Children in Home by Completion Status............ 64 Table 54 – Completion Status and Age Eligible Children Enrolled in School
Crosstabulation ...................................................................................................... 65 Table 55 - Completion Status and Medical Insurance Crosstabulation ......................... 65 Table 56 - Completion Status and Family Member with Criminal Involvement/Arrest
Crosstabulation ...................................................................................................... 66 Table 57 - Completion Status and Juvenile Nicotine Use Crosstabulation.................... 67 Table 58 - Completion Status and Juvenile Alcohol Use Crosstabulation..................... 67
vi
Table 59 - Completion Status and Juvenile Marijuana Use Crosstabulation ................. 68 Table 60 – Completion Status and Juvenile Hard Drug Use Crosstabulation ............... 68 Table 61 – Comparison of Age of First Use by Completion Status ............................... 69 Table 62 – Completion Status and Parental Knowledge of Alcohol Use Crosstabulation
............................................................................................................................... 70 Table 63 – Completion Status and Parental Knowledge of Marijuana Use
Crosstabulation ...................................................................................................... 70 Table 64 – Completion Status and Parental Knowledge of Hard Drug Use
Crosstabulation ...................................................................................................... 71 Table 65 – Completion Status and Parental Knowledge of Involvement in Drug Sales
Crosstabulation ...................................................................................................... 72 Table 66 – Completion Status and Juvenile Reported Abuse Crosstabulation ............. 72 Table 67 – Completion Status and Juvenile Reported Emotional Abuse Crosstabulation
............................................................................................................................... 73 Table 68 – Completion Status and Juvenile Reported Physical Abuse Crosstabulation73 Table 69 – Completion Status and Juvenile Reported Sexual Abuse Crosstabulation . 74 Table 70 – Completion Status and Juvenile Has Been Picked Up By Police
Crosstabulation ...................................................................................................... 75 Table 71 – Completion Status and Juvenile Has Been Arrested Crosstabulation ......... 75 Table 72 – Completion Status and Parent Reported Gang Involvement Crosstabulation
............................................................................................................................... 76 Table 73 – Completion Status and Juvenile is Employed Crosstabulation.................... 77 Table 74 – Completion Status and Juvenile Has Been Fired From a Job Crosstabulation
............................................................................................................................... 78 Table 75 – Completion Status and Juvenile Counseling/Treatment Crosstabulation .... 78 Table 76 - Variables Values Which Produced Significant Difference from Baseline
Successful Completion Percentage ....................................................................... 79
vii

Table 77 – Comparison of Percentages within Completion Status to Illustrate Effect on Program Completion .............................................................................................. 85
viii

CHAPTER 1 INTRODUCTION
With the ever-growing concern about crime in our society, researchers and
practitioners are continuously seeking options to reduce and prevent crime before it
occurs. The fact that juveniles (individuals under age 18) make up only 19% of the
population while accounting for 29% of criminal arrests (Cottle, Lee, and Heilbrun 2001)
has caused a great deal of attention to be placed on efforts being made in the juvenile
justice field. The juvenile justice system in this nation has made a commitment to deal
with the problem of juvenile crime and delinquency. This includes not only handling
those juveniles who commit crime and delinquent acts but also reducing the juvenile
crime rate and making efforts to prevent juveniles from ever committing crime or
becoming involved in the juvenile justice system. Reduction and prevention programs,
in general, are designed to address juvenile delinquency problems in the best possible
manner and to produce the most promising results.
Many recent efforts within the juvenile justice system have sought to determine
characteristics which place juveniles at risk for committing crime and to incorporate
services into programs that can address these risk factors. By identifying these factors
in the early development of the juvenile, researchers and program administrators hope
that intervention and education can reduce the likelihood that a juvenile will commit
crime (Hawkins, Herrenkohl, Farrington, Brewer, Catalano, Harachi and Cothern 2000).
Along this same line of reason, similar services can be provided to juveniles with a
history of minor delinquency and status offenses in the effort to prevent escalation to
more serious crimes. The provision of services to status offenders has become an
increasingly popular alternative to formal juvenile justice system processing in order to
1

avoid negative interaction with the system that could push juveniles toward crime and
limit their offenses to those that are less serious in nature.
The Dallas Challenge Truancy and Class C Enforcement Center is one such
program which addresses truant behavior as a risk factor and seeks to eliminate the
likelihood of future criminality through social service intervention and education. The
program is an alternative to court processing, for those juveniles who have exhibited the
early stages of delinquent behavior, which attempts to alter the behavior and refocus
the participants on their education. Prior to examining the Dallas Challenge program
and its specifics, it is important to understand the concept of risk factors and the place
truancy fits into predicting future criminality.
Risk and protective factors for juvenile delinquency
The concept of risk factors as a predictor of criminal behavior has become a
popular area of exploration within juvenile justice research. Identifying those factors in a
juvenile’s life that contribute to delinquency and the amount of predictive value they
have in leading to crime is a valuable tool in addressing juvenile crime. Conversely,
determining those protective factors that reduce a juvenile’s chance of committing crime
is equally important for juvenile justice practitioners. By recognizing the factors, both
protective and risk, that play a role in predicting criminality, programs can provide more
effective services to juveniles. In numerous studies, researchers have identified both
risk factors that increase and protective factors that decrease the probability of
delinquency (see Bilchik 1995; Brown, Schulenberg, Bachman, O’Malley and Johnston
2001; Carr and Vandiver 2001; Cottle et al 2001; Elliot 1998; Ellis and Sowers 2001;
2
Hallfors, Vevea, Iritani, Cho, Khatapoush and Saxe 2002; Hawkins et al 2000;
Herrenkohl, Maguin, Hill, Hawkins, Abbott and Catalano 2000; Holmes, Slaughter and
Kashani 2001; Duncan, Duncan and Strycker 2000; Jessor 1992; Najaka, Gottfredson
and Wilson 2001; Paetsch and Bertrand 1997; Stouthamer-Loeber, Loeber, Wei,
Farrington and Wikstrorm 2002).
Risk factors can be any characteristic, trait, or influence that increases the
probability of a juvenile committing a criminal or delinquent act. Ellis and Sowers (2001)
categorized risk and protective factors as related to the life area that the juvenile
experiences the risk; including individual, family, school, peer and community risk
factors. Within these categories falls a plentitude of factors that can contribute to or
reduce the possibility of criminal behavior. While there is no equation for predicting
delinquency based on risk and protective factors it has been found that as risk factors
increase and protective factors decrease, the likelihood of delinquency multiplies
(Hawkins et al 2000; Herrenkohl et al 2000) and the potential for escalation into more
serious delinquent behavior rises (Huzinga, Loeber, and Thornberry 1994).
The value of identifying risk and protective factors becomes apparent when it is
incorporated into a program setting. Risk factors must be assessed through intake
procedures, interviews and review of the juvenile’s previous record (Heilbrun, Brock,
Waite, Lanier, Schmid, Witte, Keeney, Westendorf, Buinavert, and Shumate 2000;
Taylor, Fritsch and Caeti 2002) in order to determine appropriate services,
interventions, education, and supervision for the juveniles participating in the program.
Those juveniles who are determined to be most at risk, based on the identified risk
factors present, should receive the most intensive and comprehensive services to
3

provide the greatest likelihood for avoiding delinquency. It must be considered that risk
factors are often inter-correlated and can perpetuate one another in a cyclical pattern
(Jessor 1992).
Truancy as a risk factor for juvenile delinquency
One of the risk factors that is often associated with increased probability of
criminal behavior in juveniles is truancy. When considering truancy as a risk factor for
delinquency it should be noted that truancy can be considered both a risk factor for
serious delinquency problems and a delinquent behavior that is a result of other risk
factors. For this reason, program administrators and researchers can examine truancy
that is a result of risk factors such as peer associations, family problems or individual
rebelliousness (Bilchik 1995) or as a risk factor that contributes to more serious
delinquent activities such as violence, gang involvement, or substance abuse (Brown et
al 2001; Fergusson, Lynskey and Horwood 1996; Hallfors et al 2002; Huizinga, Loeber,
Thornberry and Cothern 2000; Pritchard, Cotton and Cox 1992; Swadi 1992; Taylor et
al 2002).
Truancy, whether a risk factor for delinquency or a behavior resulting from a high
risk environment, must be addressed appropriately within a program setting. Intake
procedures must determine the nature of the problem that is causing truancy.
Comprehensive services must be available to address the multitude of issues that may
contribute to the juvenile’s truant behavior and at the same time deter the juvenile from
continuing such behavior.
4

Overview of the Dallas Challenge Truancy and Class C Enforcement Center program
Dallas Challenge, Inc. operates as a public/private organization which provides
intervention and prevention services to at risk youth and their families within Dallas,
Denton and Collin County. Dallas Challenge addresses all of the following risk factors
that face the adolescents that come through its doors: alcohol, tobacco, and drug use,
low academic performance, truancy, poor social skills, delinquent behavior, and criminal
behavior. The Dallas Challenge Truancy and Class C Enforcement Center is one of
three departments that make up the larger Dallas Challenge, Inc. which seeks to re-
establish school attendance for its participants by providing individual attention and
social services. The Truancy and Class C Enforcement center (hence forth referred to
as Truancy Center in this writing) operates in conjunction with the Dallas County
Commissioners Court and the Juvenile Board as a county funded agency with an
operating budget of $504,250 (2005 budget). The Truancy Center provides services to
youth who have failed to attend school or failed to follow a judge’s order with regard to a
truancy violation and are being held in contempt of court. The program was developed
to both divert juveniles with contempt charges from involvement in the juvenile justice
system and provide the opportunity to change at-risk behavior prior to escalation to
serious delinquency.
The state of Texas allows for several avenues by which a juvenile can be
directed to participate in the Truancy Center for violation of truancy statutes. In §
25.085 of the Texas Education Code, it stipulates the compulsory school attendance
laws which mandate that any child who is at least six years old and has yet not reached
age eighteen must attend every day of school for the entire period of instruction. A child
5

commits the offense of truancy if the he/she fails to attend school on ten or more whole
or partial days in a six month period or on three or more whole or partial days within a
four week period, according to § 25.094 (Failure to Attend School)of the Texas
Education Code. The failure to attend statutes also clarify that truancy violations can
fall into the jurisdictions of either the constitutional county, justice, or municipal courts
and once a finding of truancy is reached the juvenile is placed under court order which
requires that he/she do one of the following: attend school without further absences,
attend a high school equivalency class, attend a program that is determined to provide
services that are in the best interest of the juvenile, attend a class for students at risk of
dropping out with the juvenile’s parents, perform community service, or participate in a
tutorial program sponsored by the juvenile’s school.
The Truancy Center receives its clientele from all of the above mentioned courts
operating within Dallas County and the surrounding municipalities. Dallas County has
enacted three constitutional county courts with the specific function of hearing Dallas
Independent School District truancy cases in 2003 when legislation allowed jurisdiction
to fall under the county courts. Prior to 2003, Dallas ran 2 municipal courts that
operated for the same function, hearing truancy cases. Surrounding municipalities also
refer truancy cases to the Truancy Center from their municipal and justice courts.
Texas statutes also allow, in the Code of Criminal Procedure § 45.057 (Offenses
Committed by Juveniles), for a child and his/her parents to be referred to a program for
social services for offenses defined in Family Code § 51.03 (Delinquent Conduct;
Conduct Indicating a Need for Supervision) and Family Code § 264.302 – 303 (Early
6

Youth Intervention Services and Determination of At-risk Child), which reference the
truancy statute in the Education Code.
After a juvenile is found to be truant or non-compliant with an order to attend
school, the presiding judge may order that the juvenile be transported to the Truancy
Center by Dallas County Constables. The juvenile’s parents are also ordered to appear
at Dallas Challenge within 90 minutes of their child being transported. These immediate
actions are designed to increase the accountability of the juvenile for the opposition to
the court order.
Upon arrival, at the Truancy Center, a case manager gives the juvenile the option
to participate in the truancy deferred prosecution program or to be sent to the Juvenile
Detention Center. Upon agreeing to participate in the Truancy program, the juvenile
undergoes a thorough intake assessment to determine the nature and extent of the
problems that contributed to the inability to comply with the court order. The parents are
also included in the intake to allow for input about the child’s history, behavior and
family dynamics. Based on the needs assessed during the intake process an
intervention plan is developed detailing the programs the juvenile and parents are
expected to attend and outlining the behavior expected from the child while participating
in the program.
Following the intake process, the juvenile appears before an on-site referee. The
referee is given jurisdiction by the juvenile board, by Family Code § 51.04 (Jurisdiction),
for proceedings involving conduct indicating a need for supervision, in this case, truancy
cases. The referee issues a court order for the juvenile to complete an informal
7

probationary period with the Truancy Center which is based on the intervention plan
determined by the case manager who performed the intake assessment.
Upon implementation of the case plan, the juvenile’s progress is monitored by
one of the Dallas Challenge case managers for a period of time between 3 and 6
months. The case manager is responsible for assuring the juvenile is in compliance
with the case plan, intervening when needed and taking action when the juvenile
deviates from the guidelines of the case plan. Court reviews of the juvenile’s case are
made to assure compliance with the program stipulations. If at any time the juvenile
strays from the case plan that was agreed upon, the case manager may alter the plan to
address the problems. The case manager may modify the case plan to address new
needs of the juvenile, extend the program time, recommend multiple court reviews,
place the child in a temporary shelter, or develop new resources for the child and
his/her family. If the juvenile complies with the conditions of the court order and follows
the case manager’s outline for services, the case is closed successfully and the juvenile
avoids formal processing in the juvenile justice system.
If the juvenile fails to comply with the Truancy Center issued court order, under
Article 45.050 (Failure to Pay Fine; Contempt: Juvenile) of the Code of Criminal
Procedure, it is considered to be an action that constitutes contempt of court and results
in the referral of the juvenile to the appropriate juvenile court for delinquent conduct for
contempt of the court order. Referral to the juvenile court is considered a last resort
when all program options have been exhausted.
Dallas Challenge has three primary goals for its Truancy program: (1) preventing
further progression of the juvenile into the juvenile justice system, (2) preventing
8

juveniles from “falling through the cracks” of the juvenile justice system, and (3) to
involve the community in the truancy intervention strategy. All of these goals combine
to create a program that addresses truancy through a comprehensive, multi-faceted,
community interest driven program. Dallas Challenge Truancy and Class C
Enforcement Center provides a cost-effective alternative to processing juveniles for an
offense that has previously been under recognized and improperly addressed.
According to agency information, Dallas County spends approximately $5000 for each
juvenile who enters the Juvenile Justice system and $20,000 for six months in a juvenile
residential center, while only spending $500 per juvenile who participates in the Truancy
Center. In doing so, the program is providing a quality service not only to its consumers
and their families but also to the community which its consumers come from.
(Information from Dallas Challenge Program Literature 2002 and
www.dallaschallenge.org )
With the increased attention that is being placed on risk reduction programs and
the need for evaluative research in the area of truancy it is appropriate and necessary to
examine the efforts of the Dallas Challenge Truancy and Class C Enforcement Center
to determine if it is accomplishing its organizational goals. This study will examine the
participants in the Dallas Challenge program to determine common characteristics of
the juveniles who are referred to the program. Additionally, statistical analysis will
determine the factors that are correlated to the successful or unsuccessful completion of
the program requirements.
9

Overview of Remaining Chapters
This research is divided into 5 chapters including the preceding introduction.
Chapter 2 is a comprehensive review of the available truancy literature. Included
is an examination of the nationwide definitional problems associated with truancy, the
difficulties associated with collecting reliable offense data and a description of the
factors that contribute to truancy. Additionally, a review of recommendations that
researchers have made in regard to truancy prevention will be presented. Finally, the
costs of truancy will be examined in relation to the individual and the community.
Chapter 3 will provide the methodological procedure for the research study. This
chapter will outline the methods for data collection, variables to be examined, selection
of the sample groups to be studied, statistical analysis techniques to be used, limitations
of the study, and generalizability of the findings.
Chapter 4 will include an analysis of the data and a presentation of the results of
the statistical testing. An examination of the characteristics of the typical truant referred
to Dallas Challenge will provide a “profile” of a generic truant. The researcher will also
perform a logistic regression to determine the variables that predict success or failure
within the program.
Chapter 5 will be a discussion of the results of the research and a conclusion.
Included will be implications of the findings for Dallas Challenge and possible
applications of the findings to other truancy prevention programs. Recommendations
for additional truancy research and its possible benefits will also be made based on the
outcome of this research.
10

CHAPTER 2 LITERATURE REVIEW
Despite the recent attention placed on truancy as a growing concern within
educational and juvenile justice areas, there is a relatively small amount of quality
literature on the subject. That which does exist can be best characterized as
descriptive, speculative and exploratory in nature and consists mostly of program
descriptions with little evaluation research, drawing conclusions which are loosely based
on marginal results. Because of the limited research on the subject and the
repetitiveness of the literature that is available, it is best to examine the literature by
subject matter as it relates to the research questions for this project.
In doing so, it is appropriate to examine the general topic of truancy and the
characteristics that truants have been found to possess. Additionally, it is important to
consider truancy prevention efforts and the steps being taken within programs which
target truancy. This will include results from programs that are currently in operation
which have conducted evaluation research. Finally, the consequences of truancy, not
only for the juveniles, but the long term costs to families, schools and communities in
which truant juveniles live, must also be considered.
Truancy: What is it?
One difficulty in examining the issue of truancy is that there is not a universally
accepted definition of the offense or any national measure of its occurrence (Baker,
Sigmon, and Nugent 2001; Bell, Rosen, and Dynlacht 1994; Gabb 1994; Sommer
1985a). Each state has its own compulsory laws regarding school attendance that
translate into individual definitions of truancy (Gonzales and Mullins 2004). For the
11

purposes of law enforcement those definitions serve their intended purpose, but they
also serve to provide enough variance across the nation to inhibit the collection of data
on the occurrence of the offense on a national scale (Baker et al 2001; Gonzales and
Mullins 2004). Considering the variance within state statutes regarding truancy and the
application and interpretation of enforcement of truancy policies often falling into the
hands of school districts or even individual schools, uniform enforcement of a state’s
attendance law, even within its own borders, can be inconsistent (Gonzales and Mullins
2004; Heilbrunn 2004).
This dilemma is further confounded by the fact that researchers have broken the
concept of truancy into even more specific terms, such as non-attendance (DeKalb
1999; Schultz 1987), school refusal (Sommer 1985a), and have even separated truants
into simple and habitual offenders (Bell et al. 1994; Mueller 2000; Sommer 1985a) or
blanket and post-registration truancy (Gabb 1994). Despite the ambiguity of these
definitions, most of the literature characterizes truancy as an unexcused absence from
school, whether authorized or not by the parents.
Even without a national reporting mechanism for truancy, there seems to be no
lack of national, state or local statistics on the offense. Rates, percentages of student
populations and raw numbers of those missing school are available in practically every
report on truancy (see Bell et al. 1994; DeKalb 1999; Garry 1996; WESTMARC
(www.kci.org) 2002; Manual 1996; Mueller 2000; Schultz 1987; Sommer 1985a;
Truancy – Dealing with a School, Community, and National Problem (www.kci.org)
2002). Most of these reports do not reveal the source of the data, but it can be
assumed that it is pulled from school daily absence reports which are sent to the state
12
for funding purposes. The difficulty of differentiating between absences for legitimate
reasons and those related to truant activity make using absence reporting an unreliable
source of truancy statistics.
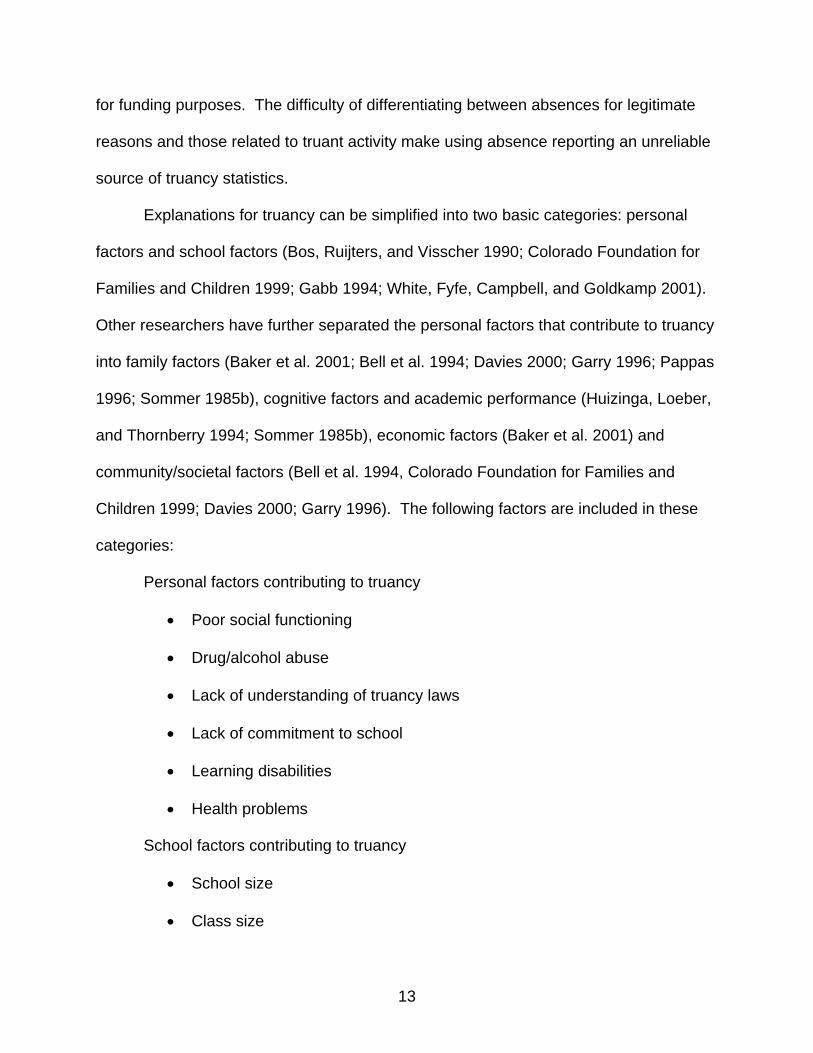
Explanations for truancy can be simplified into two basic categories: personal
factors and school factors (Bos, Ruijters, and Visscher 1990; Colorado Foundation for
Families and Children 1999; Gabb 1994; White, Fyfe, Campbell, and Goldkamp 2001).
Other researchers have further separated the personal factors that contribute to truancy
into family factors (Baker et al. 2001; Bell et al. 1994; Davies 2000; Garry 1996; Pappas
1996; Sommer 1985b), cognitive factors and academic performance (Huizinga, Loeber,
and Thornberry 1994; Sommer 1985b), economic factors (Baker et al. 2001) and
community/societal factors (Bell et al. 1994, Colorado Foundation for Families and
Children 1999; Davies 2000; Garry 1996). The following factors are included in these
categories:
Personal factors contributing to truancy
• Poor social functioning
• Drug/alcohol abuse
• Lack of understanding of truancy laws
• Lack of commitment to school
• Learning disabilities
• Health problems
School factors contributing to truancy
• School size
• Class size
13
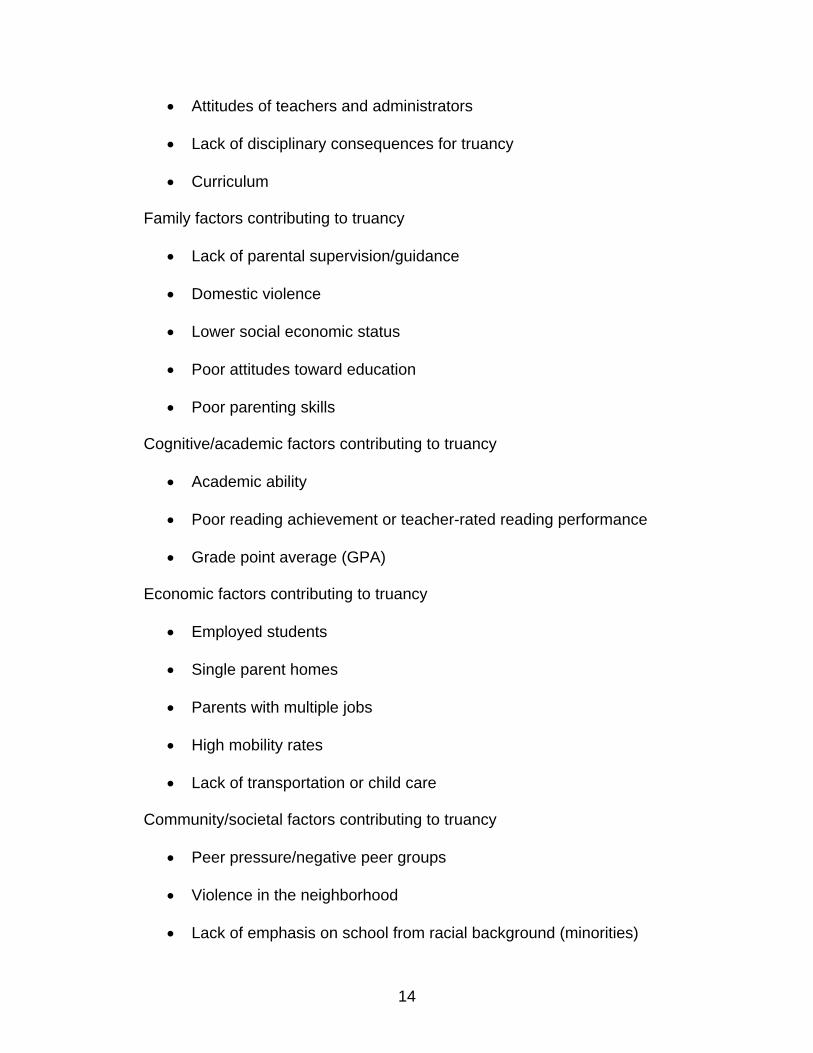
• Attitudes of teachers and administrators
• Lack of disciplinary consequences for truancy
• Curriculum
Family factors contributing to truancy
• Lack of parental supervision/guidance
• Domestic violence
• Lower social economic status
• Poor attitudes toward education
• Poor parenting skills
Cognitive/academic factors contributing to truancy
• Academic ability
• Poor reading achievement or teacher-rated reading performance
• Grade point average (GPA)
Economic factors contributing to truancy
• Employed students
• Single parent homes
• Parents with multiple jobs
• High mobility rates
• Lack of transportation or child care
Community/societal factors contributing to truancy
• Peer pressure/negative peer groups
• Violence in the neighborhood
• Lack of emphasis on school from racial background (minorities)
14

• Lack of acceptance of education as means of success
Researchers have suggested all of the above factors in proposing the causality
of truancy among students. Most have combined the categories and factors into an
equation of truancy, while others stand by a single category as the primary cause of
truancy.
Truants: Who are they?
Because truancy is a status offense, the age of the offender is predetermined by
the fact that he/she must be a juvenile, usually under age 18 (some state truancy laws
extend only through age 16 or 17, while a few only require completion of 8th grade)
(Colorado Foundation for Families and Children 1999). Beyond that general stipulation,
different researchers have found truants to have varying characteristics.
When considering age as a characteristic of truants, researchers propose the
idea that increases in truancy correspond with an increase in age (Bell et al. 1994;
Welsh, Jenkins, and Harris 1999). This can most likely be explained by a “growing into
deviancy” explanation. Studies have found the median age of truants to be 15 years old
(Baker et al. 2001; White et al. 2001) but both older and younger students are included
in truancy numbers as well.
With regards to gender of truants, Baker et al. present the idea that truancy is
split evenly among boys and girls across the nation (2001). This has not proven true in
some of the programs and sweeps that have been reviewed by other researchers.
Truancy sweeps in Richmond, CA picked up boys at a ratio of 2 to 1 to girls (White et al.
2001), while Bell et al. (2001) presents information from two separate studies that
indicate exact opposites, one showing that boys are more likely to be truant during the
15

first 3 years of high school than girls, the other that girls are more likely to be truant than
boys. From information provided by the above researchers, it would seem that this
characteristic of truancy would be contingent on the sample techniques and the size of
the sample that was being examined.
One similarity between truancy demographics is that minorities, especially
African Americans, represent the majority of those students who are truant (Bell et al.
1994; White et al. 2001). Some of the other characteristics that were found to be
shared by truants include: coming from low-income families (Bell et al. 1994), having
poor grades in the years previous to being picked up for truancy, having poor school
attendance (excused or unexcused absences), receiving disciplinary sanctions in
school in the years leading up to truancy, having contact with police agencies (arrest,
suspicion, victims, witnesses, or less formal contact) (White et al. 2001) and reporting
hanging out with large groups of people (Sommer 1985b).
Truancy prevention: What is being done?
There are programs spread across the nation that are either partially or totally
dedicated to truancy prevention as their organizational goal. The methods and
procedures by which a program goes about achieving its goals ultimately determines
the success of the clients in avoiding further truancy and the overall success of the
program. The wide variety of programs across the nation makes it impossible to review
all of their tactics and methods employed. Instead, this section will review some of the
general methods being used to reduce truancy and some recommendations for truancy
prevention programs in order to increase the likelihood of success. Additionally, it will
16

identify some of the mistakes and pitfalls that programs might make when dealing with
truants which could jeopardize the success of the program.
Common Themes in Truancy Prevention
There are several characteristics of truancy prevention programs which are
practically universal across the nation. The involvement of the school and law
enforcement agencies to address the truancy of the student and making the parents
aware of the situation are the most common and necessary characteristics of any
truancy prevention program (Colorado Foundation for Families and Children 1999;
DeKalb 1999; Garry 1996; WESTMARC (www.kci.org) 2002). Additionally, providing
serious sanctions for both truants and their parents in order to ensure responsibility and
dedication to changing behavior is an important factor in preventing further truancy
(Baker et al. 2001; Truancy (www.kci.org) 2002; Mueller 2000).
Truancy prevention programs rely mostly on law enforcement, school officials,
juvenile probation officers, or program employees to detect or catch students who are
truant from school. This initial step brings the juvenile in contact with the truancy
prevention program and begins the process. Depending on the program practices, the
juvenile may be ticketed for the violation (Pappas 1996), returned to school, released to
a truancy processing center to be released to a parent (Baker et al. 2001; Garry 1996),
or detained by the police until a parent picks the juvenile up. After initial contact, there
are a multitude of options that programs utilize to deal with the issue at hand and to
prevent further occurrence of truancy. Often times, the parents are notified of the initial
violation, either through letter, phone, or personally (Colorado Foundation for Families
17

and Children 1999). It is at this point that most programs diverge greatly in their
methods of dealing with truants and it seems best to discuss those program options that
provide the best outlook for reducing/preventing truancy.
Most important in developing a successful truancy prevention strategy is the
incorporation and cooperation of the student, parents, schools, law enforcement,
juvenile courts, social services, religious organizations, and the community in
developing a solution (Colorado Foundation for Families and Children 1999; ERIC 1997;
Manuel 1996; Truancy (www.kci.org) 2002). By utilizing the above mentioned
resources, it becomes possible to examine the root of truancy problems for each
individual juvenile and develop a specialized plan to combat the underlying causes of
the truancy problem (Colorado Foundation for Families and Children 1999). Only by
addressing the entire problem, through the use of every available resource, and being
persistent in changing the circumstances which led to the juvenile’s truancy, can it be
corrected.
The Office of Juvenile Justice and Delinquency Prevention (OJJDP) also
provides four guidelines under Title V Delinquency Prevention Programs that stipulate
requirements that must be met in order to receive program funding. They are:
1. Programs must be based on sound theory that is supported by positive
research results.
2. Programs must incorporate a system for data collection and analysis to
evaluate the program success/failure.
3. The program must be a result of collaborative efforts between public
agencies, private citizens, businesses and volunteers.
18

4. The program must periodically assess its operations and make
appropriate changes to programming, based on changing risk factors
within the community.
(Colorado Foundation for Families and Children 1999)
These four precepts are not only important to ensure funding from OJJDP but also to
make certain that the program has a chance to be effective in its goal of reducing and
preventing truancy. By following basic concepts of program evaluation, administrators
of the program will be able to determine if goals are being reached and if changes are
appropriate to better achieve the goals of the program.
Some of the pitfalls and mistakes that are present in the literature concerning
truancy and truancy prevention are easily identifiable and skew the picture of truancy
prevention efforts. Some studies make generalizations about juvenile populations
without drawing an appropriate random sample or utilizing proper sample sizes to
produce inferential statistics (Schultz 1987; Sommer 1985b). Another problem that has
been noted is the twisting of results, which is presenting results which are perceived in
one report to be poor results or failures and presenting the same results as successes
in another summary of the same program. In Truancy Reduction Efforts (2000), the
Wisconsin Joint Legislative Audit Committee Members and State Auditor Janice Mueller
report that the 65% attendance of school on the day following participation in the
Truancy Abatement and Burglary Suppression (TABS) program is a poor result for the
program. The same statistic is reported as a successful outcome in a summary of the
TABS program within the Manual to Combat Truancy (1996). This type of
19

misinformation only serves to confuse the situation and damage the reputation of the
program and others seeking to achieve the same goals.
Truancy: What does it cost?
Truancy is considered, within the majority of the literature, to be a risk factor to
predicting future delinquency and criminality (Baker et al. 2001; Davies 2000; De Kalb
1999; Fritsch, Caeti, and Taylor 1999; Gabb 1994; Garry 1996; Introduction
(www.kci.org) 2002; Manual 1996; Mueller 2000; Sommer 1985a; White et al. 2001).
That is to say that juveniles who are truant have a higher propensity to become involved
in gangs, drug and alcohol abuse, theft, burglary, and violent crimes than those
juveniles who are not truant. For a truant juvenile, there is an increased propensity
towards a life of crime that could ultimately lead to prison. A study of adult offenders
found that 84% of those who had re-offended had truancy as their first offense on their
arrest records or had been truant without being caught to begin their criminal career
(Truancy (www.kci.org) 2002). Studies have also examined the causal relationship of
truancy to delinquency and the explanatory relationship of delinquency to truancy
(Huizinga, Loeber, and Thornberry 1994; Huizinga, Loeber, Thornberry, and Cothern
2000) in an attempt to recognize the predictive benefits of truancy to future criminality.
The other consequence that a truant juvenile faces besides a higher propensity
towards delinquency and crime is the loss of education and increased probability of
dropping out of school prior to graduation (DeKalb 1999; Garry 1996; Truancy Gale
Encyclopedia 1998; White et al. 2001). It has been suggested that truancy is linked to
poor school performance and increased propensity to dropout prior to completion of
20

high school (Gonzales and Godwin Mullins 2004; Gonzales, Richards, and Seeley
2002; Helibrunn 2003; Helibrunn 2004). ). Missed educational opportunities translate
to reduced chances of graduation, lower earning potential, increased chances of welfare
dependency, and unemployment; all of which cost both the juvenile and the community
at large (Hibbett, Fogelman and Manor 1990). The problems related to non-completion
of high school place the individual at a considerable disadvantage considering that it
has been established that the earning potential for a high school dropout is far below
(approximately 75% for both males and females) his/her counterpart that earned a high
school diploma or equivalency (Heilbrunn 2003; National Center for Education Statistics
2003).
If a juvenile does not have the means to provide for themself due to squandered
educational opportunities, the community often times must bear the cost of supporting
an individual who has wasted the opportunity to become a self-sufficient member of
society. The cost of supporting these individuals falls back on society as a whole in the
form of government programs and actions that are supported by tax revenue, including:
welfare, food stamps, unemployment, Medicare and Medicaid, and Social Security and
SSI. The most costly of expenditures which are related to failure to complete high
school involve criminal justice expenses related to jail, prison and court costs. All
together, it is estimated that a high school dropout will require in excess of $200,000 in
public support expenditures over the course of a lifetime versus a high school graduate
(Heilbrunn 2003; Heilbrunn and Seeley 2003). With truancy being an indicator for high
school completion, it seems appropriate to direct resources toward reducing its
occurrence.
21

A community also suffers from truancy in the form of victimization at the hands of
those juveniles who would be in school who decide to expand their delinquent behavior
beyond non-attendance. Truancy has been related to high incidence of daytime
burglary and vandalism (Gonzales, Richards, and Seeley 2002). Some truancy
prevention programs have been found to reduce daytime crimes such as theft and
burglary that are committed by juveniles (DeKalb 1999; Fritsch et al 1999; Garry 1996;
Manual 1996). By reducing truancy, it stands to reason that the money lost because of
daytime crime committed by truants would concurrently be reduced.
There have also been cost-benefit analysis studies for truancy programs that
show the amount spent on providing truancy prevention services are far less than the
amount that would be spent on incarcerating that juvenile in juvenile custody (Garry
1996; Heilbrunn 2003; Heilbrunn and Seeley 2003). By dedicating the effort and
expense into truancy prevention early enough, it is possible to avoid greater
expenditures in the future when those juveniles escalate their criminal activities beyond
mere status offenses which would require more costly disposition for their actions.
The available truancy literature leaves a great deal of room for expansion. That
literature which is available addresses the main issues of truancy and truancy
prevention, but provides little quality evaluation research of programs that are currently
running. The information that is provided by most of the literature is cursory, at best,
and does not fully explain the phenomenon of truancy. That research which does
include evaluation of truancy prevention/reduction programs does not thoroughly
examine whether the programs effectively achieve the goal of reducing truancy. There
22

has been no research to date which examines the ability of a program to reduce future
delinquent/criminal activity or increase the likelihood of a juvenile completing high
school. This lack of depth in the available research is somewhat understandable
considering the relative infancy of the subject as a focus of research in the juvenile
justice field, but it is an important next step in truancy related research.
This research project will address gaps that exist in previous truancy research by
creating a profile of a truant based on those juveniles who are referred for services to
Dallas Challenge. It will also examine the differences in the characteristics of those
juveniles who completed the Dallas Challenge program versus those who did not.
23

CHAPTER 3 METHODOLOGY
The major problem with previous truancy research is that it has failed to give a
detailed picture of the individuals who commit the offense or programs that have been
found to reduce truancy. Most of the available information on truants and truancy
prevention programs is broad and non-specific in nature. This research project will
address this issue by evaluating the participants who were referred to the Dallas
Challenge Truancy and Class C Enforcement Center. Any child between the age of 10
and 17 in Dallas County, Texas who has been filed as truant, was found to be in
contempt of court related to the truancy charges and is not otherwise active in the
juvenile justice system can be referred for services. The primary objectives of the
Truancy Center are to: (1) cease the truant behavior in the juvenile and (2) reintegrate
the juvenile into school so that he/she may ultimately complete high school or a GED
equivalency program. The purpose of this study is to examine the characteristics of the
juveniles referred to the Truancy Center and whether specific characteristics of the
participants correlate with the successful completion of the program. This study will
answer the following research questions:
• What characteristics profile the typical juvenile who is referred to Dallas
Challenge for chronic truancy?
• What characteristics are correlated with successful or non-successful
completion of the Dallas Challenge program?
24

Population to be Studied
This research will involve a study of the population of juveniles from Dallas
Independent School District schools who have been referred to the Dallas Challenge
Truancy and Class C Enforcement Center since the program’s inception in 1996
through December 31, 2000. Since its opening in 1996, the Truancy Center has
received 5,605 referrals to the program (as of 6/12/2002, when the data was collected
from Dallas Challenge). This research will only examine a sample of 1,313 DISD
students who either successfully or unsuccessfully completed the Truancy Center
program.
Some of the population that is referred to the Truancy Center does not receive
services based on their circumstances within the juvenile justice system. Referred
juveniles are denied services for the following reasons: the juvenile commits a new
delinquency offense while enrolled in the program for less than 20 days, the juvenile is
already active in the juvenile justice department, or the Truancy Center has no
jurisdiction or probable cause for the offense. Any of these conditions can eliminate the
referred juvenile from being eligible for services. Because these juveniles were not
eligible to receive services from the Truancy Center they will not be included in the
analysis.
Data Collection
The data to be used for analysis in this study will be provided to the researcher
by the Dallas Challenge Truancy and Class C Enforcement Center. The Truancy
Center’s Associate Executive Director of Truancy Services, Shelton Stogner, brought
25

this research project to the University of North Texas Criminal Justice Department and
has a vested interest in the completion of the study. Therefore, Mr. Stogner has made
the necessary data and support from the Truancy Center staff available to the
researcher in this project.
The data provided to the researcher by the Truancy Center consists of the
information that was gathered from its participants and that which was collected by the
staff members about the participant’s progress in the program. The Truancy Center has
completed a detailed intake process for each juvenile referred to the program. The
intake instrument collected basic demographic, offense, family history, drug use, abuse
and other criminal information provided by both the juvenile and a parent or guardian.
Each juvenile and his/her parent/guardian was led through this process by one of the
program case managers, who in turn entered the collected data into the database
developed to maintain the records of all Truancy Center participants. The potential for
reliability and validity issues arising from the nature of self reported data from the
juvenile and his/her parent or guardian about potentially criminal behavior must be
acknowledged.
Both the juvenile participant and his/her parent or guardian were asked to
provide information about the child and household during each intake process. The
nature of self reported data in criminal justice settings such as this is cause for concern.
Issues of reliability that arise from self reported data from the juvenile and
parent/guardian include: memory recall problems of the child’s behavior, information
about absences from school, drug and alcohol use and the age when it first occurred,
and if the juvenile had previous arrests or interactions with police. These were all issues
26
addressed during the intake process that required both the juvenile and parent/guardian
to recall the juvenile’s past. Additionally, reluctance to report illegal or delinquent
behavior, such as alcohol or drug use, or potentially embarrassing information, such as
criminal behavior within the family, causes validity problems with the information
collected from the participant and the parent/guardian. Outright refusal to respond to
questions leaving blanks within each case file is yet another issue arising from the self
reported data supplied to researcher from the Truancy Center. These are recognized
problems associated with most self reported data in criminal justice research; but, for
this research project, the information collected from the Truancy Center participants and
their parent/guardian is the only source available and it was unable to be verified or
cross-checked for its reliability or validity.
The potential for error from data entry transcription mistakes also creates an
internal validity problem with the data. There were 23 case managers and additional
administrative/clerical staff who performed data entry for referred juveniles during the
time in question for this research project, all of which had the opportunity to enter
information incorrectly into the database. This combined with open text fields and a lack
of standardized responses within the database for many of the fields opens the door for
human error to affect the quality and integrity of the data collected by the Truancy
Center by allowing a wide variance of responses to be entered for any particular
variable (I.E. – open fields allowed for race description to be entered as white,
Caucasian, or Anglo).
The researcher was provided with the data collected on each referred juvenile in
the database form in which it was maintained in by the Truancy Center. This data was
27
converted into spreadsheet form so that it could be cleaned and formatted into a
useable form within a statistical analysis program. For those variables where it was
possible, text string variables were converted into numerical variables and assigned
values so that the data could be analyzed. The researcher analyzed the data for
spelling errors and variations and replaced those fields with the correct information
when it was clear what was intended to be entered by the Dallas Challenge staff.
These efforts were made to address the internal validity problems that were created by
human error during data entry.
The data provided to the researcher was manipulated for the purpose of this
research in other ways so that it might be useable to answer the specific research
questions. The Truancy Center, for its operational purposes, has more than one
outcome associated with unsuccessful completion of the programs requirements. For
the purpose of this research, the disposition of the juvenile upon failure to complete the
program requirements was not important so it was excluded. Therefore, the closing
category variable was recoded to a new variable which included only successful and
unsuccessful completion, and the unsuccessful variations were eliminated from
consideration.
Additionally, the Truancy Center collects self reported drug use information from
the juvenile during the intake assessment. For the purpose of simplification of that
information, the reported use of hard drugs such as inhalants, cocaine, crack, crank,
amphetamines, barbiturates, hallucinogens, tranquilizers, and heroin were all combined
into one variable called “hard drug use”. The reported information on the age of first
28
use by the juvenile regarding all of the above mentioned hard drugs was combined into
a variable called “hard drug age”.
As mentioned previously, data was collected from the parent or guardian who
picked up the juvenile at the Truancy Center upon referral from court. This data was not
originally entered into the agency database with the juvenile’s information. The
researcher obtained the files for the DISD participants from the Truancy Center and was
able to pull the parent reported information from these files with the help of UNT
Criminal Justice department student assistants. This information was coupled with the
participant data already provided to the researcher to be included in the analysis.
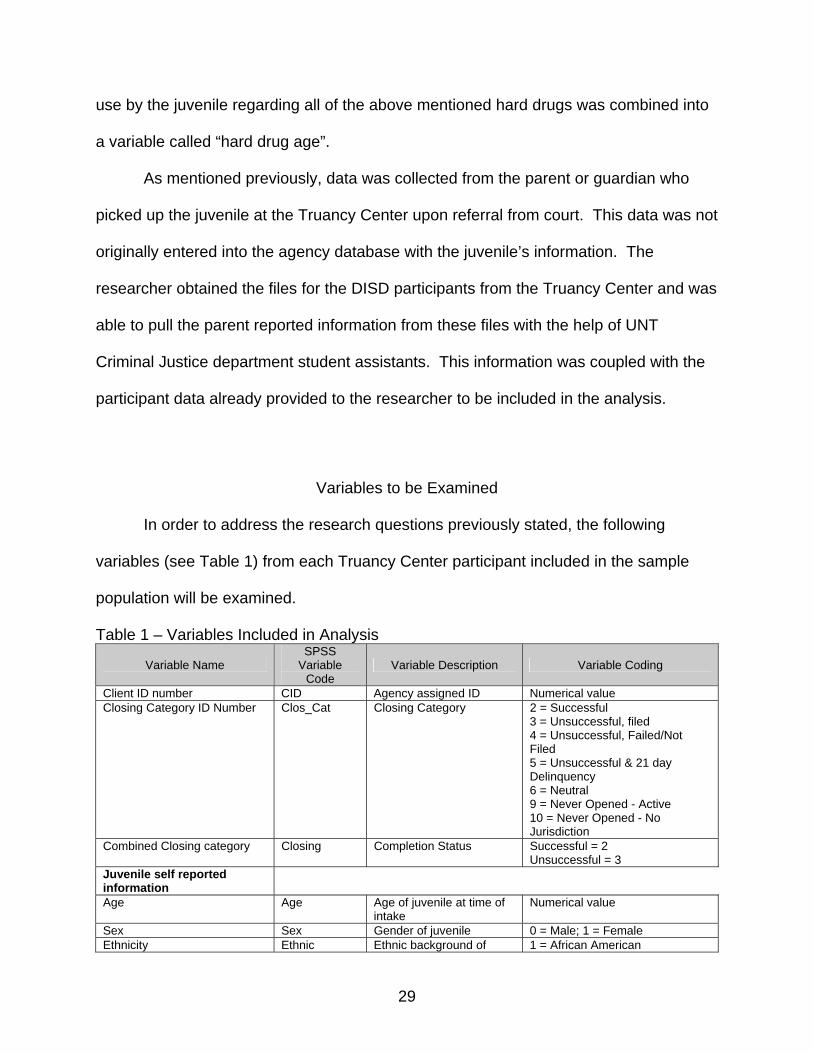
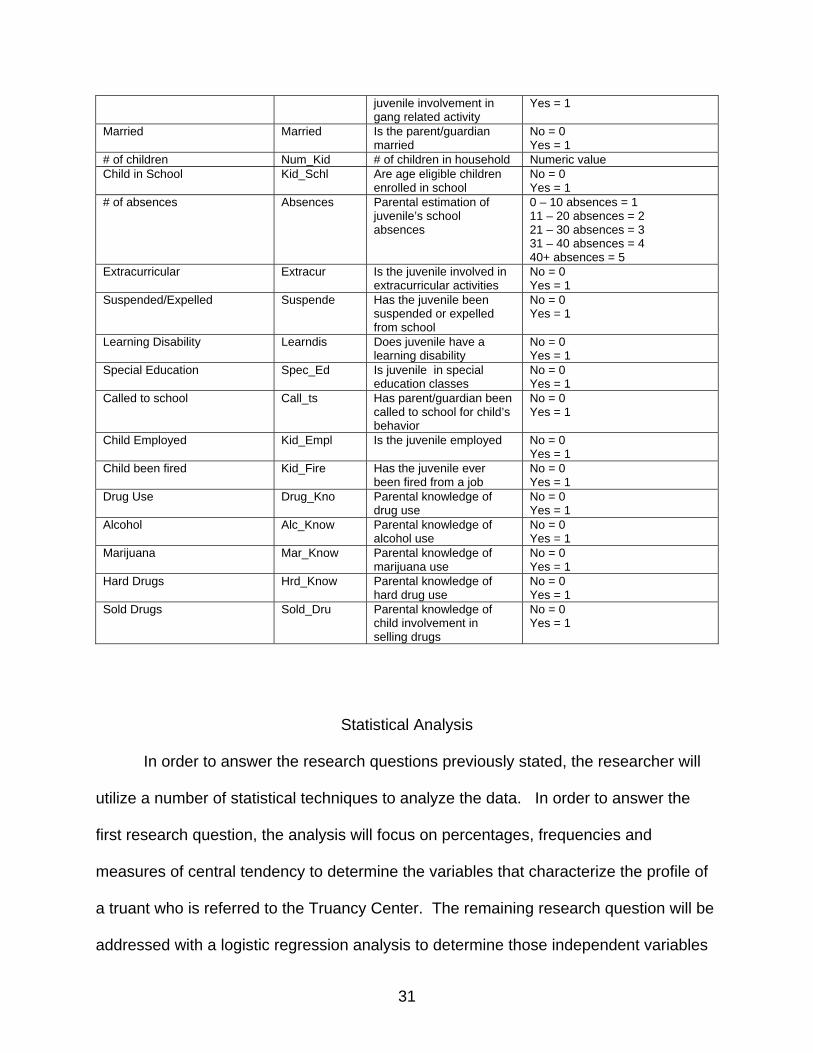
Variables to be Examined
In order to address the research questions previously stated, the following
variables (see Table 1) from each Truancy Center participant included in the sample
population will be examined.
Table 1 – Variables Included in Analysis
Variable Name SPSS
Variable Code
Variable Description Variable Coding
Client ID number CID Agency assigned ID Numerical value Closing Category ID Number Clos_Cat Closing Category 2 = Successful
3 = Unsuccessful, filed 4 = Unsuccessful, Failed/Not Filed 5 = Unsuccessful & 21 day Delinquency 6 = Neutral 9 = Never Opened - Active 10 = Never Opened - No Jurisdiction
Combined Closing category Closing Completion Status Successful = 2 Unsuccessful = 3
Juvenile self reported information
Age Age Age of juvenile at time of intake
Numerical value
Sex Sex Gender of juvenile 0 = Male; 1 = Female Ethnicity Ethnic Ethnic background of 1 = African American
29

juvenile 2 = Caucasian 3 = Hispanic 4 = Other
Previous DC Referral DC_Prev Has the juvenile been to DC before?
0 = No; 1 = Yes
Times Referred TimesRef # of previous referrals to DC
Numerical value
Current School Grade Grd_Crnt Juvenile’s current grade Numerical value Grades Failed Grd_Fail Number of grades of
school failed 0 = No Grades Failed, 1 = One Grade Failed, 2 = Multiple Grades Failed
Juvenile Lives With Liv_With Relation of parent/guardian that juvenile lives with
1 = Father, 2 = Mother, 3 = Father/Mother, 4 = Father/Stepmother, 5 = Mother/Stepfather, 6 = Stepfather/Stepmother, 7 =Stepmother
Victim of Abuse Abuse Juvenile reported being a victim of any abuse
0 = No; 1 = Yes
Emotional Abuse Emo_Abus Juvenile reported being a victim of emotional abuse
0 = No; 1 = Yes
Physical Abuse Phy_Abus Juvenile reported being a victim of physical abuse
0 = No; 1 = Yes
Sexual abuse Sex_Abus Juvenile reported being a victim of sexual abuse
0 = No; 1 = Yes
Have you used alcohol? Alc_Use Juvenile’s alcohol use 0 = No; 1 = Yes Age alcohol was first used? Alc_Age Age of first alcohol use Numerical value Have you used nicotine? Nic_Use Juvenile’s nicotine use 0 = No; 1 = Yes Age nicotine was first used? Nic_Age Age of first alcohol use Numerical value Have you used marijuana? Mar_Use Juvenile’s marijuana use 0 = No; 1 = Yes Age marijuana was first used? Mar_Age Age of first alcohol use Numerical value Have you used hard drugs? Hard_Use Juvenile’s hard drug use 0 = No; 1 = Yes Age hard drugs were first used?
Hard_Age Age of first hard drug use Numerical value
Parent/Guardian self reported information
Employed Employed Is the respondent employed
No = 0 Yes = 1
Spouse Employed Spouse_E Is the respondent’s spouse employed
No = 0 Yes = 1
Family has Medical Insurance Medical Does the parent/guardian have medical insurance
No = 0 Yes = 1
Picked up Picked_U # of times child has been picked up by police
Numeric value
Picked up (collapsed categories)
Pickup2 Juvenile has been picked up by police (collapsed categories)
Never picked up = 0 Picked up once = 1 Multiple times picked up = 2
Child Arrested Child_Ar # of times child has been arrested by police
Numeric value
Child Arrested (collapsed categories)
Arrest2 Juvenile has been arrested (collapsed categories)
Never arrested = 0 Arrested once = 1 Multiple arrests = 2
Family Criminal Involvement/Arrest
Crim_Fam Has an immediate family member been involved in criminal activity or been arrested
No = 0 Yes = 1
Counseling/Treatment Counseli Has the juvenile participated in counseling or treatment previously
No = 0 Yes = 1
Gang Related Activity Gang_Rel Parental knowledge of No = 0
30
juvenile involvement in gang related activity
Yes = 1
Married Married Is the parent/guardian married
No = 0 Yes = 1
# of children Num_Kid # of children in household Numeric value Child in School Kid_Schl Are age eligible children
enrolled in school No = 0 Yes = 1
# of absences Absences Parental estimation of juvenile’s school absences
0 – 10 absences = 1 11 – 20 absences = 2 21 – 30 absences = 3 31 – 40 absences = 4 40+ absences = 5
Extracurricular Extracur Is the juvenile involved in extracurricular activities
No = 0 Yes = 1
Suspended/Expelled Suspende Has the juvenile been suspended or expelled from school
No = 0 Yes = 1
Learning Disability Learndis Does juvenile have a learning disability
No = 0 Yes = 1
Special Education Spec_Ed Is juvenile in special education classes
No = 0 Yes = 1
Called to school Call_ts Has parent/guardian been called to school for child’s behavior
No = 0 Yes = 1
Child Employed Kid_Empl Is the juvenile employed No = 0 Yes = 1
Child been fired Kid_Fire Has the juvenile ever been fired from a job
No = 0 Yes = 1
Drug Use Drug_Kno Parental knowledge of drug use
No = 0 Yes = 1
Alcohol Alc_Know Parental knowledge of alcohol use
No = 0 Yes = 1
Marijuana Mar_Know Parental knowledge of marijuana use
No = 0 Yes = 1
Hard Drugs Hrd_Know Parental knowledge of hard drug use
No = 0 Yes = 1
Sold Drugs Sold_Dru Parental knowledge of child involvement in selling drugs
No = 0 Yes = 1
Statistical Analysis
In order to answer the research questions previously stated, the researcher will
utilize a number of statistical techniques to analyze the data. In order to answer the
first research question, the analysis will focus on percentages, frequencies and
measures of central tendency to determine the variables that characterize the profile of
a truant who is referred to the Truancy Center. The remaining research question will be
addressed with a logistic regression analysis to determine those independent variables
31

that explain the dichotomous dependent variable of successful or non-successful
completion of the Truancy Center program.
Generalizability
The generalizability of this research study is important considering the relatively
small amount of evaluation research in the area of truancy prevention. The profile that
will be generated of a truant referred to the Truancy Center will be applicable not only to
juveniles within Dallas County but also other metropolitan areas across the nation that
are comparable to the Dallas area. More so, those characteristics that are found to
have predictive value in completing the Truancy Centers program, from the results of
this research, will be valuable to similar such programs which provide social services to
juveniles who have committed similar offenses.
32

CHAPTER 4 ANALYSIS
This section will present the results of analysis of the sample group of
participants in the Dallas Challenge Truancy and Class C Enforcement Center. Most of
the information available for analysis was provided voluntarily by the juvenile
participants and their parent or guardian during the intake process. As such, there are
variables within each case that include missing responses. Analysis information in this
section will exclude the missing responses unless otherwise noted during the discussion
of the results.
Participant Overview
The sample group represents the 1,313 juvenile participants in the Truancy
Center from the program’s opening in October of 1996 through the end of December
2000. Of the 1,313 juveniles in question, 870 (66.3%) completed the program
requirements successfully with the remaining 443 (33.7%) failing to complete the
program (see Graph 1). The sample group consisted of 607 male participants (46.2%)
and 706 female participants (53.8%) ranging in age from 9 to 17 years of age with an
average age of 15 years and 6 months old (see Graph 2). Participants of Hispanic
ethnicity made up 59.6% of the participants, followed by African Americans at 32.0%,
Caucasians with 6.2%, and 1.1% of the population from other ethnic backgrounds (14
cases did not have ethnicity indicated in their case information) (see Graph 3).
Graph 1 – Completion of Truancy Center Requirements by Sex
33
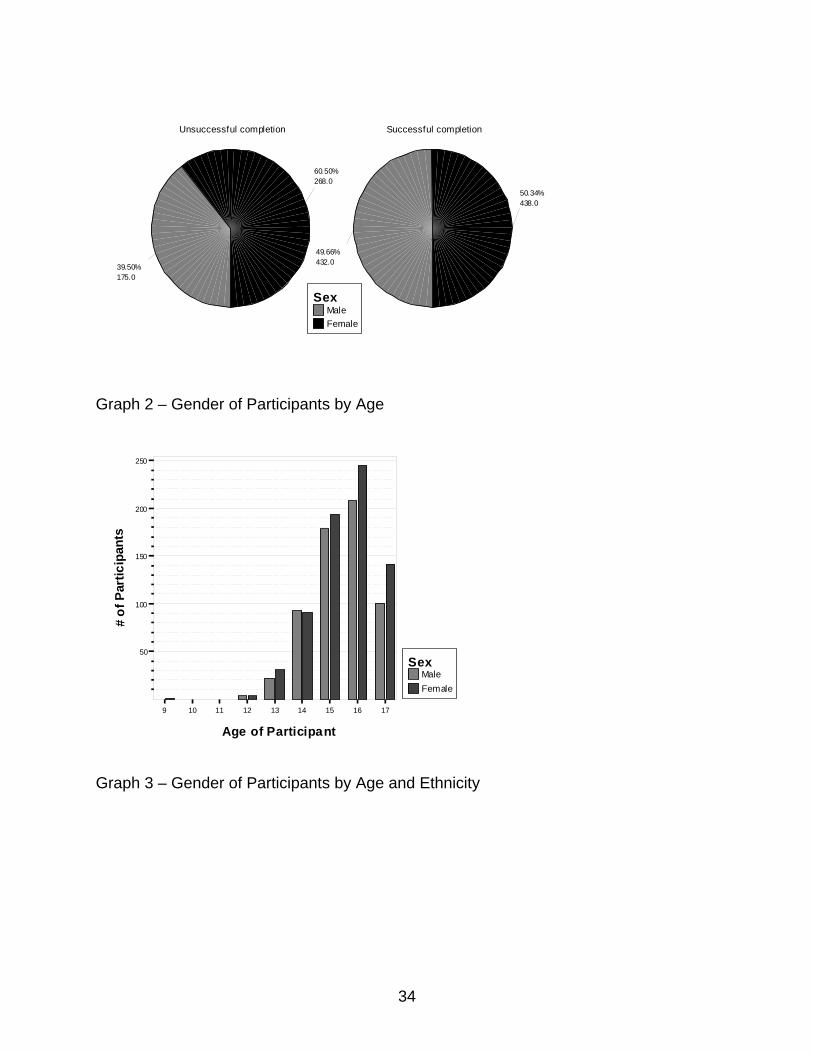
Unsuccessful completion Successful completion
MaleFemale
Sex
39.50%175.0
60.50%268.0
49.66%432.0
50.34%438.0
Graph 2 – Gender of Participants by Age
MaleFemale
Sex
9 10 11 12 13 14 15 16 17
Age of Participant
50
100
150
200
250
# of
Par
ticip
ants
Graph 3 – Gender of Participants by Age and Ethnicity
34
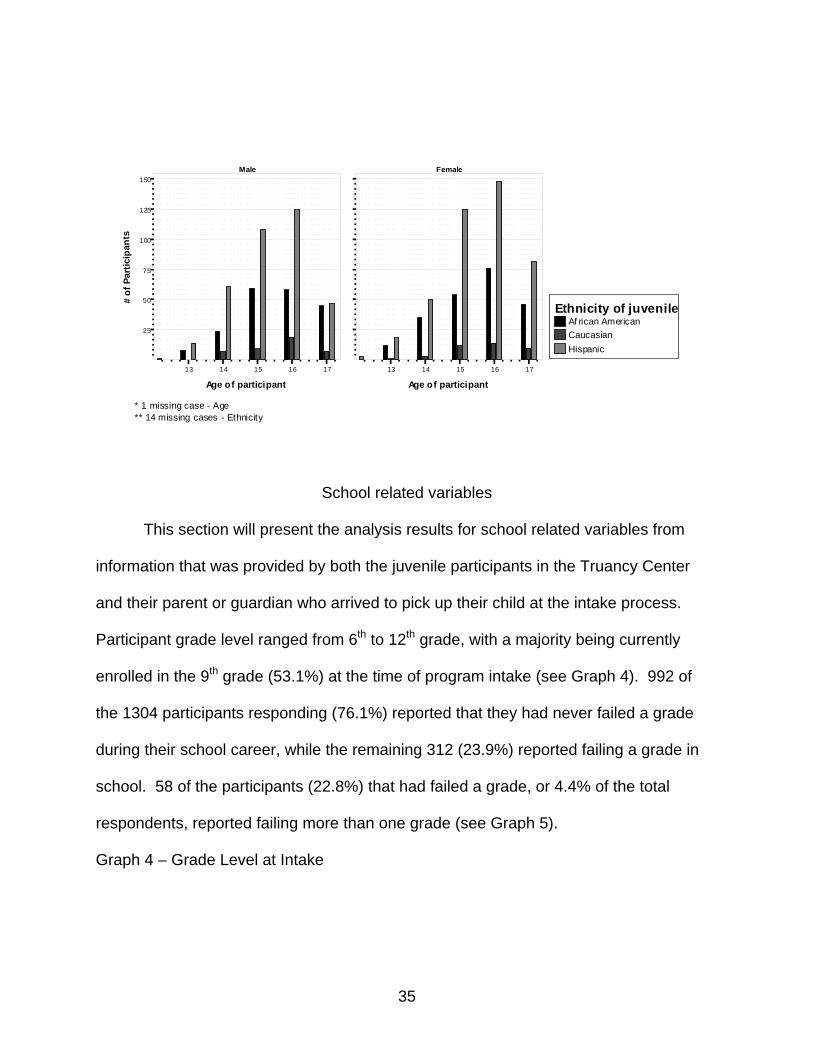
Male Female
Af rican AmericanCaucasianHispanic
Ethnicity of juvenile
* 1 missing case - Age** 14 missing cases - Ethnicity
13 14 15 16 17
Age of participant
25
50
75
100
125
150
# of
Par
ticip
ants
13 14 15 16 17
Age of participant
School related variables
This section will present the analysis results for school related variables from
information that was provided by both the juvenile participants in the Truancy Center
and their parent or guardian who arrived to pick up their child at the intake process.
Participant grade level ranged from 6th to 12th grade, with a majority being currently
enrolled in the 9th grade (53.1%) at the time of program intake (see Graph 4). 992 of
the 1304 participants responding (76.1%) reported that they had never failed a grade
during their school career, while the remaining 312 (23.9%) reported failing a grade in
school. 58 of the participants (22.8%) that had failed a grade, or 4.4% of the total
respondents, reported failing more than one grade (see Graph 5).
Graph 4 – Grade Level at Intake
35

MaleFemale
Sex
* missing 17 cases
6th Grade7th Grade
8th Grade9th Grade
10th Grade11th grade
12th grade
Current Grade
50
100
150
200
250
300
350
400
# of
Par
ticip
ants
Graph 5 – Number of Grades Failed
No Grades FailedOne Grade FailedMultiple Grades Failed
Grades failed
* 9 missing cases
76.07%n=992
19.48%n=254
4.45%n=58
Parent reported information indicated that 63.7% of the parents of male
participants and 70.0% of the parents of female participants had previously been called
to their child’s school for behavior issues (see Table 2). Of the 288 parents who gave
36
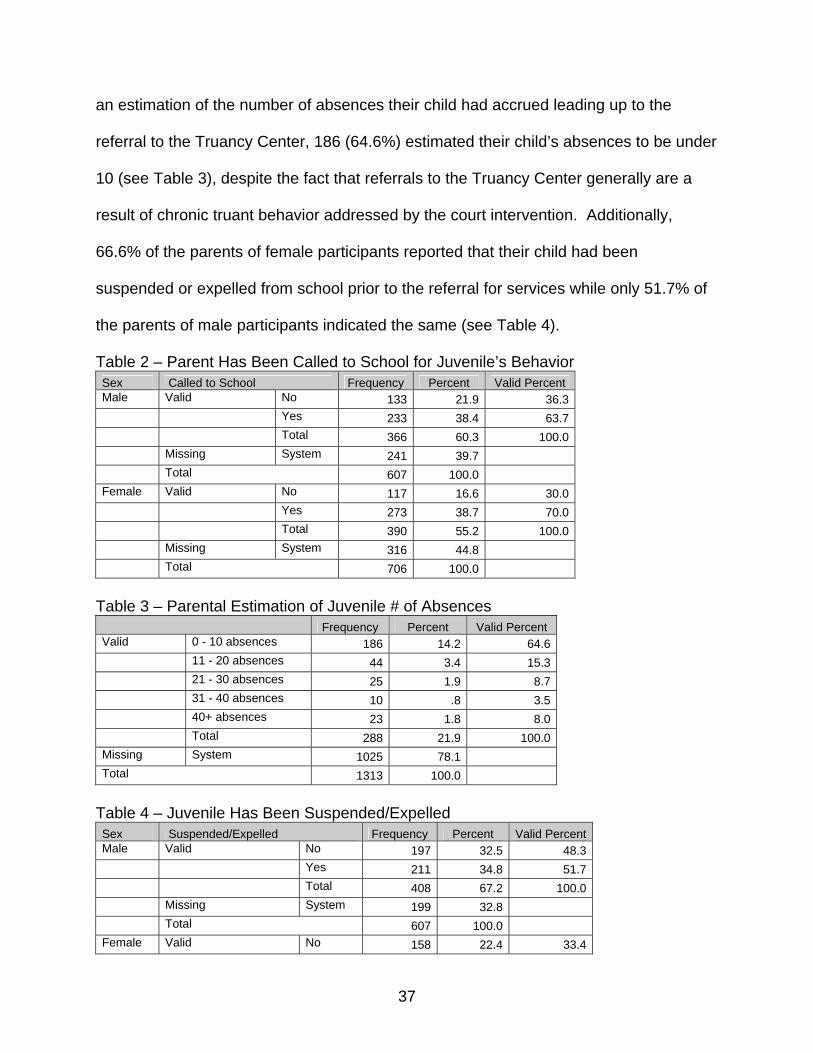
an estimation of the number of absences their child had accrued leading up to the
referral to the Truancy Center, 186 (64.6%) estimated their child’s absences to be under
10 (see Table 3), despite the fact that referrals to the Truancy Center generally are a
result of chronic truant behavior addressed by the court intervention. Additionally,
66.6% of the parents of female participants reported that their child had been
suspended or expelled from school prior to the referral for services while only 51.7% of
the parents of male participants indicated the same (see Table 4).
Table 2 – Parent Has Been Called to School for Juvenile’s Behavior Sex Called to School Frequency Percent Valid Percent Male Valid No 133 21.9 36.3 Yes 233 38.4 63.7 Total 366 60.3 100.0 Missing System 241 39.7 Total 607 100.0 Female Valid No 117 16.6 30.0 Yes 273 38.7 70.0 Total 390 55.2 100.0 Missing System 316 44.8 Total 706 100.0
Table 3 – Parental Estimation of Juvenile # of Absences Frequency Percent Valid Percent Valid 0 - 10 absences 186 14.2 64.6 11 - 20 absences 44 3.4 15.3 21 - 30 absences 25 1.9 8.7 31 - 40 absences 10 .8 3.5 40+ absences 23 1.8 8.0 Total 288 21.9 100.0Missing System 1025 78.1 Total 1313 100.0
Table 4 – Juvenile Has Been Suspended/Expelled Sex Suspended/Expelled Frequency Percent Valid Percent Male Valid No 197 32.5 48.3 Yes 211 34.8 51.7 Total 408 67.2 100.0 Missing System 199 32.8 Total 607 100.0 Female Valid No 158 22.4 33.4
37

Yes 315 44.6 66.6 Total 473 67.0 100.0 Missing System 233 33.0 Total 706 100.0
The Truancy Center also collected information from the parents of participants
regarding their child’s special needs as a student and their involvement in school
activities. 30.8% of female participants had a learning disability and 20.5% were in
special education classes in school, according to their parents. For males, only 20.2%
were reported to have a learning disability with 12.2% being in special education (see
Tables 5, 6). Of the 185 combined male and female participants who reported having a
learning disability, only 52.4% were in special education classes (8 cases missing
special education response) (see Table 7).
Table 5 – Juvenile has a Learning Disability Sex Learning Disability Frequency Percent Valid Percent Male Valid No 293 48.3 79.8 Yes 74 12.2 20.2 Total 367 60.5 100.0 Missing System 240 39.5 Total 607 100.0 Female Valid No 267 37.8 69.2 Yes 119 16.9 30.8 Total 386 54.7 100.0 Missing System 320 45.3 Total 706 100.0
Table 6 – Juvenile is in Special Education Classes Sex Special Education Classes Frequency Percent Valid Percent Male Valid No 366 60.3 87.8 Yes 51 8.4 12.2 Total 417 68.7 100.0 Missing System 190 31.3 Total 607 100.0 Female Valid No 373 52.8 79.5 Yes 96 13.6 20.5 Total 469 66.4 100.0 Missing System 237 33.6 Total 706 100.0
38
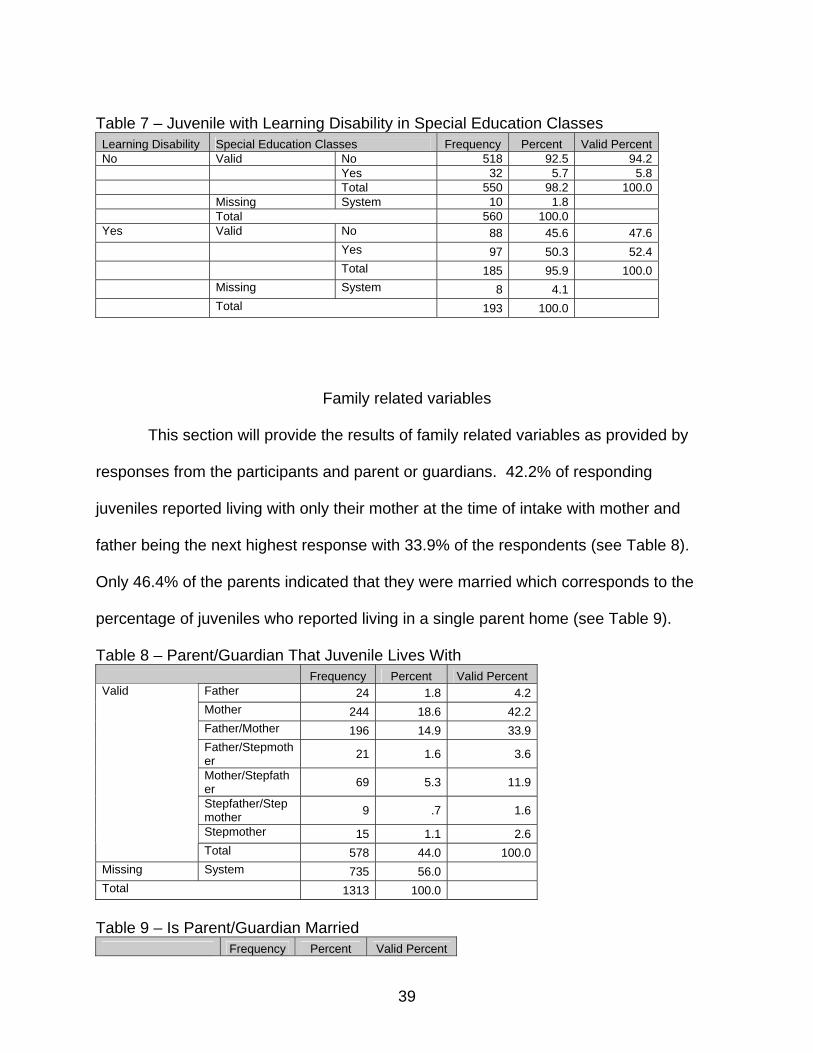
Table 7 – Juvenile with Learning Disability in Special Education Classes Learning Disability Special Education Classes Frequency Percent Valid Percent No Valid No 518 92.5 94.2 Yes 32 5.7 5.8 Total 550 98.2 100.0 Missing System 10 1.8 Total 560 100.0 Yes Valid No 88 45.6 47.6 Yes 97 50.3 52.4 Total 185 95.9 100.0 Missing System 8 4.1 Total 193 100.0
Family related variables
This section will provide the results of family related variables as provided by
responses from the participants and parent or guardians. 42.2% of responding
juveniles reported living with only their mother at the time of intake with mother and
father being the next highest response with 33.9% of the respondents (see Table 8).
Only 46.4% of the parents indicated that they were married which corresponds to the
percentage of juveniles who reported living in a single parent home (see Table 9).
Table 8 – Parent/Guardian That Juvenile Lives With Frequency Percent Valid Percent
Father 24 1.8 4.2Mother 244 18.6 42.2Father/Mother 196 14.9 33.9Father/Stepmother 21 1.6 3.6
Mother/Stepfather 69 5.3 11.9
Stepfather/Stepmother 9 .7 1.6
Stepmother 15 1.1 2.6
Valid
Total 578 44.0 100.0Missing System 735 56.0 Total 1313 100.0
Table 9 – Is Parent/Guardian Married Frequency Percent Valid Percent
39

No 474 36.1 53.6Yes 411 31.3 46.4
Valid
Total 885 67.4 100.0Missing System 428 32.6 Total 1313 100.0
Of the parents that chose to respond, 83.4% were currently employed while only
53.6% of their spouses held jobs (see Tables 10, 11). 60.9% of the 716 parent
respondents did not have medical insurance (see Table 12) and only 28.4% of 737
respondents reported having a family member that had been arrested or was involved in
criminal activity (see Table 13).
Table 10 – Parent Employed Frequency Percent Valid Percent Valid No 139 10.6 16.6 Yes 697 53.1 83.4 Total 836 63.7 100.0Missing System 477 36.3 Total 1313 100.0
Table 11 – Spouse Employed Frequency Percent Valid Percent
No 228 17.4 46.4Yes 263 20.0 53.6
Valid
Total 491 37.4 100.0Missing System 822 62.6 Total 1313 100.0
Table 12 – Family has Medical Insurance Frequency Percent Valid Percent
No 436 33.2 60.9Yes 280 21.3 39.1
Valid
Total 716 54.5 100.0Missing System 597 45.5 Total 1313 100.0
Table 13 – Family Member with Criminal Involvement/Arrest Frequency Percent Valid Percent
No 528 40.2 71.6Yes 209 15.9 28.4
Valid
Total 737 56.1 100.0Missing System 576 43.9
40

Total 1313 100.0
The number of children in the house as reported by parents ranged from 1 to 10,
with an average house having just over 3 children. 65.3% of the reporting parents had
3 or fewer children living under their roof (see Table 14). Only 4.2% of 911 parents
responding indicated that there were age eligible children living in their house that were
not enrolled in school (see Table 15).
Table 14 - # of Children in the Household
Frequency Percent Valid Percent Cumulative
Percent 1 child 89 6.8 10.2 10.2 2 children 195 14.9 22.3 32.4 3 children 288 21.9 32.9 65.3 4 children 169 12.9 19.3 84.6 5 or more children 135 10.3 15.4 100.0
Valid
Total 876 66.7 100.0 Missing System 437 33.3 Total 1313 100.0 (a)
a. Mean # of children in the household - 3.08 Table 15 – Age Eligible Children Enrolled in School Frequency Percent Valid Percent
No 38 2.9 4.2Yes 873 66.5 95.8
Valid
Total 911 69.4 100.0Missing System 402 30.6 Total 1313 100.0
Personal related variables
This section will examine those variables which are related to the individual
characteristics of the participants in the Truancy Center program. Information collected
from the parents of the participants revealed that 30.1% of the responding parent’s
children had been previously involved in counseling or a treatment program (see Table
41
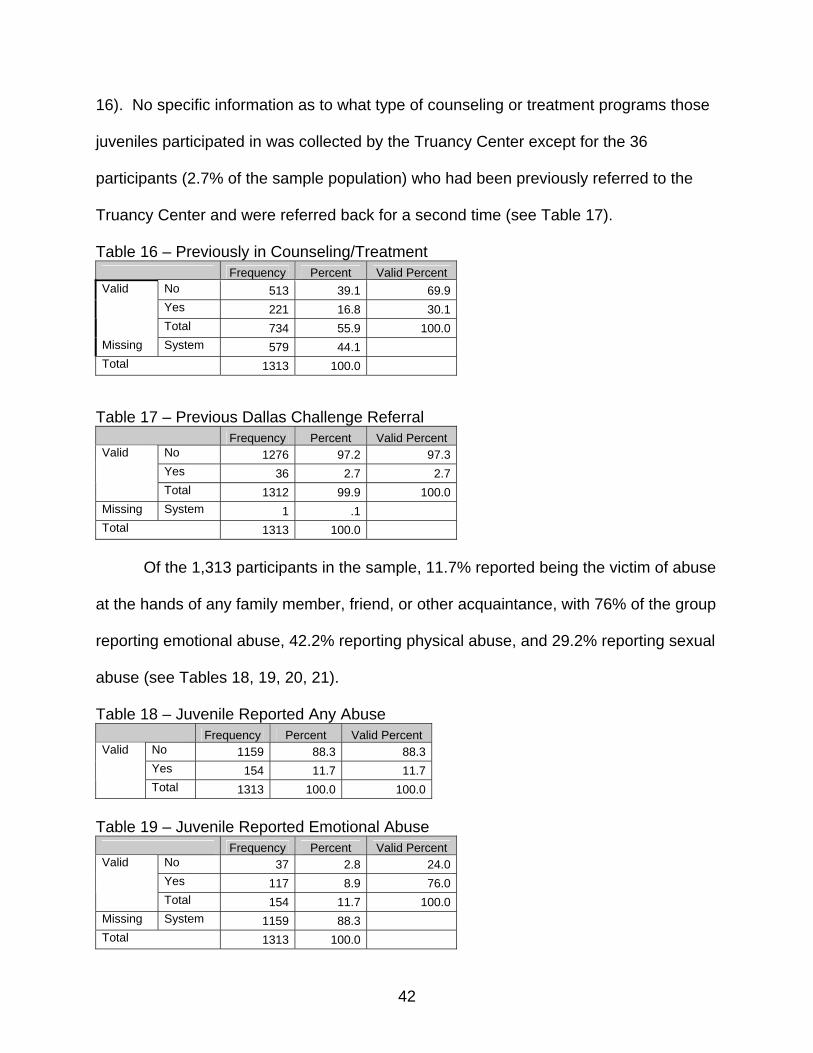
16). No specific information as to what type of counseling or treatment programs those
juveniles participated in was collected by the Truancy Center except for the 36
participants (2.7% of the sample population) who had been previously referred to the
Truancy Center and were referred back for a second time (see Table 17).
Table 16 – Previously in Counseling/Treatment Frequency Percent Valid Percent
No 513 39.1 69.9Yes 221 16.8 30.1
Valid
Total 734 55.9 100.0Missing System 579 44.1 Total 1313 100.0
Table 17 – Previous Dallas Challenge Referral Frequency Percent Valid Percent
No 1276 97.2 97.3Yes 36 2.7 2.7
Valid
Total 1312 99.9 100.0Missing System 1 .1 Total 1313 100.0
Of the 1,313 participants in the sample, 11.7% reported being the victim of abuse
at the hands of any family member, friend, or other acquaintance, with 76% of the group
reporting emotional abuse, 42.2% reporting physical abuse, and 29.2% reporting sexual
abuse (see Tables 18, 19, 20, 21).
Table 18 – Juvenile Reported Any Abuse Frequency Percent Valid Percent
No 1159 88.3 88.3Yes 154 11.7 11.7
Valid
Total 1313 100.0 100.0
Table 19 – Juvenile Reported Emotional Abuse Frequency Percent Valid Percent
No 37 2.8 24.0Yes 117 8.9 76.0
Valid
Total 154 11.7 100.0Missing System 1159 88.3 Total 1313 100.0
42

Table 20 – Juvenile Reported Physical Abuse Frequency Percent Valid Percent
No 89 6.8 57.8Yes 65 5.0 42.2
Valid
Total 154 11.7 100.0Missing System 1159 88.3 Total 1313 100.0
Table 21 – Juvenile Reported Sexual Abuse Frequency Percent Valid Percent
No 109 8.3 70.8Yes 45 3.4 29.2
Valid
Total 154 11.7 100.0Missing System 1159 88.3 Total 1313 100.0
Of 899 responses from the parents, only 9.7% indicated that their child was
currently employed (see Table 22). Additionally, only 5.1% of 571 parent responses
indicated that their child had been fired from a job (see Table 23). Considering the
relatively young average age of the participants it would be expected that the amount of
work experience for this sample would be limited.
Table 22 – Juvenile is Currently Employed Frequency Percent Valid Percent
No 812 61.8 90.3Yes 87 6.6 9.7
Valid
Total 899 68.5 100.0Missing System 414 31.5 Total 1313 100.0
Table 23 – Juvenile Has Been Fired From a Job Frequency Percent Valid Percent
No 542 41.3 94.9Yes 29 2.2 5.1
Valid
Total 571 43.5 100.0Missing System 742 56.5 Total 1313 100.0
43
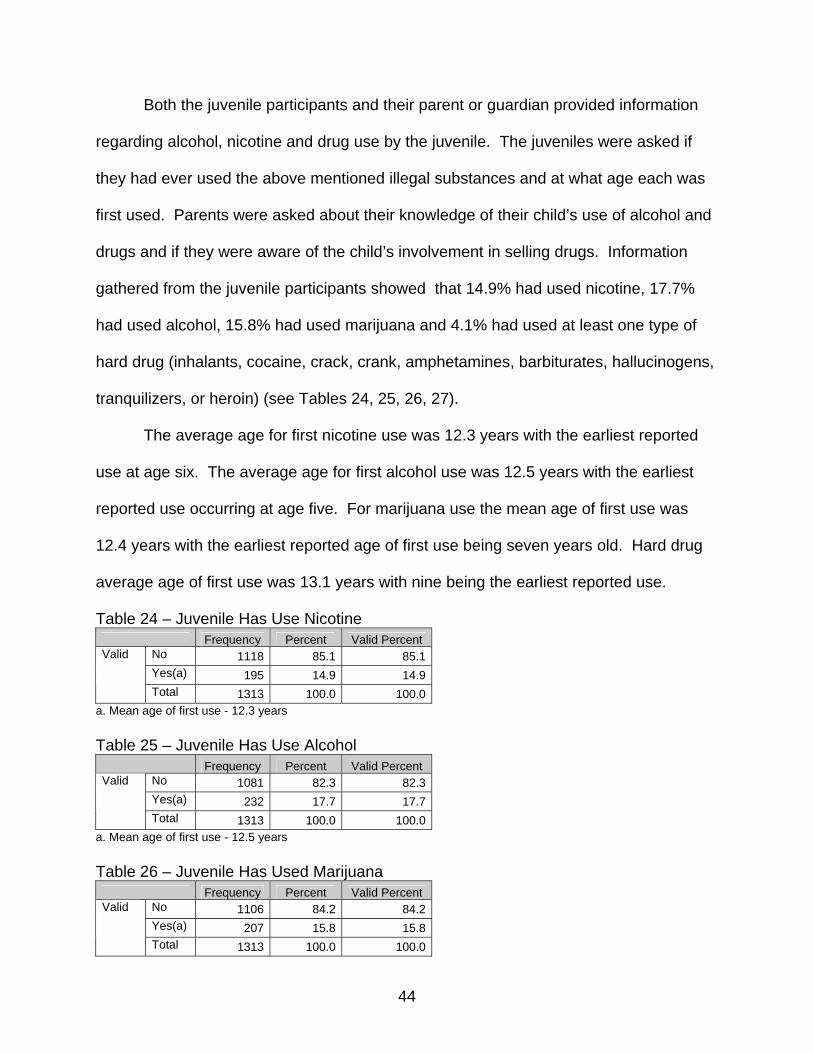
Both the juvenile participants and their parent or guardian provided information
regarding alcohol, nicotine and drug use by the juvenile. The juveniles were asked if
they had ever used the above mentioned illegal substances and at what age each was
first used. Parents were asked about their knowledge of their child’s use of alcohol and
drugs and if they were aware of the child’s involvement in selling drugs. Information
gathered from the juvenile participants showed that 14.9% had used nicotine, 17.7%
had used alcohol, 15.8% had used marijuana and 4.1% had used at least one type of
hard drug (inhalants, cocaine, crack, crank, amphetamines, barbiturates, hallucinogens,
tranquilizers, or heroin) (see Tables 24, 25, 26, 27).
The average age for first nicotine use was 12.3 years with the earliest reported
use at age six. The average age for first alcohol use was 12.5 years with the earliest
reported use occurring at age five. For marijuana use the mean age of first use was
12.4 years with the earliest reported age of first use being seven years old. Hard drug
average age of first use was 13.1 years with nine being the earliest reported use.
Table 24 – Juvenile Has Use Nicotine Frequency Percent Valid Percent
No 1118 85.1 85.1Yes(a) 195 14.9 14.9
Valid
Total 1313 100.0 100.0a. Mean age of first use - 12.3 years Table 25 – Juvenile Has Use Alcohol Frequency Percent Valid Percent
No 1081 82.3 82.3Yes(a) 232 17.7 17.7
Valid
Total 1313 100.0 100.0a. Mean age of first use - 12.5 years Table 26 – Juvenile Has Used Marijuana Frequency Percent Valid Percent
No 1106 84.2 84.2Yes(a) 207 15.8 15.8
Valid
Total 1313 100.0 100.0
44
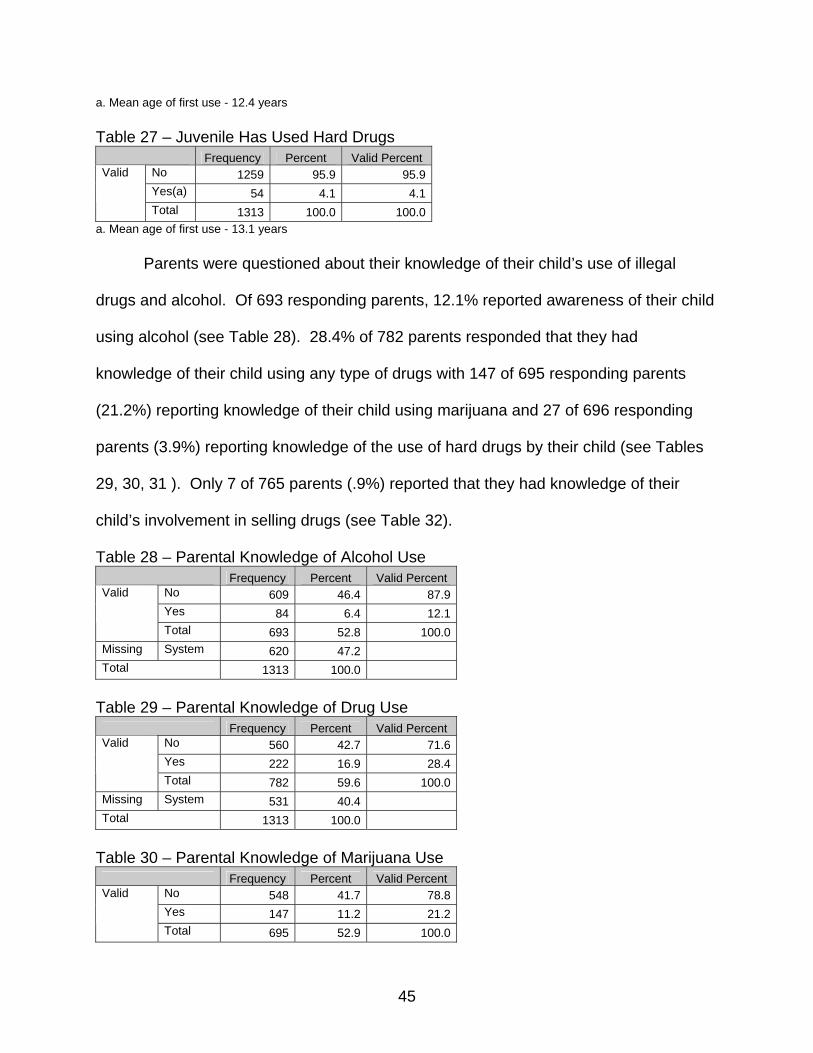
a. Mean age of first use - 12.4 years Table 27 – Juvenile Has Used Hard Drugs Frequency Percent Valid Percent
No 1259 95.9 95.9Yes(a) 54 4.1 4.1
Valid
Total 1313 100.0 100.0a. Mean age of first use - 13.1 years Parents were questioned about their knowledge of their child’s use of illegal
drugs and alcohol. Of 693 responding parents, 12.1% reported awareness of their child
using alcohol (see Table 28). 28.4% of 782 parents responded that they had
knowledge of their child using any type of drugs with 147 of 695 responding parents
(21.2%) reporting knowledge of their child using marijuana and 27 of 696 responding
parents (3.9%) reporting knowledge of the use of hard drugs by their child (see Tables
29, 30, 31 ). Only 7 of 765 parents (.9%) reported that they had knowledge of their
child’s involvement in selling drugs (see Table 32).
Table 28 – Parental Knowledge of Alcohol Use Frequency Percent Valid Percent
No 609 46.4 87.9Yes 84 6.4 12.1
Valid
Total 693 52.8 100.0Missing System 620 47.2 Total 1313 100.0
Table 29 – Parental Knowledge of Drug Use Frequency Percent Valid Percent
No 560 42.7 71.6Yes 222 16.9 28.4
Valid
Total 782 59.6 100.0Missing System 531 40.4 Total 1313 100.0
Table 30 – Parental Knowledge of Marijuana Use Frequency Percent Valid Percent
No 548 41.7 78.8Yes 147 11.2 21.2
Valid
Total 695 52.9 100.0
45

Missing System 618 47.1 Total 1313 100.0
Table 31 – Parental Knowledge of Hard Drug Use Frequency Percent Valid Percent
No 669 51.0 96.1Yes 27 2.1 3.9
Valid
Total 696 53.0 100.0Missing System 617 47.0 Total 1313 100.0
Table 32 – Parental Knowledge of Juvenile Involvement in Drug Sales Frequency Percent Valid Percent
No 758 57.7 99.1Yes 7 .5 .9
Valid
Total 765 58.3 100.0Missing System 548 41.7 Total 1313 100.0
Profile of a Truant Juvenile
Based on analysis of the sample population from the Truancy Center,
generalizations can be made from the demographic information and other family and
individual factors to create a profile of a juvenile that is at risk for truant behavior. This
information could be used to address at-risk juveniles earlier in their development,
perhaps even prior to actual truant behavior begins, to limit or prevent risk factors from
starting the juveniles down the path toward delinquency.
Considering the previous analysis and combining the data output, it is reasonable
to say that juveniles of Hispanic or African American ethnicity around 15 years of age
and currently enrolled in the 9th grade would fit into the profile. Based on the evenly
divided gender breakdown of the sample, it seems inappropriate to include the gender
46

of the juvenile in the profile except to say that either sex is equally at risk for truant
behavior.
Additionally, the juvenile has most likely experienced behavioral issues that have
resulted in his/her parents being called to school and may have also been suspended or
expelled because of behavior problems. Despite behavioral problems, the juvenile has
most likely never failed a grade in school nor does he/she have a learning disability or
require enrollment in special education classes.
It is likely that the child comes from a single parent or broken home consisting of
a combination of birth parents and stepparents. One or both parents are most likely to
be employed but there is a possibility that the family does not have medical insurance.
The juvenile will also be likely to come from a multiple child household.
Regarding other personal factors of the juvenile, there is a low probability that the
juvenile has been the victim of abuse, has ever been involved in counseling, is currently
employed, or has used nicotine, alcohol or drugs.
This summary provides a loose idea of the profile of a truant juvenile. It should
be understood that because truancy is a status offense and therefore relatively minor in
the spectrum of illegal behavior for juveniles this profile is somewhat benign in nature.
What is important to consider is the presence of school problems that could lead to
disconnection from school by a student and that these problems most likely develop into
truant behavior during the years leading into the 9th grade that was presented as the
target year in the profile. That being said, it would be most useful to anticipate the
development of truant behavior through the identification of the above mentioned profile
characteristics in a juvenile prior to the manifestation of problem behavior. To do so
47

would require forecasting and assessment of individual and family factors for school
populations that fit the profile early in their school career as a proactive measure to
prevent truancy later in the academic career.
Comparison of successful and unsuccessful completion groups
Ideally, every individual referred to the Truancy Center would complete the
program requirements and utilize the services to change the problem behavior
previously exhibited. Unfortunately, that is not the reality of any program of this nature
and it is therefore necessary to compare the group that completed successfully to those
that did not and determine those characteristics that increased the probability of
successful completion based on the outcome of that comparison. To do so, a logistic
regression analysis was used to determine those variables that increase the probability
of completion and the amount of predictive power that each independent variable
contributes to the outcome of the dependant variable, in this case successful or
unsuccessful completion of the Truancy Center’s program requirements.
The incompleteness of data provided by the Truancy Center, due to the self
reported nature of the information gathered, has been previously discussed but plays a
major factor in the regression analysis. The statistical program being used for analysis
eliminates a case from consideration if any variable has a missing response when
processing the logistic regression. Therefore, the independent variables that were used
in the regression analysis were limited to those variables that had few missing cases.
The variables included in the analysis included were: age, sex, ethnicity, previous
48

Dallas Challenge referral, number of previous Dallas Challenge referrals, current grade,
number of grades failed, and report of abuse.
Also included were the two variables that would indicate a pattern of school
problems for the juvenile: (1) has the juvenile been suspended or expelled from school
and (2) has the parent been called to school for their child’s behavior. These two
variables did include a number of missing responses but are salient to the indication of
school problems that could have lead to the truant behavior and therefore their inclusion
in the analysis was important.
After the elimination of cases for missing information, 697 of the 1,313 in the
sample (53.1%) were available for regression analysis. Of the 616 cases eliminated for
missing responses, 592 were eliminated for missing responses to the
suspended/expelled and parent called to school variables (see Table 33).
Table 33 – Exclusion from Logistic Regression for Missing Responses Juvenile has been suspended/expelled
Parent has been called to school for juvenile's behavior Frequency
Missing Response Missing Response 397 No 11 Yes 24 No Missing Response 70 Yes Missing Response 90
The logistic regression determined that five of the variables used in the model
were statistically significant in predicting completion of the program requirements, those
being: age (.012), sex (.001), current grade (.013), suspended/expelled (.000), and
parent called to school (.000) (see Table 34).
Table 34 – Variables Included in Regression and Significance Score df Significance Variables Age 6.348 1 .012 Sex 11.825 1 .001 Ethnicity 2.522 1 .112 Previous Referral .004 1 .951
49
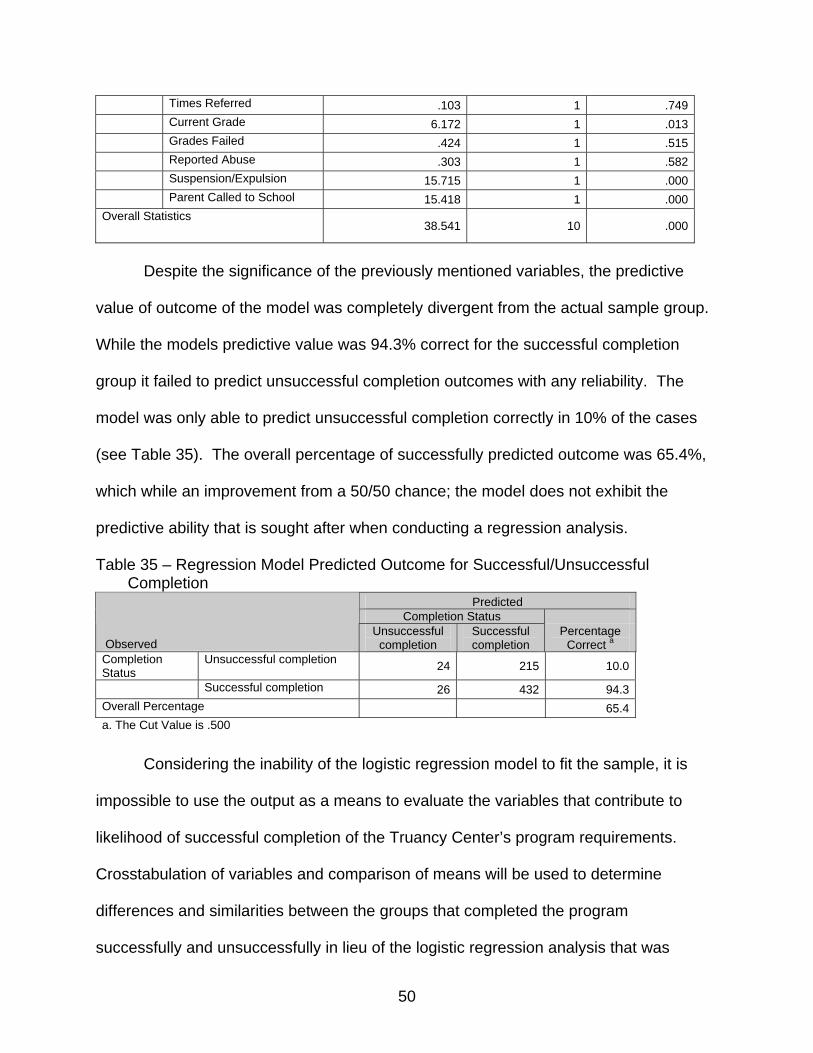
Times Referred .103 1 .749 Current Grade 6.172 1 .013 Grades Failed .424 1 .515 Reported Abuse .303 1 .582 Suspension/Expulsion 15.715 1 .000 Parent Called to School 15.418 1 .000Overall Statistics
38.541 10 .000
Despite the significance of the previously mentioned variables, the predictive
value of outcome of the model was completely divergent from the actual sample group.
While the models predictive value was 94.3% correct for the successful completion
group it failed to predict unsuccessful completion outcomes with any reliability. The
model was only able to predict unsuccessful completion correctly in 10% of the cases
(see Table 35). The overall percentage of successfully predicted outcome was 65.4%,
which while an improvement from a 50/50 chance; the model does not exhibit the
predictive ability that is sought after when conducting a regression analysis.
Table 35 – Regression Model Predicted Outcome for Successful/Unsuccessful Completion
Predicted Completion Status
Observed Unsuccessful completion
Successful completion
Percentage Correct a
Completion Status
Unsuccessful completion 24 215 10.0
Successful completion 26 432 94.3 Overall Percentage 65.4 a. The Cut Value is .500
Considering the inability of the logistic regression model to fit the sample, it is
impossible to use the output as a means to evaluate the variables that contribute to
likelihood of successful completion of the Truancy Center’s program requirements.
Crosstabulation of variables and comparison of means will be used to determine
differences and similarities between the groups that completed the program
successfully and unsuccessfully in lieu of the logistic regression analysis that was
50
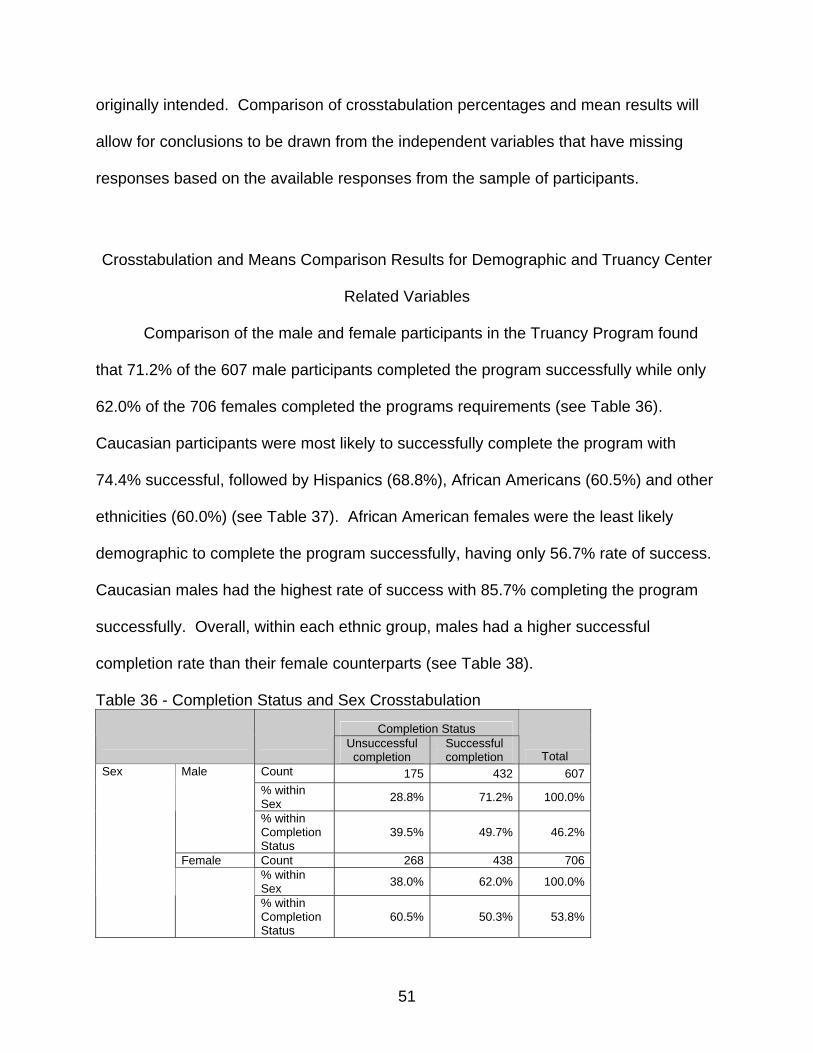
originally intended. Comparison of crosstabulation percentages and mean results will
allow for conclusions to be drawn from the independent variables that have missing
responses based on the available responses from the sample of participants.
Crosstabulation and Means Comparison Results for Demographic and Truancy Center
Related Variables
Comparison of the male and female participants in the Truancy Program found
that 71.2% of the 607 male participants completed the program successfully while only
62.0% of the 706 females completed the programs requirements (see Table 36).
Caucasian participants were most likely to successfully complete the program with
74.4% successful, followed by Hispanics (68.8%), African Americans (60.5%) and other
ethnicities (60.0%) (see Table 37). African American females were the least likely
demographic to complete the program successfully, having only 56.7% rate of success.
Caucasian males had the highest rate of success with 85.7% completing the program
successfully. Overall, within each ethnic group, males had a higher successful
completion rate than their female counterparts (see Table 38).
Table 36 - Completion Status and Sex Crosstabulation
Completion Status
Unsuccessful completion
Successful completion Total
Count 175 432 607 % within Sex 28.8% 71.2% 100.0%
Male
% within Completion Status
39.5% 49.7% 46.2%
Female Count 268 438 706 % within Sex 38.0% 62.0% 100.0%
Sex
% within Completion Status
60.5% 50.3% 53.8%
51
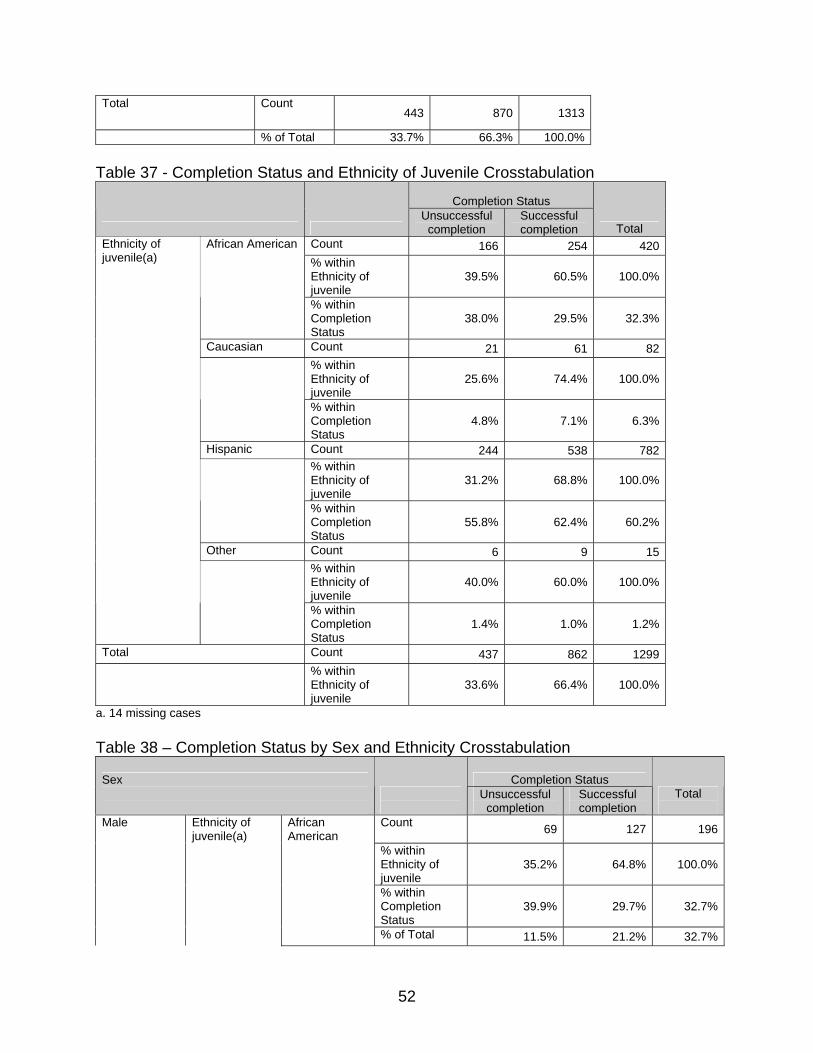
Total Count 443 870 1313
% of Total 33.7% 66.3% 100.0% Table 37 - Completion Status and Ethnicity of Juvenile Crosstabulation
Completion Status
Unsuccessful completion
Successful completion Total
Count 166 254 420% within Ethnicity of juvenile
39.5% 60.5% 100.0%
African American
% within Completion Status
38.0% 29.5% 32.3%
Caucasian Count 21 61 82% within Ethnicity of juvenile
25.6% 74.4% 100.0%
% within Completion Status
4.8% 7.1% 6.3%
Hispanic Count 244 538 782% within Ethnicity of juvenile
31.2% 68.8% 100.0%
% within Completion Status
55.8% 62.4% 60.2%
Other Count 6 9 15% within Ethnicity of juvenile
40.0% 60.0% 100.0%
Ethnicity of juvenile(a)
% within Completion Status
1.4% 1.0% 1.2%
Total Count 437 862 1299% within Ethnicity of juvenile
33.6% 66.4% 100.0%
a. 14 missing cases Table 38 – Completion Status by Sex and Ethnicity Crosstabulation
Completion Status Sex
Unsuccessful completion
Successful completion
Total
Male Ethnicity of juvenile(a)
African American
Count 69 127 196
% within Ethnicity of juvenile
35.2% 64.8% 100.0%
% within Completion Status
39.9% 29.7% 32.7%
% of Total 11.5% 21.2% 32.7%
52
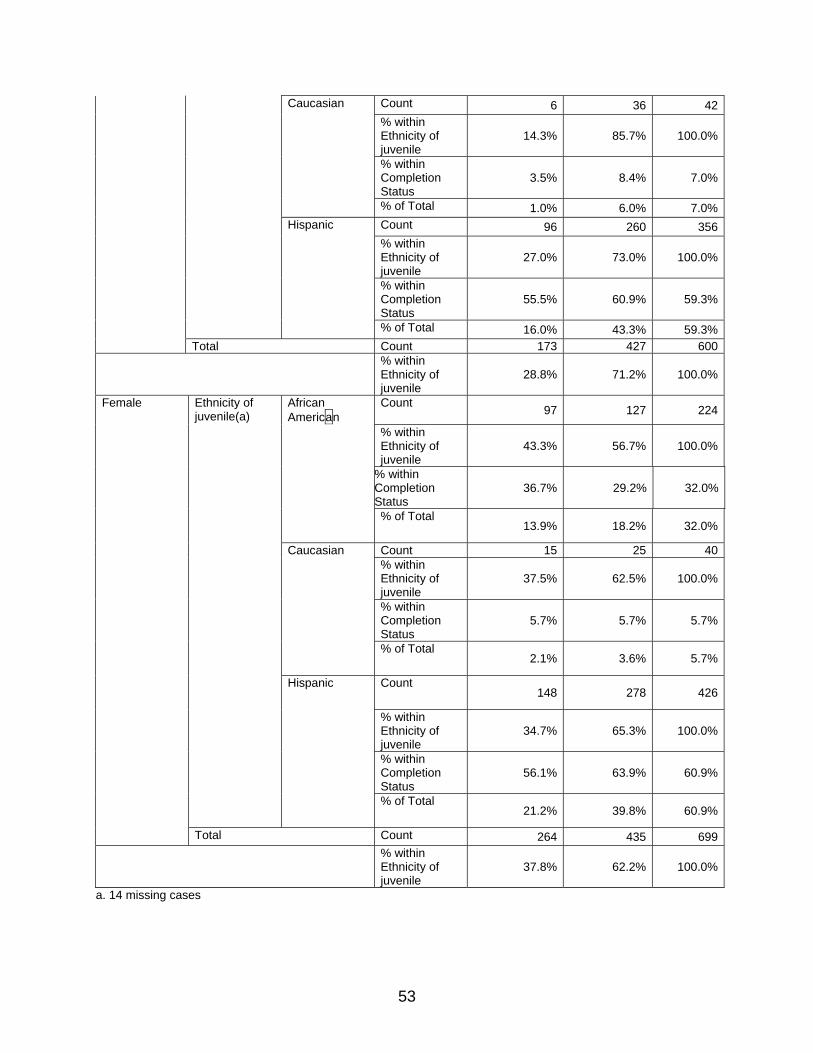
a. 14 missing cases
Caucasian Count 6 36 42 % within
Ethnicity of juvenile
14.3% 85.7% 100.0%
% within Completion Status
3.5% 8.4% 7.0%
% of Total 1.0% 6.0% 7.0% Hispanic Count 96 260 356 % within
Ethnicity of juvenile
27.0% 73.0% 100.0%
% within Completion Status
55.5% 60.9% 59.3%
% of Total 16.0% 43.3% 59.3% Total Count 173 427 600 % within
Ethnicity of juvenile
28.8% 71.2% 100.0%
Female Ethnicity of juvenile(a)
African American
Count 97 127 224
% within Ethnicity of juvenile
43.3% 56.7% 100.0%
% within Completion Status
36.7% 29.2% 32.0%
% of Total 13.9% 18.2% 32.0%
Caucasian Count 15 25 40 % within
Ethnicity of juvenile
37.5% 62.5% 100.0%
% within Completion Status
5.7% 5.7% 5.7%
% of Total 2.1% 3.6% 5.7%
Hispanic Count 148 278 426
% within Ethnicity of juvenile
34.7% 65.3% 100.0%
% within Completion Status
56.1% 63.9% 60.9%
% of Total 21.2% 39.8% 60.9%
Total Count 264 435 699
% within Ethnicity of juvenile
37.8% 62.2% 100.0%
53

When comparing the mean ages of the two groups it was noted that while the
average age of those who completed the program successfully were older than those
who did not, the age difference in the two groups was negligible (10 weeks) (see Table
39).
Table 39 – Comparison of Mean Age by Completion Status Completion Status Mean Age N(a) Std. Deviation Unsuccessful completion 15.34 443 1.086Successful completion 15.54 869 1.114Total 15.47 1312 1.109
a. 1 missing case
The data also indicated that those participants who had a previous referral to the
Truancy Center completed the program successfully in only 41.7% of the cases while
those who were participating in their first referral completed the program in 66.9% of the
cases (see Table 40). It should be noted that while the number of second referrals to
the Truancy Center is small (n = 36) the 25.2% difference from those who have not
previously been referred to the program is substantial and could indicate that
alternatives to a second referral would be warranted.
Table 40 - Completion Status and Previous Dallas Challenge Referral Crosstabulation
Completion Status
Unsuccessful completion
Successful completion Total
Count 422 854 1276% within Previous Dallas Challenge referral
33.1% 66.9% 100.0%
No
% within Completion Status
95.3% 98.3% 97.3%
Yes Count 21 15 36% within Previous Dallas Challenge referral
58.3% 41.7% 100.0%
Previous Dallas Challenge referral(a)
% within Completion Status
4.7% 1.7% 2.7%
Total Count 443 869 1312
% within Previous 33.8% 66.2% 100.0%
54
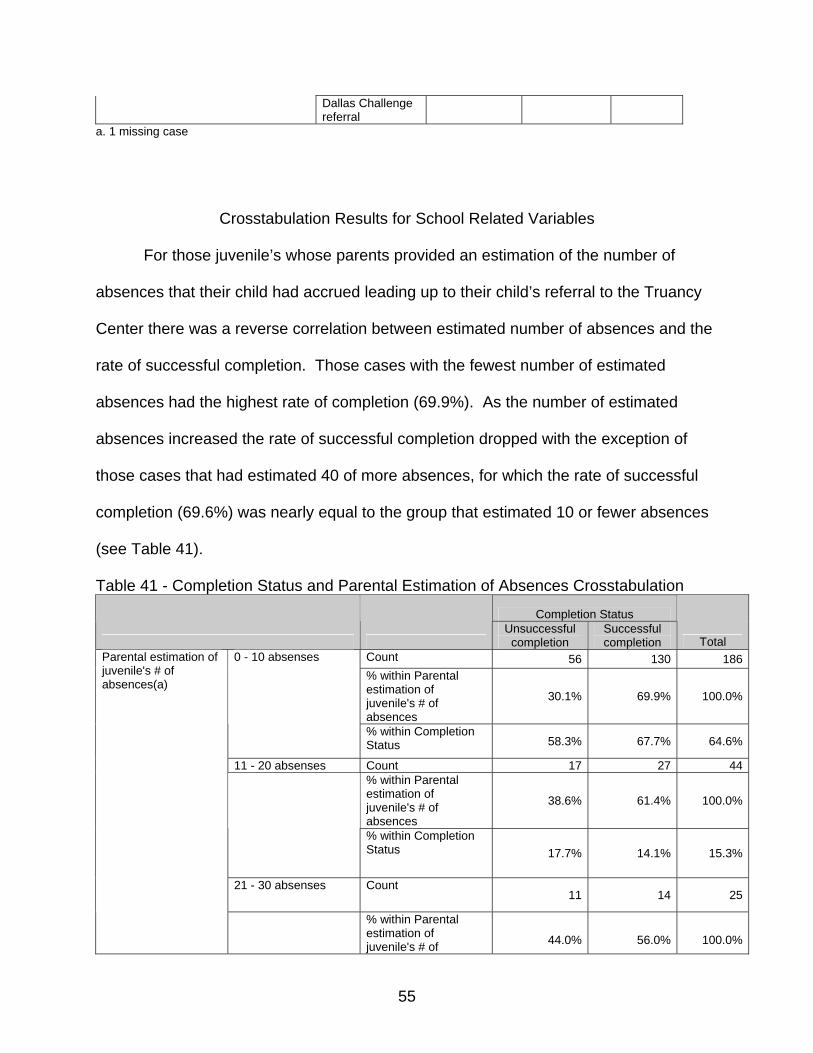
Dallas Challenge referral
a. 1 missing case
Crosstabulation Results for School Related Variables
For those juvenile’s whose parents provided an estimation of the number of
absences that their child had accrued leading up to their child’s referral to the Truancy
Center there was a reverse correlation between estimated number of absences and the
rate of successful completion. Those cases with the fewest number of estimated
absences had the highest rate of completion (69.9%). As the number of estimated
absences increased the rate of successful completion dropped with the exception of
those cases that had estimated 40 of more absences, for which the rate of successful
completion (69.6%) was nearly equal to the group that estimated 10 or fewer absences
(see Table 41).
Table 41 - Completion Status and Parental Estimation of Absences Crosstabulation
Completion Status
Unsuccessful completion
Successful completion Total
Count 56 130 186% within Parental estimation of juvenile's # of absences
30.1% 69.9% 100.0%
0 - 10 absenses
% within Completion Status 58.3% 67.7% 64.6%
11 - 20 absenses Count 17 27 44% within Parental estimation of juvenile's # of absences
38.6% 61.4% 100.0%
% within Completion Status 17.7% 14.1% 15.3%
21 - 30 absenses Count 11 14 25
Parental estimation of juvenile's # of absences(a)
% within Parental estimation of juvenile's # of 44.0% 56.0% 100.0%
55
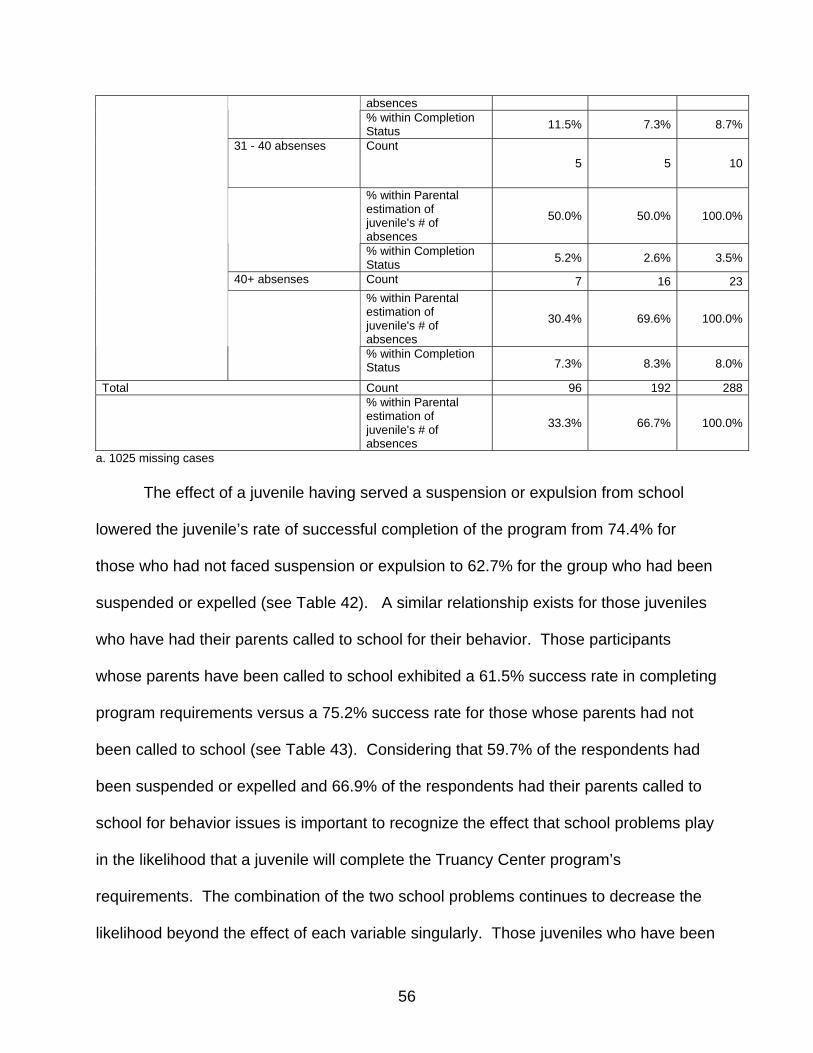
absences % within Completion Status 11.5% 7.3% 8.7%
31 - 40 absenses Count 5 5 10
% within Parental estimation of juvenile's # of absences
50.0% 50.0% 100.0%
% within Completion Status 5.2% 2.6% 3.5%
40+ absenses Count 7 16 23% within Parental estimation of juvenile's # of absences
30.4% 69.6% 100.0%
% within Completion Status 7.3% 8.3% 8.0%
Total Count 96 192 288% within Parental estimation of juvenile's # of absences
33.3% 66.7% 100.0%
a. 1025 missing cases The effect of a juvenile having served a suspension or expulsion from school
lowered the juvenile’s rate of successful completion of the program from 74.4% for
those who had not faced suspension or expulsion to 62.7% for the group who had been
suspended or expelled (see Table 42). A similar relationship exists for those juveniles
who have had their parents called to school for their behavior. Those participants
whose parents have been called to school exhibited a 61.5% success rate in completing
program requirements versus a 75.2% success rate for those whose parents had not
been called to school (see Table 43). Considering that 59.7% of the respondents had
been suspended or expelled and 66.9% of the respondents had their parents called to
school for behavior issues is important to recognize the effect that school problems play
in the likelihood that a juvenile will complete the Truancy Center program’s
requirements. The combination of the two school problems continues to decrease the
likelihood beyond the effect of each variable singularly. Those juveniles who have been
56
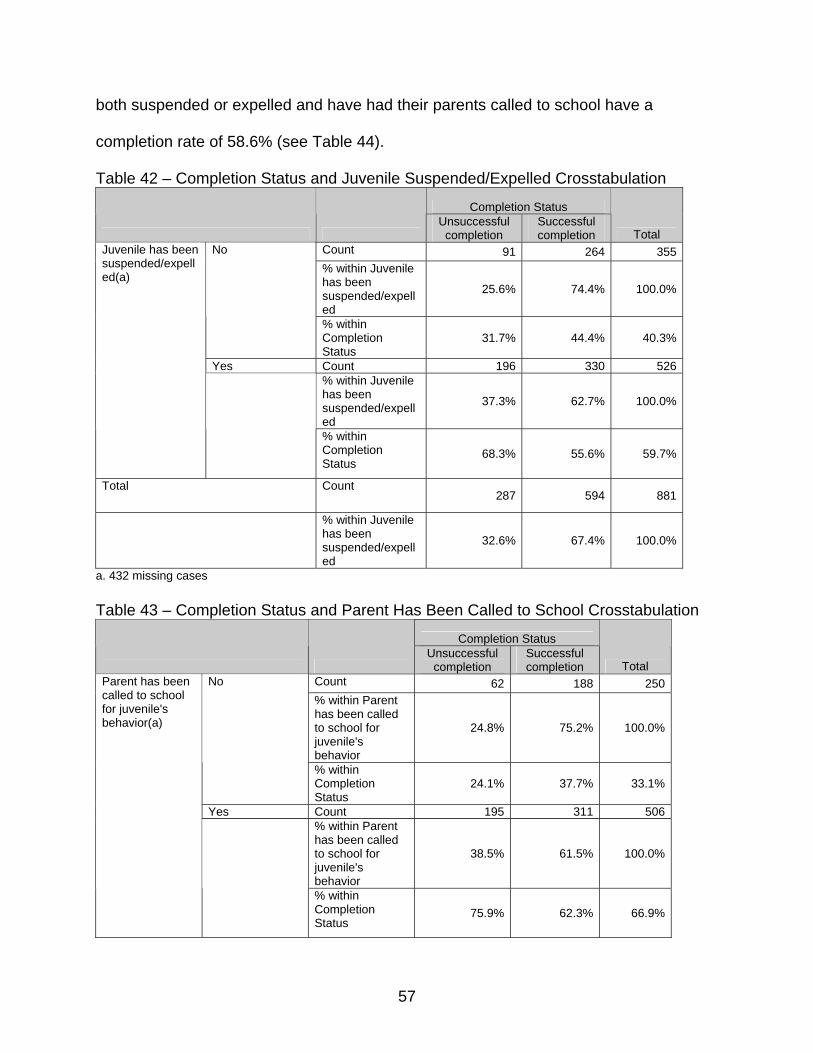
both suspended or expelled and have had their parents called to school have a
completion rate of 58.6% (see Table 44).
Table 42 – Completion Status and Juvenile Suspended/Expelled Crosstabulation
Completion Status
Unsuccessful completion
Successful completion Total
Count 91 264 355% within Juvenile has been suspended/expelled
25.6% 74.4% 100.0%
No
% within Completion Status
31.7% 44.4% 40.3%
Yes Count 196 330 526% within Juvenile has been suspended/expelled
37.3% 62.7% 100.0%
Juvenile has been suspended/expelled(a)
% within Completion Status
68.3% 55.6% 59.7%
Total Count 287 594 881
% within Juvenile has been suspended/expelled
32.6% 67.4% 100.0%
a. 432 missing cases Table 43 – Completion Status and Parent Has Been Called to School Crosstabulation
Completion Status
Unsuccessful completion
Successful completion Total
Count 62 188 250% within Parent has been called to school for juvenile's behavior
24.8% 75.2% 100.0%
No
% within Completion Status
24.1% 37.7% 33.1%
Yes Count 195 311 506% within Parent has been called to school for juvenile's behavior
38.5% 61.5% 100.0%
Parent has been called to school for juvenile's behavior(a)
% within Completion Status
75.9% 62.3% 66.9%
57

Total Count 257 499 756
% within Parent has been called to school for juvenile's behavior
34.0% 66.0% 100.0%
a 557 missing cases Table 44 – Completion Status by Parent Called and Juvenile Suspended/Expelled
Crosstabulation
Completion Status Total Parent has been called to school
Unsuccessful completion
Successful completion
No Juvenile has been suspended/expelled
No Count 35 128 163
% within Juvenile has been suspended/expelled
21.5% 78.5% 100.0%
Yes Count 24 52 76 % within Juvenile
has been suspended/expelled
31.6% 68.4% 100.0%
Yes Juvenile has been suspended/expelled
No Count 38 84 122
% within Juvenile has been suspended/expelled
31.1% 68.9% 100.0%
Yes Count 149 211 360 % within Juvenile
has been suspended/expelled
41.4% 58.6% 100.0%
Those participants who have a learning disability completed the program at a
rate of 57.0% as compared to the 69.5% rate for those who do not have a learning
disability (see Table 45). Similarly, for participants who are enrolled in special
education classes the completion rate differed from those who are in regular classes
with rates of 58.5% and 68.6% respectively (see Table 46).
Table 45 - Completion Status and Juvenile Has a Learning Disability Crosstabulation
Completion Status
Unsuccessful completion
Successful completion Total
Count 171 389 560% within Juvenile has learning disability
30.5% 69.5% 100.0%
Juvenile has learning disability(a)
No
% within Completion Status 67.3% 78.0% 74.4%
58

Yes Count 83 110 193% within Juvenile has learning disability
43.0% 57.0% 100.0%
% within Completion Status 32.7% 22.0% 25.6%
Total Count 254 499 753
% within Juvenile has learning disability
33.7% 66.3% 100.0%
a. 560 missing cases Table 46 - Completion Status and Juvenile is in Special Education Classes
Crosstabulation
Completion Status
Unsuccessful completion
Successful completion Total
Count 232 507 739% within Juvenile is in special eduaction classes
31.4% 68.6% 100.0%
No
% within Completion Status
79.2% 85.5% 83.4%
Yes Count 61 86 147% within Juvenile is in special eduaction classes
41.5% 58.5% 100.0%
Juvenile is in special eduaction classes(a)
% within Completion Status
20.8% 14.5% 16.6%
Total Count 293 593 886
% within Juvenile is in special eduaction classes
33.1% 66.9% 100.0%
a. 427 missing cases Results from the analysis of the number of grades failed variable found that there
was little difference in the success rate of completion between the groups who had not
failed any grades, those who had failed one grade, and those who failed multiple grades
of school. Within all three groups, approximately 2/3 of the participants completed the
program successfully regardless of their history of grades failed (see Table 47).
Table 47 - Completion Status and Number of Grades Failed Crosstabulation
59

Completion Status
Unsuccessful completion
Successful completion Total
Count 338 654 992% within Grades failed 34.1% 65.9% 100.0%
No Grades Failed
% within Completion Status 76.6% 75.8% 76.1%
One Grade Failed Count 83 171 254% within Grades failed 32.7% 67.3% 100.0%
% within Completion Status 18.8% 19.8% 19.5%
Multiple Grades Failed
Count 20 38 58
% within Grades failed 34.5% 65.5% 100.0%
Grades failed(a)
% within Completion Status 4.5% 4.4% 4.4%
Total Count 441 863 1304% within Grades failed 33.8% 66.2% 100.0%
a. 9 missing cases Involvement in extracurricular activities had a minimal effect on increasing
likelihood of successful program completion. The participants responding to the
question were evenly regarding their involvement in extra-curricular activities and the
rate of completion of the program for both responses was inline with the overall
completion percentages of the sample (see Table 48).
Table 48 - Completion Status and Juvenile Involvement in Extra-Curricular Activities Crosstabulation
Completion Status
Unsuccessful completion
Successful completion Total
Count 103 169 272 % within Juvenile involvement in extra-curricluar activities
37.9% 62.1% 100.0%
No
% within Completion Status
51.5% 46.8% 48.5%
Yes Count 97 192 289
Juvenile involvement in extra-curricluar activities(a)
% within Juvenile involvement in extra-curricluar
33.6% 66.4% 100.0%
60
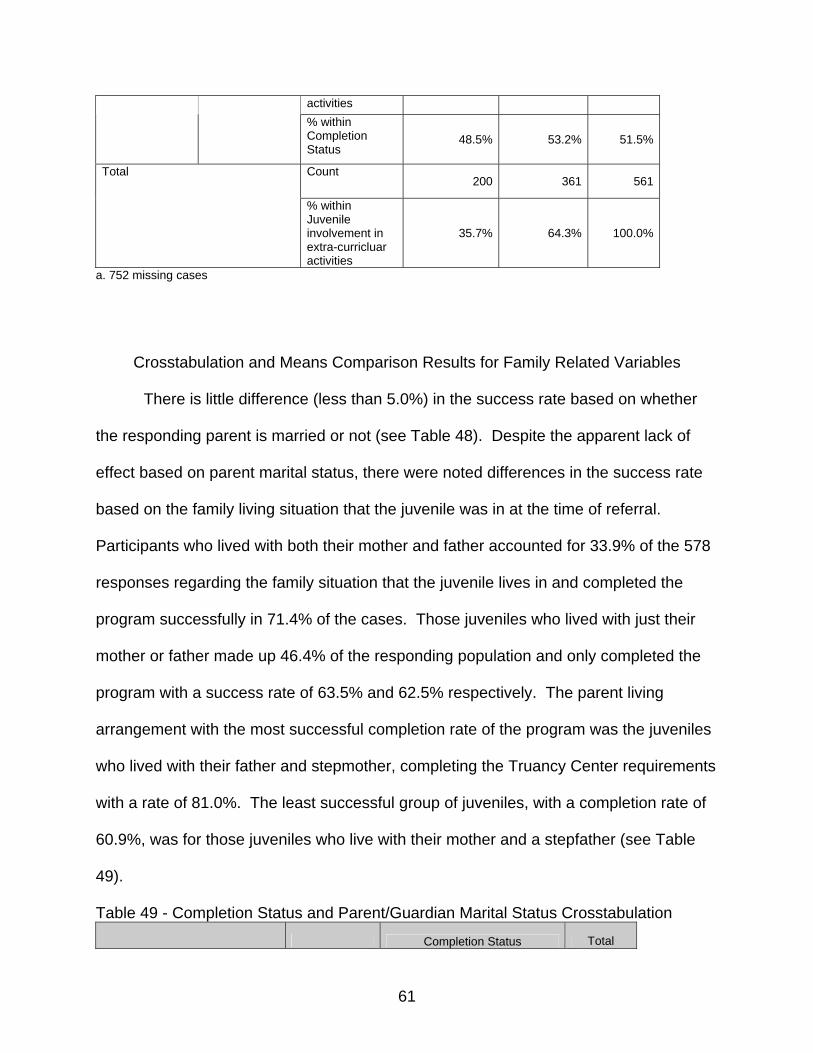
activities % within Completion Status
48.5% 53.2% 51.5%
Total Count 200 361 561
% within Juvenile involvement in extra-curricluar activities
35.7% 64.3% 100.0%
a. 752 missing cases
Crosstabulation and Means Comparison Results for Family Related Variables
There is little difference (less than 5.0%) in the success rate based on whether
the responding parent is married or not (see Table 48). Despite the apparent lack of
effect based on parent marital status, there were noted differences in the success rate
based on the family living situation that the juvenile was in at the time of referral.
Participants who lived with both their mother and father accounted for 33.9% of the 578
responses regarding the family situation that the juvenile lives in and completed the
program successfully in 71.4% of the cases. Those juveniles who lived with just their
mother or father made up 46.4% of the responding population and only completed the
program with a success rate of 63.5% and 62.5% respectively. The parent living
arrangement with the most successful completion rate of the program was the juveniles
who lived with their father and stepmother, completing the Truancy Center requirements
with a rate of 81.0%. The least successful group of juveniles, with a completion rate of
60.9%, was for those juveniles who live with their mother and a stepfather (see Table
49).
Table 49 - Completion Status and Parent/Guardian Marital Status Crosstabulation
Completion Status Total
61

Unsuccessful completion
Successful completion
Count 166 308 474 % within Is parent/guardian married
35.0% 65.0% 100.0%
No
% within Completion Status
57.2% 51.8% 53.6%
Yes Count 124 287 411 % within Is parent/guardian married
30.2% 69.8% 100.0%
Is parent/ guardian married(a)
% within Completion Status
42.8% 48.2% 46.4%
Total Count 290 595 885
% within Is parent/guardian married
32.8% 67.2% 100.0%
a. 428 missing cases Table 50 - Completion Status and Family Member That Juvenile Lives with
Crosstabulation
Completion Status
Unsuccessful completion
Successful completion Total
Count 9 15 24 % within Juvenile lives with
37.5% 62.5% 100.0%
Father
% within Completion Status
4.7% 3.9% 4.2%
Mother Count 89 155 244 % within Juvenile lives with
36.5% 63.5% 100.0%
% within Completion Status
46.6% 40.1% 42.2%
Father/Mother Count 56 140 196
% within Juvenile lives with
28.6% 71.4% 100.0%
% within Completion Status
29.3% 36.2% 33.9%
Father/Stepmother
Count 4 17 21
% within Juvenile lives with
19.0% 81.0% 100.0%
Juvenile lives with(a)
% within Completion 2.1% 4.4% 3.6%
62
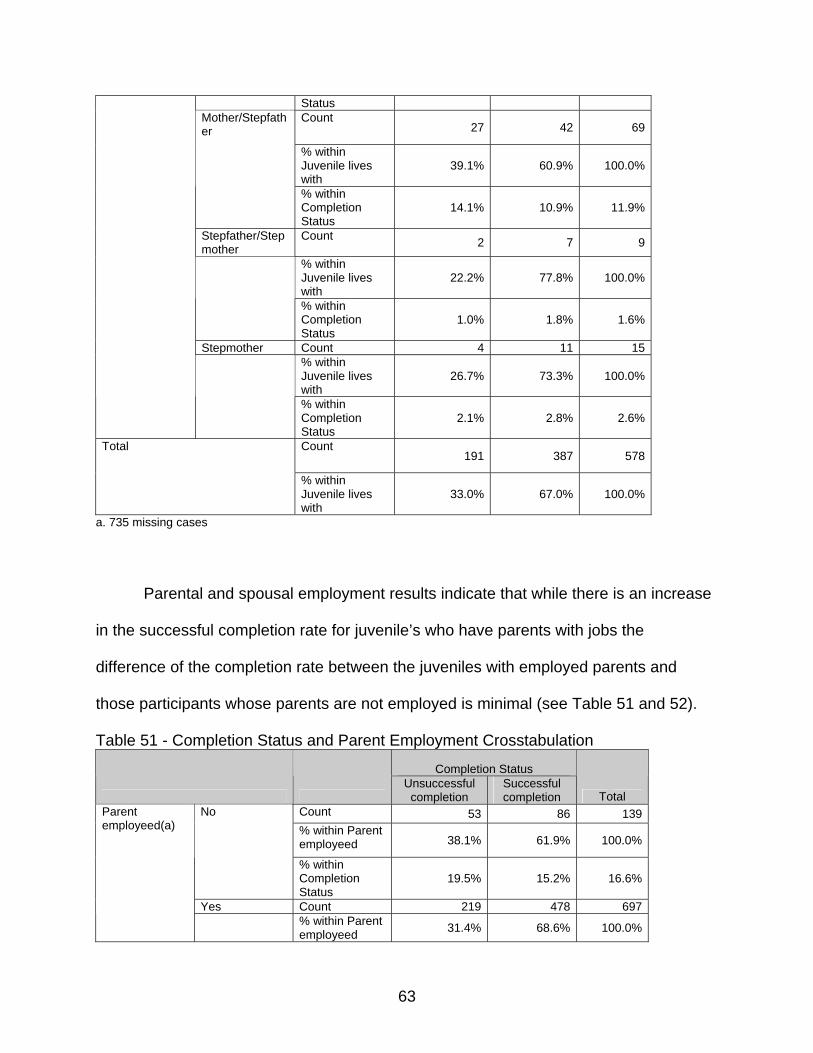
Status Count
27 42 69
% within Juvenile lives with
39.1% 60.9% 100.0%
Mother/Stepfather
% within Completion Status
14.1% 10.9% 11.9%
Stepfather/Stepmother
Count 2 7 9
% within Juvenile lives with
22.2% 77.8% 100.0%
% within Completion Status
1.0% 1.8% 1.6%
Stepmother Count 4 11 15 % within Juvenile lives with
26.7% 73.3% 100.0%
% within Completion Status
2.1% 2.8% 2.6%
Total Count 191 387 578
% within Juvenile lives with
33.0% 67.0% 100.0%
a. 735 missing cases Parental and spousal employment results indicate that while there is an increase
in the successful completion rate for juvenile’s who have parents with jobs the
difference of the completion rate between the juveniles with employed parents and
those participants whose parents are not employed is minimal (see Table 51 and 52).
Table 51 - Completion Status and Parent Employment Crosstabulation
Completion Status
Unsuccessful completion
Successful completion Total
Count 53 86 139 % within Parent employeed 38.1% 61.9% 100.0%
No
% within Completion Status
19.5% 15.2% 16.6%
Yes Count 219 478 697
Parent employeed(a)
% within Parent employeed 31.4% 68.6% 100.0%
63
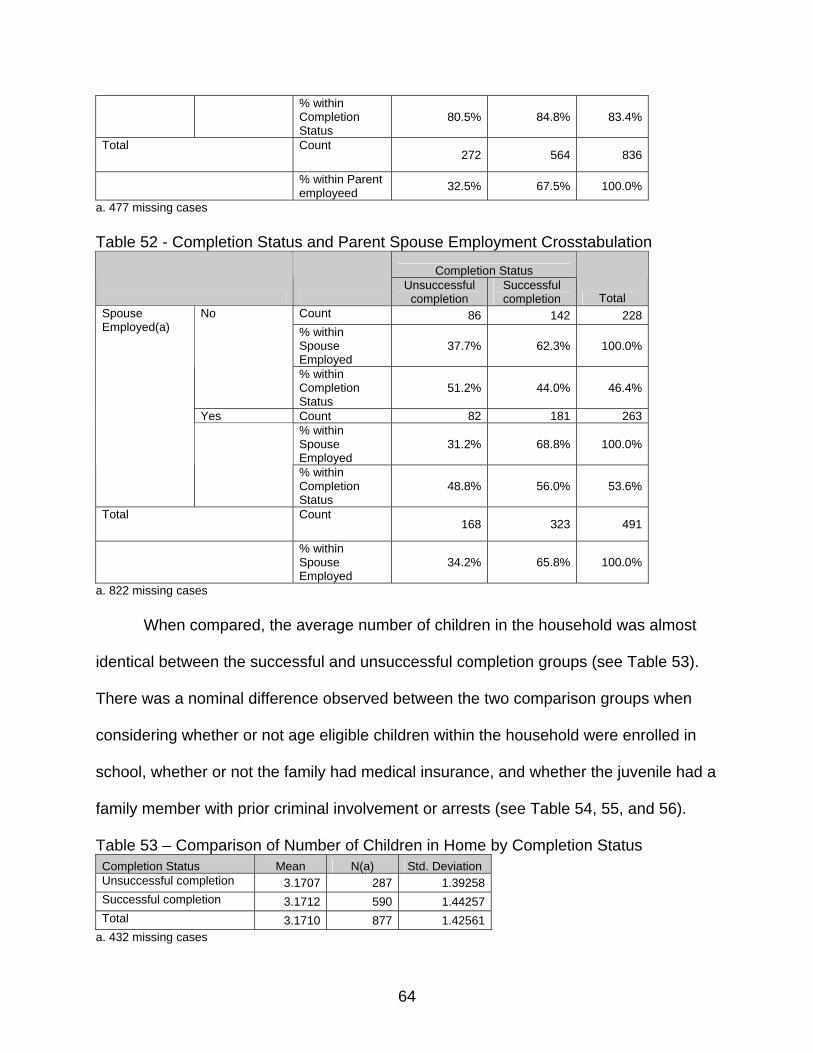
% within Completion Status
80.5% 84.8% 83.4%
Total Count 272 564 836
% within Parent employeed 32.5% 67.5% 100.0%
a. 477 missing cases Table 52 - Completion Status and Parent Spouse Employment Crosstabulation
Completion Status
Unsuccessful completion
Successful completion Total
Count 86 142 228 % within Spouse Employed
37.7% 62.3% 100.0%
No
% within Completion Status
51.2% 44.0% 46.4%
Yes Count 82 181 263 % within Spouse Employed
31.2% 68.8% 100.0%
Spouse Employed(a)
% within Completion Status
48.8% 56.0% 53.6%
Total Count 168 323 491
% within Spouse Employed
34.2% 65.8% 100.0%
a. 822 missing cases When compared, the average number of children in the household was almost
identical between the successful and unsuccessful completion groups (see Table 53).
There was a nominal difference observed between the two comparison groups when
considering whether or not age eligible children within the household were enrolled in
school, whether or not the family had medical insurance, and whether the juvenile had a
family member with prior criminal involvement or arrests (see Table 54, 55, and 56).
Table 53 – Comparison of Number of Children in Home by Completion Status Completion Status Mean N(a) Std. Deviation Unsuccessful completion 3.1707 287 1.39258Successful completion 3.1712 590 1.44257Total 3.1710 877 1.42561
a. 432 missing cases
64
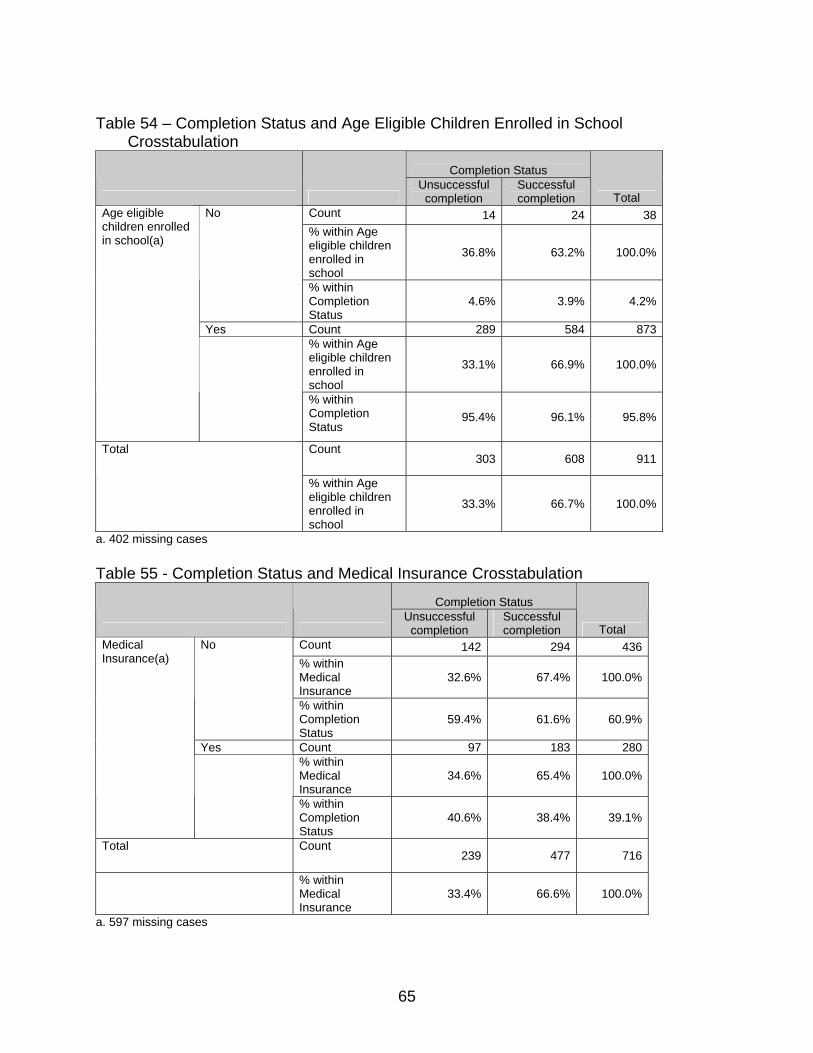
Table 54 – Completion Status and Age Eligible Children Enrolled in School
Crosstabulation
Completion Status
Unsuccessful completion
Successful completion Total
Count 14 24 38% within Age eligible children enrolled in school
36.8% 63.2% 100.0%
No
% within Completion Status
4.6% 3.9% 4.2%
Yes Count 289 584 873% within Age eligible children enrolled in school
33.1% 66.9% 100.0%
Age eligible children enrolled in school(a)
% within Completion Status
95.4% 96.1% 95.8%
Count 303 608 911
Total
% within Age eligible children enrolled in school
33.3% 66.7% 100.0%
a. 402 missing cases Table 55 - Completion Status and Medical Insurance Crosstabulation
Completion Status
Unsuccessful completion
Successful completion Total
Count 142 294 436 % within Medical Insurance
32.6% 67.4% 100.0%
No
% within Completion Status
59.4% 61.6% 60.9%
Yes Count 97 183 280 % within Medical Insurance
34.6% 65.4% 100.0%
Medical Insurance(a)
% within Completion Status
40.6% 38.4% 39.1%
Total Count 239 477 716
% within Medical Insurance
33.4% 66.6% 100.0%
a. 597 missing cases
65
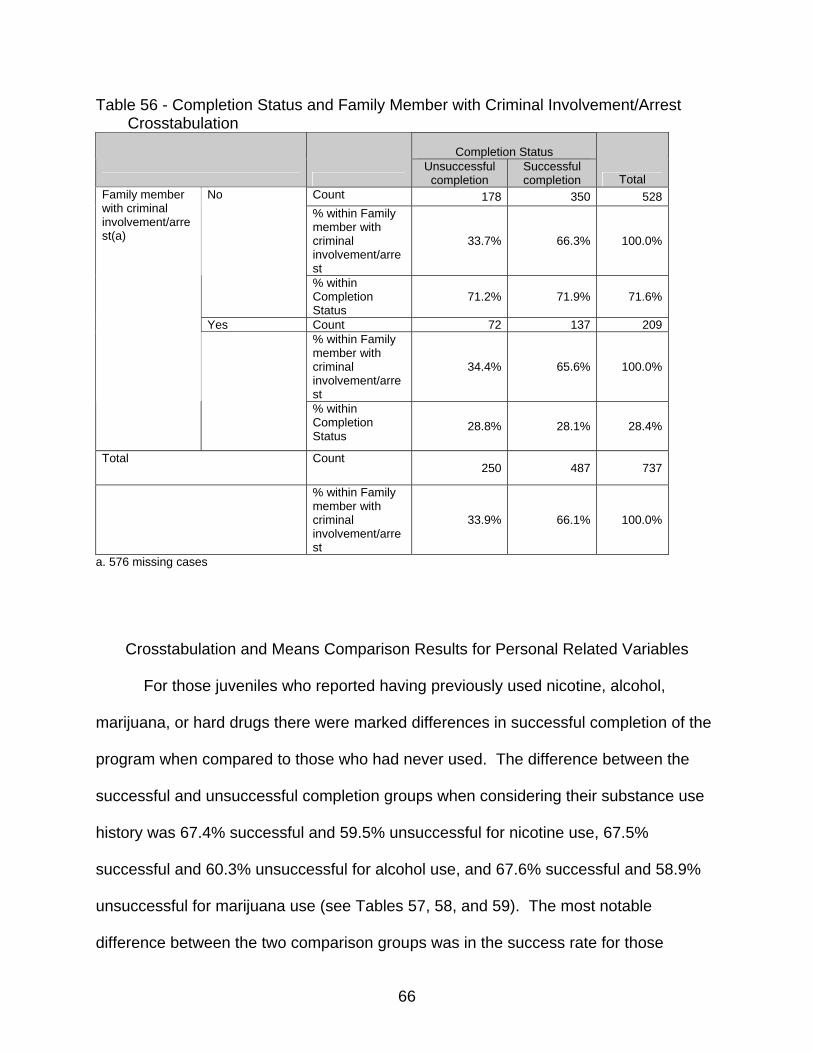
Table 56 - Completion Status and Family Member with Criminal Involvement/Arrest Crosstabulation
Completion Status
Unsuccessful completion
Successful completion Total
Count 178 350 528% within Family member with criminal involvement/arrest
33.7% 66.3% 100.0%
No
% within Completion Status
71.2% 71.9% 71.6%
Yes Count 72 137 209% within Family member with criminal involvement/arrest
34.4% 65.6% 100.0%
Family member with criminal involvement/arrest(a)
% within Completion Status
28.8% 28.1% 28.4%
Total Count 250 487 737
% within Family member with criminal involvement/arrest
33.9% 66.1% 100.0%
a. 576 missing cases
Crosstabulation and Means Comparison Results for Personal Related Variables
For those juveniles who reported having previously used nicotine, alcohol,
marijuana, or hard drugs there were marked differences in successful completion of the
program when compared to those who had never used. The difference between the
successful and unsuccessful completion groups when considering their substance use
history was 67.4% successful and 59.5% unsuccessful for nicotine use, 67.5%
successful and 60.3% unsuccessful for alcohol use, and 67.6% successful and 58.9%
unsuccessful for marijuana use (see Tables 57, 58, and 59). The most notable
difference between the two comparison groups was in the success rate for those
66
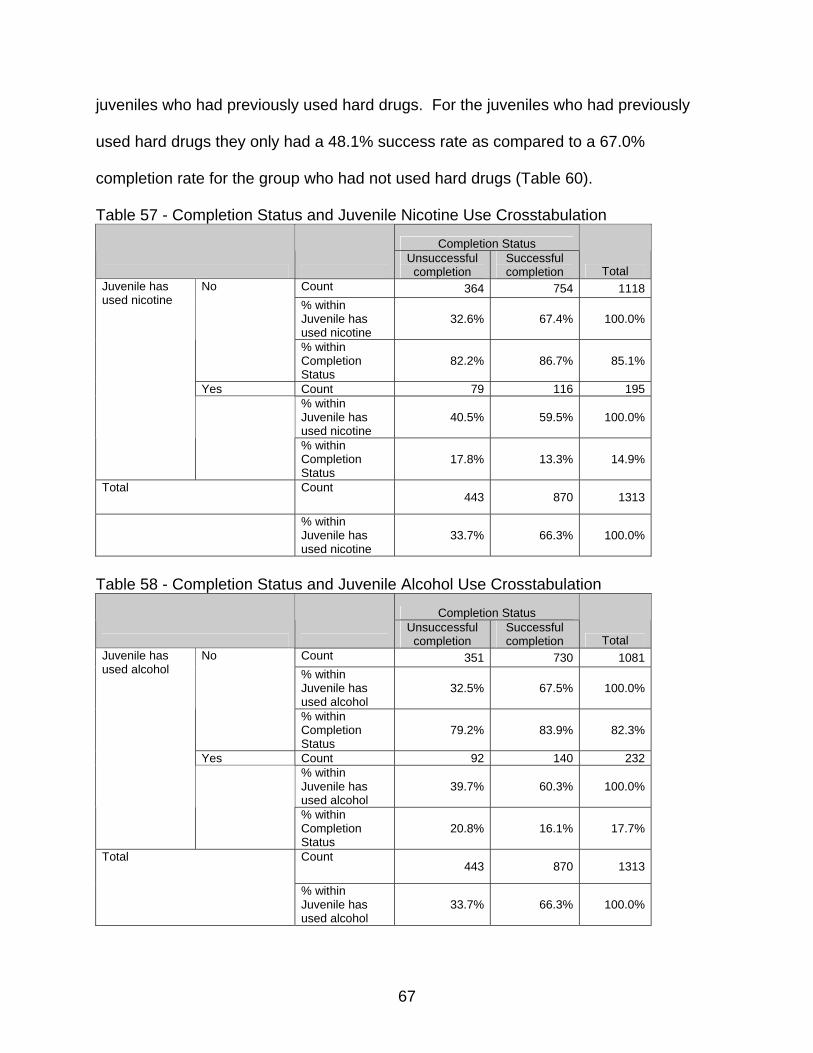
juveniles who had previously used hard drugs. For the juveniles who had previously
used hard drugs they only had a 48.1% success rate as compared to a 67.0%
completion rate for the group who had not used hard drugs (Table 60).
Table 57 - Completion Status and Juvenile Nicotine Use Crosstabulation
Completion Status
Unsuccessful completion
Successful completion Total
Count 364 754 1118 % within Juvenile has used nicotine
32.6% 67.4% 100.0%
No
% within Completion Status
82.2% 86.7% 85.1%
Yes Count 79 116 195 % within Juvenile has used nicotine
40.5% 59.5% 100.0%
Juvenile has used nicotine
% within Completion Status
17.8% 13.3% 14.9%
Total Count 443 870 1313
% within Juvenile has used nicotine
33.7% 66.3% 100.0%
Table 58 - Completion Status and Juvenile Alcohol Use Crosstabulation
Completion Status
Unsuccessful completion
Successful completion Total
Count 351 730 1081 % within Juvenile has used alcohol
32.5% 67.5% 100.0%
No
% within Completion Status
79.2% 83.9% 82.3%
Yes Count 92 140 232 % within Juvenile has used alcohol
39.7% 60.3% 100.0%
Juvenile has used alcohol
% within Completion Status
20.8% 16.1% 17.7%
Total Count 443 870 1313
% within Juvenile has used alcohol
33.7% 66.3% 100.0%
67
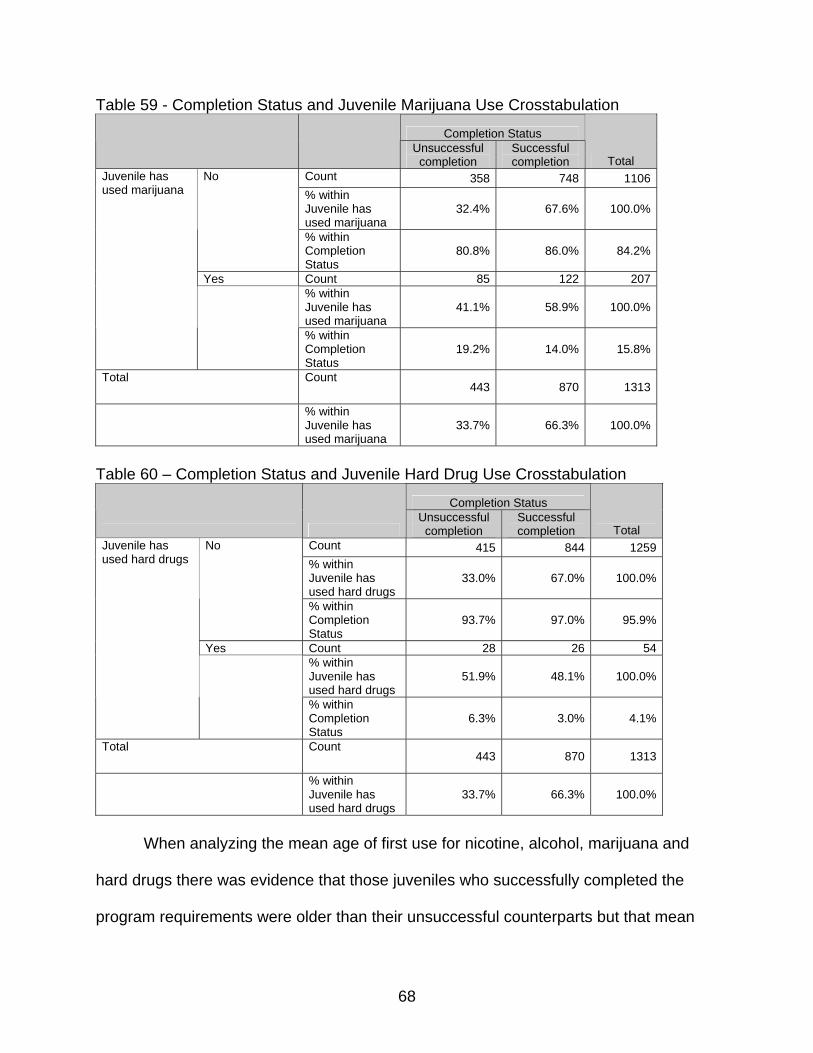
Table 59 - Completion Status and Juvenile Marijuana Use Crosstabulation
Completion Status
Unsuccessful completion
Successful completion Total
Count 358 748 1106 % within Juvenile has used marijuana
32.4% 67.6% 100.0%
No
% within Completion Status
80.8% 86.0% 84.2%
Yes Count 85 122 207 % within Juvenile has used marijuana
41.1% 58.9% 100.0%
Juvenile has used marijuana
% within Completion Status
19.2% 14.0% 15.8%
Total Count 443 870 1313
% within Juvenile has used marijuana
33.7% 66.3% 100.0%
Table 60 – Completion Status and Juvenile Hard Drug Use Crosstabulation
Completion Status
Unsuccessful completion
Successful completion Total
Count 415 844 1259% within Juvenile has used hard drugs
33.0% 67.0% 100.0%
No
% within Completion Status
93.7% 97.0% 95.9%
Yes Count 28 26 54% within Juvenile has used hard drugs
51.9% 48.1% 100.0%
Juvenile has used hard drugs
% within Completion Status
6.3% 3.0% 4.1%
Total Count 443 870 1313
% within Juvenile has used hard drugs
33.7% 66.3% 100.0%
When analyzing the mean age of first use for nicotine, alcohol, marijuana and
hard drugs there was evidence that those juveniles who successfully completed the
program requirements were older than their unsuccessful counterparts but that mean
68
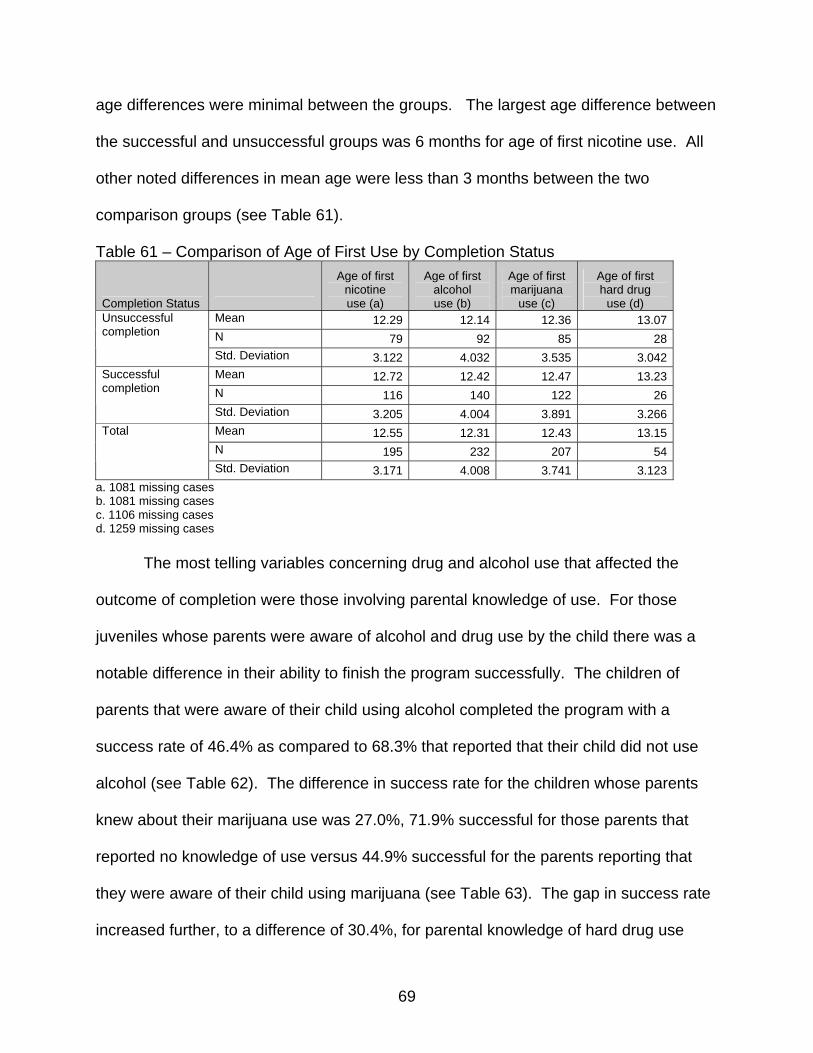
age differences were minimal between the groups. The largest age difference between
the successful and unsuccessful groups was 6 months for age of first nicotine use. All
other noted differences in mean age were less than 3 months between the two
comparison groups (see Table 61).
Table 61 – Comparison of Age of First Use by Completion Status
Completion Status
Age of first nicotine use (a)
Age of first alcohol use (b)
Age of first marijuana
use (c)
Age of first hard drug
use (d) Mean 12.29 12.14 12.36 13.07N 79 92 85 28
Unsuccessful completion
Std. Deviation 3.122 4.032 3.535 3.042Mean 12.72 12.42 12.47 13.23N 116 140 122 26
Successful completion
Std. Deviation 3.205 4.004 3.891 3.266Mean 12.55 12.31 12.43 13.15N 195 232 207 54
Total
Std. Deviation 3.171 4.008 3.741 3.123a. 1081 missing cases b. 1081 missing cases c. 1106 missing cases d. 1259 missing cases The most telling variables concerning drug and alcohol use that affected the
outcome of completion were those involving parental knowledge of use. For those
juveniles whose parents were aware of alcohol and drug use by the child there was a
notable difference in their ability to finish the program successfully. The children of
parents that were aware of their child using alcohol completed the program with a
success rate of 46.4% as compared to 68.3% that reported that their child did not use
alcohol (see Table 62). The difference in success rate for the children whose parents
knew about their marijuana use was 27.0%, 71.9% successful for those parents that
reported no knowledge of use versus 44.9% successful for the parents reporting that
they were aware of their child using marijuana (see Table 63). The gap in success rate
increased further, to a difference of 30.4%, for parental knowledge of hard drug use
69
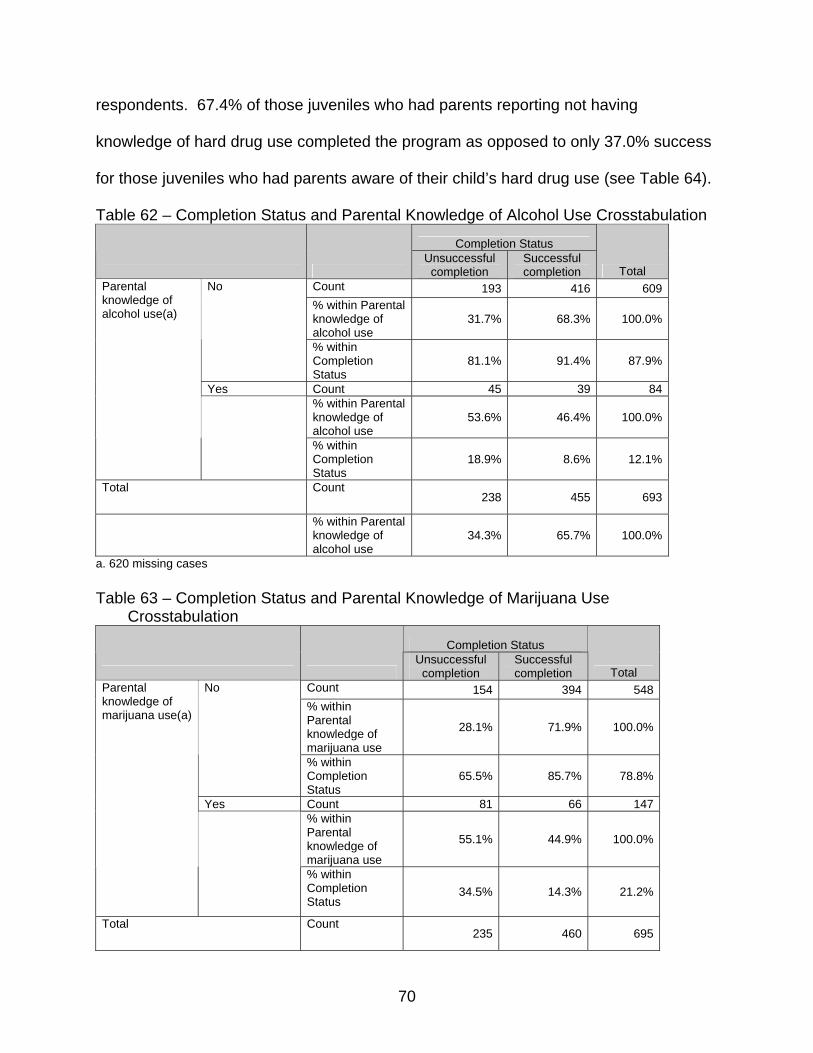
respondents. 67.4% of those juveniles who had parents reporting not having
knowledge of hard drug use completed the program as opposed to only 37.0% success
for those juveniles who had parents aware of their child’s hard drug use (see Table 64).
Table 62 – Completion Status and Parental Knowledge of Alcohol Use Crosstabulation
Completion Status
Unsuccessful completion
Successful completion Total
Count 193 416 609% within Parental knowledge of alcohol use
31.7% 68.3% 100.0%
No
% within Completion Status
81.1% 91.4% 87.9%
Yes Count 45 39 84% within Parental knowledge of alcohol use
53.6% 46.4% 100.0%
Parental knowledge of alcohol use(a)
% within Completion Status
18.9% 8.6% 12.1%
Total Count 238 455 693
% within Parental knowledge of alcohol use
34.3% 65.7% 100.0%
a. 620 missing cases Table 63 – Completion Status and Parental Knowledge of Marijuana Use
Crosstabulation
Completion Status
Unsuccessful completion
Successful completion Total
Count 154 394 548 % within Parental knowledge of marijuana use
28.1% 71.9% 100.0%
No
% within Completion Status
65.5% 85.7% 78.8%
Yes Count 81 66 147 % within Parental knowledge of marijuana use
55.1% 44.9% 100.0%
Parental knowledge of marijuana use(a)
% within Completion Status
34.5% 14.3% 21.2%
Total Count 235 460 695
70
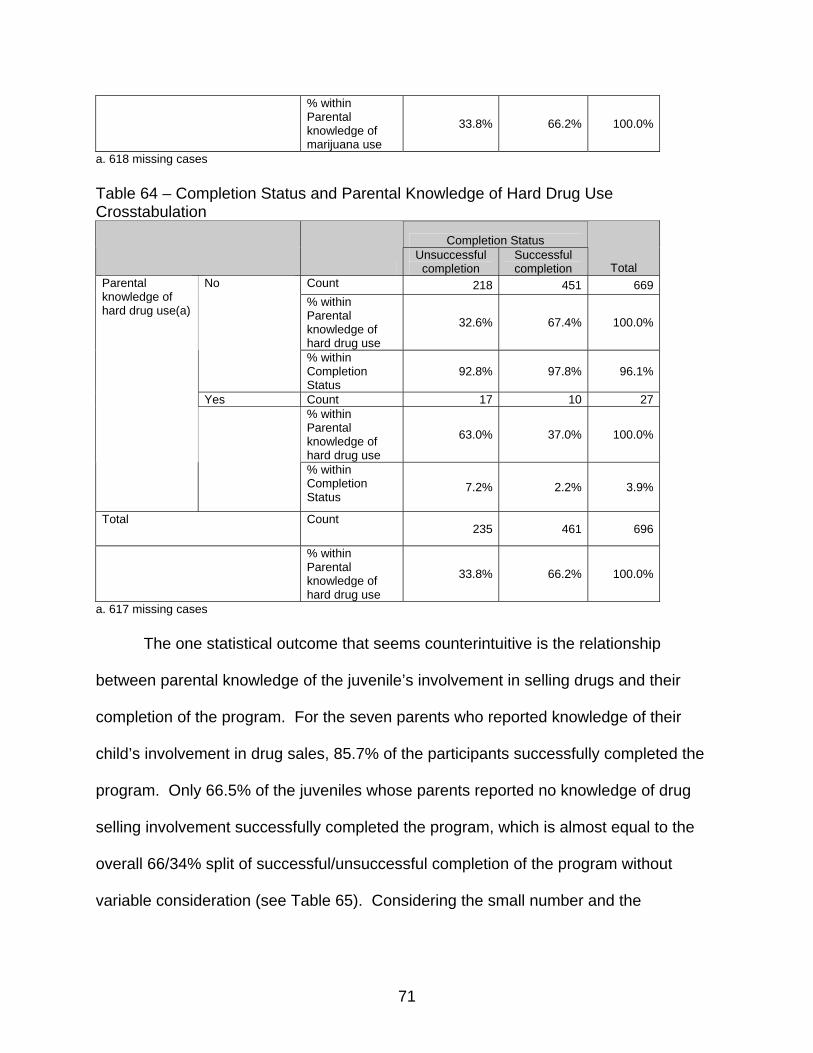
% within Parental knowledge of marijuana use
33.8% 66.2% 100.0%
a. 618 missing cases Table 64 – Completion Status and Parental Knowledge of Hard Drug Use Crosstabulation
Completion Status
Unsuccessful completion
Successful completion Total
Count 218 451 669 % within Parental knowledge of hard drug use
32.6% 67.4% 100.0%
No
% within Completion Status
92.8% 97.8% 96.1%
Yes Count 17 10 27 % within Parental knowledge of hard drug use
63.0% 37.0% 100.0%
Parental knowledge of hard drug use(a)
% within Completion Status
7.2% 2.2% 3.9%
Total Count 235 461 696
% within Parental knowledge of hard drug use
33.8% 66.2% 100.0%
a. 617 missing cases
The one statistical outcome that seems counterintuitive is the relationship
between parental knowledge of the juvenile’s involvement in selling drugs and their
completion of the program. For the seven parents who reported knowledge of their
child’s involvement in drug sales, 85.7% of the participants successfully completed the
program. Only 66.5% of the juveniles whose parents reported no knowledge of drug
selling involvement successfully completed the program, which is almost equal to the
overall 66/34% split of successful/unsuccessful completion of the program without
variable consideration (see Table 65). Considering the small number and the
71
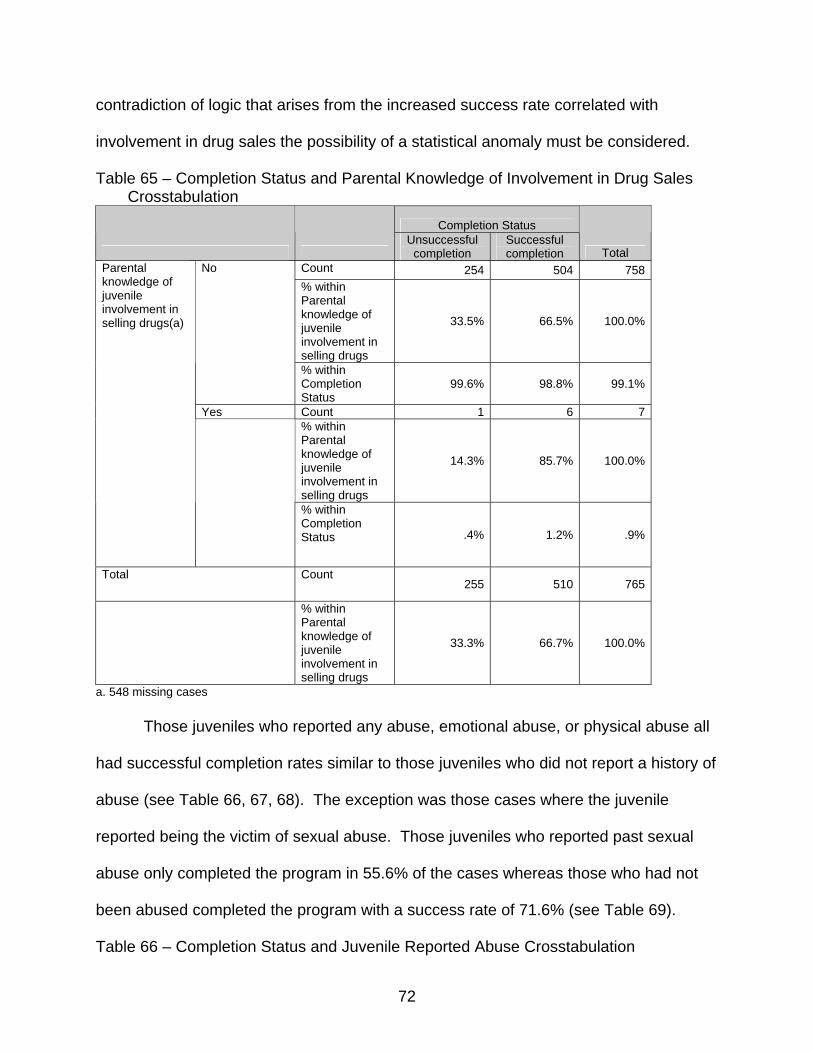
contradiction of logic that arises from the increased success rate correlated with
involvement in drug sales the possibility of a statistical anomaly must be considered.
Table 65 – Completion Status and Parental Knowledge of Involvement in Drug Sales Crosstabulation
Completion Status
Unsuccessful completion
Successful completion Total
Count 254 504 758 % within Parental knowledge of juvenile involvement in selling drugs
33.5% 66.5% 100.0%
No
% within Completion Status
99.6% 98.8% 99.1%
Yes Count 1 6 7 % within Parental knowledge of juvenile involvement in selling drugs
14.3% 85.7% 100.0%
Parental knowledge of juvenile involvement in selling drugs(a)
% within Completion Status .4% 1.2% .9%
Total Count 255 510 765
% within Parental knowledge of juvenile involvement in selling drugs
33.3% 66.7% 100.0%
a. 548 missing cases Those juveniles who reported any abuse, emotional abuse, or physical abuse all
had successful completion rates similar to those juveniles who did not report a history of
abuse (see Table 66, 67, 68). The exception was those cases where the juvenile
reported being the victim of sexual abuse. Those juveniles who reported past sexual
abuse only completed the program in 55.6% of the cases whereas those who had not
been abused completed the program with a success rate of 71.6% (see Table 69).
Table 66 – Completion Status and Juvenile Reported Abuse Crosstabulation
72
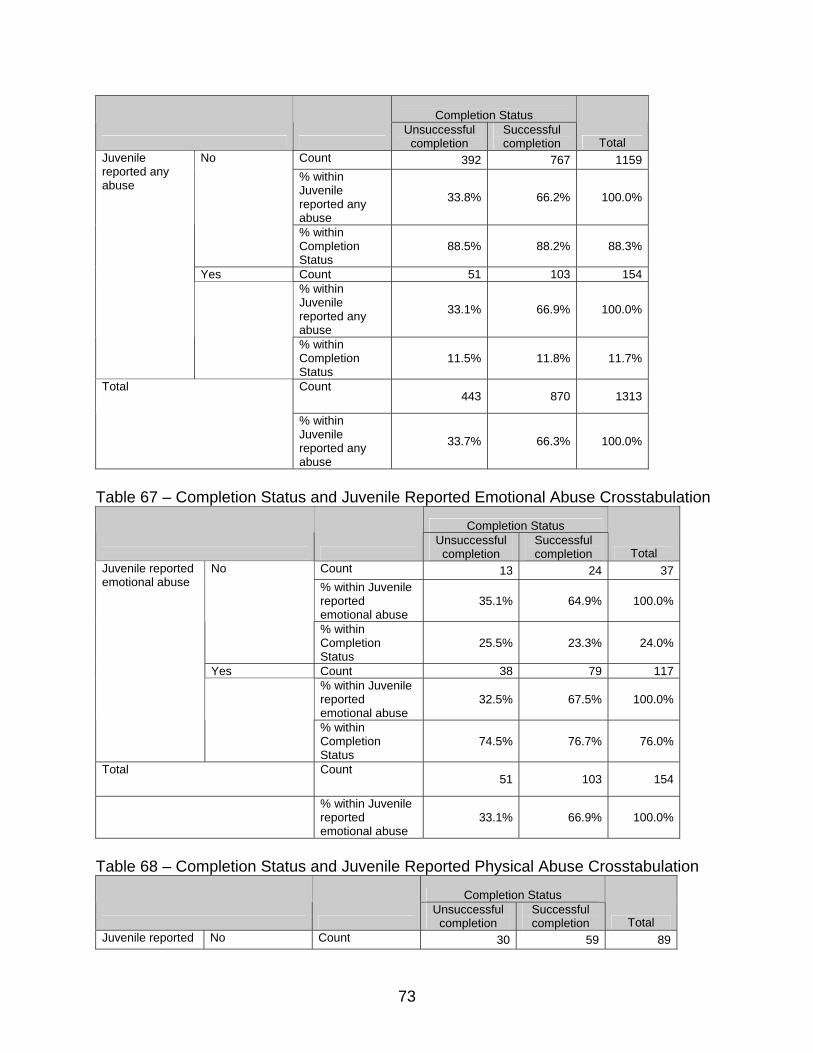
Completion Status
Unsuccessful completion
Successful completion Total
Count 392 767 1159 % within Juvenile reported any abuse
33.8% 66.2% 100.0%
No
% within Completion Status
88.5% 88.2% 88.3%
Yes Count 51 103 154 % within Juvenile reported any abuse
33.1% 66.9% 100.0%
Juvenile reported any abuse
% within Completion Status
11.5% 11.8% 11.7%
Count 443 870 1313
Total
% within Juvenile reported any abuse
33.7% 66.3% 100.0%
Table 67 – Completion Status and Juvenile Reported Emotional Abuse Crosstabulation
Completion Status
Unsuccessful completion
Successful completion Total
Count 13 24 37% within Juvenile reported emotional abuse
35.1% 64.9% 100.0%
No
% within Completion Status
25.5% 23.3% 24.0%
Yes Count 38 79 117% within Juvenile reported emotional abuse
32.5% 67.5% 100.0%
Juvenile reported emotional abuse
% within Completion Status
74.5% 76.7% 76.0%
Total Count 51 103 154
% within Juvenile reported emotional abuse
33.1% 66.9% 100.0%
Table 68 – Completion Status and Juvenile Reported Physical Abuse Crosstabulation
Completion Status
Unsuccessful completion
Successful completion Total
Juvenile reported No Count 30 59 89
73
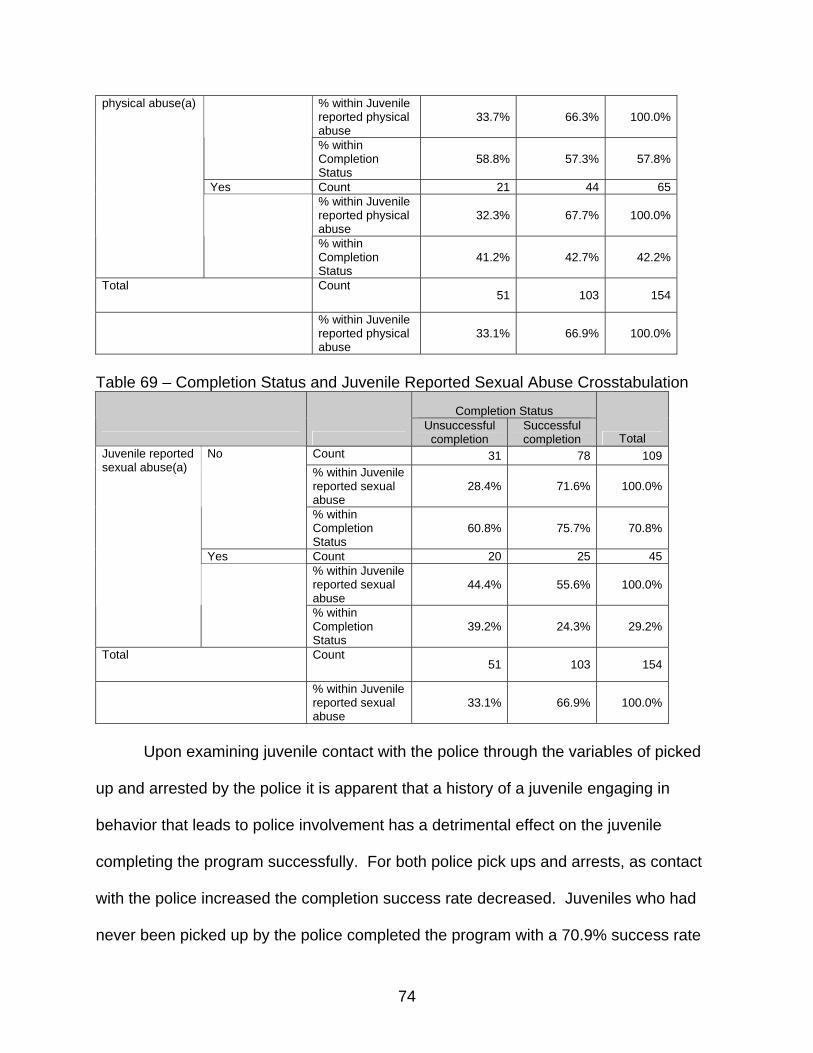
% within Juvenile reported physical abuse
33.7% 66.3% 100.0%
% within Completion Status
58.8% 57.3% 57.8%
Yes Count 21 44 65% within Juvenile reported physical abuse
32.3% 67.7% 100.0%
physical abuse(a)
% within Completion Status
41.2% 42.7% 42.2%
Total Count 51 103 154
% within Juvenile reported physical abuse
33.1% 66.9% 100.0%
Table 69 – Completion Status and Juvenile Reported Sexual Abuse Crosstabulation
Completion Status
Unsuccessful completion
Successful completion Total
Count 31 78 109% within Juvenile reported sexual abuse
28.4% 71.6% 100.0%
No
% within Completion Status
60.8% 75.7% 70.8%
Yes Count 20 25 45% within Juvenile reported sexual abuse
44.4% 55.6% 100.0%
Juvenile reported sexual abuse(a)
% within Completion Status
39.2% 24.3% 29.2%
Total Count 51 103 154
% within Juvenile reported sexual abuse
33.1% 66.9% 100.0%
Upon examining juvenile contact with the police through the variables of picked
up and arrested by the police it is apparent that a history of a juvenile engaging in
behavior that leads to police involvement has a detrimental effect on the juvenile
completing the program successfully. For both police pick ups and arrests, as contact
with the police increased the completion success rate decreased. Juveniles who had
never been picked up by the police completed the program with a 70.9% success rate
74

as compared to the 50.0% success rate for those juveniles who had been picked up
multiple times (see Table 70 ). Similarly, 72.0% of the juveniles with no arrest history
completed the program while only 41.4% of those who had multiple arrests were able to
finish successfully (see Table 71).
Table 70 – Completion Status and Juvenile Has Been Picked Up By Police Crosstabulation
Completion Status
Unsuccessful
completion Successful completion Total
Count 145 354 499% within Juvenile Has Been Picked Up By Police (collapsed catagories)
29.1% 70.9% 100.0%
Never Picked Up
% within Completion Status 54.9% 66.3% 62.5%
Picked Up Once Count 83 144 227% within Juvenile Has Been Picked Up By Police (collapsed catagories)
36.6% 63.4% 100.0%
% within Completion Status 31.4% 27.0% 28.4%
Multiple Times Picked Up
Count 36 36 72
% within Juvenile Has Been Picked Up By Police (collapsed catagories)
50.0% 50.0% 100.0%
Juvenile Has Been Picked Up By Police (collapsed catagories)(a)
% within Completion Status 13.6% 6.7% 9.0%
Total Count 264 534 798
% within Juvenile Has Been Picked Up By Police (collapsed catagories)
33.1% 66.9% 100.0%
a. 515 missing cases Table 71 – Completion Status and Juvenile Has Been Arrested Crosstabulation
Completion Status
Unsuccessful completion
Successful completion Total
75
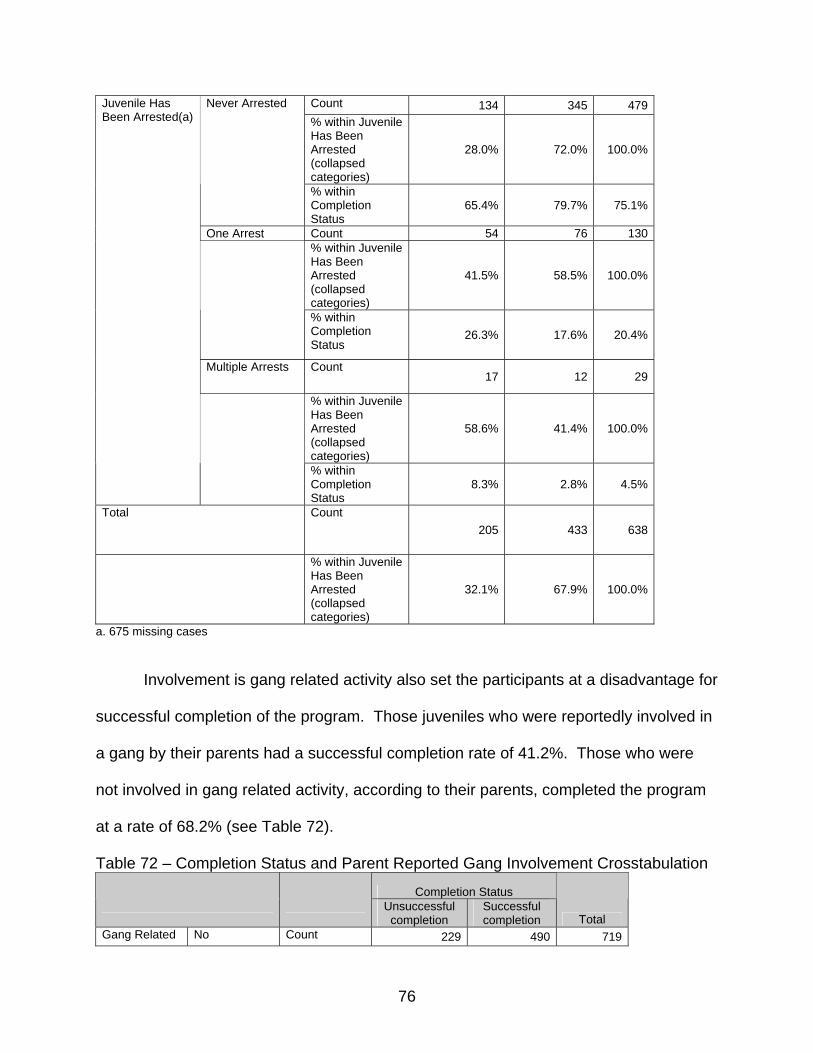
Count 134 345 479 % within Juvenile Has Been Arrested (collapsed categories)
28.0% 72.0% 100.0%
Never Arrested
% within Completion Status
65.4% 79.7% 75.1%
One Arrest Count 54 76 130 % within Juvenile Has Been Arrested (collapsed categories)
41.5% 58.5% 100.0%
% within Completion Status
26.3% 17.6% 20.4%
Multiple Arrests Count 17 12 29
% within Juvenile Has Been Arrested (collapsed categories)
58.6% 41.4% 100.0%
Juvenile Has Been Arrested(a)
% within Completion Status
8.3% 2.8% 4.5%
Total Count 205 433 638
% within Juvenile Has Been Arrested (collapsed categories)
32.1% 67.9% 100.0%
a. 675 missing cases Involvement is gang related activity also set the participants at a disadvantage for
successful completion of the program. Those juveniles who were reportedly involved in
a gang by their parents had a successful completion rate of 41.2%. Those who were
not involved in gang related activity, according to their parents, completed the program
at a rate of 68.2% (see Table 72).
Table 72 – Completion Status and Parent Reported Gang Involvement Crosstabulation
Completion Status
Unsuccessful completion
Successful completion Total
Gang Related No Count 229 490 719
76

% within Gang Related Activity
31.8% 68.2% 100.0%
% within Completion Status
88.4% 95.9% 93.4%
Yes Count 30 21 51 % within Gang Related Activity
58.8% 41.2% 100.0%
Activity(a)
% within Completion Status
11.6% 4.1% 6.6%
Total Count 259 511 770
% within Gang Related Activity
33.6% 66.4% 100.0%
a. 543 missing cases A good indicator of successful completion was employment on the part of the
participant. Those juveniles who had jobs completed the program in 75.9% of the cases
as opposed to 66.5% completion by those juveniles who did not have a job (see Table
73). Conversely, being previously fired from a job decreased the chances of successful
completion to 58.6% in comparison to those who had never been fired that completed
the program at a rate of 68.3% (see Table 74).
Table 73 – Completion Status and Juvenile is Employed Crosstabulation
Completion Status
Unsuccessful completion
Successful completion Total
Count 272 540 812% within Juvenile is currently employed
33.5% 66.5% 100.0%
No
% within Completion Status
92.8% 89.1% 90.3%
Yes Count 21 66 87% within Juvenile is currently employed
24.1% 75.9% 100.0%
Juvenile is currently employed(a)
% within Completion Status
7.2% 10.9% 9.7%
Total Count 293 606 899
% within Juvenile is currently 32.6% 67.4% 100.0%
77
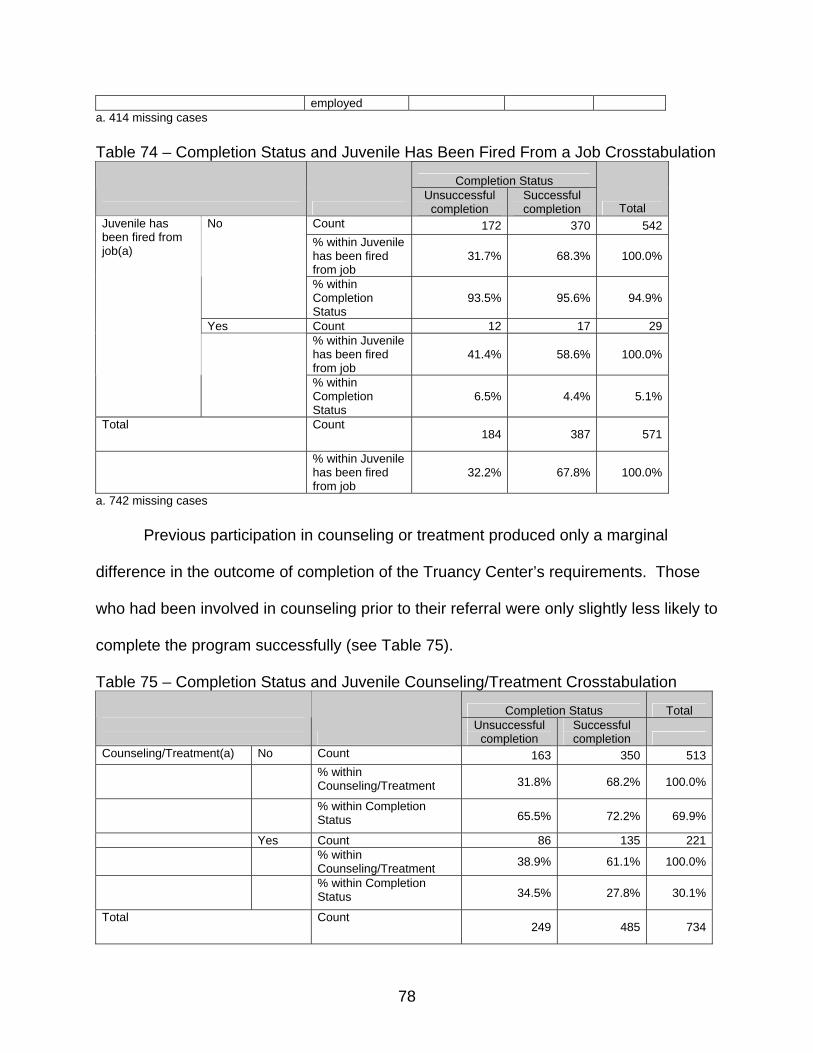
employed a. 414 missing cases Table 74 – Completion Status and Juvenile Has Been Fired From a Job Crosstabulation
Completion Status
Unsuccessful completion
Successful completion Total
Count 172 370 542% within Juvenile has been fired from job
31.7% 68.3% 100.0%
No
% within Completion Status
93.5% 95.6% 94.9%
Yes Count 12 17 29% within Juvenile has been fired from job
41.4% 58.6% 100.0%
Juvenile has been fired from job(a)
% within Completion Status
6.5% 4.4% 5.1%
Total Count 184 387 571
% within Juvenile has been fired from job
32.2% 67.8% 100.0%
a. 742 missing cases Previous participation in counseling or treatment produced only a marginal
difference in the outcome of completion of the Truancy Center’s requirements. Those
who had been involved in counseling prior to their referral were only slightly less likely to
complete the program successfully (see Table 75).
Table 75 – Completion Status and Juvenile Counseling/Treatment Crosstabulation
Completion Status Total
Unsuccessful completion
Successful completion
Counseling/Treatment(a) No Count 163 350 513 % within
Counseling/Treatment 31.8% 68.2% 100.0%
% within Completion Status 65.5% 72.2% 69.9%
Yes Count 86 135 221 % within
Counseling/Treatment 38.9% 61.1% 100.0%
% within Completion Status 34.5% 27.8% 30.1%
Total Count 249 485 734
78
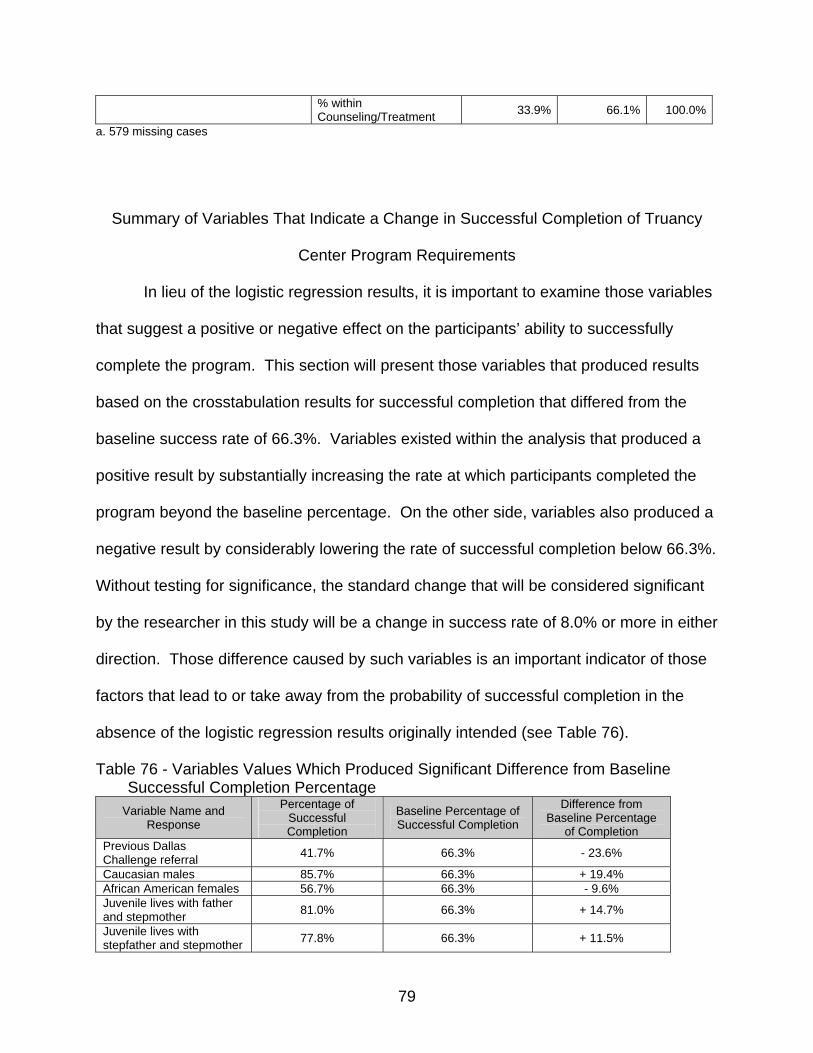
% within Counseling/Treatment 33.9% 66.1% 100.0%
a. 579 missing cases
Summary of Variables That Indicate a Change in Successful Completion of Truancy
Center Program Requirements
In lieu of the logistic regression results, it is important to examine those variables
that suggest a positive or negative effect on the participants’ ability to successfully
complete the program. This section will present those variables that produced results
based on the crosstabulation results for successful completion that differed from the
baseline success rate of 66.3%. Variables existed within the analysis that produced a
positive result by substantially increasing the rate at which participants completed the
program beyond the baseline percentage. On the other side, variables also produced a
negative result by considerably lowering the rate of successful completion below 66.3%.
Without testing for significance, the standard change that will be considered significant
by the researcher in this study will be a change in success rate of 8.0% or more in either
direction. Those difference caused by such variables is an important indicator of those
factors that lead to or take away from the probability of successful completion in the
absence of the logistic regression results originally intended (see Table 76).
Table 76 - Variables Values Which Produced Significant Difference from Baseline Successful Completion Percentage
Variable Name and Response
Percentage of Successful Completion
Baseline Percentage of Successful Completion
Difference from Baseline Percentage
of Completion Previous Dallas Challenge referral 41.7% 66.3% - 23.6%
Caucasian males 85.7% 66.3% + 19.4% African American females 56.7% 66.3% - 9.6% Juvenile lives with father and stepmother 81.0% 66.3% + 14.7%
Juvenile lives with stepfather and stepmother 77.8% 66.3% + 11.5%
79
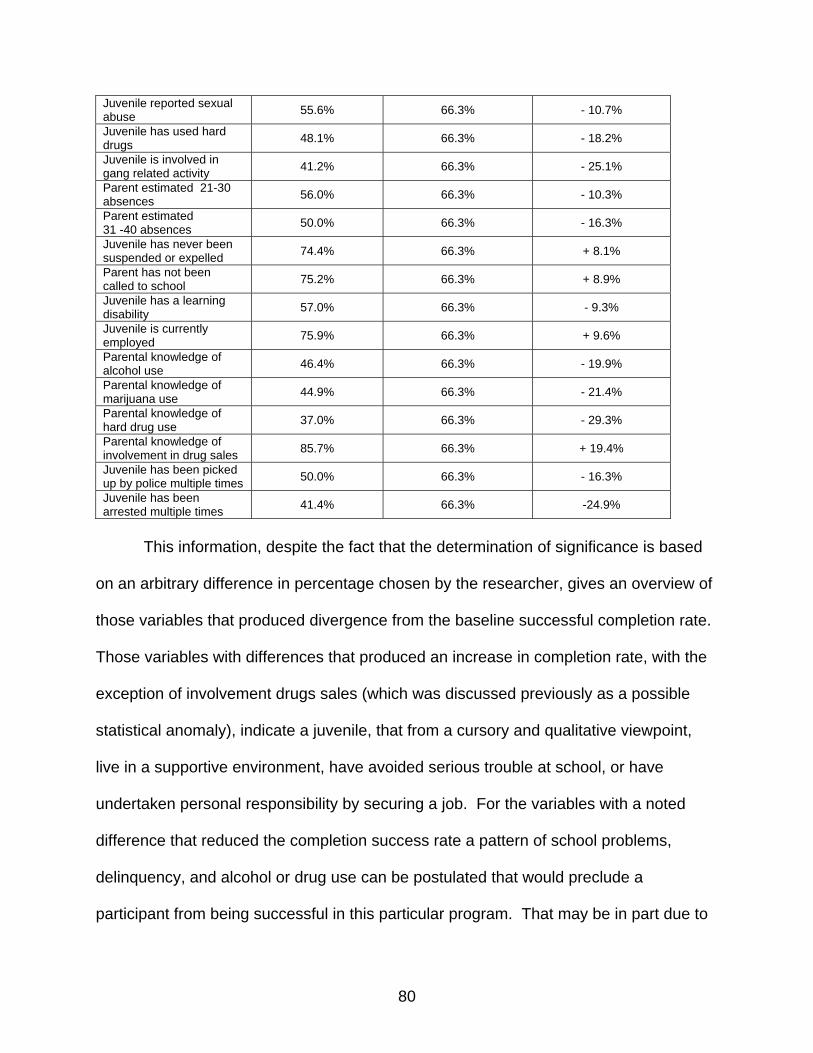
Juvenile reported sexual abuse 55.6% 66.3% - 10.7%
Juvenile has used hard drugs 48.1% 66.3% - 18.2%
Juvenile is involved in gang related activity 41.2% 66.3% - 25.1%
Parent estimated 21-30 absences 56.0% 66.3% - 10.3%
Parent estimated 31 -40 absences 50.0% 66.3% - 16.3%
Juvenile has never been suspended or expelled 74.4% 66.3% + 8.1%
Parent has not been called to school 75.2% 66.3% + 8.9%
Juvenile has a learning disability 57.0% 66.3% - 9.3%
Juvenile is currently employed 75.9% 66.3% + 9.6%
Parental knowledge of alcohol use 46.4% 66.3% - 19.9%
Parental knowledge of marijuana use 44.9% 66.3% - 21.4%
Parental knowledge of hard drug use 37.0% 66.3% - 29.3%
Parental knowledge of involvement in drug sales 85.7% 66.3% + 19.4%
Juvenile has been picked up by police multiple times 50.0% 66.3% - 16.3%
Juvenile has been arrested multiple times 41.4% 66.3% -24.9%
This information, despite the fact that the determination of significance is based
on an arbitrary difference in percentage chosen by the researcher, gives an overview of
those variables that produced divergence from the baseline successful completion rate.
Those variables with differences that produced an increase in completion rate, with the
exception of involvement drugs sales (which was discussed previously as a possible
statistical anomaly), indicate a juvenile, that from a cursory and qualitative viewpoint,
live in a supportive environment, have avoided serious trouble at school, or have
undertaken personal responsibility by securing a job. For the variables with a noted
difference that reduced the completion success rate a pattern of school problems,
delinquency, and alcohol or drug use can be postulated that would preclude a
participant from being successful in this particular program. That may be in part due to
80

the fact that the program is focused on intervening in behavior that is less serious than
these juveniles are already involved in and thus may put them at a disadvantage for
successful completion prior to their starting in the program.
81

CHAPTER 5 CONCLUSIONS AND DISCUSSION
The Dallas Challenge Truancy and Class C Enforcement Center provides
services to those juveniles who have exhibited chronic truant behavior and failure to
change that behavior when ordered to do so by a court of law in an attempt to change
problem behavior and enable the participants to return to school. To this end, it is in the
best interest of the program and the juveniles referred for services to target those
individuals who have the best hope of benefiting from the services provided, as is the
case with any intervention program such as the Truancy Center. The profile of a truant
juvenile referred to the Truancy Center and the identification of factors that contribute to
successful completion of the program resulting from this research is information that can
be used to evaluate the operation of the Truancy Center and to shape truancy
prevention and intervention efforts that are in use in other jurisdictions. Prior to
examining the application of this research back to the Truancy Center and discussing
how it can be generalized to other programs there are several limitations of the research
that, while previously mentioned, must be recognized and discussed in conjunction with
the conclusions drawn from the research.
Limitations Associated with Research Conclusions
First, issues associated with the integrity of the collection of data by agency
employees must be addressed. The Truancy Center utilized many employees to
conduct the intake procedures for participants, all of which presumably had their own
techniques and styles for asking, recording and archiving the information gathered from
the juveniles who were referred for services. This is evident in the manner that much of
82

the data was recorded in the agency database and then passed on for the purpose of
this research. It is also difficult to guarantee that each employee was diligent in making
sure that each participant fully understood every question posed during each individual
intake interview. With varying intake interview practices and the lack of standardized
documentation for responses there was a great deal of variance that was created within
the agency data by the Truancy Center’s employees.
Second, there are definitional issues associated with some of the questions that
are posed to each juvenile during his/her intake process. Each juvenile is asked about
previous nicotine use without indication that nicotine is defined to the juvenile as
cigarettes, snuff, or chewing tobacco. Another example of definitional problems occurs
with the question asked of parents regarding their child’s involvement in extracurricular
activities. When examining the open string variable in the agency data, activities such
as hanging out with friends were included in the described activities that the juveniles
participated in. The lack of clarification with regards to the definition of what activities
are extracurricular allowed for the inclusion of behavior that does not necessarily match
the definition of the term in question. The potential for an incorrect response because of
lack of understanding or clarification creates additional reliability issues within the
agency data.
Third, with regards to validity issues within the data provided by the Truancy
Center, missing data within each individual case file created the most significant
reliability and validity problem. Non-response to intake questions, do to the nature of
the self reported information, allowed for blanks within the agency files. Embarrassment
or reluctance to admit to further illegal behavior on the part of both the juveniles and
83

their parents that led to a refusal to respond to intake questions created holes within the
analyzable data. The failure to secure a response, or even indicate non-response, on
the part of agency employees who conducted intake interviews rendered the data
unusable for the originally intended logistical regression analysis because of the missing
data within each case.
Finally, the inability to perform a multivariate analysis drastically reduced the
ability of the results of this research’s efforts to explain the factors that contribute or
detract to successful completion of the program requirements. While there were most
definitely useful results produced through the crosstabulation comparisons, a
multivariate analysis would have illustrated the interactive effects that the included
variables played in predicting successful or unsuccessful outcomes. Being forced to
utilize the crosstabulation analysis made it impossible to determine the amount that any
given variable contributed to the completion outcome.
All of the above mentioned problems with the agency data contribute to the
limitations of the analysis of said data. The limitations and problems associated with the
data provided by the Truancy Center were not intentionally created by the agency, but
were instead the product of the real world application of a program to juveniles in need
versus the conditions that would exist in an ideal laboratory experiment. Intake data
was collected for use within the program context without consideration of possible
research applications later which can possibly explain the lack of attention to detail and
the design of the collection and record keeping methods. The situation created within
this research by the condition of the agency provided data was accepted as the reality
84

of working with a program of this nature and adaptations were made to salvage useable
results from the data that was available.
Implications of Analysis Results
When looking at the results of the analysis in a broad overview there is a
sweeping generalization that can be made about the findings, that being that there were
variables that did not appear to have an affect on program completion and there were
also variables which produced a change in successful or unsuccessful outcome (see
Table 77). The specific implications of each variables affect on program completion
cannot be made because of the lack of appropriate statistical results that would allow for
such conclusions to be drawn but it is possible to hypothesize about the possible cause
and effect relationships that exist between the individual variables, the variables as a
group, and program outcome. It is also appropriate to question the results of variables
that seem to contradict the logical affect that a particular variable would have on
successful completion.
Table 77 – Comparison of Percentages within Completion Status to Illustrate Effect on Program Completion
% within Completion Status Variable Name Variable Value Unsuccessful
Completion Successful Completion
Difference
Sex Male 39.5% 49.7% 10.2% Female 60.5% 50.3% 10.2% Ethnicity African American 38.0% 29.5% 8.5% Caucasian 4.8% 7.1% 2.3% Hispanic 55.8% 62.4% 6.6% Other 1.4% 1.0% .4% Age 15.34 years 15.54 years .2 years Previous Dallas Challenge referral Yes 4.7% 1.7% 3.0%
Estimation of absences 0 – 10 absences 58.3% 67.7% 9.4% 11 – 20 absences 17.7% 14.1% 3.6% 21 – 30 absences 11.5% 7.3% 4.2% 31 – 40 absences 5.2% 2.6% 2.6% 40 + absences 7.3% 8.3% 1.0%
85

Juvenile has been suspended/expelled Yes 68.3% 55.6% 12.7%
Parent has been called to school for juvenile behavior Yes 75.9% 62.3% 13.6%
Juvenile has a learning disability Yes 32.7% 22.0% 10.7%
Juvenile is in special education classes Yes 20.8% 14.5% 6.3%
Juvenile has failed a grade in school
Yes (one or multiple grades) 23.3% 24.2% .9%
Juvenile is involved in extra-curricular activities Yes 48.5% 53.2% 4.7%
Parental marital status Married 42.8% 48.2% 5.4% Parent employment status Employed 80.5% 84.8% 4.3% Parent’s spouse employment status Employed 48.8% 56.0% 7.2%
Number of children in household 3.17 3.17 0.0
Age eligible children in school Yes 95.4% 96.1% .7% Family medical insurance Yes 40.6% 38.4% 2.2% Family member with criminal involvement/arrest Yes 28.8% 28.1% .7%
Juvenile nicotine use Yes 17.8% 13.3% 4.5% Age of first nicotine use 12.29 years 12.72 years .43 years Juvenile alcohol use Yes 20.8% 16.1% 4.7% Age of first alcohol use 12.14 years 12.42 years .28 years Parental knowledge of alcohol use Yes 18.9% 8.6% 10.3%
Juvenile marijuana use Yes 19.2% 14.0% 5.2% Age of first marijuana use 12.36 years 12.47 years .11 years Parental knowledge of marijuana use Yes 34.5% 14.3% 20.2%
Juvenile hard drug use Yes 6.3% 3.0% 3.3% Age of first hard drug use 13.07 years 13.23 years .16 years Parental knowledge of hard drug use Yes 7.2% 2.2% 5.0%
Parental knowledge of involvement in drug sales Yes .4% 1.2% .8%
Juvenile reported abuse Yes 11.5% 11.8% .3% Juvenile reported emotional abuse Yes 74.5% 76.7% 2.2%
Juvenile reported physical abuse Yes 41.2% 42.7% 1.5%
Juvenile reported sexual abuse Yes 39.2% 24.3% 14.9% Juvenile has been picked up police
Yes (once or multiple times) 45.0% 33.7% 11.3%
Juvenile has been arrested Yes (once or multiple times) 34.6% 20.4% 14.2%
Parent reported gang involvement Yes 11.6% 4.1% 7.5%
Juvenile is employed Yes 7.2% 10.9% 3.7% Juvenile has been fired from a job Yes 6.5% 4.4% 2.1%
Juvenile has been in counseling/treatment Yes 34.5% 27.8% 6.7%
When the percentage within the completion status is examined it appears that
there is little difference between the successful and unsuccessful completion outcomes
86

for many of the variables analyzed. Those variables that do indicate a difference
between the successful and unsuccessful completion groups are primarily factors that
would indicate that the juvenile has engaged in behavior that would intuitively put them
at a greater disadvantage for being successful in an intervention program like the
Truancy Center. Variables that would indicate problems at school, interaction with the
police, and parental knowledge of alcohol or drug use generated the greatest difference
between the successful and unsuccessful participant groups. The converse of that
hypothesis is also assumable, in that the participants who have avoided problem
behavior and have a strong support system, attachment to school or other activities,
and a sense of responsibility prior to referral to the Truancy Center will have the highest
likelihood of completing the program requirements successfully.
There are also results that contradict logic based on their apparent lack of
influence, or even an inverse relationship, on successful completion of the program.
Variables such as grades failed, family member that is involved in criminal activity,
parent reported gang involvement, and the age differences between the
successful/unsuccessful participants for age of first alcohol and drug use showed little
difference between the two possible completion outcomes. The variables of
involvement in drug sales, estimated absences in excess of 40, and juvenile reported
emotional and physical abuse which indicated a inverse relationship that is
counterintuitive to what would be expected are even more perplexing results. There are
several possible explanations for the apparent inconsistencies resulting from the
comparison of outcomes.
87
The Truancy Center utilizes a multitude of resources and programs to outsource
participants for services. As mentioned previously, each participant receives a personal
program plan upon intake that is tailored to the individual needs of the juvenile. While
the Truancy Center has standard programs that are mandated for nearly all of the
participants there is also the potential for each juvenile to receive additional services to
accommodate special needs. This information was unavailable to include with the
analysis and could possibly explain variation in program outcome if those juveniles with
specialized needs participated in programs that addressed their needs more effectively
than a participant who was only mandated to minimal program requirements.
Another possible explanation for the divergent results is related, once again, to
the validity and reliability of the data and the ability for its use to produce results. For
example, the data regarding drug use that was reported by both the juveniles and their
parents has produced differing results upon analysis. Juvenile reported information
indicated that the use of nicotine, alcohol, and drugs produced little difference between
the two possible program completion outcomes. The results from the parent reported
information concerning alcohol and drug use indicated a far greater difference between
the successful and unsuccessful completion groups. The fact that there are
discrepancies and contradicting information that came out of the analysis gives cause to
question the validity of the data used and the resulting output. Despite the apparent
shortcomings of the data and analysis results, it is still possible to use the information to
propose theoretical conclusions based on the results.
88

Generalization of Results to the Truancy Center and Beyond
With regard to the Truancy Center specifically, the results draw attention to the
population that is most likely to be referred to the program for services in the form of the
profile generated from the sample population. This is a profile that can be generalized
back to the population from which the original sample was drawn, that being students of
the Dallas Independent School District. This profile should not only be used to identify
those juveniles who are at immediate risk for truant behavior but also to forecast for
individuals who exhibit risk factors that lead to truancy.
Efforts to recognize and address actions of those juveniles from minority ethnic
groups who exhibit minor problem behavior in school should be made to avoid
escalating behavior that will later require referral to programs such as the Truancy
Center. Early identification of minor problems and the ability of teachers to put young
students on the right track have the potential to prevent far more truancy than any
program that attempts to intervene in the life of a child who has already exhibited the
behavior. While the profile of a truant can be useful in the program setting, the potential
for its use as a tool for raising awareness of the factors that contribute to truancy is far
more useful if that information is put into an action plan for addressing behavior prior to
it developing into serious conduct.
The identification of factors that predict success in completion of the Truancy
Center’s program requirements is valuable information for the purpose of operation and
selection of individuals who are appropriate for receipt of services. By recognizing
factors and characteristics that place an individual at a lower probability of success
89

within the program upon intake, case managers can better tailor program services to the
needs of the individual. This is a technique that is already in place within the program,
but by increasing the understanding of the factors that substantially reduce likelihood of
success can only improve the ability of program staff to serve its participants.
Also, by identifying the factors that seriously inhibit the ability of a juvenile to be
successful in completing the program it is possible to identify those individuals who may
require more specialized or intensive services than the Truancy Center has at its
disposal. If a juvenile exhibits multiple characteristics that have been determined to
inhibit completion of the program such as drug and alcohol use, serious problem
behavior at school, police interaction or arrest, or gang involvement he/she may be at a
point where truancy intervention will have little possibility of changing his/her behavior.
It must be acknowledged that there were very few variables that lowered the successful
rate of completion below 50%, but those variables that produced such results were
behavior that crosses the line of minor problem or status offense into delinquent actions.
Upon recognition of such issues, it may be appropriate for Truancy Center staff to
recommend that the juvenile participate in an alternative program that is designed to
address the more serious issues that face the child. This is not to say that individuals
that fall into this grouping could not experience benefit from Truancy Center services,
but if truancy is the least serious of their problem behaviors, there may be little benefit
gained from attacking the problem from the angle of truancy intervention.
The results of this research apply to other outside programs in much the same
manner that it relates back to the Truancy Center. For any truancy intervention or
prevention program, it is important to remember what the goals of the program are and
90

to maintain practices that are in line with achieving those goals. This research has
provided a profile of truancy that could be applied to juveniles in any metropolitan
jurisdiction that bears resemblance to the Dallas area to identify juveniles who are at
risk for developing truant behavior. More so, the identification of factors that limit
success in a program of this nature can provide a framework for other programs to limit
participation based on the presence of attributes that reduce likelihood of completion.
Future Research in Truancy Prevention and Intervention
The limitations of truancy research were previously mentioned and this project
made a minimal expansion upon that body of research. For future truancy research to
be truly valuable in determining the benefit of truancy prevention and intervention
programs it most be longitudinal in nature to determine the long term effect of such
programs on the clientele who receive services. Future research should include
survival information to indicate whether participants who successfully completed a
truancy prevention/intervention program were able to reduce school absences after
completion, complete high school, or avoid escalation to delinquent or criminal behavior.
Research has been conducted to determine if delinquents and adult criminals
had a history of school problems, including truancy, prior to criminal activity (see
Huizinga, Loeber, and Thornberry 1994; Huizinga, Loeber, Thornberry, and Cothern
2000). Such research has experienced difficulty in establishing whether school
problems lead to delinquency and criminality or vice versa. Longitudinal research
following completion of a truancy program would help to solidify the nature of truancy’s
relationship to delinquency and criminal activity. Research regarding those individuals
91

who fail to successfully complete a truancy program and the future consequences that
do or do not befall them would also be beneficial in determining the effectiveness of
truancy prevention and intervention efforts.
It is important that the future of truancy research continue to branch out beyond
the limited studies that have been conducted to date. With the potential to understand
how truancy, as a status offense, plays a role in the development of delinquency and
criminal behavior this is a subject that deserves to be explored in greater depth.
92
REFERENCES
Baker, M., J. Sigmon, M. Nugnet. 2001. “Truancy Reduction: Keeping Students in
School.” Office of Juvenile Justice and Delinquency Prevention, United States
Department of Justice.
Bell, A., L. Rosen, and D. Dynlacht. 1994. “Truancy Intervention.” The Journal of
Research and Development in Education. 27:203-211.
“Best Practice in Developing Truancy Reduction Programs.” 2002. Colorado Foundation
for Families and Children. www.coloradofoundation.org.
Bilchik, S. 1995. “Delinquency - Prevention Works.” Office of Juvenile Justice and
Delinquency Prevention, United States Department of Justice.
Bos, K., A. Ruijters, A. Visscher. 1990. “Truancy, Drop-out, Class Repeating and Their
Relation With School Characteristics.” Educational Research. 32:175-185.
Brown, T., J. Schulenberg, J. Bachman, P. O’Malley, and L. Johnston. 2001. “Are Risk
and Protective Factors for Substance Use Consistent Across Historical Time?:
National Data from the High School Classes of 1976 through 1997.” Prevention
Science: The Official Journal of the Society for Prevention Research 2:29-43.
Carr, M., and T. Vandiver. 2001. “Risk and Protective Factors Among Youth
Offenders.” Adolescence 36:409-426.
Chamberlain, P. and S. Mihalic. 1998. Blueprints for Violence Prevention - Book Eight
- Multidimensional Treatment Foster Care. Golden, CO: Venture Publishing.
Cottle, C., R. Lee, K. Heilbrun. 2001. “The Prediction of Criminal Recidivism in
Juveniles - A Meta-Analysis.” Criminal Justice and Behavior 28:367-394.
93
Davies, S. 2000. “Truancy Program Targets Problems Before They Start: Chanute Wins
1995 Bill Koch Community Safety Award.” Koch Crime Institute.
www.kci.org/chanute.htm
Duncan, S., T. Duncan, and L. Strycker. 2000. “Risk and Protective Factors Influencing
Adolescent Problem Behavior: A Multivariate Latent Growth Curve Analysis.”
Annals of Behavioral Medicine: A Publication of the Society of Behavioral
Medicine 22:103-109.
DeKalb, J. 1999. “Student Truancy. ERIC Digest, Number 125.” ERIC Digests
ED429334.
Ellis, R. and K. Sowers. 2001. Juvenile Justice Practice - A Cross-Disciplinary
Approach to Intervention. Stamford, CT: Thompson Learning.
ERIC Digests. 1997. “Urban Policies and Program to Reduce Truancy. ERIC/CUE
Digest, Number129.” ERIC Digests. ED415306.
Fergusson, D., M. Lynskey, and L. Horwood. 1996. “The Short-term Consequences of
Early Onset Cannabis Use.” Journal of Abnormal Child Psychology 24:499-512.
Fritsch, E., T. Caeti, R. Taylor. 1999. “Gang Suppression Through Saturation Patrol,
Aggressive Curfew, and Truancy Enforcement: A Quasi-Experimental Test of the
Dallas Anti-Gang Initiative.” Crime & Delinquency. 45:122-139.
Gabb, S. 1997. “Truancy: Its Measurement and Causation – A Brief Review of the
Literature.” The Report of the North London Truancy Unit. adapted from Ch 2.
Garry, E. 1996. “Truancy: A First Step to a Lifetime of Problems.” Office of Juvenile
Justice and Delinquency Prevention, United States Department of Justice.
94

Gonzales, R. and Godwin Mullins, T. 2004. “Addressing Truancy in Youth Court
Programs.” Selected Topics on Youth Courts: A Monograph. Office of Juvenile
Justice and Delinquency Prevention, United States Department of Justice.
Hallfors, D., J. Vevea, B. Iritani, H. Cho, S. Khatapoush, and L. Saxe. 2002. “Truancy,
Grade Point Average, and Sexual Activity: A Meta-Analysis of Risk Indicators for
Youth Substance Use.” The Journal of School Health 72:205-211.
Hawkins, J., T. Herrenkohl, D. Farrington, D. Brewer, R. Catalano, T. Harachi, and L.
Cothern. 2000. “Predictors of Youth Violence.” Office of Juvenile Justice and
Delinquency Prevention, United States Department of Justice.
Heilbrunn, J. 2004. “Juvenile Detention for Colorado Truants: Exploring the Issues.”
The National Center for School Engagement, Colorado Foundation for Families
and Children.
Heilbrun, K., W. Brock, D. Waite, A. Lanier, M. Schmid, G. Witte, M. Keeney, M.
Westendorf, L. Buinavert, and M. Shumate. 2000. “Risk Factors for Juvenile
Criminal Recidivism - The Postrelease Community Adjustment of Juvenile
Offenders.” Criminal Justice and Behavior 27:275-291.
Herrenkohl, T., E. Maguin, K. Hill, J. Hawkins, R. Abbott, and R. Catalano. 2000.
“Developmental Risk Factors for Youth Violence.” The Journal of Adolescent
Health: Official Publication of the Society for Adolescent Medicine 26:176-186.
Hibbett, A., K. Fogelman, and O. Manor. 1990. “Occupational Outcomes of Truancy.”
The British Journal of Educational Psychology 60:23-36.
95
Holmes, S., J. Slaughter, and J. Kashani. 2001. “Risk Factors in Childhood That Lead
to the Development of Conduct Disorder and Antisocial Personality Disorder.”
Child Psychiatry and Human Development 31:183-193.
Huizinga, D., R. Loeber, and T. Thorneberry. 1994. “Urban Delinquency and
Substance Abuse: Initial Findings.” Office of Juvenile Justice and Delinquency
Prevention, United States Department of Justice.
Huizinga, D., R. Loeber, T. Thorneberry, and L. Cothern. 2000. “Co-occurrence of
Delinquency and Other Problem Behaviors.” Office of Juvenile Justice and
Delinquency Prevention, United States Department of Justice.
“Introduction.” 2002. Koch Crime Institute. www.kci.org/publication/sji/introduction.htm
Jessor, R. 1992. “Risk Behavior in Adolscence: A Psychosocial Framework for
Understanding and Action.” Pp. 138-143 in Adolescents at Risk: Medical and
Social Perspectives, edited by D. Rodgers and E. Ginzburg. Boulder, CO:
Westview Press.
“Manual to Combat Truancy.” 1996. United States Department of Education, United
States Department of Justice.
Mueller, J. auditor. 2000. “A Best Practices Review: Truancy Reduction Efforts” State of
Wisconsin. Legislative Audit Bureau.
Najaka, S., D. Gottfredson, and D. Wilson. 2001. “A Meta-analytic Inquiry into the
Relationship Between Selected Risk Factors and Problem Behavior.” Prevention
Science: The Official Journal of the Society fro Prevention Research 2:257-271.
National Center for Education Statistics. 2003. Digest of Education Statistics 2003.
U.S. Department of Education, Office of Research and Improvement.
96
Paetsch, J., and L. Bertrand. 1997. “The Relationship Between Peer, Social, and
School Factors, and Delinquency Among Youth.” The Journal of School Health
67:27-32.
Pappas, J. 1996. “Truancy, a New Twist.”
Pritchard, C., A. Cotton, and M. Cox. 1992. “Truancy and Illegal Drug Use, and
Knowledge of HIV Infection in 932 14-16 Year-old Adolescents.” Journal of
Adolescence 15:1-17.
Schultz, R. 1987. “Truancy: Issues and Interventions.” Behavioral Disorders. 12:117-
130.
Sommer, B. 1985b. “What’s Different About Truants? A Comparison Study of Eighth-
Graders.” Journal of Youth and Adolescence. 14:411-423.
Sommer, B. 1985a. “Truancy in Early Adolescence.” Journal of Early Adolescence. 5:
145-160.
Stouthamer-Loeber, M., R. Loeber, E. Wei, D. Farrington, and P. Wikstrorm. 2002.
“Risk and Promotive Effects in the Explanation of Persistent Serious Delinquency
in Boys.” Journal of Consulting and Clinical Psychology 70:111-123.
Swadi, H. 1992. “Relative Risk Factors in Detecting Adolescent Drug Abuse.” Drug
and Alcohol Dependence 29:253-254.
Taylor, R., E. Fritsch, and T. Caeti. 2002. Juvenile Justice Policies, Program, and
Practices. New York: Glencoe McGraw-Hill.
“Truancy.” 1998. Gale Encyclopedia of Childhood and Adolescence.
www.findarticles.com/cf_0/g2602/0005/2602000545/print.jhtml.
97
“Truancy – Dealing with a School, Community and National Problem.” 2002. Koch
Crime Institute. www.kci.org/seminars/modules/sv012.htm.
“Truancy: Guide to Community-Based Alternatives for Low-Risk Juvenile Offenders.”
2002. Koch Crime Institute. www.kci.org/publication/sji/intro.htm/truancy/htm.
“Truancy Prevention and Diversion Program.” 2002. Koch Crime Institute.
www.kci.org/publication/sji/programs/trunacy_prevention.htm
Welsch, W., P. Jenkins, P. Harris. 1999. “Reducing Minority Overrepresentation in
Juvenile Justice: Results of Community-Based Delinquency Prevention in
Harrisburg.” Journal of Research in Crime and Delinquency. 36: 87-110.
“WESTMARC Truancy Division Partnership.” 2002. Koch Crime Institute.
www.kci.org/publication/sji/programs/westmarc_truancy.htm.
White, M., J. Fyfe, S. Campbell, J. Goldkamp. 2001. “The School – Police Partnership:
Identifying At-Risk Youth Through a Truant Recovery Program.” Evaluation
Review. 25:507-532.
98