trtviewer: monitoring and diagnostic tool for the trt ... · 52 s.yu. smirnov and v.o. tikhomirov /...
TRANSCRIPT
Physics Procedia 74 ( 2015 ) 51 – 58
Available online at www.sciencedirect.com
1875-3892 © 2015 The Authors. Published by Elsevier B.V. This is an open access article under the CC BY-NC-ND license (http://creativecommons.org/licenses/by-nc-nd/4.0/).Peer-review under responsibility of the National Research Nuclear University MEPhI (Moscow Engineering Physics Institute)doi: 10.1016/j.phpro.2015.09.203
ScienceDirect
Conference of Fundamental Research and Particle Physics, 18-20 February 2015, Moscow,Russian Federation
TRTViewer: monitoring and diagnostic tool for the TRT detector of
the ATLAS experiment at LHC
S.Yu. Smirnova, V.O. Tikhomirova,b,∗aNational Research Nuclear University MEPhI (Moscow Engineering Physics Institute), Kashirskoye shosse 31, Moscow, 115409, Russia
bP.N. Lebedev Physical Institute of the Russian Academy of Sciences, Leninskij Prospekt 53, Moscow, 119991, Russia
Abstract
TRTViewer is the dedicated software tool for monitoring of the ATLAS Transition Radiation Tracker (TRT) performance at dif-
ferent electronics levels: individual channels, readout chips or electronic boards. It can use several sources of input information –
from direct DAQ stream or raw data files to ROOT files with processed analysis histograms. Using TRTViewer one can quickly
estimate the TRT operational parameters – occupancy, efficiency, timing, reveal problematic regions with noisy, dead or inefficient
channels, check calibration uniformity, etc. This tool is widely used by shifters in ATLAS Control Room and also by TRT experts
during electronics installation, tuning, operation control and express-offline data analysis.c© 2015 The Authors. Published by Elsevier B.V.
Peer-review under responsibility of the National Research Nuclear University MEPhI (Moscow Engineering Physics Institute).
Keywords: ATLAS; TRT; monitoring software
1. Introduction
Transition Radiation Tracker (TRT) is the outermost part of ATLAS Inner Detector (ID). The main detecting
element of the TRT are 4-mm in diameter thin-wall proportional drift tubes – straws, filled by Xe-based gas mixture.
The TRT has close to 300,000 straws with around 350,000 electronic readout channels. Two main TRT tasks are
providing continuous tracking in the outer part of ID and identification of particles with high Lorentz factor – mainly
electrons. The latter is achieved through the detection of transition radiation photons generated by charged particles
in polymer fibers or foils that fill the space between straws. TRT provides in average 35 coordinate measurements on
track with ∼130 μm spatial resolution and pion rejection factor ∼100 at 90% of electron registration efficiency. The
detailed description of the TRT detector can be found in [1–3].
To control the operation of such a complex and large-scale detector during commissioning, collision data-taking
periods, or tests during LHC shutdowns, the continuous TRT monitoring is absolutely necessary. It is being done using
various software and hardware tools. One of such tools – TRTViewer package – has been developed for monitoring of
∗ Corresponding author. Tel: +7-499-132-6032; fax: +7-499-135-7880.
E-mail address: [email protected]
© 2015 The Authors. Published by Elsevier B.V. This is an open access article under the CC BY-NC-ND license (http://creativecommons.org/licenses/by-nc-nd/4.0/).Peer-review under responsibility of the National Research Nuclear University MEPhI (Moscow Engineering Physics Institute)
52 S.Yu. Smirnov and V.O. Tikhomirov / Physics Procedia 74 ( 2015 ) 51 – 58
TRT performance at different hardware levels: individual channels, readout chips or electronic boards. The program
is written in C++ with a wide usage of ROOT libraries [4].
The TRTViewer has proved to be a very helpful and efficient tool for fast detector diagnostics. It is widely used
both by shifters in the ATLAS Control Room (ACR) and also by TRT experts during read-out electronics installation,
tuning and operation control. Short review of the TRTViewer can be found in [5]. This paper presents more detailed
description of the package.
2. Basic concept
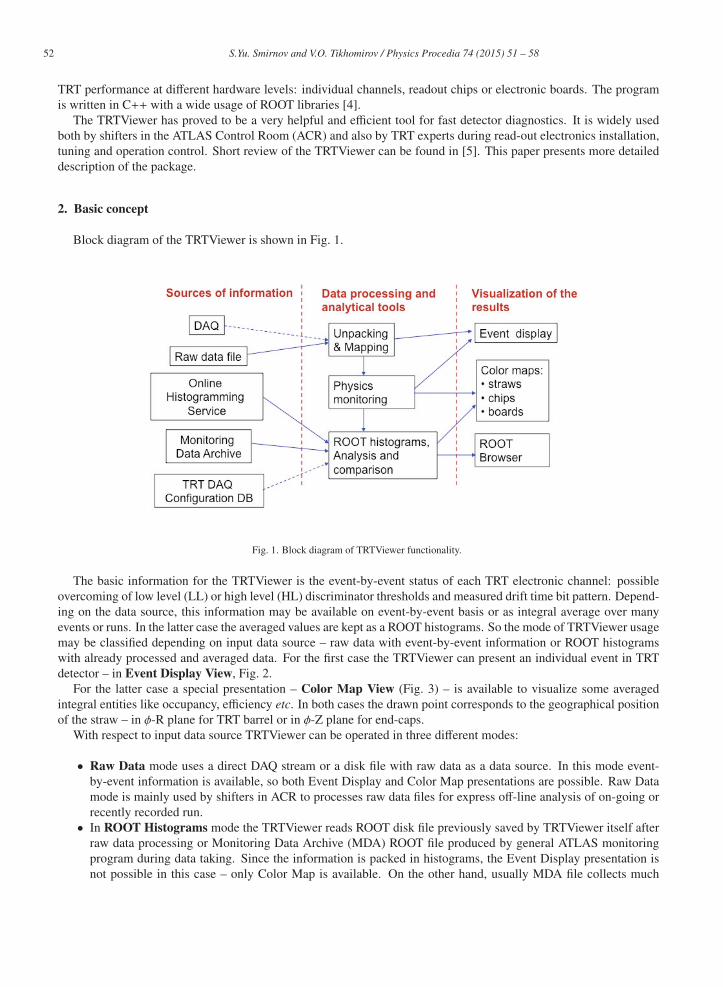
Block diagram of the TRTViewer is shown in Fig. 1.
Fig. 1. Block diagram of TRTViewer functionality.
The basic information for the TRTViewer is the event-by-event status of each TRT electronic channel: possible
overcoming of low level (LL) or high level (HL) discriminator thresholds and measured drift time bit pattern. Depend-
ing on the data source, this information may be available on event-by-event basis or as integral average over many
events or runs. In the latter case the averaged values are kept as a ROOT histograms. So the mode of TRTViewer usage
may be classified depending on input data source – raw data with event-by-event information or ROOT histograms
with already processed and averaged data. For the first case the TRTViewer can present an individual event in TRT
detector – in Event Display View, Fig. 2.
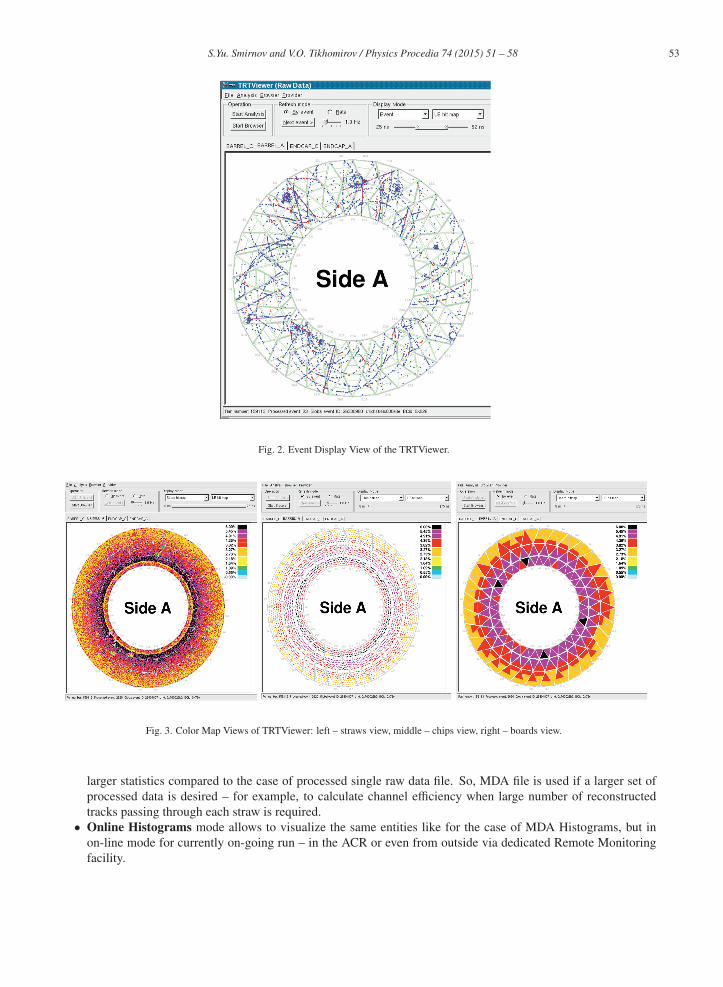
For the latter case a special presentation – Color Map View (Fig. 3) – is available to visualize some averaged
integral entities like occupancy, efficiency etc. In both cases the drawn point corresponds to the geographical position
of the straw – in φ-R plane for TRT barrel or in φ-Z plane for end-caps.
With respect to input data source TRTViewer can be operated in three different modes:
• Raw Data mode uses a direct DAQ stream or a disk file with raw data as a data source. In this mode event-
by-event information is available, so both Event Display and Color Map presentations are possible. Raw Data
mode is mainly used by shifters in ACR to processes raw data files for express off-line analysis of on-going or
recently recorded run.
• In ROOT Histograms mode the TRTViewer reads ROOT disk file previously saved by TRTViewer itself after
raw data processing or Monitoring Data Archive (MDA) ROOT file produced by general ATLAS monitoring
program during data taking. Since the information is packed in histograms, the Event Display presentation is
not possible in this case – only Color Map is available. On the other hand, usually MDA file collects much
S.Yu. Smirnov and V.O. Tikhomirov / Physics Procedia 74 ( 2015 ) 51 – 58 53
Fig. 2. Event Display View of the TRTViewer.
Fig. 3. Color Map Views of TRTViewer: left – straws view, middle – chips view, right – boards view.
larger statistics compared to the case of processed single raw data file. So, MDA file is used if a larger set of
processed data is desired – for example, to calculate channel efficiency when large number of reconstructed
tracks passing through each straw is required.
• Online Histograms mode allows to visualize the same entities like for the case of MDA Histograms, but in
on-line mode for currently on-going run – in the ACR or even from outside via dedicated Remote Monitoring
facility.

54 S.Yu. Smirnov and V.O. Tikhomirov / Physics Procedia 74 ( 2015 ) 51 – 58
3. TRTViewer GUI
When the TRTViewer is running in graphical mode, it is operated via Graphical User Interface (GUI) (Fig. 4). If
launched with DAQ or raw data source, it gives a choice: user can click on the “Next Event” button to display (and
process) single TRT event or switch to “Rate” radio button to process and display event-by-event or click to “Start
Analysis” button to start continuous data analysis without events displaying – to speed up the processing. Later on the
user can switch between these modes at any time during data processing.
Fig. 4. TRTViewer GUI.
“BARREL C”, “BARREL A”, “ENDCAP C” and “ENDCAP A” tabs can be used to switch between views of
different TRT partitions. Two “Display Mode” menus are intended to choose display mode – Event Display or Color
Map and for the latter case to select the entity, which is displayed as a color map. User can also change the scale of
displayed entity via gamut on the top of main TRTViewer window or via “Gamut scale” sliders.
“Map mode” radio button can be used if the current data are compared with the reference set. It allows to switch
between data which are displayed as a color map: “Current”, “Reference” or “Difference”.
“Start Browser” button can be used to open ROOT browser to inspect histograms filled during raw data analysis or
contained in the input ROOT file or in Online Histograms stream (see section 6).
On the top left corner of GUI there is a set of menus – “File”, “Analysis”, “Browser” and “Provider”. Some of
menu items just duplicate the buttons mentioned previously. The rest is dedicated for relatively rarely used operations.
When processing raw data or connecting directly to DAQ stream, the TRTViewer can also be launched without
GUI (– –nogui option in the command line). In this case the TRTViewer will run in batch mode and process the input
file or DAQ stream till the end of file or end of DAQ stream. As a result we will have output ROOT file with collected
histograms. This file can be used later as an input for the TRTViewer to display corresponding color maps or as a
reference set.
S.Yu. Smirnov and V.O. Tikhomirov / Physics Procedia 74 ( 2015 ) 51 – 58 55
4. Event Display View
Event Display View mode is available when the TRTViewer is launched with direct DAQ stream or raw data file
as the input. In the Event Display View each drawn point represents TRT straw with Low Level – in blue color, or
High Level – in red color – signal in the current event. It can also show some reconstructed tracks, if this option is
switched on in the configuration file. Status bar in the bottom provides some information about current event: run
number, event number, level 1 trigger (L1id) and bunch crossing (BCid) identifiers (Fig. 2).
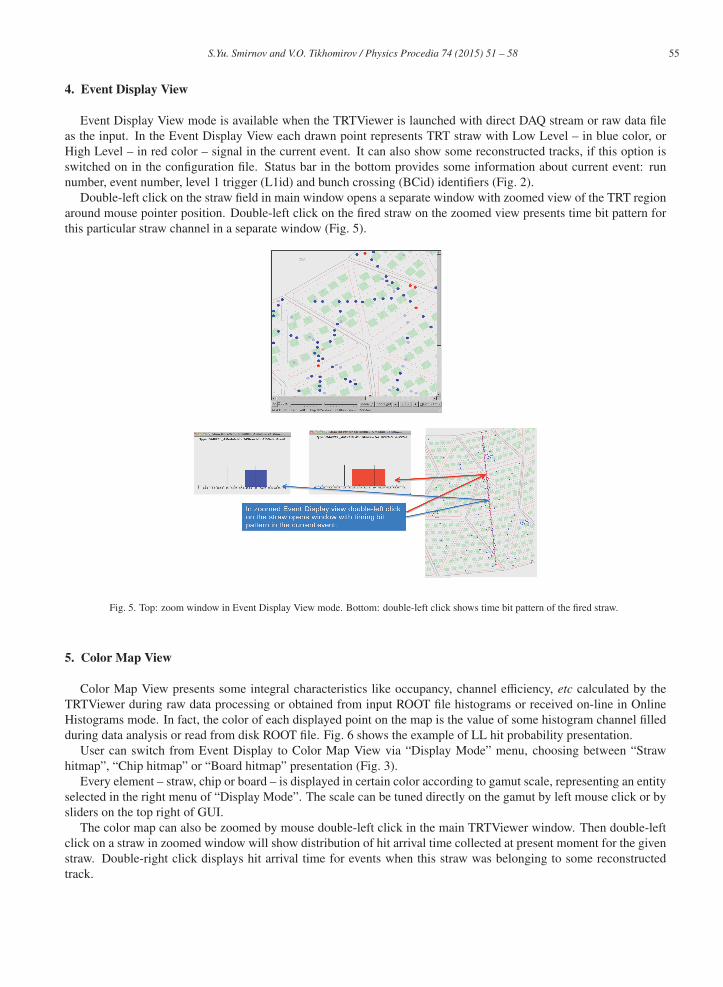
Double-left click on the straw field in main window opens a separate window with zoomed view of the TRT region
around mouse pointer position. Double-left click on the fired straw on the zoomed view presents time bit pattern for
this particular straw channel in a separate window (Fig. 5).
Fig. 5. Top: zoom window in Event Display View mode. Bottom: double-left click shows time bit pattern of the fired straw.
5. Color Map View
Color Map View presents some integral characteristics like occupancy, channel efficiency, etc calculated by the
TRTViewer during raw data processing or obtained from input ROOT file histograms or received on-line in Online
Histograms mode. In fact, the color of each displayed point on the map is the value of some histogram channel filled
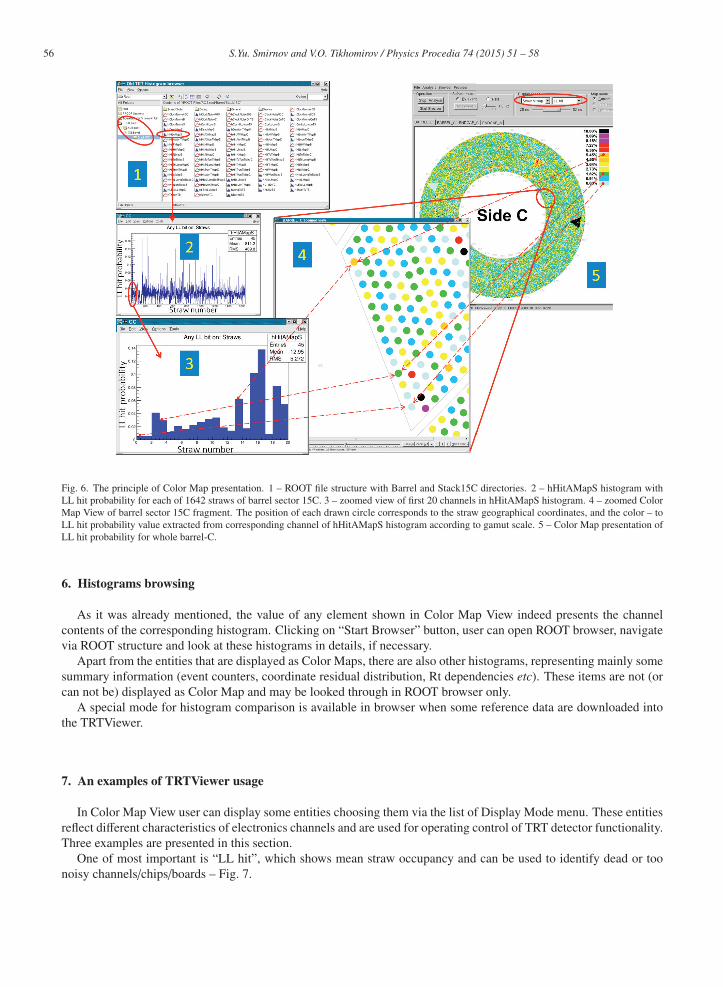
during data analysis or read from disk ROOT file. Fig. 6 shows the example of LL hit probability presentation.
User can switch from Event Display to Color Map View via “Display Mode” menu, choosing between “Straw
hitmap”, “Chip hitmap” or “Board hitmap” presentation (Fig. 3).
Every element – straw, chip or board – is displayed in certain color according to gamut scale, representing an entity
selected in the right menu of “Display Mode”. The scale can be tuned directly on the gamut by left mouse click or by
sliders on the top right of GUI.
The color map can also be zoomed by mouse double-left click in the main TRTViewer window. Then double-left
click on a straw in zoomed window will show distribution of hit arrival time collected at present moment for the given
straw. Double-right click displays hit arrival time for events when this straw was belonging to some reconstructed
track.
56 S.Yu. Smirnov and V.O. Tikhomirov / Physics Procedia 74 ( 2015 ) 51 – 58
Fig. 6. The principle of Color Map presentation. 1 – ROOT file structure with Barrel and Stack15C directories. 2 – hHitAMapS histogram with
LL hit probability for each of 1642 straws of barrel sector 15C. 3 – zoomed view of first 20 channels in hHitAMapS histogram. 4 – zoomed Color
Map View of barrel sector 15C fragment. The position of each drawn circle corresponds to the straw geographical coordinates, and the color – to
LL hit probability value extracted from corresponding channel of hHitAMapS histogram according to gamut scale. 5 – Color Map presentation of
LL hit probability for whole barrel-C.
6. Histograms browsing
As it was already mentioned, the value of any element shown in Color Map View indeed presents the channel
contents of the corresponding histogram. Clicking on “Start Browser” button, user can open ROOT browser, navigate
via ROOT structure and look at these histograms in details, if necessary.
Apart from the entities that are displayed as Color Maps, there are also other histograms, representing mainly some
summary information (event counters, coordinate residual distribution, Rt dependencies etc). These items are not (or
can not be) displayed as Color Map and may be looked through in ROOT browser only.
A special mode for histogram comparison is available in browser when some reference data are downloaded into
the TRTViewer.
7. An examples of TRTViewer usage
In Color Map View user can display some entities choosing them via the list of Display Mode menu. These entities
reflect different characteristics of electronics channels and are used for operating control of TRT detector functionality.
Three examples are presented in this section.
One of most important is “LL hit”, which shows mean straw occupancy and can be used to identify dead or too
noisy channels/chips/boards – Fig. 7.

S.Yu. Smirnov and V.O. Tikhomirov / Physics Procedia 74 ( 2015 ) 51 – 58 57
Fig. 7. Color map of “LL hit” – possible indication of dead (1) and noisy (2) channels.
“LE on track” is looking for reconstructed tracks, if any, and estimate straw efficiency – probability to give a hit, if
crossed by a reconstructed track (Fig. 8, left).
The right part of Fig. 8 shows the mean trailing edge time (in ns) for signals when straw was crossed by recon-
structed track. Contrary to the Leading Edge, which depends on track distance to straw’s anode, the Trailing Edge is
practically independent and so can be used to estimate of channel time delay equalization uniformity.
Fig. 8. Left: Color map of “LE on track” shows estimated straw efficiency. Right: Color map shows mean trailing edge time for straws on track.

58 S.Yu. Smirnov and V.O. Tikhomirov / Physics Procedia 74 ( 2015 ) 51 – 58
8. Conclusion
The dedicated software package – TRTViewer – was developed for monitoring and diagnostics of the ATLAS TRT
detector functionality at electronics readout level. The program provides a rich set of different tools and is widely
used by TRT shifters and experts for detector debugging and data taking. It has made an essential contribution for
successful TRT detector operation during LHC Run-1 period.
References
[1] Abat E., Addy T.N., Akesson T.P.A. et al. The ATLAS TRT barrel detector. JINST. 2008; 3:P02014.
[2] Abat E., Addy T.N., Akesson T.P.A. et al. The ATLAS TRT end-cap detectors. JINST. 2008; 3:P10003.
[3] Abat E., Addy T.N., Akesson T.P.A. et al. The ATLAS TRT electronics. JINST. 2008; 3:P60007.
[4] Brun R., Rademakers F. ROOT – An Object Oriented Data Analysis Framework. NIM A. 1997; 389:81–86. See also http://root.cern.ch.
[5] Smirnov S.Yu. TRTViewer: The ATLAS TRT detector monitoring and diagnostics tool. NIM A. 2013; 706:90–92.