tropospheric ozone and human health - ct.gov … · designer smog masks (london 1950’s) source:...
TRANSCRIPT
Tropospheric Ozone and Human Health
Michelle L. BellYale School of Forestry and
Environmental Studies
Connecticut Department of Environmental ProtectionJune 9, 2005

Outline
• Brief history of air pollution and human health research
• Tropospheric ozone• The relationship between ozone and
mortality– Recent studies– Future research directions
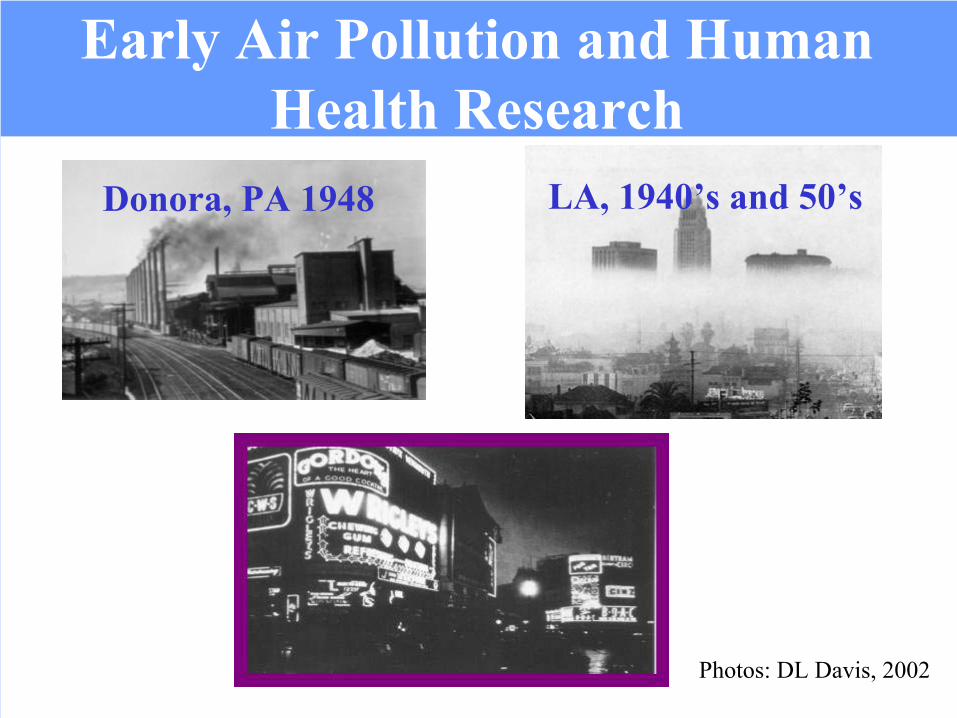
Early Air Pollution and Human Health Research
Photos: DL Davis, 2002
Donora, PA 1948 LA, 1940’s and 50’s
London 1952

Designer Smog Masks (London 1950’s)
Source: DL Davis. When Smoke Ran Like Water (2002)
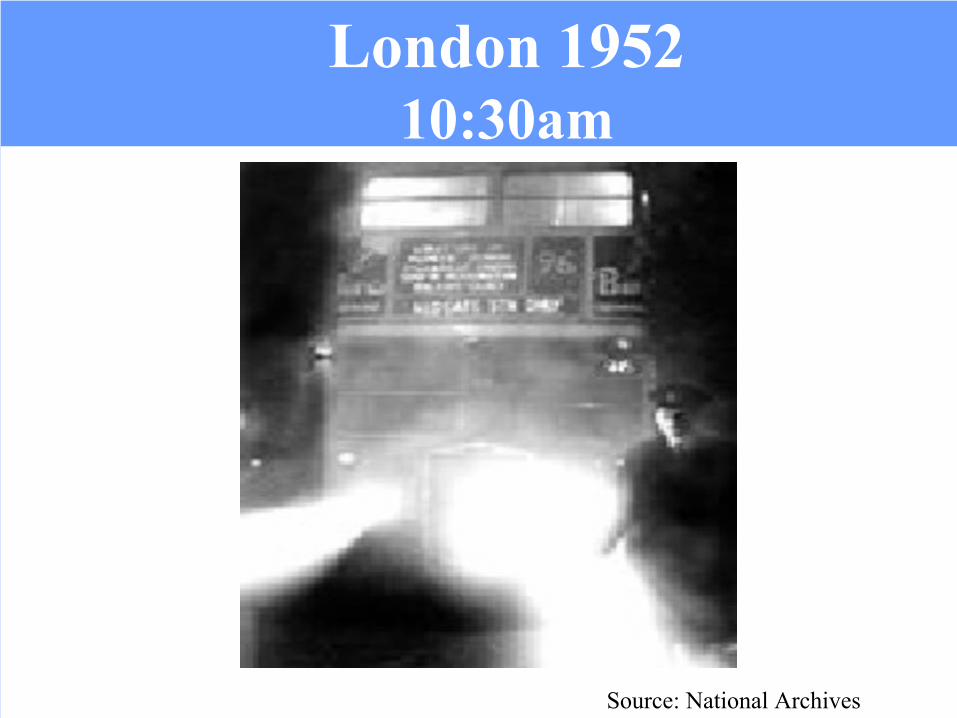
London 1952 10:30am
Source: National Archives

Cardiac Emergency Bed Service Applications for Greater London 1952
0
0.1
0.2
0.3
0.4
0.5
0.6
0.7
0.8
Dec. 2 Dec. 3 Dec. 4 Dec. 5 Dec. 6 Dec. 7 Dec. 8 Dec. 9 Dec. 100
5
1015
20
25
30
3540
45
50
Cardiac EBS
Car
diac
EB
S ap
plic
atio
ns
Dai
ly S
O2
(ppm
)
episode
SO2
Source: Bell & Davis, EHP 2001

Dai
ly O
3(p
pb)
Dai
ly P
M10
(µg/
m3 )
Dai
ly T
otal
M
orta
lity
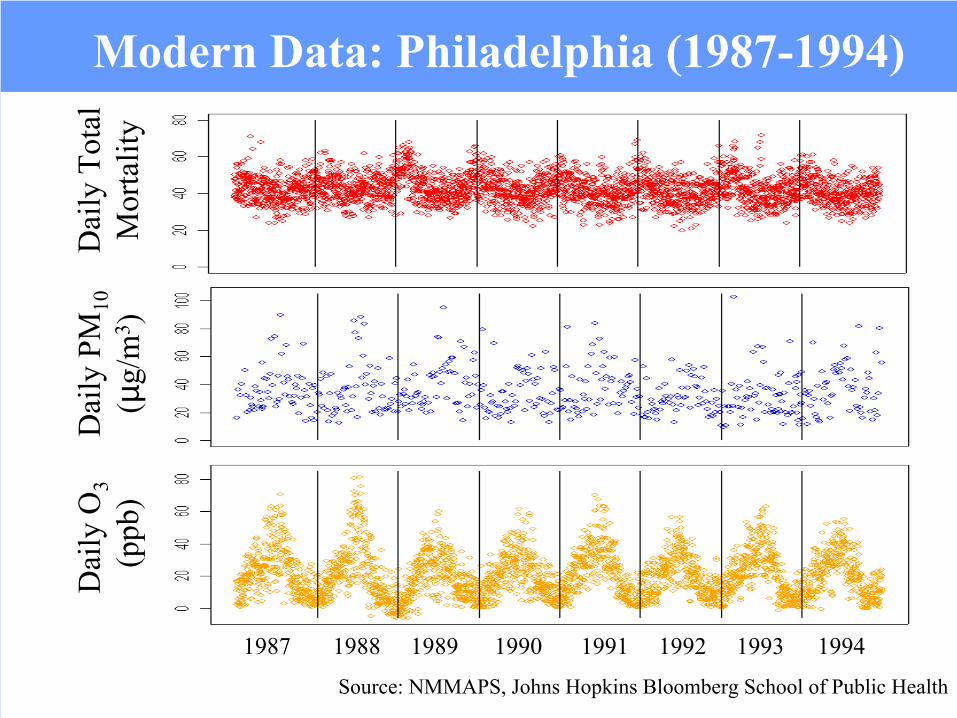
Modern Data: Philadelphia (1987-1994)
Source: NMMAPS, Johns Hopkins Bloomberg School of Public Health
1987 1988 1989 1990 1991 1992 1993 1994

Also in 1952: Discovery of Photochemical Smog
• Arie Haagen-Smit (1900 – 1977)– Began with study of vegetation damaged
by air pollution– Discovered that tropospheric O3 was
• Not mainly from stratospheric intrusion• Not directly emitted but was formed through
the chemical conversion of precursors– Suggested that O3 and its precursors
were the main constituents of LA smog

Tropospheric O3 Chemistry(very simplified)
VOCs + NOx + heat / sunlight O3
Precursors to ozoneSecondary pollutant
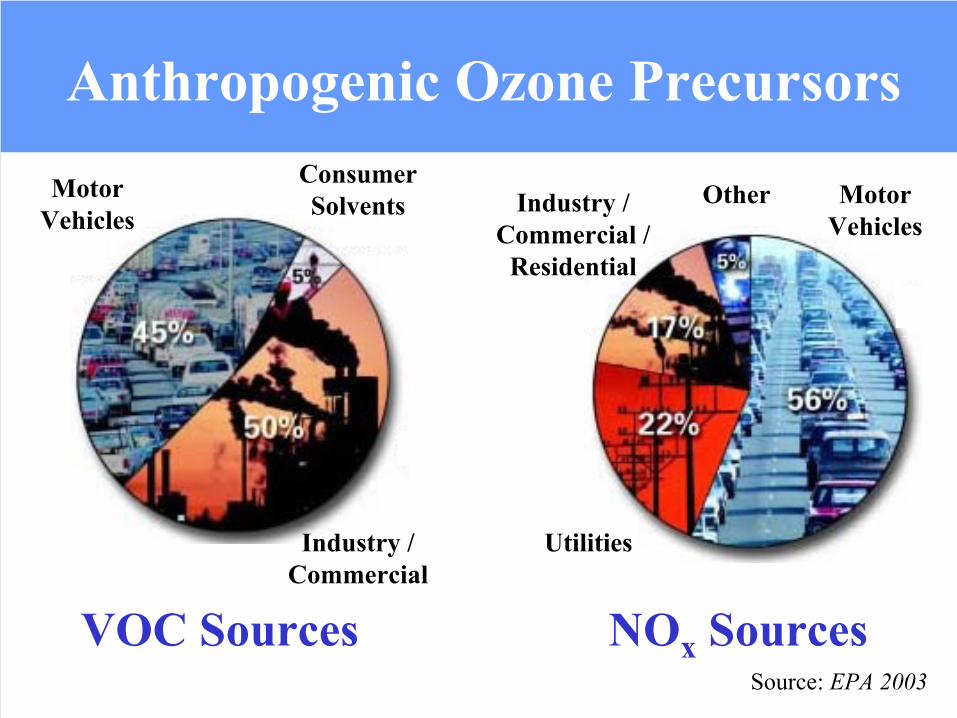
Utilities
Industry / Commercial /
Residential
Other Motor Vehicles
NOx Sources
Industry / Commercial
ConsumerSolvents
Motor Vehicles
VOC Sources
Anthropogenic Ozone Precursors
Source: EPA 2003
NO2 and Health
• Health effects: irritation to throat and lungs, respiratory tract infection, exacerbation of asthma, lung function, possible increased susceptibility to allergens
• Children and asthmatics more susceptible
• Also a Criteria Pollutant

Volatile Organic Compounds (VOCS)
• Category of pollutants• Gas• Primary, secondary• Sources: Biomass and fossil fuel
combustion, construction materials, household chemicals (solvents), industry, biogenic sources
• Health effects: headache, dizziness, upper respiratory tract irritation, nausea, cancer
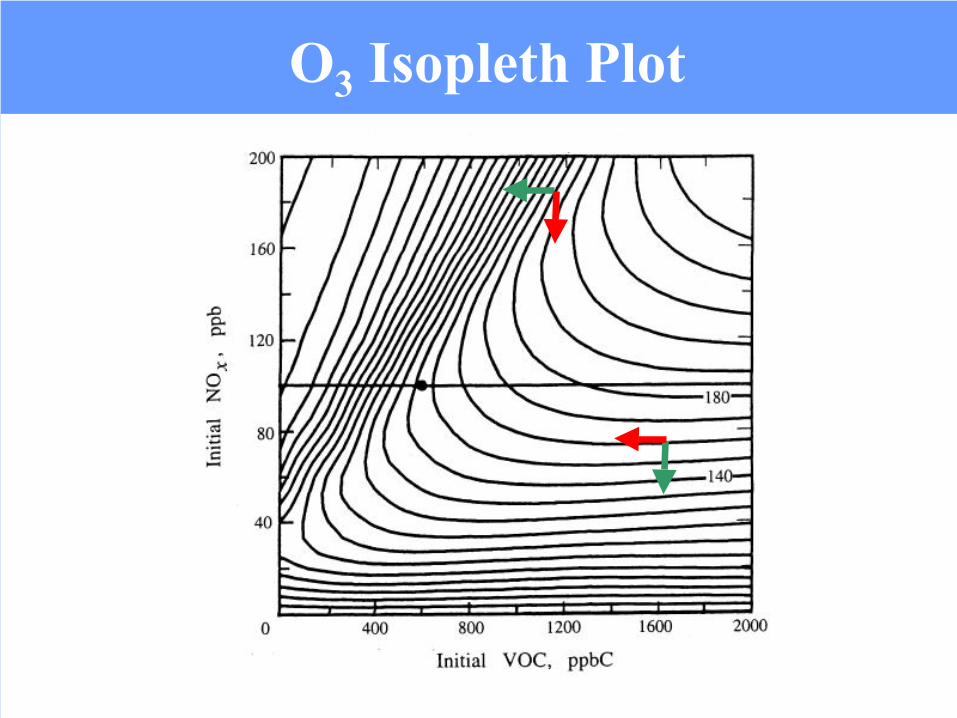
O3 Isopleth Plot
Source: EPA Greenbook
Health Impacts of Ozone
• Effects on lung function• Respiratory symptoms• Exacerbation of asthma• Hospital admissions• Emergency room visits
Source: EPA. Air Quality Criteria for Ozone and Related Photochemical Oxidants. 1996
• Mortality?

Why divergent results for ozone and mortality?
• Potential reasons:– Differences in (and lack of) statistical
power– Various statistical methods– Addressing of potential confounders– Underlying populations– Health care systems– Data quality– Others?
Why divergent results for ozone and mortality?
• Potential reasons:– Differences in (and lack of) statistical
power– Various statistical methods– Addressing of potential confounders– Underlying populations– Health care systems– Data quality– Others?

Confounders
Lung CancerAlcohol ?
• Potential confounder– Associated with the exposure of concern– Associated with the health endpoint– Not in the causal pathway
• Can create spurious associations or obscure real associations

?Health response
Confounder
Exposure
• What is associated with both the exposure and the health outcome?– Could potentially be a confounder
Lung Cancer
Smoking
Alcohol
Confounding Example

?Health response
Confounder
Pollutant
Potential Confounders for Ozone and Mortality
Mortality
Temperature
Ozone Mortality
PM
Ozone
EmissionsSources

Approaches to Resolve Seemingly Conflicting Results
1) Meta-Analysis Combine results of previous efforts+ Increased statistical power+ Can explore differences in model specification,
location, etc.- Publication bias
2) Multi-City StudyEstimate the relationship in numerous locations+ The above advantages+ Lack of publication bias- Data intensive
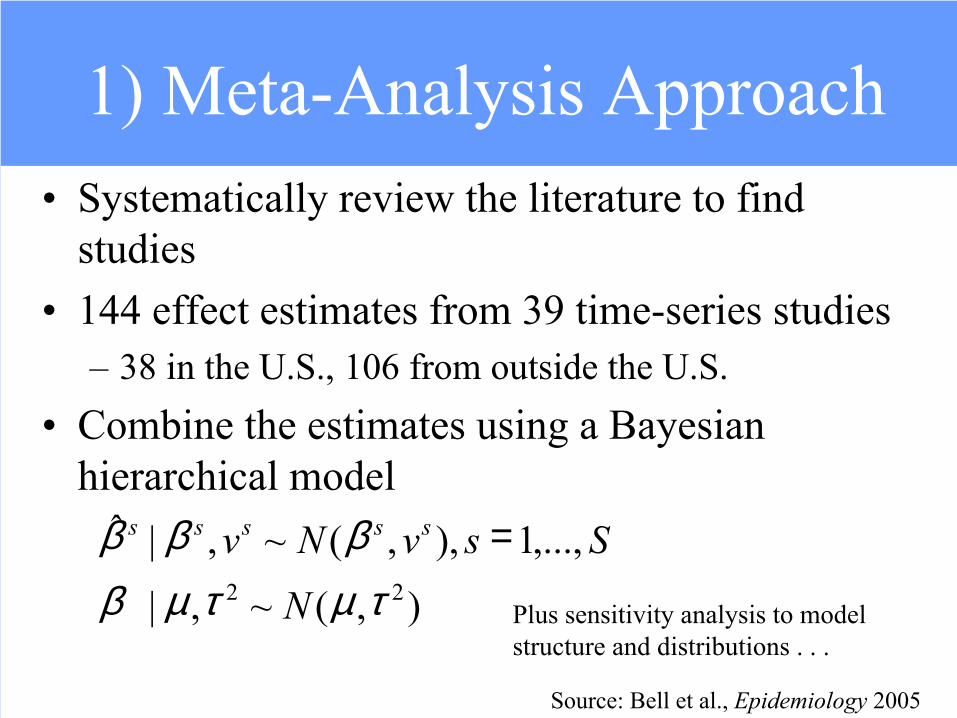
• Systematically review the literature to find studies
• 144 effect estimates from 39 time-series studies– 38 in the U.S., 106 from outside the U.S.
• Combine the estimates using a Bayesian hierarchical model
1) Meta-Analysis Approach
Plus sensitivity analysis to model structure and distributions . . .
),(~,|
,...,1),,(~,|ˆ22 τµτµβ
βββ
N
SsvNv sssss =
Source: Bell et al., Epidemiology 2005
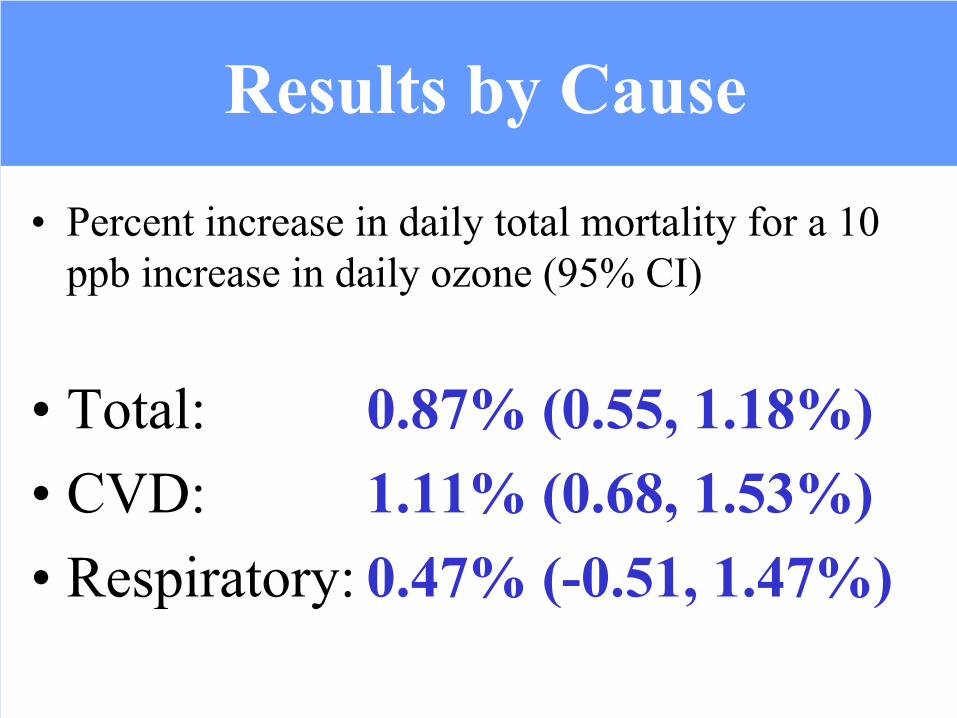
Results by Cause
• Percent increase in daily total mortality for a 10 ppb increase in daily ozone (95% CI)
• Total: 0.87% (0.55, 1.18%)• CVD: 1.11% (0.68, 1.53%)• Respiratory: 0.47% (-0.51, 1.47%)
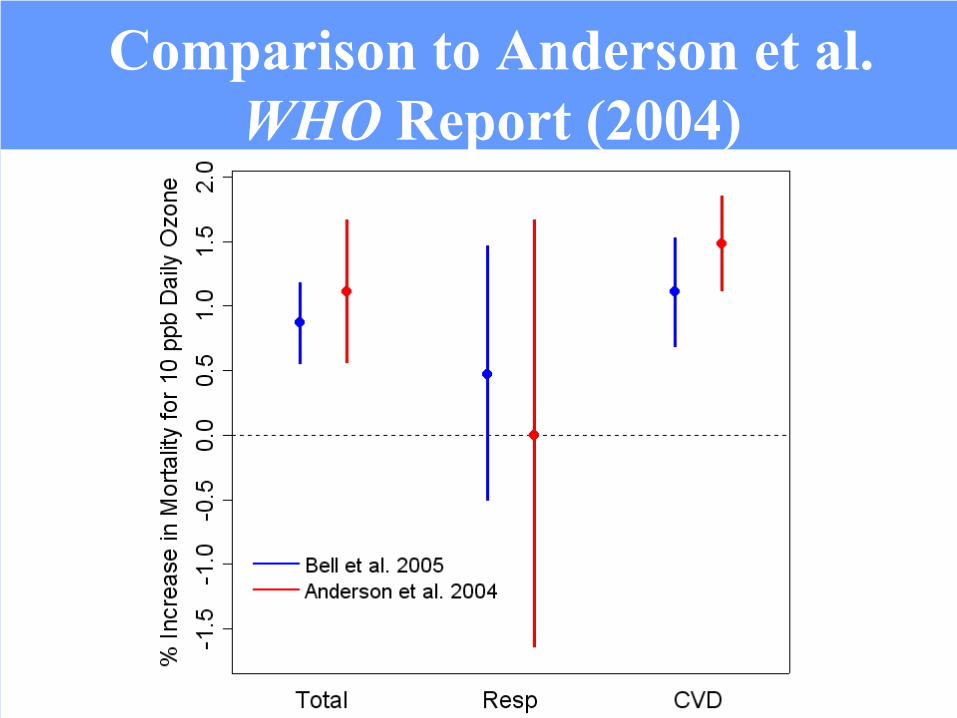
Comparison to Anderson et al. WHO Report (2004)

Other New Meta-Analyses
• Jonathan I. Levy, Susan M. Chemerynski, Jeremy A. Sarnat (2005). Ozone exposure and mortality risk: An empirical Bayes meta-regression analysis. Epidemiology 16(4).
• Kazuhiko Ito, Samantha DeLeon, Morton Lippmann (2005). Associations between ozone and daily mortality: A review and additional analysis. Epidemiology 16(4).
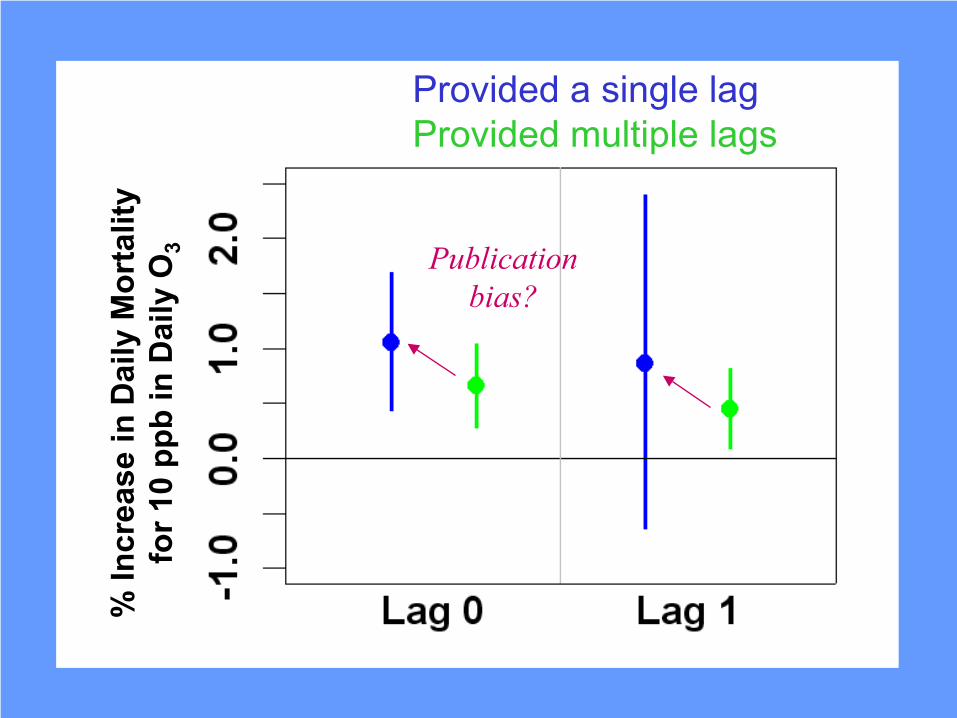
% In
crea
se in
Dai
ly M
orta
lity
for 1
0 pp
b in
Dai
ly O
3
Provided a single lagProvided multiple lags
Publication bias?

Selected Meta-Analysis Results
• 144 effect estimates from 39 time-series studies• Strong statistically significant association identified
between ozone and mortality for total deaths and cardiovascular disease
• Implied relationship between ozone and respiratory disease mortality
• Large heterogeneity in individual study estimates• Strong indications of publication bias

2) Multi-City Study
• Time-series study to investigate short-term exposure to ambient ozone (up to a week)
• 95 large urban U.S. communities (40% of the U.S. population)
• 14 years of daily data from 1987 to 2000– Some cities monitor O3 for part of the year
• Uniform analysis framework for all cities • Total and Cardiovascular/Respiratory mortality
Source: Bell et al., JAMA 2004
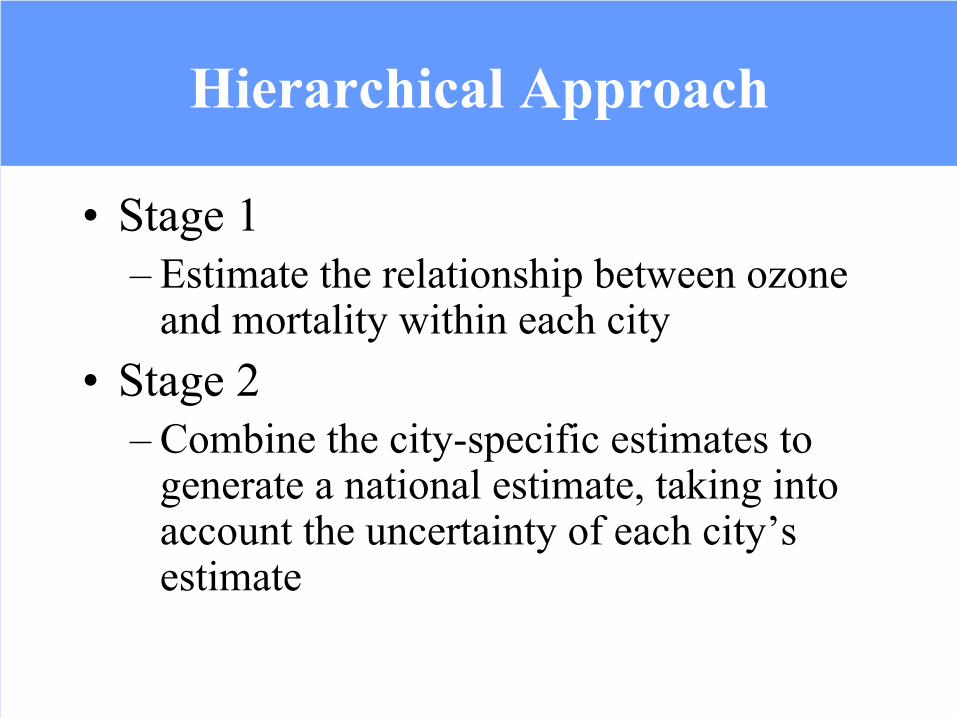
Hierarchical Approach
• Stage 1– Estimate the relationship between ozone
and mortality within each city• Stage 2
– Combine the city-specific estimates to generate a national estimate, taking into account the uncertainty of each city’s estimate
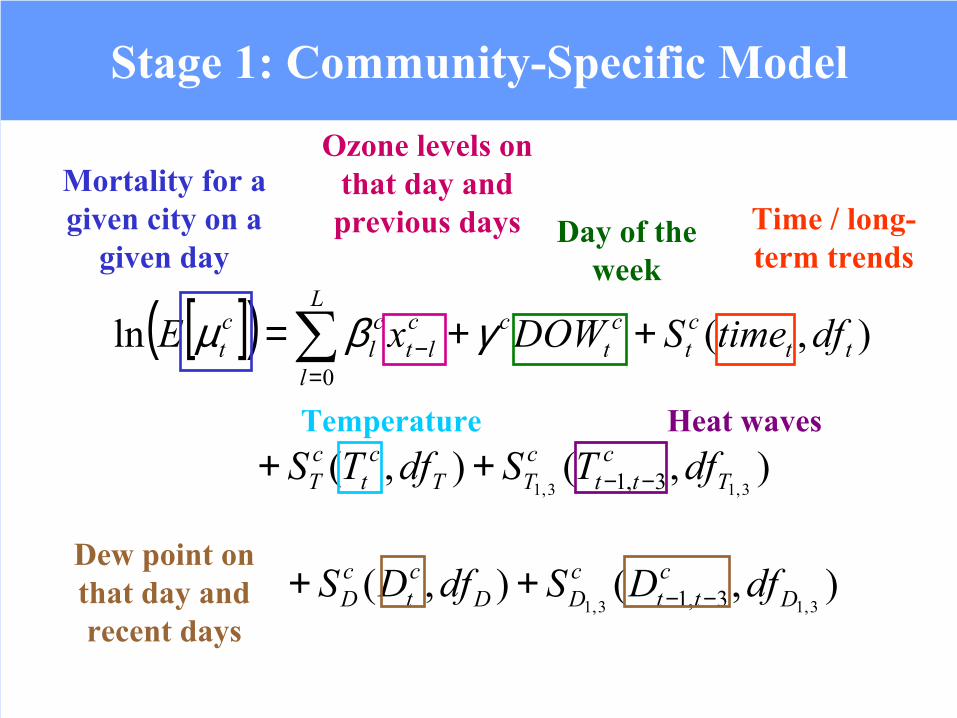
Stage 1: Community-Specific Model
[ ]( ) ),(ln0
ttct
ct
cclt
L
l
cl
ct dftimeSDOWxE ++= −
=∑ γβµ
),(),(3,13,1 3,1 T
ctt
cTT
ct
cT dfTSdfTS −−++
),(),(3,13,1 3,1 D
ctt
cDD
ct
cD dfDSdfDS −−++
Mortality for a given city on a
given day
Ozone levels on that day and previous days Day of the
weekTime / long-term trends
Temperature Heat waves
Dew point on that day and recent days
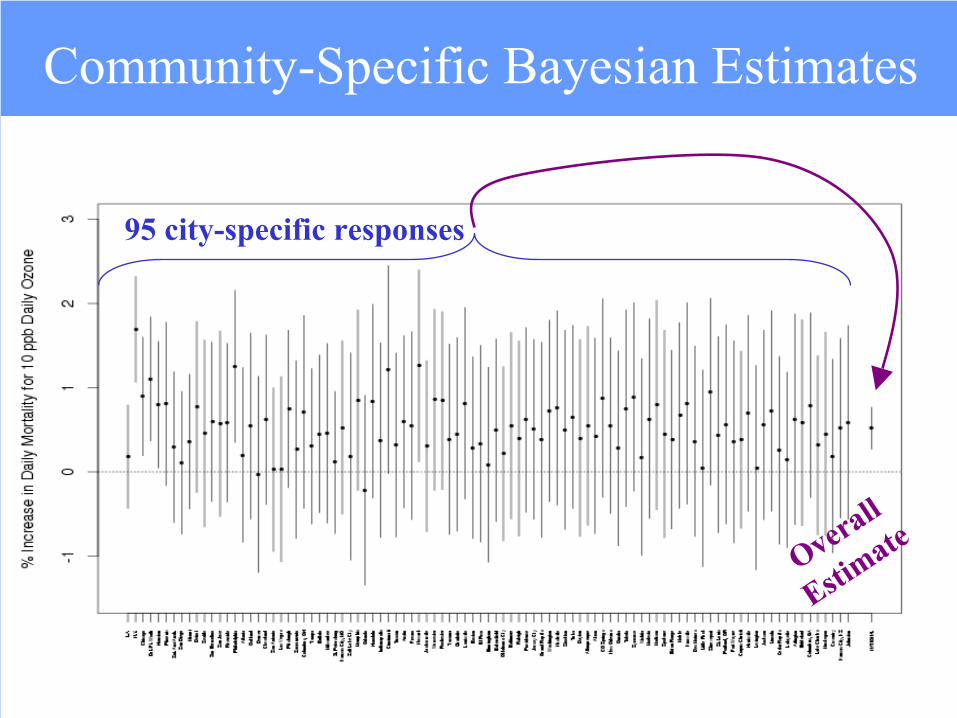
Community-Specific Bayesian Estimates
95 city-specific responses
Overall
Estimate

-0.2
0.0
0.2
0.4
0.6
0.8
1.0
1.2
Total Mortality
CVD + Respiratory Mortality
% In
crea
se in
Dai
ly M
orta
lity
for 1
0 pp
b D
aily
O3
Lag 0 Lag 1 Lag 2 Lag 3 Unconstrained
Constrained
SINGLE LAG MODELS DISTRIBUTED LAG MODELS
% In
crea
se in
Mor
talit
yFo
r 10
ppb
Dai
ly O
zone
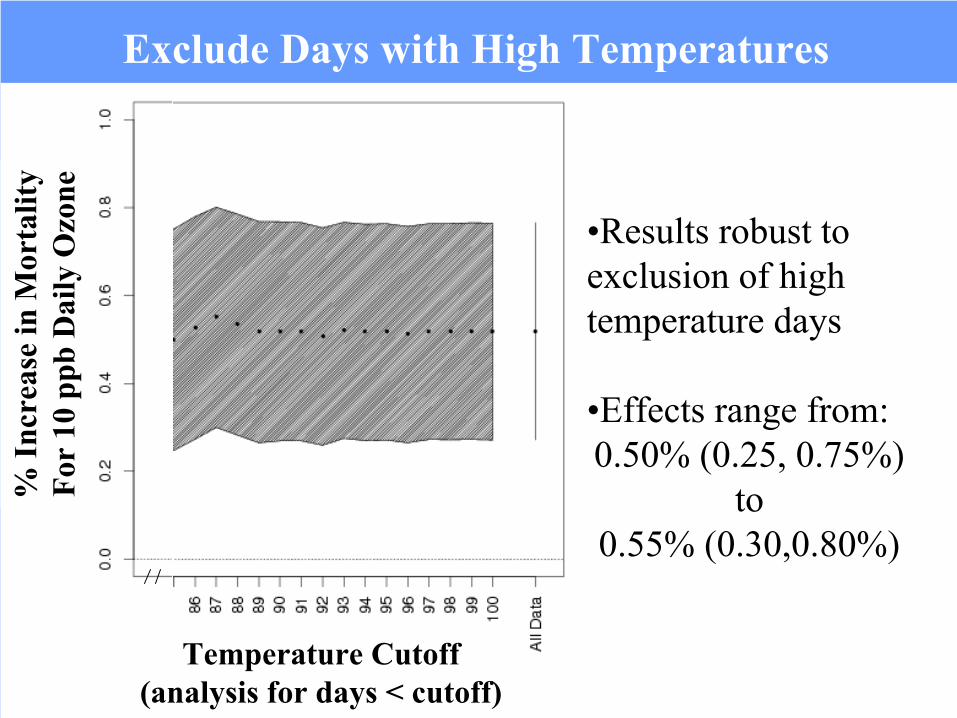
Temperature Cutoff(analysis for days < cutoff)
Exclude Days with High Temperatures
•Results robust to exclusion of high temperature days
•Effects range from:0.50% (0.25, 0.75%)
to 0.55% (0.30,0.80%)

Sensitivity to Adjustment by PM10
Without PM Adjustment (using only days with PM data)
Adju
sted
for P
M10
(lag
1)

Selected Multi-City Study Results
• 95 U.S. urban communities over 14 years• Identified a strong statistically significant
association between ozone and mortality• Effects present for O3 on the present day,
previous day, and up to about a week• Effects similar for all age groups considered• Results robust to adjustment by PM10, degrees
of freedom for smooth functions of time, and temperature
• Association present even when considering only days below EPA’s current standard

Compare Meta-Analysis and Multi-City Results

Source: EPA. Air Quality Criteria for Ozone and Related Photochemical Oxidants DRAFT. 2005
Mortality now (tentatively) included as a health endpoint.

Future Research Directions
Mor
talit
y R
isk
O3 ConcentrationThreshold
• Ozone threshold studies

Summer Ozone Levels (2050’s vs. 1990’s)
Future Research Directions
• Ozone threshold studies
• Climate change and ozone

Future Research Directions
• Ozone threshold studies
• Climate change and ozone
• Particulate matter speciation
• Mortality and air pollution in Latin American urban centers
Summer Ozone Levels (2050’s vs. 1990’s)
AcknowledgementsFrancesca Dominici, Scott L. Zeger, Jonathan M. Samet, and Aidan McDermott Johns Hopkins Bloomberg School of Public Health
Jonathan Patz University of Wisconsin – MadisonNelson Institute for Environmental Studies
Devra L. Davis University of Pittsburg, Center for Environmental Oncology
Patrick L. KinneyColumbia University, Mailman School of Public Health