tropical seaways played a more important role than high latitude
TRANSCRIPT

Clim. Past, 7, 801–813, 2011www.clim-past.net/7/801/2011/doi:10.5194/cp-7-801-2011© Author(s) 2011. CC Attribution 3.0 License.
Climateof the Past
Tropical seaways played a more important role than high latitudeseaways in Cenozoic cooling
Z. Zhang1,2, K. H. Nisancioglu1, F. Flatøy1, M. Bentsen1, I. Bethke1, and H. Wang2
1Bjerknes Centre for Climate Research, UniResearch, 5007, Bergen, Norway2Nansen-Zhu International Research Center, Institute of Atmospheric Physics, Chinese Academy of Sciences,100029, Beijing, China
Received: 15 March 2011 – Published in Clim. Past Discuss.: 21 March 2011Revised: 23 June 2011 – Accepted: 28 June 2011 – Published: 26 July 2011
Abstract. Following the Early Eocene climatic optimum(EECO, ∼55–50 Ma), climate deteriorated and graduallychanged the earth from a greenhouse into an icehouse, withmajor cooling events at the Eocene-Oligocene boundary(∼34 Ma) and the Middle Miocene (∼15 Ma). It is believedthat the opening of the Drake Passage had a marked impacton the cooling at the Eocene-Oligocene boundary. Basedon an Early Eocene simulation, we study the sensitivity ofclimate and ocean circulation to tectonic events such as theclosing of the West Siberian Seaway, the deepening of theArctic-Atlantic Seaway, the opening of the Drake Passage,and the constriction of the Tethys and Central American sea-ways. The opening of the Drake Passage, together with theclosing of the West Siberian Seaway and the deepening ofthe Arctic-Atlantic Seaway, weakened the Southern OceanDeep Water (SODW) dominated ocean circulation and led toa weak cooling at high latitudes, thus contributing to the ob-served Early Cenozoic cooling. However, the later constric-tion of the Tethys and Central American Seaways is shownto give a strong cooling at southern high latitudes. This cool-ing was related to the transition of ocean circulation from aSODW-dominated mode to the modern-like ocean circula-tion dominated by North Atlantic Deep Water (NADW).
Correspondence to:Z. Zhang([email protected])
1 Introduction
The Cenozoic Era was a period of long-term cooling, withmajor cooling events at the Eocene-Oligocene boundary andthe Middle Miocene (e.g., Miller, 1992; Zachos et al., 2001;Liu et al., 2009). There are several hypotheses trying toexplain the mechanisms behind the Cenozoic cooling (e.g.,Kennett, 1977; Raymo and Ruddiman, 1992; DeConto andPollard, 2003; Coxall et al., 2005). One hypothesis is thatpast reorganizations of ocean circulation could have beenan important factor. Among the tectonic events that had animpact on ocean circulation, the opening of the Drake Pas-sage is thought to have contributed to cooling at the Eocene-Oligocene boundary. The opening of the Drake Passage en-abled the development of the Antarctic Circumpolar Cur-rent (ACC), which thermally insulated Antarctica through re-duced southward heat transport (e.g., Toggweiler and Bjorns-son, 2000; Nong et al., 2000; Sijp and England, 2004), andalso influenced the formation of deep water in the North At-lantic (NADW) (Toggweiler and Bjornsson, 2000; Scher andMartin, 2008).
This thermal isolation hypothesis is, however, in conflictwith recent studies (Livermore et al., 2005; Scher and Mar-tin, 2006; Lagabrielle et al., 2009) indicating that the open-ing of the Drake Passage might have been much earlier thanthe Eocene-Oligocene boundary. Further, modelling studieshave demonstrated that the change of ocean heat transportwith the opening of the high latitude seaways was weak (Hu-ber and Nof, 2006), and the cooling caused by the changes inocean heat transport is insignificant compared to the cooingcaused by the drop of atmospheric CO2 levels (DeConto andPollard, 2003).
Published by Copernicus Publications on behalf of the European Geosciences Union.

802 Z. Zhang et al.: Tropical seaways in Cenozoic cooling
The warm greenhouse climate of the Early Eocene markedthe beginning of the long term Cenozoic cooling trend, andhas been the focus of several recent modelling studies (Hu-ber et al., 2004; Heinemann et al., 2009; Roberts et al., 2009;Shellito et al., 2009; Tindall et al., 2010; Winguth et al.,2010; Speelman et al., 2010; Lunt et al., 2010). These stud-ies have tested the sensitivity of climate to a large increase inatmospheric greenhouse gases (Shellito et al., 2009; Winguthet al., 2010; Lunt et al., 2010), explored the mechanism be-hind the Arctic warming (Heinemann et al., 2009; Shellito etal., 2009), simulated the isotope distribution of ancient sea-water and precipitation in the Early Eocene (Tindall et al.,2010, Speelman et al., 2010) , and also considered the pos-sible climatic effects caused by the changes to the high lati-tude seaways, including the West Siberian Seaway, Atlantic-Arctic Seaway (Roberts et al., 2009), Drake Passage and Tas-man Seaway (Huber et al., 2004). However, the impact oftropical seaways on the warm Early Eocene climate has notbeen addressed in detail. More importantly, under the EarlyEocene land-sea configuration, with a narrow and shallowDrake Passage and a narrow Tasman Seaway, the ACC wasrelatively weak (Huber and Sloan, 2001; Zhang et al., 2010),challenging the thermal isolation hypothesis which requiresthe development of a strong ACC once the Drake Passageopens.
Here, starting from a simulation of Early Eocene climate,we use FOAM (Fast Ocean Atmosphere Model) (Jacob etal., 2001) to examine the climate sensitivity to changes inthe seaways, including the closing of the West Siberian Sea-way, the deepening of the Arctic-Atlantic Seaway, the open-ing/deepening of Drake Passage and in particular the con-striction of the tropical Atlantic seaways: the Tethys Seawayand the Central American Seaway.
In this paper, Sect. 2 introduces the climate model FOAMand the experimental design. Sections 3 and 4 present theEarly Eocene control experiment and four sensitivity experi-ments with changes in the most important seaways. Section 5compares the simulations with geological evidence and pre-vious modelling studies, and discusses the implications ofthis study for understanding Cenozoic cooling. A summaryfollows in Sect. 6.
2 Model and experimental design
2.1 Model introduction
FOAM version 1.5 is a fully coupled General CirculationModel (GCM), run without flux corrections (Jacob et al.,2001). FOAM consists of a parallel version of the Com-munity Climate Model (CCM2) (Hack et al., 1993), withatmospheric physics upgraded following CCM3.6 (Kiehl etal., 1996). The atmospheric model is run with a horizontalresolution of R15 (4.5× 7.5 degrees) and 18 vertical levels.The Ocean Model (OM3) is a finite-difference, z-coordinate
ocean model with a horizontal resolution of 1.4× 2.8 de-grees, 24 vertical levels, and a free surface. The basic equa-tions solved in OM3 are the same as those for the Modu-lar Ocean Model (MOM) (Bryan, 1969; Cox, 1984), and ituses Richardson-number-based vertical mixing. The basicland model in FOAM is a simplified version of the defaultland model of CCM2 (Hack et al., 1993). The sea ice modeluses the thermodynamics of the NCAR CSM Sea Ice Model(Bettge et al., 1996).
FOAM is intended for long century-scale integrations. Itprovides a good simulation of the mean and variability ofthe modern climate (e.g., Liu and Wu, 2004). It has alsobeen used in paleoclimate studies of the Holocene (e.g., Liuet al., 2000) and Pleistocene (e.g., Lee and Poulsen, 2006),as well as periods from the deep geological time, such asthe Neoproterozoic snowball Earth (Poulsen et al., 2001),Mesozoic paleoclimate and paleoceanography (Poulsen andHuynh, 2006; Donnadieu et al., 2007). Details on the FOAMmodel can be found here:http://www.mcs.anl.gov/research/projects/foam/.
2.2 Boundary conditions
In the Paleocene/Earliest Eocene, the Arctic connected withthe Atlantic by the shallow Atlantic-Arctic Seaway, and withthe Tethys Sea via the West Siberian Seaway (e.g., Scotese,2001). At the same time the Drake Passage closed. However,there was a direct passage between the Pacific and Atlanticthrough the Central America Seaway. Reorganizations ofthese seaways occurred gradually. In the Middle Eocene, theWest Siberian Seaway closed (Akhmet’ev and Beniamovski,2006), and the Arctic-Atlantic Seaway deepened by the ex-tension of the Mid-Atlantic Ridge (e.g., Scotese, 2001). Al-though age estimates for the opening of the Drake Passageare still under debate (Barker, 2001; Lagabrielle et al., 2009),there is evidence indicating an early shallow opening in theEarly Eocene (Livermore et al., 2005) and subsequent deep-ening at∼ 41 Ma in the Middle Eocene (Scher and Martin,2006). If this is the case, the opening/deepening of the DrakePassage is simultaneous with the closing of the West SiberianSeaway and the deepening of the Arctic-Atlantic Seaway.
Changes to the tropical seaways occurred later. The nar-rowing of the Tethys Seaway (Barrier and Vrielynck, 2008)and the Central American seaway (e.g., Droxler et al., 1998)commenced in the Late Eocene. Further gradual shoaling ofthe Central American seaway began at∼16 Ma (e.g., Droxleret al., 1998), and the Tethys seaway was permanently closedat about 15 Ma (Rogl, 1999).
The Early Eocene boundary conditions (Fig. 1) are set fol-lowing the paleogeography of Scotese (2001) and the paleo-bathymetry is estimated using the method outlined by Bice etal. (1998). The paleogeography contains the reconstructionsof mountains, coastlines and shallow ocean basins, as well asmagnetic lines on the ocean floor. The coastlines outlined by
Clim. Past, 7, 801–813, 2011 www.clim-past.net/7/801/2011/

Z. Zhang et al.: Tropical seaways in Cenozoic cooling 803
o o180 W 0 180 E
90o
90oS
60o
30o
N
EQ
N
N
30oS
60oS
0 6 12 18 24 30 36
a
0
-1500
-250
-500
-3500
-550090oS EQ 90oN
0 6 12 18 24 30 36
b
d0
10
20
30
40
oTe
mp
era
ture
( C
)
0
10
20
30
40
0
10
20
30
40
Tem
pe
ratu
re (
C)
o
90oS EQ 90oN
Simulated SATSimulated SST
o o180 W 0 180 E
90o
90oS
60o
30o
N
EQ
N
N
30oS
60oS
0.1 1 2 3
c-1.0
2.0
1.0
0
δ
C (
‰)
13
-1.0
2.0
1.0
0
δ
C (
‰)
13
90oS EQ 90oN
f
e
-3.0
4.0
-1.0
0
1.0
2.0
3.0
-2.0
δ
O (
‰)
18
10
12
14
16
8
Tem
pe
ratu
re (
C)
o
90oS EQ 90oN
Estimation Simulationδ O 18
Figure 1
Mg/Ca
TEX86
LMA
d18O
Other
SST SAT
d18O
Figure 1. Warm climate and SODW-dominated ocean circulation simulated in the Early
Eocene (EECO) experiment. (a) Sea surface temperature (SST, oC). (b) zonal mean ocean
temperature (oC). (c) Deep ocean circulation (cm/s) at 2500m. Arrows show flow directions,
and colour scales show current speed. (d) Comparison of latitudinal sea surface temperature
between the model simulation and proxy records. LMA means leaf-margin analysis. (e)
Comparison of deep water temperature among the simulation (bold green line),
paleotemperature estimation (green shaded bar) (Lear et al., 2000) and benthic foraminiferal
δ18
O (small green markers). (f) Latitudinal gradients of benthic foraminiferal δ13
C in the Early
Eocene. All geological data used here are listed in the supplementary materials.
Fig. 1. Warm climate and SODW-dominated ocean circulation simulated in the Early Eocene (EECO) experiment.(a) Sea surface temper-ature (SST,◦C). (b) Zonal mean ocean temperature (◦C). (c) Deep ocean circulation (cm s−1) at 2500 m. Arrows show flow directions, andcolour scales show current speed.(d) Comparison of latitudinal sea surface temperature between the model simulation and proxy records.LMA means leaf-margin analysis.(e) Comparison of deep water temperature among the simulation (bold green line), paleotemperatureestimation (green shaded bar) (Lear et al., 2000) and benthic foraminiferalδ18O (small green markers).(f) Latitudinal gradients of benthicforaminiferalδ13C in the Early Eocene. All geological data used here are listed in the supplementary materials.
Scotese (2001) are set at 0 m, and the shallow ocean basinsare given a depth of 200 m. The age-depth relationships es-tablished by Bice et al. (1998) are used to calculate the depthof each magnetic line. Finally, this depth data is interpolatedinto a global areal configuration.
Starting from the reconstructed Early Eocene bathymetry,the main seaways discussed above are changed in the sensi-tivity experiments (Table 1, Supplement). The West SiberianSeaway is closed in experiment WSSC. The Arctic AtlanticSeaway is deepened in experiment AASD, giving a maxi-mum depth of 1900 m, and an Arctic with a water depth be-tween 2000 m to 3000 m. The Drake Passage is deepened
to about 2500 m in experiment DPGD. The Tethys Seaway isfully closed and the Central American Seaway is narrowed inexperiment TSCN, as the tectonic changes to these two sea-ways happened close in time. The changes of these two sea-ways are simplified; however paleogeographical reconstruc-tions (Droxler et al., 1998; Rogl, 1999) illustrate the compli-cated evolution of the Tethys and Central American Seaway.
In order to focus on the climatic effects caused by changesto the seaways, other boundary conditions are kept fixed. Inall experiments, the solar constant and orbital parameters areset to present conditions; vegetation on land is prescribed asshrubland/grassland; and the concentration of atmospheric
www.clim-past.net/7/801/2011/ Clim. Past, 7, 801–813, 2011

804 Z. Zhang et al.: Tropical seaways in Cenozoic cooling
0
-10
-20
-30
-10
0
-40 -30 -20 -10 0 10 20 4030
60oS EQ 90oN60oS EQ 90oN
-40 -30 -20 -10 0 10 20 4030
0
-2000
-1000
-3000
-4000
-50000
-2000
-1000
-3000
-4000
-5000
WSSC AASD
TSCN
(c)
(f)(e)
(d)
DPGD
0
-10
-20
-30
-10
0
0
0
0
-10
-10-20
-20
-10
0
0
0
10
10
0
0
0-10
-10
-10
0
-2000
-1000
-3000
-4000
-50000
-2000
-1000
-3000
-4000
-5000
0
-2000
-1000
-3000
-4000
-5000
EQ
90oS
90oN
180oW 180oE0
1
2
3
4
4
(a) (b)
EECO
Figure 2
Figure 2: Atlantic meridional overturning streamfunction (Sv) simulated in the experiments.
(a) Early Eocene land-sea distribution (land is yellow) with changes in seaways highlighted in
blue and red. 1), closing of the West Siberian Seaway (WSSC); 2), deepening of the
Arctic/Arctic-Atlantic Seaway (AASD); 3), deepening of the Drake Passage Gateway
(DPGD); 4, constriction of the tropical Atlantic seaways (TSCN), with a fully closed Tethys
seaway and narrow Central American seaway. Simulation in the control (b) EECO and the
sensitivity experiments (c) WSSC, (d) AASD, (e) DPGD, (f) TSCN.
Fig. 2. Atlantic meridional overturning streamfunction (Sv) simulated in the experiments.(a) Early Eocene land-sea distribution (landis yellow) with changes in seaways highlighted in blue and red. (1) closing of the West Siberian Seaway (WSSC); (2) deepening of theArctic/Arctic-Atlantic Seaway (AASD); (3) deepening of the Drake Passage Gateway (DPGD); (4) constriction of the tropical Atlanticseaways (TSCN), with a fully closed Tethys seaway and narrow Central American seaway. Simulation in the control(b) EECO and thesensitivity experiments(c) WSSC,(d) AASD, (e)DPGD,(f) TSCN.
Table 1. Summary of boundary conditions.
Exp. Topography and bathymetry Other boundary condition
Control Run Fixed in all experiments:EECO 50 Ma Insolation:present solarSensitivity Experiments constant and orbital parameters;WSSC 50 Ma+West Siberian Seaway closing (WSSC) Vegetation: shrubland everywhere;AASD 50 Ma+ WSSC+Arctic/Arctic-Atlantic Seaway deepening (AASD) Greenhouse gases: 2240 ppmv CO2,DPGD 50 Ma+ WSSC+AASD+Drake Passage Gateway deepening (DPGD)760 ppb CH4, 270 ppb N2OTSCN 50 Ma+ WSSC+AASD+DPGD+Tropical seaways closing/narrowing
CO2 is set to 8 times the preindustrial level, following es-timates for the Early Eocene (Royer, 2006). This is done tobetter isolate the roles of the seaways.
2.3 Initial conditions and model spin-up
In order to reduce the spin up time we use geological ev-idence (e.g., Lear et al., 2000; Tripati et al., 2003; Sluijset al., 2006; Pearson et al., 2007) to construct an initial
Clim. Past, 7, 801–813, 2011 www.clim-past.net/7/801/2011/

Z. Zhang et al.: Tropical seaways in Cenozoic cooling 805
temperature field for the ocean model. We prescribe the tem-peratures at four points, SST of 34◦C at the equator, deep-water temperature of 12◦C at the equator, SST of 15◦Cat both poles and deep-water temperature of 10◦C at bothpoles. Based on a rough empirical relationship of present dayocean temperature with depth, we use the following equa-
tions: t0(d) = 12+22× e−d
1000 and t90(d) = 10+5× e−d
1000
to calculate the temperature in each layer at the equator andpoles.d here is the depth of each layer in the ocean model.Then, a trigonometric sine function is used to set the merid-ional temperature gradient for each layer, with the temper-ature difference between the equator and the pole being theamplitude of the sine function. Finally, the meridional oceantemperature profile is applied at all longitudes, giving a three-dimensional temperature field to initialize the model.
The EECO experiment is spun up for 1250 yr in a fullycoupled configuration, in order to reach equilibrium not onlyat the ocean surface but also in the deep ocean. After the1250 yr spin-up, we continue the EECO experiment to modelyear 2000. We use the 1250 of the spin-up to initialize thefour sensitivity experiments. These sensitivity experimentsrun for another 750 yr to reach quasi-stationary ocean states.All results reported here are the averages of the last 100 yr ofeach experiment.
3 The Early Eocene simulation
The Early Eocene experiment simulates a warm climate andan ocean circulation dominated by Southern Ocean DeepWater (SODW). The global mean surface air temperature(SAT) is 25◦C, and the global mean sea surface temperature(SST) is 27◦C (Fig. 1). The average SST in the Arctic basinis about 6◦C and in the Southern Ocean about 15◦C. SODWdivides into two branches: one flows north in the Atlanticand upwells in the tropics; the other branch flows throughthe Indian Ocean and upwells in the Pacific.
Reconstructions of surface temperature for the EarlyEocene are based on oxygen isotope data (e.g., Zachos et al.,1994; Schmitz et al., 1996; Fricke and Wing, 2004; Eldrettet al., 2009), Ma/Ca ratios (e.g., Tripati et al., 2003) and theTEX86 method (a paleothermometer based on the distribu-tion of crenarchaeotal membrane lipids) (Sluijs et al., 2006;Brinkhuis et al., 2006; Bijl et al., 2009; Hollis et al., 2009).They give a rough estimate of the zonal mean surface temper-ature gradient during the Early Eocene. The simulated zonalmean SAT and SST fall within the range of the reconstructedtemperature gradient (Fig. 1d).
It is important to note the uncertainties in these reconstruc-tions of surface temperature. The reconstructions of SSThave uncertainties due to the choice of oxygen isotopic com-position of mean seawater, the estimated Mg/Ca of seawa-ter, and the calibration of TEX86 (Huber, 2008). The recentSST reconstructions based on oxygen isotopes (e.g., Pearsonet al., 2007; Ivany et al., 2008) are warmer than the earlierresults (Zachos et al., 1994). The SST estimates based on
TEX86 (Sluijs et al., 2006, 2007; Brinkhuis et al., 2006; Bijlet al., 2009; Hollis et al., 2009) appear to be warmer thanthose from oxygen isotopes and Mg/Ca. Most of the terres-trial temperature estimates, even though they are mostly fromNorth America (e.g., Fricke and Wing, 2004; Greenwood etal., 2005), show a large range.
The simulated surface air temperature falls within therange of terrestrial temperature estimates. The simulated seasurface temperature agrees better with the most recent esti-mates based on Mg/Ca and oxygen isotopes (e.g., Tripati etal., 2003; Pearson et al., 2007; Ivany et al., 2008), but issignificantly lower than the estimates based on TEX86, bothat low and high latitudes. The model-data discrepancy ap-pears in the northern high latitudes, particularly in the Arc-tic. The simulated surface temperature is about 5∼6◦C atthe surface in the northern high latitudes, which agrees wellwith other simulations with the same atmospheric CO2 level(Shellito et al., 2009). However, the simulated annual meantemperatures at northern high latitudes are still lower thanmost proxy based estimates which fall within the range 10 to15◦C (Eberle et al., 2010).
In the deep ocean (Fig. 1e), the simulated temperature isconsistent with the estimated range of∼12–14◦C based onMg/Ca ratios (Lear et al., 2000). Since the Early Eocenesimulation presented here has reached equilibrium, the biasesin model-data comparison of deep ocean temperature shouldbe small. The simulated Early Eocene ocean circulation issupported by the reconstruction of circulation based onδ13Cratios from benthic foraminifera (Fig. 1f), which indicatesactive deep water formation in the Southern Hemisphere andits northward flow (aging) (Nunes and Norris, 2006).
4 The sensitivity experiments
In the sensitivity experiments starting from the Early Eocenecontrol climate (EECO), two types of overturning circula-tion can be discriminated: one dominated by the forma-tion of SODW and the other by NADW (Fig. 2). As inthe control simulation, SODW continues dominating oceancirculation in the experiments with a closed West SiberianSeaway (WSSC), a deep Arctic-Atlantic Seaway (AASD),and a deep Drake Passage (DPGD). However, the intensityof SODW formation is weakened, with a maximum over-turning at about 40◦ S reduced from 31 Sv in the controlrun (EECO) to 20 Sv in experiment DPGD. Once the trop-ical seaways (the Tethys and Central American Seaway) areclosed/narrowed in experiment TSCN, the deep ocean circu-lation changes drastically with the commencement of deep-water formation in the North Atlantic and the dominance ofNADW (Figs. 2f and 3b).
With the transition to a NADW-dominated ocean circula-tion in experiment TSCN, global mean SST is reduced byabout 0.4◦C compared to the Early Eocene control climate(EECO). In contrast to the nearly symmetric cooling in thehigh latitudes of both hemispheres in experiment DPGD, the
www.clim-past.net/7/801/2011/ Clim. Past, 7, 801–813, 2011

806 Z. Zhang et al.: Tropical seaways in Cenozoic cooling
-5 -3 543210-1-2-40.1 1 2 3
EQ
90oS
90oN
EQ
90oS
90oN
DPGD-EECO
-1
-1
-1
-1-2
(c)
TSCN-EECO
-1
-1
-2-3
-4-5
1
1
2
-1
(d)
(a)
(b)
12
2
3
4
4
DPGD
TSCN
Figure 3
180oW 180oE0 180oW 180oE0
Figure 3. Transition of ocean circulation from a SODW-dominated to a NADW-dominated
mode and it impact on SST. Deep ocean currents (cm/s) at 2500m for experiments (a) DPGD
and (b) TSCN. Geographic distributions of SST changes (oC) in the DPGD (c) and the TSCN
(d) experiments, compared to the control experiment (EECO). Arrows show flow directions,
and colour scales show current speed. Changes in seaways are highlighted by red rectangles:
1), closing of the West Siberian Seaway (WSSC); 2), deepening of the Arctic/Arctic-Atlantic
Seaway (AASD); 3), deepening of the Drake Passage Gateway (DPGD); 4), constriction of
the tropical Atlantic seaways (TSCN), with a fully closed Tethys seaway and narrow Central
American seaway. The statistical signifcance has been tested with the t-test, based on annual
mean SST time series for each point. Only SST changes with confidence levels greater than
95% are illustrated here.
Fig. 3. Transition of ocean circulation from a SODW-dominated to a NADW-dominated mode and its impact on SST. Deep ocean currents(cm s−1) at 2500 m for experiments(a) DPGD and(b) TSCN. Geographic distributions of SST changes (◦C) in the DPGD(c) and the TSCN(d) experiments, compared to the control experiment (EECO). Arrows show flow directions, and colour scales show current speed. Changesin seaways are highlighted by red rectangles: (1) closing of the West Siberian Seaway (WSSC); (2) deepening of the Arctic/Arctic-AtlanticSeaway (AASD); (3) deepening of the Drake Passage Gateway (DPGD); (4) constriction of the tropical Atlantic seaways (TSCN), with afully closed Tethys seaway and narrow Central American seaway. The statistical signifcance has been tested with the t-test, based on annualmean SST time series for each point. Only SST changes with confidence levels greater than 95 % are illustrated here.
cooling in experiment TSCN is focused to the East Antarcticsection of the Southern Ocean (Fig. 3d). A significant de-crease of surface air temperature is also observed over EastAntarctica (not shown). Note that the initiation of Antarcticglaciation at the Eocene-Oligocene boundary and the expan-sion at the Middle Miocene were focused to East Antarctica(Zachos et al., 2001). No cooling can be observed over WestAntarctica, on which the glaciation occurred later in the LateMiocene (Zachos et al., 2001).
The pattern of the SST changes is similar to the familiarsea-saw pattern (Crowley, 1992), with a strong cooling in theSouth Atlantic and a warming in the North Atlantic. Thesea-saw pattern is best seen when comparing the TSCN andDPGD experiments (Fig. 4a).
A similar pattern of changes in sea surface salinity (SSS)is observed in response to the closed/narrowed tropical sea-ways. SSS increases by 2 psu in the North Atlantic, anddecreases∼2 to 4 psu in the South Atlantic (Fig. 4b). Atthe same time, the western boundary currents along the eastcoast of Southern American are strengthened (Fig. 4c).
The above changes of SSS and currents are caused by thereduction in transport through the Tethys and Central Amer-
ica Seaways. Due to the salinity of inflowing Indian Oceanwater feeding the Tethys Sea, the salinity in the Tethys Seais lower than in the tropical and subtropical North Atlanticin the EECO experiment. After the tropical seaways are nar-rowed/closed in the sensitivity experiments, the flow of waterthrough these two seaways is reduced, particularly in exper-iment TSCN (Table 2). The closing of the Tethys Seawayshuts down the relatively fresh surface current that flows intothe North Atlantic, increasing SSS in the subtropical NorthAtlantic. Similarly, the narrowing of the Central AmericanSeaway reduces the inflow of relatively fresh Pacific waterand supports the development of the western boundary cur-rent in the Atlantic. The change of the surface salinity andcurrents in the Atlantic, caused by the reduced inflow fromthe Pacific and Tethys Sea, is beneficial for the commence-ment of NADW formation.
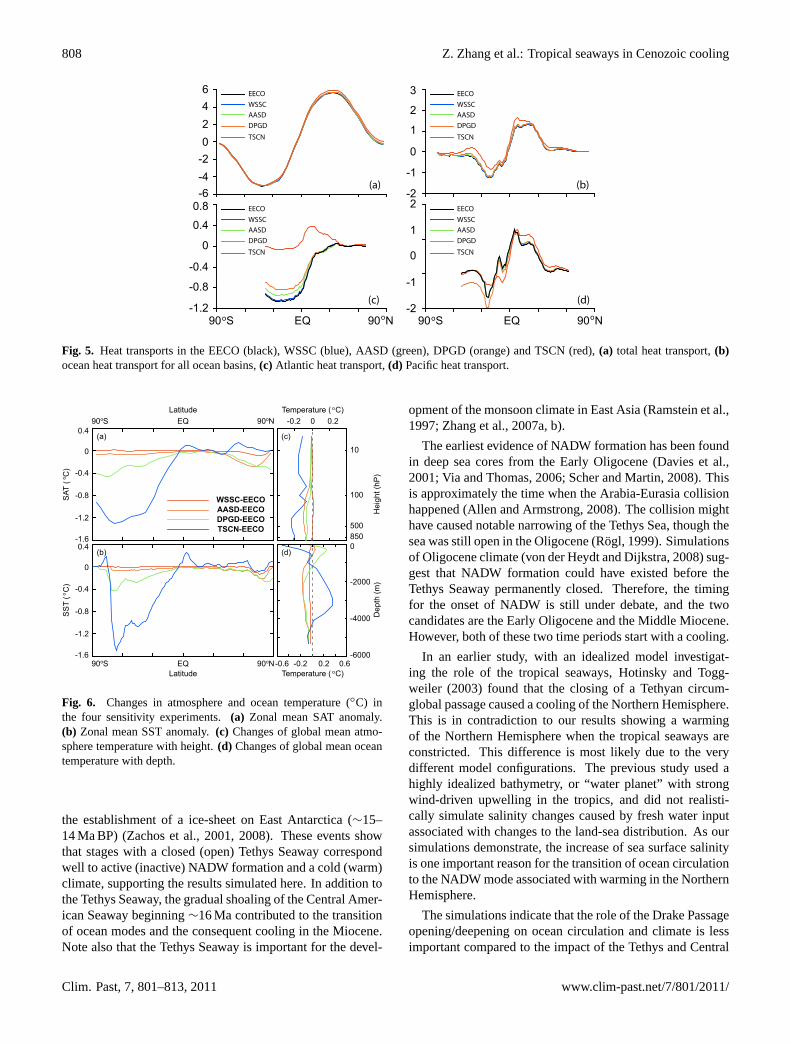
In the sensitivity experiments dominated by SODW for-mation, there are only small changes in meridional heattransport. Compared with the control run (EECO), experi-ments WSSC, AASD and DPGD show very small changesin ocean heat transport (Fig. 5).
Clim. Past, 7, 801–813, 2011 www.clim-past.net/7/801/2011/

Z. Zhang et al.: Tropical seaways in Cenozoic cooling 807
-1
-2-3
-5-4
1
2
3
1
1
12
3
-1
-3
-1
1
1
-2-2
180oW 180oE0
(b)
(c)
EQ
90oS
90oN
EQ
90oS
90oN
EQ
90oS
90oN
TSCN-DPGD SSS
TSCN-DPGD SUV
Figure 4
0.5
1.0
2.0
3.0
4.0
5.06.0
(a)
TSCN-DPGD SST
0
1.0
-1.0
2.0
3.0
4.05.0
-2.0
-3.0
-4.0-5.0
0
1.0
-1.0
2.0
3.0
4.05.0
-2.0
-3.0
-4.0-5.0
Figure 4. Geographic changes of (a) SST (oC) , (b) SSS and (c) surface currents at 50m
(cm/s) between the TSCN and the DPGD experiment. SST and SSS changes with confidence
levels greater than 95% are illustrated in (a) and (b). The two red rectangles in (a) highlight
the Central American Seaway (Left) and the section of the Tethys Seaway (Right) for
calculating water mass in Table 2.
Fig. 4. Geographic changes of(a) SST (◦C) , (b) SSS and(c) sur-face currents at 50 m (cm s−1) between the TSCN and the DPGDexperiment. SST and SSS changes with confidence levels greaterthan 95 % are illustrated in(a) and(b). The two red rectangles in(a) highlight the Central American Seaway (Left) and the section ofthe Tethys Seaway (Right) for calculating water mass in Table 2.
Table 2. Water mass (Sv) transport through the Tethys Seaway andthe Central American Seaway. Positive values are to the east.
Exp. Tethys seaway Central American Seaway
EECO −4.56 9.40WSSC −4.55 8.83AASD −4.54 6.27DPGD −4.33 3.62TSCN 0 1.04
However, once a NADW-dominated ocean circulation isestablished in experiment TSCN, northward heat transportis intensified, particularly in the Atlantic (Fig. 5c). Asa result, there is a cooling in the Southern Hemisphere(Fig. 6). Although there is a strong cooling over parts ofthe Southern Ocean, simulated surface temperatures remainabove freezing, and the area of sea ice does not increase.Due to the production of deep water in the North Atlantic,more heat is transported from the surface to the deep ocean(Fig. 6c and d).
5 Discussion
5.1 The role of tropical seaways
The simulated surface temperature gradient and ocean circu-lation agrees well with previous modelling studies (Shelltioet al., 2009; Winguth et al., 2010). Further, the comparisonto proxy data illustrates that the experiment EECO simulatesthe Early Eocene climate reasonably well, although our sim-ulation can not reproduce the full magnitude of the recon-structed Early Eocene warming in the Arctic region.
Here, we focus on the important role of tropical seawaysin the evolution of Cenozoic ocean circulation and climate.Starting from a realistic Early Eocene simulation, the sensi-tivity experiments indicate that the transition in ocean circu-lation has a cooling effect on southern high latitudes. Theconstriction of the main tropical Atlantic seaways appears toplay a leading role in this transition. Earlier modelling stud-ies with a shallow Central American Seaway and a closedTethys Seaway show the existence of NADW in the SouthAtlantic (Nisancioglu et al., 2003), a strong cooling in theSouthern Hemisphere (von der Heydt and Dijkstra, 2006)and development of a western boundary current in the At-lantic (Omta and Dijkstra, 2003). All these studies showthat the NADW dominated ocean circulation exists with theCentral American Seaway fully opened, suggesting that theTethys Seaway is more important for the transition of oceancirculation.
The role of the Tethys Seaway is supported by the tim-ing of key geological events (Fig. 7). Detailed reconstruc-tions of the paleogeography (Rogl, 1999) illustrate that theTethys Seaway was open in the early Miocene (∼24–19 Ma),closed in the late early Miocene (∼19–17 Ma), opened againin the middle Miocene (∼17–15 Ma), before it permanentlyclosed at about 15 Ma. The reduced carbon isotope gradientbetween the Atlantic and Pacific indicates that NADW for-mation was active during a period in the late early Mioceneand dominated ocean circulation again after about 15 Ma(Wright et al., 1992), though this may be complicated bylower oceanic nutrient levels. Oxygen isotope data revealthat climate was warm in the earliest Miocene, followed by arelatively cold period in the late early Miocene, then camethe warm middle Miocene Climate Optimum, and finally
www.clim-past.net/7/801/2011/ Clim. Past, 7, 801–813, 2011
808 Z. Zhang et al.: Tropical seaways in Cenozoic cooling
-4
-2
0
2
4
6
-0.4
0
0.8
-2
-1
0
1
2
-2
-1
0
1
2
-0.8
-6
-1.2
EECO
WSSC
AASD
DPGD
TSCN
EECO
WSSC
AASD
DPGD
TSCN
EECO
WSSC
AASD
DPGD
TSCN
EECO
WSSC
AASD
DPGD
TSCN
(a)
(d)
(b)
(c)
0.4
90oS EQ 90oN 90oS EQ 90
oN
3
Figure 5: Heat transports in the EECO (black), WSSC (blue), AASD (green), DPGD (orange)
and TSCN (red), (a) total heat transport, (b) ocean heat transport for all ocean basins, (c)
Atlantic heat transport, (d) Pacific heat transport.
Figure 5
Fig. 5. Heat transports in the EECO (black), WSSC (blue), AASD (green), DPGD (orange) and TSCN (red),(a) total heat transport,(b)ocean heat transport for all ocean basins,(c) Atlantic heat transport,(d) Pacific heat transport.
-1.6
-1.2
-0.8
-0.4
0
0.4
WSSC-EECO
AASD-EECO
DPGD-EECO
TSCN-EECO
(a)
(b)
(c)
SA
T (
C
)o
-6000
-4000
-2000
0
De
pth
(m
)
90oS EQ 90oN
Latitude
-0.2 0 0.2
Temperature ( C)o
-1.6
-1.2
-0.8
-0.4
0
0.4
SS
T (
C
)o
-0.2 0.2 0.690oS EQ 90oN
Latitude
-0.6
Temperature ( C)o
850
500
10
100
He
igh
t (h
P)
(d)
Figure 6: Changes in atmosphere and ocean temperature (oC) in the four sensitivity
experiments. (a) Zonal mean SAT anomaly. (b) Zonal mean SST anomaly. (c) Changes of
global mean atmosphere temperature with height. (d) Changes of global mean ocean
temperature with depth.
Figure 6
Fig. 6. Changes in atmosphere and ocean temperature (◦C) inthe four sensitivity experiments.(a) Zonal mean SAT anomaly.(b) Zonal mean SST anomaly.(c) Changes of global mean atmo-sphere temperature with height.(d) Changes of global mean oceantemperature with depth.
the establishment of a ice-sheet on East Antarctica (∼15–14 Ma BP) (Zachos et al., 2001, 2008). These events showthat stages with a closed (open) Tethys Seaway correspondwell to active (inactive) NADW formation and a cold (warm)climate, supporting the results simulated here. In addition tothe Tethys Seaway, the gradual shoaling of the Central Amer-ican Seaway beginning∼16 Ma contributed to the transitionof ocean modes and the consequent cooling in the Miocene.Note also that the Tethys Seaway is important for the devel-
opment of the monsoon climate in East Asia (Ramstein et al.,1997; Zhang et al., 2007a, b).
The earliest evidence of NADW formation has been foundin deep sea cores from the Early Oligocene (Davies et al.,2001; Via and Thomas, 2006; Scher and Martin, 2008). Thisis approximately the time when the Arabia-Eurasia collisionhappened (Allen and Armstrong, 2008). The collision mighthave caused notable narrowing of the Tethys Sea, though thesea was still open in the Oligocene (Rogl, 1999). Simulationsof Oligocene climate (von der Heydt and Dijkstra, 2008) sug-gest that NADW formation could have existed before theTethys Seaway permanently closed. Therefore, the timingfor the onset of NADW is still under debate, and the twocandidates are the Early Oligocene and the Middle Miocene.However, both of these two time periods start with a cooling.
In an earlier study, with an idealized model investigat-ing the role of the tropical seaways, Hotinsky and Togg-weiler (2003) found that the closing of a Tethyan circum-global passage caused a cooling of the Northern Hemisphere.This is in contradiction to our results showing a warmingof the Northern Hemisphere when the tropical seaways areconstricted. This difference is most likely due to the verydifferent model configurations. The previous study used ahighly idealized bathymetry, or “water planet” with strongwind-driven upwelling in the tropics, and did not realisti-cally simulate salinity changes caused by fresh water inputassociated with changes to the land-sea distribution. As oursimulations demonstrate, the increase of sea surface salinityis one important reason for the transition of ocean circulationto the NADW mode associated with warming in the NorthernHemisphere.
The simulations indicate that the role of the Drake Passageopening/deepening on ocean circulation and climate is lessimportant compared to the impact of the Tethys and Central
Clim. Past, 7, 801–813, 2011 www.clim-past.net/7/801/2011/

Z. Zhang et al.: Tropical seaways in Cenozoic cooling 809
Figure 7: Timing of key geological events, 1) the evolution of the Tethys Seaway, 2)
Cenozic cooling based on deep-sea oxygen isotopes and ice-sheet development (Zachos et al.,
2001, 2008), 3) the evolution of ocean circulation. The Tethys evolution is summarized
according to Akhmet’ev and Beniamovski (2006), Rögl (1996), Barrier and Vrielynck (2008).
The changes of other seaways are summarized according to Scotese (2001), Livermore et al.
(2005) and Scher and Martin (2006). The Early Oligocene evidence of NADW formation is
summarized according to Davies et al. (2001), Via and Thomas (2006) and Scher and Martin
(2008). The red line show the NADW index based on benthic carbon isotopes (Wright et al.,
1992). The high value of Δδ13
C indicates active NADW, and the low value indicates inactive
NADW.
Figure 7
0
10
60
50
40
30
20
AG
E (
Ma
)
Open, Deep
Open, Shallow
Closed
Closed
Closing of West Siberian Seaway
permanent closing of Tethys
Tethys Retreat to Turan Plate
SODW
NADW
NADW
?NADW
0
10
60
50
40
30
20
AG
E (
Ma
)
Tethys Seaway Global Temperature Ocean Circulation
0 0.5 1
-20246
δ O (‰)18
∆δ C (‰)13
(a) (c)(b)Pale
Eo
cen
eO
lig
oce
ne
Mio
cen
e
Pilo
Plei
Large narrowing of Tethys
Deepening of Drake Passage
Deepening of Arctic-Atlantic Seaway
Early opening of Drake Passage
Open, Shallow
?
Partial or epherneral
Full scale and permanent
SH
Ice-S
he
ets
NH
Ice-S
he
ets
W. Antarctic
ice-sheet
E. Antarctic
ice-sheet
E. Antarctic
ice-sheet
Fig. 7. Timing of key geological events, (1) the evolution of the Tethys Seaway, (2) Cenozic cooling based on deep-sea oxygen isotopes andice-sheet development (Zachos et al., 2001, 2008), (3) the evolution of ocean circulation. The Tethys evolution is summarized according toAkhmet’ev and Beniamovski (2006), Rogl (1996), Barrier and Vrielynck (2008). The changes of other seaways are summarized accordingto Scotese (2001), Livermore et al. (2005) and Scher and Martin (2006). The Early Oligocene evidence of NADW formation is summarizedaccording to Davies et al. (2001), Via and Thomas (2006) and Scher and Martin (2008). The red line shows the NADW index based onbenthic carbon isotopes (Wright et al., 1992). The high value of1δ13C indicates active NADW, and the low value indicates inactive NADW.
American Seaways. These results challenge the prevailinghypothesis that the Drake Passage is the key player in ma-jor cooling events during the Cenozoic and the glaciation ofAntarctica.
The cooling effect of the Drake Passage and its impact onCenozoic glaciations might have been overestimated in theearlier sensitivity experiments (e.g., Nong et al., 2000; Sijpand England, 2004), as they were carried out with presenttopography and bathymetry. In this case, the intensity ofthe Antarctic Circumpolar Current (ACC) is above 100 Sv,once the Drake Passage is opened. However, as shown inthe present study, the Drake Passage was relatively narrowand shallow in the early Cenozoic, and ocean circulation wasdominated by the formation of SODW. As a consequence, theACC during the early Cenozoic is thought to have been sig-nificantly weaker than present (Huber and Sloan, 2001; thisstudy). With this in mind, the effect of the Drake Passageon ocean circulation and the climate of Antarctica during theearly Cenozoic should be reconsidered.
5.2 Implications for Cenozoic cooling
The mechanisms behind the long term Cenozoic coolingtrend and major cooling events are still under debate. Thereare four main hypotheses/theories, including the thermal iso-
lation of Antarctica (Kennett, 1977; Toggweiler and Bjorns-son, 2000), declining levels of atmospheric CO2 (DeContoand Pollard, 2003; Huber and Nof, 2006), uplift of largemountains (Raymo and Ruddiman, 1992), and modified in-solation patterns and seasonality (Coxall et al., 2005). Thethermal isolation hypothesis for understanding the cooling atthe Eocene-Oligocene boundary has been challenged by ge-ological evidence (Moran et al., 2006; Tripati et al., 2008),early modelling studies (DeConto and Pollard, 2003; Hu-ber and Nof, 2006) and the present study. The CO2 the-ory suggests that the declining levels of atmospheric CO2 ismore important in understanding the cooling at the Eocene-Oligocene boundary. This theory is strongly supported byreconstructions of Cenozoic atmospheric CO2 (e.g., Paganiet al., 2005; Zachos et al., 2008, Pearson et al., 2009) andmodelling studies (DeConto and Pollard, 2003; Huber andNof, 2006). However, this does not answer the questionwhy atmospheric CO2 levels decreased greatly during theCenozoic, and in particular at the Eocene-Oligocene bound-ary. The uplift hypothesis links mountain uplift with thedrop of atmospheric CO2 levels in the Cenozoic (Raymoand Ruddiman, 1992). The uplift of the Himalayas-TibetanPlateau, Rocky Mountains and Andes Mountains would in-crease chemical weathering, thereby reducing atmospheric
www.clim-past.net/7/801/2011/ Clim. Past, 7, 801–813, 2011

810 Z. Zhang et al.: Tropical seaways in Cenozoic cooling
CO2 levels and cause a cooling. This hypothesis is still im-portant in understanding the long-term cooling trend in theCenozoic. However, there are uncertainties in the historyof the uplift, and it is difficult to estimate how much atmo-spheric CO2 was removed in the process. The weak insola-tion hypothesis suggests that weak insolation caused by theEarth’s orbital configuration was the ultimate trigger for thecooling events at the Eocene-Oligocene boundary (Coxall etal., 2005). However, this hypothesis is based on a tuned agemodel, with its inherent uncertainties (Kuiper et al., 2008). Insummary, the key remaining problem in explaining the Ceno-zoic cooling is why atmospheric CO2 levels were greatly re-duced, in particular at the Eocene-Oligocene boundary.
In the present study, our experiments illustrate the linkagebetween tropical seaways and ocean circulations associatedwith the Cenozoic cooling. The constriction of the main trop-ical Atlantic seaways appears to play an important role in thetransition of ocean circulation from a SODW to a NADWocean circulation mode. The transition of ocean circulationscauses a significant cooling in the Southern Hemisphere. Wesuggest that this linkage is potentially important for under-standing the Cenozoic cooling, in particular for the coolingat the Eocene-Oligocene boundary.
However, there are still some limitations in our presentstudy. In order to better isolate the role of the seaways, wecarry out the experiments with the atmospheric CO2 levelfixed at eight times the preindustrial level. Due to the highatmospheric CO2 level, we are limited to address the possibleimpact of the decrease in atmospheric CO2 levels on oceancirculations. As earlier studies illustrated, the changes of at-mospheric CO2 level may also influence ocean circulationmodes (Lunt et al., 2010), and climate sensitivities to sea-ways associated with different atmosphere CO2 levels can bedifferent (Sijp et al., 2009). Furthermore, we do not distin-guish the respective roles of the Central American Seawayand the Tethys Seaway. Based on the Early Eocene land-seadistribution conditions, we are not able to consider the possi-ble influence of the widening of the Atlantic on the merid-ional overturning circulation (von der Heydt and Dijkstra,2008). With these limitations in mind, the linkage betweenthe tropical seaways and the ocean circulations still needsto be tested by more experiments with reduced atmosphericCO2 levels.
In our experiments, the local cooling in the SouthernHemisphere caused by the transition from a SODW to aNADW dominated ocean circulation is significant (Figs. 3dand 6a, b). However, the global effect of the transition isminimal, with a global mean cooling of 0.4◦C in SST. Theglobal cooling is weaker than what is estimated from avail-able geological evidence (e.g., Liu et al., 2009; Eldrett et al.,2009), indicating that changes in ocean circulation alone cannot fully explain the cooling at the Eocene-Oligocene bound-ary. Additional factors must be involved to account for thefull scale of the cooling, such as the drop of atmospheric CO2levels (DeConto and Pollard, 2003; Huber and Nof, 2006).
Here, we suggest the potential link between the transitionof ocean circulation from a SODW to a NADW dominatedmode and the large observed drop in atmospheric CO2 lev-els at the Eocene-Oligocene boundary. Since the ocean playsa vital role in the Earth’s carbon cycle, it is likely that thetransition of ocean circulation to a NADW dominated modemight have played an important role in causing the drop inatmospheric CO2 levels in the Cenozoic. The response ofthe carbon cycle can be very fast (e.g., Dunkley et al., 2010).Further improving our knowledge of the link between oceancirculation and the carbon cycle is important for understand-ing the cooling pattern at the surface (Liu et al., 2009), thedebate of bipolar versus polar glaciation (DeConto et al.,2008; Lear et al., 2008), and extinction and environmentalevents (Pearson et al., 2008) at the Eocene-Oligocene bound-ary. However, how the switch from a SODW to a NADWdominated mode of circulation impacted the carbon cycle re-mains an open question, which must be addressed by addi-tional proxy data and modelling studies.
Although the simulations presented here and the studies ofDeConto and Pollard (2003), Huber et al. (2004) and Huberand Nof (2006) indicate that the Drake Passage plays a mi-nor role in cooling the Antarctic continent, the impact of theDrake Passage opening/deepening on the long-term Ceno-zoic cooling trend should not be neglected. With a gradualexpansion and deepening of the Drake Passage, the strengthof the ACC is expected to have increased, possibly, playinga role in the observed long-term global cooling in the Ceno-zoic.
6 Summary
In summary, starting from an equilibrium simulation of theEarly Eocene, the important role of tropical seaways is high-lighted in the present study. The simulation shows a potentialimportant linkage between tropical seaways and the Ceno-zoic cooling. The Cenozoic cooling trend was enhancedby the transition between two different ocean circulationmodes: one corresponding to a SODW-dominated mode andthe other to a NADW-dominated mode. The closing of theTethys Seaway was likely to be key to the transition fromthe SODW to the NADW. The constriction of the TethysSeaway and the establishment of modern-like ocean circu-lation dominated by NADW formation might have triggeredthe Eocene-Oligocene cooling and glaciation over Antarc-tica, once atmospheric CO2 levels reached a critical level.Although the role of the Tethys Seaway is supported by somegeological evidence, the role of tropical seaways still needsto be investigated by more modelling and data studies infuture.
Clim. Past, 7, 801–813, 2011 www.clim-past.net/7/801/2011/

Z. Zhang et al.: Tropical seaways in Cenozoic cooling 811
Supplementary material related to thisarticle is available online at:http://www.clim-past.net/7/801/2011/cp-7-801-2011-supplement.pdf.
Acknowledgements.We sincerely thank Nanne Weber, GillesRamstein and Anna von der Heydt for their suggestions andcontributions during the revision of the paper. We thank RobertJacob for technical support on the model. We thank EysteinJansen, Martin Miles and Thomos Leslie Leith for thoughtful re-views, Yongqi Gao, Jinzhi Su, Xu Yue and Lei Yu for discussions.This work is supported by the National 973 Program of China underGrant 2010CB950102, the National Natural Science Foundation ofChina under Grant 40902054 and the funding from Statoil, Norway.
Edited by: N. Weber
References
Akhmet’ev, M. A. and Beniamovski, V. N.: The Paleocene andEocene in the Russian part of West Eurasia, Stratigr. Geol. Cor-rel., 14(1), 49–72,doi:10.1134/S0869593806010047, 2006.
Allen, M. B. and Armstrong, H. A.: Arabia-Eurasia collisionand the forcing of mid-Cenozoic global cooling, Palaeogeogr.Palaeocl., 265, 52–58, 2008.
Barker, P. F.: Scotia Sea regional tectonic evolution: implicationsfor mantle flow and palaeocirculation, Earth Sci. Rev., 55, 1–39,2001.
Barrier, E. and Vrielynck, B.: Palaeotectonic maps of the MiddleEast, CGMW, 2008.
Bettge, T. W., Weatherly, J. W., Washington, W. M., Pollard, D.,Briegleb, B. P., and Strand, W. G.: The CSM Sea Ice Model.NCAR Technical Note NCAR/TN-425+STR, National Centerfor Atmospheric Research, Boulder, Colorado, 1996.
Bice, K. L., Barron, E. J., and Peterson, W. H.: Reconstructionof realistic Early Eocene paleobathymetry and ocean GCM sen-sitivity to specified basin configuration, in: Tectonic BoundaryConditions for Climate Reconstructions, edited by: Crowley, T.and Burke, K., Oxford Univ. Press., 227–247, 1998.
Bijl, P., Schouten, S., Sluijs, A., Reichart, G., Zachos, J. C., andBrinkhuis, H.: Early palaeogene temperature evolution of thesouthwest pacific ocean, Nature, 461, 776–779, 2009.
Brinkhuis, H., Schouten, S., Collinson, M. E., Sluijs, A., Damste, J. S. S., Dickens, G. R., Huber, M., Cronin, T. M., Onodera,J., Takahashi, K., Bujak, J. P., Stein, R., van der Burgh, J.,Eldrett, J. S., Harding, I. C., Lotter, A. F., Sangiorgi, F., Cit-tert, H. K., de Leeuw, J. W., Matthiessen, J., Backman, J.,Moran, K., and the Expedition 302 Scientists: Episodic fresh sur-face waters in the Eocene Arctic Ocean, Nature, 441, 606–609,doi:10.1038/nature04692, 2006.
Bryan, K.: A numerical method for the study of the circulation ofthe World Ocean, J. Comp. Phys., 4, 347–376, 1969.
Cox, M. D.: A primitive equation three-dimensional model of theocean. Technical report GFDL ocean group Tech. Rep. 1, GFDL,Princeton, NJ, 1984.
Coxall, H. K., Wilson, P., Palike, H., Lear, C. H., and Backman, J.:H Rapid stepwise onset of Antarctic glaciation and deeper calcitecompensation in the Pacific Ocean, Nature, 433, 53–57, 2005.
Crowley, T. J.: North Atlantic Deep Water cools the southern hemi-sphere, Paleoceanography, 7, 489–498, 1992.
Davies, R., Cartwright, J., Pike, J., and Line, C.: Early Oligoceneinitiation of North Atlantic Deep Water formation, Nature, 410,917–920, 2001.
DeConto, R. M. and Pollard, D.: Rapid Cenozoic glaciation ofAntarctica induced by declining atmospheric CO2, Nature, 421,245–249, 2003.
Donnadieu, Y., Pierrehumbert, R., Jacob, R., and Fluteau, F.: Mod-elling the primary control of paleogeography on Cretaceous cli-mate, Earth Planet. Sci. Lett., 248, 426–437, 2006.
Droxler, A. W., Burke, K., Cunningham, A. D., Hine, A. C.,Rosencrantz, E., Duncan, D. S., Hallock, P., and Robinson, E.:Caribbean constraints on circulation between Atlantic and Pa-cific Oceans over the past 40 million years, In: Tectonic Bound-ary Conditions for Climate Reconstructions, edited by: Crowley,T. and Burke, K., Oxford Univ. Press., 169–191, 1998.
Dunkley Jones, T., Ridgwell, A., Lunt, D. J., Maslin, M. A.,Schmidt, D. N., and Valdes, P. J.: A Paleogene perspective onclimate sensitivity and methane hydrate instability, Philos. T. R.Soc., 368, 2395–2415,doi:10.1098/rsta.2010.0053, 2010.
Eberle, J. J., Fricke, H. C., Humphrey, J. D., Hackett, L., Newbrey,M. G., and Hutchinson, J. H.: Seasonal variability in Arctic tem-peratures during early Eocene time, Earth Planet. Sci. Lett., 296,481–486, 2010.
Eldrett, J. S., Greenwood, D. R., Harding, I. C., and Huber,M.: Increased seasonality through the Eocene to Oligocenetransition in Northern high latitudes, Nature, 459, 969–974,doi:10.1038/nature08069, 2009.
Fricke, H. C. and Wing, S. L.: Oxygen isotope and paleobotanicalextimates of temperature andδ18O-latitude gradients over NorthAmerica during the Early Eocene, Am. J. Sci., 304, 612–635,2004.
Greenwood, D. R., Archibald, S. B., Mathewes, R. W., and Moss,P. T.: Fossil biotas from the Okanagan Highlands, southernBritish Columbia and northeastern Washington State: climatesand ecosystems across an Eocene landscape, Can. J. Earth Sci.,42, 167–185,doi:10.1139/E04-100, 2005.
Hack, J. J, Boville, B. A., Briegleb, B. P., Kiehl, J. T., Rasch,P. J., and Williamson, D. L.: Description of the NCAR Com-munity Climate Model (CCM2). NCAR Tech. Note NCAR/TN-382+STR, Natl. Cent. Atmos. Res., Boulder, CO, 1993.
Heinemann, M., Jungclaus, J. H., and Marotzke, J.: Warm Pale-ocene/Eocene climate as simulated in ECHAM5/MPI-OM, Clim.Past, 5, 785–802,doi:10.5194/cp-5-785-2009, 2009.
Hollis, C. J., Handley, L., Crouch E. M., Morgans, H. E. G.,Baker, J. A., Creech, J., Collins, K. S., Gibbs, S. J., Huber, M.,Schouten, S., Zachos, J. C., and Pancost, R. D.: Tropical sea tem-peratures in the high-latitude South Pacific during the Eocene,Geology, 37(2), 99–102, 2009.
Hotinsky, R. M. and Toggweiler, J. R.: Impact of a Tethyan circum-global passage on ocean heat transport “and equable” climates,Paleoceanography, 18, 1007, doi:10.1029/2001PA000730, 2003.
Huber, M.: A Hotter Greenhouse?, Science, 321, 353–354, 2008.Huber, M. and Nof, D.: The ocean circulation in the southern
hemisphere and its climatic impacts in the Eocene, Palaeogeogr.Palaeocl., 231, 9–28, 2006.
Huber, M. and Sloan, L. C.: Heat transport, deep waters, and ther-mal gradients: coupled simulation of an Eocene greenhouse cli-
www.clim-past.net/7/801/2011/ Clim. Past, 7, 801–813, 2011

812 Z. Zhang et al.: Tropical seaways in Cenozoic cooling
mate, Geophys. Res. Lett., 28, 3481–3484, 2001.Huber, M., Brinkhuis, H., Stickley, C. E., Doos, K., Sluijs,
A., Warnaar, J., Schellenberg, S. A., and Williams, G. L.:Eocene circulation of the Southern Ocean: was Antarctica keptwarm by subtropical waters?, Paleoceanography, 19, PA4026,doi:10.1029/2004PA001014, 2004.
Ivany, L. C., Lohmann, K. C., Hasiuk, F., Blake, D. B., Glass, A.,Aronson, R. B., and Moody, R. M.: Eocene climate record of ahigh southern latitude continental shelf: Seymour Island, Antarc-tica, Geol. Soc. Am. Bull., 120, 659–678, 2008.
Jacob, R., Schafer, C., Foster, I., Tobis, M., and Anderson, J.: Com-putational Design and Performance of the Fast Ocean Atmo-sphere Model, Version One, in: Proc. 2001 International Con-ference on Computational Science, edited by: Alexandrov, V.N., Dongarra, J. J., and Tan, C. J. K., Springer-Verlag, 175–184,2001.
Kennett, J. P.: Cenozoic evolution of Antarctic glaciation, thecircum-Antarctic ocean, and their impact on global paleoceanog-raphy, J. Geophys. Res., 82, 3843–3859, 1977.
Kiehl, J. T., Hack, J. J., Bonan, G. B., Boville, B. A., Briegleb,B. P., Williamson, D. L., and Rasch, P. J.: Description of theNCAR Community Climate Model (CCM3). NCAR Tech. NoteNCAR/TN-420+STR, Natl. Cent. for Atmos. Res., Boulder, CO,1996.
Kuiper, K. F., Deino, A., Hilgen, F. J., Krijgsman, W., Renne, P. R.,and Wijbrans, J. R.: Synchronizing rock clocks of Earth History,Science, 320, 500–504,doi:10.1126/science.1154339, 2008.
Lagabrielle, Y., Godderis, Y., Donnadieu, Y, Malavieille, J., andSuarez, M.: The tectonic history of Drake Passage and its possi-ble impacts on global climate, Earth Planet. Sci. Lett., 279, 197–211, 2009.
Lear, C. H., Elderfield, H., and Wilson, P. A.: Cenozoicdeep-sea temperatures and global ice volumes from Mg/Cain benthic foraminiferal calcite, Science, 287, 269–272,doi:10.1126/science.287.5451.269, 2000.
Lear, C. H., Bailey, T. R., Pearson, P. N., Coxall, H. K., and Rosen-thal, Y.: Cooling and ice growth across the Eocene-Oligocenetransition, Geology, 36, 251–254, 2008.
Lee, S.-Y. and Poulsen, C. J.: Sea ice control of Plio-Pleistocenetropical Pacific climate evolution, Earth Planet. Sci. Lett., 248,238–247, 2006.
Liu, Z. and Wu, L.: Atmospheric response to the North Pacific SST:The role of ocean-atmosphere coupling, J. Climate, 17, 1859–1882, 2004.
Liu, Z., Kutzbach, J., and Wu, L.: Modeling Climate Shift of ElNino Variability in the Holocene, Geophys. Res. Lett., 27(15),2265–2268, 2000.
Liu, Z., Pagani, M., Zinniker, D., DeConto, R., Huber, M.,Brinkhuis, H., Shah, S. R., Leckie, R. M., and Pearson, A.:Global cooling during the Eocene-Oligocene climate transition,Science, 323, 1187–1190, 2009.
Livermore, R., Nankivell, A., Eagles, G., and Morris, P.: Paleogeneopening of Drake Passage, Earth. Planet. Sci. Lett., 236, 459–470,doi:10.1016/j.epsl.2005.03.027, 2005.
Lunt, D. J., Valdes, P. J., Dunkley Jones, T., Ridgwell, A., Hay-wood, A. M., Schmidt, D. N., Marsh, R., and Maslin, M.: CO2-driven ocean circulation changes as an amplifier of Paleocene-Eocene thermal maximum hydrate destabilization, Geology,38(10), 875–878,doi:10.1130/G31184.1, 2010.
Miller, K. G.: Middle Eocene to Oligocene stable isotopes, cli-mate, and deep-water history: The Terminal Eocene Event?,in: Eocene-Oligocene Climatic and Biotic Evolution, edited by:Prothero, D. and Berggren, W. A., Princeton Univ. Press, 160–177, 1992.
Moran, K., Backman, J., Brinkhuis, H., Clemens, S. C., Cronin,T., Dickens, G. R., Eynaud, F., Gattacceca, J., Jakobsson, M.,Jordan, R. W., Kaminski, M., King, J., Koc, N., Krylov, A.,Martinez, N., Matthiessen, J., McInroy, D., Moore, T. C., On-odera, J., ORegan, M., Palike, H., Rea, B., Rio, D., Sakamoto,T., Smith, D. C., Stein, R., St John, K., Suto, I., Suzuki, N.,Takahashi, K., Watanabe, M., Yamamoto, M., Farrell, J., Frank,M., Kubik, P., Jokat, W., and Kristoffersen, Y.: The Cenozoicpalaeoenvironment of the Arctic Ocean, Nature, 441, 601–605,doi:10.1038/nature04800, 2006.
Nisancioglu, K. H., Raymo, M. E., and Stone, P. H.: Reorganizationof Miocene deep water circulation in response to the shoaling ofthe Central American Seaway, Paleoceanography, 18(1), 1006,doi:10.1029/2002PA000767, 2003.
Nong, G. T., Najjar, R. G., Seidov, D., and Peterson, W. H.: Sim-ulation of ocean temperature change due to the opening of theDrake Passage, Geophys. Res. Lett., 27, 2689–2692, 2000.
Nunes, F. and Norris, R. D.: Abrupt reversal in ocean overturningduring the Palaeocene/Eocene warm period, Nature, 439, 60–63,doi:10.1038/nature04386, 2006.
Omta, A. W. and Dijkstra, H. A.: A physical mechanism for theAtlantic-Pacific flow reversal in the early Miocene, Glob. Planet.Change, 788, 1–12, 2003.
Pagani, M., Zachos, J. C., Freeman, K. H., Tipple, B., and Bohaty,S.: Marked decline in atmospheric carbon dioxide concentrationsduring the Paleogene, Science, 309, 600–603, 2005.
Pearson, P. N., van Dongen, B. E., Nicholas, C. J., Pancost, R. D.,Schouten, S., Singano, J., and Wade, B. S.: Stable warm trop-ical climate through the Eocene Epoch, Geology, 35, 211–214,doi:10.1130/G23175A.1, 2007.
Pearson, P. N., McMillan, I. K., Wade, B. S., Dunkley Jones, T.,Coxall, H. K., Bown, P. R., and Lear, C. H.: Extinction and envi-ronmental change across the Eocene-Oligocene boundary in Tan-zania, Geology, 36, 179–182,doi:10.1130/G24308A.1, 2008.
Pearson, P. N., Foster, G. L., and Wade, B. S.: Atmospheric car-bon dioxide through the Eocene-Oligocene climate transition,Nature, 461, 1110–1113, 2009.
Poulsen, C. J., Pierrehumbert, R. T., and Jacob, R. L.: Impact ofocean dynamics on the simulation of the Neoproterozoic “snow-ball earth”, Geophys. Res. Lett., 28(8), 1575–1578, 2001.
Poulsen, C. J. and Huynh, T. T.: Paleoceanography of the MesozoicPacific: A perspective from climate model simulations, in: Pa-leogeography of the North American Cordillera: Evidence Forand Against Large-Scale Displacements, edited by: Haggart, J.W., Enkin, R. J., and Monger, J. W. H., Geological Associationof Canada, Special Paper, 46, 13–28, 2006.
Ramstein, G., Fluteau, F., Besse, J., and Joussaume, S.: Effect oforogeny, plate motion and land-sea distribution on Eurasian cli-mate change over the past 30 million years, Nature, 386, 788–795, 1997.
Raymo, M. E. and Ruddiman, W. F.: Tectonic forcing of late Ceno-zoic climate, Nature, 359, 177–122, 1992.
Roberts, C. D., LeGrande, A. N., and Tripati, A. K.: Climate sen-sitivity to Arctic seaway restriction during the early Paleogene,
Clim. Past, 7, 801–813, 2011 www.clim-past.net/7/801/2011/

Z. Zhang et al.: Tropical seaways in Cenozoic cooling 813
Earth Planet. Sci. Lett., 286, 576–585, 2009.Rogl, F.: Mediterranean and Parateths, facts and hypotheses of an
Oligocene to Miocene paleogeography (short overview), Geo-logical Carpathica, 50(4), 339–349, 1999.
Royer, D. L.: CO2-forced climate thresholds during the Phanero-zoic, Geochim. Cosmochim. Acta, 70(23), 5665–5675, 2006.
Scher, H. D. and Martin, E. E.: Oligocene deep water export fromthe North Atlantic and the development of the Antarctic Circum-polar Current examined with neodymium isotopes, Paleoceanog-raphy, 23, PA1205,doi:10.1029/2006PA001400, 2008.
Scher, H. D. and Martin, E. E.: Timing and climatic Conse-quences of the opening of Drake Passage, Science, 312, 428–430,doi:10.1126/science.1120044, 2006.
Schmitz, B., Heilmann-Clausen, C., King, C., Steurbaut, E., An-dreasson, F. P., Corfield, R. M., and Cartlidge, J. E.: Stableisotope and biotic evolution in the North Sea during the earlyEocene: the Albæk Hoved section, Denmark, Geological Soci-ety, London, Special Publications, 101, 275–306, 1996.
Scotese, C. R.: Digital Paleogeographic Map Archive on CD-ROM,PALEOMAP Project, Arlington, Texas, 2001.
Shellito, C. J., Lamarque J. F., and Sloan, L. C.: Early Eocene Arc-tic climate sensitivity topCO2 and basin geography, Geophys.Res. Lett., 36, L09707,doi:10.1029/2009GL037248, 2009.
Sijp, W. P. and England, M. H.: Effect of the Drake PassageThroughflow on global climate, J. Phys. Oceanogr., 34, 1254–1266, 2004.
Sijp, W. P., England, M. H., and Toggweiler, J. R.: Effect ofocean gateway changes under greenhouse warmth, J. Climate,22, 6639–6652, 2009.
Sluijs, A., Schouten, S., Pagani, M., Woltering, M., Brinkhuis,H., Damste, J. S. S., Dickens, G. R., Huber, M., Reichart,G.-J., Stein, R., Matthiessen, J., Lourens, L. J., Pedentchouk,N., Backman, J., Moran, K., and the Expedition 302 Sci-entists: Subtropical Arctic Ocean temperatures during thePalaeocene/Eocene thermal maximum, Nature, 441, 610–613,doi:10.1038/nature04668, 2006.
Sluijs, A., Brinkhuis, H., Schouten, S., Bohaty, S. M., John, C. M.,Zachos, J. C., Reichart, G., Damste, J. S. S., Crouch, E. M., andDickens, G. R.: Environmental precursors to rapid light carboninjection at the Palaeocene/Eocene boundary, Nature, 450, 1218–1221, 2007.
Speelman, E. N., Sewall, J. O., Noone, D., Huber, M., von derHeydt, A., Damste, J. S., and Reichart, G.-J.: Modeling the in-fluence of a reduced equator-to-pole sea surface temperature gra-dient on the distribution of water isotopes in the Early/MiddleEocene, Earth Planet. Sci. Lett., 298, 57–65, 2010.
Tindall, J., Flecker, R., Valdes, P., Schmidt, D. N., Markwick, P.,and Harris, J.: Modeling the oxygen isotope distribution of an-cient seawater using a coupled ocean-atmosphere GCM: Implica-tions for reconstructing early Eocene climate, Earth Planet. Sci.Lett., 292, 265–273,doi:10.1016/j.epsl.2009.12.049, 2010.
Toggweiler, J. R. and Bjornsson, H.: Drake Passage and paleocli-mate, J. Quat. Sci., 15, 238–319, 2000.
Tripati, A. K., Delaney, M. L., Zachos, J. C., Anderson, L. D.,Kelly, D. C., and Elderfield, H.: Tropical sea-surface temper-ature reconstruction for the early Paleogene using Mg/Ca ra-tios of planktonic foraminifera, Paleoceanography, 18, 1101,doi:10.1029/2003PA000937, 2003.
Tripati, A. K., Eagle, R. A., Morton, A., Dowdeswell, J. A., Atkin-son, K. L., Bahe, Y., Dawber, C. F., Khadun, E., Shaw, R. M. H.,Shorttle, O., and Thanabalasundaram, L.: Evidence for North-ern Hemisphere glaciation back to 44 Ma from ice-rafted debrisin the Greenland Sea, Earth. Planet. Sci. Lett., 265, 112–122,doi:10.1016/j.epsl.2007.09.045, 2008.
Via, R. K. and Thomas, D. J.: Evolution of Atlantic ther-mohaline circulation: Early Oligocene onset of deep-waterproduction in the North Atlantic, Geology, 34(6), 441–444,doi:10.1130/G22545.1, 2006.
von der Heydt, A. and Dijkstra, H. A.: Effect of ocean gatewayson the global ocean circulation in the late Oligocene and earlyMiocene, Paleoceanography, 21, PA1011, 2006.
von der Heydt, A. and Dijkstra, H. A.: The effect of gatewayson ocean circulation patterns in the Cenozoic, Global Planet.Change, 62, 132–146, 2008.
Winguth, A., Shellito, C., Shields, C., and Winguth, C.: Climateresponse at the Paleocene- Eocene thermal maximum to green-house gas forcing-A model study with CCSM3, J. Clim., 23,2562–2584,doi:10.1175/2009JCLI3113.1, 2010.
Wright, J. D., Miller, K. G., and Fairbanks, R. G.: Early and MiddleMiocene stable isotopes: implications for deepwater circulationand climate, Paleoceanography, 7(3), 357–389, 1992.
Zachos, J. C., Stott, L. D., and Lohmann, K. C.: Evolution of earlyCenozoic marine temperature, Paleoceanography, 9, 353–387,1994.
Zachos, J. C., Pagani, M., Sloan, L., Thomas, E., and Billups, K.:Trends, rhythms, and aberrations in global climate 65 Ma topresent, Science, 292, 686–693,doi:10.1126/science.1059412,2001.
Zachos, J. C., Dickens, G. R., and Zeebe, R. E.: An early Cenozoicperspective on greenhouse warming and carbon-cycle dynamics,Nature, 451, 279–283, 2008.
Zhang, Z.-S., Wang, H.-J., Guo, Z., and Jiang, D.: What triggersthe transition of palaeoenvironmental patterns in China, the Ti-betan Plateau uplift or the Paratethys Sea retreat?, Palaeogeogr.Palaeoclimatol. Palaeoecol., 245, 317–331, 2007a.
Zhang, Z.-S., Wang, H., Guo, Z., and Jiang, D.: Impacts of tectonicchanges on the reorganization of the Cenozoic paleoclimatic pat-terns in China, Earth Planet. Sci. Lett., 257, 622–634, 2007b.
Zhang, Z.-S., Yan Q., and Wang, H.-J.: Does the Drake Passageplay an essentially important role in the Cenozoic Cooling?, At-mos. Ocean. Sci. Lett., 3, 288–292, 2010.
www.clim-past.net/7/801/2011/ Clim. Past, 7, 801–813, 2011