tropical cyclones and climate change - app state
TRANSCRIPT
Advanced Review
Tropical cyclones andclimate changeKevin J.E. Walsh,1 John L. McBride,2 Philip J. Klotzbach,3
Sethurathinam Balachandran,4 Suzana J. Camargo,5 Greg Holland,6
Thomas R. Knutson,7 James P. Kossin,8 Tsz-cheung Lee,9
Adam Sobel10 and Masato Sugi11
Edited by Matilde Rusticucci, Domain Editor, and Mike Hulme, Editor-in-Chief
Recent research has strengthened the understanding of the links between cli-mate and tropical cyclones (TCs) on various timescales. Geological records ofpast climates have shown century-long variations in TC numbers. While no sig-nificant trends have been identified in the Atlantic since the late 19th century,significant observed trends in TC numbers and intensities have occurred in thisbasin over the past few decades, and trends in other basins are increasinglybeing identified. However, understanding of the causes of these trends is incom-plete, and confidence in these trends continues to be hampered by a lack of con-sistent observations in some basins. A theoretical basis for maximum TCintensity appears now to be well established, but a climate theory of TC forma-tion remains elusive. Climate models mostly continue to predict future decreasesin global TC numbers, projected increases in the intensities of the strongeststorms and increased rainfall rates. Sea level rise will likely contribute towardincreased storm surge risk. Against the background of global climate changeand sea level rise, it is important to carry out quantitative assessments on thepotential risk of TC-induced storm surge and flooding to densely populatedcities and river deltas. Several climate models are now able to generate a gooddistribution of both TC numbers and intensities in the current climate. Inconsist-ent TC projection results emerge from modeling studies due to different down-scaling methodologies and warming scenarios, inconsistencies in projectedchanges of large-scale conditions, and differences in model physics and trackingalgorithms. © 2015 Wiley Periodicals, Inc.
How to cite this article:WIREs Clim Change 2016, 7:65–89. doi: 10.1002/wcc.371
*Correspondence to: [email protected] of Earth Sciences, University of Melbourne, Parkville,Australia2Centre for Climate Research Singapore (CCRS), MeteorologicalService Singapore, Singapore, Singapore3Department of Atmospheric Science, Colorado State University,Fort Collins, CO, USA4Cyclone Warning Research Centre, Regional Meteorological Cen-tre, Chennai, India5Lamont-Doherty Earth Observatory, Columbia University, Pali-sades, NY, USA6National Center for Atmospheric Research, Boulder, CO, USA
7National Oceanic and Atmospheric Administration (NOAA),Geophysical Fluid Dynamics Laboratory, Princeton, NJ, USA8National Oceanic and Atmospheric Administration (NOAA),National Centers for Environmental Information, Asheville,NC, USA9Hong Kong Observatory, Hong Kong, China10Columbia University, Palisades, NY, USA11Meteorological Research Institute, Japan Meteorological Agency,Ibaraki, Japan
Conflict of interest: The authors have declared no conflicts of inter-est for this article.
Volume 7, January/February 2016 © 2015 Wiley Per iodica ls , Inc. 65
INTRODUCTION
Estimates of the effect of anthropogenic climatechange on tropical cyclones (TCs) generally fall
into two main topics: whether changes in the climateto date have already had a detectable effect on TCsand what portion of this is due to anthropogenic ornatural causes, and how climate change might affectTCs in the future. Assessments of observed trends inTC characteristics are affected by the same datahomogeneity issues that affect all climate variables,so that a starting point for such an analysis is theconstruction of a dataset that is free from spurioustrends due to changes in observing and assessmentpractices. These issues are important for TCs, as themost comprehensive datasets of TC records, the besttrack datasets,1 were designed as best estimates ofTC data using the techniques available at the time ofcompilation. Thus, they were not primarily intendedas datasets to be used for trend analysis. Neverthe-less, recent advances in the production of more tem-porally homogeneous datasets have been made, andanalysis of these datasets is starting to reveal impor-tant new results.2,3 The increasing use of atmosphericreanalysis datasets4–9 has facilitated analysis of theimpact of changes in climate variables on TCs,although reanalyses have significant potential homo-geneity issues relevant to TC activity.10,11 Currentreanalysis products have substantial limitations intheir explicit representation of TCs,12 and their per-formance in representing various TC climatologicalmetrics varies among available reanalyses.13 Effortshave also been made using geological techniques todetermine TC incidence in the distant past, and thesestudies have revealed surprisingly large long-termvariations in past TC activity.14–16
For future projections of TCs, climate models(general circulation models or GCMs) have improvedto the point where the best models can now givereasonable simulations of numbers of the averagenumber of TCs in all TC basins, including theiryear-to-year variability.17,18 While there is still roomfor improvement, global GCMs are also showingan increasing ability to simulate the intensity distri-bution of observed TCs in both SST-forced19 andcoupled20 configurations. This latter task in particu-lar requires high model resolution, so variousdynamical,21 statistical,22,23 and hybrid5 ‘downscal-ing’ techniques have been developed to bridge the gapbetween the relatively low resolution of most climatemodels (e.g., the CMIP5 models used for many cli-mate change projections24) and the fine detail requiredfor reliable simulation of TC intensities, an importantcapability for future climate projections of TCs.
Confidence in future projections has beenincreased by theoretical ideas and techniques thatrelate climate variables to TCs. These have enabledboth a better understanding of TC dynamics andimproved confidence in future projections. While agenerally accepted climate theory of TC formation isstill lacking, a climate theory of TC maximum inten-sity (potential intensity, PI) is now well estab-lished.25,26 Analysis and model experiments arebeginning to determine the crucial climate variablesassociated with changes in TC formation rate.
This review summarizes recent research in theinterdisciplinary field of TCs and climate change. Itdoes not attempt an updated assessment of the sci-ence beyond that given in the IPCC 5th AssessmentReport27; i.e., this review does not make synthesisstatements regarding our overall level of confidencein predictions of climate change science. Neverthe-less, this review is motivated by recent developmentsin this field since the previous review and assess-ment.28 The increasing compilation and analysis ofimproved, more homogeneous TC datasets hasenabled more conclusive results to be producedabout TC trends. There is an increasing availabilityof datasets from before the period of written records.Additionally, the best-performing climate modelingsystems are now producing not only a good simula-tion of numbers and geographical patterns of TC for-mation but also a rapidly improving representationof the distribution of TC intensity. These three devel-opments motivate a new review of this topic.
OBSERVATIONS OF TCS
PaleotempestologyPaleotempestology is the study of storm occurrencein the past before written records became available.The purpose of paleotempestology is to establishwhether there have been variations in the numberand intensity of TCs over geologic time periods. Thisprovides a way of establishing a longer climate base-line than the relatively short observational recordand also for exploring the dependence of TC activityon climate change. Many types of geological proxieshave been tested for reconstructing past hurricaneactivity; the most common proxies are based onhurricane-induced overwash deposits of sediments ofcoastal lakes and marshes.16,29,30 Other emergingproxies are based on oxygen isotopic ratios of hurri-cane precipitation in caves (stalagmites), tree rings,and corals.15,31,32 As these studies typically focus ona specific geographic location, a caveat that shouldbe considered is that they cannot distinguish between
Advanced Review wires.wiley.com/climatechange
66 © 2015 Wiley Per iodicals , Inc. Volume 7, January/February 2016
basin-wide trends or variability and systematicchanges in TC tracks, both of which may be modu-lated by climate.33 One method to evaluate the signif-icance of the obtained patterns of overwashreconstructions is to employ a large set of synthetichurricane tracks for a specific site.34
A number of significant recent advances havebeen made in this work. In the Australian region,oxygen isotopic analysis of stalagmite records hasbeen used35 to infer that the TC incidence in north-east Queensland is less at present than at any time inthe past 1500 years. In the Atlantic basin, e.g., Bran-don et al.30 use overwash deposits to show that aperiod of increased intense hurricane frequency isobserved between ~1700 and ~600 years before thepresent (B.P.) and decreased intense storm frequencyis observed from ~2500 to ~1700 and ~600 yearsB.P. to the present. Thus, there have been large,unexplained variations in TC climatology in the rela-tively recent geologic past.16,29,36
These sedimentary records only go back a fewmillennia, however. Therefore, dynamical,37
statistical,38 and statistical–dynamical39 modelingstudies of more distant past climates have becomemore common. For both the Holocene (6 ka beforethe present) and the Last Glacial Maximum (LGM;21 ka), Korty et al.40,41 show that even though condi-tions during the LGM were cooler than today, therewas not a systematic decrease in either PI or otherenvironmental variables associated with TC fre-quency. Sugi et al.42 found that their model-simulated TC frequency significantly increases in a4 K cooler climate GCM experiment, indicating thatthere may be more TCs in a glacial period, consistentwith the consensus finding that overall TC frequencydecreases with warming43 and showing that a climatewith generally cooler SSTs does not imply fewerTCs.44 They also pointed out that TC formationunder these conditions can occur at sea-surface tem-peratures (SSTs) well below 26�C, a value conven-tionally used to indicate the minimum threshold forTC formation in our present-day climate.45 Merlis46
used the GFDL HiRAM model to show that TC fre-quency was simulated to increase during the LGM.
Historical and Satellite EraObserved TC data during what is called the ‘histori-cal’ era (in this case typically from the 19th centuryonward, the period when ship observations becamemore routine) are compiled in what is known as ‘besttrack’ datasets. These compilations are the best esti-mates of TC characteristics such as position andintensity, but are subject to ongoing review.47
The recent introduction of the IBTrACS compi-lation of best track datasets1 has considerably facili-tated analysis of global climate trends. Creating anhomogenous climate record from best track data con-tinues to be a challenge, however, especially forcyclone intensity data,48 as the quality of measuringtechniques has generally improved over time. Theparallel creation of more homogeneous satellite-derived datasets3 increasingly enables analysis of cli-mate variability for the recent decades.
In addition to cyclone intensity, both size andtranslation speed have been shown to be substantialcontributors to the impacts resulting from hurricanepassage.49–52 Emphasis on increased attention tothese parameters in the development of future data-sets is therefore desirable, along with creative meth-ods for developing new approaches to theirdetermination from past climate.53 It has been shownthat for observed Atlantic TC intensities and sea sur-face cooling due to the passage of a TC, storm trans-lation speed affects the amount of local cooling, butthe cooling does not increase monotonically for allintensities.54 This indicates a role for ocean subsur-face thermal structure in modulating the ability ofstorms to intensify and thus alter the degree of cool-ing under intense TCs.55
Global ObservationsA previous review of this topic28 concluded that ‘itremains uncertain whether past changes in TC activ-ity have exceeded the variability expected from natu-ral causes.’ While there remain concerns about thetemporal homogeneity of the best track record,56,57
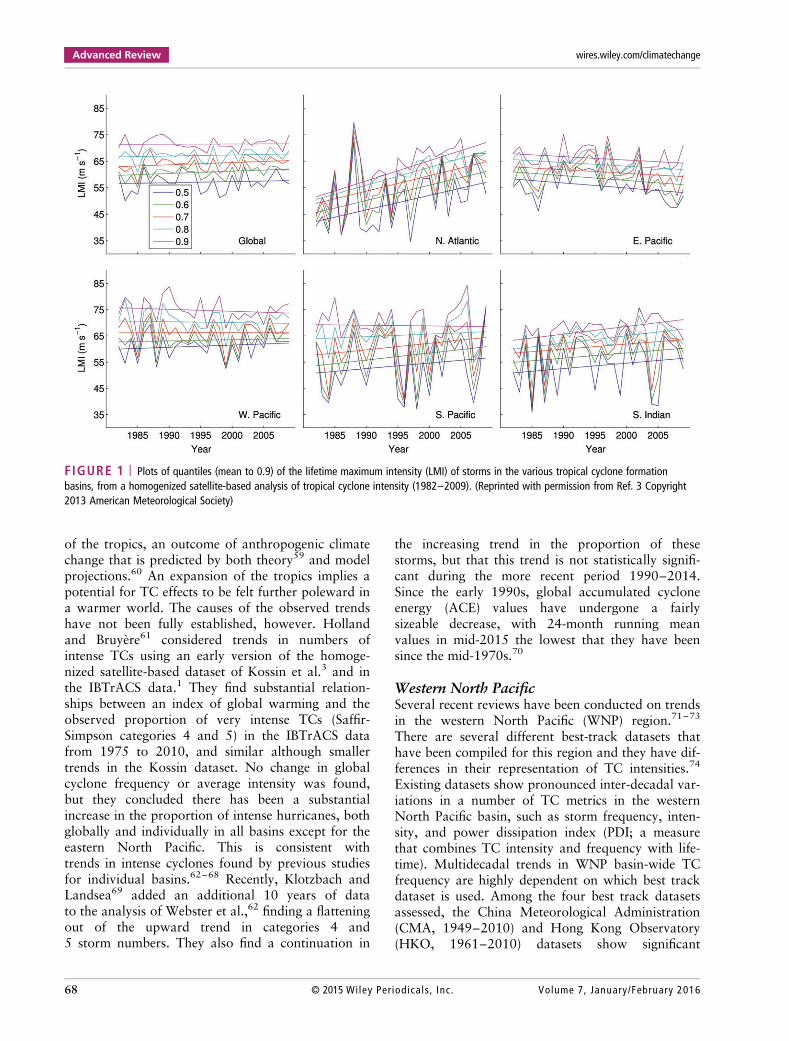
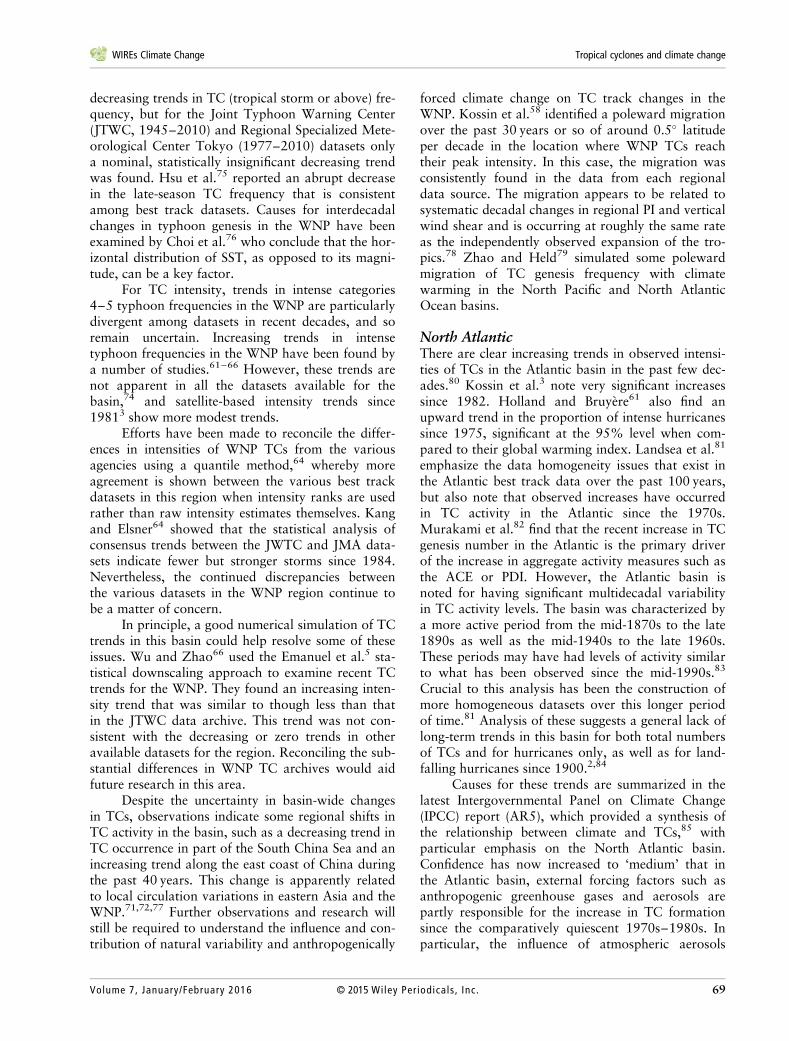
recent studies using satellite-based temporally homo-genized datasets are beginning to suggest climatetrends of various kinds in the TC record over thepast few decades. For example, a summary of trendsin the lifetime maximum intensity of TCTCs in vari-ous ocean basins3 is shown in Figure 1, for theperiod 1989–2009. Globally, there are modest signif-icant trends in this quantity (at the 90% level), butindividual basins have greater significance. In theNorth Atlantic and Western North Pacific, trends arehighly significant at the 95% level, with increases inthe North Atlantic and decreases in the WesternNorth Pacific. More modest trends significant at the90% level are seen in the South Pacific and the SouthIndian basins (both upwards). Trends have not beensignificant in the Eastern North Pacific and the NorthIndian basin has insufficient data. More recently,Kossin et al.58 find significant poleward movement inthe latitude of the maximum intensity of TCs overthe period 1982–2012. This result is potentiallyimportant as an indicator of the poleward expansion
WIREs Climate Change Tropical cyclones and climate change
Volume 7, January/February 2016 © 2015 Wiley Per iodica ls , Inc. 67
of the tropics, an outcome of anthropogenic climatechange that is predicted by both theory59 and modelprojections.60 An expansion of the tropics implies apotential for TC effects to be felt further poleward ina warmer world. The causes of the observed trendshave not been fully established, however. Hollandand Bruyère61 considered trends in numbers ofintense TCs using an early version of the homoge-nized satellite-based dataset of Kossin et al.3 and inthe IBTrACS data.1 They find substantial relation-ships between an index of global warming and theobserved proportion of very intense TCs (Saffir-Simpson categories 4 and 5) in the IBTrACS datafrom 1975 to 2010, and similar although smallertrends in the Kossin dataset. No change in globalcyclone frequency or average intensity was found,but they concluded there has been a substantialincrease in the proportion of intense hurricanes, bothglobally and individually in all basins except for theeastern North Pacific. This is consistent withtrends in intense cyclones found by previous studiesfor individual basins.62–68 Recently, Klotzbach andLandsea69 added an additional 10 years of datato the analysis of Webster et al.,62 finding a flatteningout of the upward trend in categories 4 and5 storm numbers. They also find a continuation in
the increasing trend in the proportion of thesestorms, but that this trend is not statistically signifi-cant during the more recent period 1990–2014.Since the early 1990s, global accumulated cycloneenergy (ACE) values have undergone a fairlysizeable decrease, with 24-month running meanvalues in mid-2015 the lowest that they have beensince the mid-1970s.70
Western North PacificSeveral recent reviews have been conducted on trendsin the western North Pacific (WNP) region.71–73
There are several different best-track datasets thathave been compiled for this region and they have dif-ferences in their representation of TC intensities.74
Existing datasets show pronounced inter-decadal var-iations in a number of TC metrics in the westernNorth Pacific basin, such as storm frequency, inten-sity, and power dissipation index (PDI; a measurethat combines TC intensity and frequency with life-time). Multidecadal trends in WNP basin-wide TCfrequency are highly dependent on which best trackdataset is used. Among the four best track datasetsassessed, the China Meteorological Administration(CMA, 1949–2010) and Hong Kong Observatory(HKO, 1961–2010) datasets show significant
FIGURE 1 | Plots of quantiles (mean to 0.9) of the lifetime maximum intensity (LMI) of storms in the various tropical cyclone formationbasins, from a homogenized satellite-based analysis of tropical cyclone intensity (1982–2009). (Reprinted with permission from Ref. 3 Copyright2013 American Meteorological Society)
Advanced Review wires.wiley.com/climatechange
68 © 2015 Wiley Per iodicals , Inc. Volume 7, January/February 2016
decreasing trends in TC (tropical storm or above) fre-quency, but for the Joint Typhoon Warning Center(JTWC, 1945–2010) and Regional Specialized Mete-orological Center Tokyo (1977–2010) datasets onlya nominal, statistically insignificant decreasing trendwas found. Hsu et al.75 reported an abrupt decreasein the late-season TC frequency that is consistentamong best track datasets. Causes for interdecadalchanges in typhoon genesis in the WNP have beenexamined by Choi et al.76 who conclude that the hor-izontal distribution of SST, as opposed to its magni-tude, can be a key factor.
For TC intensity, trends in intense categories4–5 typhoon frequencies in the WNP are particularlydivergent among datasets in recent decades, and soremain uncertain. Increasing trends in intensetyphoon frequencies in the WNP have been found bya number of studies.61–66 However, these trends arenot apparent in all the datasets available for thebasin,74 and satellite-based intensity trends since19813 show more modest trends.
Efforts have been made to reconcile the differ-ences in intensities of WNP TCs from the variousagencies using a quantile method,64 whereby moreagreement is shown between the various best trackdatasets in this region when intensity ranks are usedrather than raw intensity estimates themselves. Kangand Elsner64 showed that the statistical analysis ofconsensus trends between the JWTC and JMA data-sets indicate fewer but stronger storms since 1984.Nevertheless, the continued discrepancies betweenthe various datasets in the WNP region continue tobe a matter of concern.
In principle, a good numerical simulation of TCtrends in this basin could help resolve some of theseissues. Wu and Zhao66 used the Emanuel et al.5 sta-tistical downscaling approach to examine recent TCtrends for the WNP. They found an increasing inten-sity trend that was similar to though less than thatin the JTWC data archive. This trend was not con-sistent with the decreasing or zero trends in otheravailable datasets for the region. Reconciling the sub-stantial differences in WNP TC archives would aidfuture research in this area.
Despite the uncertainty in basin-wide changesin TCs, observations indicate some regional shifts inTC activity in the basin, such as a decreasing trend inTC occurrence in part of the South China Sea and anincreasing trend along the east coast of China duringthe past 40 years. This change is apparently relatedto local circulation variations in eastern Asia and theWNP.71,72,77 Further observations and research willstill be required to understand the influence and con-tribution of natural variability and anthropogenically
forced climate change on TC track changes in theWNP. Kossin et al.58 identified a poleward migrationover the past 30 years or so of around 0.5� latitudeper decade in the location where WNP TCs reachtheir peak intensity. In this case, the migration wasconsistently found in the data from each regionaldata source. The migration appears to be related tosystematic decadal changes in regional PI and verticalwind shear and is occurring at roughly the same rateas the independently observed expansion of the tro-pics.78 Zhao and Held79 simulated some polewardmigration of TC genesis frequency with climatewarming in the North Pacific and North AtlanticOcean basins.
North AtlanticThere are clear increasing trends in observed intensi-ties of TCs in the Atlantic basin in the past few dec-ades.80 Kossin et al.3 note very significant increasessince 1982. Holland and Bruyère61 also find anupward trend in the proportion of intense hurricanessince 1975, significant at the 95% level when com-pared to their global warming index. Landsea et al.81
emphasize the data homogeneity issues that exist inthe Atlantic best track data over the past 100 years,but also note that observed increases have occurredin TC activity in the Atlantic since the 1970s.Murakami et al.82 find that the recent increase in TCgenesis number in the Atlantic is the primary driverof the increase in aggregate activity measures such asthe ACE or PDI. However, the Atlantic basin isnoted for having significant multidecadal variabilityin TC activity levels. The basin was characterized bya more active period from the mid-1870s to the late1890s as well as the mid-1940s to the late 1960s.These periods may have had levels of activity similarto what has been observed since the mid-1990s.83
Crucial to this analysis has been the construction ofmore homogeneous datasets over this longer periodof time.81 Analysis of these suggests a general lack oflong-term trends in this basin for both total numbersof TCs and for hurricanes only, as well as for land-falling hurricanes since 1900.2,84
Causes for these trends are summarized in thelatest Intergovernmental Panel on Climate Change(IPCC) report (AR5), which provided a synthesis ofthe relationship between climate and TCs,85 withparticular emphasis on the North Atlantic basin.Confidence has now increased to ‘medium’ that inthe Atlantic basin, external forcing factors such asanthropogenic greenhouse gases and aerosols arepartly responsible for the increase in TC formationsince the comparatively quiescent 1970s–1980s. Inparticular, the influence of atmospheric aerosols
WIREs Climate Change Tropical cyclones and climate change
Volume 7, January/February 2016 © 2015 Wiley Per iodica ls , Inc. 69
appears to be important in producing the quiescentperiod in Atlantic TC activity (from about the late1960s to the early 1990s).18,23,86–89 An additionalcomponent of this variability is likely driven by fluc-tuations in the strength of the Atlantic thermohalinecirculation that drive changes in SST patterns in theAtlantic Main Development Region.90–92 In theAtlantic, observed multidecadal variability of theocean and atmosphere has been attributed to naturalinternal variability via meridional overturning oceancirculation changes93 natural external variabilitycaused by volcanic eruptions94 and Saharan dustoutbreaks,95,96 and anthropogenic external forcingvia greenhouse gases and sulfate aerosols.207 How-ever, the relative contributions of each mechanism tothe observed multidecadal variability in the Atlanticare presently an active area of research and debate.
It has also been hypothesized that changes inboth frequency and intensity of TCs in the Atlanticbasin are related to decreases in tropical tropopausetemperatures in that basin. Emanuel et al.97 used aTC downscaling technique to show that this coolinghas contributed to the estimated change in PI in thisbasin. It was also noted that the trends in this varia-ble in the NCEP-1 reanalysis98 are larger than thosefrom other datasets and so likely overestimate thesePI trends. Using a high-resolution model forced byobserved SSTs, Vecchi et al.10 showed that strongcooling in the tropical tropopause layer seen in theNCEP-1 reanalysis is neither simulated by the model,nor it is evident in other observational estimates. Inaddition, the simulated TC frequency changes in theirmodel are neither significantly affected by simulatedtropical tropopause layer temperature changes, nordo they scale directly with PI, and yet the model isstill able to simulate the observed TC trends since1980. They concluded that the tropical tropopauselayer temperature trends in the NCEP-1 Reanalysisare therefore unlikely to be accurate, and likely drivespuriously positive TC and PI trends, along with aninflated connection between absolute surface temper-ature warming and TC activity increases. A recentstudy by Kossin,11 which uses TCs to more directlysample global upper tropospheric temperatures, lendssome support to this claim.
Other TC-related datasets have been analyzedfor trends in this basin. Using tide gage data,Grinsted et al.99 conclude that there is a significantpositive trend in eastern United States in storm surgeincidence from 1923 to 2008. Peduzzi et al.100 notethat demographic pressures over the next 20 yearswill exacerbate the risk of TC damage, due toincreased exposure in the increasingly densely popu-lated coastal regions.
North IndianDuring the period 1961–2008, several studies findsubstantial decreasing trends in TC activity in theBay of Bengal and Arabian Sea, particular during themonsoon season.101–103 In contrast, Singh67 found amarked increasing trend in the most intense TCs inrecent decades. Holland and Bruyère61 also found avery large increasing trend in the proportion ofintense hurricanes in this region since 1975. This wasshown to be consistent with global warming trendsat the 95% significance level. Geetha and Balachan-dran104 have studied the decadal variations in thetranslational speeds of cyclonic disturbances (CDs)over the North Indian Ocean over the period1961–2010 and have noted that during the mostrecent decade, the most probable speeds of CDs haveincreased over the Bay of Bengal, but have decreasedover the Arabian Sea.
There are substantial concerns about inhomo-geneity due to changes in analysis and observingmethods in this basin. For example, prior to theintroduction of Meteosat-5 geostationary satelliteimagery in 1998, viewing angles in the North IndianOcean were quite oblique, making identification ofthe strongest storms quite challenging.3
In the adjacent Arabian Sea region, Evanet al.105 linked reduced wind shear to the recentobserved increase in the number of very intensestorms in that region, including the five very severecyclones that have occurred since 1998. The funda-mental cause of this proposed linkage is not yet cer-tain, however.105–107
Demographic changes in coastal regions ofthis basin are also driving changes in TC impacts.Raghaven and Rajesh108 examined cyclone landfallsin Andhra Pradesh, India and found a markedincrease in impacts, which they attributed to changingeconomic circumstances and coastal development.
South Indian, South Pacific,and Northeast PacificCallaghan and Power109 find a statistically significantdecrease in eastern Australia land-falling TCs sincethe late 19th century, although Hartmann et al.110
note that after including 2010/2011 season data, thistrend becomes nonsignificant (i.e., a trend of zero liesjust inside the 90% confidence interval). Holland andBruyère61 analyzed the South Indian and westernSouth Pacific regions separately and found anincreasing trend in the proportion of intense hurri-canes that was significantly related to global warm-ing at the 99% level. However, the South IndianOcean basin had the same oblique viewing angle
Advanced Review wires.wiley.com/climatechange
70 © 2015 Wiley Per iodicals , Inc. Volume 7, January/February 2016
issues that characterized the North Indian Ocean3
which could partially explain the trend found in thatregion.
In contrast, Kuleshov et al.111 analyzed a com-piled Southern Hemisphere best track data archivefrom 1981. They found no trends in the total num-bers of TCs nor in numbers of TCs with central pres-sures of 970 hPa and lower in the Southern IndianOcean and the South Pacific Ocean (such TCs beingcalled ‘severe’ in the Southern Hemisphere). Positivetrends in the numbers of TCs with central pressuresof less than 945 hPa in the Southern Indian Oceanare significant but appear to be influenced to someextent by changes in data quality. Malan et al.112
reported an increased occurrence of severe stormdays (category 3 or higher) in the Southwest IndianOcean since the 1990s associated with the increase inTC heat potential, although total cyclone numbersdecreased. In the Australian region, Kuleshovet al.111 found no significant trends in the total num-ber of TCs, or in the proportion of the most intenseTCs. While this conclusion of Kuleshov et al. is dif-ferent from that of Holland and Bruyère, slight dif-ferences in the methodologies between these twostudies may account for this difference.
For the northeast Pacific, studies that haveexamined trends in this region as part of global trendanalysis have found no significant trends in intenseTCs.62,113 Interdecadal variability in landfallingstorms on the Pacific coast of Mexico is substantialand appears to be modulated by the Pacific DecadalOscillation.114–116
ENSO, TCs, and Climate ChangeTC incidence in various formation basins isstrongly tied to ENSO variations.117–122 Thus, anysubstantial change in the behavior of ENSO in awarmer world would cause substantial accompany-ing changes in TC formation regions and tracks.Current high-resolution climate models simulateaspects of the relationship between ENSO and TCswell.20,123–127 Nevertheless, Christensen et al.128
concluded that at present there was still low confi-dence in projected changes of the intensity and spa-tial pattern of ENSO in a changed climate, and thussimilarly low confidence in future changes in TC for-mation regions due to changes in ENSO.
Relationships between TC Formationand ClimateUnderstanding the fundamental links between cli-mate and TC is vital to improving the confidence of
our future projections of TCs. At present, there is noclimate theory of TC formation, in the sense that thenumber of TCs likely to be produced in a particularclimate can be confidently calculated. Links betweenwhat appears to be the two-stage process of TC for-mation (organization followed by intensification) andclimate are not well understood. Recent results havestrengthened the evidence that TC numbers appearto be tied to changes in the mean vertical circulationin the tropics.43,79,129,130 In addition, several resultsindicate the importance of mid-tropospheric moisturedeficit in TC formation.5,131 Nevertheless, care needsto be taken to differentiate between the importantrole of mid-level moisture in the immediate environ-ment of the TC, and the impact of climatologicalmid-level moisture on broad TC formations. Bruyèreet al.132 found that climatological mid-level moisturevariations were slightly negatively related to inter-annual variations in TC frequency for the NorthAtlantic. Based on this analysis, humidity appearsto be a threshold parameter for interannual TCformation.
A number of GCM experiments have shownstatistical links between climatological upward massflux and TC formation. Using idealized climateexperiments, Held and Zhao43 and Sugi et al.129
showed that both the CO2 increase and SST increasecontribute about equally to the reduction of futureupward mass flux, which they suggested could leadto a reduction of TC frequency. The more recent USCLIVAR Hurricane Working Group experiments,where SST and CO2 values were also changed sepa-rately to understand their effects, also reached similarconclusions.130,133 In these experiments, it should benoted that the saturation moisture deficit does notchange in the CO2 increase (without SST increase)experiments, and thus it does not explain the reduc-tion of TC frequency in the CO2 increase experi-ments in these models.130 A remaining issue is whythe decrease of mean upward mass flux leads to areduction of TC frequency. A recent study by Satohand Yamada134 proposed that an average TC inten-sity increase combined with a climate-related con-straint for the total TC mass flux leads to thereduction of TC numbers.
Recent advances have also been made in theformulation of statistical relationships between cli-mate and TC formation, the so-called genesis poten-tial indices (GPIs).135 Numerous issues remainregarding their application. Bruyère et al.132 showedthat care needs to be taken with the area selected forapplication of the genesis parameter. For the NorthAtlantic, application of these parameters to the MainDevelopment Region east of the Lesser Antilles
WIREs Climate Change Tropical cyclones and climate change
Volume 7, January/February 2016 © 2015 Wiley Per iodica ls , Inc. 71
enables good reproduction of observed variabilityand trends, but using the whole basin substantiallydegrades this. They also found that PI and verticalshear are good predictors, especially when usedtogether. Low-level vorticity makes no contributionand mid-level moisture is weakly negatively relatedto cyclone formation frequency. These findings are inagreement with earlier studies by Tippett et al.136
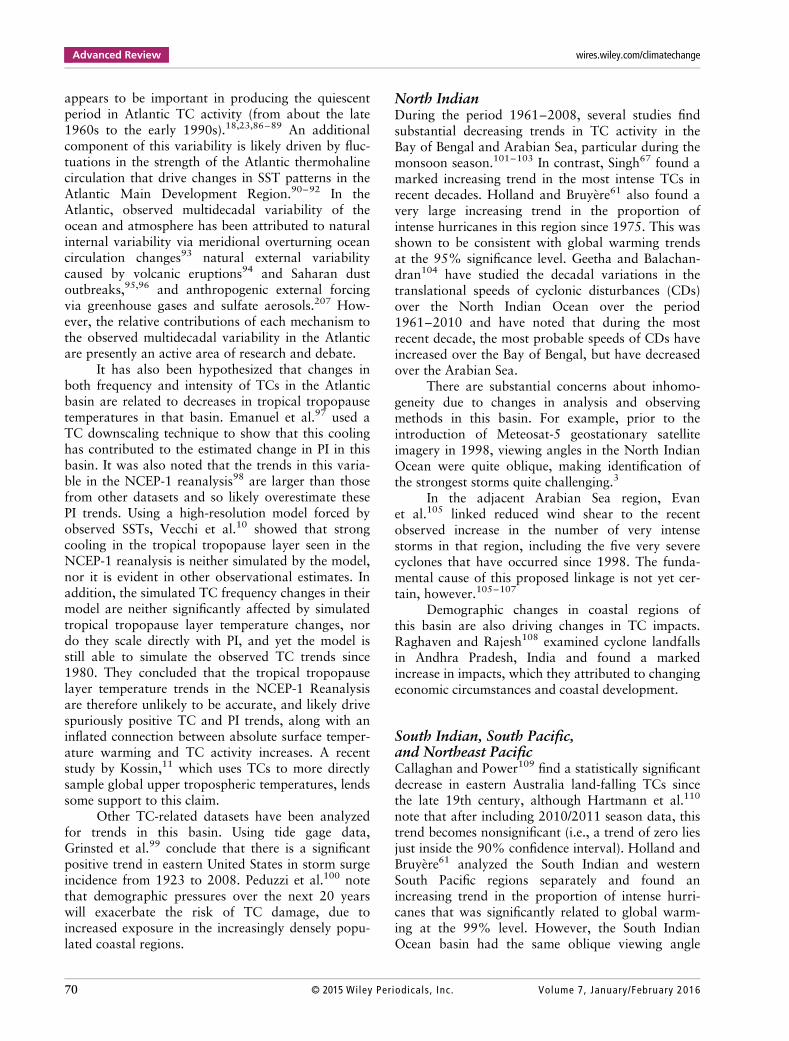
However, the lack of mid-level moisture signal is notsupported by Emanuel and Nolan137 andEmanuel.138 Furthermore, by modifying existingGPIs by making the humidity predictor the columnsaturation deficit and by using PI as the thermody-namic predictor, decreases in future TC formationsimulated by the HIRAM model17 can be cap-tured139 (Figure 2). Peng et al.140 also investigatedenvironmental parameters controlling TC genesisin the North Atlantic using observations. Theyconcluded that thermodynamic variables were moreimportant controlling parameters than dynamic
variables for TC genesis in the North Atlantic.Examining the eastern and western Atlantic sepa-rately (40W separation line), they concluded that925–400 hPa water vapor content was the mostimportant controlling parameter for TC genesis forboth regions. Other important parameters includedSST and 700 hPa vorticity in the east and, and hori-zontal shear and divergence in the west Atlantic.
Given the current uncertainties regarding theprecise formulation of GPIs, further work is neededon the contributions of various environmental para-meters to TC formation.
Theoretical Relationships betweenClimate and IntensityThe now well-established thermodynamic theory ofTC maximum PI141,142 continues to be investigatedand refined. In addition, there has been considerablework done since 2010 analyzing the ‘relative SST’argument, namely that TC characteristics such as PIin a basin can be affected locally by basin SSTsbecause tropical upper troposphere temperaturestend to follow the global tropical average instead ofthe basin average. Thus, the relative SST can serve asa useful although not perfect proxy for PI.143
Camargo et al.144 and Ting et al.145 indicate that thedecrease in PI in the Atlantic basin caused by aerosolforcing and its increase due to greenhouse gas forcinglargely canceled each other, and the sharp increase inthe PI in the last 30 years in this region was domi-nated by multidecadal natural variability. They arguethat this is more effective in increasing PI thanincreases in SST related to climate change. In con-trast, the observed increases in both global and basinproportions of intense hurricanes found by Hollandand Bruyère61 were all related to global changes,which models indicated were arising from anthropo-genic effects, and they could find no natural multide-cadal trend in the models that could explain thisbehavior. Projections are uncertain on whether rela-tive SST (or tropical storm frequency) in the Atlanticbasin will increase during the 21st century underGHG forcing.23,146,147 In addition, the role of tropo-pause temperature trends in observed changes in thePI appears unresolved,10,97,148,149 thus reducing ourconfidence in future projections of this relationship.
PROJECTION OF FUTURETC CLIMATOLOGY
Climate models are the main tools for the projectionof the future effect of anthropogenic warming, butfor TCs they generally suffer from inadequate
40°N(a) 0.02
0.015
0.01
0.005
0
20°N
20°S
40°S0°E 50°E 100°E 150°E 160°W
TCGI-R HIRAM Climatology
TCGI-R NCEP
TCGI-R ERA40
110°W 60°W 10°W
0
40°N(b) 0.02
0.015
0.01
0.005
0
20°N
20°S
40°S0°E 50°E 100°E 150°E 160°W 110°W 60°W 10°W
0
40°N(c) 0.02
0.015
0.01
0.005
0
20°N
20°S
40°S0°E 50°E 100°E 150°E 160°W 110°W 60°W 10°W
0
FIGURE 2 | Climatology of a revised genesis index per year for(a) HiRAM climatology, (b) NCEP reanalysis, and (c) ERA-40.(Reprinted with permission from Ref. 139 Copyright 2014 AmericanMeteorological Society)
Advanced Review wires.wiley.com/climatechange
72 © 2015 Wiley Per iodicals , Inc. Volume 7, January/February 2016
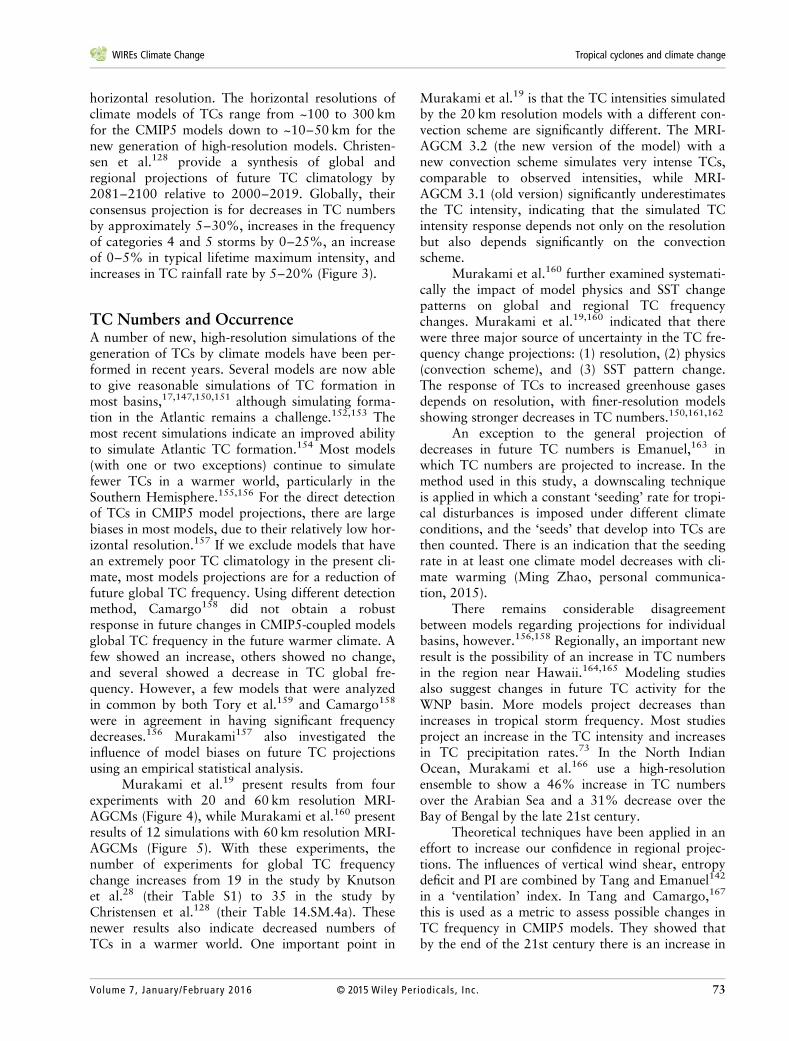
horizontal resolution. The horizontal resolutions ofclimate models of TCs range from ~100 to 300 kmfor the CMIP5 models down to ~10–50 km for thenew generation of high-resolution models. Christen-sen et al.128 provide a synthesis of global andregional projections of future TC climatology by2081–2100 relative to 2000–2019. Globally, theirconsensus projection is for decreases in TC numbersby approximately 5–30%, increases in the frequencyof categories 4 and 5 storms by 0–25%, an increaseof 0–5% in typical lifetime maximum intensity, andincreases in TC rainfall rate by 5–20% (Figure 3).
TC Numbers and OccurrenceA number of new, high-resolution simulations of thegeneration of TCs by climate models have been per-formed in recent years. Several models are now ableto give reasonable simulations of TC formation inmost basins,17,147,150,151 although simulating forma-tion in the Atlantic remains a challenge.152,153 Themost recent simulations indicate an improved abilityto simulate Atlantic TC formation.154 Most models(with one or two exceptions) continue to simulatefewer TCs in a warmer world, particularly in theSouthern Hemisphere.155,156 For the direct detectionof TCs in CMIP5 model projections, there are largebiases in most models, due to their relatively low hor-izontal resolution.157 If we exclude models that havean extremely poor TC climatology in the present cli-mate, most models projections are for a reduction offuture global TC frequency. Using different detectionmethod, Camargo158 did not obtain a robustresponse in future changes in CMIP5-coupled modelsglobal TC frequency in the future warmer climate. Afew showed an increase, others showed no change,and several showed a decrease in TC global fre-quency. However, a few models that were analyzedin common by both Tory et al.159 and Camargo158
were in agreement in having significant frequencydecreases.156 Murakami157 also investigated theinfluence of model biases on future TC projectionsusing an empirical statistical analysis.
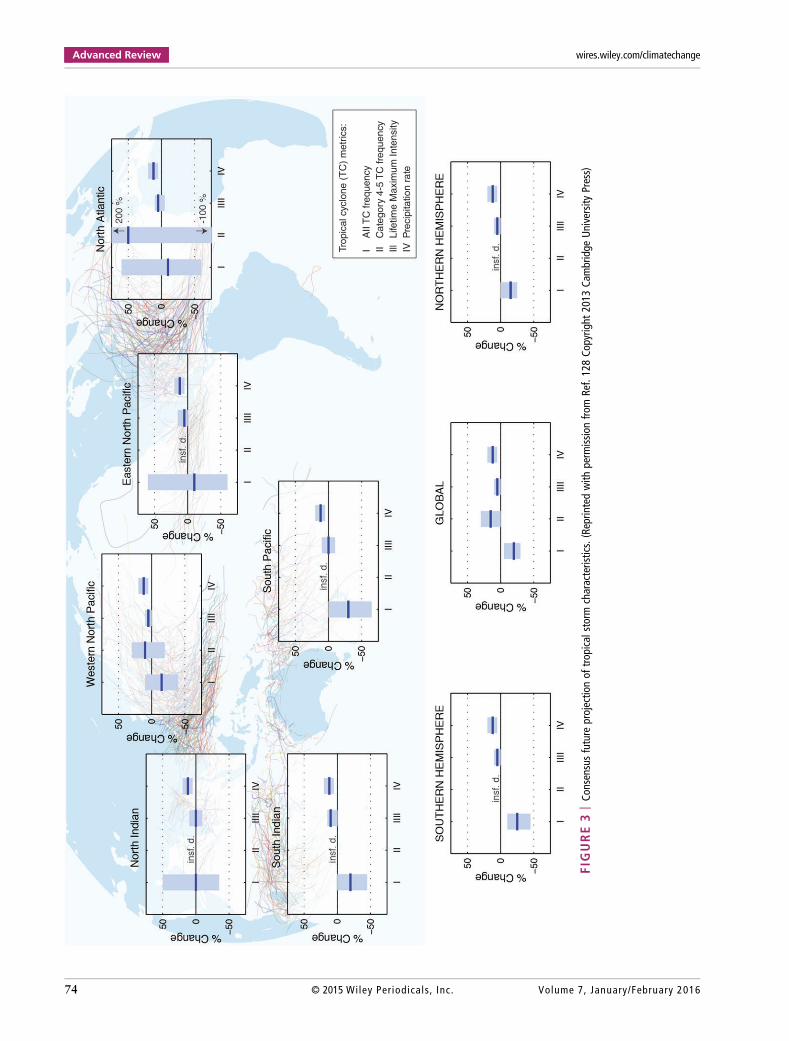
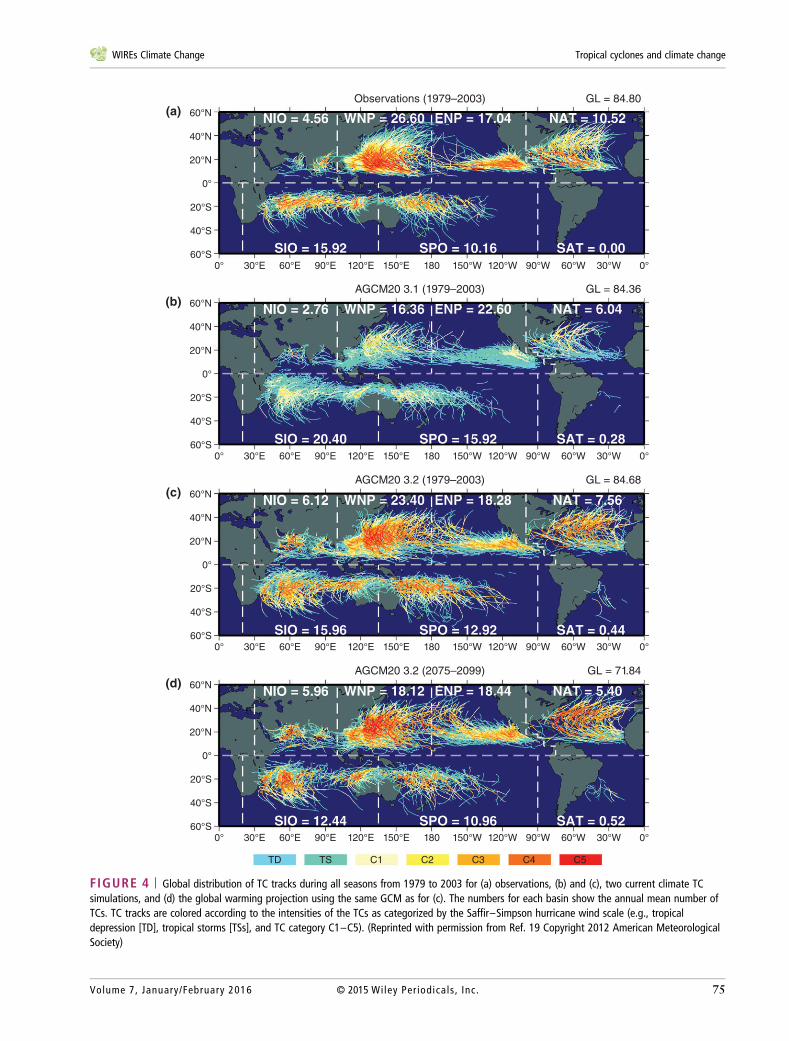
Murakami et al.19 present results from fourexperiments with 20 and 60 km resolution MRI-AGCMs (Figure 4), while Murakami et al.160 presentresults of 12 simulations with 60 km resolution MRI-AGCMs (Figure 5). With these experiments, thenumber of experiments for global TC frequencychange increases from 19 in the study by Knutsonet al.28 (their Table S1) to 35 in the study byChristensen et al.128 (their Table 14.SM.4a). Thesenewer results also indicate decreased numbers ofTCs in a warmer world. One important point in
Murakami et al.19 is that the TC intensities simulatedby the 20 km resolution models with a different con-vection scheme are significantly different. The MRI-AGCM 3.2 (the new version of the model) with anew convection scheme simulates very intense TCs,comparable to observed intensities, while MRI-AGCM 3.1 (old version) significantly underestimatesthe TC intensity, indicating that the simulated TCintensity response depends not only on the resolutionbut also depends significantly on the convectionscheme.
Murakami et al.160 further examined systemati-cally the impact of model physics and SST changepatterns on global and regional TC frequencychanges. Murakami et al.19,160 indicated that therewere three major source of uncertainty in the TC fre-quency change projections: (1) resolution, (2) physics(convection scheme), and (3) SST pattern change.The response of TCs to increased greenhouse gasesdepends on resolution, with finer-resolution modelsshowing stronger decreases in TC numbers.150,161,162
An exception to the general projection ofdecreases in future TC numbers is Emanuel,163 inwhich TC numbers are projected to increase. In themethod used in this study, a downscaling techniqueis applied in which a constant ‘seeding’ rate for tropi-cal disturbances is imposed under different climateconditions, and the ‘seeds’ that develop into TCs arethen counted. There is an indication that the seedingrate in at least one climate model decreases with cli-mate warming (Ming Zhao, personal communica-tion, 2015).
There remains considerable disagreementbetween models regarding projections for individualbasins, however.156,158 Regionally, an important newresult is the possibility of an increase in TC numbersin the region near Hawaii.164,165 Modeling studiesalso suggest changes in future TC activity for theWNP basin. More models project decreases thanincreases in tropical storm frequency. Most studiesproject an increase in the TC intensity and increasesin TC precipitation rates.73 In the North IndianOcean, Murakami et al.166 use a high-resolutionensemble to show a 46% increase in TC numbersover the Arabian Sea and a 31% decrease over theBay of Bengal by the late 21st century.
Theoretical techniques have been applied in aneffort to increase our confidence in regional projec-tions. The influences of vertical wind shear, entropydeficit and PI are combined by Tang and Emanuel142
in a ‘ventilation’ index. In Tang and Camargo,167
this is used as a metric to assess possible changes inTC frequency in CMIP5 models. They showed thatby the end of the 21st century there is an increase in
WIREs Climate Change Tropical cyclones and climate change
Volume 7, January/February 2016 © 2015 Wiley Per iodica ls , Inc. 73
Trop
ical
cyc
lone
(T
C)
met
rics:
I A
II T
C fr
eque
ncy
II
Cat
egor
y 4-
5 T
C fr
eque
ncy
Ill
Life
time
Max
imum
Inte
nsity
IV P
reci
pita
tion
rate
FIGURE3
|Co
nsensusfuture
projectionof
tropicalstorm
characteristics.(Reprintedwith
perm
issionfro
mRef.128Co
pyright
2013
Cambridge
UniversityPress)
Advanced Review wires.wiley.com/climatechange
74 © 2015 Wiley Per iodicals , Inc. Volume 7, January/February 2016
40°N
20°N
0°
60°N(a)
20°S
40°S
60°S0° 30°E 60°E 90°E 120°E 150°E 180
Observations (1979–2003) GL = 84.80
150°W 120°W 90°W 60°W 30°W 0°
40°N
20°N
0°
60°N(b)
20°S
40°S
60°S0° 30°E 60°E 90°E 120°E 150°E 180
AGCM20 3.1 (1979–2003) GL = 84.36
150°W 120°W 90°W 60°W 30°W 0°
40°N
20°N
0°
60°N(c)
20°S
40°S
60°S0° 30°E 60°E 90°E 120°E 150°E 180
AGCM20 3.2 (1979–2003) GL = 84.68
150°W 120°W 90°W 60°W 30°W 0°
40°N
20°N
0°
60°N(d)
20°S
40°S
60°S0° 30°E 60°E 90°E 120°E 150°E 180
AGCM20 3.2 (2075–2099) GL = 71.84
150°W 120°W 90°W 60°W 30°W 0°
TD TS C1 C2 C3 C4 C5
FIGURE 4 | Global distribution of TC tracks during all seasons from 1979 to 2003 for (a) observations, (b) and (c), two current climate TCsimulations, and (d) the global warming projection using the same GCM as for (c). The numbers for each basin show the annual mean number ofTCs. TC tracks are colored according to the intensities of the TCs as categorized by the Saffir–Simpson hurricane wind scale (e.g., tropicaldepression [TD], tropical storms [TSs], and TC category C1–C5). (Reprinted with permission from Ref. 19 Copyright 2012 American MeteorologicalSociety)
WIREs Climate Change Tropical cyclones and climate change
Volume 7, January/February 2016 © 2015 Wiley Per iodica ls , Inc. 75
the seasonal ventilation index, implying less favora-ble conditions for TC genesis or rapid intensificationin the majority of the TC basins, with the exceptionof the North Indian Ocean. Basin changes in theindex are well correlated with changes in TC fre-quency and intensification in the models.
Another important question is whether the typi-cal regions of occurrence and resulting impacts ofTCs in today’s climate might change in a warmerworld. Evans and Waters168 examined results fromcoupled models to show that the threshold tempera-ture for onset of deep convection—often associatedwith regions prone to tropical cyclogenesis—is likelyto increase in a warmer world. A similar result hasbeen obtained from observations for the amount ofwarming that has occurred so far.169,170 One implica-tion of this result may be little change in future regionsof cyclogenesis, as an increase in the future thresholdtemperature of deep convection is also accompanied
by a general increase in SSTs. However, if a substan-tial change in the threshold temperature for TC for-mation will occur in the future, it has not beenobserved yet: Dare and McBride45 examined all globalindividual TC formation events from 1981 to 2008.Dividing the 27-year dataset into an earlier versus alater 13.5-year period, positive but small changes(+0.20�C) occur in the mean formation temperature.
TC occurrence can be affected by changes intypical TC tracks. Colbert et al.171 used a statistical-dynamical modeling approach to estimate futurechanges in TC tracks in the North Atlantic, finding adecrease in westward tracks and in increase in recur-ving tracks. This would imply a decrease in landfallin the Caribbean and North America independent ofoverall changes in activity. Murakami and Wang172
reported that TC tracks would shift eastward in theNorth Atlantic in a warmer climate. In the WNP,Wang et al.173 used singular value decomposition
–100
–80
–60
–40
–20
0
20
40
60
80
100GL
Y0 Y1 Y2 Y3 K0 K1 K2 K3 A0 A1 A2 A3 YG
4.8
–100
–80
–60
–40
–20
0
20
40
60
80
100NH
Y0 Y1 Y2 Y3 K0 K1 K2 K3 A0 A1 A2 A3 YG
9.3
–100
–80
–60
–40
–20
0
20
40
60
80
100SH
Y0 Y1 Y2 Y3 K0 K1 K2 K3 A0 A1 A2 A3 YG
7.5
–100
–80
–60
–40
–20
0
20
40
60
80
100NIO
Y0 Y1 Y2 Y3 K0 K1 K2 K3 A0 A1 A2 A3 YG
18.6
–100
–80
–60
–40
–20
0
20
40
60
80
100WNP
Y0 Y1 Y2 Y3 K0 K1 K2 K3 A0 A1 A2 A3 YG
13.8
–100
–80
–60
–40
–20
0
20
40
60
80
100ENP
Y0 Y1 Y2 Y3 K0 K1 K2 K3 A0 A1 A2 A3 YG
17.6
–100
–80
–60
–40
–20
0
20
40
60
80
100NAT
Y0 Y1 Y2 Y3 K0 K1 K2 K3 A0 A1 A2 A3 YG
19.1
–100–80–60–40–20
020406080
100SIO
Y0 Y1 Y2 Y3 K0 K1 K2 K3 A0 A1 A2 A3 YG
10.5
–100–80–60–40–20
020406080
100SPO
Y0 Y1 Y2 Y3 K0 K1 K2 K3 A0 A1 A2 A3 YG
12.3
FIGURE 5 | Fractional future changes (%) in TC genesis number for each basin for a group of ensemble experiments, for three differentconvection schemes and four different future SST patterns. The error bars indicate 90% confidence intervals. Blue bars indicate that projectedfuture changes that are statistically significant at 90% level according to the two-sided Student’s t-test. The number in the top left corner of eachpanel shows the standard deviation of twelve ensemble experiments (YG experiment is not included). (Reprinted with permission from Ref. 19Copyright 2012 Springer)
Advanced Review wires.wiley.com/climatechange
76 © 2015 Wiley Per iodicals , Inc. Volume 7, January/February 2016
(SVD) analysis and found that the observed TC trackchanges are linked to the leading SVD mode ofglobal SST warming and to associated changes inlarge-scale steering flows. They suggested that futurechanges in these steering flows using the SVD modeas simulated using five CMIP3 models implied thatthe currently observed track changes in this region,with more storms over subtropical East Asia and lessover the South China Sea, may persist until at least2040. In another study, Murakami et al.174 used a20-kmmesh global model to simulate possible futurechanges in TC activity over the WNP. They noted aneastward shift in the positions of the prevailingnorthward recurving TC tracks during the peak TCseason (July–October) for 2075–2099, resulting in asignificant reduction in the number of TCs approach-ing coastal regions of Southeast Asia. Yokoi andTakayabu175 also performed future projections of theregional TC passage frequency over the WNP byusing seven CMIP3 GCMs. The models projectincreases in the TC passage frequency over the tropi-cal central North Pacific and decreases in regions tothe west and northwest, including East Asian coun-tries. Their analysis reveals that the gross horizontalcontrast in the passage frequency changes is causedby a projected eastward shift of the main TC devel-opment region, probably caused by the pattern ofprojected SST changes, which is uncertain. Moreo-ver, the likely track changes would decrease the pas-sage frequency over the Korean peninsula, Indochinapeninsula and western Japan, but increase that overeastern Japan and the eastern coast of central China.A consistent projected increase in TC occurrencein the Central Pacific is also reported in a fewstudies.164,165
TC IntensityA notable change in the capability of climate modelsof TCs in the last few years is that more high resolu-tion climate simulations can now simulate reasonablywell the observed intensity distribution ofTCs.19–21,147,176–178 These high-resolution modelstypically predict an increase in the frequency of themost intense TCs. Ideally, although, even higher reso-lutions would be preferable for the best representa-tion of the TC intensity response.179,180 Along theselines, the sensitivity of limiting hurricane intensity(a statistical analog of maximum PI) has recentlybeen estimated to be about 8ms−1 K−1 in the Atlanticbasin, which is similar to the estimated sensitivityto patterns of SST change of PI computed acrossa suite of coupled GCMs,169 but this sensitivityis not reached for simulated TCs in some recent
high-resolution climate models,181,182 likely due toresolution issues. Statistical downscaling of theGCM-simulated intensity distribution is also demon-strated to be useful for understanding present-dayintensity variability and future change.22
For societal impacts, Christensen et al.128 notethat the number of very strong cyclones is usuallymore important than a measure such as mean inten-sity. Several studies50–52 provide evidence that pre-dicting societal impacts also requires explicitinclusion of hurricane size and translation speedchanges. Note that physical factors like storm sizeand intensity are difficult for global models to simu-late directly unless very fine resolution is used, yetthese are factors that are important for societalimpacts of TCs, which are largely dominated by therarer, high-intensity storms.
Air–Sea InteractionThe exchange of energy between the ocean and theatmosphere is the fundamental reason why TCsintensify,181,182 so capturing this process in modelsimulations of TCs is important. Because of the verysignificant computational cost of running high-resolution coupled ocean–atmosphere GCMs, mostvery high-resolution simulations of the effect of cli-mate change on TCs have been performed using thetime-slice method, whereby simulated SSTs from acoarser-resolution model are used as a boundary con-dition for the simulation of a finer-resolutionatmosphere-only climate model. While this techniqueis far more economical in computer time than using afully coupled ocean atmosphere GCM to perform thesame projection, the lack of full air–sea interactionin the time-slice experiments has raised questionsabout their realism, especially for simulating intenseTCs where air–sea energy exchanges are strong.However, the limited number of high-resolutioncoupled model simulations that have been performedto date obtain similar results to the atmosphere-onlyGCMs. Kim et al.,183 using the GFDL CM2.5coupled model at a horizontal atmospheric resolutionof about 50 km, note a strong link in their modelsimulations between decreases in TC occurrence anddecreases in upward mid-tropospheric vertical veloc-ity in TC formation regions, similar to that found inthe atmosphere-only models. In addition, like theatmosphere-only models, they also simulate too fewstorms in the Atlantic. The response to increasedCO2 in their model is a substantial decrease in TCnumbers in almost all basins, and an increase in aver-age TC intensities by about 3%, again similar toresults from atmosphere-only models. Nevertheless, a
WIREs Climate Change Tropical cyclones and climate change
Volume 7, January/February 2016 © 2015 Wiley Per iodica ls , Inc. 77
resolution of 50 km is still coarse compared to theresolution required to simulate reliably the TC inten-sity distribution.
In addition to the effect of climate on TCs, TCsthemselves also appear to have some effect on theglobal climate. State-of-the-art fully coupled GCMsare able to represent the TC interaction with theocean and TC activity (given the aforementionedunder-simulation of TC intensities) seems to signifi-cantly impact the ocean heat transport (OHT) withinthe tropical belt, on short time scales, but no signifi-cant changes appear to have occurred over the pasthalf-century.184 The role of TCs in the OHT hasbeen quantified but the range of estimates is largeand the TC-induced transport response differs fromstudy to study.185
TC Rainfall and Other ImpactsChristensen et al.128 note that the increase in rainfallrates associated with TCs is a common response ofnumerical models under greenhouse warm-ing.147,183,186,187 Projected increases in TC rainfalltypically range from 5 to 20%, although results canvary somewhat between different TC basins.178 Thequantitative changes may also depend on the detailsof the TC precipitation metric chosen. Nonetheless,an increase in storm-relative rainfall rates from com-posite storms in a warmer climate is one of the moreconfident predictions of the effects of future climateon TCs.
There have not yet been any detected globaltrends in TC rainfall rates.188 Chang et al.52 exam-ined a multidecadal trend in rainfall from TCs affect-ing Taiwan. They found that the observed increasesarose from relatively weaker typhoons and couldlargely be attributed to an increase in slow-movingsystems. They could not find a mechanism thatattributed this trend to anthropogenic climatechange.
The most important impact of TCs in coastalregions is storm surge. Increases in storm surges dueto TCs may be caused by a combination of sea levelrise and increases in TC wind speeds.189 Woodruffet al.190 reviewed this topic, noting that projectionsof sea level rise are more confident than projectionsof changes in TCs. In some locations, sea level risemay dominate the changes in storm surge climatol-ogy.191 From the point of view of the prediction ofsocietal impacts, this outcome actually makes futurepredictions of storm surge incidence more confident,due to the higher confidence in future sea level riseprojections. All else being equal, sea level rise willcause increases in the total flood level associated with
a given return period. Particularly for shorter returnperiods, it is likely that this effect will dominate overchanges in the storm climate. The total flood levelsassociated with return periods on the order of100 years or less, e.g., are very likely to increase,according to calculations to date based on several cli-mate models. At longer return periods, changes inthe frequencies and intensities of TCs play a largerrole, and increase the uncertainty in the flood levelsfor those more extreme events.189
Tebaldi et al.192 present projections of stormsurges along the U.S. coast based on historical tidegage trends, which generally also include verticalland movement effects as well as sea level effects.They did not incorporate storm change effects. By2050, today’s 100-year events become ’decadal-return-time’ events for about a third of their studygages. They noted that ‘Gulf locations appear in leastdanger of a rapid shift (in extreme return levels/peri-ods), despite rapid relative sea level rise, due to thehigh amplitudes of historical storm extremes, whichrender the relative effect of sea level rise small.’
In summary, model studies indicate that sealevel rise contributes toward increased surge risk,although the full change in risk is influenced bystorm climate changes as well, particularly for rarer,more extreme surge events.
Done et al.51 examined potential future changesin North Atlantic hurricane impacts on offshoreenergy structures in the Gulf of Mexico. Using simu-lations of hurricane case studies, they found a futureincrease in the frequency of most intense hurricanes,but that the cyclones became smaller and moved fas-ter. The net result is a predicted reduction in hurri-cane impacts on offshore energy structures inthe Gulf.
TC Detection IssuesIdeally, there should be no uncertainty introduced bythe method used to detect TCs in a climate modelsimulation. In practice, climate model studies use awide range of TC tracking and detection schemes,193
but no detection technique is perfect.153,159 Tradi-tional direct detection methods use (1) structural cri-teria to ensure a disturbance resembles a TC and(2) a wind speed threshold to determine if the distur-bance is sufficiently intense to be considered a TC.
Some allowance needs to be made when settingthese criteria for that fact that TC-like circulations inclimate models are not well resolved, which intro-duces an element of subjectivity to the definition ofwhat actually is a ‘climate model TC.’ Variousattempts have been made to reduce this subjectivity,
Advanced Review wires.wiley.com/climatechange
78 © 2015 Wiley Per iodicals , Inc. Volume 7, January/February 2016
including the development of a relationship forwind speed thresholds as a function of gridresolution,194 and the development of alternativedirect detection methodologies.153,159,195 TheCamargo and Zebiak158 method applies statisticallydetermined thresholds to the wind speed and twostructural criteria (vorticity and warm-core), so thatextreme circulations, as determined by the variabilitywithin the TC basin of interest, are declared TCs.The Tory et al.152 detection method attempts to iden-tify the large-scale environment in which TCs form,and if this favorable environment persists for 48 h,a TC is declared. The method is based on theOkubo–Weiss–Zeta Parameter (OWZP), whichidentifies the existence of large-scale regions of near-solid body rotation in the low- and mid-troposphere.Where these coincide with enhanced relative humid-ity and weak vertical wind shear, the environment isconsidered favorable for TC development.
Each method has strengths and weaknesses andindeed when applied to the same model they can pro-duce somewhat different results.156 Horn et al.193
find some sensitivity to the choice of TC detectionscheme when applied to the results from various per-turbation climate experiments, although once minordifferences between the schemes were removed, theresults of the perturbation experiments became moresimilar. It is also noted that not all disturbances inthe tropics with low-level wind speeds greater than17ms−1 are TCs (e.g., monsoon gyres196), so therewill continue to be a need for a reliable TC detectionmethod for the analysis of climate model output.Until climate models can be run at a fine enough res-olution to resolve adequately inner-core TC struc-ture, alternative methodologies such as the Camargoand Zebiak and Tory et al. detectors can offer valua-ble insight into detection uncertainty when used inparallel with the traditional direct detectors.
RESEARCH TOPICS FORTHE FUTURE
Detection Methods As a Sourceof UncertaintyThe various methods used to detect TCs in climatemodels can be viewed as a form of modeling uncer-tainty. Given that current detection techniques candeliver different results when analyzing the same cli-mate modeling system (as noted above), there couldbe value in analyzing subjectively the circulationsthat each detector detects. For example, does thedetector that systematically detects fewer TCs onlyidentify the strongest circulations? Such knowledge
will better inform projection results. This still impliesa need for standardized detection techniques,although it is noted that this outcome may need towait until climate models can routinely simulate wellthe intense inner-core region of TCs. Furthermore, itis expected that the differences among detectionmethodologies will decrease as the models increasehorizontal resolution and the TC activity is bettersimulated. Having unified detection methods acrossdifferent resolutions will be important.
Lack of a Climate Theory ofTC FormationAs stated earlier, a theory of any kind that tells uswhat the probability of TC genesis is for a givenlarge-scale environment is not available at this time.Therefore, historically, there has been a reliance onempirical genesis indices, and more recently, on thenew generation of global atmospheric models thathave begun to produce increasingly realistic resultsfor TC climatology. While this recent development isencouraging, confidence in the predictions of thesemodels would be considerably enhanced if they couldbe compared to the results of a realistic climate the-ory of TC formation, just as high-resolution modelpredictions of future increases in maximum TC inten-sities have been made more confident by a realistictheory of maximum PI.
Confidence in Detection and Attributionof Observed Changes in TCs To DateWhile there has certainly been an increase in TCactivity in the Atlantic basin since the 1970s, debatecontinues over the relative contributions of internalclimate variability versus the radiatively forcedresponse. Similarly, debate still continues abouttrends in the temperatures of the tropical upper trop-osphere, which are important for evaluating climate-related changes in TC activity.
Typically, climate models are needed in orderto attribute changes in TC activity to a specific cause,such as anthropogenic forcing. For example, to assesswhether an observed trend is ‘detectable’ or unusualcompared to trends expected from natural causesalone, a comparison of the trend with the distribu-tion of trends from long simulations of natural varia-bility alone (without anthropogenic forcing) is oftenused. Models run with and without a given set of for-cings (e.g., with and without anthropogenic forcings)can be important tools for assessing causes of anobserved change. If an observed change is consistentwith that simulated by models that include a given
WIREs Climate Change Tropical cyclones and climate change
Volume 7, January/February 2016 © 2015 Wiley Per iodica ls , Inc. 79
set of forcings (e.g., anthropogenic plus natural for-cings) and inconsistent with the simulation obtainedusing only a subset of the forcings (e.g., runswith natural forcings only), this indicates a changewhich is attributable, according to the models, toanthropogenic forcing. While such procedures havebeen used for surface temperature changes andother variables, their use for assessing historicalTC changes is relatively rare. One example is a mod-eling study of anthropogenic aerosol forcing ofhistorical Atlantic tropical storm multidecadal varia-bility by Dunstone et al.,18 although other modelsdiffer on how much anthropogenic aerosols havecontributed to the observed North Atlantic multide-cadal TC variability.23 In general, the relative contri-butions of aerosol forcing and internal climatevariability to observed North Atlantic multidecadalSST variability remains a topic of research anddiscussion.87,88
The observed regional shifts in TC activity inthe WNP basin in recent decades may have signifi-cant implication for landfalling TCs and associatedimpacts various countries in the WNP.197,198 Furtherstudies are required to identify the possible causesand relative contribution of global climate changeto these changes. Similarly, while climate modelsproject more precipitation from TCs in the WNP(and globally) in the 21st century, observationalstudies and model simulations are required to assessthe long-term variations of the total and extremerainfall induced by TCs for different countriesin the WNP (and globally) in the past and the21st century.
There remains considerable work that can beperformed in producing more homogeneous datasetsof TCs for climate analysis.3,47,58,81 The productionof datasets that make allowance for undersamplingof TC counts in the presatellite era, as pioneered inthe Atlantic basin, could be extended to other basins.In particular, reanalysis efforts to create more homo-geneous records of landfalling TCs are needed.
It has been inferred from paleotempestologystudies that variations in TC activity over centennialtime scales have been large, based on studies at a lim-ited number of locations. Reasons for these apparentlarge centennial-scale TC activity variations are pres-ently unknown.
Impact of Uncertainty in FutureProjections of Large-Scale Climate FieldsOne of the reasons that confidence in future regionalprojections of TCs remains limited is the variationbetween climate models of projections of mean
patterns of change of regional SSTs. Therefore, itremains important to improve climate model simula-tion in order to reduce uncertainties in the 21st-century projections of the mean magnitude and pat-terns of change of both regional SST patterns and ofthe vertical structure of the atmosphere (temperature,winds, and moisture), as these differences can lead tolarge differences in regional TC projections. Addi-tionally, the future changes in climate models such asENSO and the resulting effects on TC projections arestill unclear, given the lack of agreement and poorsimulation by many climate models of those climatemodes.
In this context, the CMIP5 experiments areimportant. Analysis of these experiments for changesin TCs has only started156,158,163 and more resultswill need to be produced before a consensus canemerge on the likely effect of the CMIP5 experimen-tal results on TCs.
Correct Simulation of TC FrequencyResponse in High-ResolutionClimate ModelsEven if there were high confidence in future meanlarge-scale environmental changes, there would stillbe uncertainties due to the simulated response of TCsin the climate models. Improved theoretical under-standing of the relationship between climate and TCswould assist in decreasing existing uncertainties.Model resolutions will soon become high enough forroutine comparisons to be made between the small-scale mechanisms of TC formation in models and inobservations.
Most genesis indices predict an increase infuture TC numbers, while the models predictdecreases in TC frequency decreases in most cases. Itis not clear whether this is a problem with the formu-lation of the genesis indices139 or that the models areincorrect and so TC frequency will actuallyincrease.163
CONCLUSION
Paleotempestology work has identified large, centen-nial to millennial scale variations in regional TC inci-dence, the causes of which are at present notunderstood. The paleotempestology record needs tobe extended both in time and space, and combinedwith proxy-based and modeling studies to determinethe reasons for these variations. Establishing thesereasons might assist in the development of a climatetheory of TC formation. Analysis of both data andclimate simulations may enable to development of
Advanced Review wires.wiley.com/climatechange
80 © 2015 Wiley Per iodicals , Inc. Volume 7, January/February 2016
quantitative constraints on the formation of TCsunder various climate conditions. These could thenbe employed to inform the results of climate modelprojections.
A number of recent papers have documentedglobal increases in the proportion of very intensecyclones and also of trends in the latitude of maxi-mum TC intensity, consistent with the model projec-tions for future climate. Confidence in theseprojections continues to increase as simulationsimprove in quality. It is recommended that furtherresearch be undertaken to reduce the uncertaintiesin the detection of trends in TCs, particularly inthe presence of continually improving observationalcapabilities. This could include (ideally) the extensionof aircraft reconnaissance to other regions of theglobe. Further improvements of the IBTrACSdataset should be undertaken, especially reanalysisefforts in the WNP basin, where significant differ-ences in intensities between various best track data-sets remain.
The recent assessment of Christensen et al.128
provided a synthesis of then-available global andregional projections of future TC climatology by2081–2100 relative to 2000–2019, for a mid-rangeA1B-like scenario. Globally, the consensus projectionwas for decreases in TC numbers by approximately5–30%, increases in the frequency of categories4 and 5 storms by 0–25%, an increase of a few per-cent in typical lifetime maximum intensity, andincreases in TC rainfall amounts by 5–20%. How-ever, it is noted that there is a large uncertainty inthese projections.
One source of uncertainty that has emerged isthat somewhat different results can be obtained formodel sensitivity experiments if different TC detec-tion methods are used. It is useful to pose the
question whether the community should converge ona single method for the detection of TCs in climatemodels, although this may need to wait until climatemodels produce improved simulations of inner-coreTC dynamics and thus better intensities. In the mean-time, the careful comparison and use of more thanone detection method is needed for the assessment ofclimate model simulations.
Climate models will continue to improve, byincorporating improved physics and throughincreases in typical horizontal resolution. The nextchallenge for the TC/climate change community is touse climate models to simulate the observed, cloud-scale processes leading to TC formation, to ensurethat such simulations give realistic depictions of thisprocess. In addition, the climate modeling commu-nity should eventually move toward using coupledmodels capable of more realistic TC simulation.More analysis should be undertaken of existingcoupled model experiments, e.g., CMIP5, includingpossibly the inclusion of a bias correction forintensity.199
While the formulation of GPIs continues to bein a state of flux, combining statistical and dynamicalapproaches to simulate past interannual variability ofTC activity has shown considerable promise, and it isrecommended that this be expanded to consider newapproaches.
Against the background of global climatechange and sea level rise, it will be important to havequantitative assessments on the potential risk of TCinduced storm surge and flooding to densely popu-lated coastal cities/river delta regions in the comingdecades and century. A more comprehensive data-base should be established on casualties and eco-nomic loss for monitoring any long-term trends ofTC impacts in the different TC basins.
ACKNOWLEDGMENTS
This article is a revised and extended version of section 5.1 of the workshop report for the 8th InternationalWorkshop on Tropical Cyclones, held at Jeju, Korea, 2–10 December 2014. The authors would like tothank Kerry Emanuel, Kevin Tory, and members of the Hurricane Working Group of U.S. CLIVAR and theWMO Expert Team on Climate Change Impacts on Tropical Cyclones for valuable comments on thismanuscript.
REFERENCES1. Knapp KR, Kruk MC, Levinson DH, Diamond HJ,
Neumann CJ. The international best track archive forclimate stewardship (IBTrACS) unifying tropicalcyclone data. Bull Am Meteorol Soc 2010,91:363–376.
2. Vecchi GA, Knutson TR. Estimating annualnumbers of Atlantic Hurricanes missing from theHURDAT database (1878–1965) using ship trackdensity. J Clim 2011, 24:1736–1746. doi:10.1175/2010JCLI3810.1.
WIREs Climate Change Tropical cyclones and climate change
Volume 7, January/February 2016 © 2015 Wiley Per iodica ls , Inc. 81
3. Kossin JP, Olander TL, Knapp KR. Trend analysiswith a new global record of tropical cyclone intensity.J Clim 2013, 26:9960–9976.
4. Knutson TR, Sirutis JJ, Garner ST, Held IM, TuleyaRE. Simulation of the recent multidecadal increase ofAtlantic hurricane activity using an 18-km-gridregional model. Bull Am Meteorol Soc 2008,88:1549–1565. doi:10.1175/BAMS-88-10-1549.
5. Emanuel K, Sundararajan R, Williams J. Hurricanesand global warming: results from downscaling IPCCAR4 simulations. Bull Am Meteorol Soc 2008,89:347–367.
6. Kistler R, Collins W, Saha S, White G, Woollen J,Kalnay E, Chelliah M, Ebisuzaki W, Kanamitsu M,Kousky V, et al. The NCEP-NCAR 50-year reanaly-sis: monthly means CD-ROM and documentation.Bull Am Meteorol Soc 2001, 82:247–267.
7. Saha S, Moorthi S, Pan H-L, Wu X, Wang J,Nadiga S, Tripp P, Kistler R, Woollen J, Behringer D,et al. The NCEP climate forecast system reanalysis.Bull Am Meteorol Soc 2010, 91:1015–1057.
8. Dee DP, Uppala SM, Simmons AJ, Perrisford P,Poli P, Kobayashi S, Andrae U, Balmaseda MA,Balsamo G, Bauer P, et al. The ERA-Interim reanalysis:configuration and performance of the data assimilationsystem. Q J R Meteorol Soc 2011, 137:553–597.doi:10.1002/qj.828.
9. Wu L, Chou C, Chen C-T, Huang R, Knutson TR,Sirutis JJ, Garner ST, Kerr C, Lee C-J, Feng Y-C.Simulations of the present and late 21st century west-ern North Pacific tropical cyclone activity using aregional model. J Clim 2014, 27:3405–3424.doi:10.1175/JCLI-D-12-00830.1.
10. Vecchi GA, Fueglistaler S, Held IM, Knutson TR,Zhao M. Impacts of atmospheric temperaturechanges on tropical cyclone activity. J Clim 2013,26:3877–3891.
11. Kossin JP. Validating atmospheric reanalysis datausing tropical cyclones as thermometers. Bull AmMeteorol Soc 2015, 96:1089–1096. doi:10.1175/BAMS-D-14-00180.
12. Schenkel BA, Hart RE. An examination of tropicalcyclone position, intensity, and intensity life cyclewithin atmospheric reanalysis datasets. J Clim 2012,25:3453–3475.
13. Murakami H. Tropical cyclones in reanalysis datasets. Geophys Res Lett 2014, 41:2133–2141.
14. Liu K-B, Fearn ML. Reconstruction of prehistoriclandfall frequencies of catastrophic hurricanes innorthwestern Florida from lake sediment records.Quat Res 2000, 54:238–245.
15. Frappier AB. A stepwise screening system to selectstorm-sensitive stalagmites: taking a targetedapproach to speleothem sampling. Quat Int 2007,187:25–39. doi:10.1016/j.quanit.2007.09.042.
16. Donnelly JP, Hawkes AD, Lane P, MacDonald D,Shuman BN, Toomey MR, van Hengstum P,Woodruff JD. Climate forcing of unprecedentedintense-hurricane activity in the last 2,000 years.Earth Future 2015, 3:49–65. doi:10.1002/2014EF000274.
17. Zhao M, Held IM, Lin S-J. Vecchi GA simulations ofglobal hurricane climatology, interannual variability,and response to global warming using a 50-km reso-lution GCM. J Clim 2009, 22:6653–6678.
18. Dunstone NJ, Smith DM, Booth BBB, Hermanson L,Eade R. Anthropogenic aerosol forcing of Atlantictropical storms. Nat Geosci 2013, 6:534–539.
19. Murakami H, Wang Y, Yoshimura Y, Mizuta R,Sugi M, Shindo E, Adachi Y, Yukimoto S, Hosaka M,Kusunoki S, et al. Future changes in tropical cycloneactivity projected by the new high-resolution MRI-AGCM. J Clim 2012a, 25:3237–3260.
20. Murakami H, Vecchi GA, Underwood S, Delworth T,Wittenberg AT, Anderson W, Chen J-H, Gudgel R,Harris L, Lin S-J, et al. Simulation and prediction ofcategory 4 and 5 hurricanes in the high-resolutionGFDL HiFLOR coupled climate model. J Clim. InPress.
21. Bender M, Knutson T, Tuleya R, Sirutis J, Vecchi G,Garner ST, Held I. Modeled impact of anthropogenicwarming on the frequency of intense Atlantic hurri-canes. Science 2010, 327:454–458.
22. Zhao M, Held IM. An analysis of the effect of globalwarming on the intensity of Atlantic hurricanes use aGDM with statistical refinement. J Clim 2010,23:6382–6393.
23. Villarini G, Vecchi GA. Projected increases in NorthAtlantic tropical cyclone intensity from CMIP5 mod-els. J Clim 2013, 26:3231–3240.
24. Taylor KE, Stouffer RJ, Meehl GA. An overview ofCMIP5 and the experiment design. Bull Am MeteorolSoc 2012, 93:485–498.
25. Emanuel KA. An air–sea interaction theory fortropical cyclones, part I: steady-state maintenance.J Atmos Sci 1986, 43:585–605.
26. Emanuel KA. The maximum intensity of hurricanes.J Atmos Sci 1988, 45:1143–1155.
27. IPCC. Stocker TF, Qin D, Plattner G-K, Tignor M,Allen SK, Boschung J, Nauels A, Xia Y, Bex V,Midgley PM, eds. Climate Change 2013: ThePhysical Science Basis. Contribution of WorkingGroup I to the Fifth Assessment Report of the Inter-governmental Panel on Climate Change. Cambridge,UK and New York, NY: Cambridge University Press;2013, 1535 pp.
28. Knutson TR, McBride JL, Chan J, Emanuel K,Holland G, Landsea C, Held I, Kossin JP, SrivastavaAK, Sugi M. Tropical cyclones and climate change.Nat Geosci 2010, 3:157–163. doi:10.1038/ngeo0779.
Advanced Review wires.wiley.com/climatechange
82 © 2015 Wiley Per iodicals , Inc. Volume 7, January/February 2016

29. Liu K-B. Chapter 2—paleotempestology: principles,methods, and examples from Gulf Coast lake sedi-ments. In: Murnane RJ, Liu K-B, eds. Hurricanes andTyphoons, Past, Present and Future. New York:Columbia University Press; 2001, 13–57.
30. Brandon CM, Woodruff JD, Lane D, Donnelly JP.Tropical cyclone wind speed constraints from result-ant storm surge deposition: a 2500 year reconstruc-tion of hurricane activity from St. Marks, FL.Geochem Geophys Geosyst 2013, 14:2993–3008.doi:10.1002/ggge.20217.
31. Frappier A, Knutson T, Liu K-B, Emanuel K. Perspec-tive: coordinating paleoclimate research on tropicalcyclones with hurricane-climate theory and model-ling. Tellus A 2007, 59:529–537.
32. Frappier AB, Pyburn J, Pinkey-Drobnis AD, Wang X,Corbett DR, Dahlin BH. Two millennia of tropicalcyclone-induced mud layers in a northern Yucatánstalagmite: multiple overlapping climatic hazards dur-ing the Maya Terminal Classic “megadroughts.”Geophys Res Lett 2014, 41:5148–5157.
33. Banholzer S, Kossin J, Donner S. The impact of cli-mate change on natural disasters. In: Singh A,Zommers Z, eds. Preventing Disaster: Early WarningSystems for Climate Change. Dordrecht: Springer;2014, 387 pp.
34. Woodruff JD, Donnelly JP, Emanuel K, Lane P.Assessing sedimentary records of paleohurricaneactivity using modeled hurricane climatology. Geo-chem Geophys Geosyst 2008, 9:Q09V10.
35. Haig J, Nott J, Reichart GJ. Australian tropicalcyclone activity lower than at any time over the past550–1,500 years. Nature 2014, 505:667–671.
36. Woodruff JD, Sriver SL, Lund DC. Tropical cycloneactivity and western North Atlantic stratification overthe last millennium: a comparative review with viableconnections. J Quat Sci 2012, 27:337–343.
37. Kozar ME, Mann ME, Emanuel KA, Evans JL. Long-term variations of North Atlantic tropical cycloneactivity downscaled from a coupled model simulationof the last millennium. J Geophys Res Atmos 2013,118:13–383.
38. Mann ME, Woodruff JD, Donnelly JP, Zhang ZH.Atlantic hurricanes and climate over the past 1,500years. Nature 2009, 460:880–883.
39. Fedorov AV, Breierly CM, Emanuel K. Tropicalcyclones and permanent El Niño in the early Plioceneepoch. Nature 2010, 463:1066–1070.
40. Korty RL, Camargo SJ, Galewsky J. Variations intropical cyclone genesis factors in simulations of theHolocene Epoch. J Clim 2012a, 25:8196–8211.doi:10.1175/JCLI-D-12-00033.1.
41. Korty RL, Camargo SJ, Galewsky J. Tropical cyclonegenesis factors in simulations of the Last GlacialMaximum. J Clim 2012b, 25:4348–4365.doi:10.1175/JCLI-D-11-00517.1.
42. Sugi M, Yoshida K, Murakami H. More tropicalcyclones in a cooler climate? Geophys Res Lett 2015,42:6780–6784.
43. Held IM, Zhao M. The response of tropical cyclonestatistics to an increase in CO2 with fixed sea surfacetemperatures. J Clim 2011, 24:5353–5364.doi:10.1175/JCLI-D-11-00050.1.
44. Merlis TM, Zhao M, Held IM. The sensitivity of hur-ricane frequency to ITCZ changes and radiativelyforced warming in aquaplanet simulations. GeophysRes Lett 2013, 40:4109–4114.
45. Dare RA, McBride JL. The threshold sea surface tem-perature condition for tropical cyclogenesis. J Clim2011, 24:4570–4576.
46. Merlis TM. Tropical cyclone frequency in simulationsof the Last Glacial Maximum. Available at: https://ams.confex.com/ams/31Hurr/webprogram/Paper244915.html. (Accessed January 24, 2015).
47. Landsea CW, Feuer S, Hagen A, Glenn D, Sims J,Perez R, Chenoweth M, Anderson N. A reanalysis ofthe 1921–30 Atlantic hurricane database. J Clim2012, 25:865–885.
48. Knapp KR, Knaff JA, Sampson CR, Riggio GM,Schnapp AD. A pressure-based analysis of the histori-cal western North Pacific tropical cyclone intensityrecord. Mon Weather Rev 2013, 141:2611–2631.
49. Powell MD, Reinhold TA. Tropical cyclone destruc-tive potential by integrated kinetic energy. Bull AmMeteorol Soc 2007, 88:513–526. doi:10.1175/BAMS-88-4-513.
50. Czajkowski J, Done J. As the wind blows: under-standing hurricane damages at the local level througha case study analysis. Weather Clim Soc 2014,6:202–217. doi:10.1175/WCAS-D-13-00024.1.
51. Done J, Bruyère C, Ge M, Holland GJ. Futurechanges in Gulf of Mexico hurricane wave climatol-ogy. In: OTC 2014 Offshore Technology Conference,Houston, TX, 5–8 May, 2014. Available at: http://www.rpsea.org/media/files/project/cff96dc8/10121-4802-01-PR-Future_Changes_GOM_Hurricane_Wa-ve_Climatology-05-07-14.pdf. (Accessed January12, 2015).
52. Chang C-P, Yang Y-T, Kuo H-C. Large increasingtrend of tropical cyclone rainfall in Taiwan and theroles of terrain. J Clim 2013, 26:4138–4147.doi:10.1175/JCLI-D-12-00463.1.
53. Knaff JA, Longmore SP, Molenar DA. An objectivesatellite-based tropical cyclone size climatology.J Clim 2014, 27:455–476.
54. Lloyd ID, Vecchi GA. Observational evidence for oce-anic controls on hurricane intensity. J Clim 2011,24:1138–1153.
55. Vincent EM, Emanuel KA, Lengaigne M, Vialard J,Madec G. Influence of upper-ocean stratification
WIREs Climate Change Tropical cyclones and climate change
Volume 7, January/February 2016 © 2015 Wiley Per iodica ls , Inc. 83
interannual variability on tropical cyclones. J AdvModel Earth Syst 2014, 6:680–699.
56. Landsea CW, Harper BA, Hoarau K, Knaff JA. Canwe detect trends in extreme tropical cyclones? Science2006, 313:452–454.
57. Kamahori H, Yamazaki N, Mannoji N, Takahashi K.Variability in intense tropical cyclone days in thewestern North Pacific. SOLA 2006, 2:104–107.
58. Kossin JP, Emanuel KA, Vecchi GA. The polewardmigration of the location of tropical cyclone maxi-mum intensity. Nature 2014, 509:349–352.
59. Held IM, Hou AY. Nonlinear axially symmetric cir-culations in a nearly inviscid atmosphere. J Atmos Sci1980, 37:515–533.
60. Lu J, Vecchi GA, Reichler T. Expansion of the Had-ley cell under global warming. Geophys Res Lett2007, 34:L06805.
61. Holland GJ, Bruyère C. Recent intense hurricaneresponse to global climate change. Clim Dyn 2014,42:617–627. doi:10.1007/s00382-013-1713-0.
62. Webster PJ, Holland GJ, Curry JA, Chang HR.Changes in tropical cyclone number, duration andintensity in a warming environment. Science 2005,309:1844–1846.
63. Elsner JB, Kossin JP, Jagger TH. The increasing inten-sity of the strongest tropical cyclones. Nature 2008,455:92–95.
64. Kang N-M, Elsner JB. Consensus on climate trends inwestern North Pacific tropical cyclones. J Clim 2012,25:7564–7573.
65. Holland GJ, Webster PJ. Heightened tropical cycloneactivity in the North Atlantic: natural variability orclimate trend? Philos Trans R Soc Lond A 2007,365:2695–2716.
66. Wu L, Zhao H. Dynamically derived tropical cycloneintensity changes over the Western North Pacific.J Clim 2012, 25:89–98.
67. Singh OP. Recent trends in tropical cyclone activity inthe North Indian Ocean. In: Charabi Y, ed. IndianOcean Tropical Cyclones and Climate Change.Dordrecht: Springer Science and Business; 2010,51–54.
68. Elsner JB, Jagger TH. Hurricane Climatology: AModern Statistical Guide Using R. New York:Oxford University Press; 2013, 380 pp.
69. Klotzbach PJ, Landsea CW. Extremely intense hurri-canes: revisiting Webster et al. (2005) after 10 years.J Clim 2015, 28:7621–7629.
70. Maue RN. Recent historically low global tropicalcyclone activity. Geophys Res Lett 2011, 38:L14803.doi:10.1029/2011GL047711.
71. Lee TC, Knutson TR, Kamahori H, Ying M. Impactsof climate change on tropical cyclones in the westernNorth Pacific Basin, part I: past observations.
Tropical Cyclone Res Rev 2012a, 1:213–230.doi:10.6057/2012TCRR02.08.
72. Lee TC, Leung YY, Kok MH, Chan HS. The longterm variations of tropical cyclone activity in theSouth China Sea and the vicinity of Hong Kong.Tropical Cyclone Res Rev 2012b, 1:277–292.doi:10.6057/2012TCRR02.01.
73. Ying M, Knutson TR, Kamahori H, Lee TC. Impactsof climate change on tropical cyclones in the WesternNorth Pacific basin, part II: late 21st century projec-tions. Tropical Cyclone Res Rev 2012, 1:231–241.doi:10.6057/2012TCRR02.09.
74. Song JJ, Wang Y, Wu L. Trend discrepanciesamong three best track data sets of western NorthPacific tropical cyclones. J Geophys Res Atmos 2010,115:D12128. doi:10.1029/2009JD013058.
75. Hsu P-C, Chu P-S, Murakami H, Zhao X. An abruptdecrease in the late-season typhoon activity over thewestern North Pacific. J Clim 2014, 27:4296–4312.
76. Choi Y, Ha K-J, Ho C-H, Chung CE. Interdecadalchange in typhoon genesis condition over the westernNorth Pacific. Clim Dyn. In press. doi:10.1007/s00382-015-2536-y.
77. Liu KS, Chan JCL. Interdecadal variability of westernNorth Pacific tropical cyclone tracks. J Clim 2008,21:4464–4476.
78. Lucas C, Timbal B, Nguyen H. The expanding tro-pics: a critical assessment of the observational andmodeling studies. WIREs Clim Change 2014,5:89–112.
79. Zhao M, Held IM. TC-permitting GCM simulationsof hurricane frequency response to sea surface tem-perature anomalies projected for the late-twenty-firstcentury. J Clim 2012, 25:2995–3009. doi:10.1175/JCLI-D-11-00313.1.
80. Walsh J, Wuebbles D, Hayhoe K, Kossin J, Kunkel K,Stephens G, Thorne P, Vose R, Wehner M, Willis J,et al. Chapter 2: our changing climate. In: MelilloJM, Richmond T, Yohe GW, eds. Climate ChangeImpacts in the United States: The Third National Cli-mate Assessment. Washington DC: U.S. GlobalChange Research Program; 2014, 19–67.
81. Landsea CW, Vecchi GA, Bengtsson L, Knutson TR.Impact of duration thresholds on Atlantic tropicalcyclone counts. J Clim 2010, 23:2508–2519.
82. Murakami H, Li T, Hsu P-C. Contributing factors tothe recent high level of accumulated cyclone energy(ACE) and power dissipation index (PDI) in theNorth Atlantic. J Clim 2014, 27:3023–3034.
83. Goldenberg SB, Landsea CW, Mestas-Nuñez AM,Gray WM. The recent increase in Atlantic hurricaneactivity: causes and implications. Science 2001,293:474–479.
84. Landsea C. Comment on “Monitoring and Under-standing Trends in Extreme Storms—State of
Advanced Review wires.wiley.com/climatechange
84 © 2015 Wiley Per iodicals , Inc. Volume 7, January/February 2016
Knowledge”. Bull Am Meteorol Soc 2015, 96:1177–1179. doi:10.1175/BAMS-D-13-00211.1.
85. Bindoff NL, Stott PA, AchutaRao KM, Allen MR,Gillett N, Gutzler D, Hansingo K, Hegerl G, Hu Y,Jain S, et al. Detection and attribution of climatechange: from global to regional. In: Stocker TF, QinD, Plattner G-K, Tignor M, Allen SK, Boschung J,Nauels A, Xia Y, Bex V, Midgley PM, eds. ClimateChange 2013: The Physical Science Basis. Contribu-tion of Working Group I to the Fifth AssessmentReport of the Intergovernmental Panel on ClimateChange. Cambridge, UK and New York, NY: Cam-bridge University Press; 2013, 1535 pp.
86. Mann ME, Emanuel KA. Atlantic hurricane trendslinked to climate change. Eos 2006, 87:233–244.
87. Booth BBB, Dunstone NJ, Halloran PR, Andrews T,Bellouin N. Aerosols implicated as a prime driver oftwentieth-century North Atlantic climate variability.Nature 2012, 484:228–232.
88. Zhang R, Delworth TL, Sutton R, Hodson D, DixonKW, Held IM, Kushnir Y, Marshall D, Ming Y, Msa-dek R, et al. Have aerosols caused the observedAtlantic multidecadal variability? J Atmos Sci 2013,70:1135–1144.
89. Mann ME, Steinman BA, Miller SK. On forced tem-perature changes, internal variability, and the AMO.Geophys Res Lett 2014, 41:3211–3219.doi:10.1002/2014GL059233.
90. Knight JR, Allan RJ, Folland CK, Vellinga M, MannME. A signature of persistent natural thermohalinecirculation cycles in observed climate. Geophys ResLett 2005, 32:L20708. doi:10.1029/2005GL024233.
91. Zhang R, Delworth TL. Impact of Atlantic multideca-dal oscillations on India/Sahel rainfall and Atlantichurricanes. Geophys Res Lett 2006, 33:L17712.doi:10.1029/2006GL026267.
92. Klotzbach PJ, Gray WM. Multidecadal variability inNorth Atlantic tropical cyclone activity. J Clim 2008,21:3929–3935.
93. Delworth TL, Mann ME. Observed and simulatedmultidecadal variability in the Northern Hemisphere.Clim Dyn 2000, 16:661–676.
94. Evan AT. Atlantic hurricane activity following twomajor volcanic eruptions. J Geophys Res Atmos2012, 117:D06101. doi:10.1029/2011JD016716.
95. Evan AT, Foltz GR, Zhang D, Vimont DJ. Influenceof African dust on ocean–atmosphere variability inthe tropical Atlantic. Nat Geosci 2011, 4:762–765.
96. Evan AT, Vimont DJ, Heidinger AK, Kossin JP, Ben-nartz R. The role of aerosols in the evolution of tropi-cal North Atlantic Ocean temperature anomalies.Science 2009, 324:778–781.
97. Emanuel K, Solomon S, Folini D, Davis S, CagnazzoC. Influence of tropical tropopause layer cooling on
Atlantic hurricane activity. J Clim 2013, 26:2288–2301. doi:10.1175/JCLI-D-12-00242.1.
98. Kalnay E, Kanamitsu M, Kistler R, Collins W, Dea-ven D, Gandin L, Iredell M, Saha S, White G, Wool-len J, et al. The NCEP/NCAR 40-year reanalysisproject. Bull Am Meteorol Soc 1996, 77:437–471.
99. Grinsted A, Moore JC, Jevrejeva S. Homogeneousrecord of Atlantic hurricane surge threat since 1923.Proc Natl Acad Sci USA 2012, 109:19601–19605.
100. Peduzzi P, Chatenoux B, Dao H, De Bono A, HeroldC, et al. Global trends in tropical cyclone risk. NatClim Change 2012, 2:289–294.
101. Srivastava AK, Sinha Ray KC, De US. Trends in thefrequency of cyclonic disturbances and their intensifi-cation over Indian sea. Mausam 2000, 51:113–118.
102. Singh OP, Khan TMA, Rahman MS. Changes in thefrequency of tropical cyclones over the North IndianOcean. Meteorol Atmos Phys 2000, 75:11–20.
103. Niyas NT, Srivastava AK, Hatwar HR. Variabilityand trend in the cyclonic storms over North IndianOcean. Meteorological Monograph No. CycloneWarning—3/2009, 2009, 35 pp. Available at: http://www.imdpune.gov.in/ncc_rept/Met_Monograph%20No.%203_2009.pdf. (Accessed January 20, 2015).
104. Geetha B, Balachandran S. Decadal variations intranslational speeds of cyclonic disturbances overNorth Indian Ocean. Mausam 2014, 65:115–118.
105. Evan AT, Kossin JP, Chung CE, Ramanathan V. Ara-bian Sea tropical cyclones intensified by emissions ofblack carbon and other aerosols. Nature 2011,479:94–97.
106. Evan AT, Kossin JP, Chung C, Ramanathan V. Inten-sified Arabian Sea tropical storms. Nature 2012,2012:E2–E3.
107. Wang B, Xu S, Wu L. Intensified Arabian Sea tropicalstorms. Nature 2012, 489:E1–E2. doi:10.1038/nature11470.
108. Raghavan S, Rajesh S. Trends in tropical cycloneimpact: a study in Andhra Pradesh, India. Bull AmMeteorol Soc 2003, 84:635–644. doi:10.1175/BAMS-84-5-635.
109. Callaghan J, Power SB. Variability and decline in thenumber of severe tropical cyclones making land-fallover eastern Australia since the late nineteenth cen-tury. Clim Dyn 2011, 37:647–662.
110. Hartmann DL, Klein Tank AMG, Rusticucci M,Alexander LV, Brönnimann S, Charabi Y, DentenerFJ, Dlugokencky EJ, Easterling DR, Kaplan A,et al. Observations: atmosphere and surface. In:Stocker TF, Qin D, Plattner G-K, Tignor M, AllenSK, Boschung J, Nauels A, Xia Y, Bex V, MidgleyPM, eds. Climate Change 2013: The Physical ScienceBasis. Contribution of Working Group I to the FifthAssessment Report of the Intergovernmental Panel on
WIREs Climate Change Tropical cyclones and climate change
Volume 7, January/February 2016 © 2015 Wiley Per iodica ls , Inc. 85
Climate Change. Cambridge, UK and New York,NY: Cambridge University Press; 2013.
111. Kuleshov YR, Fawcett R, Qi L, Trewin B, Jones D,McBride J, Ramsay H. Trends in tropical cyclones inthe South Indian Ocean and the South Pacific Ocean.J Geophys Res Atmos 2010, 115:D01101.doi:10.1029/2009JD012372.
112. Malan N, Reason CJC, Loveday BR. Variability intropical cyclone heat potential over the SouthwestIndian Ocean. J Geophys Res Oceans 2013,118:6734–6746. doi:10.1002/2013JC008958.
113. Klotzbach PJ. Trends in global tropical cycloneactivity over the past twenty years (1986–2005).Geophys Res Lett 2006, 33:L10805. doi:10.1029/2006GL025881.
114. Raga GB, Bracamontes-Ceballos B, Farfán L,Romero-Centeno R. Landfalling tropical cycloneson the Pacific coast of Mexico: 1850–2010. Atmos-fera 2013, 26:209–220.
115. Mantua NJ, Hare SR. The Pacific decadal oscillation.J Oceanogr 2002, 58:35–44.
116. Pazos M, Mendoza B. Landfalling tropical cyclonesalong the eastern Pacific coast between the sixteenthand twentieth centuries. J Clim 2013, 26:4219–4230.
117. Camargo SJ, Sobel AH, Barnston AG, Klotzbach PJ.Chapter 11: the influence of natural climate variabil-ity, and seasonal forecasts of tropical cyclone activity.In: Chan JCL, Kepert JD, eds. Global Perspectives onTropical Cyclones, from Science to Mitigation. WorldScientific Series on Earth System Science in Asia,vol. 4. 2nd ed. Singapore: World Scientific; 2010,325–360. ISBN: 978-981-4293-47-1.
118. Klotzbach PJ. The influence of El Niño–Southernoscillation and the Atlantic multidecadal oscillationon Caribbean tropical cyclone activity. J Clim 2011,24:721–731.
119. Zhang G, Wang Z. Interannual variability of theAtlantic Hadley circulation in boreal summer and itsimpacts on tropical cyclone activity. J Clim 2013,26:8529–8544.
120. Diamond HJ, Lorrey AM, Renwick JA. A southwestPacific tropical cyclone climatology and linkages tothe El Niño–Southern Oscillation. J Clim 2013,26:3–25.
121. Chand SS, Tory KJ, McBride J, Wheeler MC, DareR, Walsh KJE. The different impact of positive–neutral and negative–neutral ENSO regimes onAustralian tropical cyclones and rainfall. J Clim2013, 26:8008–8016.
122. Felton CS, Subrahmanyam B, Murty VSN. ENSO-modulated cyclogenesis over the Bay of Bengal.J Clim 2013, 26:9806–9818.
123. Chen JH, Lin S-J. The remarkable predictability ofinterannual variability of Atlantic hurricanes during
the past decades. Geophys Res Lett 2011, 38:L11804. doi:10.1029/2011GL047629.
124. Wang H, Long L, Kumar A, Wang W, Schemm J-KE,Zhao M, Vecchi GA, LaRow TE, Lin Y-K, SchubertSD, et al. How well do global climate models simu-late the variability of Atlantic tropical cyclones asso-ciated with ENSO? J Clim 2014, 27:5673–5692.
125. Vecchi GA, Delworth T, Gudgel R, Kapnick S, RosatiA, Wittenberg AT, Zeng F, Anderson W, Balaji V,Dixon K, et al. On the seasonal forecasting ofregional tropical cyclone activity. J Clim 2014,27:7994–8016. doi:10.1175/JCLI-D-14-00158.1.
126. Bell R, Hodges K, Vidale PL, Strachan J, Roberts M.Simulation of the global ENSO–tropical cycloneteleconnection by a high-resolution coupled generalcirculation model. J Clim 2014, 27:6404–6422.
127. Walsh KJE. Fine resolution simulations of the effectof climate change on tropical cyclones in the SouthPacific. Clim Dyn 2015, 45:2619–2631.
128. Christensen JH, Krishna Kumar K, Aldrian E, An S-I,Cavalcanti IFA, de Castro M, Dong W, Goswami P,Hall A, Kanyanga JK, et al. Climate phenomena andtheir relevance for future regional climate change. In:Stocker TF, Qin D, Plattner G-K, Tignor M, AllenSK, Boschung J, Nauels A, Xia Y, Bex V, MidgleyPM, eds. Climate Change 2013: The Physical ScienceBasis. Contribution of Working Group I to the FifthAssessment Report of the Intergovernmental Panel onClimate Change (IPCC AR5). Cambridge, UK andNew York, NY: Cambridge University Press; 2013.
129. Sugi M, Murakami H, Yoshimura J. On the mechan-ism of tropical cyclone frequency changes due toglobal warming. J Meteorol Soc Jpn 2012,90A:397–408.
130. Zhao M, Held IM, Vecchi G, Scoccimarro E, WangH, Wehner M, Lim Y-K, LaRow T, Camargo SJ,Walsh K, et al. Robust direct effect of increasingatmospheric CO2 concentration on global tropicalcyclone frequency—a multi-model inter-comparison.CLIVAR Variations 2013, 11:17–23. Available at:http://www.usclivar.org/sites/default/files/USCLI-VAR_VARIATIONS_11_3_Fall2013.pdf. (AccessedDecember 5, 2013).
131. Rappin ED, Nolan DS, Emanuel KA. Thermody-namic control of tropical cyclogenesis in environ-ments of radiative-convective equilibrium with shear.Q J R Meteorol Soc 2010, 136:1954–1971.
132. Bruyère CL, Holland GJ, Towler E. Investigating theuse of a genesis potential index for tropical cyclonesin the North Atlantic Basin. J Clim 2012,25:8611–8626.
133. Walsh KJE, Camargo SJ, Vecchi GA, Daloz AS, Els-ner J, Emanuel K, Horn M, Lim Y-K, Roberts M,Patricola C, et al. Hurricanes and climate: theU.S. CLIVAR working group on hurricanes. Bull AmMeteorol Soc 2015, 96:997–1017.
Advanced Review wires.wiley.com/climatechange
86 © 2015 Wiley Per iodicals , Inc. Volume 7, January/February 2016
134. Satoh M, Yamada Y. Constraint on future change ofnumber of tropical cyclones associated with globalwarming. J Meteorol Soc Jpn. In press.
135. Menkes CE, Lengaigne M, Marchesiello P, JourdainNC, Vincent EM, Lefevre J, Chauvin F, Royer J-F.Comparison of tropical cyclogenesis indices on sea-sonal to interannual timescales. Clim Dyn 2012,38:301–321.
136. Tippett MK, Camargo SJ, Sobel AH. A Poissonregression index for tropical cyclone genesis and therole of large-scale vorticity in genesis. J Clim 2011,24:2335–2357.
137. Emanuel KA, Nolan DS. Tropical cyclone activityand global climate. In: Proceedings of the 26th Con-ference on Hurricanes and Tropical Meteorology,American Meteorological Society, Miami, FL, 2004,240–241. Available at: ftp://texmex.mit.edu/pub/ema-nuel/PAPERS/em_nolan_extended_2004.pdf.(Accessed October 10, 2015).
138. Emanuel K. Tropical cyclone activity downscaledfrom NOAA-CIRES reanalysis, 1908–1958. J AdvModel Earth Syst 2010, 2.
139. Camargo SJ, Tippett MK, Sobel AH, Vecchi GA,Zhao M. Testing the performance of tropical cyclonegenesis indices in future climates using the HIRAMmodel. J Clim 2014, 27:9171–9196.
140. Peng MS, Fu B, Li T, Stevens DE. Developing versusnondeveloping disturbances in the North Atlanticand Western North Pacific, part I: the North Atlantic.Mon Weather Rev 2012, 140:1047–1066.doi:10.1175/2011MWR3617.1.
141. Bister M, Emanuel KA. Dissipative heating and hurri-cane intensity. Meteorol Atmos Phys 1998,65:233–240.
142. Tang B, Emanuel K. Sensitivity of tropical cycloneintensity to ventilation in an axisymmetric model.J Atmos Sci 2012, 69:2394–2413.
143. Emanuel K, Sobel A. Response of tropical sea surfacetemperature, precipitation, and tropical cyclone-related variables to changes in global and local forc-ing. J Adv Model Earth Syst 2013, 5:447–458.
144. Camargo SJ, Ting M, Kushnir Y. Influence of localand remote SST on North Atlantic tropical cyclonepotential intensity. Clim Dyn 2013, 40:1515–1529.
145. Ting M, Camargo SJ, Li C, Kushnir Y. Natural andforced North Atlantic hurricane potential intensitychange in CMIP5 models. J Clim 2015,28:3926–3942.
146. Villarini G, Vecchi GA. Twenty-first-century projec-tions of North Atlantic tropical storms from CMIP5models. Nat Clim Change 2012, 2:604–607.
147. Knutson TR, Sirutis JJ, Vecchi GA, Garner S, ZhaoM, Kim H-S, Bender M, Tuleya RE, Held IM, Villar-ini G. Dynamical downscaling projections of late 21stcentury Atlantic hurricane activity: CMIP3 and
CMIP5 model-based scenarios. J Clim 2013,26:6591–6617. doi:10.1175/JCLI-D-12-00539.1-.
148. Ramsay HA. The effects of imposed stratosphericcooling on the maximum intensity of tropicalcyclones in axisymmetric radiative–convective equi-librium. J Clim 2013, 26:9977–9985.
149. Wang S, Camargo SJ, Sobel AH, Polvani LM. Impactof the tropopause temperature on the intensity oftropical cyclones—an idealized study using a meso-scale model. J Atmos Sci 2014, 71:4333–4348.
150. Bell R, Strachan J, Vidale PL, Hodges K, Roberts M.Response of tropical cyclones to idealized climatechange experiments in a global high-resolutioncoupled general circulation model. J Clim 2013,26:7966–7980.
151. Shaevitz DA, Camargo SJ, Sobel AH, Jonas JA, KimD, Kumar A, LaRow TE, Lim Y-K, Murakami H,Reed K, et al. Characteristics of tropical cyclones inhigh-resolution models in the present climate. J AdvModel Earth Syst 2014, 6:1154–1172.
152. Tory KJ, Dare RA, Davidson NE, McBride JL, ChandSS. The importance of low-deformation vorticity intropical cyclone formation. Atmos Chem Phys2013a, 13:2115–2132.
153. Tory KJ, Chand SS, Dare RA, McBride JL. An assess-ment of a model-, grid-, and basin-independent tropi-cal cyclone detection scheme in selected CMIP3global climate models. J Clim 2013c, 26:5508–5522.
154. Mei W, Xie S, Zhao M. Variability of tropicalcyclone track density in the North Atlantic: observa-tions and high-resolution simulations. J Clim 2014,27:4797–4814. doi:10.1175/JCLI-D-13-00587.1.
155. Sugi M, Yoshimura J. Decreasing trend of tropicalcyclone frequency in 228-year high-resolution AGCMsimulations. Geophys Res Lett 2012, 39:L19805.doi:10.1029/2012GL053360.
156. Tory KJ, Chand SS, McBride JL, Ye H, Dare RA.Projected changes in late 21st century tropical cyclonefrequency in CMIP5 models. In: Proceedings of the31st Conference on Hurricanes and Tropical Meteor-ology, American Meteorological Society, San Diego,CA, 2014, 7C.4. Available at: https://ams.confex.com/ams/31Hurr/webprogram/Paper245100.html.(Accessed September 6, 2014).
157. Murakami H, Hsu P-C, Arakawa O, Li Y. Influenceof model biases on projected future changes in tropi-cal cyclone frequency of occurrence. J Clim 2014,27:2159–2181.
158. Camargo SJ. Global and regional aspects of tropicalcyclone activity in the CMIP5 models. J Clim 2013,26:9880–9902. doi:10.1175/JCLI-D-12-00549.1.
159. Tory KJ, Chand SS, Dare RA, McBride JL. The devel-opment and assessment of a model-, grid-, and basin-independent tropical cyclone detection scheme. J Clim2013b, 26:5493–5507.
WIREs Climate Change Tropical cyclones and climate change
Volume 7, January/February 2016 © 2015 Wiley Per iodica ls , Inc. 87
160. Murakami H, Mizuta R, Shindo E. Future changes intropical cyclone activity projected by multi-physicsand multi-SST ensemble experiments using the 60-km-mesh MRI-AGCM. Clim Dyn 2012b, 39:2569–2584. doi:10.1007/s00382-011-1223-x.
161. Strachan J, Vidale PL, Hodges K, Roberts M, Dem-ory M-E. Investigating global tropical cyclone activitywith a hierarchy of AGCMs: the role of model resolu-tion. J Clim 2013, 26:133–152. doi:10.1175/JCLI-D-12-00012.1.
162. Rathmann NM, Yang S, Kaas E. Tropical cyclones inenhanced resolution CMIP5 experiments. Clim Dyn2013, 42:665–681.
163. Emanuel KA. Downscaling CMIP5 climate modelsshows increased tropical cyclone activity over the21st century. Proc Natl Acad Sci USA 2013, 110.doi:10.1073/pnas.1301293110.
164. Li T, Kwon M, Zhao M, Kug J-S, Luo J-J, Yu W.Global warming shifts Pacific tropical cyclonelocation. Geophys Res Lett 2010, 37:L21804.doi:10.1029/2010GL045124.
165. Murakami H, Wang B, Li T, Kitoh A. Projectedincrease in tropical cyclones near Hawaii. Nat ClimChange 2013, 3:749–754.
166. Murakami H, Sugi M, Kitoh A. Future changes intropical cyclone activity in the North Indian Oceanprojected by high-resolution MRI-AGCMs. Clim Dyn2013, 40:1949–1968.
167. Tang B, Camargo SJ. Environmental control of tropi-cal cyclones in CMIP5: a ventilation perspective.J Adv Model Earth Syst 2014, 6:115–128.doi:10.1002/2013MS000294.
168. Evans JL, Waters JJ. Simulated relationships betweensea surface temperatures and tropical convection inclimate models and their implications for tropicalcyclone activity. J Clim 2012, 25:7884–7895.
169. Vecchi GA, Soden BJ. Effect of remote sea surfacetemperature change on tropical cyclone potentialintensity. Nature 2007, 450:1066–1070.doi:10.1038/nature06423.
170. Johnson NC, Xie SP. Changes in the sea surface tem-perature threshold for tropical convection. NatGeosci 2010, 3:842–845.
171. Colbert AJ, Soden BJ, Vecchi GA, Kirtman BP. Theimpact of anthropogenic climate change on NorthAtlantic tropical cyclone tracks. J Clim 2013,26:4088–4095.
172. Murakami H, Wang B. Future change of NorthAtlantic tropical cyclone tracks: projection by a 20-km-mesh global atmospheric model. J Clim 2010,23:2699–2721.
173. Wang R, Wu L, Wang C. Typhoon track changesassociated with global warming. J Clim 2011,24:3748–3752.
174. Murakami H, Wang B, Kitoh A. Future change ofwestern North Pacific typhoons: projections by a 20-km-mesh global atmospheric model. J Clim 2011,24:1154–1169.
175. Yokoi S, Takayabu YN. Attribution of projectedfuture changes in tropical cyclone passage frequencyover the Western North Pacific. J Clim 2013,26:4096–4111.
176. Lavender SL, Walsh KJE. Dynamically downscaledsimulations of Australian region tropical cyclones incurrent and future climates. Geophys Res Lett 2011,38. doi:10.1029/2011GL047499.
177. Manganello JV, Hodges KI, Kinter JL III, Cash BA,Marx L, Jung T, Achuthavarier D, Adams JM,Altshuler EL, Huang B, et al. Tropical cyclone clima-tology in a 10-km global atmospheric GCM: towardweather-resolving climate modeling. J Clim 2012,25:3867–3893. doi:10.1175/JCLI-D-11-00346.1.
178. Knutson TR, Sirutis JJ, Zhao M, Tuleya RE, BenderM, Vecchi GA, Villarini G, Chavas D. Global projec-tions of intense tropical cyclone activity for the late21st century from dynamical downscaling of CMIP5/RCP4.5 scenarios. J Clim 2015, 28:7203–7224.
179. Kanada S, Wada A, Sugi M. Future changes in struc-tures of extremely intense tropical cyclones using a 2-km mesh nonhydrostatic model. J Clim 2013,26:9986–10005. doi:10.1175/JCLI-D-12-00477.1.
180. Tsuboki K, Yoshioka M, Shinoda T, Kato M,Kanada S, Kitoh A. Future increase of super-typhoonintensity associated with climate change. GeophysRes Lett 2014, 42:646–652.
181. Emanuel KA. The theory of hurricanes. Annu RevFluid Mech 1991, 23:179–196.
182. Strazzo SE, Elsner JB, LaRow T, Halperin DJ, ZhaoM. Observed versus GCM-generated local tropicalcyclone frequency: comparisons using a spatial lattice.J Clim 2013, 26:8257–8268.
183. Kim H-S, Vecchi GA, Knutson TR, Anderson WG,Delworth TL, Rosati A, Zeng F, Zhao M. Tropicalcyclone simulation and response to CO2 doubling inthe GFDL CM2.5 high-resolution coupled climatemodel. J Clim 2014, 27:8034–8054. doi:10.1175/JCLI-D-13-00475.1.
184. Scoccimarro E, Gualdi S, Bellucci A, Sanna A, FogliPG, Manzini E, Vichi M, Oddo P, Navarra A. Effectsof tropical cyclones on ocean heat transport in a highresolution coupled general circulation model. J Clim2011, 24:4368–4384. doi:10.1175/2011JCLI4104.1.
185. Bueti MR, Ginis I, Rothstein LM, Griffies SM. Tropi-cal cyclone-induced thermocline warming and itsregional and global impacts. J Clim 2014,27:6978–6999.
186. Villarini G, Lavers DA, Scoccimarro E, Zhao M,Wehner MF, Vecchi G, Knutson T. Sensitivity oftropical cyclone rainfall to idealized global scale for-cings. J Clim 2014, 27:4622–4641.
Advanced Review wires.wiley.com/climatechange
88 © 2015 Wiley Per iodicals , Inc. Volume 7, January/February 2016
187. Scoccimarro E, Gualdi S, Villarini G, Vecchi G, ZhaoM, Walsh K, Navarra A. Intense precipitation eventsassociated with landfalling tropical cyclones inresponse to a warmer climate and increased CO2.J Clim 2014, 27:4642–4654.
188. Peterson TC, Karl TR, Kossin JP, Kunkel KE, Lawri-more JH, McMahon JR, Vose RS, Yin X. Changes inweather and climate extremes: state of knowledge rel-evant to air and water quality in the United States.J Air Waste Manage Assoc 2014, 64:184–197.doi:10.1080/10962247.2013.851044.
189. Lin N, Emanuel K, Oppenheimer M, Vanmarcke E.Physically based assessment of hurricane surge threatunder climate change. Nat Clim Change 2012,2:462–467.
190. Woodruff JD, Irish JL, Camargo SJ. Coastal floodingby tropical cyclones and sea-level rise. Nature 2013,504:44–52. doi:10.1038/nature12855.
191. McInnes K, Walsh K, Hoeke RK, O’Grady JG, Col-berg F. Quantifying storm tide risk in Fiji due to cli-mate variability and change. Glob Planet Change2014, 116:115–129.
192. Tebaldi C, Strauss BH, Zervas CE. Modelling sealevel rise impacts on storm surges along US coasts.Environ Res Lett 2012, 7:014032.
193. Horn M, Walsh K, Zhao M, Camargo SJ, Scocci-marro E, Murakami H, Wang H, Ballinger A, Kumar
A, Shaevitz D, et al. Tracking scheme dependence ofsimulated tropical cyclone response to idealized cli-mate simulations. J Clim 2014, 27:9197–9213.
194. Walsh K, Fiorino M, Landsea C, McInnes K. Objec-tively-determined resolution-dependent threshold cri-teria for the detection of tropical cyclones in climatemodels and reanalyses. J Clim 2007, 20:2307–2314.
195. Camargo SJ, Zebiak SE. Improving the detectionand tracking of tropical cyclones in atmospheric gen-eral circulation models. Weather Forecast 2002,17:1152–1162.
196. Lander MA. Description of a monsoon gyre and itseffects on the tropical cyclones in the western NorthPacific during August 1991. Weather Forecast 1994,9:640–654.
197. Park DSR, Ho CH, Kim HS, Kim JH. Spatially inho-mogeneous trends of tropical cyclone intensity overthe Western North Pacific for 1977–2010. J Clim2013, 26:5088–5101.
198. Park DSR, Ho CH, Kim JH. Growing threat ofintense tropical cyclones to East Asia over the period1977–2010. Environ Res Lett 2014, 9:014008.
199. Sugi M, Murakami H. Bias correction for regionalprojections of tropical cyclone intensity changes. In:AOGS 11th Annual Meeting, 28 July–1 August,2014, Sapporo, Japan.
WIREs Climate Change Tropical cyclones and climate change
Volume 7, January/February 2016 © 2015 Wiley Per iodica ls , Inc. 89