tropical-cyclone convection: the effects of a near
TRANSCRIPT
Quarterly Journal of the Royal Meteorological Society Q. J. R. Meteorol. Soc. 00: 1–14 (2016)
Tropical-cyclone convection: the effects of a near tropicalstorm strength vortex on deep convection
Gerard Kilroya∗and Roger K. Smitha
a Meteorological Institute, Ludwig-Maximilians University of Munich, Munich, Germany∗Correspondence to: Gerard Kilroy, Meteorological Institute, Ludwig-Maximilians University of Munich, Theresienstr.
37, 80333 Munich, Germany, Email: [email protected]
Idealized numerical model simulations are used to investigate the generationand evolution of vertical vorticity by deep convection in a warm-cored vortexof near tropical storm strength. Deep convective updraughts are initiated bythermal perturbations located at different radii from the vortex axis. It isfound that, as the location of the thermal perturbation is moved away fromthe axis of rotation, the updraught that results becomes stronger, the cyclonicvorticity anomaly generated by the updraught becomes weaker, the structure ofthe vorticity anomaly changes and the depth of the anomaly increases. For anupdraught along or near the vortex axis, the vorticity anomaly has the structureof a monopole and little or no anticyclonic vorticity is generated in the core.Vorticity dipoles are generated in updraughts near or beyond the radius ofmaximum tangential wind speed and this structure reverses in sign with height.In all cases the anomalies persist long after the initial updraught has decayed.Implications of the results for understanding the vorticity consolidation duringtropical cyclogenesis are discussed.The effects of eddy momentum fluxes associated with a single updraughton the tangential-mean velocity tendency are investigated and a conceptualframework for the interpretation of these eddy fluxes is given. The simulationsare used to appraise long standing ideas suggesting that latent heat releasein deep convection occurring in the high inertial stability region of a vortexcore is “more efficient” than deep convection outside the core in producingtemperature rise in the updraught.Copyright c© 2016 Royal Meteorological Society
Key Words: tropical cyclones, rotating deep convection, vortical hot towers
Received March 10, 2016; Revised ; Accepted
Citation: . . .
1. Introduction
The pioneering numerical studies of tropical cyclogenesisby Hendricks et al. (2004) and Montgomery et al. (2006)highlighted the potentially important role of vorticityamplification by rotating deep convection in the dynamicsof genesis. In these and subsequent studies (Tory et al.2006a,b, 2007, Nolan 2007, Nguyen et al. 2008, Shin andSmith 2008, Fang and Zhang 2010, Ngyuen et al. 2011,Gopalakrishnan et al. 2011, Bao et al. 2012, Persing etal. 2013, Nicholls and Montgomery 2013, Davis 2015),
the progressive aggregation, merger and axisymmetrizationof the convectively-enhanced vorticity anomalies aidedby the convectively-induced system-scale convergence arefound to be prominent features in both the formationand intensification of tropical cyclones in models. Recentreviews of these studies are given by Montgomery andSmith (2014) and Smith and Montgomery (2015).
Motivated by the early findings and in parallel with sub-sequent work, there has been a series of numerical investiga-tions of vorticity production by individual deep convectiveclouds in rotating environments with background flows of
Copyright c© 2016 Royal Meteorological SocietyPrepared using qjrms4.cls [Version: 2011/05/18 v1.02]

2 Gerard Kilroy and Roger K. Smith
increasing complexity (Rozoff 2007, Wissmeier and Smith2011, Kilroy and Smith, 2012, 2015 (henceforth KS15),Kilroy et al. 2014 (henceforth KSW14)). Such studies arepertinent to developing an understanding of the evolutionof more complex vortex systems involving local vorticityamplification by multiple deep clouds. A review of theearlier studies by Rozoff (2007), Wissmeier and Smith(2011) and Kilroy and Smith (2012), which consideredquiescent environments, and those which included uniformhorizontal and/or vertical shear is given by KSW14.
KSW14 investigated the effects of a unidirectionalboundary-layer wind structure on storm structure, espe-cially on vertical vorticity production. They investigatedalso the combined effects of horizontal and vertical shear onvertical vorticity production, with and without backgroundrotation. They noted that in tropical depressions and tropicalcyclones, the tangential wind speed decreases with heightabove a shallow boundary layer so that the sign of theradial vorticity component changes sign at some low level,typically on the order of a few kilometres. It was shown thatthe tilting of horizontal vorticity by a convective updraughtin this environment leads not only to dipole patterns ofvertical vorticity, but also to a reversal in sign of the vorticitywith height. The results are in contrast to the classical mid-latitude thunderstorm case, where the wind increases instrength with height so that the local cross-wise vorticity hasa single sign (see Ramsay and Doswell 2005; their Fig. 1).These findings add a layer of complexity to interpretationsof the aggregation of convectively induced cyclonic vortic-ity anomalies in terms of barotropic dynamics (e.g. Nguyenet al., 2008).
Another complication in the context of tropical cyclonesis that there is a significant radial wind component in theboundary layer, an effect that was omitted in KSW14.KS15 carried out a further series of numerical experimentsto investigate the effects of a vortex boundary-layer windprofile on the generation of vertical vorticity in tropicaldeep convection. In these experiments the wind hodographturned clockwise with height within the boundary layer.Situations were considered in which there was either novertical shear above the boundary layer, or negative verticalshear appropriate to a warm-cored vortex. Deep convectiongrowing in these environments develops dipole structures ofvertical-vorticity in which the cyclonic gyre is favoured andpersists longer than the anticyclonic one. The orientationof the dipole at a particular height is determined partlyby that of the ambient horizontal vortex lines, whichrotate with height, and also by the vertical advection ofvertical vorticity from below. When negative vertical shearabove the boundary layer is considered the vorticity dipolereverses in sign at some height, but because of the strongvertical advection of the dipole from below, the reversalin sign occurs at a much higher altitude than would beexplained by the linear theory of Rotunno and Klemp(1982).
In the present paper we go one step further in realismand investigate vertical vorticity generation in an initially-balanced, warm-cored vortex. In such a vortex there arespatial variations of temperature, vorticity and tangentialwind, all of which could influence the development ofvertical vorticity within deep clouds growing in such anenvironment. Vertical vorticity developing within the radiusof maximum tangential winds (where the flow regime isvorticity dominated) is expected to be longer lived, whereasthat developing outside the radius of maximum winds
Figure 1. Skew-T log-p diagram showing the temperature (right solidcurve) and dew point temperature (left solid curve) of the Karl pouchsounding used in this study.
(where the flow is strain dominated) is expected to beweaker and more filamented (Rozoff et al. 2009). Cloudsdeveloping outside the radius of maximum winds are moresusceptible also to the entrainment of ambient air (Rozoffet al. 2006), which will affect the maximum updraughtstrength. The aim of this study is to highlight and quantifysuch effects.
The plan is to initiate deep convection with a thermalperturbation at different radial locations in a warm-coredvortex and examine the generation and decay of verticalvorticity during the lifetime of the cloud. Several locationsare chosen, both inside and outside the radius of maximumtangential winds. We examine also the contributions ofdeep convective clouds on the evolution of the vortexitself by analysing azimuthally-averaged eddy terms in thetangential momentum equation (Persing et al. 2013). Thesecalculations are seen as the next step to understandinghow deep convective clouds generate vertical vorticity atdifferent radial locations within tropical cyclones.
The paper is organized as follows. A brief descriptionof the numerical model is given in section 2 and theconfiguration of the experiments is described in section 3.The results are presented in sections 4 and a discussion ofthe relevance of these results for tropical cyclone genesisand intensification is given in section 5. The contributionsof deep convective clouds on the evolution of the vortex arediscussed in section 6, and a discussion of the “efficiency”of deep convection in relation to its location in the vortex isgiven in section 7. The conclusions are given in section 8.
2. The numerical model
The numerical simulations relate to the prototype problemfor tropical cyclone intensification, which considers theevolution of a prescribed, initially cloud-free axisymmetricweak vortex in a quiescent environment on an f -planeas articulated in Nguyen et al. (2008). They are carriedout using the numerical model CM1 version 16, a non-hydrostatic and fully compressible cloud model (Bryan
Copyright c© 2016 Royal Meteorological Society Q. J. R. Meteorol. Soc. 00: 1–14 (2016)Prepared using qjrms4.cls
TROPICAL CYCLONE CONVECTION 3
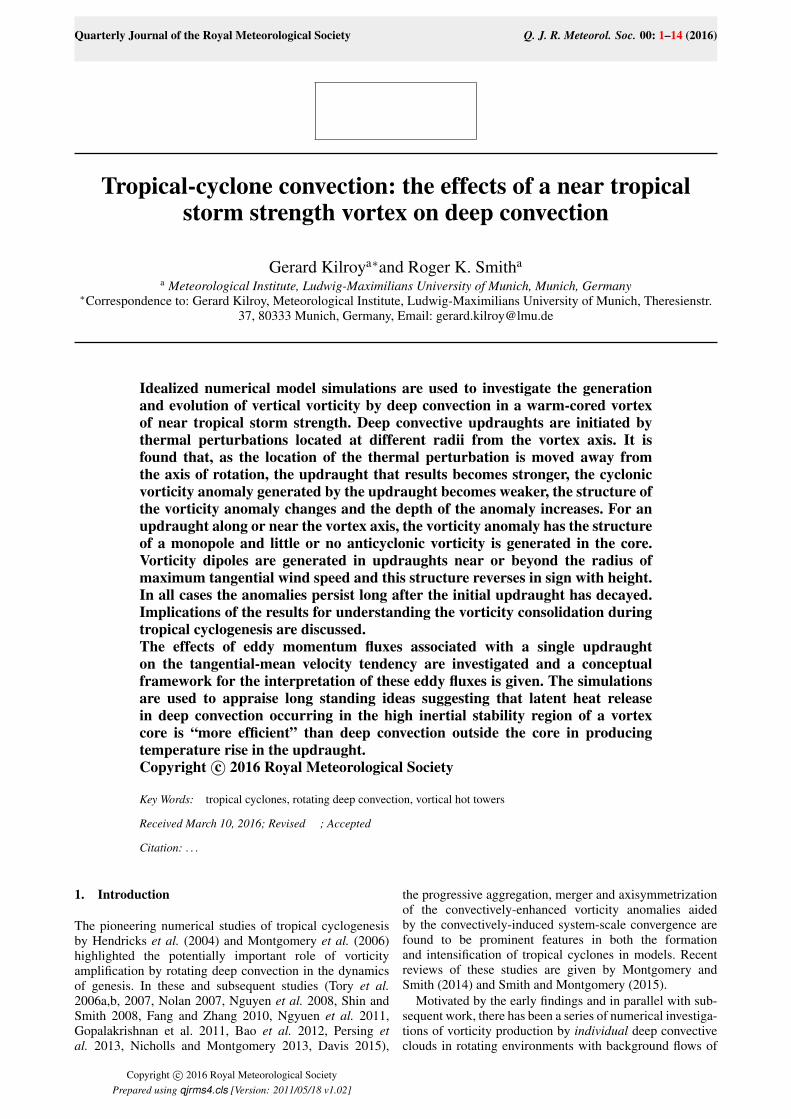
Figure 2. Vertical cross section of the initial vortex structure and thelocations of the initial thermals. Contours: V wind component contouredevery 2 m s−1, with blue shading for regions stronger than 10 m s−1. Thelocations of the initial thermal perturbation for the various experiments areindicated by vertical lines labelled E1, E2, etc.
and Fritsch 2002)∗ in the three-dimensional configurationdescribed by Persing et al. (2013) and C̆rnivec et al. (2016),except that a larger inner grid-mesh region with constantgrid spacing is used here. Specifically, the outer domain is1500× 1500 km in size with variable spacing increasingto 10 km near the domain boundaries. The inner domain is300× 300 km in size and has a grid spacing of 500 m. Thedomain has 40 vertical levels extending to a height of 25km. The vertical grid spacing expands gradually from 50 mnear the surface to 1200 m at the top of the domain.
In brief, the model has prediction equations forthe three components of the velocity vector, specifichumidity, suspended liquid, perturbation Exner function,and perturbation density potential temperature, whereperturbation quantities are defined relative to a prescribedhydrostatic basic state. A simple warm-rain scheme isused in which rain has a fixed fall speed of 7 m s−1.For simplicity, ice microphysical processes and dissipativeheating are not included in these experiments. The largetime step is 5 seconds and the integration time is 2 h.There are ten small time steps for each large time stepto resolve fast-moving sound waves. A Rayleigh dampinglayer is added at heights above 20 km to suppress theartificial reflection of internal gravity waves from the upperboundary. The e-folding time scale for this damping is 5min. Rayleigh damping is applied also within 100 km of thelateral boundaries, which are rigid walls. Radiative effectsare represented by adopting a simple Newtonian coolingapproximation with a time scale of 12 h. Following Rotunnoand Emanuel (1987), the magnitude of the cooling rate iscapped at 2 K per day.
2.1. Thermodynamic sounding
All experiments use the reference sounding shown inFig. 1. It is constructed from a day mean of dropsondesoundings in the pouch region of pre-genesis tropical stormKarl on 12 Sep 2010, obtained during the Pre-Depression
∗For a complete description of the three-dimensional model and variabledefinitions see the technical document “The governing equations forCM1”, available for download at http://www.mmm.ucar.edu/people/bryan/cm1 and available also from G. Bryan at the NationalCenter for Atmospheric Research. For a complete description of theaxisymmetric version of CM1, see the paper by Bryan and Rotunno (2009).
Investigation of Cloud Systems in the Tropics (PREDICT)field campaign (see Montgomery et al. 2012 for moredetails). This sounding has a CAPE† of 1950 J kg−1, aConvection Inhibition (CIN)‡ of 47 J kg−1 and a TotalPrecipitable Water (TPW) value of 61 kg m−2. The surfacetemperature is 302.15 K.
2.2. Initial vortex and wind profiles
As in C̆rnivec et al. (2016) and Kilroy et al. (2016a), theprescribed initial vortex is axisymmetric and in thermalwind balance. The initial tangential wind speed has amaximum of 15 m s−1 at the surface at a radius of 75km from the centre of circulation. The tangential windcomponent decreases sinusoidally with height, becomingzero at a height of 20 km. Above this height, the tangentialwind is set to zero. The balanced pressure, density andtemperature fields consistent with this prescribed tangentialwind distribution are obtained using the method describedby Smith (2006). A vertical cross section of the initial vortexis shown in Fig. 2, along with the locations of the initialthermal perturbations used for all experiments.
2.3. Representation of vertical vorticity
The calculations are carried out on an f -plane with theCoriolis parameter f = 2.53× 10⁻⁵ s−1, correspondingto a latitude of 10◦N. The background vertical vorticityassociated with the initial vortex is represented in Fig. 3.
2.4. Initiation of convection
Convection is initiated by a symmetric thermal perturbationwith a horizontal radius of 10 km and a vertical extent of 1km. The temperature excess has a maximum at the surface atthe centre of the perturbation and decreases monotonicallyto zero at the perturbation’s edge. The perturbation centrecoincides with the centre of the domain. In general, thedetails of the ensuing convection such as the updraughtdepth and the maximum updraught strength will dependon the amplitude and spatial structure of the thermalperturbation. A maximum temperature perturbation of 3.5K is used in all experiments, which is 0.5 K larger thanthat used in KW14, but the same as that used in Wissmeierand Smith (2011). The water vapour mixing ratio in thewarm bubble is increased so that the relative humidityis essentially the same as the surrounding environment,and this moisture adjustment does not lead to noticeabledifferences in TPW between the experiments.
3. The numerical experiments
We describe eight numerical experiments, details of whichare summarized in Fig. 3. Shown are the distance of the
†We remind the reader that CAPE is a parcel quantity that typically has astrong negative vertical gradient in the lower troposphere. For this reason,the values cited herein are based on an average for air parcels lifted fromthe surface and at 100 m intervals above the surface to a height of 500m. Since the calculation of CAPE is a non-linear function of temperatureand moisture, we prefer this method to one based on averaged values oftemperature and mixing ratio through a surface-based layer of air withsome arbitrarily-prescribed depth.‡Like CAPE, CIN is a quantity that refers also to an air parcel. Rather thancomputing an average up to 500 m as for CAPE, it seems physically morereasonable to examine the minimum value of CIN up to this level.
Copyright c© 2016 Royal Meteorological Society Q. J. R. Meteorol. Soc. 00: 1–14 (2016)Prepared using qjrms4.cls
4 Gerard Kilroy and Roger K. Smith
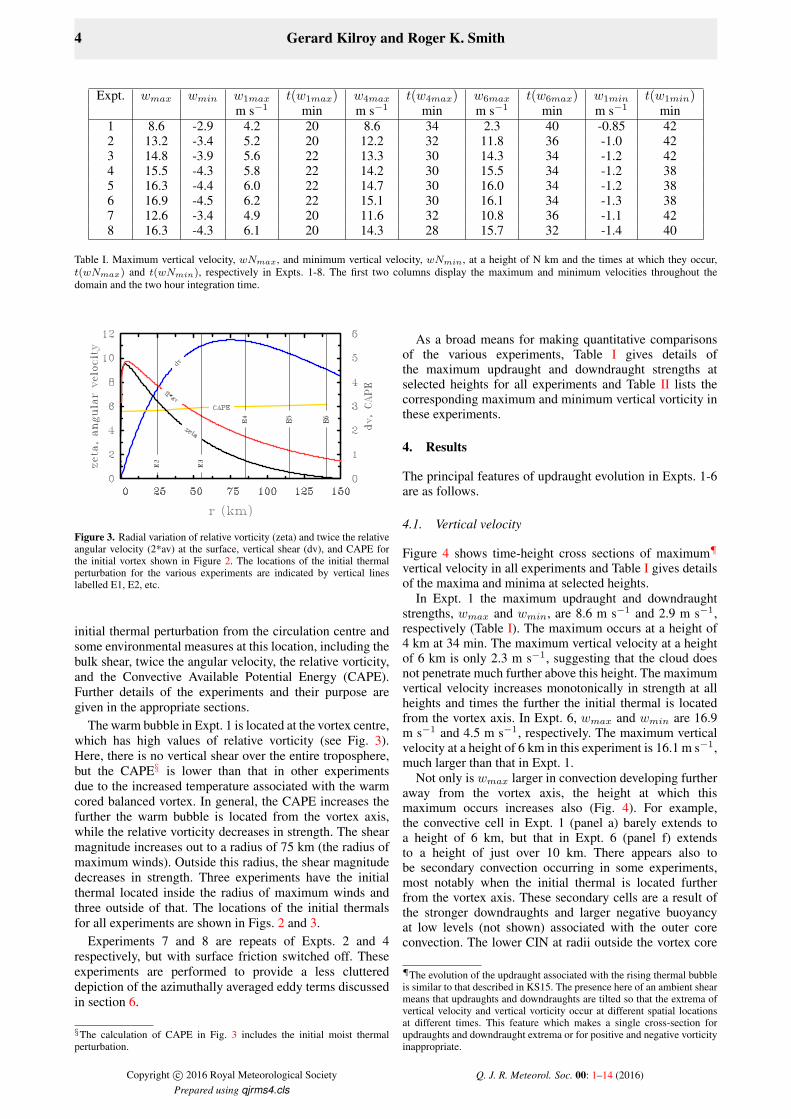
Expt. wmax wmin w1max t(w1max) w4max t(w4max) w6max t(w6max) w1min t(w1min)m s−1 min m s−1 min m s−1 min m s−1 min
1 8.6 -2.9 4.2 20 8.6 34 2.3 40 -0.85 422 13.2 -3.4 5.2 20 12.2 32 11.8 36 -1.0 423 14.8 -3.9 5.6 22 13.3 30 14.3 34 -1.2 424 15.5 -4.3 5.8 22 14.2 30 15.5 34 -1.2 385 16.3 -4.4 6.0 22 14.7 30 16.0 34 -1.2 386 16.9 -4.5 6.2 22 15.1 30 16.1 34 -1.3 387 12.6 -3.4 4.9 20 11.6 32 10.8 36 -1.1 428 16.3 -4.3 6.1 20 14.3 28 15.7 32 -1.4 40
Table I. Maximum vertical velocity, wNmax, and minimum vertical velocity, wNmin, at a height of N km and the times at which they occur,t(wNmax) and t(wNmin), respectively in Expts. 1-8. The first two columns display the maximum and minimum velocities throughout thedomain and the two hour integration time.
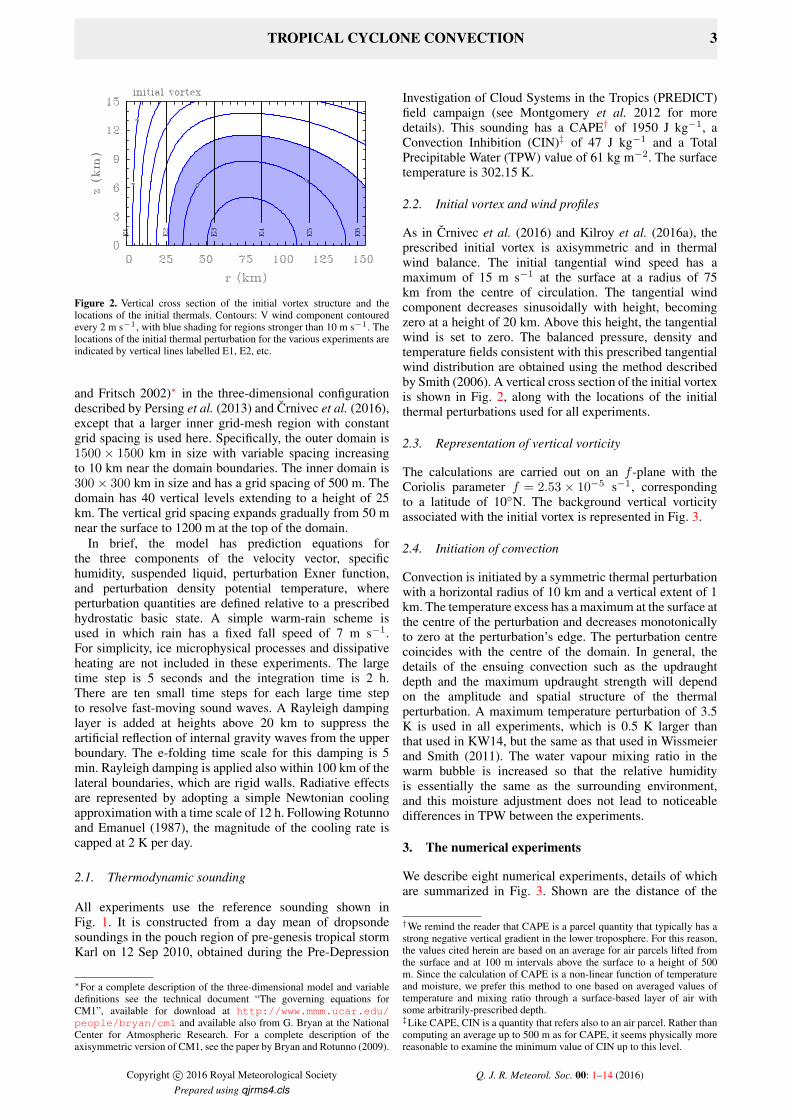
Figure 3. Radial variation of relative vorticity (zeta) and twice the relativeangular velocity (2*av) at the surface, vertical shear (dv), and CAPE forthe initial vortex shown in Figure 2. The locations of the initial thermalperturbation for the various experiments are indicated by vertical lineslabelled E1, E2, etc.
initial thermal perturbation from the circulation centre andsome environmental measures at this location, including thebulk shear, twice the angular velocity, the relative vorticity,and the Convective Available Potential Energy (CAPE).Further details of the experiments and their purpose aregiven in the appropriate sections.
The warm bubble in Expt. 1 is located at the vortex centre,which has high values of relative vorticity (see Fig. 3).Here, there is no vertical shear over the entire troposphere,but the CAPE§ is lower than that in other experimentsdue to the increased temperature associated with the warmcored balanced vortex. In general, the CAPE increases thefurther the warm bubble is located from the vortex axis,while the relative vorticity decreases in strength. The shearmagnitude increases out to a radius of 75 km (the radius ofmaximum winds). Outside this radius, the shear magnitudedecreases in strength. Three experiments have the initialthermal located inside the radius of maximum winds andthree outside of that. The locations of the initial thermalsfor all experiments are shown in Figs. 2 and 3.
Experiments 7 and 8 are repeats of Expts. 2 and 4respectively, but with surface friction switched off. Theseexperiments are performed to provide a less cluttereddepiction of the azimuthally averaged eddy terms discussedin section 6.
§The calculation of CAPE in Fig. 3 includes the initial moist thermalperturbation.
As a broad means for making quantitative comparisonsof the various experiments, Table I gives details ofthe maximum updraught and downdraught strengths atselected heights for all experiments and Table II lists thecorresponding maximum and minimum vertical vorticity inthese experiments.
4. Results
The principal features of updraught evolution in Expts. 1-6are as follows.
4.1. Vertical velocity
Figure 4 shows time-height cross sections of maximum¶vertical velocity in all experiments and Table I gives detailsof the maxima and minima at selected heights.
In Expt. 1 the maximum updraught and downdraughtstrengths, wmax and wmin, are 8.6 m s−1 and 2.9 m s−1,respectively (Table I). The maximum occurs at a height of4 km at 34 min. The maximum vertical velocity at a heightof 6 km is only 2.3 m s−1, suggesting that the cloud doesnot penetrate much further above this height. The maximumvertical velocity increases monotonically in strength at allheights and times the further the initial thermal is locatedfrom the vortex axis. In Expt. 6, wmax and wmin are 16.9m s−1 and 4.5 m s−1, respectively. The maximum verticalvelocity at a height of 6 km in this experiment is 16.1 m s−1,much larger than that in Expt. 1.
Not only is wmax larger in convection developing furtheraway from the vortex axis, the height at which thismaximum occurs increases also (Fig. 4). For example,the convective cell in Expt. 1 (panel a) barely extends toa height of 6 km, but that in Expt. 6 (panel f) extendsto a height of just over 10 km. There appears also tobe secondary convection occurring in some experiments,most notably when the initial thermal is located furtherfrom the vortex axis. These secondary cells are a result ofthe stronger downdraughts and larger negative buoyancyat low levels (not shown) associated with the outer coreconvection. The lower CIN at radii outside the vortex core
¶The evolution of the updraught associated with the rising thermal bubbleis similar to that described in KS15. The presence here of an ambient shearmeans that updraughts and downdraughts are tilted so that the extrema ofvertical velocity and vertical vorticity occur at different spatial locationsat different times. This feature which makes a single cross-section forupdraughts and downdraught extrema or for positive and negative vorticityinappropriate.
Copyright c© 2016 Royal Meteorological Society Q. J. R. Meteorol. Soc. 00: 1–14 (2016)Prepared using qjrms4.cls

TROPICAL CYCLONE CONVECTION 5
(a) (b) (c)
(d) (e) (f)
Figure 4. Time-height series of maximum vertical velocity in Expts. 1-6. Contour intervals: vertical velocity, thin contours 0.5 m s−1, thick contours 5m s−1.
(a) (b)
(c) (d)
Figure 5. Time-height series of (a,b) maximum density temperature difference and (c,d) maximum cloud rain in Expts. 1 and 6. Contour intervals:dTrho, thin contour 0.5 K, thick contours 1.0 K. Cloud rain,thin contours 0.5 g kg−1, thick contours 5 g kg−1
(not shown) makes it easier for the spreading cold pools tolift environmental air to its level of free convection.
4.2. Buoyancy and cloud rain
Figure 5 shows time-height cross sections of maximumdensity temperature difference (top panels, a measure of thecloud buoyancy including the effects of water loading) andthe maximum rain water (bottom panels) for Expts. 1 and 6.The far field sounding is used as the reference temperatureto calculate buoyancy. The buoyancy produced by latentheat release is much weaker in Expt. 1 than in Expt. 6 andthe height at which the maximum buoyancy occurs is muchlower in Expt. 1. The amount of rainfall produced is muchlower in Expt. 1, a result expected with weaker convection.
In panel (a), the system buoyancy associated with the warmcored vortex is clearly noticeable.
4.3. Vertical vorticity
4.3.1. Vertical vorticity extrema
Details of the maximum and minimum vertical vorticityat selected heights for all experiments are included inTable II. In Expt. 1, the overall maximum ζmax = 11.6×10⁻² s−1 and occurs at the surface. In the experimentswhere convection is located at increasing distances from thevortex axis, ζmax decreases monotonically with the smallestmaximum value occurring in Expt. 6 (4.2 ×10⁻² s−1).In Expts. 2-6 the maximum occurs at a height of 500 m.The maximum cyclonic vorticity occurs at relatively low
Copyright c© 2016 Royal Meteorological Society Q. J. R. Meteorol. Soc. 00: 1–14 (2016)Prepared using qjrms4.cls

6 Gerard Kilroy and Roger K. Smith
(a) (b) (c)
(d) (e) (f)
Figure 6. Time-height series of maximum vertical vorticity in Expts. 1-6. Contour intervals: vertical vorticity, thin contours 0.5× 10⁻³ s−1 to4.5× 10−3 s−1, thick contours 5× 10⁻³ s−1.
Expt. ζmax z(ζmax) ζ0.5max t(ζ0.5max) ζ1max t(ζ1max) ζ4max t(ζ4max) ζ1min t(ζ1min) ζ4min t(ζ4min)10−3 s−1 km 10−3 s−1 min 10−3 s−1 min 10−3 s−1 min 10−3 s−1 min 10−3 s−1 min
1 115.7 0.0 102.3 24 71.8 24 10.2 54 -5.8 22 0 -2 96.9 0.5 96.9 28 74.6 26 17.0 32 -9.6 24 -3.5 303 75.5 0.5 75.5 30 55.4 28 11.3 30 -16.4 28 -11.4 304 63.3 0.5 63.3 28 44.5 30 9.9 28 -20.8 28 -13.6 305 50.8 0.5 50.8 28 36.1 30 8.3 28 -22.5 30 -13.2 286 41.5 0.5 41.5 30 29.6 34 7.3 36 -21.7 30 -12.1 287 119.1 0.0 98.0 26 73.4 26 15.0 32 -7.6 22 -2.2 328 56.0 0.0 45.2 30 35.0 30 13.7 38 -7.2 22 -11.4 30
Table II. Maximum of the vertical component of relative vorticity, ζNmax, at heights N of 500 m, 1 km and 4 km and the times at which theyoccur, t(ζNmax), in Expts. 1-8. Shown also is minimum of this vorticity component at a height of 1 km and 4 km, together with the time at whichthey occur.
altitudes compared to the those in the KSW14 experimentson account of both the absence of strong backgroundhorizontal vorticity at upper levels and because of thelarge background relative vorticity at low levels associatedwith the vortex. KSW14 and KW14 showed that verticalvorticity produced at low levels was mainly the result ofthe stretching of existing vertical vorticity, whereas verticalvorticity produced above the boundary layer was mostlydue to the tilting of horizontal vorticity. Both of thesestudies showed also that the vorticity dipole produced bytilting reversed in sign at some height when the backgroundhorizontal vorticity changes sign at the top of the boundarylayer. An unexpected result was the large contribution bythe vertical advection term, which resulted in vorticitydipoles that did not reverse in sign at the heights they wereexpected to (i.e. the vorticity dipole at given height abovethe boundary layer did not match the orientation expectedby the horizontal vorticity at that height, rather by thehorizontal vorticity at lower levels).
The monotonic decrease in ζmax with increasing distancefrom vortex core occurs at mostly all heights, except inExpt. 1 above 1 km. This reasons for this is that the strengthof the updraught is weaker in this experiment at upperlevels and there is no background horizontal vorticity at thislocation so that tilting does not play a role in generatingvorticity at upper levels.
The minimum vorticity at a height of 1 km, ζ1min, is−0.6× 10⁻² s−1 in Expt. 1, and becomes progressivelylarger in magnitude as the convection is located further fromthe vortex axis, except in Expt. 6 which is furthest fromthe axis. Beyond the radius of maximum tangential windspeed, the toroidal vorticity begins to decrease in magnitudewith radius whereupon, even though there is an increase inthe vertical velocity, the contribution to vorticity productionby tilting decreases beyond some radius. In all experimentsζ1max is stronger in magnitude than ζ1min, although thedifference is much larger when the convection occurs closerto the vortex axis. Note that at a height of 4 km this result isnot always true, with the minimum stronger in magnitude inthe calculations where convection occurs outside the radiusof maximum winds.
In the experiments where convection occurs outside theradius of maximum winds, there are stronger magnitudes ofmaximum and minimum vertical vorticity at a height of 6km than at 4 km (not shown). For example, in Expt. 5 ζ6maxis 1.9× 10⁻² s−1, while ζ6min is −1.9× 10⁻² s−1. Thereare similar values for Expts. 4 and 6. These identical valuesof maximum and minimum vertical vorticity are tell-talesigns that vorticity production occurs primarily by tilting atthis height.
Copyright c© 2016 Royal Meteorological Society Q. J. R. Meteorol. Soc. 00: 1–14 (2016)Prepared using qjrms4.cls

TROPICAL CYCLONE CONVECTION 7
(a) (b) (c)
(d) (e) (f)
Figure 7. Time-height series of minimum vertical vorticity in Expts. 1-6. Contour intervals: vertical vorticity, thin contours 0.5× 10⁻³ s−1 to4.5× 10−3 s−1, thick contours 5× 10⁻³ s−1.
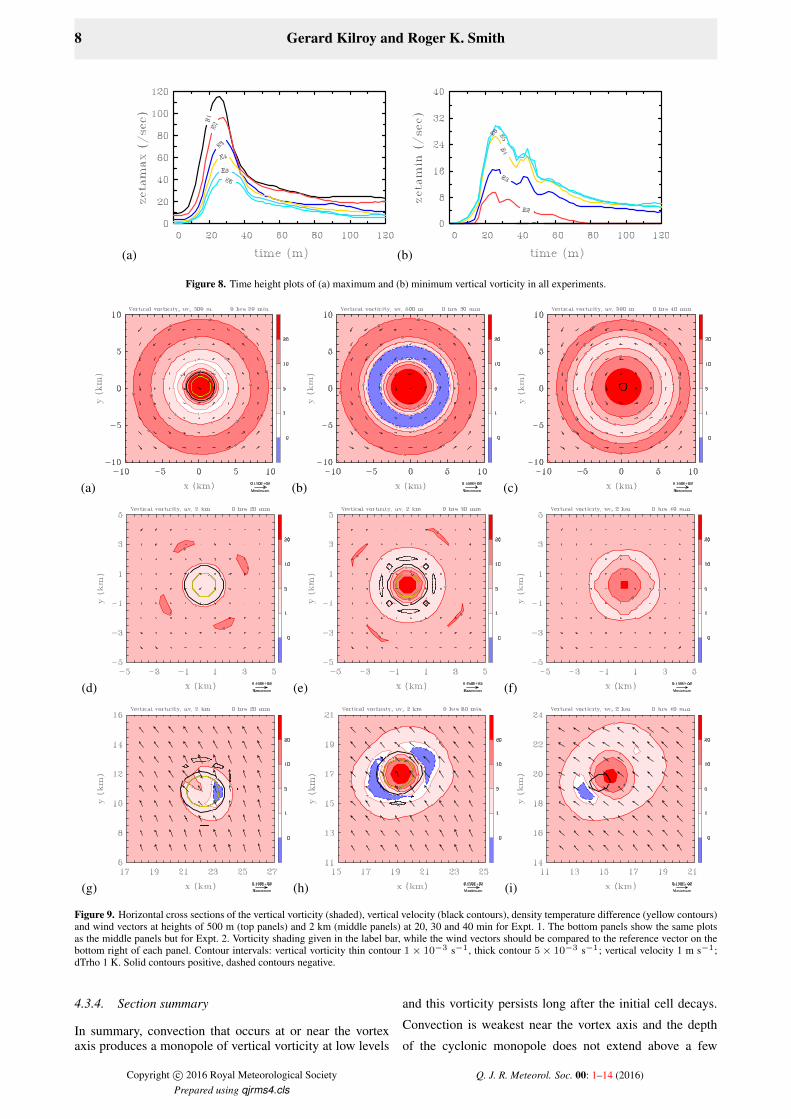
4.3.2. Vorticity maximum evolution
Figures 6 and 7 show time-height cross sections of themaximum and minimum vertical vorticity in all experiments(these extrema may not occur at the same horizontallocation). Note that significant vertical vorticity is generatedup to a height of about 5 km in Expt. 1 and up to a height of9 km in Expt. 6 (compare panels a and f).
The maximum cyclonic vorticity occurs between thesurface and a height of 1 km and persists longest withinthis height range. In the experiments located near the radiusof maximum winds there is significant vertical vorticitygenerated between heights of 5 and 9 km due to tilting ofbackground horizontal vorticity.
In Expts. 1 and 2 there is only minor development ofanticyclonic vorticity, mostly below a height of 3 km, whilein Expts. 3-6, significant anticyclonic vorticity is generatedboth near the surface and between heights of 5 to 9 km.
Figure 8 shows the evolution of the maximum andminimum vertical vorticity in all experiments. As wehave seen in Table II the vorticity maximum decreasesmonotonically with convection located further from thevortex axis. An important result is that an enhanced ζmaxpersists until the end of the simulation in all experiments.In Expt. 1 the final ζmax is about three times larger than theinitial ζmax. The inner core experiments (Expts. 1 and 2)develop a relatively weak vorticity minimum and this doesnot persist until the end of the simulation. In Expts. 3-6 theminimum persists beyond the life time of the cloud, untilthe end of the simulation.
4.3.3. Horizontal structure of vorticity
Figure 9 shows horizontal cross sections of the verticalcomponent of relative vorticity in Expt. 1 at heights of500 m and 2 km at 20, 30 and 40 min. Shown also inthe bottom panels are similar horizontal cross sections ata height of 2 km for Expt. 2. Regions of ascent exceeding1 m s−1 and subsidence with magnitude exceeding 1 m s−1are shown in black contours. Values of density temperaturedifference (dTrho) above 1 K are shown also. At a height
of 500 m in Expt. 1 there is a strong vertical vorticitymonopole at all times. At 20 min this monopole is encircledby positive vertical motion which is replaced by a smallscale downdraught at 40 min. At 30 min there is an annulusof weak anticyclonic vertical vorticity associated with areduction in relative vorticity due to outflow at this levelas the thermal pushes through it. However, this negativeanomaly does not persist and is not present at this heightat 40 min. At a height of 2 km a buoyant updraught ispresent at 20 and 30 min, but a core of strong (greater than20× 10−3 s−1) vertical vorticity develops only after 20min. By 40 min there remains a core of enhanced vorticity.Despite the initial thermal being located in a region ofbackground vertical shear in Expt. 2 (see Fig. 3) there existsalso a strong monopole of vertical vorticity at a height of 2km, and vertical motion (stronger than 1 m s−1) occurs atthis height at 40 min.
Figure 10 shows similar plots as in Fig. 9 for Expt.4 at heights of 500 m, 2 km and 6 km. At 20 minat a height of 500 m there is a vorticity tripole. Theweaker anticyclonic anomaly to the right of the updraughtis associated with toroidal vorticity. To understand thisstructure, we note that the buoyancy of the rising thermalcreates toroidal vorticity, which, together with ambienthorizontal and vertical vorticity is tilted by the horizontalgradient of vertical velocity and stretched by the verticalgradient thereof. This feature was noted also in KSW14.The prominent vertical vorticity feature at this height is thedipole which is co-located with the updraught and positivebuoyancy. At 30 min the updraught is still present, althoughby 40 min there is only a small region of downdraught. Thetripole feature is evident at a height of 2 km at 30 and 40min, while there is positive buoyancy and upward motionat all three times shown at this height. At a height of 6 kmthe updraught is just breaking through at 30 min, while at40 min there is positive vertical motion. The dipole at thisheight at 40 min has reversed in sign when compared to thatat lower levels, a result found also in KS15 and KSW14.
Copyright c© 2016 Royal Meteorological Society Q. J. R. Meteorol. Soc. 00: 1–14 (2016)Prepared using qjrms4.cls
8 Gerard Kilroy and Roger K. Smith
(a) (b)
Figure 8. Time height plots of (a) maximum and (b) minimum vertical vorticity in all experiments.
(a) (b) (c)
(d) (e) (f)
(g) (h) (i)
Figure 9. Horizontal cross sections of the vertical vorticity (shaded), vertical velocity (black contours), density temperature difference (yellow contours)and wind vectors at heights of 500 m (top panels) and 2 km (middle panels) at 20, 30 and 40 min for Expt. 1. The bottom panels show the same plotsas the middle panels but for Expt. 2. Vorticity shading given in the label bar, while the wind vectors should be compared to the reference vector on thebottom right of each panel. Contour intervals: vertical vorticity thin contour 1× 10⁻³ s−1, thick contour 5× 10⁻³ s−1; vertical velocity 1 m s−1;dTrho 1 K. Solid contours positive, dashed contours negative.
4.3.4. Section summary
In summary, convection that occurs at or near the vortexaxis produces a monopole of vertical vorticity at low levels
and this vorticity persists long after the initial cell decays.
Convection is weakest near the vortex axis and the depth
of the cyclonic monopole does not extend above a few
Copyright c© 2016 Royal Meteorological Society Q. J. R. Meteorol. Soc. 00: 1–14 (2016)Prepared using qjrms4.cls

TROPICAL CYCLONE CONVECTION 9
(a) (b) (c)
(d) (e) (f)
(g) (h) (i)
Figure 10. Horizontal cross sections similar to those in Fig. 9 at heights of 500 m (top panels), 2 km (middle panels) and 6 km (bottom panels) at 20, 30and 40 min for Expt. 4. Contour intervals are the same as in Fig. 9.
kilometres in the vertical. The depth of significant vorticityproduction is larger, the further the thermal is located fromthe vortex axis. Anticyclonic vorticity anomalies are weakin convection near the circulation centre.
While convection is generally stronger the further itis located from the vortex axis, the maximum verticalvorticity is weaker and significant anticyclonic anomaliesare produced at and beyond the radius of maximumtangential wind. The structure of the vorticity anomaliesproduced change drastically away from the vortex axis, withmonopoles occurring near the axis and dipoles that reversein sign with height occurring in regions with larger verticalshear near and beyond the radius of maximum winds.
5. Relevance to tropical cyclone genesis andintensification
KS15 suggested that the complexities associated withdipole-like structures of vertical vorticity that reversed insign with height would have implications for understandingthe aggregation of convectively-induced vorticity anomalies
during vortex evolution (Nguyen et al. 2008, Deng et al.2012). A question that arose was how the anticyclonicanomalies would be ejected from the vortex core so that theaggregation of positive anomalies could occur.
The results of this study suggest that deep convectionnear the vortex axis doesn’t generate appreciable anticy-clonic vorticity, and there is no need to invoke complexexplanations of how to remove anticyclonic vorticity sinceso little of it is produced. Near the vortex axis the generationof vorticity is dominated by stretching. Of course, stretchingof vorticity will enhance the magnitude of local vorticityanomalies and compression will diminish their magnitude.The stretching and thereby amplification of ambient (orsystem-scale) vorticity by convection by itself does not leadto an increase in the circulation around a fixed loop embed-ded in the flow because stretching leads to a contraction inthe areal extent of the loop (see Haynes and McIntyre 1987,Raymond et al. 2013).
A key result is that significantly enhanced verticalvorticity persists long after the convective cell decays.In developing tropical cyclones, this region of enhanced
Copyright c© 2016 Royal Meteorological Society Q. J. R. Meteorol. Soc. 00: 1–14 (2016)Prepared using qjrms4.cls
10 Gerard Kilroy and Roger K. Smith
vorticity can be amplified further should more convectionoccur nearby. Indeed many recent studies of tropicalcyclone genesis found that spin up occurred when repeatedbouts of deep convection occurred near the circulationcentre (Tory et al. 2006a,b, Nolan 2007 Nicholls andMontgomery 2013), Smith et al. 2015, Davis 2015, Kilroyet al. 2016a, Kilroy et al. 2016b).
6. Eddy momentum fluxes
Two additional calculations are carried out to quantify theeffect of cloud scale eddies on the evolution of the vortex.The new experiments, Expts. 7 and 8, are similar to Expts. 2and 4, in which the initial thermal perturbations are locatedat radii of 25 km and 85 km, respectively. The differencesare that surface friction is switched off and a zero gradientlower boundary condition is used. These experiments avoidthe clutter from the contribution of the frictionally-inducedinflow to the eddy terms that arises in Expts. 2 and 4.However, in terms of cloud evolution, the results are similarto those of Expts. 2 and 4, respectively, the vertical velocitydifferences being less than about 1 m s−1 at all heights(see Table I). In Expts. 7 and 8, ζmax is on the order of20% larger than in Expts. 2 and 4, respectively, and ζmaxis located at the surface instead of at a height of 500 m.The latter differences reflect the increase of vertical vorticitynear the surface when frictional processes are switched off.
Following Persing et al. (2013), we apply the tradi-tional Eulerian approach of “eddy-mean” partitioning in theazimuthally-averaged tangential velocity equation. Denot-ing an azimuthal mean of any quantity ψ by the operator〈ψ〉 = 1
2π
∫ 2π
0ψdλ and the perturbation therefrom by a
prime, ψ′, the azimuthal-mean tangential momentum equa-tion has the form:
∂ 〈v〉∂t
= − 1
r2∂(r2 〈u〉 〈v〉
)∂r
− ∂(〈w〉 〈v〉)∂z
− f〈u〉
− 1
r2∂(r2 〈u′v′〉
)∂r
− 1
ρ
∂(ρ 〈v′w′〉)∂z
−cp⟨θ′ρr
∂π′
∂λ
⟩+ 〈Dv〉 . (1)
where (u, v, w) is the velocity vector expressed incylindrical coordinates (r, λ, z), r is the radius, λ is theazimuth, z is the height, ρ is the density (assumed a functionof height only), cp is the specific heat of air at constantpressure, Π is the Exner function [(p/p∗)κ where p isthe pressure, p∗ is a reference pressure normally takento be 1000 mb and κ = R/cp, where R is the specificgas constant], θρ is the density potential temperature (thedensity temperature in K divided by the Exner function),and Dv is the sub-grid-scale azimuthal component ofturbulent stress. In the present formulation, 〈v〉 is initiallyequal to the prescribed initial vortex, but is subsequentlymodified by azimuthal flow perturbation induced by theinitial thermal perturbation.
For an isolated convective cloud spanning a small rangeof azimuths, most of the flow perturbations induced by theinitial thermal perturbation will appear in the perturbationvelocity (u′, v′, w′). Our interest here is the magnitude andspatial distribution of 〈v〉 induced by the deep convectivecloud during the first hour of its lifetime and in thecontribution thereto from the eddy momentum fluxes: 〈u′v′〉and 〈v′w′〉 (the terms in the second row of Eq. (1)).
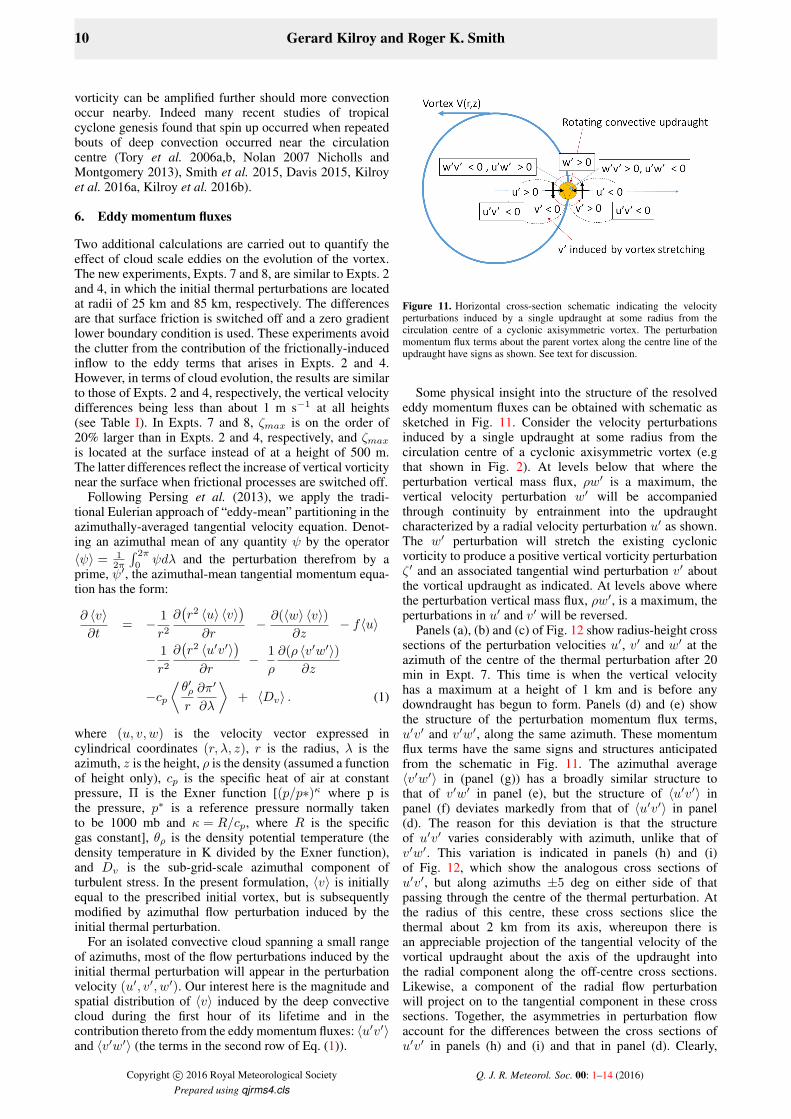
Figure 11. Horizontal cross-section schematic indicating the velocityperturbations induced by a single updraught at some radius from thecirculation centre of a cyclonic axisymmetric vortex. The perturbationmomentum flux terms about the parent vortex along the centre line of theupdraught have signs as shown. See text for discussion.
Some physical insight into the structure of the resolvededdy momentum fluxes can be obtained with schematic assketched in Fig. 11. Consider the velocity perturbationsinduced by a single updraught at some radius from thecirculation centre of a cyclonic axisymmetric vortex (e.gthat shown in Fig. 2). At levels below that where theperturbation vertical mass flux, ρw′ is a maximum, thevertical velocity perturbation w′ will be accompaniedthrough continuity by entrainment into the updraughtcharacterized by a radial velocity perturbation u′ as shown.The w′ perturbation will stretch the existing cyclonicvorticity to produce a positive vertical vorticity perturbationζ ′ and an associated tangential wind perturbation v′ aboutthe vortical updraught as indicated. At levels above wherethe perturbation vertical mass flux, ρw′, is a maximum, theperturbations in u′ and v′ will be reversed.
Panels (a), (b) and (c) of Fig. 12 show radius-height crosssections of the perturbation velocities u′, v′ and w′ at theazimuth of the centre of the thermal perturbation after 20min in Expt. 7. This time is when the vertical velocityhas a maximum at a height of 1 km and is before anydowndraught has begun to form. Panels (d) and (e) showthe structure of the perturbation momentum flux terms,u′v′ and v′w′, along the same azimuth. These momentumflux terms have the same signs and structures anticipatedfrom the schematic in Fig. 11. The azimuthal average〈v′w′〉 in (panel (g)) has a broadly similar structure tothat of v′w′ in panel (e), but the structure of 〈u′v′〉 inpanel (f) deviates markedly from that of 〈u′v′〉 in panel(d). The reason for this deviation is that the structureof u′v′ varies considerably with azimuth, unlike that ofv′w′. This variation is indicated in panels (h) and (i)of Fig. 12, which show the analogous cross sections ofu′v′, but along azimuths ±5 deg on either side of thatpassing through the centre of the thermal perturbation. Atthe radius of this centre, these cross sections slice thethermal about 2 km from its axis, whereupon there isan appreciable projection of the tangential velocity of thevortical updraught about the axis of the updraught intothe radial component along the off-centre cross sections.Likewise, a component of the radial flow perturbationwill project on to the tangential component in these crosssections. Together, the asymmetries in perturbation flowaccount for the differences between the cross sections ofu′v′ in panels (h) and (i) and that in panel (d). Clearly,
Copyright c© 2016 Royal Meteorological Society Q. J. R. Meteorol. Soc. 00: 1–14 (2016)Prepared using qjrms4.cls

TROPICAL CYCLONE CONVECTION 11
(a) (b) (c)
(d) (e) (f)
(g) (h) (i)
Figure 12. Vertical cross sections at 20 min in Expt. 7 of: (a,b,c) the perturbation velocities u′, v′ and w′ at the azimuth of the centre of the thermalperturbation. Contour interval: thin contours from 0.5 m s−1 to 1.5 m s−1 in intervals of 0.5 m s−1, thick contours: 2 m s−1. Panels (d) and (e) showthe perturbation momentum flux terms, u′v′ and v′w′, at the azimuth of the centre of the thermal perturbation. Panels (h) and (i) show similar slicesof u′v′, but along azimuths +5 (h) and −5 (i) deg on either side of that passing through the centre of the thermal perturbation. Contour interval: thincontours from 0.5 m2 s−2 to 1.5 m2 s−2 in intervals of 0.5 m2 s−2, thick contours: 2 m2 s−2. Panels (f) and (g) show vertical cross sections of theazimuthally averaged flux terms, 〈u′v′〉 and 〈v′w′〉. Contour interval: thin contours from 0.5× 10⁻² m2 s−2 to 4.5× 10⁻² m2 s−2 in intervals of0.5× 10−2 m2 s−2, thick contours: 5× 10⁻² m2 s−2. Solid (red) contours positive, dashed (blue) contours negative.
when calculating 〈u′v′〉, the positive values of u′v′ at 25km radius in both off centre cross sections compared withsmall values in the central cross section account for the largepositive values of 〈u′v′〉 in the same region.
While the schematic in Fig. 11 provides useful insightinto the structure of the covariance terms, 〈u′v′〉 and 〈v′w′〉,we have shown that caution is required not to base theinterpretation solely on a single cross section throughthe centre of the thermal perturbation. Even then, it isderivatives of the covariances that appear in the tendency of〈v〉 in Eq. (1). At this point, one has to do the calculation!The upper panels of Fig. 13 show vertical-height crosssections of the individual eddy contributions to ∂ 〈v〉 /∂tfrom the terms in the middle row on the right of Eq. (1) andtheir sum at 20 min for Expt. 7. The principal features ofthe radial eddy flux contribution [(1/r2)∂
⟨−r2u′v′
⟩/∂r]
is a spin up tendency at low levels (below 1 km, which
happens to be approximately the height of (ρw)max) onthe outside of the updraught and spin down tendencyon the inside (panel (a)). At higher levels the tendencysignatures are somewhat weaker. The main features of thevertical eddy flux contribution [(1/ρ)∂
⟨−ρr2v′w′
⟩/∂z]
are similar above a height of 200 m, but opposite in signbelow that (panel (b)). Thus when the two contributionsare summed, there is some cancellation at low levels andreinforcement aloft (panel (c)). The net result is a positivecontribution to the tangential wind tendency radially outsidethe axis of convection and a negative contribution inside theaxis. The maximum tendency of 〈v〉 at 20 min is 2.1 m s−1h−1 in Expt. 7.
Panel (e) of Fig. 13 show the time integrated contributionof the eddy terms to the change in 〈v〉 over 1 h in Expt. 7.The patterns are similar to the tendencies at 20 min, exceptfor in a shallow layer near the surface and the maximum and
Copyright c© 2016 Royal Meteorological Society Q. J. R. Meteorol. Soc. 00: 1–14 (2016)Prepared using qjrms4.cls

12 Gerard Kilroy and Roger K. Smith
(a) (b) (c)
(d) (e) (f)
Figure 13. Vertical cross sections at 20 min for Expt. 7 of the (a) radial eddy flux contribution [(1/r2)∂⟨−r2u′v′
⟩/∂r], the (b) vertical eddy flux
contribution [(1/ρ)∂⟨−ρr2v′w′
⟩/∂z] and (c) the sum of these terms. Panel (d) shows the sum of these terms for Expt. 8. Contour interval: thin
contours 1× 10⁻⁵ m s−2 to 5× 10⁻⁵ m s−2 in intervals of 1× 10⁻⁵ m s−2, thick contours: 5× 10⁻⁵ m s−2. Panels (e) and (f) show vertical crosssections of the 1 h time-integrated sum of the radial and vertical eddy flux terms in Expts. 7 and 8, respectively. Contour interval: thin contours 1× 10⁻²
m s−1 to 5× 10⁻² m s−1 in intervals of 1× 10⁻² m s−1, thick contours: 5× 10⁻² m s−1. Solid contours positive, dashed contours negative.
minimum values are locally about ± 0.39 m s−1 summedover the hour. The largest difference in the total azimuthallyaveraged tangential wind field occurs at 34 mins (0.28m s−1) and this becomes smaller with time (0.15 m s−1
at 1 hour). The difference in the tangential wind field issmaller than suggested by the integrated sum of the eddyterms, indicating that diffusion plays a role in weakeningthe tangential winds over an hour.
When convection is located at a radius of 85 km, thetotal eddy contribution to ∂ 〈v〉 /∂t shown in Fig. 13(d) hasa similar pattern to that in Fig. 13(c), but the magnitudeis weaker, for the most part because the effect of theupdraught is averaged over an annulus with a much largercircumference. The maximum tendency at 20 min is 0.36 ms−1 h−1 in Expt. 8 (compared to 2.1 m s−1 h−1 in Expt.7). The time integrated contribution of the eddy terms to thechange in 〈v〉 over 1 h in Expt. 8 is much weaker than inExpt. 7 (compare panels (e) and (f) of Fig. 13) and thesecontributions over the hour sum to 0.11 m s−1.
As pointed out by Montgomery and Smith (2016a), in anintensifying tropical cyclone there will be multiple vorticalupdraughts and these updraughts will excite vortex Rossbyand inertia-buoyancy waves, which will in turn contributealso to the sign and structure of the eddy momentumfluxes. We suggest that the foregoing analysis for a singlecloud provides a useful starting point for understanding thediagnosed momentum fluxes in this more complex situation.
7. Convective efficiency arguments in vortices
The calculations described herein are pertinent to appraisingwidely-held ideas concerning the efficiency of deep convec-tion in relation to the radial location of the convection withina typical tropical-cyclone scale vortex. These ideas origi-nated from pioneering analytical calculations by Schubertand Hack (1982) and Hack and Schubert (1986), whereina fixed spatial distribution of diabatic heating is located atdifferent radii from the vortex centre, where, inter alia, theinertial stability is locally different. Schubert and Hack’sargument is that an increase in the local inertial stabilityacts to impede the strength of the secondary circulationproduced by a given heating rate of fixed spatial structure.As a result rising air parcels cool at a lower rate as theyexpand so that more of the diabatic heating is availableto increase their temperature: i.e. the heating is “moreefficient” in raising the temperature of the cloud updraught.
The realism of a calculation with fixed heating hasbeen questioned by Smith and Montgomery (2016), whopointed out that, in reality, a reduction of the strengthof the secondary circulation in the region of heatingwould be accompanied by a corresponding reduction inthe strength and radial distribution of the diabatic heatingrate. The calculations presented here provide an opportunityto quantify the differences in heating rate as a functionof radial location, albeit in a situation where the cloudupdraught is not assumed to be in approximate hydrostaticbalance, unlike the updraught in Schubert and Hack’scalculations.
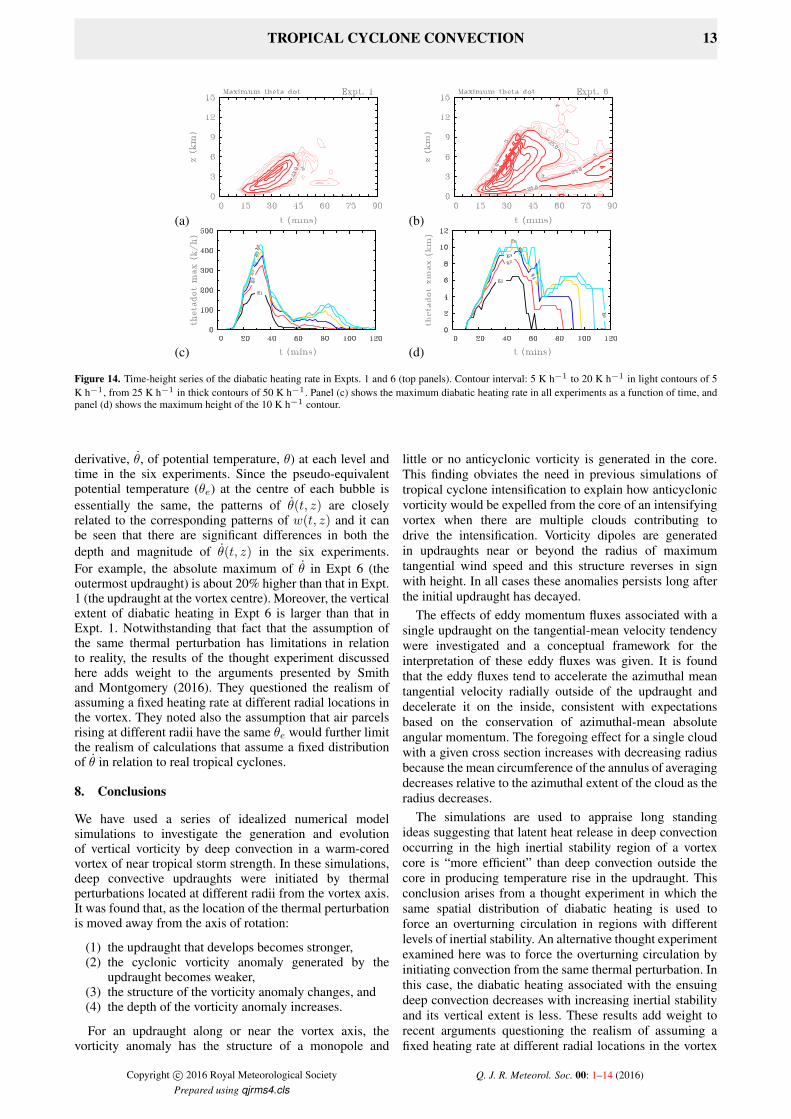
Figure 14 shows time-height series of the maximumdiabatic heating rate (characterized here by the material
Copyright c© 2016 Royal Meteorological Society Q. J. R. Meteorol. Soc. 00: 1–14 (2016)Prepared using qjrms4.cls
TROPICAL CYCLONE CONVECTION 13
(a) (b)
(c) (d)
Figure 14. Time-height series of the diabatic heating rate in Expts. 1 and 6 (top panels). Contour interval: 5 K h−1 to 20 K h−1 in light contours of 5K h−1, from 25 K h−1 in thick contours of 50 K h−1. Panel (c) shows the maximum diabatic heating rate in all experiments as a function of time, andpanel (d) shows the maximum height of the 10 K h−1 contour.
derivative, θ̇, of potential temperature, θ) at each level andtime in the six experiments. Since the pseudo-equivalentpotential temperature (θe) at the centre of each bubble isessentially the same, the patterns of θ̇(t, z) are closelyrelated to the corresponding patterns of w(t, z) and it canbe seen that there are significant differences in both thedepth and magnitude of θ̇(t, z) in the six experiments.For example, the absolute maximum of θ̇ in Expt 6 (theoutermost updraught) is about 20% higher than that in Expt.1 (the updraught at the vortex centre). Moreover, the verticalextent of diabatic heating in Expt 6 is larger than that inExpt. 1. Notwithstanding that fact that the assumption ofthe same thermal perturbation has limitations in relationto reality, the results of the thought experiment discussedhere adds weight to the arguments presented by Smithand Montgomery (2016). They questioned the realism ofassuming a fixed heating rate at different radial locations inthe vortex. They noted also the assumption that air parcelsrising at different radii have the same θe would further limitthe realism of calculations that assume a fixed distributionof θ̇ in relation to real tropical cyclones.
8. Conclusions
We have used a series of idealized numerical modelsimulations to investigate the generation and evolutionof vertical vorticity by deep convection in a warm-coredvortex of near tropical storm strength. In these simulations,deep convective updraughts were initiated by thermalperturbations located at different radii from the vortex axis.It was found that, as the location of the thermal perturbationis moved away from the axis of rotation:
(1) the updraught that develops becomes stronger,(2) the cyclonic vorticity anomaly generated by the
updraught becomes weaker,(3) the structure of the vorticity anomaly changes, and(4) the depth of the vorticity anomaly increases.
For an updraught along or near the vortex axis, thevorticity anomaly has the structure of a monopole and
little or no anticyclonic vorticity is generated in the core.This finding obviates the need in previous simulations oftropical cyclone intensification to explain how anticyclonicvorticity would be expelled from the core of an intensifyingvortex when there are multiple clouds contributing todrive the intensification. Vorticity dipoles are generatedin updraughts near or beyond the radius of maximumtangential wind speed and this structure reverses in signwith height. In all cases these anomalies persists long afterthe initial updraught has decayed.
The effects of eddy momentum fluxes associated with asingle updraught on the tangential-mean velocity tendencywere investigated and a conceptual framework for theinterpretation of these eddy fluxes was given. It is foundthat the eddy fluxes tend to accelerate the azimuthal meantangential velocity radially outside of the updraught anddecelerate it on the inside, consistent with expectationsbased on the conservation of azimuthal-mean absoluteangular momentum. The foregoing effect for a single cloudwith a given cross section increases with decreasing radiusbecause the mean circumference of the annulus of averagingdecreases relative to the azimuthal extent of the cloud as theradius decreases.
The simulations are used to appraise long standingideas suggesting that latent heat release in deep convectionoccurring in the high inertial stability region of a vortexcore is “more efficient” than deep convection outside thecore in producing temperature rise in the updraught. Thisconclusion arises from a thought experiment in which thesame spatial distribution of diabatic heating is used toforce an overturning circulation in regions with differentlevels of inertial stability. An alternative thought experimentexamined here was to force the overturning circulation byinitiating convection from the same thermal perturbation. Inthis case, the diabatic heating associated with the ensuingdeep convection decreases with increasing inertial stabilityand its vertical extent is less. These results add weight torecent arguments questioning the realism of assuming afixed heating rate at different radial locations in the vortex
Copyright c© 2016 Royal Meteorological Society Q. J. R. Meteorol. Soc. 00: 1–14 (2016)Prepared using qjrms4.cls

to demonstrate the efficiency of the heating at higher levelsof inertial stability.
9. Acknowledgements
We thank Dr. George Bryan for generously making themodel available. Financial support for this research wasprovided by the German Research Council (DeutscheForschungsgemeinschaft) under Grant numbers SM30/23-3 and SM30/23-4 and the Office of Naval Research Globalunder Grant No. N62909-15-1-N021.
References
Bao JW, Gopalakrishnan SG, Michelson SA, Marks FD,Montgomery MT, 2012: Impact of physics representations inthe HWRFX on simulated hurricane structure and pressure-windrelationships. Mon. Wea. Rev., 140, 3278-3299.
Bryan GH, Fritsch JM. 2002: A benchmark simulation for moistnonhydrostatic numerical models. Mon. Wea. Rev., 130, 2917-2928.
Bryan GH, Rotunno R, 2009: The maximum intensity ofTropical cyclones in axisymmetric numerical model simulations.Mon. Wea. Rev., 137, 1770-1789.
C̆rnivec N, Smith RK, Kilroy G, 2016: Dependence of tropicalcyclone intensification rate on sea surface temperature. Submittedto Q. J. R. Meteorol. Soc., , (accepted).
Davis C, 2015: The Formation of Moist Vortices and TropicalCyclones in Idealized Simulations. J. Atmos. Sci., 72, 3499-3516.
Deng Q, Smith L, Majda A, 2012: Tropical cyclogenesis andvertical shear in a moist Boussinesq model. Journal of FluidMechanics, 706, pp 384-412
Fang J, Zhang F, 2010: Initial development and genesis ofHurricane Dolly (2008). J. Atmos. Sci., 67, 655-672.
Gopalakrishnan SG, Marks FD, Zhang X, Bao JW, Yeh K-S,Atlas R, 2011: The experimental HWRF system: A study on theinfluence of horizontal resolution on the structure and intensitychanges in tropical cyclones using an idealized framework. Mon.Wea. Rev., 139, 1762-1784.
Hack JJ, Schubert WH, 1986: Nonlinear response ofatmospheric vortices to heating by organized cumulus convection.J. Atmos. Sci., 43, 1559-1573.
Haynes P, McIntyre ME, 1987: On the evolution of vorticity andpotential vorticity in the presence of diabatic heating and frictionalor other forces. J. Atmos. Sci., 44, 828-841.
Hendricks, EA, Montgomery MT, and Davis CA, 2004: On therole of “vortical” hot towers in formation of tropical cyclone Diana(1984). J. Atmos. Sci., 61, 1209-1232.
Kilroy G, Smith RK, 2012: A numerical study of rotatingconvection during tropical cyclogenesis. Q. J. R. Meteorol. Soc.,139, 1255-1269.
Kilroy G, Smith RK, Wissmeier U, 2014: Tropical convection:the effects of ambient vertical and horizontal vorticity. Q. J. R.Meteorol. Soc., 140, 1756-1770.
Kilroy G, Smith RK, 2015: Tropical cyclone convection: theeffects of a vortex boundary-layer wind profile on deep convection.Q. J. R. Meteorol. Soc., 141, 714-726.
Kilroy G, Smith RK, Montgomery MT, 2016a: Why do modeltropical cyclones grow progressively in size and decay in intensityafter reaching maturity? J. Atmos. Sci., 73, 487-503.
Kilroy, G, Smith RK, Montgomery MT, Lynch B, Earl-SpurrC, 2016b: A case study of a tropical depression that formed inthe Australian Northern Territory (January 2014) in the monsoontrough and intensified over land, as seen in the ECMWF analyses.Q. J. R. Meteorol. Soc., , in review.
Montgomery MT, Smith RK, 2014: Paradigms for tropicalcyclone intensification. Aust. Met. Ocean. Soc. Journl., 64, 37-66.
Montgomery MT, Smith RK, 2016: The fluid dynamics oftropical cyclones. Ann. Rev. fluid Dyn., XX, in press.
Montgomery MT, Nicholl ME, Cram TA, Saunders A, 2006: A“vortical” hot tower route to tropical cyclogenesis. J. Atmos. Sci.,, 63, 355-386.
Montgomery MT, Davis C, Dunkerton T, Wang Z, Velden C,Torn R, Majumdar S, Zhang F, Smith RK, Bosart L, Bell MM,Haase JS, Heymsfield A, Jensen J, Campos T, Boothe MA, 2012:The Pre-Depression Investigation of Cloud Systems in the Tropics(PREDICT) Experiment: Scientific basis, new analysis tools, andsome first results. Bull. Amer. Meteor. Soc., 93: 153172.
Nguyen SV, Smith RK, Montgomery MT, 2008: Tropical-cyclone intensification and predictability in three dimensions. Q.J. R. Meteorol. Soc., 134, 563-582.
Nguyen CM, Reeder MJ, Davidson NE, Smith RK, Mont-gomery MT, 2011: Inner-core vacillations cycles during the inten-sification of Hurricane Katrina. Q. J. R. Meteorol. Soc., 137, 829-844.
Nicholls M, Montgomery MT, 2013: An Examination ofTwo Pathways to Tropical Cyclogenesis Occurring in IdealizedSimulations with a Cloud-Resolving Numerical Model. Atmos.Chem. Phys., 13, 5999-6022.
Nolan DS, 2007: What is the trigger for tropical cyclogenesis?Aust. Meteorol. Mag., 56, 241-266.
Persing J, Montgomery MT, McWilliams J, Smith RK, 2013:Asymmetric and axisymmetric dynamics of tropical cyclones .Atmos. Chem. Phys, 13, 12249-12341.
Ramsay HA, Doswell CA, 2005: A sensitivity study ofhodograph-based methods for estimating supercell motion. Wea.Forecasting, 20, 954-970.
Raymond DJ, Gjorgjievska S, Sessions S, Fuchs , 2013:Tropical cyclogenesis and mid-Level vorticity. Aust. Met. Ocean.Soc. Journl., (submitted).
Rotunno R, Klemp JB, 1982: The influence of the shear-inducedpressure gradient on thunderstorm motion. Mon. Wea. Rev., 110,136-151.
Rotunno R, Emanuel KA, 1987: An air-sea interactiontheory for tropical cyclones. Part II Evolutionary study using anonhydrostatic axisymmetric numerical model. J. Atmos. Sci., ,44, 542-561.
Rozoff CM, 2007: Aspects of moat formation in tropicalcyclone eyewall replacement cycles. Ph.D. thesis, Colorado StateUniversity, 165 pp.
Rozoff CM, Schubert WH, McNoldy BD, Kossin JP, 2006:Rapid Filamentation Zones in Intense Tropical Cyclones. J.Atmos. Sci., , 63, 325-340.
Rozoff CM, Kossin JP, Schubert WH, Mulero PJ, 2009: InternalControl of Hurricane Intensity Variability: The Dual Nature ofPotential Vorticity Mixing. J. Atmos. Sci., , 66, 133147.
Schubert WH, Hack JJ, 1982: Inertial stability and tropicalcyclone development. J. Atmos. Sci., , 39, 1687-1697.
Shin S, Smith RK, 2008: Tropical-cyclone intensification andpredictability in a minimal three-dimensional model. 134, 1661-1671.
Smith RK, 2006: Accurate determination of a balancedaxisymmetric vortex. Tellus, 58A, 98-103.
Smith RK, Montgomery MT, 2015: Towards clarity onunderstanding tropical cyclone intensification. J. Atmos. Sci., , 72,3020-3031.
Smith RK, Montgomery MT, 2016: The efficiency of diabaticheating and tropical cyclone intensification . Revised versionsubmitted to Quart. J. Roy. Meteor. Soc. (Jan)
Tory KJ, Montgomery MT, Davidson NE, 2006a: Predictionand diagnosis of tropical cyclone formation in an NWP system.Part I: The critical role of vortex enhancement in deep convection.J. Atmos. Sci., 63, 3077-3090.
Tory KJ, Montgomery MT, Davidson NE, Kepert JD, 2006b:Prediction and diagnosis of tropical cyclone formation in an NWPsystem. Part II: A detailed diagnosis of tropical cyclone Chrisformation. J. Atmos. Sci., 63, 3091-3113.
Tory KJ, Davidson NE, Montgomery MT, 2007: Prediction anddiagnosis of tropical cyclone formation in an NWP system. PartIII: Diagnosis of developing and nondeveloping storms. J. Atmos.Sci., 64, 3195-3213.
Wissmeier U, Smith RK, 2011: Tropical-cyclone convection:the effects of ambient vertical vorticity. Q. J. R. Meteorol. Soc.,137, 845-857.