trivino et al 2015
TRANSCRIPT

This is an electronic reprint of the original article. This reprint may differ from the original in pagination and typographic detail.
Author(s):
Title:
Year:
Version:
Please cite the original version:
All material supplied via JYX is protected by copyright and other intellectual property rights, and duplication or sale of all or part of any of the repository collections is not permitted, except that material may be duplicated by you for your research use or educational purposes in electronic or print form. You must obtain permission for any other use. Electronic or print copies may not be offered, whether for sale or otherwise to anyone who is not an authorised user.
Managing a boreal forest landscape for providing timber, storing and sequesteringcarbon
Triviño, María; Juutinen, Artti; Mazziotta, Adriano; Miettinen, Kaisa; Podkopaev,Dmitry; Reunanen, Pasi; Mönkkönen, Mikko
Triviño, M., Juutinen, A., Mazziotta, A., Miettinen, K., Podkopaev, D., Reunanen, P., &Mönkkönen, M. (2015). Managing a boreal forest landscape for providing timber,storing and sequestering carbon. Ecosystem Services, 14 (August), 179-189.doi:10.1016/j.ecoser.2015.02.003
2015

1
Title: Managing a boreal forest landscape for providing timber, storing and sequestering
carbon
Author names: María Triviño a*, Artti Juutinen b,c,d, Adriano Mazziotta a, Kaisa Miettinen e, Dmitry
Podkopaev f,a,e, Pasi Reunanen a, Mikko Mönkkönen a.
Author affiliations:
a University of Jyvaskyla, Department of Biological and Environmental Sciences, P.O. Box 35, FI-40014 University of Jyvaskyla, Finland
b Department of Economics, P.O. Box 4600, FI-90014 University of Oulu, Finland
c Thule Institute, P.O. Box 7300, FI-90014 University of Oulu, Finland
d Natural Resources Institute Finland, Oulu, Paavo Havaksen tie 3, P.O. Box 413, FI-90014 University of Oulu, Finland
e University of Jyvaskyla, Departament of Mathematical Information Technology, P.O. Box 35 (Agora), FI-40014 University of Jyvaskyla, Finland
f Systems Research Institute, Polish Academy of Sciences, Newelska 6, 01-447 Warsaw, Poland
Author e-mail addresses: Artti Juutinen ([email protected]); Adriano Mazziotta
([email protected]); Kaisa Miettinen ([email protected]), Dmitry Podkopaev
([email protected]), Pasi Reunanen ([email protected]), Mikko Mönkkönen
* Corresponding author
Full contact details for corresponding author:
María Triviño: Department of Biological and Environmental Sciences, University of Jyväskylä, P.O.
Box 35, FI-40014 Jyväskylä, Finland. Tel: +358 408054735 E-mail: [email protected];

2
Abstract
Human well-being highly depends on ecosystem services and this dependence is expected to
increase in the future with an increasing population and economic growth. Studies that investigate
trade-offs between ecosystem services are urgently needed for informing policy-makers. We
examine the trade-offs between a provisioning (revenues from timber selling) and regulating (carbon
storage and sequestration) ecosystem services among seven alternative forest management regimes
in a large boreal forest production landscape. First, we estimate the potential of the landscape to
produce harvest revenues and store/sequester carbon across a 50-year time period. Then, we
identify conflicts between harvest revenues and carbon storage and sequestration. Finally, we apply
multiobjective optimization to find optimal combinations of forest management regimes that
maximize harvest revenues and carbon storage/sequestration. Our results show that no
management regime alone is able to either maximize harvest revenues or carbon services and that a
combination of different regimes is always necessary. We also show that with a relatively little
economic investment (5% decrease in harvest revenues), a substantial increase in carbon services
could be attained (9% for carbon storage; 15-23% for carbon sequestration). We conclude that it is
possible to achieve win-win situations applying diversified forest management planning at a
landscape level.
Keywords: Carbon storage and sequestration; Climate change; Ecosystem service trade-offs; Finland;
Forest management; Multiobjective optimization.

3
1. Introduction
Over the past two centuries, humans have had a tremendous impact on their environment, mostly
to meet rapidly growing demands for resources along with economic development (Vitousek et al.
1997). These demands have caused severe ecosystem degradation and biodiversity loss (e.g., MEA
2005; Rapport et al. 1998). Ecosystem services represent direct and indirect benefits that people
derive from ecosystems (MEA 2005) and our dependence on their consumption is expected to
increase in the future with an increasing population and economic growth (Guo et al. 2010).
Therefore, studies about trade-offs between ecosystem services are urgently needed to inform
decision-makers and managers of natural resources to take appropriate management actions. As a
result, international, continental and national policies have been formulated such as the
Intergovernmental Platform on Biodiversity and Ecosystem Services, the European Union
Biodiversity Strategy for 2020 and the Finnish national strategy (www.ipbes.net, European
Commission 2010; Finnish Government Resolution 2012).
Many crucial ecosystem services are provided by forests (Gamfeldt et al. 2013; García-Nieto et al.
2013; Vanhanen et al. 2012). The boreal biome represents approximately one-third of all remaining
global forests (Bradshaw et al. 2009; Hansen et al. 2010) and constitutes approximately 45% of the
world’s stock of growing timber (Vanhanen et al. 2012). Moreover, boreal forests store about one
third of the global terrestrial carbon in forests (Pan et al. 2011). Therefore, the absence of boreal
forests from global policy agendas on climate change mitigation (e.g., REDD+ program) represents an
important missed opportunity that should be corrected (Moen et al. 2014). Most commercial forests
worldwide have been intensively managed for maximizing the provision of timber, while maintaining
biodiversity and other ecosystem services such as water and climate regulation, soil retention and
recreational values have received less attention (Gerasimov et al. 2012; Guariguata et al. 2012).
Management based on a single ecosystem service is potentially problematic, as it might undermine
the long-term provision of other ecosystem services (Balvanera et al. 2014; Rodríguez et al. 2006).
For example, in northern Europe, intensive forest management for timber production might reduce
water quality (Eriksson et al. 2011). Moreover, intensive timber extraction has caused profound
ecological changes in forests like simplification of stand structure (e.g., homogenization of tree’s age
and composition), reduction of dead wood, altered disturbance dynamics (e.g., fire suppression) and
the loss and fragmentation of old growth forests (Brumelis et al. 2011; Hanski 2005; Siitonen 2001).
Thus, the biggest challenge in forest management is to simultaneously maintain the provision of
timber, biodiversity and other ecosystem services (e.g., de Groot et al. 2010).

4
Forests help to regulate climate and, more specifically, mitigate climate change by sequestering CO2
from the atmosphere and storing it in different biomass pools (e.g., Powers et al. 2013). Carbon
storage represents the carbon stock (the amount of carbon fixed in the system at a given time; size
of storage pools) whereas carbon sequestration represents the carbon flux (the amount of carbon
exchange between atmosphere and forests between two points in time) (Powers et al. 2013). Even
though values of carbon storage and sequestration will tend to coincide in the long term because all
carbon fixed through photosynthesis will eventually be released back to the atmosphere (Liski et al.
2001), they represent different aspects of climate regulation when considering forest management
for a short period of time. Trees sequester carbon as they grow, so a critical aspect in carbon
sequestration is the rate of tree growth (van Kooten et al. 1995). Usually fast-growing tree species
sequester more carbon at the beginning of their lives, whereas carbon sequestration rates for slow-
growing trees will be higher later on (Nghiem 2014). Since about 12.5% of anthropogenic carbon
emissions from 1990 to 2010 are due to land-use change and deforestation (Houghton et al. 2010)
sustainable forest management can play an important role in climate change mitigation. Forest
management practices can significantly affect whether forests act as net carbon sources or sinks
(e.g., Birdsey et al. 2006).
Finland is the most forested country in Europe and in the boreal zone (UNEP FAO and UNFF 2009)
with around 86% of its territory covered by forests and most of Finland’s forests are under
commercial management (Finnish Forest Research Institute 2011). There is a long history of forestry
in Finland and this expertise can be seen as an opportunity to develop and implement management
practices that promote ecosystem services besides timber production (Moen et al. 2014). For
example, the frequency and intensity of thinning play very important roles in timber production and
carbon sequestration (Cao et al. 2010; Hynynen et al. 2005) as well as in berry production (Miina et
al. 2010). Regulating the rotation length is also an effective way to increase forest carbon
sequestration (Hynynen et al. 2005; Liski et al. 2001) and berry production (Miina et al. 2010).
Therefore, investigating the effects of different land-use and management decisions on different
ecosystem services is vitally important.
In this study, we examined trade-offs between a provisioning ecosystem service (timber) and
regulating ecosystem service (carbon storage/sequestration) across a large boreal forest production
landscape in central Finland. Using market prices, we estimated the net present value of harvest
revenues to measure the economic value of timber production as a provisioning service. However,
we used the biophysical amount of carbon to measure regulating services, as the carbon markets are

5
still not established for boreal forests. Our main aim is to identify forest management regimes which
improve simultaneously both ecosystem services studied. We go beyond previous studies and
incorporate forest dynamics by simulating forest growth in a landscape with about 30,000 stands
during 50 years to obtain future forest growth and yield projections. Forest stands are simulated
considering seven alternative management regimes ranging from the recommended management
(business as usual) to setting aside entire forests stands. The effects of several forest management
regimes on multiple ecosystem services in a dynamic context have been rarely assessed (an
exception to this is given in e.g., Pukkala et al. 2011). We also apply multiobjective optimization for
analysing trade-offs between these different objectives (Miettinen 1999). The explicit analyses of
trade-offs can identify where the current management actions are inefficient to provide multiple
goods or services, such as timber production or carbon storage. These analyses can also identify
situations where carbon storage can be increased without any, or with only minimal, reductions in
the production of timber, or vice versa. Specifically, we address the following questions: (i) What is
the potential of the forest landscape and the optimal combinations of management regimes to
simultaneously produce economic revenues and regulate climate? (ii) Is there a difference between
the two carbon measures regarding to their trade-offs with timber production? This is an interesting
question as carbon storage and sequestration reflect different aspects of climate regulation.
2. Material and Methods
2.1. Study area
Our study area is a typical boreal production forest landscape located in Central Finland (62° 14' N,
25° 43' E) (Fig. 1). The total area is 687 km2 and forest on mineral soils covers 55%, peat lands 13%,
lakes 16% and farmland settlement some 15% of the area. Scots pine (Pinus sylvestris), Norway
spruce (Picea abies), birch (Betula pendula and Betula pubescens) and mixed stands dominate the
forest consisting of 29,706 stands of an average size of 1.45 hectares (stand size ranges between
0.06 and 17.5 hectares). Past forest management practices have resulted in a bimodal age structure
of forest stands with a large proportion being less than 40 years of age, and another large part being
between 70 and 90 years old (see the complete distribution of stand age in Fig. S1 in Supplementary
material).

6
Fig. 1. Map of the location of the study area in Finland.
2.2. Forest data, management regimes and forest growth simulations
We extracted data for forest growth modelling from the data administered by the Finnish Forest
Centre, a governmental administrative organization for legal control and enhancement of forestry in
private land. The data are organized as forest stands that are basic units for forest inventories. We
considered seven alternative management regimes for each stand (see Table 1): (1) BAU (Business as
usual): in this management regime thinning and final harvest are conducted according to current
recommendations (Yrjölä 2002) which results in more or less homogeneous monoculture of trees;
(2) SA (Set aside) represents a permanent conservation strategy; (3) EXT10 (Extended rotation by ten
years): postponing final harvest produces some additional mortality (more dead wood) and larger
and older trees. This strategy represents a short-term conservation strategy; (4) EXT30 (Extended
rotation by thirty years) represents a long-term conservation strategy; (5) GTR30 (Green tree
retention) represents a conservation oriented management regime that attempt to mimic and
restore natural disturbances regimes (Vanha-Majamaa and Jalonen 2001); (6) NTLR (No thinnings
with long rotation): avoiding thinning results in a slower tree growth, as it takes longer to reach the
recommended tree diameter (the middle of recommended threshold value range) for final harvest.
It is expected that the harvest revenues of this management regime are smaller than for BAU due to
lost thinning revenues and longer rotations; (7) NTSR (No thinnings with short rotation) represents a
management regime where thinnings are not allowed and the final harvest is set to take place
approximately at the same time as in BAU (for further details see Mönkkönen et al. 2014).

7
Table 1. Management regimes applied on the forest stands (adapted from Mönkkönen et al. 2014).
Management regime Acronym Description
Business as usual BAU
Recommended management: average rotation length 80 years; site preparation, planting or seedling trees; 1-3 thinnings; final harvest with green tree retention level 5 trees/ha
Set aside SA No management
Extended rotation (10 years) EXT10 BAU with postponed final harvesting by 10 years; average rotation length 90 years
Extended rotation (30 years) EXT30 BAU with postponed final harvesting by >30 years; average rotation length 115 years
Green tree retention GTR30 BAU with 30 green trees retained/ha at final harvest; average rotation length 80 years
No thinnings (final harvest threshold values as in BAU)
NTLR Otherwise BAU regime but no thinnings; therefore trees grow more slowly and final harvest is delayed; average rotation length 86 years
No thinnings (minimum final harvest threshold values)
NTSR Otherwise BAU regime but no thinnings; final harvest adjusted so that rotation does not prolong: average rotation length 77 years
We ran forest growth simulations for 50 years in 5 years’ intervals, which resulted in 11 time steps.
The development of forest stands under different management regimes was projected using MOTTI
stand simulator (http://www.metla.fi/metinfo/motti/index-en.htm), which has been applied to
investigate forest growth and timber yield as well as to assess profitability for alternative forest
management regimes. MOTTI is a statistical growth and yield model that includes the most recent
descriptions of forest processes (e.g., Ahtikoski et al. 2011; Hynynen et al. 2005; Kojola et al. 2012).
The models used in MOTTI are based on empirical data from forests managed mainly according to
prevailing regulations (Business as usual). Thus applying MOTTI for other management regimes
might require extrapolation and causes some uncertainty in model predictions (for further details
see Mönkkönen et al. 2014). The core of MOTTI comprises specific distance-independent tree-level
models for predicting variables such as natural regeneration, tree growth, and mortality, as well as
effects of management on tree growth (Salminen et al. 2005).
2.3. Net present value of harvest revenues
In order to transform the extracted timber into an economic value, we calculated the net present
value (NPV) of harvest revenues for each management regime and forest stand (see Mönkkönen et
al. 2014 for details). In these calculations, we used stumpage prices for eight timber assortments

8
(pulp wood and saw logs for each tree species: Scots pine, Norway spruce and two birch species) and
unit costs of five different silvicultural work components including natural regeneration, seedling,
planting, tending of seeding stands, and cleaning of sapling stands (Finnish Forest Research Institute
2012). In addition, as previously said, we used a 50-year planning horizon divided into ten 5-year
periods and applied a 3% real interest rate in discounting the revenues and costs occurring at
different time periods.
2.4. Carbon measurements
Even though carbon storage and sequestration terms are highly interrelated and sometimes climate
regulation is measured using only carbon sequestration (e.g., Nelson et al. 2009), these two terms
describe different aspects of climate regulation. Carbon storage (CStor) is a measure of the
ecosystem’s capacity to retain carbon (prevent further release of stored carbon) while carbon
sequestration relates to mitigating anthropogenic carbon emissions (transferring atmospheric CO2
into long-lived pools). We adopt terminology from Powers et al. (2013), where carbon storage refers
to the size of the carbon pool at a certain point in time and sequestration to the rate of annual
transfer of carbon between the atmosphere and forests. Different types of forests can provide
different services as old forests store large amounts of carbon (Luyssaert et al. 2008) while young
fast-growing forests may have higher annual carbon sequestration rates (Jandl et al. 2007).
There is some controversy about whether wood products (extracted timber) should be considered or
not when calculating the amount of sequestered carbon. Some argue that the potential of the forest
sector to sequester carbon becomes underestimated if these products are not taken into account
(Karjalainen et al. 1994). For that reason, we considered two measures of carbon sequestration: one
that includes the carbon in harvested timber (carbon sequestered [CSeq]) and another that excludes
the carbon in harvested timber (carbon sequestered non-extracted [CSeqNoExt]).
For calculating the three carbon measurements (CStor, CSeq and CSeqNoExt), we considered the
four most common tree species in boreal forests: Scots pine (Pinus sylvestris), Norway spruce (Picea
abies) and two birches (Betula pendula and Betula pubescens) and the carbon pools most affected
by forest management regimes: (i) living wood; (ii) dead wood; (iii) harvested timber; (iv) residual
carbon left after thinning or final harvest. Carbon storage (CStor) was calculated for each stand as
the average amount of carbon biomass across the 11 time steps. Carbon sequestration (CSeq) was
calculated for each stand as the sum of changes in carbon stock across all time steps and carbon

9
sequestered non-extracted (CSeqNoExt) was calculated in the same way as carbon sequestration
but excluding harvesting timber from the estimates (for further information about carbon
calculations see Appendix A). In this study we did not take into account the carbon biomass of
understory and litter as they represent a small fraction of the total carbon in most forests (Brown
2002). Because we did not have data available for estimating carbon biomass in soils, it was not
considered in this study despite the high importance of soil carbon (Liski et al. 2006). The review of
Nave et al. (2010) showed a significant decrease in soil carbon following harvesting. However,
carbon losses could be largely avoided by reducing physical disturbance to the soil profile during site
preparation.
2.5. Identifying the best and worst forest stands for providing harvest revenues and carbon
To reveal the maximum capacity of each individual stand to produce timber and store/sequester
carbon, prior to optimization, we identified the management regime that provides the highest value
of timber and carbon across the seven management regimes. It is likely that the regime which
provides the highest value of carbon is different from the regime which provides the highest value of
timber, but it is also possible that the same management regime provides the highest value for both
ecosystem services. To explore conflicts between the maximum provision of harvest revenues (NPV)
and the three measurements of carbon, we identified stands which were simultaneously good for
providing harvest revenues and carbon. We classified stands above the third quartile in the range of
values of NPV and carbon measurements as the best and stands below the first quartile of NPV and
carbon measurements as the worst. The stands classified as the best were the ones that provided
the highest value for both ecosystem services and where forest owners could obtain more benefits,
while the worst stands represented forests where the capacity for providing both services was low.
We additionally plotted the values of NPV and carbon measurements against each other for each
individual management option. Then, we identified how initial (at year 0) forest stand characteristics
(age, proportion of pine biomass, proportion of spruce biomass and proportion of birch biomass)
were associated with the best and the worst forest stands (using boxplots and Mann-Whitney test to
analyse whether the stand characteristics differed between the best and the worst stands).
To shed more light on the conflicts between harvest revenues and the three carbon measurements
we identified the forest stands for which the management regime that provided the highest value of
timber and each one of the carbon measurements matched (matching) or did not match (not
matching). In addition, we carried out the same analyses but excluding the set-aside management

10
option because it does not produce any harvest revenues. We also explored how the initial forest
stand characteristics were associated with the matching and the not matching forest stands for
these additional analyses excluding set-aside management option. Spatial representation of forest
stands was carried out within the Geographical Information System (GIS) software ArcGIS 10.1. (ESRI
2011) and all the statistical analyses were performed using R version 3.0.2 (R Development Core
Team 2013).
2.6. Multiobjective optimization analyses: optimal combination of management regimes
To explore the maximum capacity of the landscape to produce harvest revenues and each one of the
three carbon measurements, we produced management plans (a combination of management
regimes assigned to all forest stands) that maximized harvest revenue (NPV) from timber production
and the carbon measurement by solving the following bi-objective optimization problem:
maximize (f1(x), f2(x))
subject to xX,
where X is the set of alternative management regimes, f1(x) is NPV and f2(x) is the objective function
for the carbon measurement over the 50-year planning period resulted from applying management
plan xX.
Using multiobjective optimization we maximized both objective functions simultaneously to
determine management plans that are Pareto optimal instead of selecting the single best
management regime based on only one objective. (Pareto optimal plans involve different trade-offs
among the objectives and none of the objectives can be improved without impairing at least one of
the others. All Pareto optimal plans form a Pareto optimal set. For further details, see e.g., Miettinen
1999.) This enables analysing trade-offs between revenues from timber production and carbon
measurements. The calculations were carried out using IBM ILOG CPLEX optimizer (http://www-
01.ibm.com/software/commerce/optimization/cplex-optimizer/). For further details of the
formulation of the multiobjective optimization model and the concept of Pareto optimality
connected to analysing trade-offs, see Mönkkönen et al. (2014).
To illustrate Pareto optimal combinations of management regimes that maximize carbon for
different fixed levels of harvest revenues, we created graphs for each carbon measurement to
represent how the optimal allocation of management regimes for forest stands evolves with
11
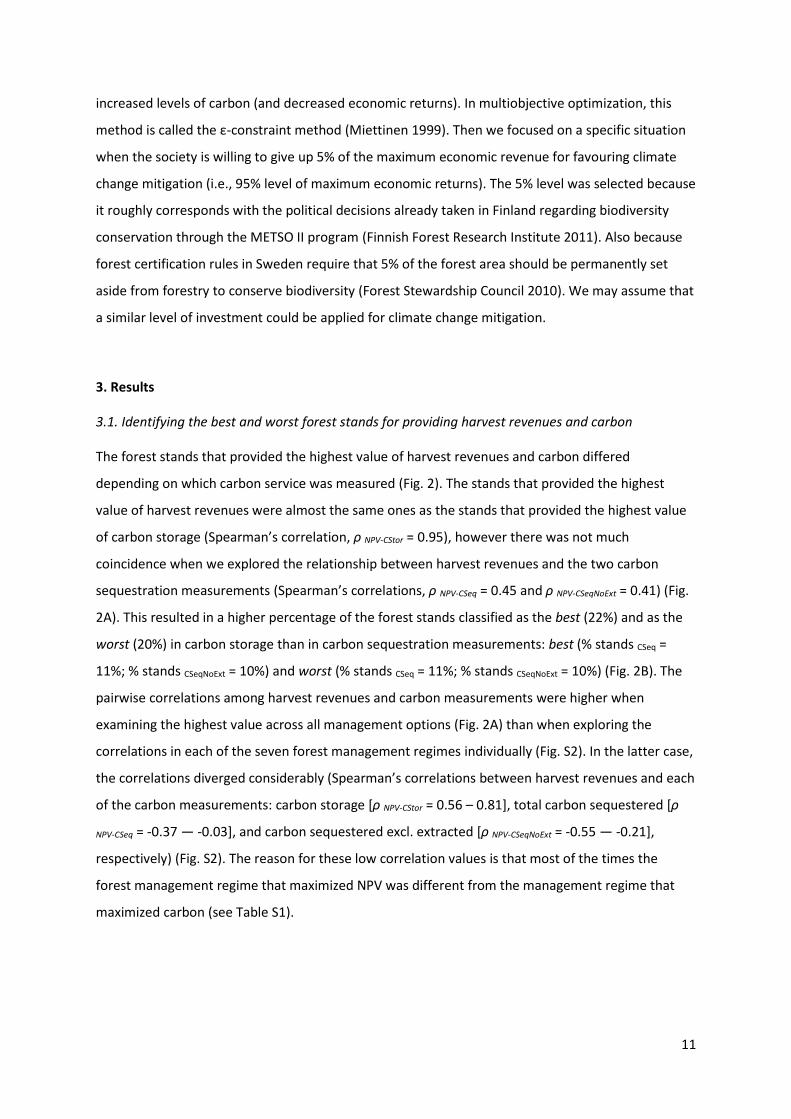
increased levels of carbon (and decreased economic returns). In multiobjective optimization, this
method is called the ε-constraint method (Miettinen 1999). Then we focused on a specific situation
when the society is willing to give up 5% of the maximum economic revenue for favouring climate
change mitigation (i.e., 95% level of maximum economic returns). The 5% level was selected because
it roughly corresponds with the political decisions already taken in Finland regarding biodiversity
conservation through the METSO II program (Finnish Forest Research Institute 2011). Also because
forest certification rules in Sweden require that 5% of the forest area should be permanently set
aside from forestry to conserve biodiversity (Forest Stewardship Council 2010). We may assume that
a similar level of investment could be applied for climate change mitigation.
3. Results
3.1. Identifying the best and worst forest stands for providing harvest revenues and carbon
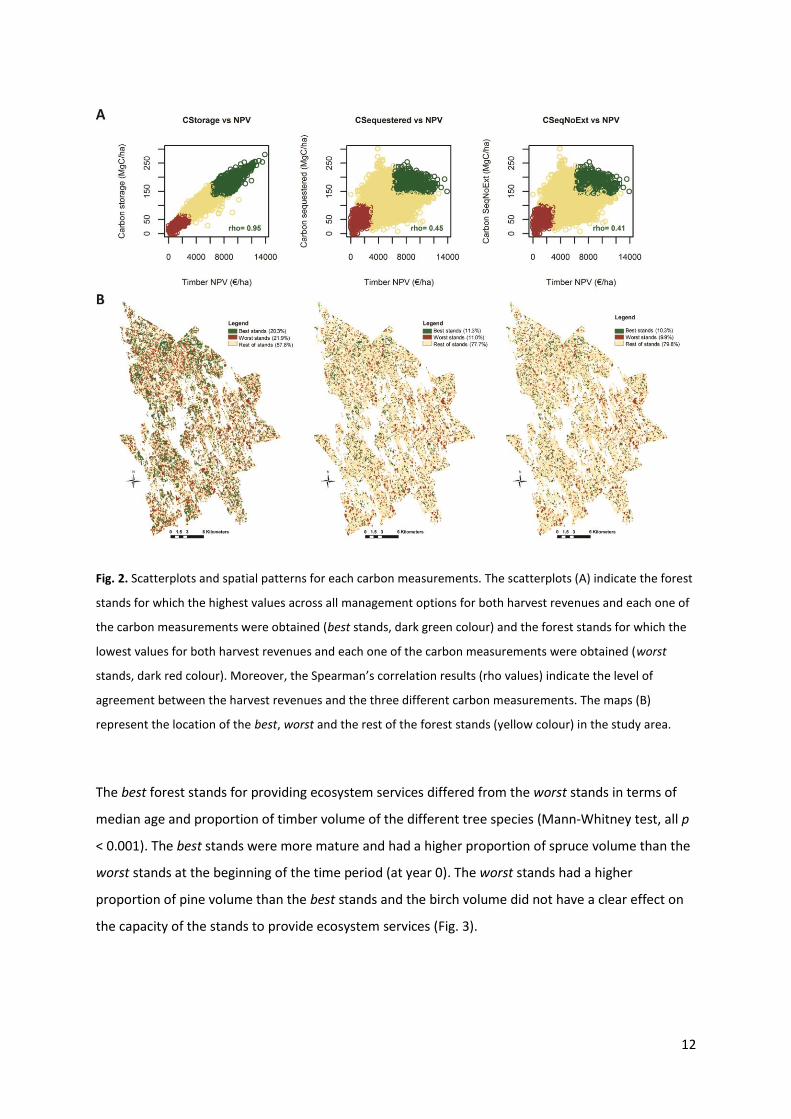
The forest stands that provided the highest value of harvest revenues and carbon differed
depending on which carbon service was measured (Fig. 2). The stands that provided the highest
value of harvest revenues were almost the same ones as the stands that provided the highest value
of carbon storage (Spearman’s correlation, ρ NPV-CStor = 0.95), however there was not much
coincidence when we explored the relationship between harvest revenues and the two carbon
sequestration measurements (Spearman’s correlations, ρ NPV-CSeq = 0.45 and ρ NPV-CSeqNoExt = 0.41) (Fig.
2A). This resulted in a higher percentage of the forest stands classified as the best (22%) and as the
worst (20%) in carbon storage than in carbon sequestration measurements: best (% stands CSeq =
11%; % stands CSeqNoExt = 10%) and worst (% stands CSeq = 11%; % stands CSeqNoExt = 10%) (Fig. 2B). The
pairwise correlations among harvest revenues and carbon measurements were higher when
examining the highest value across all management options (Fig. 2A) than when exploring the
correlations in each of the seven forest management regimes individually (Fig. S2). In the latter case,
the correlations diverged considerably (Spearman’s correlations between harvest revenues and each
of the carbon measurements: carbon storage [ρ NPV-CStor = 0.56 – 0.81], total carbon sequestered [ρ
NPV-CSeq = -0.37 ― -0.03], and carbon sequestered excl. extracted [ρ NPV-CSeqNoExt = -0.55 ― -0.21],
respectively) (Fig. S2). The reason for these low correlation values is that most of the times the
forest management regime that maximized NPV was different from the management regime that
maximized carbon (see Table S1).
12
Fig. 2. Scatterplots and spatial patterns for each carbon measurements. The scatterplots (A) indicate the forest
stands for which the highest values across all management options for both harvest revenues and each one of
the carbon measurements were obtained (best stands, dark green colour) and the forest stands for which the
lowest values for both harvest revenues and each one of the carbon measurements were obtained (worst
stands, dark red colour). Moreover, the Spearman’s correlation results (rho values) indicate the level of
agreement between the harvest revenues and the three different carbon measurements. The maps (B)
represent the location of the best, worst and the rest of the forest stands (yellow colour) in the study area.
The best forest stands for providing ecosystem services differed from the worst stands in terms of
median age and proportion of timber volume of the different tree species (Mann-Whitney test, all p
< 0.001). The best stands were more mature and had a higher proportion of spruce volume than the
worst stands at the beginning of the time period (at year 0). The worst stands had a higher
proportion of pine volume than the best stands and the birch volume did not have a clear effect on
the capacity of the stands to provide ecosystem services (Fig. 3).

13
Fig. 3. Boxplots comparing the forest stand characteristics (age and proportion of biomass for the three main
tree species) between the best and the worst stands for the three carbon measurements (where B refers to
the best stands and W to the worst stands; 1 refers to values for NPV and carbon storage; 2 refers to values for
NPV and carbon sequestered and 3 refers to values for NPV and carbon sequestered non extracted).
Regarding the best and the worst stands for providing harvest revenues and carbon services, the
management regime that, most of the times, was identified to provide the highest value for harvest
revenues (NPV) was business as usual; whereas the management regime that, generally, provided
the highest value for the carbon services was set-aside. This indicated a conflict because the same
management regime could not provide the highest value for both objectives. Thus, we explored
further the conflicts by identifying the forest stands for which the management regime that provided
the highest value of NPV was the same (matching) as for carbon measurements and the forest
stands for which the management regime did not coincide (not matching) (Fig. 4). Stands with
matching management regime represent a win-win case. Most of the matching stands were also
classified as the worst stands for maximizing carbon services and NPV (70% for CStor; 32% for CSeq
and 41% for CSeqNoExt) (Table S1) but this pattern was not found when excluding the set-aside
management regime (see Fig. S3). Across all management regimes, win-win situations could be
found on stands with a relatively low capacity for timber revenues but a high capacity for carbon

14
sequestration (Fig. 4). When excluding the set-aside regime, win-win situations were more scattered
across the full gradient of timber revenues (Fig. S3), indicating that it is possible to find stands where
a single management regime will provide the highest value both for timber and carbon. At the
beginning of the time period (at year 0), matching stands tended to be younger and contained a
lower proportion of spruce out of the total timber volume than in not matching stands (Fig. S4).
Fig. 4. Scatterplots that indicate the forest stands for which the management regime to maximize timber and
each one of the carbon measurements is the same (matching, blue colour) or is not the same (not matching,
orange colour).
3.2. Optimization results: trade-offs between harvest revenues and carbon
In the set of Pareto optimal plans, trade-offs between the harvest revenues and the carbon services
showed a nonlinear interdependence when different plans were connected to form curves (Fig. 5).
The slopes of the curves were quite flat for small values of carbon, meaning that the first increments
of carbon storage or sequestration were inexpensive. Maximizing the total amount of carbon
sequestered and carbon sequestered without considering the extracted timber resulted in large NPV
losses, but it was even more expensive to maximize the total amount of carbon storage as the curve
was steeper (see Table 2 and Fig. 5). We also showed that BAU, the currently applied management
regime, was not efficient because when it was applied consistently the outcomes were below the
potential harvest production (see three points in Fig. 5).

15
Fig. 5. Curves representing Pareto optimal plans describing the trade-offs between carbon services (carbon
storage and carbon sequestration; Mg of carbon, averaged across every 5 years) and harvest revenues (net
present value) for the three different carbon measurements. The reference line for a change of 5% in the NPV
is included (dashed and light violet colour line) and the changes for each carbon measurement (when the
dashed line intercepts with each one of the three carbon measurements). The three points show where
exclusive application of the current management regime (BAU = Business as usual) locates.
Table 2. Potential of the landscape to provide harvest revenues (NPV), carbon services examined using three
carbon measurements (average MgC per 5 years), and costs related to carbon services. Carbon Min. and
Carbon Max. represent the minimum and the maximum amount of carbon among all Pareto optimal plans.
Abs. NPV diff. is the absolute difference in NPV between the minimum and the maximum carbon values in the
Pareto optimal sets (maximum NPV is 194 M€ in all cases), i.e. the absolute cost of maximizing carbon
storage/sequestration. Relative carbon and NPV ranges illustrate the potential (in percentages) that exists to
decrease carbon storage/sequestration or NPV.
Carbon measurement Carbon Min. (103 MgC)
Carbon Max. (103 MgC)
Relative carbon range
Abs. NPV diff. (M€)
Relative NPV range
Carbon storage 2,730 4,449 39% 132 69% Carbon sequestered 3,266 5,214 37% 105 54% Carbon SeqNoExt 1,697 5,078 67% 130 67%

16
3.3. Optimal combinations of forest management regimes
When a single forest management regime was applied consistently, setting aside stands was the
most beneficial strategy for the three carbon measurements, followed by extended rotation (30
years) for carbon storage and by no thinnings (long rotation) for carbon sequestration (Table 3). By
contrast, the business as usual, if applied consistently, provided the lowest carbon storage values
and extended rotation 10 years was the least beneficial regime for the two carbon sequestration
measurements (Table 3). One can summarize that there was no single management regime that, if
applied consistently, maximized the carbon values (Table 3).
The combination of management regimes that maximized harvest revenues was business as usual
(60% of the stands), no thinnings (32%) and green tree retention (8%) regimes (Table 4). This
combination was used as a reference solution. The changes in the proportion of alternative
management regimes with increasing values of carbon in the Pareto optimal set were different for
the three carbon measurements (Fig. S5). For increased levels of carbon storage, there was an
increment of the application of extended rotation regimes (at the beginning a high increment of
EXT10 and then of EXT30). Increasing both measurements of carbon sequestration would require
more no-thinning regimes, especially NTSR and GTR30. Set aside should increasingly be applied
when targeting high in all carbon values.

17
Table 3. Net Present Value (NPV) and absolute carbon values (MgC) for alternative management regimes if applied consistently across all the stands. For the carbon
measurements also the percentage of the maximum carbon (Table 2) is given in brackets. The most beneficial exclusive strategy for different carbon measurements is given
in bold.
BAU SA EXT10 EXT30 GTR30 NTSR NTLR
NPV if applied consistently, M€ 187 0 167 159 182 170 159 Carbon measurements Carbon storage, 103 MgC 2,776 (62.4%) 4,431 (99.6%) 3,030 (68.1%) 3,751 (84.3%) 2,867 (64.4%) 2,880 (64.7%) 3,227 (72.5%) Carbon sequestered, 103 MgC 3,143 (60.3%) 5,019 (96.3%) 3,063 (58.7%) 3,664 (70.3%) 3,459 (66.3%) 3,592 (68.8%) 3,971 (76.2%) Carbon SeqNoExt., 103 MgC 1,370 (27.0%) 5,019 (98.8%) 1,345 (26.5%) 2,110 (41.6%) 1,756 (34.6%) 2,267 (44.6%) 2,884 (56.8%)

18
Table 4. Changes in units in the share of different management practices in the Pareto optimal set at the 5%
level of carbon cost (95% of the maximum NPV) for the different carbon measurements. The first row gives the
reference solution, i.e. the share when the target is to maximize NPV. The rest of the rows give the changes
from the reference solution. For example, for carbon storage when there is a reduction of 5% of carbon cost,
the management regime BAU is reduced by 11% but there is an increase of 10% in the application of EXT10.
Management regime
BAU SA EXT10 EXT30 GTR30 NTSR NTLR
59.5 0 0.3 0 8.4 30 1.7
Carbon storage -11.1 0.0 10.0 5.1 -0.7 -10.4 7.1 Carbon sequestered -25.6 0.0 5.6 1.2 7.7 3.8 7.2 Carbon SeqNoExt. -30.7 0.1 1.8 0.1 8.0 12.2 8.5
If the society is willing to invest 5% of harvest revenues for carbon related ecosystem services, an
increase of around 9% in the levels of carbon storage, 15% in carbon sequestration and 23% in
carbon sequestration excluding extracted timber can be achieved (Fig. 5). The required changes in
units in the management regimes differed among the three carbon measurements (Table 4). For
example, to achieve the 9% increase in carbon storage it is required, in the optimal case, to make an
11% reduction in the share of BAU regime and a 10% reduction in no thinning short rotation. These
regimes were replaced by applying more extended rotations and no-thinning with long rotation.
Likewise, to increase carbon sequestration required a considerable reduction of the BAU regime, and
an increase of the two no-thinning and the green-tree retention regimes (Table 4 and Fig. S5).
4. Discussion
In this study we identify optimal combinations of seven forest management regimes in a large boreal
landscape with about 30,000 stands for a 50-year time period. Our analyses show that there are
forest stands where it is possible to (i) greatly increase the levels of carbon (especially of carbon
sequestration) with little economic investment and (ii) maximize both the provisioning (timber
production) and regulating (carbon storage/sequestration) services. This requires adequate
optimization methods and forest management planning.
The trade-offs between timber and carbon differed when looking at carbon storage or carbon
sequestration. We found a strong correlation between the stands that provide the highest value for
harvest revenues and for carbon storage but a much weaker correlation between the stand that
provide the highest value for harvest revenues and for carbon sequestration measures (Fig. 2). This

19
indicated a stronger conflict for carbon storage than for carbon sequestration with harvest revenues,
which was also evident in the curves based on Pareto optimal plans in Fig. 5. Regarding the forest
characteristics at the beginning of the time period, we found that mature, spruce-dominated forests
were the best ones for providing both timber and carbon services. Age correlates well with tree
biomass and carbon accumulation until a very advanced age in which net carbon uptake is thought
to be balanced by respiration and increased mortality (Xu et al. 2012). Therefore, old trees store less
efficiently carbon in live woody tissues, although they still can continue accumulating carbon
(Luyssaert et al. 2008). Regarding tree species composition, Liski et al. (2001) found that a long
rotation length was more favourable for the total carbon stock in Scots pine sites whereas a short
rotation length seemed to be more favourable in Norway spruce sites. Therefore, the selection of
tree species that most efficiently sequester/store carbon probably depends on the forest
management regime applied.
We found a conflict between timber production and carbon services because, in most cases, the
management regime that maximized timber was different from the one that maximized carbon.
Moreover, for the small proportion of stands where a single regime maximized both services, most
of the stands were classified as the worst. The stands designated as the worst were not very suitable
for either services, but they may still be good stands from the climate policy perspective if they can
provide carbon benefits at a low cost (see Juutinen et al. 2014 for cost-efficient study to improve
forest biodiversity). Nevertheless, we also found situations in which both ecosystem services could
be achieved with a single management regime (matching stands). In our landscape, these stands
tended to be initially young with a relatively low proportion of spruce (Fig. S4). These results suggest
three main strategies in resolving the conflict. First, one must identify and locate the win-win cases,
i.e. stands where management regimes match and provide high levels of both ecosystem services
(best stands). Second, for the rest of the stands one must find a combination of regimes that
minimizes economic losses for a given level of carbon services, or vice versa. The third strategy is to
spatially differentiate between the provision of timber and carbon related services. Our results
suggest that ‘land sharing’ (provision of the two services from the same forest stand) and ‘land
sparing’ (single service prioritization) are not exclusive strategies, although both are needed for
solving the conflicts at the landscape scale.
Most of the studies analysing multiple ecosystem services focus on a single aspect of climate
regulation: carbon storage (e.g., Maskell et al. 2013) or carbon sequestration (e.g., Nelson et al.
20
2009) but the consideration of both of them is interesting as different types of forests can be good
at providing these different aspects of climate regulation. For instance, old-growth forests contain
high amounts of carbon stored in the biomass and continue accumulating carbon in soils (Zhou et al.
2006). Forest management quite often targets at replacing old-growth forests with fast-growing
young trees or tree species that can sequester carbon faster but, at the same time, the carbon
storage is being reduced (Harmon et al. 1990). However, the capacity of boreal forests to store and
sequester carbon are not the only elements contributing to climate regulation, as there are other
processes involved, such as vegetation albedo (Betts and Ball 1997; Betts 2000; Bonan et al. 1992),
ecosystem respiration (Valentini et al. 2000) or provision of aerosols that contribute to cloud
formation (Spracklen et al. 2008). We urge for studies that incorporate as many of these processes
as possible to get a more complete picture of the role that boreal forests play in climate regulation.
Our estimates of the predicted amount of carbon storage and sequestration were consistent with
earlier studies in boreal forests (Mäkipää et al. 2011; Tamminen et al. 2012). Regarding carbon
sequestration, in our study we took into consideration two measurements of it: one that includes
carbon in harvested timber (carbon sequestered) and another that excludes the carbon in harvested
timber (carbon sequestered non-extracted). The former considers wood products in the forest
carbon and assumes that all carbon, once stored into timber, is permanently away from the
atmosphere. The Kyoto Protocol (http://unfccc.int/resource/docs/convkp/kpeng.pdf) assumes a
simple case that all the carbon is released to the atmosphere immediately after harvesting, thus,
excluding the carbon storage in wood products. Both assumptions are unjustified because the end
use of the wood products determines to what extent and for how long the carbon in wood products
is retained from the atmosphere. Carbon in forest fuel is rapidly released back to the atmosphere
but carbon in wooden building material and furniture is retained for a longer time (Cao et al. 2010).
A realistic scenario is somewhere between these two extremes, and critically depends on the
management decision and the markets for alternative wood products. Another important aspect
affecting the carbon balance of forests are the substitution effects, i.e., there are different emission
rates of carbon depending on the use of wood after harvesting (biofuel, sawn wood, pulp wood,
etc.) (Pukkala 2011). However, these factors are beyond the scope of our study, because the end use
for the timber products once they leave the forest is out of landowner’s decision (Asante and
Armstrong 2012).

21
Regarding the effect of different forest management regimes on the provision of carbon we found
that no management regime alone was able to maximize carbon. Although setting aside stands was
the most beneficial management for the provision of the three carbon measurements, a
combination of regimes was more beneficial than a consistent application of the setting aside
regime (Table 3). In agreement with Liski et al. (2001), we found that longer rotation lengths would
be favourable for carbon, especially for carbon storage, whereas no-thinning strategies would be the
most favourable ones for carbon sequestration. Refraining from thinning may also be economically
profitable and beneficial for a broad range of boreal species (Mönkkönen et al. 2014; Tikkanen et al.
2012). Pukkala (2014) showed that thinning from above (a thinning that removes trees from the
dominant classes) have positive effects on the carbon balance of forests. However, this is not in
contradiction with our results because in this study we considered thinning from below (a thinning
that removes the smaller trees).
Climate change is another factor that will affect the capacity of the forest to provide timber and
preserve carbon. Most probably, in the Finnish boreal forest, carbon sequestration in living biomass
will increase due to the increase in tree growth (Pukkala and Kellomäki 2012), but the decomposition
rate of dead organic matter may also increase (Shorohova et al. 2008; Tuomi et al. 2011). Adaptation
strategies to increase timber extraction under climate change scenarios might include the reduction
of the rotation length (Kellomäki et al. 2008). By contrast, our results showed that an optimal
management, especially for carbon storage, should increase the rotation length, and no thinning
(often increasing the rotation length) would be good for carbon sequestration. These two opposite
needs for harvest revenues and carbon storage/ sequestration may create a conflict in management
priorities. Differentiating the provision of services from different types of stands (‘land sparing’)
would solve the conflict. For the delivery of timber and carbon services we should focus on mature,
spruce-dominated stands. Spruce-dominated stands are also the ones preserving a higher number of
threatened species (Tikkanen et al. 2006) and this could create a conflict between timber extraction
and biodiversity conservation. There are many uncertainties related to future climate projections
(Knutti and Sedlacek 2012) and many ways in which climate change can be measured (Garcia et al.
2014). Climate change was not considered in our analyses, but it will be interesting to include its
effects on the provision of ecosystem services in future research to have more realistic predictions.
Moreover, climate change can affect forests by altering the frequency, timing, duration and intensity
of forest disturbances such as windstorms, insect outbreaks or fires (Dale et al. 2001).

22
5. Conclusions
We studied trade-offs between provisioning (revenues from timber selling) and regulating (carbon
storage and sequestration) ecosystem services among alternative forest management regimes in a
large boreal forest production landscape. Going beyond previous studies, we incorporated up to
seven management regimes, ran simulations for a large landscape area with about 30,000 stands
and identified management optima for a 50-year planning horizon. We were able to pinpoint “win-
win” situations where it is possible to maximize both timber production and carbon
storage/sequestration. We showed that the amount of carbon captured from the atmosphere and
stored as biomass can be greatly increased with little monetary investment. In general, a good
strategy to maintain both timber production and carbon storage/sequestration in production forests
would be to diversify management regimes. The most favourable management regime for carbon
storage/sequestration was “set-aside” followed by long rotation lengths and avoiding silvicultural
thinning. These recommended management regimes are largely the same as those that have been
promoted to maintain biodiversity in production forest landscapes (e.g., Mönkkönen et al. 2014,
2011). Therefore, current biodiversity conservation policy tools such as compensating forest owners
for economic losses from environmental-friendly forest management or setting aside forests with
voluntary conservation agreements (Mönkkönen et al. 2009) also provide benefits in terms of
climate regulation. Overall, our results show that forest owners and management planners can apply
different strategies depending on the characteristics of forest stands: a) identify “win-win” situations
for the stands where it is possible to obtain both good levels of timber production and carbon
storage/sequestration and b) for the rest of the stands find a combination of management regimes
that minimize economic losses for a target level of carbon storage/sequestration, or vice versa. This
study emphasizes the importance of careful landscape-level forest management planning when
targeting multiple ecosystem services.
Acknowledgements
We are grateful to the Academy of Finland (project 138032 to M.M.) for funding. We compiled and
processed data with funding from the Finnish Ministry of Agriculture and Forestry (project 311159).
Thanks to M. Karjalainen for helping with the code in R and H. Salminen for his help with MOTTI
stand simulator. We thank five anonymous reviewers from Peerage of Science and this journal for
comments on the manuscript.

23
References
Ahtikoski, A., Tuulentie, S., Hallikainen, V., Nivala, V., Vatanen, E., Tyrväinen, L., Salminen, H., 2011.
Potential trade-offs between nature-based tourism and forestry, a case study in northern Finland.
Forests 2, 894-912.
Asante, P., Armstrong, G.W., 2012. Optimal forest harvest age considering carbon sequestration in
multiple carbon pools: A comparative statics analysis. Journal of Forest Economics 18, 145–156.
Balvanera, P., Siddique, I., Dee, L., Paquette, A., Isbell, F., Gonzalez, A., Byrnes, J., O’Connor, M.I.,
Hungate, B.A., Griffin, J.N., 2014. Linking biodiversity and ecosystem services: current
uncertainties and the necessary next steps. BioScience 64, 49-57.
Betts, A.K., Ball, J.H., 1997. Albedo over the boreal forest. Journal of Geophysical Research:
Atmospheres 102, 28901-28909.
Betts, R.A., 2000. Offset of the potential carbon sink from boreal forestation by decreases in surface
albedo. Nature 408, 187-190.
Birdsey, R., Pregitzer, K., Lucier, A., 2006. Forest carbon management in the United States. Journal of
Environmental Quality 35, 1461-1469.
Bonan, G.B., Pollard, D., Thompson, S.L., 1992. Effects of boreal forest vegetation on global climate.
Nature 359, 716-718.
Bradshaw, C.J.A., Warkentin, I.G., Sodhi, N.S., 2009. Urgent preservation of boreal carbon stocks and
biodiversity. Trends in Ecology & Evolution 24, 541-548.
Brown, S., 2002. Measuring carbon in forests: current status and future challenges. Environmental
Pollution 116, 363-372.
Brumelis, G., Jonsson, B.G., Kouki, J., Kuuluvainen, T., Shorohova, E., 2011. Forest naturalness in
Northern Europe: perspectives on processes, structures and species diversity. Silva Fennica 45,
807–821.
Cao, T., Valsta, L., Mäkelä, A., 2010. A comparison of carbon assessment methods for optimizing
timber production and carbon sequestration in Scots pine stands. Forest Ecology and
Management 260, 1726–1734.
Dale, V.H., Joyce, L.A., McNulty, S., Neilson, R.P., Ayres, M.P., Flannigan, M.D., Hanson, P.J., Irland,
L.C., Lugo, A.E., Peterson, C.J., Simberloff, D., Swanson, F.J., Stocks, B.J., Michael Wotton, B.,
2001. Climate Change and Forest Disturbances. BioScience 51, 723-734.
de Groot, R.S., Alkemade, R., Braat, L., Hein, L., Willemen, L., 2010. Challenges in integrating the
concept of ecosystem services and values in landscape planning, management and decision
making. Ecological Complexity 7, 260-272.

24
Eriksson, L.O., Löfgren, S., Öhman, K., 2011. Implications for forest management of the EU Water
Framework Directive's stream water quality requirements — A modeling approach. Forest Policy
and Economics 13, 284–291.
ESRI, 2011. ArcGIS Desktop: Release 10. Redlands, CA: Environmental Systems Research Institute.
European Commission, 2010. Communication from the commission to the European parliament, the
council, the European economic and social committee and the committee of the regions. Options
for an EU vision and target for biodiversity beyond 2010. , Available from: http://
ec.europa.eu/environment/nature/biodiversity/policy/pdf/communication_2010_0004.pdf.
Finnish Forest Research Institute, 2011. Finnish Statistical Yearbook of Forestry, Metla, Vantaa.
htpp://www.metla.fi/index-en.html.
Finnish Forest Research Institute, 2012. MetInfo (metsätilastollinen tietopalvelu), Official Statistics of
Finland.
Finnish Government Resolution, 2012. Valtioneuvoston periaatepäätös Suomen luonnon
monimuotoisuuden suojelun ja kestävän käytön strategiasta vuosiksi 2012–2020, Luonnon
puolesta - ihmisen hyväksi. http://www.ymparisto.fi/download.asp?contentid=140692&lan=fi.
Forest Stewardship Council, 2010. Svensk skogsbruksstandard enligt FSC med SLIMF-indikatorer V2-1
050510. FSC Sweden, Uppsala.
Gamfeldt, L., Snall, T., Bagchi, R., Jonsson, M., Gustafsson, L., Kjellander, P., Ruiz-Jaen, M.C., Froberg,
M., Stendahl, J., Philipson, C.D., Mikusinski, G., Andersson, E., Westerlund, B., Andren, H.,
Moberg, F., Moen, J., Bengtsson, J., 2013. Higher levels of multiple ecosystem services are found
in forests with more tree species. Nature Communications 4, 1340.
García-Nieto, A.P., García-Llorente, M., Iniesta-Arandia, I., Martín-López, B., 2013. Mapping forest
ecosystem services: From providing units to beneficiaries. Ecosystem Services 4, 126-138.
Garcia, R.A., Cabeza, M., Rahbek, C., Araújo, M.B., 2014. Multiple dimensions of climate change and
their implications for biodiversity. Science 344, 1247579.
Gerasimov, Y., Hetemäki, L., Jonsson, R., Katila, P., Kellomäki, S., Koskela, T., Krankina, O., Lundmark,
T., Moen, J., Messier, C., Mielikäinen, K., Naskali, A., Saastamoinen, O., Nordin, A., Vanhanen, H.,
2012. Making Boreal Forests Work for People and Nature, ed. S.a.E. IUFRO’s Special Project on
World Forests.
Guariguata, M.R., Sist, P., Nasi, R., 2012. Multiple use management of tropical production forests:
How can we move from concept to reality? Forest Ecology and Management 263, 170-174.
Guo, Z., Zhang, L., Li, Y., 2010. Increased dependence of humans on ecosystem services and
biodiversity. PLoS ONE 5, e13113.

25
Hansen, M.C., Stehman, S.V., Potapov, P.V., 2010. Quantification of global gross forest cover loss.
Proceedings of the National Academy of Sciences 107, 8650-8655.
Hanski, I., 2005. The Shrinking World: Ecological Consequences of Habitat Loss. International Ecology
Institute, Oldendorf/ Luhe., Germany.
Harmon, M.E., Ferrell, W.K., Franklin, J.F., 1990. Effects on carbon storage of conversion of old-
growth forests to young forests. Science 247, 699-702.
Hynynen, J., Ahtikoski, A., Siitonen, J., Sievänen, R., Liski, J., 2005. Applying the MOTTI simulator to
analyse the effects of alternative management schedules on timber and non-timber production.
Forest Ecology and Management 207, 5-18.
Jandl, R., Lindner, M., Vesterdal, L., Bauwens, B., Baritz, R., Hagedorn, F., Johnson, D.W., Minkkinen,
K., Byrne, K.A., 2007. How strongly can forest management influence soil carbon sequestration?
Geoderma 137, 253-268.
Juutinen, A., Ollikainen, M., Mönkkönen, M., Reunanen, P., Tikkanen, O.-P., Kouki, J., 2014. Optimal
contract length for biodiversity conservation under conservation budget constraint. Forest Policy
and Economics 47, 14-24.
Karjalainen, T., Kellomäki, S., Pussinen, A., 1994. Role of wood-based products in absorbing
atmospheric carbon. Silva Fennica 28, 67-80.
Kellomäki, S., Peltola, H., Nuutinen, T., Korhonen, K.T., Strandman, H., 2008. Sensitivity of managed
boreal forests in Finland to climate change, with implications for adaptive management.
Philosophical Transactions of the Royal Society B: Biological Sciences 363, 2339-2349.
Knutti, R., Sedlacek, J., 2012. Robustness and uncertainties in the new CMIP5 climate model
projections. Nature Climate Change 3, 369-373.
Kojola, S., Ahtikoski, A., Hökkä, H., Penttilä, T., 2012. Profitability of alternative management regimes
in Scots pine stands on drained peatlands. European Journal of Forest Research 131, 413-426.
Liski, J., Lehtonen, A., Palosuo, T., Peltoniemi, M., Eggers, T., Muukkonen, P., Mäkipää, R., 2006.
Carbon accumulation in Finland's forests 1922–2004 – an estimate obtained by combination of
forest inventory data with modelling of biomass, litter and soil. Annals of Forest Science 63, 687-
697.
Liski, J., Pussinen, A., Pingoud, K., Mäkipää, R., Karjalainen, T., 2001. Which rotation length is
favourable to carbon sequestration? Canadian Journal of Forest Research 31, 2004-2013.
Luyssaert, S., Schulze, E.-D., Borner, A., Knohl, A., Hessenmoller, D., Law, B.E., Ciais, P., Grace, J.,
2008. Old-growth forests as global carbon sinks. Nature 455, 213-215.

26
Mäkipää, R., Linkosalo, T., Niinimäki, S., Komarov, A., Bykhovets, S., Tahvonen, O., Mäkelä, A., 2011.
How forest management and climate change affect the carbon sequestration of a Norway spruce
stand. Journal of Forest Planning 16, 107-120.
Maskell, L.C., Crowe, A., Dunbar, M.J., Emmett, B., Henrys, P., Keith, A.M., Norton, L.R., Scholefield,
P., Clark, D.B., Simpson, I.C., Smart, S.M., 2013. Exploring the ecological constraints to multiple
ecosystem service delivery and biodiversity. Journal of Applied Ecology 50, 561-571.
MEA, 2005. Millennium Ecosystem Assessment. Ecosystems and Human Well-being: Synthesis. Island
Press, Washingthon, DC.
Miettinen, K., 1999. Nonlinear Multiobjective Optimization. Kluwer Academic Publishers, Boston.
Miina, J., Pukkala, T., Hotanen, J.-P., Salo, K., 2010. Optimizing the joint production of timber and
bilberries. Forest Ecology and Management 259, 2065-2071.
Moen, J., Rist, L., Bishop, K., Chapin, F.S., Ellison, D., Kuuluvainen, T., Petersson, H., Puettmann, K.J.,
Rayner, J., Warkentin, I.G., Bradshaw, C.J.A., 2014. Eye on the Taiga: Removing Global Policy
Impediments to Safeguard the Boreal Forest. Conservation Letters 7, 408-418.
Mönkkönen, M., Juutinen, A., Mazziotta, A., Miettinen, K., Podkopaev, D., Reunanen, P., Salminen,
H., Tikkanen, O.-P., 2014. Spatially dynamic forest management to sustain biodiversity and
economic returns. Journal of Environmental Management 134, 80-89.
Mönkkönen, M., Reunanen, P., Kotiaho, J., Juutinen, A., Tikkanen, O.-P., Kouki, J., 2011. Cost-
effective strategies to conserve boreal forest biodiversity and long-term landscape-level
maintenance of habitats. European Journal of Forest Research 130, 717-727.
Mönkkönen, M., Ylisirniö, A.-L., Hämäläinen, T., 2009. Ecological Efficiency of Voluntary Conservation
of Boreal-Forest Biodiversity. Conservation Biology 23, 339-347.
Nave, L.E., Vance, E.D., Swanston, C.W., Curtis, P.S., 2010. Harvest impacts on soil carbon storage in
temperate forests. Forest Ecology and Management 259, 857–866.
Nelson, E., Mendoza, G., Regetz, J., Polasky, S., Tallis, H., Cameron, D., Chan, K.M.A., Daily, G.C.,
Goldstein, J., Kareiva, P.M., Lonsdorf, E., Naidoo, R., Ricketts, T.H., Shaw, M., 2009. Modeling
multiple ecosystem services, biodiversity conservation, commodity production, and tradeoffs at
landscape scales. Frontiers in Ecology and the Environment 7, 4-11.
Nghiem, N., 2014. Optimal rotation age for carbon sequestration and biodiversity conservation in
Vietnam. Forest Policy and Economics 38, 56–64.
Pan, Y., Birdsey, R.A., Fang, J., Houghton, R., Kauppi, P.E., Kurz, W.A., Phillips, O.L., Shvidenko, A.,
Lewis, S.L., Canadell, J.G., Ciais, P., Jackson, R.B., Pacala, S.W., McGuire, A.D., Piao, S., Rautiainen,
A., Sitch, S., Hayes, D., 2011. A large and persistent carbon sink in the world’s forests. Science
333, 988-993.

27
Powers, E.M., Marshall, J.D., Zhang, J., Wei, L., 2013. Post-fire management regimes affect carbon
sequestration and storage in a Sierra Nevada mixed conifer forest. Forest Ecology and
Management 291, 268-277.
Pukkala, T., 2011. Optimizing forest management in Finland with carbon subsidies and taxes. Forest
Policy and Economics 13, 425–434.
Pukkala, T., 2014. Does biofuel harvesting and continuous cover management increase carbon
sequestration? Forest Policy and Economics 43, 41-50.
Pukkala, T., Kellomäki, S., 2012. Anticipatory vs adaptive optimization of stand management when
tree growth and timber prices are stochastic. Forestry 85, 463-472.
Pukkala, T., Lähde, E., Laiho, O., Salo, K., Hotanen, J.-P., 2011. A multifunctional comparison of even-
aged and uneven-aged forest management in a boreal region. Canadian Journal of Forest
Research 41, 851-862.
R Development Core Team, 2013. R: A Language and Environment for Statistical Computing., Vienna,
Austria . Available at: http://www.R-project.org.
Rapport, D.J., Costanza, R., McMichael, A.J., 1998. Assessing ecosystem health. Trends in Ecology &
Evolution 13, 397-402.
Rodríguez, J.P., Beard, T.D., Bennett, J.E.M., Cumming, G.S., Cork, S., Agard, J., Dobson, A.P.,
Peterson, G.D., 2006. Tradeoffs across space, time, and ecosystem services. Ecology and Society
11(1): 28. 11, 28.
Salminen, H., Lehtonen, M., Hynynen, J., 2005. Reusing legacy FORTRAN in the MOTTI growth and
yield simulator. Computers and Electronics in Agriculture 49, 103-113.
Shorohova, E., Kapitsa, E., Vanha-Majamaa, I., 2008. Decomposition of stumps 10 years after partial
and complete harvesting in a southern boreal forest in Finland. Canadian Journal of Forest
Research 38, 2414-2421.
Siitonen, J., 2001. Forest management, coarse woody debris and saproxylic organisms:
Fennoscandian boreal forests as an example. Ecological Bulletins, 11-41.
Spracklen, D.V., Bonn, B., Carslaw, K.S., 2008. Boreal forests, aerosols and the impacts on clouds and
climate. Philosophical Transactions of the Royal Society A: Mathematical, Physical and
Engineering Sciences 366, 4613-4626.
Tamminen, P., Saarsalmi, A., Smolander, A., Kukkola, M., Helmisaari, H.-S., 2012. Effects of logging
residue harvest in thinnings on amounts of soil carbon and nutrients in Scots pine and Norway
spruce stands. Forest Ecology and Management 263, 31-38.

28
Tikkanen, O.-P., Martikainen, P., Hyvärinen, E., Junninen, K., Kouki, J., 2006. Red-listed boreal forest
species of Finland: associations with forest structure, tree species, and decaying wood. Annales
Zoologici Fennici 43, 373–383.
Tikkanen, O.-P., Matero, J., Mönkkönen, M., Juutinen, A., Kouki, J., 2012. To thin or not to thin: bio-
economic analysis of two alternative practices to increase amount of coarse woody debris in
managed forests. European Journal of Forest Research 131, 1411-1422.
Tuomi, M., Laiho, R., Repo, A., Liski, J., 2011. Wood decomposition model for boreal forests.
Ecological Modelling 222, 709–718.
UNEP FAO and UNFF, 2009. Vital Forest Graphics. UNEP/GRID-Arendal.
Valentini, R., Matteucci, G., Dolman, A.J., Schulze, E.-D., Rebmann, C., Moors, E.J., Granier, A., Gross,
P., Jensen, N.O., Pilegaard, K., Lindroth, A., Grelle, A., Bernhofer, C., Grunwald, T., Aubinet, M.,
Ceulemans, R., Kowalski, A.S., Vesala, T., Rannik, U., Berbigier, P., Loustau, D., Gu[eth]mundsson,
J., Thorgeirsson, H., Ibrom, A., Morgenstern, K., Clement, R., Moncrieff, J., Montagnani, L.,
Minerbi, S., Jarvis, P.G., 2000. Respiration as the main determinant of carbon balance in European
forests. Nature 404, 861-865.
van Kooten, G.C., Binkley, C.S., Delcourt, G., 1995. Effect of carbon taxes and subsidies on optimal
forest rotation age and supply of carbon services. American Journal of Agricultural Economics 77,
365–374.
Vanha-Majamaa, I., Jalonen, J., 2001. Green Tree Retention in Fennoscandian Forestry. Scandinavian
Journal of Forest Research 16, 79-90.
Vanhanen, H., Jonsson, R., Gerasimov, Y., Krankina, O., Messier, C., 2012. Making boreal forests work
for people and nature,
https://archive.today/o/OiEG/http://www.iufro.org/download/file/8354/133/wfse-pol-brief-
boreal-forests_pdf/.
Vitousek, P.M., Mooney, H.A., Lubchenco, J., Melillo, J.M., 1997. Human domination of earth's
ecosystems. Science 277, 494-499.
Xu, C.-Y., Turnbull, M.H., Tissue, D.T., Lewis, J.D., Carson, R., Schuster, W.S.F., Whitehead, D.,
Walcroft, A.S., Li, J., Griffin, K.L., 2012. Age-related decline of stand biomass accumulation is
primarily due to mortality and not to reduction in NPP associated with individual tree physiology,
tree growth or stand structure in a Quercus-dominated forest. Journal of Ecology 100, 428-440.
Yrjölä, T., 2002. Forest management guidelines and practices in Finland, Sweden and Norway. In:
European Forest Institute Internal Report 11.
Zhou, G., Liu, S., Li, Z., Zhang, D., Tang, X., Zhou, C., Yan, J., Mo, J., 2006. Old-Growth Forests Can
Accumulate Carbon in Soils. Science 314, 1417.

29
Appendix A: Detailed information on how different carbon compartments were calculated
1. Carbon biomass stored in living wood, dead wood and in extracted timber
The timber volume outputs from MOTTI were transformed into biomass using biomass expansion
factors (BEFs) that are specific for tree species and stand age (Lehtonen et al. 2004). For the carbon
stored in living wood, the tree components considered were: stem, stumps, foliage, branches, bark
and transportation roots. For the carbon stored in dead wood, as the density of the wood was
reduced through the decay process, the biomass was multiplied by the density for the five decay
classes according to Mäkinen et al. (2006). The volume of the extracted timber in thinning and final
harvest was the sum of the pulp and saw wood for each tree species. This volume was also
converted into biomass using the BEFs but, in this case, only taking into account the stem
compartment as the twigs, needles, etc. are left in the forest. In all cases, the final estimate of
biomass (dry weight) was converted to carbon biomass by multiplying it by 0.5 (Intergovernmental
Panel on Climate Change 2003).
2. Residual carbon after thinning and final harvest
When there was a thinning or final harvest, the amount of cutting residues left on the forest floor
(twigs, needles, stumps, etc.) were calculated as the difference in carbon stored in living wood (Δ
WLiving C) between two consecutive time steps (e.g., between years 10 and 5, years 15 and 10 and so
on) and the amount of extracted carbon. We also took into account the growth rate of the trees
during each five-year period between consecutive time steps. We used the following equation:
W i, Residual C = (Δ Wi, Living C + Growth rate (5 yr)) - Wi, Extracted C , (1)
where i refers to each individual forest stand.
We also considered the decaying rate of the cutting residues not removed after thinning and final
harvest:
W i, Decayed Residual C = W i, Residual C, i * ρi , (2)
where ρi is the wood density values that depends on the year since death. The values were taken
from Mäkinen et al. (2006).
3. Total carbon and three carbon measurements

30
For each time step, the total amount of carbon is the sum of the carbon biomass from each
individual compartment:
WTotal C1 = WLiving C + WDead C + WExtracted C + WResidual C + WDecayed Residual C. (3)
Carbon storage (CStor) was calculated as the average amount of carbon biomass in the study area
during the 50-years period, across 11 time steps, following the equation for each stand:
WCStor = (∑ 𝑊Total C1)/1111𝑖=1 . (4)
Carbon sequestered (CSeq) was calculated as the sum of changes in carbon stock across all time
steps and for each stand (carbon biomass in harvested timber was included in the estimates):
WTotal C2 = Δ WLiving C + Δ WDead C + Δ WAccum. Extracted C + Δ WResidual C + Δ WDecayed Residual C. (5)
WCSeq = ∑ 𝑊Total C211𝑖=1 . (6)
Carbon sequestered non-extracted (CSeqNoExt) was calculated as the sum of changes in carbon
stock across all time steps and for each stand (carbon biomass in harvested timber was not included
in the estimates):
WTotal C3 = Δ WLiving C + Δ WDead C + Δ WResidual C + Δ WDecayed Residual C. (7)
WCSeqNoExt = ∑ 𝑊Total C311𝑖=1 . (8)
References
Integovernmental Panel on Climate Change, 2003. Good practice guidance for land use, land-use
change and forestry. IPPC National Greenhouse Gas Inventories Programme. http://www.ipcc-
nggip.iges.or.jp/public/gpglulucf/gpglulucf.html.
Lehtonen, A., Mäkipää, R., Heikkinen, J., Sievänen, R., Liski, J., 2004. Biomass expansion factors
(BEFs) for Scots pine, Norway spruce and birch according to stand age for boreal forests. Forest
Ecology and Management 188, 211-224.
Mäkinen, H., Hynynen, J., Siitonen, J., Sievänen, R., 2006. Predicting the decomposition of Scots pine,
Norway spruce, and birch stems in Finland. Ecological Applications 16, 1865-1879.

31
Fig. S1. Histogram showing the distribution of stand age in the study area at the initial conditions.

32
Fig. S2. Scatterplots that indicate the level of agreement between the harvest revenues and the three different carbon measurements for each one of the seven forest management regimes.
33
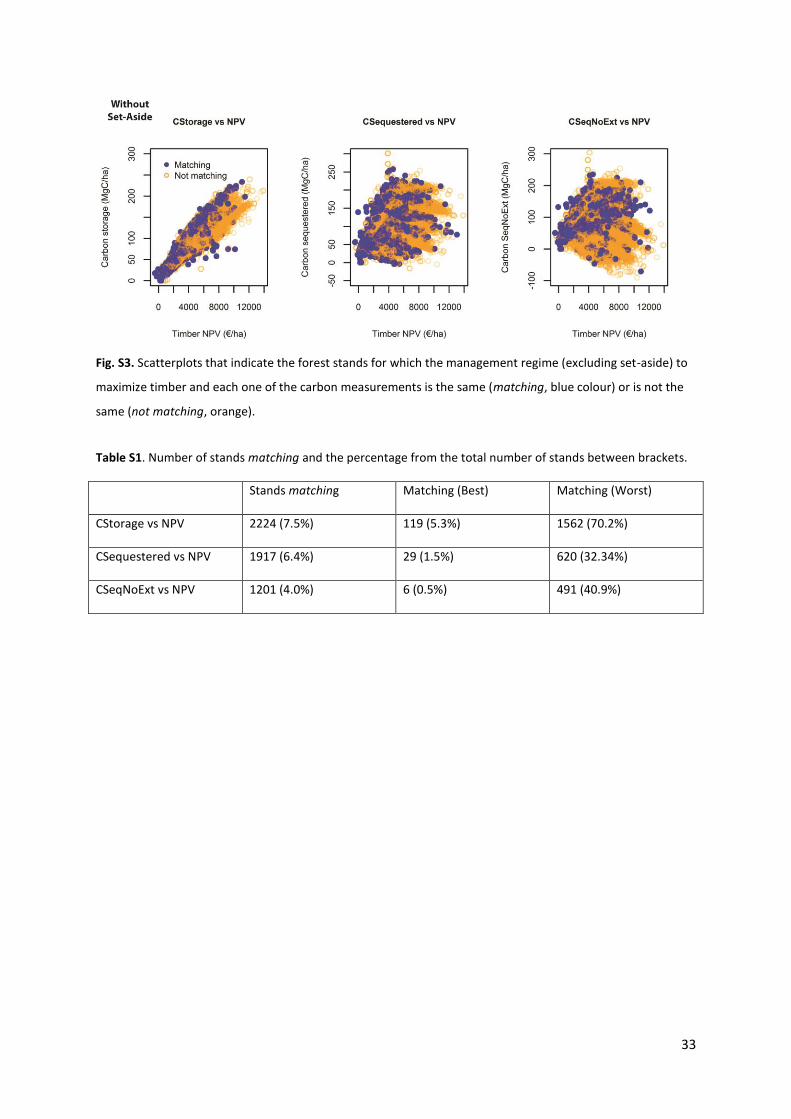
Fig. S3. Scatterplots that indicate the forest stands for which the management regime (excluding set-aside) to
maximize timber and each one of the carbon measurements is the same (matching, blue colour) or is not the
same (not matching, orange).
Table S1. Number of stands matching and the percentage from the total number of stands between brackets.
Stands matching Matching (Best) Matching (Worst)
CStorage vs NPV 2224 (7.5%) 119 (5.3%) 1562 (70.2%)
CSequestered vs NPV 1917 (6.4%) 29 (1.5%) 620 (32.34%)
CSeqNoExt vs NPV 1201 (4.0%) 6 (0.5%) 491 (40.9%)

34
Fig. S4. Boxplots comparing the forest stand characteristics (age and proportion of biomass for the three main
tree species) between the matching and the not matching stands for the three carbon measurements (where
M refers to matching stands and N to not matching stands; 1 refers to values for NPV and carbon storage; 2
refers to values for NPV and carbon sequestered and 3 refers to values for NPV and carbon sequestered non
extracted).

35
Fig. S5. Changes in the proportion of the seven alternative management regimes with increased levels of
carbon in the Pareto optimal sets. Changes are given for each one of the three carbon measurements (A:
CStor; B: CSeq; C: CSeqNoExt). Left-hand end of the x-axis refers to cases where harvest revenues (NPV) are
maximized (see first row of Table 4 for the reference proportion of management regime at this point). Y-axis
describes how much or less each management regime should be applied with increased levels of carbon.