trip linhas aéreas - divisão de engenharia civil do ita · trip linhas aéreas victor rafael r....
TRANSCRIPT

TRIP Linhas AéreasVictor Rafael R. Celestino
May 2011
TRIP Highlights
Air Transport in Brazil
Summary
Air Transport in Brazil
Regional Market
Major Challenges

TRIP Highlights
Introduction
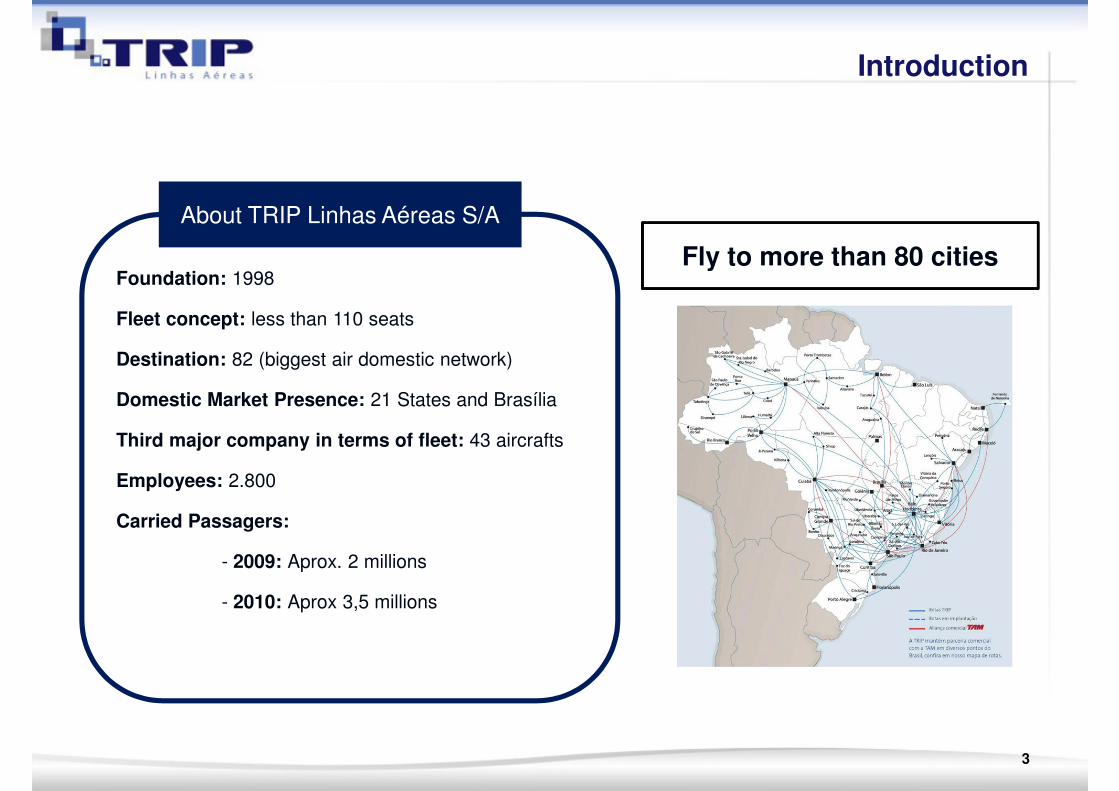
About TRIP Linhas Aéreas S/A
Fly to more than 80 citiesFoundation: 1998
Fleet concept: less than 110 seats
Destination: 82 (biggest air domestic network)
Domestic Market Presence: 21 States and Brasília
Third major company in terms of fleet: 43 aircrafts
Employees: 2.800
Carried Passagers:
Fly to more than 80 cities
Carried Passagers:
- 2009: Aprox. 2 millions
- 2010: Aprox 3,5 millions
3

Aircrafts suitable for Regional Aviation
Relevants Features
Aircrafts 48 to 110 seats
Introduction
Regional AviationAircrafts 48 to 110 seats
Revenue: “Full Web Based System”
Average fleet age: steady increase
Organizational Structure: lean and agile
Expansion of Routes:
-2007: growth of 40% (competitors increased 16% a the same
period)
- In 3 years: Aprox. 70%- In 3 years: Aprox. 70%
Headquarters: Campinas (Administrative offices) and Belo
Horizonte (Operational)
4
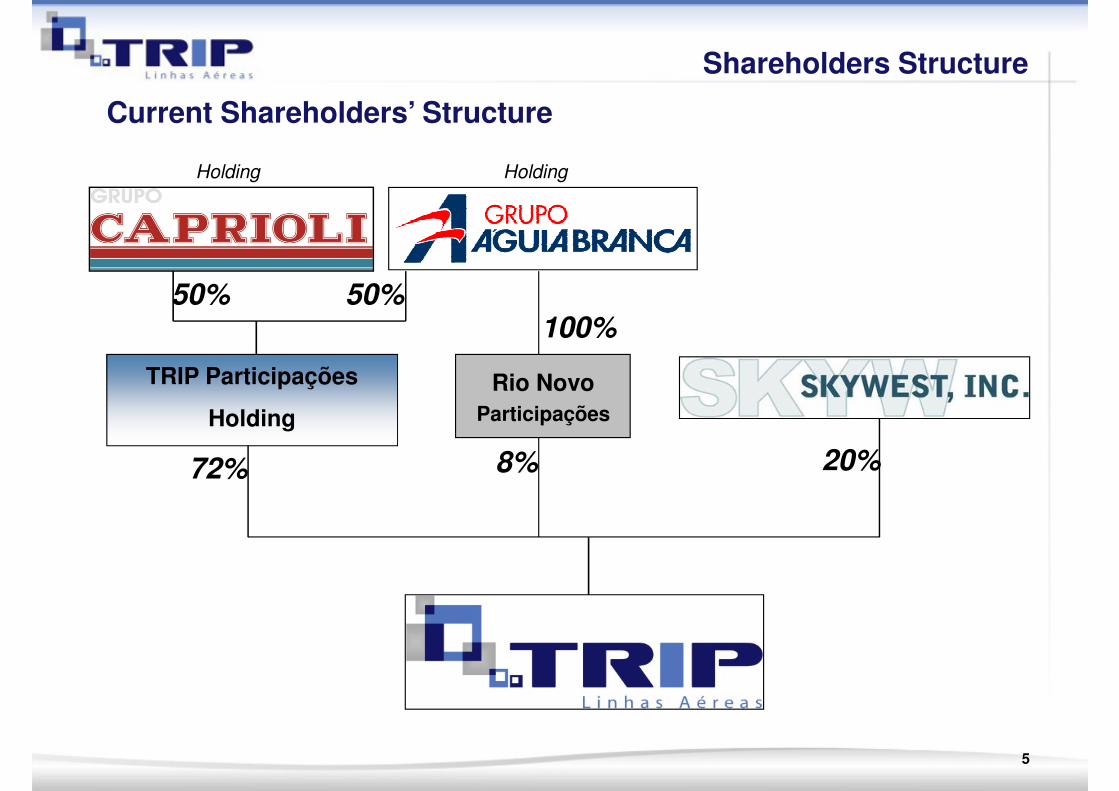
Current Shareholders’ Structure
Shareholders Structure
Holding Holding
TRIP Participações
Holding
72%
50%50%
20%8%
Rio Novo
Participações
100%
5
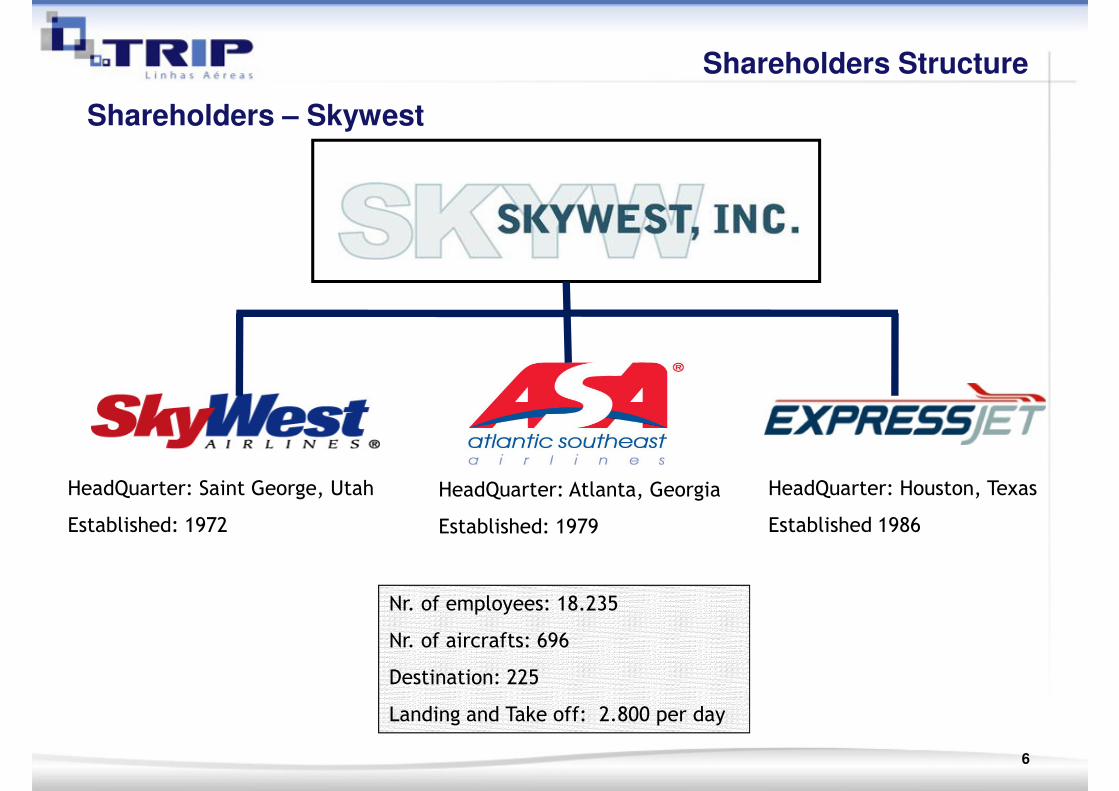
Shareholders – Skywest
Shareholders Structure
HeadQuarter: Atlanta, Georgia
Established: 1979
HeadQuarter: Saint George, Utah
Established: 1972
HeadQuarter: Houston, Texas
Established 1986Established: 1979Established: 1972
Nr. of employees: 18.235
Nr. of aircrafts: 696
Destination: 225
Landing and Take off: 2.800 per day
Established 1986
6
Alliances of Skywest
Shareholders Structure
7
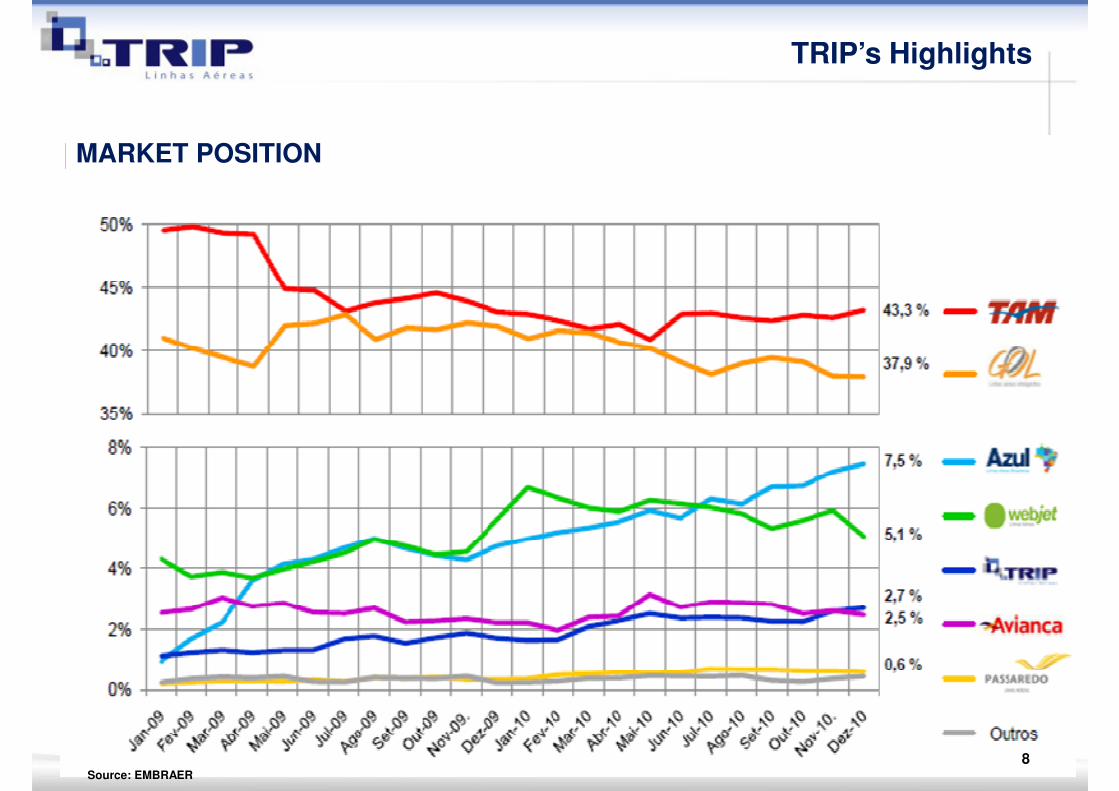
TRIP’s Highlights
MARKET POSITION
Source: EMBRAER
8
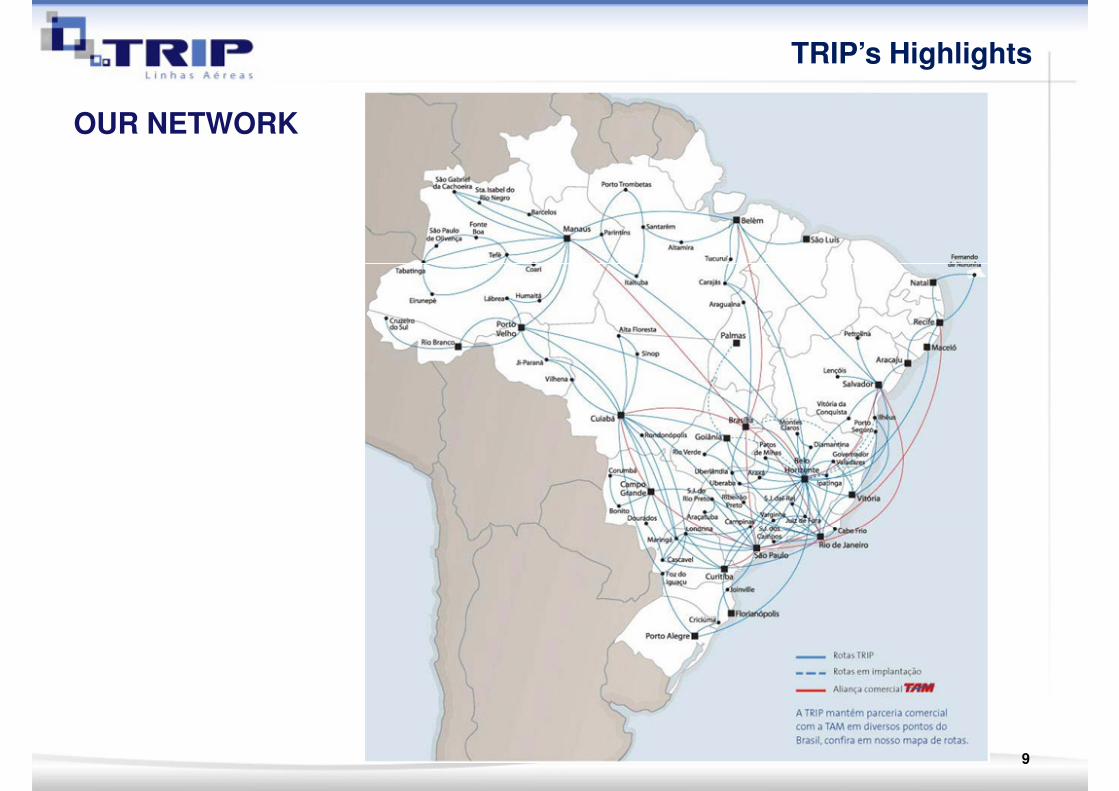
OUR NETWORK
TRIP’s Highlights
9

Our Fleet
ATR 4246-48 seats
ATR 4246-48 seats
ATR 7268 seatsATR 72
68 seats
EMBRAER 17586 seats
EMBRAER 17586 seats86 seats86 seats
EMBRAER 190110 Seats
EMBRAER 190110 Seats
10
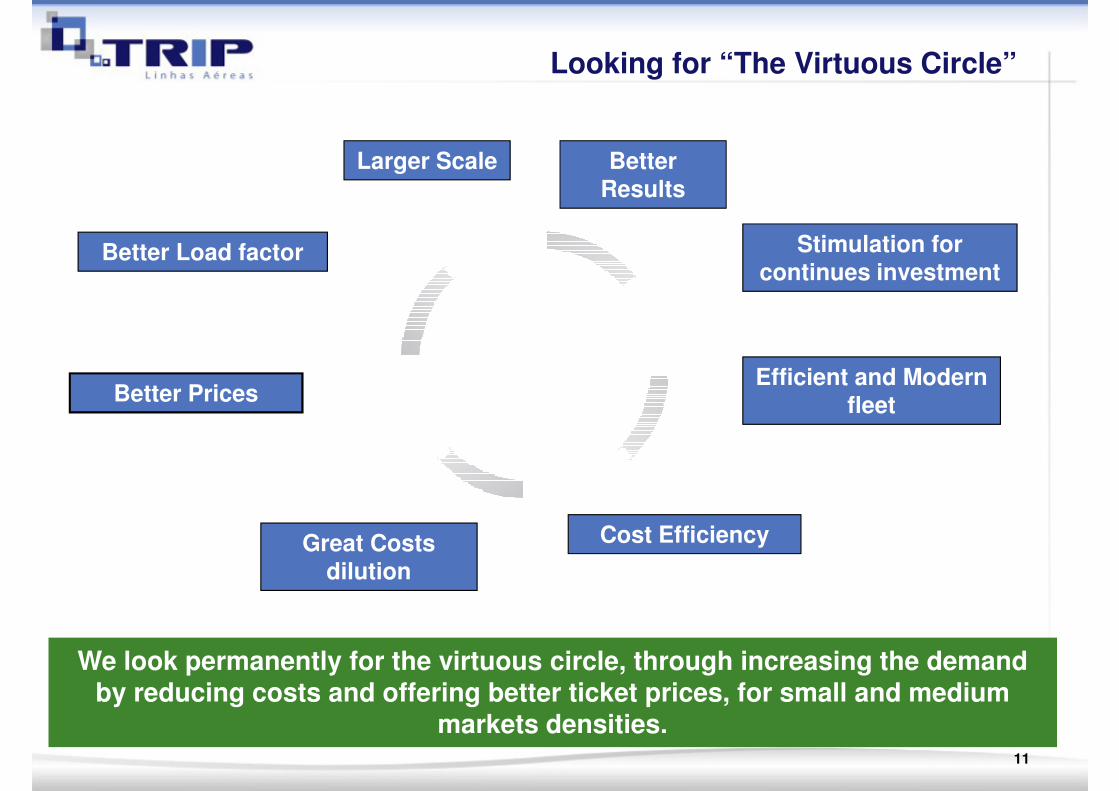
Larger Scale
Stimulation for continues investment
Better Load factor
Better Results
Looking for “The Virtuous Circle”
Efficient and Modern fleet
Cost Efficiency
continues investment
Better Prices
Better Load factor
Cost EfficiencyGreat Costs dilution
We look permanently for the virtuous circle, through increasing the demand by reducing costs and offering better ticket prices, for small and medium
markets densities.11

Air Transport in Brazil

• Country with large geographical dimension
Brazil has all the characteristics for a strong development of Regional Market
Brazilian Air Transport Market Overview
• Country with large geographical dimension
• 5th largest Global Population: about 190 million of habitants
• Non-existent, inefficient or non-preserved modal competitor
• Process of economic internalization in course: expansion of business in remote
areas
• Low Air travel penetration: passengers still traveling by bus
• Airline market in Brazil is growing fast
13

• The market has just moved from a government protect industry to a deregulated one: beginning 2000/2001
Brazil has all the characteristics for a strong development of Regional Market
Brazilian Air Transport Market Overview
deregulated one: beginning 2000/2001
• Long distance Airlines (TAM & GOL) already focused and consolidated
• Specialization: majors have grown and standardized on Narrowbodies aircrafts with
a strategy to lower the CASK
• Demand between city pairs: Mostly constituted by traffic beneath 90 PAX/day• Demand between city pairs: Mostly constituted by traffic beneath 90 PAX/day
• Airlines have not developed a wide distribution system: there is a great concentration of players in high density markets
14

Number of Airports with regular flights
178
200
TRIP’s Market: Regional Aviation
178
169
138135
119116
121
129
146
171
161 162
128
100
120
140
160
180
The result of increasing the size of aircrafts, in several markets of low and medium density, is
observed by the number of airports underserved or completely unserved.
The result of increasing the size of aircrafts, in several markets of low and medium density, is
observed by the number of airports underserved or completely unserved.
80
1998 1999 2000 2001 2002 2003 2004 2005 2006 2007 2008 2009 2010
15Source: ANAC (Jan/2011)

Domestic Demand
Million of Passengers Transported
49
58
65
31
3842
4549
Source: ANAC and Embraer (2010)
Number of passengers has grown more than 100% since 2004Number of passengers has grown more than 100% since 2004
2004 2005 2006 2007 2008 2009 2010
16
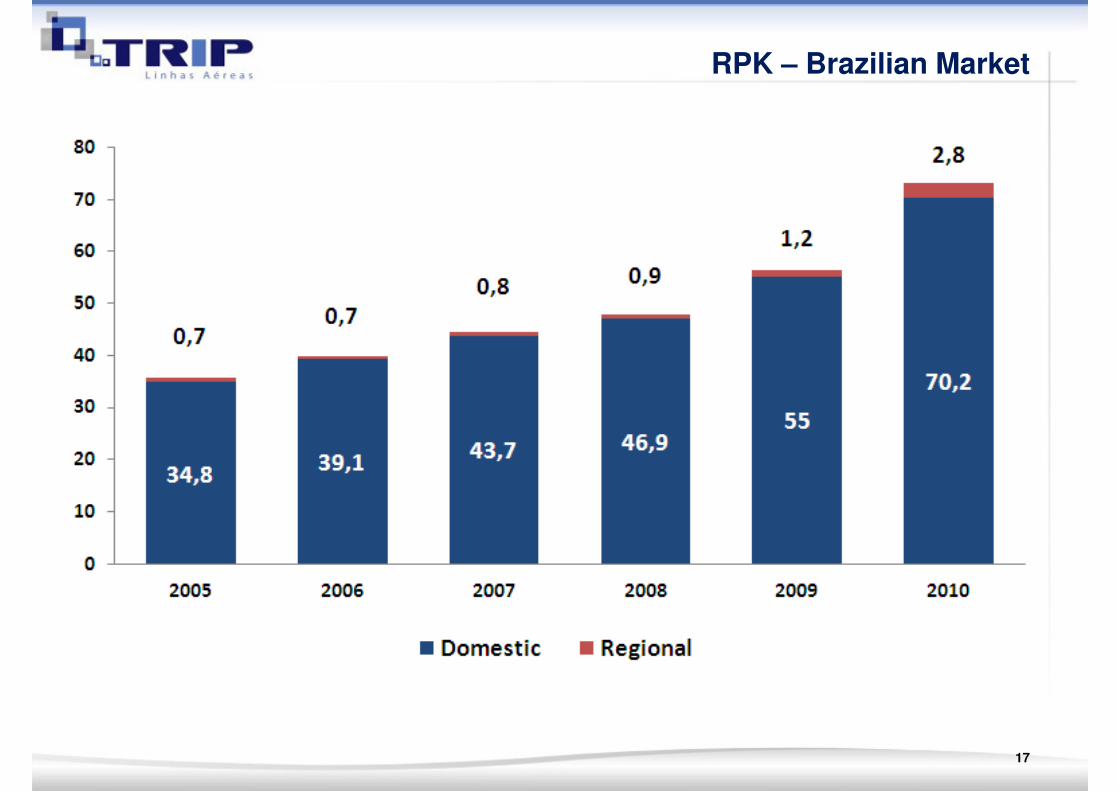
RPK – Brazilian Market
17

Movements of passengers (2009)
12 major airports
78% of traffic
12 major airports
78% of traffic
Source: INFRAERO and DAESP (2010)
Only 12 airports represent 78% of passenger traffic. Opportunities for decentralization may arise in mid-sized markets
Only 12 airports represent 78% of passenger traffic. Opportunities for decentralization may arise in mid-sized markets
18

Infrastructure GAPs (12 majors)
A I R P O R T RunwayAircraft Parking
Passenger Terminal
Current Restriction
8% 42% 50%
Guarulhos 2030
CongonhasSP Congonhas
Viracopos 2020 2014 2014
Galeão 2030
Santos Dumont 2030 2030
Confins 2020
Brasília 2030
Porto Alegre 2030 2030
Curitiba 2030 2020
SP
RJ
Others
According to recents studies, major airports show congestion signsAccording to recents studies, major airports show congestion signs
Curitiba 2030 2020
Recife 2030 2030 2020
Salvador 2030 2014
Fortaleza 2030
Others
Nowadays Before 20 years After 20 yearsRESTRICTIONS: Source: ITA and DECEA (2010)
19

Airline ASK* growth2010 vs 2009
Expansion Rate
Scheduled Airlines
12 %
13%
93%
76 %
89%
12,5%
75%
* Available Seats Kilometers
89%
Source: ANAC Brasil
Airlines have to make strong investments in fleet expansionAirlines have to make strong investments in fleet expansion
20

15%7%
Widebody ( > 210 seats)
Fleet In Service – Brazilian Airlines
34%
18%
18%
10%
34%
66%Narrowbody ( 120-210 seats)
Jet ( < 120 seats)
Turboprop
2000 2010
Unbalanced fleet means low flexibility and high potential for unprofitabilityUnbalanced fleet means low flexibility and high potential for unprofitability
Source: Fleet PC (2010)
21
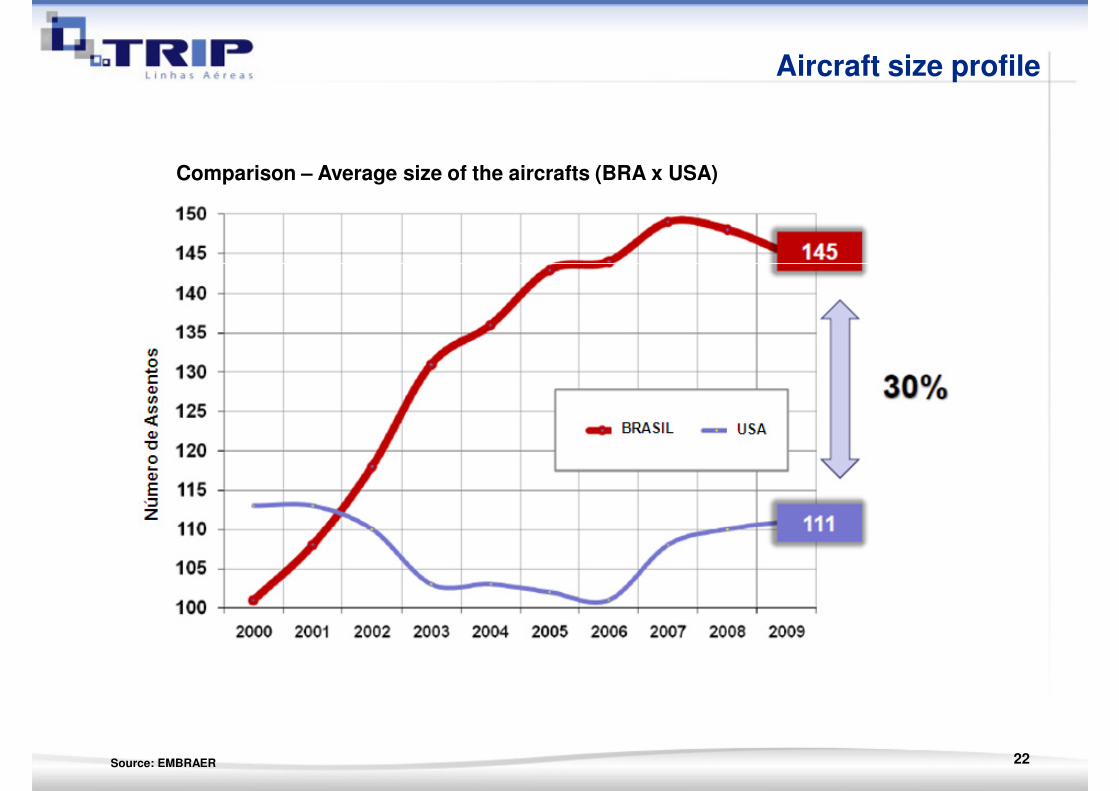
Aircraft size profile
Comparison – Average size of the aircrafts (BRA x USA)
22Source: EMBRAER

Brazilian Market Indicators
84
102
72%
69%
66%67%
69%
65%
70%
75%
100
120
40
4448
56
70
56
65
73
45%
50%
55%
60%
65%
20
40
60
80
23
Source: ANAC
However load factors remain stableHowever load factors remain stable
40%0
2006 2007 2008 2009 2010
RPK ASK LF

Regional Market
24
TRIP’s Market: Regional Aviation
� Brazil: According with the Brazilian aviation legislation, there is not a formal definition for a Regional Aviation Company. The Aviation
TRIP’s Market
formal definition for a Regional Aviation Company. The Aviation
companies are classified in scheduled airlines and non-scheduledairlines companies.
� Worldwide concept: it is defined by the number of seats in theaircraft (seat capacity): up to110 seats.
�Characteristics: flights of low or mid density, as well as, for receiving passangers of others domestics and international airlines who come passangers of others domestics and international airlines who come from bigger cities, carrying them to smaller cities (final destination).
25
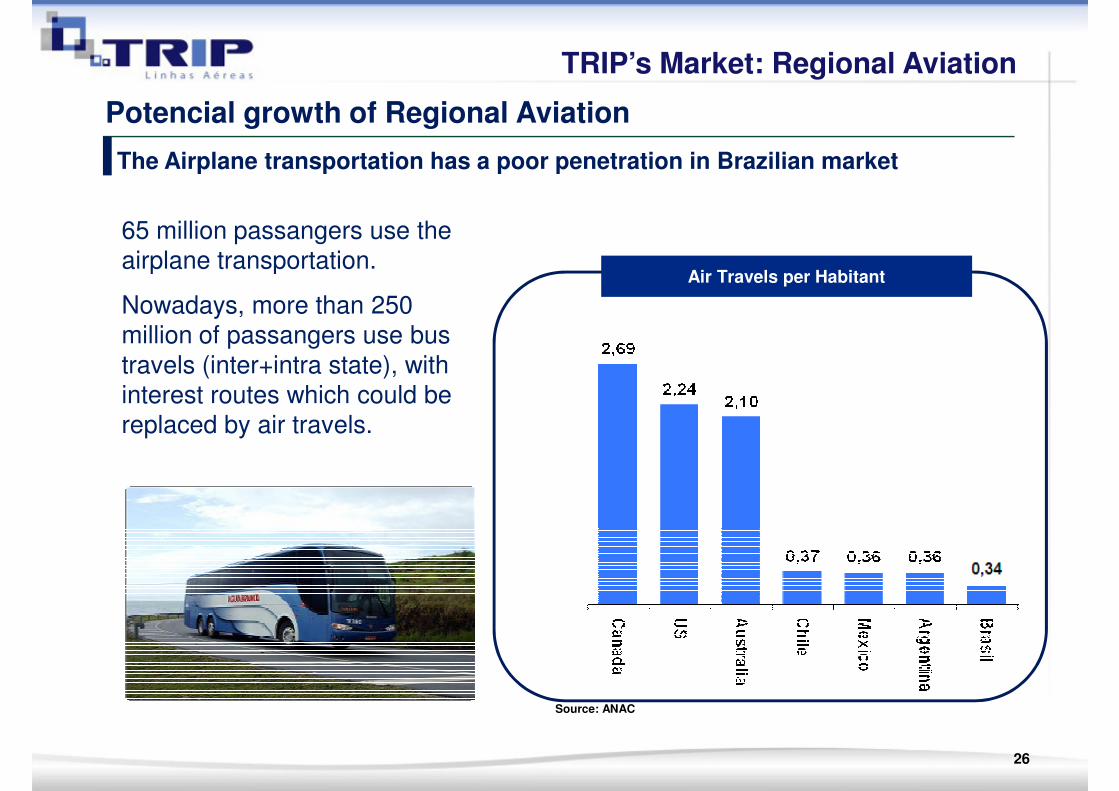
The Airplane transportation has a poor penetration in Brazilian market
65 million passangers use the airplane transportation.
Potencial growth of Regional Aviation
TRIP’s Market: Regional Aviation
airplane transportation.
Nowadays, more than 250 million of passangers use bus
travels (inter+intra state), with interest routes which could be replaced by air travels.
Air Travels per Habitant
26
Source: ANAC
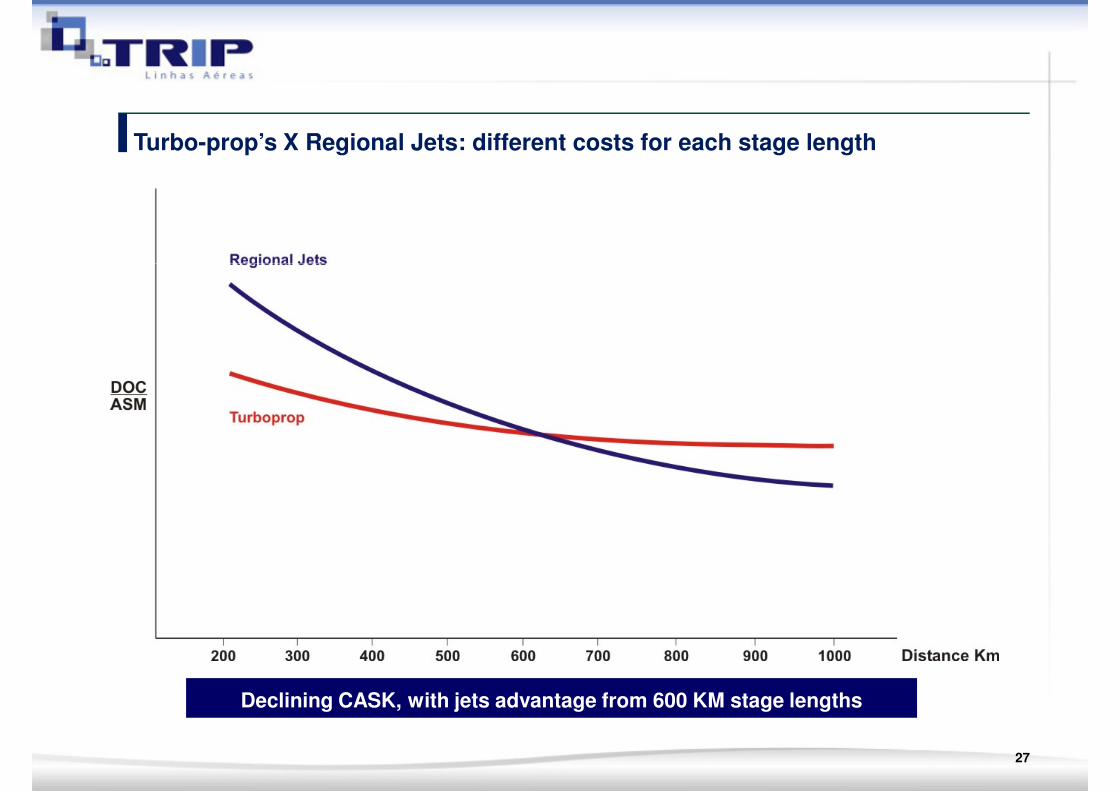
Turbo-prop’s X Regional Jets: different costs for each stage length
Declining CASK, with jets advantage from 600 KM stage lengths
27

What does the market offer ?
63% of the destinations have
less than one daily frequency
TRIP’s Market: Regional Aviation
less than one daily frequency
The combination of aircrafts size (narrowbodies), and typical Brazilian market demand, generates a net with fewer daily flights or with many stops and connections, in order to keep the load-factor and the desired breakeven
The combination of aircrafts size (narrowbodies), and typical Brazilian market demand, generates a net with fewer daily flights or with many stops and connections, in order to keep the load-factor and the desired breakeven
Daily Frequency
28Source: EMBRAER

Brazilian Air Transport Market Overview
Conclusion - Market
High competition between 2 major Airlines – pressure for low unit costs
Resulting in a Intensive use of narrowbodies(737-800 and A320’s), and no use of regional jets
With only narrowbody aircraft, markets with medium and low demand (20 and 250 PDEW) are poorly served
Intensive use of hub’s with connection flights or flights with multiple stops
Passenger wants direct and hub-bypass flights
Major opportunity for Aircraft of 70-100 seats
Majors seeking rightsizing capacity, and hub development
29

Major Challenges

K – Capitalization
N – Network
Airline Pillars
N – Network
A – Aircraft
T – Talent HR

Demand Forecast
O-D & Itinerary Construction
Network Build-Up Process
O-D & Itinerary Construction
Fleet Assignment
Crew Rostering

Data Sources
Modelling Alternatives
DemandForecast
Modelling Alternatives
Major Challenges

Data Sources – GDS / MIDT
Marketing Information Data Transfer (MIDT) from Global Distribution
Systems (GDS) represents only 17% of the actual bookings.
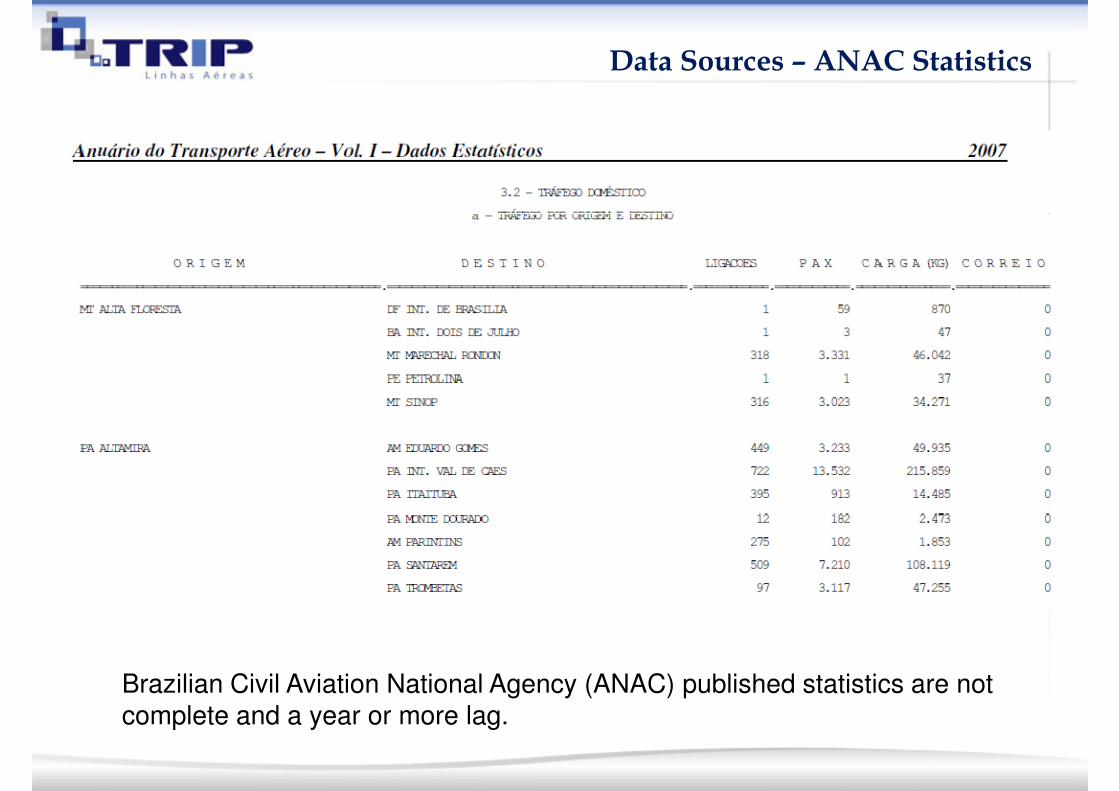
Data Sources – ANAC Statistics
Brazilian Civil Aviation National Agency (ANAC) published statistics are not
complete and a year or more lag.
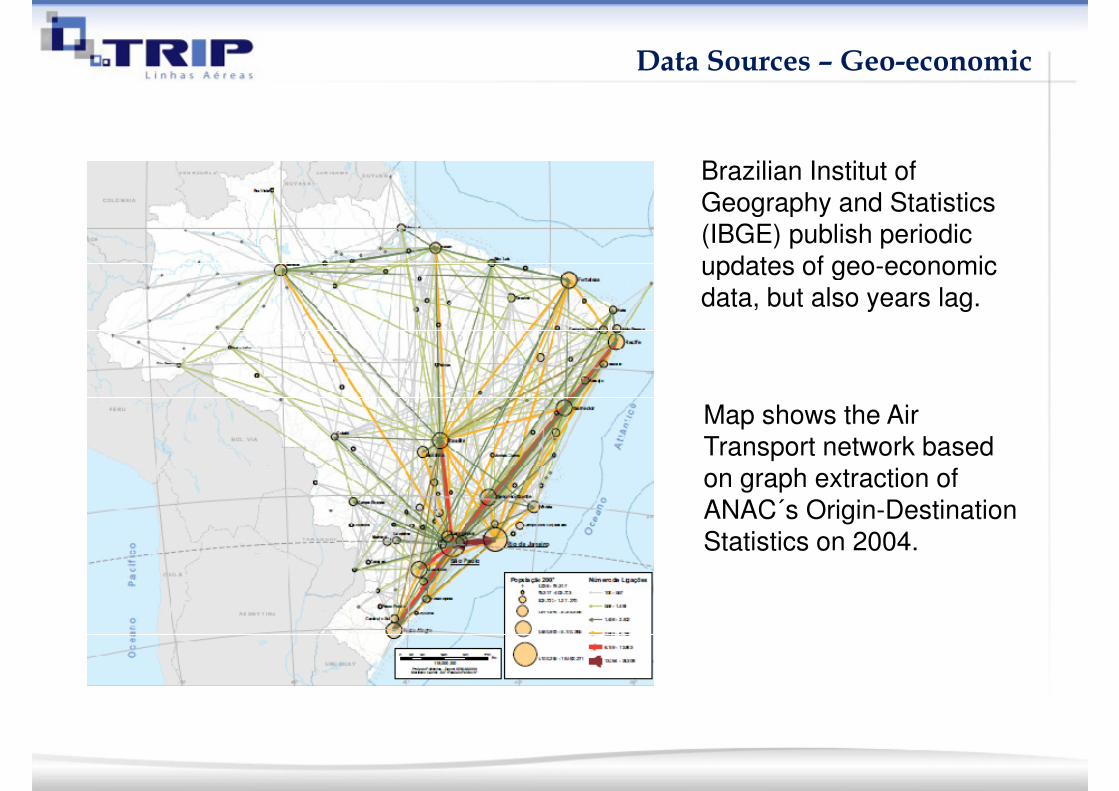
Data Sources – Geo-economic
Brazilian Institut of
Geography and Statistics
(IBGE) publish periodic
updates of geo-economic updates of geo-economic
data, but also years lag.
Map shows the Air
Transport network based
on graph extraction of
ANAC´s Origin-Destination
Statistics on 2004.Statistics on 2004.

Data Sources – Geo-economic
Map shows major
airports influence
areas based on
IBGE´s survey, from IBGE´s survey, from
which catchment
areas could be
inferred.
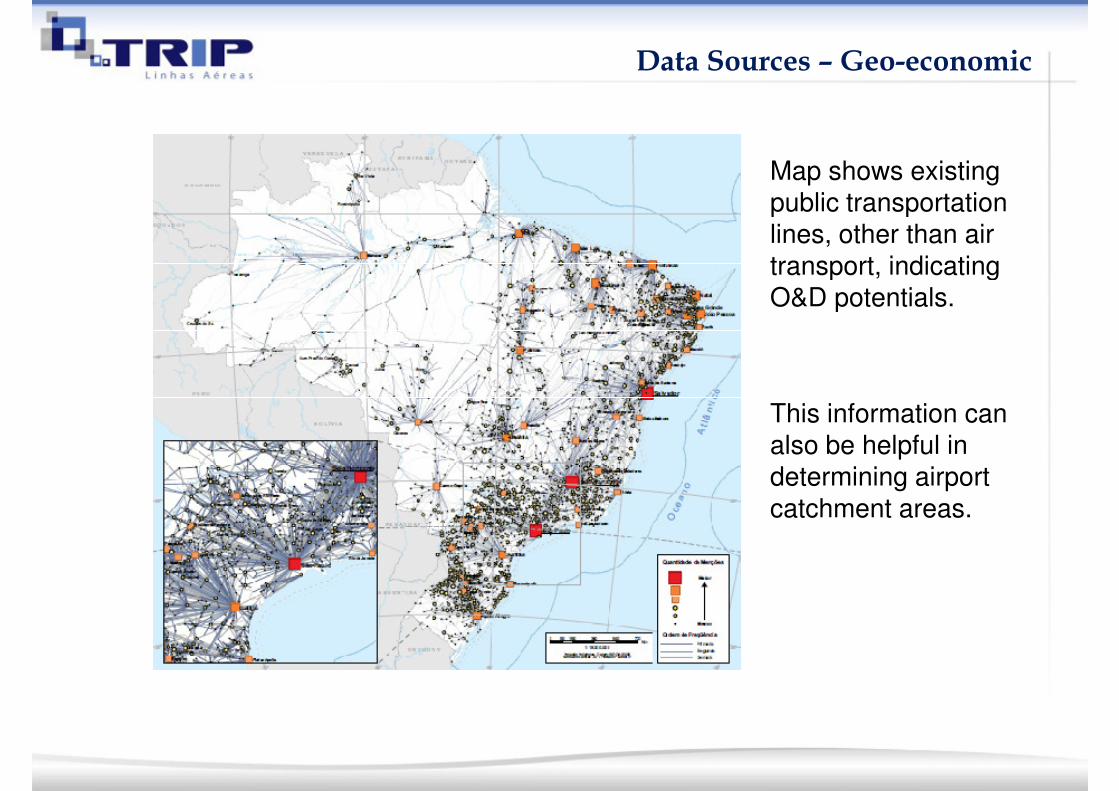
Data Sources – Geo-economic
Map shows existing
public transportation
lines, other than air
transport, indicating transport, indicating
O&D potentials.
This information can
also be helpful in
determining airport
catchment areas.

Mathematical Models
Modelling Alternatives
• Several modelling alternatives exist for forecasting demands:
� Trend extrapolation models: time series� Trend extrapolation models: time series
� Econometrics: regressions (various)
� Artificial Intelligence and Heuristics; and
� Gravitational Models.
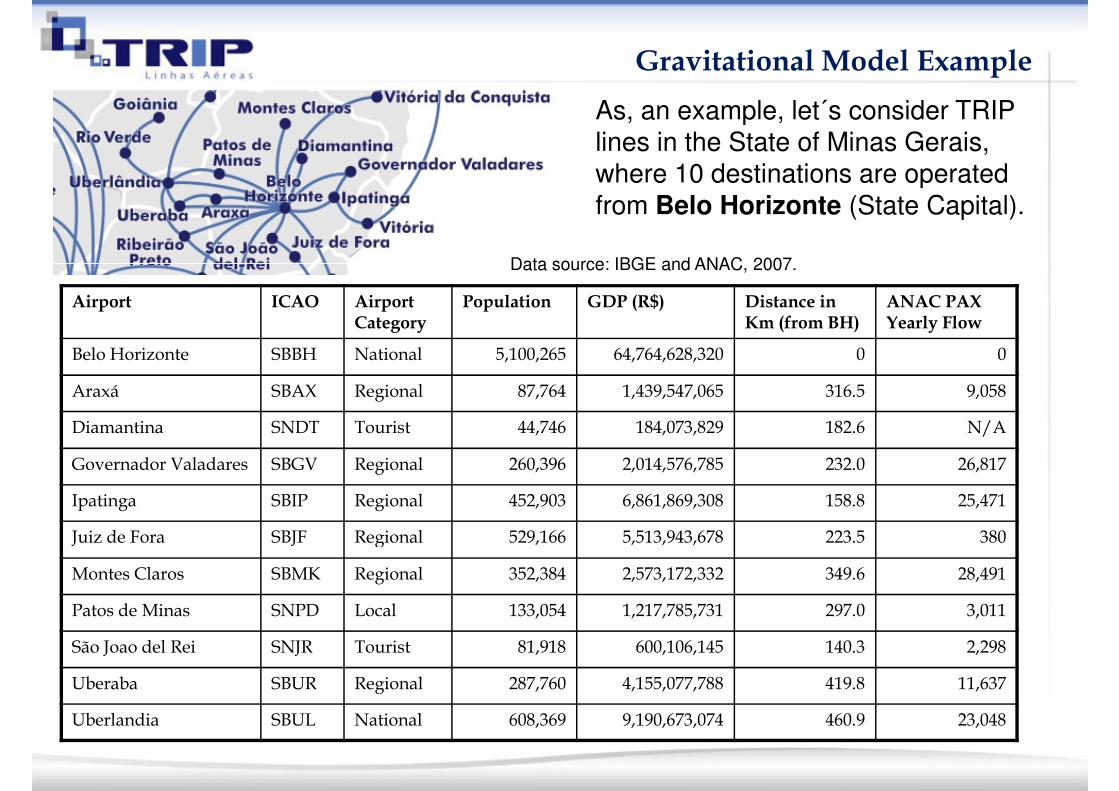
Gravitational Model Example
As, an example, let´s consider TRIP
lines in the State of Minas Gerais,
where 10 destinations are operated
from Belo Horizonte (State Capital).
Data source: IBGE and ANAC, 2007.
Airport ICAO Airport Category
Population GDP (R$) Distance in Km (from BH)
ANAC PAX Yearly Flow
Belo Horizonte SBBH National 5,100,265 64,764,628,320 0 0
Araxá SBAX Regional 87,764 1,439,547,065 316.5 9,058
Diamantina SNDT Tourist 44,746 184,073,829 182.6 N/A
Governador Valadares SBGV Regional 260,396 2,014,576,785 232.0 26,817
Ipatinga SBIP Regional 452,903 6,861,869,308 158.8 25,471
Juiz de Fora SBJF Regional 529,166 5,513,943,678 223.5 380
Data source: IBGE and ANAC, 2007.
Juiz de Fora SBJF Regional 529,166 5,513,943,678 223.5 380
Montes Claros SBMK Regional 352,384 2,573,172,332 349.6 28,491
Patos de Minas SNPD Local 133,054 1,217,785,731 297.0 3,011
São Joao del Rei SNJR Tourist 81,918 600,106,145 140.3 2,298
Uberaba SBUR Regional 287,760 4,155,077,788 419.8 11,637
Uberlandia SBUL National 608,369 9,190,673,074 460.9 23,048
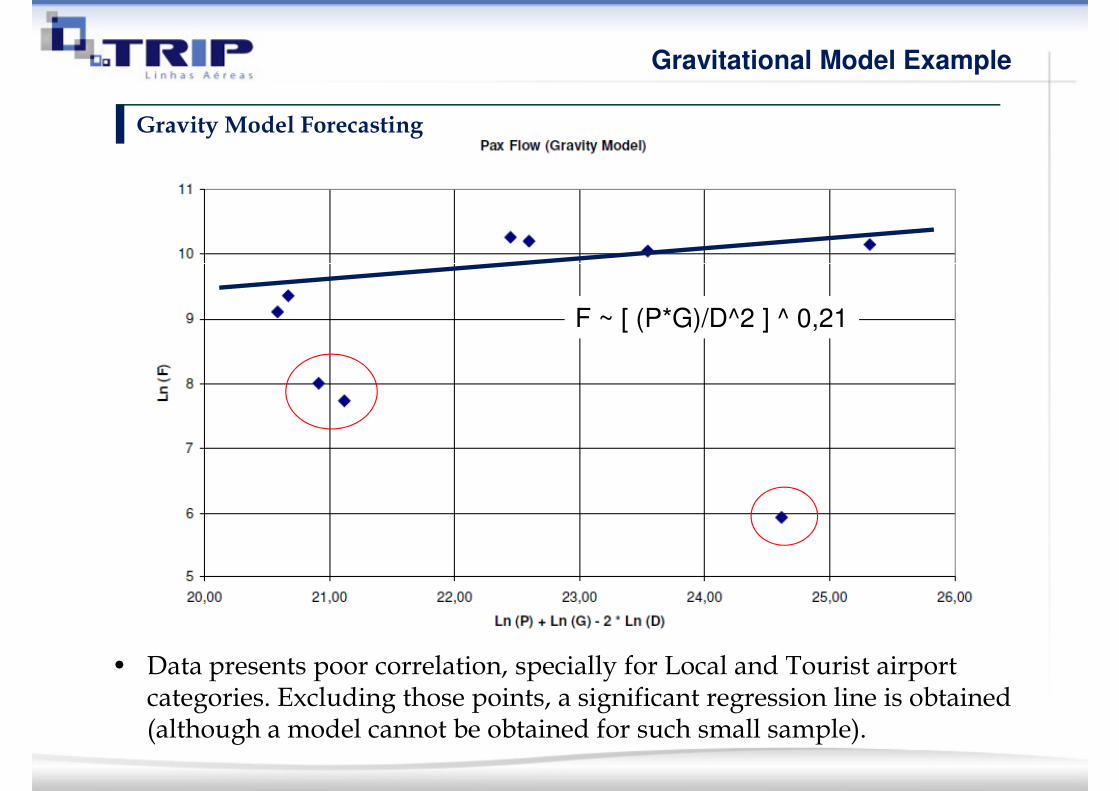
Gravity Model Forecasting
Gravitational Model Example
F ~ [ (P*G)/D^2 ] ^ 0,21
• Data presents poor correlation, specially for Local and Tourist airport categories. Excluding those points, a significant regression line is obtained (although a model cannot be obtained for such small sample).

Summing up
Major Challenges
• Challenges of demand forecasting for new destinations are:
� Lack of reliable and comprehensive air traffic flow data source for � Lack of reliable and comprehensive air traffic flow data source for model calibration, as MIDT is loosing participation and official statistics are not enough reliable and readily available;
� Immature regional air transport market, with significant contrasts among airport categories in destinations throughout the country. Some have no previous air transport history;
� Yet undetermined airport catchment areas; and
� Lack of reliable geo-economic data focused on transport demand forecasting.