trinity college · trinity college notes to consolidated financial statements june 30, 2018 and...
TRANSCRIPT
Trinity College Consolidated Financial Statements June 30, 2018 and 2017

Trinity College Index June 30, 2018 and 2017
Page(s)
Report of Independent Auditors ........................................................................................................... 1–2
Consolidated Financial Statements
Statements of Financial Position .................................................................................................................. 3
Statements of Activities ............................................................................................................................ 4–5
Statements of Cash Flows ........................................................................................................................... 6
Notes to Financial Statements ............................................................................................................... 7–29

PricewaterhouseCoopers LLP, 185 Asylum Street, Suite 2400, Hartford, CT 06103-3404 T: (860) 241 7000, F: (860) 241 7590, www.pwc.com/us
Report of Independent Auditors
To the Board of Trustees of Trinity College
We have audited the accompanying consolidated financial statements of Trinity College (the “College”),
which comprise the consolidated statement of financial position as of June 30, 2018 and 2017 and the
related consolidated statements of activities and of cash flows for the years then ended.
Management’s Responsibility for the Consolidated Financial Statements
Management is responsible for the preparation and fair presentation of the consolidated financial
statements in accordance with accounting principles generally accepted in the United States of America;
this includes the design, implementation and maintenance of internal control relevant to the preparation
and fair presentation of consolidated financial statements that are free from material misstatement,
whether due to fraud or error.
Auditors’ Responsibility
Our responsibility is to express an opinion on the consolidated financial statements based on our audits.
We conducted our audits in accordance with auditing standards generally accepted in the United States of
America. Those standards require that we plan and perform the audit to obtain reasonable assurance
about whether the consolidated financial statements are free from material misstatement.
An audit involves performing procedures to obtain audit evidence about the amounts and disclosures in
the consolidated financial statements. The procedures selected depend on our judgment, including the
assessment of the risks of material misstatement of the consolidated financial statements, whether due to
fraud or error. In making those risk assessments, we consider internal control relevant to the College’s
preparation and fair presentation of the consolidated financial statements in order to design audit
procedures that are appropriate in the circumstances, but not for the purpose of expressing an opinion on
the effectiveness of the College’s internal control. Accordingly, we express no such opinion. An audit also
includes evaluating the appropriateness of accounting policies used and the reasonableness of significant
accounting estimates made by management, as well as evaluating the overall presentation of the
consolidated financial statements. We believe that the audit evidence we have obtained is sufficient and
appropriate to provide a basis for our audit opinion.

2
Opinion
In our opinion, the consolidated financial statements referred to above present fairly, in all material
respects, the financial position of Trinity College as of June 30, 2018 and 2017, and the changes in its net
assets and its cash flows for the years then ended in accordance with accounting principles generally
accepted in the United States of America.
Hartford, Connecticut
October 22, 2018

Trinity College Consolidated Statements of Financial Position June 30, 2018 and 2017
The accompanying notes are an integral part of these consolidated financial statements.
3
2018 2017
Assets
Cash and cash equivalents 15,957,476$ 13,487,729$
Restricted cash 1,000,000 1,000,000
Short-term investments 3,544,099 4,406,748
Loan receivable 3,458,495 3,650,878
Receivables, net of allowance for doubtful accounts
of $427,000 and $492,448 1,927,326 1,577,374
Government grants receivable 612,580 752,765
Contributions receivable, net of allowance for doubtful
accounts of $1,013,867 and $1,859,310 16,248,455 19,579,262
Student loans receivable, net of allowance for doubtful
accounts of $958,000 and $820,000 5,138,315 5,604,381
Investments, at fair value 608,186,990 576,541,701
Funds held by bond trustee 12,024,777 17,910,437
Beneficial interest in funds held in trust by others 30,528,007 26,910,079
Other assets 2,980,429 561,497
Fixed assets, net of accumulated depreciation 265,881,679 269,479,217
Total assets 967,488,628$ 941,462,068$
Liabilities
Accounts payable and accrued expenses 18,659,789$ 18,861,311$
Government advances for student loans 2,212,596 2,815,852
Accrued postretirement benefits 4,984,575 5,430,073
Split interest obligations 5,298,377 5,337,982
Bonds and notes payable 141,882,240 147,156,719
Asset retirement obligation 30,475,866 29,077,802
Other liability - 335,048
Total liabilities 203,513,443 209,014,788
Net Assets
Unrestricted 120,194,346 112,209,870
Temporarily restricted 286,797,399 284,141,470
Permanently restricted 356,983,440 336,095,940
Total net assets 763,975,185 732,447,280
Total liabilities and net assets 967,488,628$ 941,462,068$

Trinity College Consolidated Statements of Activities Year Ended June 30, 2018 with Summarized Comparative Totals for 2017
The accompanying notes are an integral part of these consolidated financial statements.
4
2017
Temporarily Permanently
Unrestricted Restricted Restricted Total Total
Operating revenues and other net assets
Tuition and fees 122,330,162$ -$ -$ 122,330,162$ 119,224,982$
Room and board 22,989,176 - - 22,989,176 22,630,851
Less: Financial aid (51,895,049) - - (51,895,049) (47,336,226)
Net tuition and fees 93,424,289 - - 93,424,289 94,519,607
Federal and state grants 1,408,269 - - 1,408,269 2,686,598
Contributions 7,340,497 8,214,355 - 15,554,852 18,572,210
Endowment income distribution 446,092 25,997,721 - 26,443,813 25,439,688
Net gains on investments 246 45,372 - 45,618 42,841
Other investment income 819,287 83,847 - 903,134 448,067
Other operating income 3,994,935 292,427 - 4,287,362 4,021,370
Revenues of auxiliary enterprises 5,384,013 - - 5,384,013 5,667,001
Net assets released from restrictions 36,780,220 (36,780,220) - - -
Total operating revenues and other net assets 149,597,849 (2,146,498) - 147,451,351 151,397,382
Expenses
Instruction, research and related programs 61,236,469 - - 61,236,469 57,324,032
Academic support 21,070,338 - - 21,070,338 20,433,632
General institutional services 25,866,474 - - 25,866,474 24,203,574
Student services 15,747,721 - - 15,747,721 15,334,422
Auxiliary expenses 21,195,321 - - 21,195,321 21,930,660
Total expenses 145,116,323 - - 145,116,323 139,226,320
Other changes in net assets
Defeasance of CHEFA Series J - - - - (2,443,532)
Postretirement related changes other than
net periodic cost 553,915 - - 553,915 377,184
Operating and other fund transfers (1,454,796) 1,454,796 - - -
Transfers from endowment 1,777,695 12,235 - 1,789,930 -
Total other changes 876,814 1,467,031 - 2,343,845 (2,066,348)
Increase (decrease) in operating
and other net assets 5,358,340 (679,466) - 4,678,873 10,104,714
Endowment and similar net assets
Investment income 117,217 4,122,242 136,971 4,376,430 1,210,135
Net gains on investments 641,071 32,438,352 1,705,939 34,785,362 70,397,877
Endowment distributed for spending (446,092) (26,036,830) 39,109 (26,443,813) (25,439,688)
Investment management fees (43,604) (2,533,530) (28,252) (2,605,386) (3,999,384)
Other changes (535,732) (480,986) - (1,016,718) (1,072,924)
Net investment gain (loss) and amounts
distributed for spending (267,140) 7,509,248 1,853,767 9,095,875 41,096,016
Contributions 1,284,610 - 16,010,401 17,295,011 9,555,506
Change in value of split-interest agreements 28,529 63,410 2,156,137 2,248,076 3,824,072
Other endowment changes and transfers 3,357,833 (4,225,027) 867,195 -
Transfers to operating funds (1,777,696) (12,235) - (1,789,930) -
Other endowment changes 2,893,276 (4,173,852) 19,033,733 17,753,157 13,379,578
Increase in endowment
and similar net assets 2,626,136 3,335,396 20,887,500 26,849,032 54,475,594
Net assets
Beginning of year 112,209,870 284,141,470 336,095,940 732,447,280 667,866,971
Total increase in net assets 7,984,476 2,655,929 20,887,500 31,527,905 64,580,309
End of year 120,194,346$ 286,797,399$ 356,983,440$ 763,975,185$ 732,447,280$
2018

Trinity College Consolidated Statements of Activities Year Ended June 30, 2017
The accompanying notes are an integral part of these consolidated financial statements.
5
Temporarily Permanently
Unrestricted Restricted Restricted Total
Operating revenues and other net assets
Tuition and fees 119,224,982$ -$ -$ 119,224,982$
Room and board 22,630,851 - - 22,630,851
Less: Financial aid (47,336,226) - - (47,336,226)
Net tuition and fees 94,519,607 - - 94,519,607
Federal and state grants 2,686,598 - - 2,686,598
Contributions 6,634,113 11,938,096 - 18,572,210
Endowment income distribution 1,585,537 23,854,151 - 25,439,688
Net gain (loss) on investments (7,650) 50,491 - 42,841
Other investment income 378,036 70,031 - 448,067
Other operating income 3,807,193 214,178 - 4,021,370
Revenues of auxiliary enterprises 5,667,001 - - 5,667,001
Net assets released from restrictions 36,433,652 (36,433,652) - -
Total operating revenues and other net assets 151,704,087 (306,705) - 151,397,382
Expenses
Instruction, research and related programs 57,324,032 - - 57,324,032
Academic support 20,433,632 - - 20,433,632
General institutional services 24,203,574 - - 24,203,574
Student services 15,334,422 - - 15,334,422
Auxiliary expenses 21,930,660 - - 21,930,660
Total expenses 139,226,319 - - 139,226,319
Other changes in net assets
Defeasance of CHEFA Series K -
Defeasance of CHEFA Series J (2,443,532) - - (2,443,532)
Postretirement related changes other than
net periodic cost 377,184 - - 377,184
Operating and other fund transfers 1,206,199 (576,234) (629,965) -
Transfers from endowment - - - -
Total other changes (860,149) (576,234) (629,965) (2,066,348)
Increase (decrease) in operating
and other net assets 11,617,619 (882,940) (629,965) 10,104,715
Endowment and similar net assets
Investment income 47,246 1,029,626 133,264 1,210,135
Net gains (losses) on investments 285,900 69,417,204 694,773 70,397,877
Endowment distributed for spending (389,526) (25,083,903) 33,741 (25,439,688)
Investment management fees (5,467) (3,941,023) (52,895) (3,999,384)
Other changes (515,124) (557,801) - (1,072,924)
Net investment gain (loss) and amounts
distributed for spending (576,971) 40,864,103 808,883 41,096,015
Contributions 361,609 - 9,193,896 9,555,506
Change in value of split-interest agreements (27,429) 483,762 3,367,739 3,824,072
Other endowment changes and transfers 452,527 (8,276,549) 7,824,022 -
Transfers to operating funds - - - -
Other endowment changes 786,708 (7,792,787) 20,385,657 13,379,578
Increase in endowment
and similar net assets 209,737 33,071,316 21,194,540 54,475,594
Net assets
Beginning of year 100,382,514 251,953,093 315,531,364 667,866,971
Total increase in net assets 11,827,356 32,188,377 20,564,576 64,580,309
End of year 112,209,870$ 284,141,470$ 336,095,940$ 732,447,280$
2017

Trinity College Consolidated Statements of Cash Flows Years Ended June 30, 2018 and 2017
The accompanying notes are an integral part of these consolidated financial statements.
6
2018 2017
Cash flows from operating activities
Change in net assets 31,527,905$ 64,580,309$
Adjustments
Depreciation, amortization and accretion 15,383,503 15,087,525
Realized and unrealized gains on investments (33,824,713) (70,403,425)
Provision for student loans receivables 138,000 25,000
Provision for contributions receivable (845,443) 147,875
Contributions receivable discount (318,774) (520,634)
Donated securities (6,415,143) (6,076,416)
Proceeds from donated securities 6,095,292 1,873,905
Student loans written off 26,231 60,895
Contributions restricted for long-term investments, net (4,349,217) (10,159,099)
Post retirement related changes other than net periodic cost (553,915) (377,184)
Change in balances
Receivables and other assets 199,184 (497,945)
Contributions receivable 4,495,024 1,081,740
Accounts payable and other liabilities 2,142,957 (1,679,632)
Government advances for student loans (603,256) (389,163)
Accrued postretirement benefits 108,417 (613,451)
Total adjustments (18,321,853) (72,440,009)
Net cash provided by (from) operating activities 13,206,052 (7,859,700)
Cash flows from investing activities
Student loans granted (589,722) (714,194)
Student loans repaid 891,557 824,926
Purchase of fixed assets (12,754,178) (19,340,156)
Purchases of investments (987,216,637) (167,319,735)
Sales of investments 989,396,061 185,470,569
Change in short-term investments, net 862,649 453,718
Increase from bond proceeds deposited with trustee (3,477,397) (10,666,224)
Use of bond issuance proceeds deposited with trustee 9,363,057 17,382,152
Net cash provided by (from) investing activities (3,524,610) 6,091,056
Cash flows from financing activities
Contributions restricted for long-term investments, net 4,349,217 10,159,099
Proceeds restricted for long term purpose 319,851 273,855
Change in value of split-interest obligations (39,605) (78,799)
Change in the value of funds held in trust by others (3,617,928) (3,102,092)
Proceeds from bond issuance - 51,100,000
Change in interest rate SWAP valuation (2,970,548) (3,938,641)
Repayments of bonds and notes (5,392,939) (55,055,016)
Payments on bond issuance costs 140,257 (211,860)
Net cash from financing (7,211,695) (853,454)
Net (decrease) increase in cash and equivalents 2,469,747 (2,622,097)
Cash and cash equivalents
Beginning of year 13,487,729 16,109,826
End of year 15,957,476$ 13,487,729$
Noncash
Additions to fixed assets financed through accounts payable 624,019$ 2,968,499$
Contributed securities 6,415,143 6,076,416
Supplemental disclosure of cash flow information
Interest paid 3,575,660$ 5,245,915$

Trinity College Notes to Consolidated Financial Statements June 30, 2018 and 2017
7
1. Summary of Significant Accounting Policies
Nature of Organization
Trinity College (the “College”) is a private, not-for-profit institution of higher education located in
Hartford, Connecticut. The College also operates undergraduate programs internationally. The
College provides educational services primarily for students at the undergraduate and graduate
levels and performs some research under grants with agencies of the federal government and
other sponsoring organizations.
Basis of Presentation
The consolidated financial statements of Trinity College include the accounts of Trinity College and
its wholly owned subsidiary, the Barbieri Center, Inc.
The consolidated financial statements have been prepared on the accrual basis of accounting
under U.S. Generally Accepted Accounting Principles.
The consolidated financial statements are also prepared following the provisions of the American
Institute of Certified Public Accounts’ Audit and Accounting Guide “Not-for-Profits” Organization.
This guide requires the allocation of depreciation, operation and maintenance of plant and interest
expense to functional categories. It also requires tuition to be presented net of financial aid
discount.
The College follows the provisions of accounting guidance for revenue recognition for not-for-profit
entities for contributions received and contributions made and presentation of financial statements
of not-for-profit entities. Resources are reported for accounting purposes in separate classes of net
assets based on the existence or absence of donor-imposed restrictions. Brief definitions of the
three classes of net assets are presented below.
Unrestricted Net Assets
Net assets derived from tuition and other institutional resources that are not subject to donor-
imposed restrictions. Unrestricted net assets may be designated for specific purposes by action of
the board of trustees or may otherwise be limited by contractual agreements with outside parties.
Unrestricted net assets include investment in plant and the appreciation on funds functioning as
endowment.
Temporarily Restricted Net Assets
Net assets whose use is restricted by state law or subject to explicit donor-imposed restrictions on
the expenditure of contributions or income and gains on contributed assets. Temporary restrictions
may expire due to the passage of time or the incurrence of expenditures that fulfill the restrictions.
Temporarily restricted net assets include the appreciation on donor-restricted endowment funds.
Permanently Restricted Net Assets
Net assets that are subject to explicit donor-imposed restrictions that they be maintained
permanently by the College. Generally, the donors of these assets permit the College to use all or
part of the investment return on these assets.

Trinity College Notes to Consolidated Financial Statements June 30, 2018 and 2017
8
Revenues are reported as increases in unrestricted net assets unless use of the related assets is
limited by donor-imposed restrictions or by law. Expenses are reported as decreases in
unrestricted net assets. Gains and losses on investments and other assets or liabilities are
reported as increases or decreases in unrestricted net assets unless their use is restricted by
explicit donor stipulations or by law. Expirations of temporary restrictions on net assets either
because the donor-imposed purpose has been accomplished and/or the stipulated time period has
elapsed, are reported as reclassifications between the applicable classes of net assets.
Temporarily restricted revenues for which the restriction is met in the current period are reported as
unrestricted revenues.
Operations
The consolidated financial statements reflect all activities of the College, except those specifically
related to the endowment funds, as operations.
Fair Value Measurements
The College follows the accounting guidance for fair value measurements and disclosures that
defines fair value, establishes a framework for measuring fair value under generally accepted
accounting principles and enhances disclosures about fair value measurements. Fair value is
defined under this guidance as the exchange price that would be received for an asset or paid to
transfer a liability (an exit price) in the principal or most advantageous market for the asset or
liability in an orderly transaction between market participants on the measurement date.
This guidance also gives entities the option, at specific election dates, to measure certain financial
assets and liabilities at fair value. The College did not elect fair value accounting for any assets or
liabilities that are not currently required to be measured at fair value.
Accounting guidance for fair value measurements and disclosures establishes a hierarchy of
valuation inputs based on the extent to which the inputs are observable in the marketplace.
Observable inputs reflect market data obtained from sources independent of the reporting entity
and unobservable inputs reflect the entities own assumptions about how market participants would
value an asset or liability based on the best information available. Valuation techniques used to
measure fair value under this guidance must maximize the use of observable inputs and minimize
the use of unobservable inputs. The standard describes a fair value hierarchy based on three
levels of inputs, of which the first two are considered observable and the last unobservable, that
may be used to measure fair value.
The following describes the hierarchy of inputs used to measure fair value and the primary
valuation methodologies used by the College for its financial instruments measured at fair value on
a recurring basis. The three levels of inputs are as follows:
Level 1 Quoted prices in active markets for identical assets or liabilities.
Level 2 Inputs other than Level 1 that are observable, either directly or indirectly, such as
quoted prices for similar assets or liabilities; quoted prices in markets that are not
active; or other inputs that are observable or can be corroborated by observable
market data for substantially the same type of assets or liabilities.
Level 3 Unobservable inputs that are supported by little or no market activity and that are
significant to the fair value of the assets or liabilities.

Trinity College Notes to Consolidated Financial Statements June 30, 2018 and 2017
9
A financial instrument’s categorization within the valuation hierarchy is based upon the lowest level
of input that is significant to the fair value measurement.
The College follows guidance related to the fair value measurements and disclosures standard for
estimating the fair value of investments in investment companies (limited partnerships) that have a
calculated value of their capital account or net asset value (NAV) in accordance with, or in a
manner consistent with generally accepted accounting principles (GAAP). As a practical
expedient, the College is permitted under GAAP to estimate the fair value of an investment at the
measurement date using the reported NAV without further adjustment unless the College expects
to sell the investment at a value other than NAV or if the NAV is not calculated in accordance with
GAAP. The College’s investments in private equity, real estate and hedge funds are fair valued
based on the most current NAV received, which is June 30.
The College performs additional procedures including due diligence reviews on its investments in
investment companies and other procedures with respect to the capital account or NAV provided to
ensure conformity with GAAP. The College has assessed factors including, but not limited to,
managers compliance with fair value measurements and disclosure standards, price transparency
and valuation procedures in place, the ability to redeem at NAV at the measurement date, and
existence of certain redemption restrictions at the measurement date.
Cash and Cash Equivalents
Cash and cash equivalents include U.S. Treasury notes, money market funds and similar
temporary investments with original maturities of three months or less. Included in these amounts
are cash received for capital campaign and endowment contributions awaiting further disposition.
Cash and cash equivalents awaiting investment in the endowment are reported as investments
totaling $167,503,852 and $23,318,291 at June 30, 2018 and 2017, respectively.
The College maintains checking accounts which principally consist of cash and at times are in
excess of the financial institution’s insurance limits. The College invests available cash with high
credit quality institutions. It is the College’s policy to monitor the financial strength of these
institutions on an ongoing basis.
Restricted Cash
The amount presented as Restricted Cash represents the amount required to be maintained on
deposit with a lending institution pursuant to the Series N financing and interest rate swap
agreement described in Note 8.
Short-Term Investments
Short-term investments include certificates of deposit, bonds, and other investments with original
maturities of greater than three months but which are highly liquid and are used for operating
purposes.
Contributions
Contributions, including unconditional promises to give, are recognized as revenues in the period
the promise is made. Donor restricted contributions whose restrictions are not satisfied in the year
received are reflected in temporarily restricted net assets when received and released from
restriction when the related expense is incurred. Contributions of assets other than cash are
recorded at their estimated fair value.
Trinity College Notes to Consolidated Financial Statements June 30, 2018 and 2017
10
Unconditional promises to give that are expected to be collected within one year are recorded at
net realizable value. Unconditional promises to give that are expected to be collected in future
years are recorded at the present value of estimated future cash flows. The discounts on those
amounts are computed using risk-adjusted rates applicable to the years in which the promises are
received. Amortization of the discount is included in contribution revenue. Conditional promises to
give are not included as support until the conditions are met. As of June 30, 2018, the College did
not have any conditional promises to give.
All contributions are considered to be available for unrestricted use unless specifically restricted by
the donor. Amounts received that are designated for future periods or restricted by the donor for
specific purposes are reported as temporarily restricted or permanently restricted. Contributions
received that are awaiting designation by the donor are reported as temporarily restricted net
assets.
Credit Losses
The College records an allowance for doubtful accounts (credit losses) for long term receivables
including Perkins loans and other student loans. Management regularly assesses the adequacy of
the allowance for credit losses by performing ongoing evaluations of the student loan portfolio,
including differing economic risks associated with each loan category, the financial condition of
specific borrowers, the economic environment, the level of delinquent loans, review of the default
rate by category in comparison to prior years, the value of any collateral and, where, applicable, the
existence of any guarantees or indemnifications. The level of the allowance is adjusted based on
actual results. The College’s Perkins loans receivable represents the amounts due from current
and former students under the Federal Perkins Loan Program. Loans disbursed under the Federal
Perkins Loan Program are able to be assigned to the Federal Government in certain non-
repayment situations. In these situations the Federal portion of the loan balance is guaranteed.
Management believes that the allowance for credit losses at June 30, 2018 and 2017 is adequate
to absorb credit losses inherent in the portfolio as of that date.
Investments
Investments are recorded at fair value. The value of publicly-traded fixed income and equity
securities is based upon quoted market prices. Private equities and certain other nonmarketable
securities are valued using current information obtained from the general partner or investment
manager for the respective funds. Fair values for investments held through certain limited
partnerships are estimated by the respective external investment managers if market values are
not readily ascertainable. Purchased investments are initially recorded at cost as of the trade date
and donated investments at fair market value at the date of receipt. Gains or losses that result
from market fluctuations are recognized in the period in which the fluctuations occur.
The College holds interests in certain limited partnerships which invest in securities at the sole
discretion of the general partners. The partnerships hold, among other investments, debt and/or
equity securities of troubled or restructured companies. These partnerships may also enter into
transactions in financial futures, foreign exchange options, forward currency contracts (which are
used for hedging and nonhedging purposes), securities purchased under agreements to resell, and
securities sold under agreements to repurchase.
The College owns certain pieces of real estate which are recorded at fair value. Fair values of
these properties are evaluated annually by the College by obtaining property appraisals from local
independent appraisers.
The College records futures contracts at fair value based on the most recent available closing
quotations on the applicable exchange.

Trinity College Notes to Consolidated Financial Statements June 30, 2018 and 2017
11
Split-Interest Agreements and Beneficial Interest in Funds Held in Trust by Others The College’s split-interest agreements with donors consist primarily of charitable gift annuities, pooled life income funds, and irrevocable charitable remainder trusts. These agreements are created when a donor contributes assets to a non-profit organization and the organization is not the only beneficiary of the assets donated. All of the College’s split interest agreements stipulate that the donor, or designee will receive a fixed payment every year for either a fixed number of years or for the remaining life of the donor, or designee. Those for which the College serves as trustee are recorded in the investments line item of the Statement of Financial Position of the College. Assets are invested and payments are made to donors and/or other beneficiaries in accordance with the respective trust agreements. Fund values were $8,303,279 and $8,196,334 which includes $482,676 and $471,380 in distributions to designated beneficiaries for fiscal years 2018 and 2017 respectively. Trust termination proceeds of $55,422 and $202,263 were distributed to the College in 2018 and 2017 respectively.
The College is also the beneficiary of a number of charitable remainder trusts and perpetual trust for which unrelated third parties serve as trustees, which are recorded as beneficial interests in funds held in trust by others. During fiscal year 2018, $11,075,984 was transferred out of the charitable remainder trusts and perpetual trusts. These transfers to the College were due to the death of the beneficiaries and the clarification of the purpose of the ultimate remainder trust assets.
Contribution revenues for irrevocable charitable gift annuities and charitable remainder trusts are
recognized at fair value at the dates the agreements are established after recording liabilities for
the present value of the estimated future payments to be made to the respective donors and/or
other beneficiaries. For pooled income funds, contribution revenue is recognized upon
establishment of the agreement at the fair value of the estimated future receipts, discounted for the
estimated time period to complete the agreement. Discount rates used to calculate the present
value of split interest agreements range from approximately 2.5% to 9.0%. Contribution revenue
for perpetual trusts is recognized at the time the College is informed of the trust and has sufficient
information to record the assets and liability.
The College is aware of certain split interest arrangements in which it has been named as
beneficiary. The College has adopted a policy that until such amounts are estimable and under its
control, these amounts are not recognized in the financial statements.
Other Assets
Other assets consists of prepaid expenses and inventories which are categorized as such within
other assets in the financial statements.
Fixed Assets
Fixed assets are comprised primarily of land and land improvements buildings, equipment and
capitalized software costs, which are recorded at cost or fair market value for gifts, less
accumulated depreciation. Depreciation is computed on a straight-line basis over the estimated
useful lives of buildings (20-40 years), land improvements (30 years), equipment (5-10 years), and
capitalized software costs (5 years). The College capitalizes interest on borrowed funds during
construction periods. Capitalized interest is charged to land improvements and building accounts
and amortized over the lives of the related assets. The cost and related accumulated depreciation
of fixed assets are removed from the records at the time of disposal.
Collections
Library and art collections are included in fixed assets if the fair value can be readily determined.
Contributed collection items are not reflected in the financial statements unless a fair value can be

Trinity College Notes to Consolidated Financial Statements June 30, 2018 and 2017
12
readily determined. Proceeds from the sale of unrecorded collection items or insurance recoveries
are reflected as increases in the appropriate net asset class.
Asset Retirement Obligations
An asset retirement obligation (ARO) is a legal obligation associated with the retirement of
long-lived assets. These liabilities are initially recorded at fair value and the related asset
retirement costs are capitalized by increasing the carrying amount of the related assets by the
same amount as the liability. Asset retirement costs are subsequently depreciated over the useful
lives of the related assets. Subsequent to initial recognition, the College records period-to-period
changes in the ARO liability resulting from the passage of time and changes to either the timing or
the amount of the original estimate of undiscounted cash flows. The College derecognizes ARO
liabilities when the related obligations are settled.
Tax Status
The College has a letter of exemption from federal income tax from the Internal Revenue Service
under Section 501(c)(3) of the Internal Revenue Code and therefore has incurred no income tax
expense related to the activities of the College.
Use of Estimates
The preparation of financial statements in conformity with accounting principles generally accepted
in the United States of America requires management to make estimates and judgments that affect
the reported amounts of assets and liabilities and disclosures of contingencies at the date of the
financial statements and revenues and expenses recognized during the reporting period. Actual
results could differ from those estimates. Significant estimates include the valuation of certain
investments, collectability of gifts, contributions receivable, student loans receivable and accounts
receivable, estimated useful lives of fixed assets, the assumptions used in calculating of the
postretirement benefit plan, and asset retirement obligations.
Risks and Uncertainties
Investments are exposed to various risks, such as interest rate, market and credit risks. Due to the
level of risk associated with such investments, it is at least reasonably possible that changes in
values of such investments will occur in the near term and that such changes could materially
affect the amounts reported in the financial statements.
Recent Accounting Pronouncements
In May 2014, the Financial Accounting Standards Board (FASB) issued Accounting Standards
Update (ASU) No. 2014- 09, “Revenue from Contracts with Customers (Topic 606)”. Under the
new guidance, recognition of revenue from customer contracts is a principles-based framework.
ASU No. 2014-09 is effective for the fiscal year ended June 30, 2019; the College is still evaluating
the impact this adoption will have on the Consolidated Financial Statements.
In February 2016, the FASB issued ASU No. 2016-02, “Leases (Topic 842)” to increase
transparency and comparability among organizations by recognizing lease assets and lease
liabilities on the balance sheet and disclosing key information about leasing arrangements.
ASU No. 2016-02 is effective for the fiscal year ended June 30, 2020; the College is still evaluating
the impact this adoption will have on the Consolidated Financial Statements.
In August 2016, the FASB issued ASU No. 2016-14, “Presentation of Financial Statements for Not-
for-Profit Entities”. Under the new guidance, the existing three-category classification of net assets
will be collapsed into two categories: with donor restrictions and without donor restrictions.
Endowments that have a current fair value that is less than the original gift amount (underwater)
Trinity College Notes to Consolidated Financial Statements June 30, 2018 and 2017
13
will be classified in net assets with donor restrictions and expanded disclosures will be required.
Additional requirements include disclosure of board-designated net assets, expanded reporting to
present expenses by function and natural classification and eliminating the disclosure of investment
expenses that are netted against investment returns. ASU No. 2016-14 is effective for the fiscal
year ended June 30, 2019; the College is still evaluating the impact this adoption will have on the
Consolidated Financial Statements.
ASU 2018-08: “Clarifying the Scope and Accounting Guidance for Contributions Received and
Contributions Made” In June 2018 the FASB issued ASU 2018-08, that aims to assist entities in (1)
evaluating whether transactions should be accounted for as contributions or exchange transactions
and (2) determining whether a contribution is conditional. The guidance is applicable for the
College’s fiscal 2019 and will be implemented simultaneously with ASC 606. The College will apply
the new standard on a modified prospective basis. The College is currently assessing the impact
on its consolidated financial statements.

Trinity College Notes to Consolidated Financial Statements June 30, 2018 and 2017
14
2. Investments
Investments at June 30, 2018 and 2017 consist of:
2018 2017
Endowment funds
Short-term investments 430,646,089$ 28,774,541$
Fixed income 3,110,848 18,931,218
Domestic equity 7,557,460 8,125,212
Private equity 149,685,469 135,838,139
Real estate 6,517,810 9,162,015
Hedge funds/absolute return
Domestic equities 9,702,378 146,930,708
Private equities 374,511 443,558
Global equities - 151,716,622
Other - 76,064,990
607,594,565 575,987,002
Other funds
Domestic and global equities 383,552 345,826
Real estate 208,873 208,873
592,425 554,699
Total investments 608,186,990$ 576,541,701$
Market Value
At June 30, 2018, the College is obligated to fund $83,612,616 for future additional contributions to
certain limited partnerships. This obligation will be funded by the reallocation of investments future
earnings, new contributions or available cash.
A summary of the College’s investment return is presented below:
2018 2017
Endowment and other long-term investments
Investment income 4,376,430$ 1,210,135$
Net realized and unrealized gains, net of
investment management fees and other costs 32,179,977 66,398,493
Return on endowment and other
long-term investments 36,556,407 67,608,628
Operating investments
Investment income 903,134 448,067
Net realized and unrealized gains 45,618 42,841
Return on operating investments 948,752 490,908
Total return on investments 37,505,159$ 68,099,536$

Trinity College Notes to Consolidated Financial Statements June 30, 2018 and 2017
15
The following table presents the financial instruments carried at fair value as of June 30, 2018 and
2017, by caption on the statements of financial position by the fair value measurements and
disclosures valuation hierarchy defined in Note 1.
Quoted Significant
Prices Other Significant
in Active Observable Unobservable
Markets Inputs Inputs Total
(Level 1) (Level 2) (Level 3) NAV Fair Value
Assets
Short term investments 430,646,089$ -$ -$ -$ 430,646,089$
Fixed income 3,110,848 - - - 3,110,848
Domestic and global equities 4,430,745 - - 3,510,267 7,941,012
Private equity - - - 149,685,469 149,685,469
Real estate 1,162,859 - 2,992,000 2,452,572 6,607,431
Hedge funds/absolute return - - - 10,076,889 10,076,889
Other - - 119,252 - 119,252
Total investments 439,350,541 - 3,111,252 165,725,197 608,186,990
Beneficial interests held by 3rd parties - - 1,663,715 - 1,663,715
Perpetual trusts held by 3rd parties - - 28,864,292 - 28,864,292
Total assets at fair value 439,350,541$ -$ 33,639,259$ 165,725,197$ 638,714,997$
2018
Quoted Significant
Prices Other Significant
in Active Observable Unobservable
Markets Inputs Inputs Total
(Level 1) (Level 2) (Level 3) NAV Fair Value
Assets
Short term investments 28,774,541$ -$ -$ -$ 28,774,541$
Fixed income 18,931,218 - - - 18,931,218
Domestic and global equities 6,293,112 - - 2,177,926 8,471,038
Private equity - - - 135,838,139 135,838,139
Real estate 1,099,579 - 5,475,000 2,605,057 9,179,636
Hedge funds/absolute return - - - 375,155,878 375,155,878
Other - - 191,252 - 191,252
Total investments 55,098,449 - 5,666,252 515,777,000 576,541,701
Beneficial interests held by 3rd parties - - 11,658,833 - 11,658,833
Perpetual trusts held by 3rd parties - - 15,251,246 - 15,251,246
Total assets at fair value 55,098,449$ -$ 32,576,331$ 515,777,000$ 603,451,780$
2017
Following is a description of the College’s valuation methodologies for assets and liabilities
measured at fair value.
Fair value for Level 1 is based on quoted prices in active markets that the College has the ability to
access for identical assets and liabilities. Market price data is generally obtained from exchange or
dealer markets. The College does not adjust the quoted price for such assets and liabilities.
Fair value for Level 2 is based on quoted prices for similar instruments in active markets, quoted
prices for identical or similar instruments in markets that are not active, and model-based valuation
techniques for which all significant assumptions are observable in the market or can be
corroborated by observable market data. Inputs are obtained from various sources including
market participants, dealers, and brokers.

Trinity College Notes to Consolidated Financial Statements June 30, 2018 and 2017
16
Fair value for Level 3, is based on valuation techniques that use significant inputs that are
unobservable as they trade infrequently or not at all.
Net asset values provided by third-parties have been utilized in determining fair value where there
are significant unobservable inputs related to Level 3 assets. Investment managers utilize outside
pricing services and administrators as well as their own internal valuation models in determining
and verifying fair values. The College performs ongoing due diligence with the investment
managers that include evaluation of manager operations and valuation procedures, site visits,
investor calls, review of manager filings and audited financial statements among other items. The
College’s Investment Committee and the Board of Trustees monitors performance of the
investment managers and meets formally with the managers on a periodic basis in addition to the
ongoing due diligence performed by College investment staff.
There were no material transfers between any levels during the year ended June 30, 2018.
Investments included in Level 3 and Net Asset Value (NAV) primarily consist of the College’s
ownership in alternative investments (principally limited partnership interests in hedge, private
equity, real estate, and other similar funds). The value of certain alternative investments
represents the ownership interest in the net assets of the respective partnership. Approximately
73% of investments held by the partnerships consists of marketable securities and approximately
27% are securities that do not have readily determinable fair values. The fair values of the
securities held by limited partnerships that do not have readily determinable fair values are
determined by the general partner and are based on appraisals market comparable calculations,
income approaches such as discounted cash flows, or other estimates that require varying degrees
of judgment. If no public market exists for the investment securities, the fair value is determined by
the general partner taking into consideration various data points, including the cost of the
securities, prices of recent significant placements of securities of the same issuer, and subsequent
developments concerning the companies to which the securities relate. The College and its
investment advisor have performed due diligence around these investments to ensure NAV is an
appropriate measure of fair value as of June 30, 2018 and 2017.
Beneficial and perpetual trusts held by 3rd parties are valued at the present value of the future
distributions expected to be received over the term of the agreements.
The methods described above may produce a fair value calculation that may not be indicative of
net realizable value or reflective of future fair values. Furthermore, while the College believes its
valuation methods are appropriate and consistent with other market participants, the use of
different methodologies or assumptions to determine the fair value of certain financial instruments
could result in a different estimate of fair value at the reporting date.
The following table is a rollforward of the statements of financial position amounts for financial
instruments classified by the College within Level 3 of the fair value hierarchy defined above:
Total
Real Estate Other Investments
Fair value at June 30, 2017 5,475,000$ 191,252$ 5,666,252$
Realized and unrealized gains 45,000 - 45,000
Net purchases, sales, settlements (2,600,000) - (2,600,000)
Fair value at June 30, 2018 2,920,000$ 191,252$ 3,111,252$

Trinity College Notes to Consolidated Financial Statements June 30, 2018 and 2017
17
Beneficial Perpetual
Interests Trusts
Held by Held by
3rd Party 3rd Party
Fair value at June 30, 2017 11,658,833$ 15,251,246$
Realized and unrealized gains 58,630 2,149,842
Net purchases, sales, settlements - 11,463,204
Transfers out (10,053,748) -
Fair value at June 30, 2018 1,663,715$ 28,864,292$
Accumulated unrealized gains for assets classified within Level 3 as of June 30, 2018 and June 30,
2017 are $578,075 and $589,075, respectively.
The information provided in the table below has been disaggregated based upon sub-strategy of
the investments. Available redemption data and uncalled commitments are listed as follows:
Inside/ Redemption
Unfunded Outside of Frequency Redemption
Category Fair Value Commitments Lockup Lockup (if Eligible) Notice
Hedge funds/absolute return
Long/short 374,511$ -$ None N/A Monthly–Quarterly 10–120 Days
Fixed income strategies 9,702,378 - 36 months rolling Inside Every 2 years 90 Days
Multi-strategy - - None N/A Quarterly 90 Days
Total hedge funds 10,076,889 -
Private equity
Fund of funds 145,890,387 77,810,092 None N/A N/A– Annual None–180
Buyout 3,714,143 4,106,640 None N/A N/A None
Venture capital 17,712 - None N/A N/A None
Fixed income 63,227 492,934 None N/A N/A None
Total private equity 149,685,469 82,409,666
Real estate
Real estate 6,535,431 1,202,950 None N/A N/A None
Total real estate 6,535,431 1,202,950
166,297,789$ 83,612,616$

Trinity College Notes to Consolidated Financial Statements June 30, 2018 and 2017
18
Derivatives Contracts
The College enters into derivative instruments such as futures for trading purposes. The College
uses this strategy to provide short term exposure to the market in a cash efficient manner. These
products are not linked to specific assets and liabilities that appear on the balance sheet or to a
forecasted transaction and, therefore, do not qualify for hedge accounting. The College is required
to disclose derivative and hedging activities and thereby improve the transparency of financial
reporting. The following table shows the fair value amounts of derivatives held by the College at
June 30:
Consolidated
Statements of
Financial 2018 2017
Derivatives Not Designated as Hedging Instruments Position Fair Value Fair Value
Index futures contracts Investments, -$ (2,520)$
at fair value
As of June 30, 2018 and 2017 there were 0 and 33 futures contracts open respectively. The
volume of futures is based on the quarterly number of contracts held during the year. For the year
ended June 30, 2018 and 2017 the average number of contracts for futures was 15 and 35,
respectively.
The following table shows the net gains and losses on derivatives held by the College for the years
ended June 30:
Net Realized Net Realized
or Net Change or Net Change
Derivatives Not Designated as Consolidated Statements in Unrealized in Unrealized
Hedging Instruments of Activities Location Gain (Loss) Gain (Loss)
2018 2017
Net realized gain
Index futures contracts Net gains on investments 282,372$ 723,982$
Net change in unrealized gains and losses
Index futures contracts Net gains (losses) on investments 2,520$ (15,842)$
3. Endowment Funds
Principal balances at June 30 were as follows:
2018 2017
Endowment funds held by Trinity 585,918,047$ 562,124,627$
Funds held in trust by others 28,864,292 15,251,246
Pledges outstanding 6,408,547 7,123,521
621,190,886$ 584,499,394$
Fair Value

Trinity College Notes to Consolidated Financial Statements June 30, 2018 and 2017
19
The College’s endowment consists of over 1,000 individual funds established for a variety of
purposes. The endowment includes both donor-restricted endowment funds and funds designated
by the Board of Trustees or management to function as endowment. As required by generally
accepted accounting principles (GAAP), net assets associated with endowment funds, including
funds functioning as endowment, are classified and reported based on the existence or absence of
donor-imposed restrictions.
Temporarily restricted endowment net assets include accumulated appreciation on donor-restricted
endowment funds, as well as donor-restricted, spendable gifts designated by the Board or
management for long-term support of the College. Permanently restricted endowment net assets
include those funds designated by donors to be invested in perpetuity to provide a permanent
source of income.
The College follows the accounting guidance for Presentation of Financial statements of Not-For-
Profit-Entities, which requires net asset classification of funds subject to an enacted version of the
Uniform Prudent Management of Institutional Funds Act (UPMIFA) and enhanced disclosures for
all endowment funds, which establishes guidance on the net asset classification of donor-restricted
endowment funds for organizations subject to an enacted Uniform Prudent Management of
Institutional Funds Act. The accounting guidance requires not-for-profit entities subject to an
enacted version of UPMIFA to classify the portion of the endowment fund that is not classified as
permanently restricted net assets as temporarily restricted net assets (time restricted) until
appropriated for expenditure by the organization.
Interpretation of Relevant Law
The trustees of the College interpret the Uniform Prudent Management of Institutional Funds Act of
the State of Connecticut, as requiring the preservation of the fair value of the original gift as of the
gift date of the donor-restricted endowment funds, absent explicit donor stipulation to the contrary.
As a result of this interpretation, the College classifies as permanently restricted net assets
(a) the original value of gifts donated to the permanent endowment, (b) the original value of
subsequent gifts to the permanent endowment, and (c) accumulations to the permanent
endowment made in accordance with the direction of the applicable donor gift instrument at the
time the accumulation is added to the fund. The remaining portion of the donor-restricted
endowment fund that is not classified in permanently restricted net assets is classified as
temporarily restricted net assets until those amounts are appropriated for expenditure in a manner
consistent with the standard of prudence prescribed by UPMIFA. In accordance with UPMIFA, the
College considers the following factors in making a determination to appropriate or accumulate
donor-restricted endowment funds:
The duration and preservation of the fund
The purpose of the College and the donor-restricted endowment fund
General economic conditions
The possible effect of inflation and deflation
The expected total return from income and the appreciation of investments
Other resources of the College
The investment policies of the College

Trinity College Notes to Consolidated Financial Statements June 30, 2018 and 2017
20
Funds With Deficiencies
From time to time, the fair value of assets associated with individual donor-restricted endowment
funds may fall below the level the donor or UPMIFA requires the College to retain as a fund of
perpetual duration. These deficiencies would be the result of unfavorable market fluctuations that
occur after the investment of new permanently restricted contributions and appropriation for certain
programs that are deemed prudent by the Board of Trustees. There were deficiencies of this
nature of $250,185 and $1,197,991 in fiscal 2018 and 2017, respectively.
In accordance with the terms of donor gift instruments, the College is permitted to reduce the
balance of several restricted endowments below the original amount of the gift. Subsequent
investment gains are then used to restore the balance up to the fair market value of the original
amount of the gift. Subsequent gains above that amount are recorded to temporarily restricted net
assets.
Endowment Net Asset Composition by Type of Fund as of June 30, 2018.
Temporarily Permanently
Unrestricted Restricted Restricted
Endowment Endowment Endowment Total
Donor-restricted endowment funds -$ 238,397,662$ 349,971,101$ 588,368,763$
Funds functioning as endowment funds 9,321,676 18,856,779 4,643,668 32,822,123
Total funds 9,321,676$ 257,254,441$ 354,614,769$ 621,190,886$
Temporarily Permanently Year to Date
Unrestricted Restricted Restricted as of
Endowment Endowment Endowment June 30
Beginning balance June 30, 2017 6,721,012$ 252,777,721$ 325,000,661$ 584,499,394$
Investment Income and loss, net of fees 26,374 1,545,874 (28,252) 1,543,996
Net appreciation (realized and unrealized) 545,378 31,855,920 3,157,143 35,558,441
Total investment return 571,752 33,401,794 3,128,891 37,102,437
Contributions 1,284,610 - 15,856,783 17,141,393
Appropriation of endowment assets
for expenditure (446,092) (26,036,830) 39,109 (26,443,813)
Other changes, transfers, and
releases from restriction 1,190,394 (2,888,244) 10,589,325 8,891,475
Net assets as of June 30, 2018 9,321,676$ 257,254,441$ 354,614,769$ 621,190,886$
Endowment Net Asset Composition by Type of Fund as of June 30, 2017.
Temporarily Permanently
Unrestricted Restricted Restricted
Endowment Endowment Endowment Total
Donor-restricted endowment funds -$ 232,393,132$ 320,307,915$ 552,701,047$
Funds functioning as endowment funds 6,721,012 20,384,589 4,692,746 31,798,347
Total funds 6,721,012$ 252,777,721$ 325,000,661$ 584,499,394$

Trinity College Notes to Consolidated Financial Statements June 30, 2018 and 2017
21
Temporarily Permanently Year to Date
Unrestricted Restricted Restricted as of
Endowment Endowment Endowment June 30
Beginning balance June 30, 2016 6,579,351$ 212,876,785$ 312,888,350$ 532,344,486$
Investment Income, net of fees (4,303) (3,024,300) (52,895) (3,081,498)
Net appreciation (realized and unrealized) 101,604 69,403,231 1,902,643 71,407,478
Total investment return 97,301 66,378,931 1,849,748 68,325,980
Contributions 351,713 - 9,163,515 9,515,228
Appropriation of endowment assets
for expenditure (389,526) (25,083,903) 33,741 (25,439,688)
Other changes, transfers, and
releases from restriction 82,173 (1,394,092) 1,065,307 (246,612)
Net assets as of June 30, 2017 6,721,012$ 252,777,721$ 325,000,661$ 584,499,394$
Subscribing to or disposing of units on the basis of the market value per unit at the beginning of the
monthly period within which the transactions take place. In addition, the College maintains
separately invested funds as stipulated by donors. Endowment income is distributed based on the
number of units subscribed to at the end of each month.
The College’s endowment spending policy was designed to stabilize annual spending levels and to
preserve the real value of the endowment portfolio over time. For the 2015 fiscal year the College
elected to change its spending policy from a percentage of actual value plus inflation, to a
percentage of the average market value excluding funds held in trust, for the calendar year trailing
twelve quarters. The spending rate approved by the board of trustees for 2018 and 2017 was 5%.
This resulted in approved spending of $28,491,034 and $27,115,054, which includes $26,443,813
and $25,439,688 appropriated for expenditure and $2,047,221 and $1,675,366 unspent in 2018
and 2017, respectively.
Other endowment changes in the statements of activities include transfers due to changes in donor
intent in the amount of $503,253 and $195,976 for the years ended June 30, 2018 and 2017,
respectively.
The following table sets forth activity in the pool at June 30:
2018 2017
Number of units for income allocation 23,296,304 22,322,668
Market value per unit 25.00$ 25.00$
Total return per unit 1.49 3.00
Total return distributed per unit 1.18 1.18
4. Contributions Receivable
Contributions receivable at June 30 consisted of unconditional promises to give (net of discount of
$1,726,709 and $2,045,483 and allowance of $1,013,867 and $1,859,310 for 2018 and 2017,
respectively), which are expected to be collected in the following periods:

Trinity College Notes to Consolidated Financial Statements June 30, 2018 and 2017
22
2018 2017
In one year or less 10,008,166$ 10,920,455$
Between one year and five years 5,893,127 8,257,150
In more than five years 347,162 401,657
16,248,455$ 19,579,262$
Discount rates used to calculate the present value of contributions receivable ranged from 2.46% to
6.09%.
5. Other Assets
Other assets at June 30 include:
2018 2017
Prepaid expenses 414,298$ 282,387$
Inventories 73,778 91,573
Other * 2,492,353 187,537
2,980,429$ 561,497$
*Other in Other Assets contains 2,300,452 in SWAP valuation as referred to in Note 8.
6. Fixed Assets
Land and land improvements, buildings and equipment, less accumulated depreciation at June 30,
are as follows:
2018 2017
Land and land improvements 49,020,662$ 48,754,246$
Buildings 417,141,679 401,584,304
Equipment 62,471,972 60,305,708
Construction-in-progress 2,869,037 10,449,393
531,503,350 521,093,651
Less: Accumulated depreciation (265,621,671) (251,614,434)
265,881,679$ 269,479,217$
Depreciation expense included in operating expense amounted to $14,339,474 and $13,544,625
for the years ended June 30, 2018 and 2017. The cost of the Trinity College main campus
purchased in 1873 consisting of 78 acres and smaller parcels purchased in subsequent years is
not included in the land total above. The historical cost of this land is not practical to estimate.
7. Asset Retirement Obligations
The College recalculates its asset retirement obligation annually, adjusting the liability to reflect
obligations incurred or settled in the current period, accretion expense, and changes in estimated
cash flows.

Trinity College Notes to Consolidated Financial Statements June 30, 2018 and 2017
23
The College recognized accretion on the asset retirement obligations net of abatement and other
changes of approximately $1,398,063 and $1,243,086 in 2018 and 2017. Accretion is reported as
an operating expense in the statements of activities.
8. Bonds and Notes Payable
The following is a summary of bonds and notes payable at June 30:
2018 2017
Connecticut Health and Educational Facilities Authority (CHEFA)
Series F bonds, issued 1998, interest rates ranging from 5.0% to 5.50%;
maturities to 2028; insured by Municipal Bond Insurance Authority (MBIA).
The trustee held a sinking fund reserve of $1,775,156 and $1,735,450
at June 30, 2018 and 2017 6,875,000$ 8,380,000$
Connecticut Health and Educational Facilities Authority (CHEFA)
Series L bonds, issued 2008, interest with an initial rate of 1.65%;
and a maximum rate of 12%; maturities to 2034. The trustee held a sinking fund
reserve of $556,914 and $563,211 at June 30, 2018 and 2017 10,910,000 11,465,000
Connecticut Health and Educational Facilities Authority (CHEFA)
Series M bonds, issued 2010, interest rates ranging from 2.0% to 5.0%;
maturities to 2028; not insured. These bonds were used to refinance
the callable portion of the Series F bonds. The trustee held a sinking fund
reserve of $446,862 and $443,146 at June 30, 2018 and 2017 16,870,000 16,960,000
Connecticut Health and Educational Facilities Authority (CHEFA)
Series N bonds, issued 2014, variable interest rate equal to 0.68 of one-month
LIBOR plus 85 bps; maturities to 2026; not insured. These bonds were used
to refund the Series H bonds. There is no sinking fund required
for this series as the College pays the purchaser directly. However, there is
a $1,000,000 compensating balance required by the purchaser. 15,336,320 17,214,236
Connecticut Health and Educational Facilities Authority (CHEFA)
Series O bonds, issued 2015, interest rate equal to 2.675%
maturities to 2037; not insured. These bonds were used
to refund the Series K bonds. There is no sinking fund required
for this series as the College pays the purchaser directly. 20,480,000 21,295,000
Connecticut Health and Educational Facilities Authority (CHEFA)
Series P bonds, issued 2015, variable interest rate equal to .65% of one-month
LIBOR plus 1.54%; maturities to 2025; not insured. These bonds were used
to finance capital projects around campus. No sinking fund reserve required
for this series as the College pays the purchaser directly. 21,691,308 22,241,331
Connecticut Health and Educational Facilities Authority (CHEFA)
Series Q bonds, issued April 2017, variable interest rate equal to .65% of one-month
LIBOR plus 1.87%; maturities to 2026; not insured. These bonds were used
to refund the Series J bonds. There is no sinking fund reserve required
for this series as the College pays the purchaser directly. 51,100,000 51,100,000
143,262,628 148,655,567
Bond issuance costs, net of accumulated amortization (1,529,126) (1,669,383)
Bond premium discount net of accumulated amortization 148,738 170,535
Total bonds and notes payable 141,882,240$ 147,156,719$

Trinity College Notes to Consolidated Financial Statements June 30, 2018 and 2017
24
Maturities of the above bonds and notes payable are as follows:
2018–2019 5,548,764$
2019–2020 5,620,871
2020–2021 5,779,778
2021–2022 5,934,019
2022–2023 6,088,602
Thereafter 114,290,595
The College has entered into an interest rate swap agreements for Series N, P and Q bonds used
to economically hedge the interest rate risk associated with certain of its variable rate debt. The
following summarizes the terms for the agreement as of June 30, 2018:
Counterparty A Counterparty B Counterparty C
Trade/effective date 11/26/2013 12/15/2015 4/26/2017
Initial notional amount 22,535,000$ 23,000,000$ 51,100,000$
Current notional amount 15,336,320 21,691,308 51,100,000
Termination date 7/1/2026 12/1/2025 4/1/2026
Fixed rate paid by college 2.670 % 2.39% 2.53%
Rate paid by counterparty .68 of one-month .65 of one-month .68 of one-month
LIBOR plus 85 bps LIBOR plus 154 bps LIBOR plus 187 bps
The gains that were recognized for interest rate swap agreements for series N, P, and Q for the
years ended June 30, 2018 and 2017 were $2,635,500 and $3,938,641 respectively, and have
been netted against interest expense on the consolidated statement of activities. The swap was in
an asset position of $2,300,452 and a liability position of $335,048 as of June 30, 2018 and June
30, 2017, respectively.
In April 2017, the College borrowed $51,100,000 in the form of CHEFA Revenue Bonds, Series Q.
The proceeds from the issue were used to refund the College’s borrowings under the CHEFA
Revenue Bonds, Series J. The proceeds were deposited in a refunding trust to refund the Series J
bonds, in the outstanding principal plus future interest amount of $49,805,000. Under the terms of
the refunding trust agreement, the College has not retained control over the trust assets or
responsibility for the refunded debt. As a result, the Series J bonds were defeased. The refunding
resulted in a redemption price of the Series J bonds and its carrying value in the amount of
$1,240,488 that has been recorded as a loss in the accompanying consolidated statement of
activities, which includes the unamortized debt issuance cost of $1,203,044.
In July 2008, the College entered into an irrevocable Letter of Credit and Reimbursement
Agreement (the Letter of Credit) in the amount of $15,345,000 with JPMorgan Chase Bank, N.A.,
which expires August 31, 2019. In the event that the College receives notice of any optional tender
on its Series L variable-rate demand bonds, or if these bonds become subject to mandatory tender,
the purchase price of the bonds will be paid from the remarketing of such bonds. However, if the
remarketing proceeds are insufficient, the College will be obligated to purchase the bonds tendered
by drawing on the Letter of Credit (LOC). Amounts borrowed under the Letter of Credit must be
repaid in full on the expiration date or, at the option of the College, may be converted to a three
year term loan with quarterly payments commencing in the third month following the conversion.
The term loan bears interest at the higher of the Federal Funds Effective Rate plus 3.5% or Prime

Trinity College Notes to Consolidated Financial Statements June 30, 2018 and 2017
25
Rate plus 3.0%. If the full amount of the bonds are put and the LOC is utilized, principal amounts
on the Series L bonds due over the next five years and thereafter would be $545,000, $540,000,
$570,000, $580,000 $590,000 and $8,085,000.
The College has a line of credit agreement with a national financial institution, which provides up to
$10 million. There was no balance outstanding at June 30, 2018 or 2017. Interest is assessed at
the higher of the bank’s prime rate or the one month LIBOR plus 250 basis points for borrowings
less than $500,000, and LIBOR plus 75 basis points for borrowings in excess of $500,000. There
is also a 40 basis point charge for the unused portion of the credit line, payable quarterly in arrears.
The College’s debt with CHEFA is uncollateralized. The College is subject to certain financial and
nonfinancial covenants and was in compliance with these covenants during 2017 and 2018.
9. Unrestricted Net Assets
Unrestricted net assets at June 30, 2018 and 2017 consist of the following:
2018 2017
Unrestricted endowment 9,321,676$ 6,721,011$
Investment in plant assets 98,094,381 95,756,693
Life income funds 736,515 711,043
Operating funds 12,041,774 9,021,123
Total unrestricted net assets 120,194,346$ 112,209,870$
10. Temporarily Restricted Net Assets
Temporarily restricted net assets at June 30, 2018 and 2017 are available for the following
purposes:
2018 2017
Plant additions/renovation 5,819,295$ 6,456,457$
Life income funds 1,720,663 2,861,987
Capital campaign 4,762 7,515
Endowment funds 257,254,441 252,777,721
Operating and restricted funds 18,211,250 18,645,968
Loan funds 3,786,988 3,391,822
Total temporarily restricted net assets 286,797,399$ 284,141,470$

Trinity College Notes to Consolidated Financial Statements June 30, 2018 and 2017
26
11. Permanently Restricted Net Assets
Permanently restricted net assets at June 30, 2018 and 2017 consist of the following:
2018 2017
Income restricted
Instruction funds 103,531,874$ 102,906,917$
Scholarship funds 110,412,123 106,018,028
Library 10,060,615 9,911,128
Chapel funds 3,474,500 3,445,603
Athletics 9,316,316 8,922,004
Prize funds 913,025 913,000
Other purposes 17,522,859 16,626,839
Unrestricted as to use of income 99,383,457 76,257,142
Total investments in perpetuity in endowment 354,614,769 325,000,661
Student loan funds -
Life income funds 2,368,671 11,095,279
Total permanently restricted net assets 356,983,440$ 336,095,940$
12. Net Assets Released From Restrictions
Net assets were released from donor restrictions during the periods ended June 30, 2018 and 2017 as a result of incurred expenses satisfying the restricted purposes or by the occurrence of other events specified by donors. Such assets were utilized to fund expenditures in the following categories:
2018 2017
Instruction and research 10,605,459$ 10,589,802$
Financial aid 8,599,875 6,970,903
Plant 1,288,012 4,922,934
General institutional 12,226,090 9,609,929
Student services 905,370 978,981
Academic support 3,155,414 3,361,103
Total net assets released from restrictions 36,780,220$ 36,433,652$
13. Employee Benefit Plans
The College participates in the Teacher s Insurance and Annuity Association (TIAA) and College Retirement Equities Fund (CREF) as a defined contribution retirement plan for most of its employees. Total benefits expense for the years ended June 30, 2018 and 2017 is $4,448,372 and $4,291,704. The College has no liability for any unfunded costs under this plan.
The College provides health insurance benefits for employees who were full-time employees with
at least ten years of service were 60 or older, and who retired by June 30, 2007. Retirees after
June 30, 2007 may participate in the plan; however they must pay the full costs. The College also
provides life insurance benefits for retired employees who were full-time employees as of
December 1, 1977.
Trinity College Notes to Consolidated Financial Statements June 30, 2018 and 2017
27
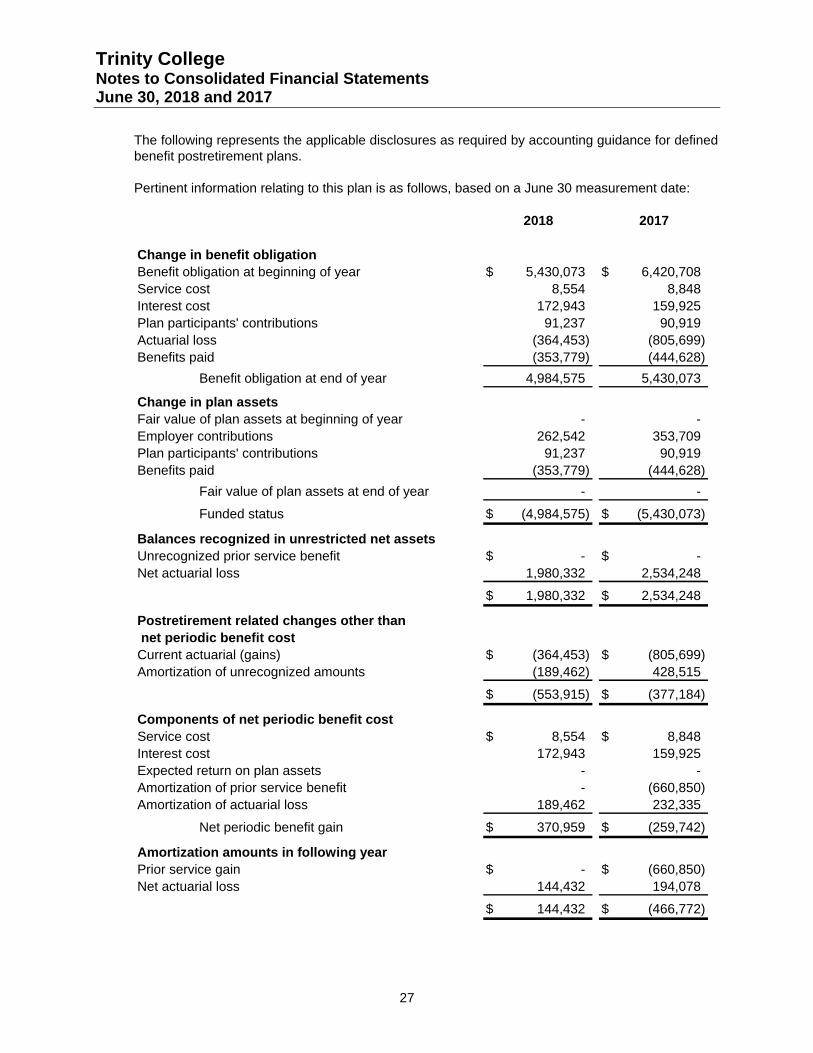
The following represents the applicable disclosures as required by accounting guidance for defined
benefit postretirement plans.
Pertinent information relating to this plan is as follows, based on a June 30 measurement date:
2018 2017
Change in benefit obligation
Benefit obligation at beginning of year 5,430,073$ 6,420,708$
Service cost 8,554 8,848
Interest cost 172,943 159,925
Plan participants' contributions 91,237 90,919
Actuarial loss (364,453) (805,699)
Benefits paid (353,779) (444,628)
Benefit obligation at end of year 4,984,575 5,430,073
Change in plan assets
Fair value of plan assets at beginning of year - -
Employer contributions 262,542 353,709
Plan participants' contributions 91,237 90,919
Benefits paid (353,779) (444,628)
Fair value of plan assets at end of year - -
Funded status (4,984,575)$ (5,430,073)$
Balances recognized in unrestricted net assets
Unrecognized prior service benefit -$ -$
Net actuarial loss 1,980,332 2,534,248
1,980,332$ 2,534,248$
Postretirement related changes other than
net periodic benefit cost
Current actuarial (gains) (364,453)$ (805,699)$
Amortization of unrecognized amounts (189,462) 428,515
(553,915)$ (377,184)$
Components of net periodic benefit cost
Service cost 8,554$ 8,848$
Interest cost 172,943 159,925
Expected return on plan assets - -
Amortization of prior service benefit - (660,850)
Amortization of actuarial loss 189,462 232,335
Net periodic benefit gain 370,959$ (259,742)$
Amortization amounts in following year
Prior service gain -$ (660,850)$
Net actuarial loss 144,432 194,078
144,432$ (466,772)$

Trinity College Notes to Consolidated Financial Statements June 30, 2018 and 2017
28
Assumptions
2018 2017
Discount rate used to determine benefit obligations
at June 30 3.83 % 3.31 %
Discount rate used to determine net periodic
benefit cost for years ended June 30 3.31 % 2.81 %
Assumed health care cost trend rates at June 30 7.00 % 7.50 %
Health care cost trend rate assumed for next year 7.00 % 7.50 %
Rate to which the cost trend rate is assumed to decline
(the ultimate trend rate) 5.00 % 5.00 %
Year that the rate reaches the ultimate trend rate 2020 2020
Assumed health care cost trend rates have a significant effect on the amounts reported for the
health care plans. A one-percentage-point change in assumed health care cost trend rates would
have the following effects:
Increase Decrease
Effect on total of service and interest cost 15,595$ (13,780)$
Effect on postretirement benefit obligation 422,801 (375,516)
1-Percentage-Point
Contributions
Trinity College expects to contribute $419,072 to its postretirement health insurance benefit plan in
fiscal year 2018.
Estimated Future Benefit Payments
Expected benefit payments for the fiscal year ending:
Postretirement
Benefits
2019 417,652$
2020 416,278
2021 410,920
2022 402,635
Thereafter 1,844,830
14. Commitments and Contingencies
The College is subject to legal proceedings and claims that arise in the ordinary course of its
business. In the opinion of management, the amount of ultimate liability with respect to those
actions will not materially affect the College’s financial position, changes in net assets or cash
flows.

Trinity College Notes to Consolidated Financial Statements June 30, 2018 and 2017
29
The College entered into a series of agreements with a third party property developer for the
construction of dormitories which were completed during fiscal 2014. The Developer leased the
land upon which the Dormitory is constructed from the College and the College manages the
property. The Developer bears all financial risk and receives all the financial benefit from the
Dormitories. Based on the terms of the agreements, the Developer constructed the Dormitories
and funded the project primarily through a commercial bank loan and a $4,000,000 loan from the
College. The balance of the loan from the College on June 30, 2018 was $3,458,495. The interest
rate is 8% and the term expires January 15, 2029.
In December 2016, the College entered in an agreement to sell one of its buildings located at 200
Constitution Plaza, Hartford, Connecticut for $2,600,000. Additionally, the College agreed to lease
two different locations in Hartford; 1 and 10 Constitution Plaza. Lease terms are 15 years
commencing on January 1, 2018.
15. Related Parties
The College invests a portion of their endowment investments in limited liability partnerships and
mutual funds where certain members of the Board of Trustees have significant influence. The total
fair value of related party investments was $425,373 and $2,080,138 at June 30, 2018 and 2017.
16. Subsequent Events
Management has evaluated subsequent events for the period after June 30, 2018, through
October 22, 2018, the date of the consolidated financial statements were issued.