trinidad drilling ltd. · laura ingram vice president, finance adrian lachance chief operating...
TRANSCRIPT

TRINIDAD DRILLING LTD.1000, 585 - 8th Avenue SW | Calgary AB T2P 1G1
P: 403.265.6525 F: 403.265.4168 E: [email protected]
Download the latest presentations and financial results about Trinidad Drilling at: www.trinidaddrilling.com
Trinidad Drilling is traded on TSX under the symbol TDG
TRIN
IDA
D D
RILLIN
G 20
17 AN
NU
AL R
EPOR
T
FOLD LINESFOLD LINES

ANNUAL MEETING
The Annual Meeting of shareholders will be held on May 8, 2018 at 10 am. Mountain Daylight Time in the Calgary Petroleum Club Cardium Room 319 – 5th Avenue S.W. Calgary, Alberta.
CORPORATE INFORMATION
Trinidad’s drilling fleet has always been one of the most adaptable, technologically advanced, and competitive in the industry—and we’re focused on keeping it that way. In 2017, this included undertaking an extensive rig upgrade program and the strategic acquisition of RigMinder.
We are meeting customers’ changing needs with integrated service offerings and cutting-edge automation and technology that unlocks potential and adds value. We have shown innovation in our rig designs, our product offerings to our customers and our day-to-day performance management. Moving into 2018, we are robustly equipped and strategically poised to deliver unparalleled value in the face of ever-changing markets, environments and challenges.
DIRECTORS
Michael HeierIndependent Businessman Cochrane, AB
Jim BrownIndependent Businessman Calgary, AB
Brian BurdenIndependent Businessman Calgary, AB
David HalfordIndependent Businessman Calgary, AB
Nancy LairdIndependent Businesswoman Calgary, AB
Ken SticklandIndependent Businessman Calgary, AB
MANAGEMENT
Brent ConwayPresident and Chief Executive Officer
Lesley BolsterChief Financial Officer
Laura IngramVice President, Finance
Adrian LachanceChief Operating Officer
Gavin LaneSenior Vice President, Canadian Operations
Ron ParentVice President, Human Resources, HSE and QMS
Nial ShepherdSenior Vice President, Trinidad Drilling International
BANKERS
Royal Bank of CanadaCalgary, AB
Wells FargoHouston, TX
AUDITORS
PricewaterhouseCoopers LLPChartered Professional Accountants Calgary, AB
LEGAL COUNSEL
Blake, Cassels & Graydon LLPCalgary, AB
REGISTRAR AND TRANSFER AGENT
TSX Trust CompanyToronto, ON
FOLD LINESFOLD LINES

2017 ANNUAL REPORT 1
TABLE OF CONTENTS
Message to Shareholders
02Operations Overview
06Auditor’s Report
48
Innovation in Our Strategy
04Management’s Discussion & Analysis
11Consolidated Financial Statements
49
Innovation in Our Operations
05Management’s Report
47Notes to the Consolidated Financial Statements
53

2 TRINIDAD DRILLING
Clear Strategy in Evolving Industry ConditionsOur strategy is to have a rig fleet with the highest earning capacity, not the largest fleet or market share. Capital discipline starts with the right assets, driven by the needs of our clients, focused in the right geographies. We are a high specification, performance-based drilling contractor with an international focus, almost 65% of our revenue comes from our US and international operations. Our strength has always been investment in core drilling rig technology and rig design that drives performance for our clients. We are focused on keeping to areas where we have extensive experience and strong performance.
The drilling industry’s investment in high specification drilling equipment has created efficiency gains that allow producers to economically drill completely new well profiles. However, in the past few years, the benefit of this investment has accrued not to drilling companies but rather to oil and gas producers. We are focused on finding ways to retain some of these benefits within Trinidad.
Customers are now asking drillers and service providers for bundled services or expanded service lines. Our customers want this integrated delivery model on select services because it reduces their execution risk. This demand has been the driving factor behind Trinidad selectively adding complementary services that deliver high margins but require low capital investment, relative to our drilling rigs. We have the ability to leverage off our key strengths and provide enhanced returns to shareholders on a capital-efficient basis by pursuing this model.
For Trinidad, 2017 was a year of change. Despite having one of the most experienced operational teams with proven technical capability and a high specification rig fleet, we were delivering financial results which have been, for the most part, at or just above average. We stepped back and took an objective view of our operational and financial performance, and found areas where we could improve.
MESSAGE TO SHAREHOLDERS
From left: Adrian Lachance, Lesley Bolster, Brent Conway
Dear Fellow InvestorsOver the past year we have seen improving industry conditions, with growing activity levels and improved customer demand. During 2017, Trinidad responded by reactivating and upgrading a large portion of our rigs, while also keeping a close eye on the safety of our people. In addition, we embraced the changing demands of our customers to improve drilling performance and efficiency with the acquisition of RigMinder. RigMinder’s innovative technology platform allows Trinidad to deliver an integrated drilling solution, while also reducing costs for customers.

2017 ANNUAL REPORT 3
We created an environment of ownership and accountability. An environment focused on achieving financial results, driving strong return on capital and improved returns for shareholders. Trinidad’s management team, together with our directors, have worked diligently to create this environment and have taken steps to improve our performance.
In the past year, we have made major changes to our management team and restructured our senior operations group to improve consistency and accountability across our drilling operations. In addition, we have increased our focus on cost control with significant reductions to overhead costs and strengthened our supply chain management. We are focused on capital discipline and we have formalized our approach to financial returns, with benchmark full cycle returns set for capital projects and regular reviews to ensure actuals meet targeted returns. Finally, we have made changes to our compensation plans to further align them with shareholder interest, including a 15% salary rollback for executives, a cap on our 2017 short-term incentive plan and increased share ownership for our executives.
Strategic Review to Enhance Shareholder ValueDespite improving industry fundamentals and recent steps we have taken to improve shareholder value; we do not believe that our current stock price reflects the value of the company. As a result, our Board of Directors recently initiated a strategic review in an effort to enhance shareholder value.
In connection with this process, the Board intends to undertake a comprehensive review of a broad range of alternatives and their potential to enhance shareholder value, including, a sale of selected assets, a merger, a corporate sale, a strategic partnership and various capital re-deployment opportunities.
This review is not a reflection of our financial or operating situation. We remain in a strong financial position, generating free cash flow from our core business to fund our capital program, and we also have additional liquidity through our existing credit facilities.
There is no guarantee that the strategic review process we are undertaking will result in a transaction. To that end, we will continue to manage our business carefully, with a focus on enhancing returns and improving results for our shareholders. We will remain focused on providing customers with the strong performance they have come to expect from Trinidad, while also maintaining our commitment to the safety of our crews and the condition of our high-performance equipment.
Sincerely,
Adrian LachanceChief Operating Officer
Lesley BolsterChief Financial Officer
Brent ConwayPresident & Chief Executive Officer
February 26, 2018

4 TRINIDAD DRILLING
INNOVATION IN OUR STRATEGY
Industry conditions began to improve in 2017 and we responded quickly. We were innovative in our strategic approach to benefit from evolving industry conditions, as we:
▪ Increased revenue by nearly $140 million or 39% from the previous year as we met growing customer demand for equipment and dayrates started to improve.
▪ Made significant changes to our management team and increased our focus on ownership and accountability. We remain committed to achieving financial results, driving strong return on capital and improved returns for shareholders.
▪ Streamlined all our purchasing activities with our new global procurement group which has executed global supply agreements and created millions of dollars in operational savings.
▪ Improved our unwavering focus on capital returns by refining our approach to capital allocation decisions. Returns have also been incorporated as a key measure for our compensation plans.
▪ Acquired RigMinder and its innovative technology platform to provide an integrated rig performance solution and reduce costs for customers. RigMinder’s Criterion™ bit guidance software and electronic data recorders integrate with Trinidad’s control systems, improving rig efficiency, safety and performance.
▪ Lowered leverage and interest costs, and extended long-term debt maturity by refinancing our senior notes and issuing equity in early 2017.
39% REVENUE INCREASED
FROM 2016

2017 ANNUAL REPORT 5
INNOVATION IN OUR OPERATIONS
The growing customer demand and increasing activity levels witnessed in 2017 are strong drivers for business. During these changing conditions, we focused on being innovative in how we keep our people safe, our customers satisfied and our operations working efficiently, as we:
▪ Responded to growing customer demand by crewing rigs and reactivating equipment quickly. We worked more than 22,000 operating days in 2017, 64% more than the year before.
▪ Remained committed to providing high performing operations and helping our customers achieve their best results.
▪ Updated our fleet to meet the new specifications customers are looking for. More than 30 rigs received upgrades to improve their marketability in 2017.
▪ Relocated rigs to areas where demand was stronger, largely under customer commitment, including moving rigs from Canada to the US.
▪ Grew our rig count in the most active play in North America, the Permian Basin, by 27% at year end.
▪ Maintained our focus on safety; we recorded a very strong safety incident (1) level of 0.24, even lower than our already strong level of 0.75 in 2016.
(1) TRIR – Total Recordable Incident Rate.(2) Compared to 2016.
GROWING ACTIVITY LEVELS
UP 64%
(2)
DROVE OVER 22,000 OPERATING DAYS

6 TRINIDAD DRILLING
OPERATIONS OVERVIEW
GLOBAL OPERATIONS (1)
RIGS
EMPLOYEES
TRIR*
In 2017, we responded strongly to growing customer demand and activity in our operations with our ongoing commitment to efficient, safe performance. We have well-trained, experienced crews, a fleet of high-performance rigs and strategic partnerships that provide opportunities for future expansion both in North America and internationally.
(1) As at December 31, 2017.* TRIR – Total Recordable Incident Rate.

2017 ANNUAL REPORT 7
US AND INTERNATIONAL
OPERATIONS
We have 68 rigs in the US and one international rig. Our US and international fleet is mostly made up of 1,500 HP triples. We have historically worked in most of the key plays across the US.
We have strong and growing market share in the Permian Basin, the most active play in the US.
69 0.48 960RIGS TRIR EMPLOYEES
2013 2014 2015 2016 2017
Dayrates (1) 23,381 21,749 24,917 26,518 18,492
Utilization (1) 73% 87% 45% 23% 48%
Operating Margin (1)(2) 41% 36% 49% 51% 32%
(1) See Non-GAAP Measure Definitions on page 43 and Additional GAAP Measures Definitions on page 46.(2) Operating Income - net percentage.

8 TRINIDAD DRILLING
CANADIAN OPERATIONS
Our Canadian fleet is made up of 70 rigs, with an average depth capacity of approximately 6,200 metres or 20,300 feet. Our rigs operate throughout the Western
Canadian Sedimentary Basin, with most of our recent activity coming from the Montney, Duvernay and Deep Basin. The blend of heavy doubles and modern triple rigs in our Canadian fleet meets the
wide range of customer demands, driving consistently higher utilization than industry averages.
70 0.12 696RIGS TRIR EMPLOYEES
2013 2014 2015 2016 2017
Dayrates ($USD) (1) 24,892 25,638 24,907 22,492 20,216
Utilization (1) 53% 57% 31% 23% 35%
Operating Margins (1),(2) 42% 43% 41% 41% 36%
(1) See Non-GAAP Measure Definitions on page 43 and Additional GAAP Measures Definitions on page 46.(2) Operating Income - net percentage.

2017 ANNUAL REPORT 9
JOINT VENTURE
OPERATIONS
We operate eight rigs through a joint venture arrangement, with four in Saudi Arabia and four in Mexico, including some of our largest and newest rigs. Our joint venture
is with Halliburton and gives us the first right to their integrated project drilling work.
8 0.00 185RIGS TRIR EMPLOYEES
2013 2014 2015 2016 2017
Adjusted EBITDA from Investments in Joint Ventures ($mm) (1)
- 1.8 27.7 31.8 30.8
Rig Count (2) 0 6 8 8 8
(1) See Non-GAAP Measure Definitions on page 43 and Additional GAAP Measures Definitions on page 46.(2) Excludes DCM Rigs.

FINANCIALS

Management’s Discussion and Analysis
The following management’s discussion and analysis (MD&A) of the financial condition and results of operations is intended to help the reader understand the current and prospective financial position and operating results of Trinidad Drilling Ltd. (“Trinidad” or the “Company”). The MD&A discusses the operating and financial results for the year ended December 31, 2017, is dated February 26, 2018, and takes into consideration information available up to that date. The MD&A is based on the audited annual consolidated financial statements of Trinidad for the year ended December 31, 2017. The MD&A should be read in conjunction with the audited annual consolidated financial statements and related notes for the year ended December 31, 2017, prepared in accordance with International Financial Reporting Standards (IFRS).
Additional information is available on Trinidad’s website (www.trinidaddrilling.com) and all previous public filings, including the most recently filed Annual Report and Annual Information Form, are available through SEDAR (www.sedar.com).
All amounts are denominated in Canadian dollars (CDN$) unless otherwise identified. All amounts are stated in thousands unless otherwise identified.
2017 ANNUAL REPORT 11

Financial Highlights
For the years ended December 31,
($ thousands except share and per share data) 2017 2016 % Change 2015 % Change (5)
Revenue 501,615 362,144 38.5 551,899 (9.1)
Revenue, net of third party costs (1) 469,650 344,213 36.4 525,043 (10.6)
Operating income (1) 157,320 159,577 (1.4) 222,166 (29.2)
Operating income percentage (1) 31.4% 44.1% (28.8) 40.3% (22.1)
Operating income - net percentage (1) 33.5% 46.1% (27.3) 42.1% (20.4)
Adjusted EBITDA (1) 129,445 143,002 (9.5) 186,746 (30.7)
Per share (diluted) (2) 0.49 0.64 (23.4) 1.11 (55.9)
Cash flow provided by operating activities 20,475 30,310 (32.4) 215,462 (90.5)
Per share (basic / diluted) (2) 0.08 0.14 (42.9) 1.28 (93.8)
Funds flow (1) 51,429 62,618 (17.9) 108,219 (52.5)
Per share (basic / diluted) (2) 0.19 0.28 (32.1) 0.64 (70.3)
Net (loss) (3) (79,618) (52,546) (51.5) (218,350) 63.5
Per share (basic / diluted) (2)(3) (0.30) (0.24) (25.0) (1.30) 76.9
Capital expenditures 163,117 44,326 268.0 140,047 16.5
Dividends declared (4) - - - 26,668 (100.0)
Shares outstanding - diluted
(weighted average) (2) 266,014,405 222,496,995 19.6 168,227,833 58.1
December 31, December 31, December 31,
($ thousands) 2017 2016 % Change 2015 % Change (5)
Total assets 1,903,773 1,982,076 (4.0) 2,236,200 (14.9)
Total long-term liabilities 533,046 657,602 (18.9) 783,254 (31.9)
(1) Readers are cautioned that Revenue, net of third party costs, Operating income, Operating income percentage, Operating income - net percentage, Adjusted EBITDA, Funds flow, and the related per share information do not have standardized meanings prescribed by IFRS – see Non-GAAP Measures Definitions and Additional GAAP Measures Definitions (beginning on page 43).
(2) Basic shares include the weighted average number of shares outstanding over the period. Diluted shares include the weighted average number of shares outstanding over the period and the dilutive impact, if any, of the number of shares issuable pursuant to the Incentive Option Plan.
(3) Net (loss) is net (loss) attributable to shareholders of Trinidad. Net (loss) per share is calculated as net (loss) attributable to shareholders of Trinidad divided by the weighted average number of common shares outstanding, both adjusted for dilutive factors.
(4) No dividends were declared for the years ending December 31, 2017 and 2016. For the year ended December 31, 2015, $0.05 per share was declared in the first, second and third quarters, and $0.01 per share was declared in the fourth quarter.
(5) Represents the percentage change for the year ending December 31, 2015 compared to the year ended December 31, 2017.
12 TRINIDAD DRILLING

Operating Highlights
For the years ended December 31,2017 2016 % Change 2015 % Change (4)
Operating days (1)
United States and International 11,924 5,716 108.6 9,474 25.9
Canada 9,004 6,144 46.5 7,303 23.3
Rate per operating day (1)
United States and International (CDN$) 24,022 35,094 (31.5) 31,241 (23.1)
United States and International (US$) 18,492 26,518 (30.3) 24,917 (25.8)
Canada (CDN$) 20,216 22,492 (10.1) 24,907 (18.8)
Utilization rate - operating day (1)
United States and International 48% 23% 108.7 45% 6.7
Canada 35% 23% 52.2 31% 12.9
Number of drilling rigs at year end (2)
United States and International 69 67 3.0 67 3.0
Canada 70 72 (2.8) 72 (2.8)
TDI Joint Venture Operations (3)
Operating days (1) 1,278 1,709 (25.2) 2,189 (41.6)
Rate per operating day (CDN$) (1) 86,491 74,249 16.5 60,478 43.0
Rate per operating day (US$) (1) 65,929 55,594 18.6 47,732 38.1
Utilization rate - operating day (1) 44% 58% (24.1) 96% (54.2)
Number of drilling rigs at year end 8 8 - 8 -
(1) See Non-GAAP Measures Definitions and Additional GAAP Measures Definitions section of this MD&A for further details (beginning on page 43).(2) Refer to the Results from Operations section for details on the changes to the rig count.(3) Trinidad is party to a joint venture with a wholly-owned subsidiary of Halliburton. These rigs are owned by the joint venture.(4) Represents the percentage change for the year ended December 31, 2015 compared to the year ended December 31, 2017.
2017 ANNUAL REPORT 13

Forward-Looking Statements
The MD&A contains certain forward-looking statements relating to Trinidad’s plans, strategies, objectives, expectations and intentions. The use of any of the words "expect", "anticipate", "continue", "estimate", "objective", "ongoing", "may", "will", "project", "should", "believe", "plans", "intends", "confident", "might" and similar expressions are intended to identify forward-looking information or statements. Various assumptions were used in drawing the conclusions or making the projections contained in the forward-looking statements throughout this MD&A. The forward-looking information and statements included in this MD&A are not guarantees of future performance and should not be unduly relied upon. Forward-looking statements are based on current expectations, estimates and projections that involve a number of risks and uncertainties, which could cause actual results to differ materially from those anticipated and described in the forward-looking statements. In particular, but without limiting the foregoing, this MD&A may contain forward-looking information and statements pertaining to:
• the assumption that Trinidad's customers will honour their long-term contracts, and Trinidad's ability to sign future long-term contracts;
• future liquidity levels;
• fluctuations in the demand for Trinidad’s services;
• the ability for Trinidad to attract and retain qualified personnel, in particular field staff to crew the Company’s rigs;
• Trinidad's ability to increase dayrates;
• the existence of competitors, technological changes and developments in the oilfield services industry;
• the existence of operating risks inherent in the oilfield services industry;
• assumptions respecting internal capital expenditure programs and expenditures by oil and gas exploration and production companies;
• assumptions regarding commodity prices, in particular oil and natural gas;
• assumptions respecting supply and demand for commodities, in particular oil and natural gas;
• assumptions regarding future expected cash flows and potential distributions from joint venture partners including Trinidad Drilling International (TDI);
• assumptions regarding foreign currency exchange rates and interest rates;
• assumptions around future Other G&A cost levels;
• the existence of regulatory and legislative uncertainties;
• the possibility of changes in tax laws; and general economic conditions including the capital and credit markets;
• assumptions made about our future banking covenants and liquidity;
• assumptions made about future performance and operations of joint ventures and partnership arrangements;
• the ability of the Company to continue to execute on its business strategy during the strategic review process, and the various risks and assumptions customarily related thereto; and
• the likelihood that the Company will be able to identify and undertake alternatives which enhance shareholder value.
Trinidad cautions that the foregoing list of assumptions, risks and uncertainties is not exhaustive. Additional information on these and other factors that could affect Trinidad’s business, operations or financial results are described in reports filed with securities regulatory authorities, accessible through the SEDAR website (www.sedar.com) including but not limited to
14 TRINIDAD DRILLING

Trinidad’s annual MD&A, financial statements, Annual Information Form and Management Information Circular. The forward-looking information and statements contained in this MD&A speak only as of the date of this MD&A and Trinidad assumes no obligation to publicly update or revise them to reflect new events or circumstances, except as may be required pursuant to applicable securities laws.
Non-GAAP Measures and Additional GAAP Measures
This MD&A contains references to certain financial measures and associated per share data that do not have any standardized meaning prescribed by IFRS, and may not be comparable to similar measures presented by other companies. These financial measures are computed on a consistent basis for each reporting period and include Operating income, Operating income percentage, Operating income - net percentage, Adjusted EBITDA, Adjusted EBITDA from investments in joint ventures, Funds flow, working capital, Senior Debt to Bank EBITDA, Bank EBITDA to Cash Interest Expense, operating revenue or revenue, net of third party costs, drilling days, operating days, utilization rate - drilling day, utilization rate - operating day, and rate per operating day or dayrate. Refer to the Non-GAAP Measures Definitions and Additional GAAP Measures Definitions sections of this MD&A (beginning on page 43) for details with respect to definitions of these measures.
Responsibility Of Management And The Board Of Directors
Management is responsible for the information disclosed in this MD&A and the accompanying audited consolidated financial statements, and has in place appropriate information systems, procedures and controls to ensure that information used internally by management and disclosed externally is materially complete and reliable. In addition, Trinidad’s Audit Committee, on behalf of the Board of Directors, provides an oversight role with respect to all public financial disclosures made by the Company, and has reviewed and approved this MD&A and the accompanying audited annual consolidated financial statements.
Profile
Trinidad is an industry-leading contract driller, providing safe, reliable, expertly-designed equipment operated by well-trained and experienced personnel. Trinidad's drilling fleet is one of the most adaptable, technologically advanced and competitive in the industry. Trinidad provides contract drilling and related services in Canada, the US, the Middle East and Mexico.
Trinidad is headquartered in Calgary, Alberta, Canada. The Company’s common shares are listed on the Toronto Stock Exchange under the trading symbol TDG. For more information, please visit www.trinidaddrilling.com.
Overview
In 2017, activity grew significantly over the levels recorded in the previous year. In the US and international operations, activity increased by 108.6%, and in the Canadian operations, activity grew by 46.5%. The increase in activity was mainly driven by higher commodity prices and increased customer demand.
Conditions continued to strengthen in the fourth quarter of 2017 and Trinidad benefited from improved profitability in its US and international operations, driven by growing activity levels, less rig reactivation costs and improving underlying dayrates. These improving conditions allowed Trinidad to record increased adjusted EBITDA in the fourth quarter of 2017 when compared to the same period of the prior year.
"Industry conditions improved in 2017 and our operating days increased significantly, particularly in our US operations," said Brent Conway, Trinidad's President and Chief Executive Officer. "Throughout the year we saw our underlying dayrates in the US improve each quarter as the impact of rigs starting up on new contracts under market rates more than offset the impact of rigs rolling off legacy contracts. In Canada, market conditions improved, but not to the extent seen in the US."
2017 ANNUAL REPORT 15

"Due to this growing customer demand, we expanded our upgrade program and relocated rigs to high demand areas such as the Permian Basin in 2017. These strategic decisions positioned Trinidad with a strong market presence in the most active play in North America and with a fleet of high quality rigs that meet customer demands.” added Conway.
In addition, in response to customer requests for improved efficiency and performance, Trinidad acquired RigMinder Operating LLC (RigMinder), a global provider of rig technology in the third quarter of 2017. This acquisition allows Trinidad to deliver an integrated rig performance solution and reduce costs for customers.
Industry Statistics
Crude oil prices improved during 2017, with WTI crude oil prices averaging US$50.85 per barrel during the year and finishing the year at US$60.42. On average, WTI crude oil was US$55.43 per barrel in the fourth quarter of 2017, up 12% from the same quarter last year and up 15% from the third quarter of 2017. Henry Hub natural gas averaged US$2.98 per million British thermal unit (mmBtu) in 2017 and US$2.91 per mmBtu in the fourth quarter of 2017, up 18% and down 4%, respectively from the same periods last year. While Canadian-based oil and gas pricing increased in 2017 over the prior year, infrastructure constraints and related challenges kept pricing from reaching levels equivalent to US-based commodity pricing.
With the increase in WTI and Henry Hub prices in 2017, activity levels increased year over year. In the US, the active rig count averaged 856 active rigs in 2017, up 68% or 347 active rigs from 2016. There were 901 active rigs in the fourth quarter of 2017. Increased activity in the US drove the rig count up to 958 rigs in July 2017, but as producers cut back slightly on capital spending towards the end of the year, the active rig count exited the fourth quarter at 929 active rigs. Canadian activity levels also increased in 2017, with full year average utilization at 28%, up from an average of 17% in 2016.
Full2017
Full2016
Year Year
2017 Q4 Q3 Q2 Q1 2016 Q4 Q3 Q2 Q1
Commodity Prices
AECO natural gas price (CDN$ per gigajoule) 2.19 1.77 1.51 2.76 2.69 2.16 3.10 2.35 1.43 1.81
Henry Hub natural gas price (US$ per million British thermal unit)
2.98 2.91 2.95 3.07 3.00 2.52 3.04 2.88 2.15 1.99
Western Canada Select crude oil price (CDN$ per barrel)
49.54 49.26 47.20 51.32 50.35 38.96 45.62 40.17 42.35 36.79
WTI crude oil price (US$ per barrel) 50.85 55.43 48.13 48.15 51.84 43.56 49.35 45.00 45.73 33.78
Canadian / US dollar exchange rate 1.30 1.27 1.25 1.34 1.32 1.32 1.33 1.30 1.29 1.37
US Activity
Average industry active land rig count (1) 856 901 926 895 742 509 589 479 423 551
Average Trinidad active land rig count (2) 31 33 35 32 24 18 22 14 15 19
Canadian Activity
Average industry utilization (3) 28% 28% 28% 18% 40% 17% 25% 17% 7% 20%
Average Trinidad utilization (4) 32% 36% 37% 19% 41% 22% 31% 20% 10% 29%
(1) Baker Hughes North America Rotary Rig Count.(2) Includes US and international rigs.(3) Canadian Association of Oilwell Drilling Contractors (CAODC) utilization.(4) Based on drilling days (spud to rig release dates).
16 TRINIDAD DRILLING

Full Year 2017 Highlights (Compared to corresponding prior-year period unless otherwise noted)
• In 2017, revenue increased by 38.5% compared to 2016, due to higher activity levels in both the US and Canada, partly offset by lower dayrates and lower early termination and standby revenue in 2017. In both Trinidad's US and international and Canadian drilling operations, dayrates lowered due to the number of rigs working under competitive spot market pricing compared to existing higher dayrate legacy contracts in 2016. As well, in Canada, dayrates lowered due to a higher proportion of smaller rigs operating.
• Operating days during 2017 increased by 108.6% and 46.5%, respectively, in the US and international and Canadian drilling operations. Activity levels increased as industry conditions continued to strengthen in 2017 due to higher commodity prices and improved customer demand, served by an upgraded Trinidad fleet.
• Operating income for 2017 was $157.3 million, relatively flat compared to 2016. The impact of higher activity levels was offset by lower dayrates, lower early termination and standby revenues, and foreign currency translation impacts year over year. Operating income - net percentage decreased to 33.5% in 2017 from 46.1% in 2016 largely due to lower early termination and standby revenues in the US and international division in 2017 compared to 2016.
• Adjusted EBITDA decreased in 2017 largely due lower average dayrates recorded in Trinidad, and due to an increase in general and administrative expenses driven by increased activity levels and severance and bad debt expenses.
• Net (loss) increased in 2017 as a result of higher depreciation and amortization expenses and a loss on foreign exchange. The impact of these factors was partly offset by lower finance and transaction costs and a larger recovery on deferred taxes.
• In 2017, Trinidad spent $163.1 million on capital expenditures, compared to $44.3 million in 2016. As well, the Company spent $4.3 million related to its portion of capital spending for the TDI joint venture, compared to $6.0 million in 2016. Capital expenditures in 2017 were higher than previously anticipated as a result of improving industry conditions and increased customer demand. Additional spend related mainly to capital requirements to reactivate equipment, such as additional drill pipe, rig re-certifications and capital inventory.
• Effective August 25, 2017, Trinidad acquired RigMinder, a leading provider of rig technology that is complementary to the Company's industry-leading drilling fleet. Since the acquisition, Trinidad has begun to roll out the RigMinder technology platform to its customers, including the use of CriterionTM, RigMinder's directional advisory software, customer-partnered testing of frac-optimization software, GMXSteeringTM, and adding electronic data recorders (EDR) to its fleet. In addition, the Company has put in place several agreements to provide integrated down hole tool solutions.
• In the first quarter of 2017, Trinidad refinanced its long-term debt and strengthened the balance sheet by lowering the Company's overall indebtedness and reducing interest costs moving forward. The Company redeemed its outstanding US$450 million of 7.875% senior unsecured notes due in 2019 (2019 Senior Notes) and issued US$350 million of 6.625% senior unsecured notes which mature in 2025 (2025 Senior Notes), collectively the Senior Notes. The company also completed an offering of 47,460,317 common shares at $3.15 per share for gross proceeds of $149.5 million in the first quarter of 2017.
2017 ANNUAL REPORT 17

Results From Operations
United States and International Operations
For the years ended December 31,
($ thousands except percentage and operating data) 2017 2016 % Change
Operating revenue (1) 286,441 200,588 42.8
Other revenue 44 308 (85.7)
286,485 200,896 42.6
Operating costs (1) 195,720 98,916 97.9
Operating income (2) 90,765 101,980 (11.0)
Operating income - net percentage (2) 31.7% 50.8%
Operating days (2) 11,924 5,716 108.6
Drilling days (2) 10,473 4,886 114.3
Rate per operating day (CDN$) (2) 24,022 35,094 (31.5)
Rate per operating day (US$) (2) 18,492 26,518 (30.3)
Utilization rate - operating day (2) 48% 23% 108.7
Utilization rate - drilling day (2) 42% 20% 110.0
Number of drilling rigs at year end 69 67 3.0
(1) Operating revenue and operating costs for the year ended December 31, 2017 and 2016 exclude third party recovery and third party costs of $12.8 million and $5.0 million, respectively. (2) See Non-GAAP Measures Definitions and Additional GAAP Measures Definitions section (beginning on page 43) of this MD&A for further details.
For the year ended December 31, 2017, Trinidad recorded operating revenue of $286.4 million, an increase of 42.8% compared to 2016. Operating revenue increased in the current year due to higher activity levels. Operating income was negatively impacted in the current year due to less early termination and standby revenue and the impact of a lower US dollar to Canadian dollar exchange rate. As well, lower dayrates impacted overall profitability in the current year.
During the year ended December 31, 2017, Trinidad recorded 11,924 operating days, up from 5,716 days in 2016. Activity increased due to improving commodity prices and growing customer demand. In response to improved industry conditions in 2017, Trinidad re-activated 17 rigs in its US and international division, primarily in the Permian Basin.
In the year ended December 31, 2017, Trinidad recorded average dayrates of US$18,492 per day, a reduction of US$8,026 per day from the comparable period of 2016, primarily due to less early termination and standby revenue recorded in the current year. In the year ended December 31, 2017, Trinidad recorded early termination and standby revenue of US$3.5 million, compared to early termination and standby revenue of US$42.5 million in 2016. Early termination and standby revenue in 2017 mainly related to three rigs, compared to six rigs in 2016.
Adjusted for the impact of early termination and standby revenue, Trinidad's dayrates averaged US$18,202 per day in 2017, a decrease of US$879 per day from the adjusted dayrates in 2016. Trinidad's adjusted dayrates lowered during the the year ended December 31, 2017, compared to 2016, as a result of an increased number of rigs working at spot market rates as activity levels improved, compared to legacy long-term contracts with higher dayrates in the prior year. As well, as more rigs were reactivated in 2017, a change in rig mix effected Trinidad's average dayrates. Sequentially, Trinidad's average dayrates increased in each of the four quarters of 2017, showing an improvement to market pricing conditions in the drilling industry.
Operating income decreased by $11.2 million for the year ended December 31, 2017 mainly due to lower early termination and standby revenue, competitive pricing pressure on dayrates, and movements in foreign currency translation in 2017; partially offset by increased activity levels in the current year. In the first half of 2017, Trinidad incurred rig re-activation costs related to readying rigs to go back to work and related transportation costs. In the second half of the year, rigs commenced full operations and reactivation costs decreased, providing greater contributions to income and lessening the year-over-year impact.
18 TRINIDAD DRILLING

For the year ended December 31, 2017, Trinidad recorded operating income - net percentage of 31.7% compared to 50.8% in 2016. Operating income - net percentage decreased mainly as a result of lower early termination and standby revenue. After adjusting for early termination and standby revenue, Trinidad recorded operating income - net percentage of 30.6% compared to 32.1% in 2016. The remaining reduction in operating income - net percentage in 2017 was primarily due to declines in Trinidad's average dayrate in the current year.
Trinidad’s US and international rig count totaled 69 rigs at December 31, 2017 compared to 67 at December 31, 2016 due to two rigs transferred from the Canadian operations in the first half of 2017. The rigs were transferred to meet increased customer demand in the Permian Basin.
Canadian Operations
For the years ended December 31,
($ thousands except percentage and operating data) 2017 2016 % Change
Operating revenue (1) 182,032 139,504 30.5
Other revenue 1,133 895 26.6
183,165 140,399 30.5
Operating costs (1) 117,070 82,742 41.5
Operating income (2) 66,095 57,657 14.6
Operating income - net percentage (2) 36.1% 41.1%
Operating days (2) 9,004 6,144 46.5
Drilling days (2) 8,326 5,695 46.2
Rate per operating day (CDN$) (2) 20,216 22,492 (10.1)
Utilization rate - operating day (2) 35% 23% 52.2
Utilization rate - drilling day (2) 32% 22% 45.5
CAODC industry average (3) 28% 17% 64.7
Number of drilling rigs at year end 70 72 (2.8)
(1) Operating revenue and operating costs for the year ended December 31, 2017 and 2016 exclude third party recovery and third party costs of $18.7 million and $11.8 million, respectively.
(2) See Non-GAAP Measures Definitions and Additional GAAP Measures Definitions section (beginning on page 43) of this MD&A for further details.(3) Canadian Association of Oilwell Drilling Contractors (CAODC) industry average is based on drilling days divided by total days available.
Improving industry conditions and higher commodity prices drove increased activity levels for the year ended December 31, 2017, compared to the prior year. Additionally, Trinidad's operations were positively impacted by higher early termination and standby revenue recorded in the current year. Overall, operating revenue and operating income increased to $182.0 million and $66.1 million, respectively, in 2017, an increase of 30.5% and 14.6%, respectively, compared to the prior year. The impact of improved activity levels, combined with increased standby and early termination revenue, was slightly offset by lower average dayrates in Trinidad for the current year.
For the year ended December 31, 2017, Trinidad recorded 9,004 operating days, compared to 6,144 operating days in the prior year. Improved industry conditions and higher demand resulted in higher activity in the current year. As well, Trinidad's average utilization in 2017 was four percentage points higher than the industry average utilization.
Dayrates for the year ended December 31, 2017, decreased by $2,276 per day compared to the prior year. Dayrates lowered in 2017 as more rigs were re-activated and worked under short-term or spot market contracts compared to more rigs working under long-term contracts in 2016. As well, a change in the active rig mix in 2017, compared to 2016, also led to a reduction in dayrates. The impact of lower contracted dayrates was partly offset by higher early termination and standby revenue in 2017 due to contracted rigs not working the contracted number of days.
2017 ANNUAL REPORT 19

For the year ended December 31, 2017, Trinidad received early termination and standby revenue of $22.5 million compared to $9.9 million in the prior year. The early termination and standby revenue recognized in 2017 primarily related to lump sum amounts for shortfall days collected on eight rigs. The early termination and standby revenue recognized in 2016 mainly related to lump sum amounts collected for five rigs. Excluding early termination and standby revenue, dayrates for the year ended December 31, 2017 were $17,716 per day, a decline of $3,162 per day compared to the adjusted 2016 dayrates.
For the year ended December 31, 2017, operating income increased by 14.6% compared to the same period last year mainly as a result of increased activity, continued focus on cost control, and higher early termination and standby revenue, which adds revenue with no corresponding operating costs. This was partly offset by the impact of lower dayrates in the current period.
For the year ended December 31, 2017, operating income - net percentage was 36.1%, compared to 41.1% in the prior year. Operating income - net percentage decreased in the current year mainly due to lower dayrates related to the change in short term, spot market contract pricing in 2017, partially offset by higher early termination and standby revenue recorded in the current year. In 2017, operating costs remained in line with the increase in operating days; however, operating revenue, excluding early termination and standby revenue, grew at a slower rate due to lower dayrates, driving lower overall profitability.
Trinidad’s Canadian rig count totaled 70 rigs at December 31, 2017, compared to 72 rigs at December 31, 2016. During 2017, the Company transferred two rigs to its US and international division.
Joint Venture Operations
Trinidad Drilling International (TDI):Amounts below are presented at 100% of the value included in the statement of operations and comprehensive (loss) income for Trinidad Drilling International (TDI); Trinidad owns 60% of the shares of TDI and each of the parties has equal voting rights. Trinidad considers the investment to be a financial asset at fair value through profit or loss and recognizes changes in fair value of the investment in the statement of operations and comprehensive (loss) as a gain from investments in joint ventures.
For the years ended December 31,
($ thousands except percentage and operating data) 2017 2016 % Change
Operating revenue 113,746 131,823 (13.7)
Other revenue 62 - 100.0
113,808 131,823 (13.7)
Operating costs 51,645 69,324 (25.5)
Operating income (1) 62,163 62,499 (0.5)
Operating income - net percentage (1) 54.6% 47.4%
Operating days (1) 1,278 1,709 (25.2)
Rate per operating day (CDN$) (1) 86,491 74,249 16.5
Rate per operating day (US$) (1) 65,929 55,594 18.6
Utilization rate - operating day (1) 44% 58% (24.1)
Number of drilling rigs at year end 8 8 -
(1) See Non-GAAP Measures Definitions and Additional GAAP Measures Definitions section of this MD&A (beginning on page 43) for further details.
For the year ended December 31, 2017, TDI recorded operating revenue of $113.7 million, a decrease of 13.7%, from the same period in 2016. Operating revenue decreased due to lower activity in both the Saudi Arabian and Mexican divisions, and was further reduced by lower dayrates in the Saudi Arabian division. The impact of these factors was partly offset by increased early termination and standby revenue in the Mexican division in 2017.
During the year ended December 31, 2017, TDI recorded utilization of 44%, compared to 58% in 2016. Operating days decreased by 151 days in Saudi Arabia and 280 days in Mexico. There were three active rigs in Saudi Arabia in 2017 compared to four in 2016, whereas Mexico had one active rig in 2017 compared to four active rigs in 2016.
20 TRINIDAD DRILLING

In 2017, dayrates increased by US$10,335 per day compared to 2016, largely as a result of increased early termination and standby revenues in Mexico, offsetting a reduction in dayrates in Saudi Arabia. Excluding early termination and standby of US$26.8 million in 2017 and US$14.7 million in 2016, dayrates were US$44,950 per day in 2017, compared to US$46,981 per day in 2016.
Operating income decreased by $0.3 million for the year ended December 31, 2017 compared to the same period in 2016, mainly due to lower activity in the current year offset by higher early termination and standby revenues in Mexico. Operating income - net percentage increased to 54.6% in 2017 from 47.4% in 2016, reflecting the increase in early termination and standby revenue, which has no accompanying operating expenses.
General and Administrative
For the years ended December 31,
($ thousands except percentage) 2017 2016 % Change
General and administrative (1) 58,215 47,335 23.0
% of revenue 11.6% 13.1%
Share-based payment expense 1,405 8,434 (83.3)
Third party recoverable costs 460 1,051 (56.2)
Total general and administrative 60,080 56,820 5.7
% of revenue 12.0% 15.7%
(1) General and administrative expenses excluding share-based payment expense and third party recoverable costs.
For the year ended December 31, 2017, Trinidad recorded higher general and administrative (G&A) costs compared to the same period in 2016 due to an increase in salary expenses and higher professional fees as a result of putting rigs back to work, as well as higher severance and bad debt expense recorded in 2017. Salary expenses increased due to higher activity within the Company combined with an increase due to the RigMinder acquisition, while professional fees were higher due to an increase in general corporate activities. Trinidad recorded $7.1 million of severance and bad debt expenses in the first quarter of 2017. The bad debt expense was related to the barge division that was discontinued in 2016.
For the year ended December 31, 2017, share-based payment expense decreased when compared to the same period in 2016 mainly due to a decrease in the share price. A reduction in the share price reduces the liability associated with the Company's performance share units, deferred share units and restricted share units .
Third party recoverable costs relate to costs incurred by Trinidad on behalf of the TDI joint venture. As these costs are fully recoverable, Trinidad records a related revenue entry for this same amount.
For the year ended December 31, 2017, G&A as a percentage of revenue decreased compared to the same period in 2016, mainly due to an increase in revenue generation associated with higher activity in 2017.
2017 ANNUAL REPORT 21

Depreciation, Amortization and Sale of Assets
For the years ended December 31,
($ thousands) 2017 2016 % Change
Depreciation 196,905 170,835 15.3
Amortization 3,057 911 235.6
(Gain) on sale of assets (2,166) (11,317) (80.9)
Depreciation expense for the year ended December 31, 2017 increased when compared to the prior year mainly due to a change in the useful life estimates effective from July 1, 2017. In the third quarter of 2017, Trinidad reviewed the useful life estimates for all rigs and related equipment and adjusted to more accurately reflect the future economic benefits related to these assets. The useful life estimates were adjusted within Trinidad's current depreciation policy. Depreciation also increased as a result of capital asset additions from rig upgrade and capital maintenance projects throughout 2017.
Amortization expense for the year ended December 31, 2017 increased when compared to the prior year mainly due to technology assets acquired through the RigMinder acquisition. In addition, amortization increased due to the addition of a licensing agreement in the second quarter of 2017.
For the year ended December 31, 2017, Trinidad recognized a gain on sale of assets of $2.2 million, mainly due to the disposition of non-core assets. The gain on sale of assets recorded for the year ended December 31, 2016 was due to the disposition of non-core assets and duplicate properties acquired as part of a previous business combination.
Foreign Exchange
For the years ended December 31,
($ thousands except percentage) 2017 2016 % Change
Foreign exchange loss (gain) 9,295 (3,374) 375.5
% of revenue 1.9% (0.9)%
Foreign exchange gains and losses are the result of foreign currency fluctuations on the Company's foreign currency funds and outstanding inter-company balances. For the year ended December 31, 2017, Trinidad recorded a foreign exchange loss of $9.3 million compared to a gain of $3.4 million in the comparative period of 2016. The loss in 2017 reflects the impact of the strengthening of the Canadian dollar on the inter-company balances.
The Company utilizes a net investment hedge on a portion of its foreign subsidiaries against its US dollar denominated Senior Notes. This hedge allows the Company to better reflect foreign exchange impacts related to operations as the translation adjustment is included in the cumulative translation account in other comprehensive (loss).
Impairment
For the years ended December 31,
($ thousands except percentage) 2017 2016 % Change
Impairment of property and equipment 2,993 - 100.0
% of revenue 0.6% 0.0%
For the year ended December 31, 2017, the Company identified top drives in its US and international segment that had a carrying amount which exceeded the recoverable amount. As a result, Trinidad recorded an impairment of $3.0 million for the year ended December 31, 2017.
22 TRINIDAD DRILLING

Finance and Transaction Costs
For the years ended December 31,
($ thousands except percentage) 2017 2016 % Change
Interest on long-term debt 37,600 49,907 (24.7)
Accretion of 2019 Senior Notes 53 611 (91.3)
Amortization of deferred financing costs 2,338 5,306 (55.9)
Finance costs related to long-term debt 39,991 55,824 (28.4)
Transaction costs 2,068 - 100.0
Finance and transaction costs 42,059 55,824 (24.7)
% of revenue 8.4% 15.4%
For the year ended December 31, 2017, finance and transaction costs were $42.1 million, a decrease of 24.7% when compared to the same period in 2016. Finance and transaction costs decreased mainly due to the redemption of the Company's outstanding US$450 million Senior Notes that were due in 2019, and the issuance of new Senior Notes at a reduced principal amount of US$350 million, due in 2025. The new Senior Notes have a lower interest rate of 6.625% compared to the previous instrument's interest rate of 7.875%. The reduction in the principal amount combined with a lower interest rate on long-term debt caused the reduction in expense.
Amortization of deferred financing costs decreased compared to prior period due to the accelerated recognition of the unamortized debt issuance costs in the prior year associated with the 2019 Senior Notes. As Trinidad announced the cash tender offer to purchase the 2019 Senior Notes in January of 2017, the related unamortized debt issuance costs were completely expensed at December 31, 2016.
For the year ended December 31, 2017, Trinidad recorded transaction costs of $0.7 million related to the RigMinder acquisition and $1.4 million relating to the early redemption of the 2019 Senior Notes.
Refer to the Liquidity and Capital Resources section for further details on the debt refinancing agreement and amendments made to the credit facility.
Income Taxes
For the years ended December 31,
($ thousands except percentage) 2017 2016 % Change
Current 929 (871) 206.7
Deferred (59,744) (33,289) 79.5
(58,815) (34,160) 72.2
% of revenue (11.7)% (9.4)%
For the year ended December 31, 2017, current tax expense was $0.9 million, compared to a recovery of $0.9 million recorded in 2016. The change was due to a recovery that was booked in 2016 related to the Manufacturing division along with increased state taxability in the US division in 2017.
For the year ended December 31, 2017, deferred tax recovery increased to $59.8 million compared to $33.3 million in the prior year. The increase was largely due to the US tax reform, decreasing the future tax rate by 14.64%, along with reduced taxability in the US and Canadian drilling operations.
2017 ANNUAL REPORT 23

Net (Loss) and Cash Flows
For the years ended December 31,
($ thousands except per share data) 2017 2016 % Change
Net (loss) (1) (79,618) (52,546) (51.5)
Per share (diluted) (1) (0.30) (0.24) (25.0)
Cash flow provided by operating activities 20,475 30,310 (32.4)
Per share (diluted) 0.08 0.14 (42.9)
Funds flow (2) 51,429 62,618 (17.9)
Per share (diluted) 0.19 0.28 (32.1)
(1) Net (loss) is net (loss) attributable to shareholders of Trinidad. Net (loss) per share is calculated as net (loss) attributable to shareholders of Trinidad divided by the weighted average number of common shares outstanding, both adjusted for dilutive factors.
(2) See Non-GAAP Measures Definitions and Additional GAAP Measures Definitions section of this MD&A (beginning on page 43) for further details.
For the year ended December 31, 2017, net loss was $79.6 million compared to a net loss of $52.5 million in 2016. While operating income for 2017 remained relatively flat compared to 2016, net loss increased due to higher depreciation and amortization expense as a result of a change in useful life estimates as well as the additions to intangible assets acquired as part of the RigMinder acquisition. As well, net loss was negatively impacted by a larger foreign exchange loss due to currency fluctuations, a loss on non-cash fair value adjustments, a decrease to the gain on sale of assets and the recognition of an impairment expense in 2017. These losses were partly offset by lower finance and transaction costs due to refinancing initiatives in early 2017, a larger tax recoverable position in the current year, and an increase in the gain from investments in joint ventures.
For the year ended December 31, 2017, cash flow provided by operating activities and funds flow decreased compared to the same period in 2016 mainly due to lower operating income and higher G&A costs in 2017. Funds flow was offset slightly by a positive impact, when compared to the prior year, related to non-cash operating working capital. Non cash operating working capital was slightly improved in the current year mainly due to increased collections on accounts receivable, partially offset by increased trade payables associated with increased activity levels and higher contingent payments related to the RigMinder acquisition.
Further details on changes discussed above are outlined in previous sections of the MD&A.
24 TRINIDAD DRILLING

Financial Highlights - Quarterly Analysis
2017 2016
($ millions except per share data and operating data) Q4 Q3 Q2 Q1 Q4 Q3 Q2 Q1
Revenue 137.9 129.8 101.2 132.7 93.0 66.9 94.5 107.7
Operating income (1) 47.9 37.1 23.7 48.6 28.2 23.0 61.7 46.7
Operating income percentage (1) 34.7% 28.6% 23.5% 36.6% 30.3% 34.3% 65.3% 43.4%
Operating income - net percentage (1) 37.3% 30.4% 24.9% 38.8% 32.3% 35.9% 66.8% 45.4%
Net (loss) income (2) (17.7) (44.7) (6.0) (12.1) (12.1) (36.1) (16.6) 11.1
Adjustments for:
Depreciation and amortization 56.2 53.3 45.9 44.6 43.7 42.3 42.5 43.2
Foreign exchange (0.9) 3.5 1.4 5.3 (0.7) (0.3) 0.1 (2.4)
(Gain) loss on sale of assets (0.2) (0.3) (1.7) 0.1 (0.7) (8.6) (0.7) (1.2)
Impairment of property and equipment 3.0 - - - - - - -
Loss (gain) from investment in joint ventures 2.0 17.2 (28.3) (8.5) (19.7) 18.4 9.7 (21.4)
Finance and transaction costs 9.4 9.7 8.9 14.1 16.0 12.3 13.3 14.1
Fair value adjustments (3) (1.5) 0.5 3.1 - (3.5) (5.9) - -
Income taxes (15.2) (16.0) (14.8) (12.8) (9.9) (10.3) (3.5) (10.4)
Other expense (1.0) 1.3 2.5 (0.8) 4.6 1.8 4.5 0.9
Income taxes paid (0.1) (0.5) (0.7) (0.3) (0.1) (0.2) (0.9) (0.9)
Income taxes recovered 0.2 1.0 0.8 - 0.7 - - 0.1
Interest paid (1.5) (17.0) (0.6) (29.4) (0.7) (24.0) (1.5) (24.4)
Funds flow (1) 32.7 8.0 10.5 0.2 17.6 (10.6) 46.9 8.7
Per share (diluted) (4) 0.12 0.03 0.04 - 0.08 (0.05) 0.21 0.04
Adjusted EBITDA (1) 36.1 27.5 14.7 51.3 23.8 18.0 57.0 44.2
Per share (diluted) (4) 0.13 0.10 0.05 0.21 0.11 0.08 0.26 0.20
Net (loss) income attributable to Trinidad (17.7) (44.4) (5.6) (11.9) (11.8) (35.8) (16.3) 11.3
Per share (diluted) (4)(5) (0.06) (0.16) (0.02) (0.05) (0.05) (0.16) (0.07) 0.05
(1) See Non-GAAP Measures Definitions and Additional GAAP Measures Definitions section of this MD&A (beginning on page 43) for further details.(2) Net (loss) income used in the consolidated statement of cash flows is total net (loss) income before adjustments for non-controlling interests amounts.(3) Fair value adjustments includes the fair value adjustments on the contingent considerations related to the RigMinder business combination and the fair value of the
non-controlling interests liability.(4) Diluted shares include the weighted average number of shares outstanding over the period and the dilutive impact, if any, of the number of shares issuable pursuant to the
Incentive Option Plan.(5) Net (loss) income per share is calculated as net (loss) income attributable to shareholders of Trinidad divided by the weighted average number of common shares outstanding.
Both are adjusted for dilutive factors.
2017 ANNUAL REPORT 25

Operating Highlights - Quarterly Analysis
2017 2016
Q4 Q3 Q2 Q1 Q4 Q3 Q2 Q1
Operating days (1)
United States and International 3,290 3,212 2,957 2,465 1,761 1,307 915 1,733
Canada 2,497 2,520 1,099 2,888 2,067 1,411 665 2,001
Rate per operating day (1)
United States and International (CDN$) 24,048 23,820 24,589 23,570 25,472 27,975 76,220 28,529
United States and International (US$) 19,170 18,515 18,249 17,847 19,191 21,557 59,070 20,438
Canada (CDN$) 19,478 17,961 19,842 22,965 20,118 18,856 31,138 24,635
Utilization rate - operating day (1)
United States and International 52% 52% 48% 41% 29% 21% 15% 29%
Canada 39% 39% 21% 45% 31% 21% 10% 31%
Number of drilling rigs at period end (3)
United States and International 69 69 69 68 67 67 67 67
Canada 70 70 70 71 72 72 72 72
TDI Joint Venture Operations (2)
Operating days (1) 268 317 339 354 284 274 461 690
Rate per operating day (CDN$) (1) 61,208 65,089 68,352
142,143 86,951 87,127 72,773 64,894
Rate per operating day (US$) (1) 48,923 50,595 50,744 107,057 65,529 67,133 55,962 46,676
Utilization rate - operating day (1) 36% 43% 47% 49% 39% 37% 63% 95%
Number of drilling rigs at period end (3) 8 8 8 8 8 8 8 8
(1) See Non-GAAP Measures Definitions and Additional GAAP Measures Definitions section of this MD&A (beginning on page 43) for further details.(2) Refer to the Results from Operations section for details on changes to the rig count.(3) Trinidad is party to a joint venture with a wholly-owned subsidiary of Halliburton (TDI). These rigs are owned by the joint venture.
An assessment or comparison of Trinidad’s quarterly results, at any given time, requires consideration of crude oil and natural gas commodity prices, geographic location and seasonality. Commodity prices ultimately drive the level of exploration and development activities carried out by the Company’s customers and the associated demand for the oilfield services provided by Trinidad.
2016 Analysis
In the first half of 2016, Trinidad's US and international and Canadian operations continued to be negatively impacted by weak commodity prices causing downward pressure on dayrates and decreased activity. In the first two quarters of 2016, the Company was able to maintain a strong operating income - net percentage as a result of early termination and standby revenue recorded during the year, as well as cost cutting initiatives and lower manufacturing activity. In the third quarter of 2016, improving commodity prices drove increased activity levels; however, ongoing competition caused downward pressure on dayrates and negatively impacted profitability. In the fourth quarter of 2016, Trinidad continued to record improved activity in each of the US and Canadian drilling divisions compared to prior periods in 2016. Profitability was negatively impacted in the fourth quarter of 2016 due to lower early termination and standby revenue, as well as continued competition affecting dayrates. In addition, Adjusted EBITDA from Trinidad's TDI joint venture increased in 2016, positively impacting results.
26 TRINIDAD DRILLING

2017 Analysis
In the twelve months ended December 31, 2017, Trinidad's US and international and Canadian operations continued to record improved activity levels associated with stabilized commodity prices and increased customer demand. Higher activity levels were partially offset by lower average dayrates. The first half of 2017 saw reduced dayrates due to changes in rig mix and increased competition as activity began to strengthen. Trinidad was impacted by increased operating costs associated with seasonal repairs and maintenance in Canada, one-time costs related to rig re-activations in the US, and higher G&A costs earlier in 2017. Into the second half of 2017, rig activity increased following the upgrade and reactivation efforts, leading to a strengthening in dayrates and a decrease in operating cost levels. The fourth quarter of 2017 in particular saw a strengthening of dayrates in the North American markets due to the upgraded fleet and improved market conditions. While the North American divisions saw increased activity and dayrates, Trinidad's TDI joint venture had a decrease in activity and dayrate in the fourth quarter of 2017. In addition, during 2017, Trinidad spent $163.1 million on capital expenditures focused primarily on upgrades to meet increasing customer demand for high performance rigs and $31.4 million on the acquisition of RigMinder.
Fourth Quarter 2017 Highlights Versus Prior Year
• Revenue increased in the fourth quarter of 2017 compared to fourth quarter of 2016 largely due to increased activity levels in both the US and international and Canadian divisions, partly offset by lower dayrates in Canada and a negative currency translation impact on the Company's US dollar-based revenues.
• Activity levels were higher in the US and international and Canadian divisions for the current period compared to 2016, as commodity prices improved and customer demand increased, particularly in the US.
• Operating income increased by 69.9% in the fourth quarter of 2017 compared to the same period of 2016. The increased level of activity, combined with relatively flat dayrates and lower operating costs, drove improved operating income.
• Operating income - net percentage increased to 37.3% in the current period, from 32.3% in 2016, due to a reduction in operating costs in the current period. In the fourth quarter of 2016, the US division had commenced its rig reactivation program and incurred extra costs, while this program was completed and rigs were largely in operation by the fourth quarter of 2017.
• Adjusted EBITDA increased to $36.1 million in the fourth quarter of 2017, compared to $23.8 million in the fourth quarter of 2016, as a result of the same drivers that increased operating income.
• Net loss increased in the fourth quarter of 2017 compared to the same period of 2016 mainly due to higher depreciation and amortization expenses and a lower contribution from Trinidad's joint venture operations. The impact of these factors was partly offset by lower finance and transaction costs due to the refinancing of the senior notes earlier in 2017.
2017 ANNUAL REPORT 27

Results from Operations
United States and International Operations
Three months ended December 31,
($ thousands except percentage data) 2017 2016 % Change
Operating revenue (1) 79,125 44,842 76.5
Other revenue 8 42 (81.0)
79,133 44,884 76.3
Operating costs (1) 48,399 32,535 48.8
Operating income (2) 30,734 12,349 148.9
Operating income - net percentage (2) 38.8% 27.5%
Operating days (2) 3,290 1,761 86.8
Drilling days (2) 2,880 1,482 94.3
Rate per operating day (CDN$) (2) 24,048 25,472 (5.6)
Rate per operating day (US$) (2) 19,170 19,191 (0.1)
Utilization rate - operating day (2) 52% 29% 79.3
Utilization rate - drilling day (2) 46% 24% 91.7
Number of drilling rigs at year end 69 67 3.0
(1) Operating revenue and operating costs for the three months ended December 31, 2017 and 2016 exclude third party recovery and third party costs of $3.3 million and $1.8 million, respectively.
(2) See Non-GAAP Measures Definitions and Additional GAAP Measures Definitions section (beginning on page 43) of this MD&A for further details.
In the fourth quarter of 2017, Trinidad recorded operating revenue and operating income of $79.1 million and $30.7 million, respectively, an increase of 76.5% and 148.9%, respectively, from the fourth quarter of 2016. Profitability increased mainly due to higher activity and lower operating costs than recorded in the fourth quarter of 2016. The fourth quarter of 2017 reflected a strong quarter of activity, following redeployment and reactivation efforts to reposition the fleet earlier in the year.
Activity levels increased to 3,290 operating days in the fourth quarter of 2017, compared to 1,761 operating days in the comparable quarter of 2016, mainly driven by stronger industry conditions.
Trinidad recorded consistent dayrates in the current quarter compared to the same quarter last year, with a dayrate of US$19,170 per day realized in the three months ended December 31, 2017 compared to US$19,191 in the comparable quarter in 2016. Dayrates lowered slightly mainly due to more rigs operating on spot market and a change in rig mix in the US division. During the current quarter, Trinidad received standby revenue of US$1.4 million, compared to early termination and standby revenue of US$1.6 million in the prior year.
Operating income - net percentage increased in the fourth quarter of 2017, compared to the prior year, driven by lower operating costs in the current period. Trinidad recorded higher operating costs in the fourth quarter of 2016 as several rigs were prepared to return to work.
28 TRINIDAD DRILLING

Fourth quarter of 2017 versus third quarter of 2017
When compared to the third quarter of 2017, Trinidad's operating income increased by $8.4 million in the fourth quarter of 2017, as a result of rig re-activation activities and higher dayrates. Trinidad incurred costs to reactivate rigs to go back to work throughout 2017. As these rigs were active in the fourth quarter of 2017, this led to a decrease in operating costs compared to the third quarter of 2017. As well, operating income - net percentage rose from 29.1% in the third quarter to 38.8% in the fourth quarter of 2017.
Dayrates in the fourth quarter of 2017 averaged US$19,170 per day, up from US$18,515 per day in the third quarter of 2017. Dayrates increased quarter over quarter as a result of strong results on Trinidad's performance-based contracts in the period, plus higher early termination and standby revenue received in the current period. Early termination and standby was US$1.4 million in the fourth quarter of 2017, as compared to US$0.6 million in the third quarter of 2017.
Canadian Operations
Three months ended December 31,
($ thousands except percentage data) 2017 2016 % Change
Operating revenue (1) 48,645 41,601 16.9
Other revenue 209 404 (48.3)
48,854 42,005 16.3
Operating costs (1) 31,823 26,272 21.1
Operating income (2) 17,031 15,733 8.3
Operating income - net percentage (2) 34.9% 37.5%
Operating days (2) 2,497 2,067 20.8
Drilling days (2) 2,290 1,882 21.7
Rate per operating day (CDN$) (2) 19,478 20,118 (3.2)
Utilization rate - operating day (2) 39% 31% 25.8
Utilization rate - drilling day (2) 36% 28% 28.6
CAODC industry average (3) 28% 25% 12.0
Number of drilling rigs at year end 70 72 (2.8)
(1) Operating revenue and operating costs for the three months ended December 31, 2017 and 2016 exclude third party recovery and third party costs of $6.4 million and $4.2 million, respectively.
(2) See Non-GAAP Measures Definitions and Additional GAAP Measures Definitions section (beginning on page 43) of this MD&A for further details.(3) CAODC industry average is based on drilling days divided by total days available.
During the fourth quarter of 2017, Trinidad recorded operating revenue and operating income of $48.6 million and $17.0 million, respectively, an increase of 16.9% and 8.3%, respectively, compared to the fourth quarter of 2016. Operating revenue and operating income was higher in the current quarter mainly due to increased activity, with 430 more operating days or a 20.8% increase from the same quarter last year. The impact of these factors was partly offset by lower average dayrates compared to the fourth quarter of 2016.
Dayrates in the fourth quarter of 2017 decreased by $640 per day, compared to the fourth quarter of 2016. Dayrates lowered mainly as a result of a change in the active rig mix and continued competitive market conditions, partly offset by increased early termination and standby revenues in the current year.
2017 ANNUAL REPORT 29

Trinidad received early termination and standby revenue of $4.5 million for a shortfall of operating days in the fourth quarter of 2017 on contracted rigs, compared to $0.2 million in the same period of 2016. The shortfall revenue recorded in the fourth quarter of 2017 related to contracted days not worked in the current period on three rigs, whereas corresponding shortfall revenue in the fourth quarter of 2016 related to one rig. Excluding early termination and standby revenue, dayrates averaged $17,696 per day in the fourth quarter of 2017, down $2,315 per day from the prior period.
Operating income increased by $1.3 million in the current quarter compared to the prior year largely due to increased activity, partly offset by lower dayrates due to rig mix, fewer long-term contracts with stronger legacy pricing and pricing pressure in a competitive market.
Operating income - net percentage was 34.9% in the three months ended December 31, 2017, down from 37.5% in the corresponding period in 2016. Operating income - net percentage decreased due to lower dayrates in the quarter, while operating costs remained in line on a per day basis relative to the activity levels in the comparable periods, partly offset by higher early termination and standby revenue in the current period, which has no associated costs.
Fourth quarter of 2017 versus third quarter of 2017
Consistent utilization and the re-activation of higher specification rigs to the active fleet drove stronger results in the fourth quarter of 2017, compared to the third quarter of 2017. Operating revenue and operating income increased in the fourth quarter of 2017 by $3.4 million and $2.3 million, respectively, due to higher dayrates realized in the current quarter. Utilization remained steady at 39% in both the third and fourth quarters of 2017. Dayrates improved in the fourth quarter of 2017, averaging $19,478 per day compared to $17,961 per day in the third quarter due to higher specification rigs working in the fourth quarter, in combination with an increase in seasonal equipment rentals. Early termination and standby revenue remained consistent quarter over quarter, with $4.5 million recorded in the fourth quarter compared to $4.6 million in the third quarter of 2017.
Joint Venture Operations
Trinidad Drilling International (TDI):Amounts below are presented at 100% of the value included in the statement of operations and comprehensive (loss) income for Trinidad Drilling International (TDI); Trinidad owns 60% of the shares of TDI and each of the parties has equal voting rights. Trinidad considers the investment to be a financial asset at fair value through profit or loss and recognizes changes in fair value of the investment in the statement of operations and comprehensive (loss) as a gain from investments in joint ventures.
Three months ended December 31,
($ thousands except percentage data) 2017 2016 % Change
Operating revenue 17,089 25,580 (33.2)
Operating costs 11,224 11,692 (4.0)
Operating income (1) 5,865 13,888 (57.8)
Operating income - net percentage (1) 34.3% 54.3%
Operating days (1) 268 284 (5.6)
Rate per operating day (CDN$) (1) 61,208 86,951 (29.6)
Rate per operating day (US$) (1) 48,923 65,529 (25.3)
Utilization rate - operating day (1) 36% 39% (7.7)
Number of drilling rigs at year end 8 8 -
(1) See Non-GAAP Measures Definitions and Additional GAAP Measures Definitions section of this MD&A (beginning on page 43) for further details.
30 TRINIDAD DRILLING

Operating revenue decreased in the fourth quarter of 2017, compared to the prior year, mainly as a result of lower dayrates and lower early termination and standby revenues. Early termination and standby revenue for the three months ended December 31, 2017 was $0.8 million, compared to $8.0 million in the three months ended December 31, 2016. Operating days were slightly lower at 268 in the fourth quarter of 2017 compared to 284 in the comparative period for 2016.
Operating income - net percentage decreased in the current quarter compared to the fourth quarter of 2016 due to lower dayrates and lower early termination and standby costs.
Fourth quarter of 2017 versus third quarter of 2017
Compared to the third quarter of 2017, TDI recorded lower operating income in the current period mainly due to lower activity and lower early termination and standby revenue. TDI recorded 49 fewer operating days and $2.1 million lower operating income in the fourth quarter compared to the third quarter. Early termination and standby revenue decreased from $2.9 million in the third quarter to $0.8 million in the fourth quarter. Operating income - net percentage decreased in the fourth quarter due to the factors discussed above.
Liquidity and Capital Resources
As at December 31, December 31,
($ thousands) 2017 2016 $ Change
Working capital (1) 44,432 48,121 (3,689)
Limited partnership loans - 1,959 (1,959)
Senior Notes 438,550 602,758 (164,208)
Credit facility 84,621 - 84,621
523,171 604,717 (81,546)
Less: unamortized debt issue costs (11,497) (1,701) (9,796)
Total long-term debt 511,674 603,016 (91,342)
Total long-term debt as a percentage of total assets 26.9% 30.4%
Total assets 1,903,773 1,982,076 (78,303)
Total long-term liabilities 533,046 657,602 (124,556)
Total long-term liabilities as a percentage of assets 28.0% 33.2%
For the years ended December 31, 2017 2016 $ Change
Cash flow provided by operating activities 20,475 30,310 (9,835)
Cash flow (used in) provided by investing activities (120,463) 23,941 (144,404)
Cash flow provided by (used in) financing activities 84,133 (92,077) 176,210
(1) See Non-GAAP Measures Definitions section of this MD&A (beginning on page 43) for further details.
For the year ended December 31, 2017, working capital decreased by $3.7 million when compared to December 31, 2016, due to a $25.5 million increase in current liabilities offset by a $21.8 million increase in current assets.
Current liabilities increased in the period mainly due to an increase in accounts payable and accrued liabilities. Included in accounts payable and accrued liabilities at December 31, 2017 was $12.3 million related to the current portion of the contingent consideration associated with the RigMinder acquisition. As well, accounts payable increased as a result of higher trade and accrued liabilities associated with increased capital expenditures and higher activity levels, partially offset by lower interest payable. During the first quarter of 2017, the Company redeemed its US$450 million 2019 Senior Notes and issued US$350 million 2025 Senior Notes at a lower interest rate, reducing the aggregate principal amount outstanding of the Senior Notes and the interest payable due. The strengthening of the Canadian dollar and a reduction in the interest rate associated with the 2025 Senior Notes compared to the 2019 Senior Notes has further reduced interest payable.
2017 ANNUAL REPORT 31

Current assets decreased in the period ended December 31, 2017 due to a decrease in cash and cash equivalents, partially offset by an increase in accounts receivable and an increase in assets held for sale in 2017. The decrease in cash and cash equivalents was primarily due to the cash used by investing activities related to capital upgrades and the RigMinder acquisition, partially offset by the private placement of shares in the first quarter of 2017. The increase in accounts receivable was primarily due to higher activity levels in 2017, while the assets held for sale increased due to property and equipment being reclassified to assets held for sale in the Canadian operations as well as top drives included in capital inventory in the US and international divisions that were being underutilized.
Trinidad’s total long-term debt balance at December 31, 2017 decreased by $91.3 million compared to December 31, 2016. This decrease was largely due to the redemption of the 2019 Senior Notes, followed by the issuance of the 2025 Senior Notes at a lower principal balance (as discussed above) as well as the strengthening of the Canadian dollar compared to the US dollar at December 31, 2017 versus December 31, 2016. As these notes are held in US funds, the Senior Notes are translated at each period end, and as such, their aggregate value fluctuates with the US to Canadian exchange rates.
Trinidad has designated the Senior Notes as a net investment hedge of the US and international operations. As a result, unrealized gains and losses on the US dollar Senior Notes are offset against foreign exchange gains and losses arising from the translation of the foreign subsidiaries and included in the cumulative translation account in other comprehensive (loss).
Credit Facility and Debt Covenants
On January 27, 2017, Trinidad amended its previously existing credit facility, dated June 24, 2016, to allow for flexibility in the redemption of the 2019 Senior Notes and subsequent issuance of the 2025 Senior Notes. The new amended credit facility includes a Canadian revolving facility of $100.0 million and a US revolving facility of $100.0 million. Included in the facility are a $10.0 million Canadian dollar bank overdraft and a $10.0 million US dollar bank overdraft. The facility requires quarterly interest payments based on Bankers Acceptance and LIBOR rates. The facility as amended on January 27, 2017 was set to mature on December 12, 2018. On November 30, 2017, Trinidad further amended the credit facility; the amendment included an extension of the maturity date to December 12, 2020, as well as releasing the prior covenant relief measures. The credit facility is subject to annual extensions of an additional year on each anniversary date upon consent of the lenders holding two-thirds of the aggregate commitments under the credit facility. The members of the syndicated groups include major Canadian, US and international financial institutions. The debt is secured by a general guarantee over the assets of Trinidad and its subsidiaries.
At December 31, 2017, the following financial covenants were in place:
Senior Debt to Bank EBITDA (1) Max of 2.5x
Bank EBITDA to Cash Interest Expense (1) Min of 2.5x
(1) Please see the Non-GAAP Measures Definitions section of this MD&A (beginning on page 43) for further details.
At December 31, 2017, Senior Debt to Bank EBITDA was 0.70 times and Bank EBITDA to Cash Interest Expense was 3.55 times. Trinidad was in compliance with all covenants at December 31, 2017.
Other covenants in effect include, but are not limited to, the following: incurring additional debt and liens on assets; investments, including advances to the TDI joint venture; asset sales; and making restricted payments. The new amended credit facility allows Trinidad to pay dividends provided that Trinidad's Senior Debt to Bank EBITDA covenant is less than five times. At December 31, 2017, Trinidad is in compliance with all covenants related to the credit facility.
32 TRINIDAD DRILLING

2025 Senior Notes
The 2025 Senior Notes are unsecured and have no financial covenant compliance reporting requirements. There are other covenant limitations, including the following: incurring additional debt; investments; asset sales; and restricted payments. Restricted payments are allowed within a basket, calculated as the accumulated net earnings from January 1, 2017 to the current period at 50.0% of net income or 100.0% of net loss, plus equity issued for cash and the net fair market value of other restricted assets added for equity. At December 31, 2017, Trinidad has a positive restricted payment basket available. Future contributions to the TDI joint venture are limited in a separate permitted business investment basket not to exceed the greater of US$300.0 million and 20% of consolidated tangible assets.
Readers are cautioned that the ratios noted above do not have standardized meanings under IFRS.
Capital Resources
Trinidad’s objectives when managing capital include safeguarding the Company’s ability to continue to provide returns for shareholders; as well as applying capital efficiencies to achieve financial objectives while focusing on operating within generated cash flows if possible. The Company manages the capital structure and makes adjustments to it in light of changes in economic conditions and the risk characteristics of the underlying assets. In order to maintain or adjust the capital structure, the Company may repurchase or issue new shares, sell assets, reduce indebtedness or take on additional debt.
Capital Expenditures
For the years ended December 31,($ thousands) 2017 2016
Capital upgrades and enhancements 136,010 23,549
Maintenance and infrastructure 27,107 6,288
Capital spares inventory - 14,489
Total capital expenditures for Trinidad 163,117 44,326
TDI joint venture capital expenditures (Trinidad's 60% share) 4,294 5,978
RigMinder acquisition (net) 31,396 -
Total capital expenditures including TDI joint venture and acquisitions 198,807 50,304
In 2017, Trinidad spent $163.1 million on capital expenditures, compared to $44.3 million in 2016. As well, the Company spent $4.3 million related to its portion of capital spending for the TDI joint venture, compared to $6.0 million in 2016. Capital expenditures in 2017 were higher than previously anticipated as a result of improving industry conditions and increased customer demand. Additional spend mainly related to capital requirements to reactivate equipment, such as additional drill pipe, rig re-certifications and capital inventory.
On August 25, 2017, Trinidad completed the acquisition of RigMinder for cash proceeds (excluding shares and contingent consideration) of $31.4 million. Through this strategic business acquisition, Trinidad acquired significant technology rights that are complementary to its industry-leading drilling fleet.
Subsequent Event
Effective February 20, 2018, Trinidad announced that the Board of Directors has commenced a formal process to initiate a strategic review in an effort to enhance shareholder value. In connection with this process, the Board intends to undertake a comprehensive review to identify and consider a broad range of alternatives and their potential to enhance shareholder value. The Company does not intend to set a definite schedule to complete its evaluation or process and cautions that there are no assurances or guarantees that the process will result in a transaction or, if a transaction is undertaken, the terms or timing of such a transaction.
2017 ANNUAL REPORT 33

Outlook
To date in 2018, crude oil prices have increased over the fourth quarter of 2017, driving a growing active rig count, particularly in the US. Since the end of 2017, the US active rig count has steadily increased, and is currently up 50 rigs. In Canada, activity levels in early 2018 have been relatively flat to levels witnessed in 2017 and high pricing differentials for Canadian products have reduced the benefits of stronger crude oil prices, limiting customer demand.
Trinidad's existing geographic diversity has allowed the Company to take advantage of the relative strength of the US industry. In early 2018, Trinidad chose to redeploy rigs from Canada and areas of weaker demand within the US and internationally to the high demand Permian Basin, with mobilization costs expected to be largely covered by its customers. As a result of growing customer demand in the US market, dayrates are continuing to increase, particularly for high specification rigs where available supply has become limited. Dayrates in Canada have remained firm through the winter drilling season; however, the upward momentum seen in the US is not occurring to the same extent in the Canadian industry.
In the US, Trinidad currently has 39 rigs, or 59% of its fleet operating, with almost 80% operating in the Permian Basin. In Canada, activity continues to be focused in the Montney, Duvernay and Deep Basin. Trinidad currently has 39 rigs or 57% of its Canadian fleet running, six percentage points above industry activity levels.
In the TDI joint venture, one rig has been recently contracted to work in Bahrain and is expected to begin work early in the second quarter of 2018. The remaining three rigs in Saudi Arabia are in the process of being moved to the US where they will be re-configured to meet US customer requirements and are expected to be working in the Permian Basin in the third quarter of 2018. TDI has participated in a number of international tenders, some of which are expected to be awarded in the near future. If successful, Trinidad anticipates using existing idle equipment to fulfill these awards, likely its rigs currently located in Mexico.
Currently, Trinidad has 31 rigs, or 21% of its fleet under long-term contracts, with an average term remaining of 1.0 year; 15 contracts have expiration dates during the remainder of 2018. The Company is presently working with customers to negotiate contracts on the rigs being redeployed to the Permian.
Trinidad continues to make good progress on the roll out of its RigMinder technology platform. CriterionTM, RigMinder's directional advisory software, is currently being used by customers in both the US and Canada with encouraging results and additional customer interest. A Canadian customer is currently working in partnership with Trinidad to test and evaluate the GMXSteeringTM frac optimization software. As well, RigMinder now has in place several agreements to provide integrated tool solutions including agreements with multi-national suppliers of downhole tools. Trinidad has begun to market this service to its customers and is encouraged by customers' interest levels. In addition, the Company continues to add RigMinder EDRs to its rigs.
Early in 2018, Trinidad undertook a review of its cost structure to ensure that its practices were in-line or ahead of its competitors and to provide long-term value for its shareholders. Following this review, Trinidad reduced headcount, rolled back salaries and implemented tighter expense management. Trinidad expects that G&A expenses will total approximately $43 million in 2018, down 26% from the level incurred in 2017.
Debt levels increased during the fourth quarter as the 2017 capital upgrade program was completed; however, Trinidad remains committed to maintaining conservative leverage and expects to manage its business within cash flow generated from its operations in 2018.
In 2018, the Company expects to spend approximately $94 million in capital expenditures. Trinidad anticipates that approximately $20 million of this spending will be funded by the proceeds from the sale of unused facilities in 2018. The Company also expects that the majority of funds spent will be backed by customer contracts.
34 TRINIDAD DRILLING

Trinidad's strong and growing operations in the US, position it well to take advantage of strengthening industry conditions. The Company's existing high quality fleet, combined with the rig upgrades completed in 2017 and the redeployment of existing equipment to the Permian allow it to benefit from improving dayrates and strong customer demand. In addition, RigMinder's technology platform is gaining momentum and Trinidad expects to continue to roll out these products to its customers throughout 2018. These factors, along with the Company's cost-efficient structure and focus on improving returns, position Trinidad for strong performance in the strengthening industry conditions.
Trinidad believes that the current trading price of its common shares does not reflect the value of the Company, despite the improving industry fundamentals and the recent steps the Company has taken to improve shareholder value. As a result, Trinidad recently commenced a formal process to initiate a strategic review in an effort to enhance shareholder value.
In connection with this process, Trinidad's Board of Directors intends to consider a broad range of alternatives, including a sale of selected assets, a merger, a corporate sale, a strategic partnership or various capital re-deployment opportunities. The Board has appointed a special committee of independent directors and engaged financial and legal advisors to assist it with the review. The Company does not intend to set a definite schedule to complete its review and does not intend to disclose developments unless the Board has approved a specific transaction or action plan, or otherwise determines that disclosure is necessary or appropriate.
There is no guarantee that the strategic review process the Company is undertaking will result in a transaction. To that end, the Company will continue to manage its business carefully. Trinidad will remain focused on providing customers with the strong performance they have come to expect from it, while also maintaining its commitment to the safety of its crews and the condition of its high performance equipment.
Commitments and Contingencies
Commitments
Trinidad enters into drilling contracts with third parties for use of the Company’s drilling equipment. These contracts range from 12 months to five years. As well, Trinidad has several operating lease agreements on buildings and equipment. Operating lease expenses are included in G&A expenses and operating expenses in the consolidated statements of operations and comprehensive (loss). The Company does not have any contingent rental payments. The Company’s annual commitments are shown net of sublease income. The leases expire at various times through 2029 and there are no significant renewal or purchase options.
Payments Due by Period
As at December 31, 2017 Due within 2 - 3 4 - 5 After
($ thousands) Total 1 year years years 5 years
Debt (1) 644,349 29,054 58,108 58,108 499,079
Operating leases 30,265 3,623 5,839 5,205 15,598
Contingent consideration 19,432 12,397 7,035 - -
Other obligations (2) 178,918 178,918 - - -
Total contractual obligations 872,964 223,992 70,982 63,313 514,677
(1) Debt payments include the face value of the 2025 Senior Notes plus any expected interest payments assuming the 2025 Senior Notes are held to maturity in 2025. (2) Other obligations consist of accounts payable, accrued liabilities, bank indebtedness, and revolving credit facility.
Contingencies
Trinidad is involved in various legal actions that have arisen in the course of operations. Management is of the opinion that losses, if any, arising from such legal actions would not have a material effect on the consolidated financial statements.
2017 ANNUAL REPORT 35
Shareholders’ Equity
Common shares outstanding at December 31, 2017 were 273,457,951 shares.
Common shares outstanding at February 26, 2018 were 273,457,951 shares.
Seasonality
Trinidad operates a substantial number of rigs in western Canada; therefore, operations are impacted by weather and seasonal factors. The winter season is typically a busy period as oil and natural gas companies take advantage of frozen ground conditions to move drilling rigs into regions that might otherwise be inaccessible to heavy equipment due to swampy conditions. Springtime normally encompasses a slow period referred to as spring break-up. During this period, melting conditions result in temporary municipal road bans that effectively prohibit the movement of drilling rigs. The remainder of the year is usually representative of average activity levels.
Trinidad’s expansion to the US and international markets has reduced its overall exposure to the seasonal factors that are present in its Canadian operations. These seasonal conditions typically limit Canadian drilling activity, whereas in the US and international areas, operators have more flexibility to work throughout the year. The activity in the US and international operations has allowed Trinidad to better manage its business with more sustainable cash flows throughout the annual cycle. However, industry conditions have an effect on how seasonality affects Trinidad's activity.
36 TRINIDAD DRILLING

Critical Accounting Judgment and Estimates
The preparation of the consolidated financial statements requires management to make judgments and estimates that affect the reported amounts of assets, liabilities, income and expenses. Judgments and estimates are continually evaluated and are based on historical experience and expectations of future events. While judgments and estimates used by Trinidad are believed to be reasonable under current circumstances, actual results could differ.
Property and equipment
The accounting estimate that has the greatest impact on Trinidad’s financial results relates to depreciation and amortization. Depreciation and amortization of Trinidad’s property and equipment and intangible assets incorporates estimates of useful lives and residual values. These estimates may change as more experience is obtained or as general market conditions change with resulting impacts on the operation of Trinidad’s property and equipment.
Impairments
Trinidad performs impairment tests of long-lived assets with determinate useful lives when indications of impairment exist. Trinidad tests goodwill for impairment at least annually, regardless of whether impairment indicators exist. Application of judgment is required in determining whether an impairment test is warranted. When indicators support that the asset is no longer impaired, Trinidad will reverse impairment losses. Similar to the impairment, application of judgment is required to determine whether a reversal should be considered. Management monitors and assesses whether impairment indicators exist on an ongoing basis.
Allowance for doubtful accounts
Trinidad regularly performs a review of outstanding accounts receivable balances greater than 90 days to determine eventual collectability. If an account is deemed uncollectible, a provision for bad debt is recorded. Trinidad also analyzes the provision for bad debt regularly to determine if any of the accounts provided for should be written off. These accounts that are deemed uncollectible could materially change as a result of changes in customers’ financial situations.
Income taxes
Trinidad calculates an income tax provision in each of the jurisdictions in which it operates. Estimation of income taxes includes evaluating the recoverability of deferred tax assets based on an assessment of the ability to use the underlying future tax deductions against future taxable income before the deductions expire. The assessment is based upon existing tax laws and estimates of future taxable income. Furthermore, there are many transactions and calculations for which the ultimate tax determination is uncertain during the ordinary course of business.
Trinidad maintains provisions for uncertain tax positions that it believes appropriately reflect its risks with respect to tax matters under active discussion, audit, dispute or appeal with tax authorities, or which are otherwise considered to involve uncertainty. These provisions are made using the best estimates of the amounts expected to be paid based on a qualitative assessment of all relevant factors. Trinidad reviews the adequacy of these provisions at each reporting period. However, it is possible that at some future date an additional liability could result from audits by taxation authorities. Where the final outcome of these tax-related matters is different from the amounts that were initially recorded, such differences will affect the tax provisions in the period in which such determination is made.
2017 ANNUAL REPORT 37

Determination of functional currency
The determination of the functional currency is a matter of determining the primary economic environment in which an entity operates. IAS 21 - The Effects of Changes in Foreign Exchange Rates (IAS 21) sets out a number of factors to apply in making the determination of the functional currency. However, applying the factors in IAS 21 does not always result in a clear indication of functional currency. Where IAS 21 factors indicate differing functional currencies within a subsidiary, Trinidad uses judgment in the ultimate determination of that subsidiary’s functional currency. Judgment was applied in the determination of the functional currency of the Company’s Mexican operating entity and labour company, whose functional currencies were determined to be the US dollar and Mexican peso, respectively. The functional currency of the Canadian operations was determined to be the Canadian dollar and the US and international operations was determined to be the US dollar. The functional currency of the Manufacturing operations consists of Canadian and US manufacturing divisions whose functional currencies were determined to be Canadian and US dollars, respectively. The functional currency of the Company's operating entities in the United Arab Emirates was determined to be the US dollar. The functional currency of Trinidad’s joint venture operations is the US dollar, including operations in Saudi Arabia and Mexico (refer to the audited consolidated annual financial statements for further discussion on the determination of the functional currency of Trinidad's joint venture operations).
Revenue recognition
Revenue for contract drilling is only recognized when drilling has occurred and collectability is reasonably assured. If collection is subsequently determined to be in doubt, an allowance is recognized against accounts receivable with a corresponding expense included within general and administrative expense in the consolidated statements of operations and comprehensive income; revenue is not adjusted.
Early termination revenue occurs when a customer has decided to negotiate the termination of an existing drilling contract before the expiration of the original terms of the contract. Early termination revenue is recognized when an amount has been agreed upon by both parties, collection is probable, and the Company does not have any further services to render in order to earn the estimated revenue. These amounts are generally recorded as lump sum payments when a contract is canceled. Some early termination contracts include a clause that would nullify a portion of the early termination revenue if the rig was re-contracted to a new customer. In these cases, the Company recognizes the early termination amounts on a monthly basis as earned until the contract is complete or the rig is re-contracted and the early termination clause is nullified. Amounts collected are recorded in deferred revenue initially and amortized into revenue per an appropriate recognition method.
Standby revenue occurs when a rig is contracted to a customer and drilling has been suspended for a period of time. The amount recorded is based on a standby rate included in the drilling contract. Standby revenues are recognized when the terms of the drilling contract include a standby clause, an amount has been agreed upon by both parties, and collection is probable. Standby contracts generally include a clause that if the rig is re-contracted to another customer, the standby rate is no longer applicable. Therefore, the Company recognizes these amounts on a monthly basis until the standby contract is complete or the rig is re-contracted and the standby contract is nullified.
Trinidad uses the percentage of completion method to account for certain long-term construction contracts in the Manufacturing operations. These contracts represent cost-plus type contracts. Total actual costs are compared to total expected costs to evaluate the percentage completion of the relevant project. This percentage is then applied to the expected revenue of the project. This method of accounting for contracts requires Trinidad to make estimates regarding the total costs of the project, progress against the project schedule and the estimated completion date, all of which impact the amount of revenue and gross margin recognized in each reporting period. Senior management reviews these estimates at each reporting period.
38 TRINIDAD DRILLING

Segment reporting
An operating segment is a component of the Company that engages in business activities from which it earns revenues and incurs expenses, including revenues and expenses from transactions with other Trinidad segments. The Company determines its operating segments based on information that is internally generated and used by the chief operating decision makers within the Company to make determinations about allocation of resources and assessments of performance.
Trinidad noted that per IAS 8 - Operating segments (IAS 8), Trinidad’s joint venture operations did not meet the quantitative thresholds required to be separately reportable. However, as management believes it would be useful for users of the financial statements to have this segment separately disclosed, this information was taken into consideration.
Accordingly, Trinidad has identified five operating segments.
• Canadian operations - includes land drilling services.
• US and international operations - includes land and barge drilling services located in both the US and international markets and technology operations in the US. The segment excludes all joint venture operations. (Note - As of December 31, 2016, Trinidad sold all barge rig assets.)
• Joint venture operations - includes all international joint venture operations.
• Manufacturing operations - includes manufacturing work performed in each of the Canadian and US manufacturing divisions. (Note - As of December 31, 2016, Trinidad no longer operates the manufacturing divisions.)
• Corporate - includes all non-operating activities and acts as a support function to the other segments.
Purchase price allocation
The measurement of each business combination requires management estimation in determining the fair values of assets and liabilities acquired as well as the fair value of any intangible assets identified. Management is required to estimate future cash flows, discount rates and market conditions at the date of the acquisition in order to determine the fair value of certain identified intangible assets.
Goodwill
Goodwill is the consideration paid in excess of the fair values of all identifiable assets and liabilities of an acquired business as of the acquisition date. Goodwill acquired through a business combination is allocated to each segment that is expected to benefit from the business combination.
Basis of consolidation
The consolidated financial statements include the accounts of Trinidad and the subsidiaries it controls. Control exists when the Company has power over the subsidiary; is exposed, or has rights, to variable returns from involvement with the subsidiary and has the ability to affect the returns through the use of its power over the subsidiary. The financial statements of the Trinidad subsidiaries are prepared for the same reporting period and apply policies that are consistent with the parent company. All inter-company balances and transactions between Trinidad and each of its wholly owned subsidiaries have been eliminated.
2017 ANNUAL REPORT 39

Non-controlling interest
Non-controlling interests are investments in which Trinidad holds less than a 100 percent interest. These investments are initially measured at fair value or at the non-controlling interest’s proportionate share of the acquiree’s identifiable assets. The investment is increased or decreased by the non-controlling interest’s share of subsequent changes in net (loss) and comprehensive (loss), as well as dividends or cash disbursements paid to the investors. A change in the ownership interests that does not result in a loss of control is accounted for as an adjustment to equity, unless the investment is required to be classified as a liability.
For non-wholly owned subsidiaries, interests held by external parties that the Company consolidates are shown as non-controlling interest and are included in total net (loss) and total other comprehensive (loss). These interests are classified as a liability on the statement of financial position as the non-wholly owned subsidiary’s shares are required to be redeemed for cash on a fixed or determinable date.
Joint arrangements
A joint arrangement is an arrangement in which two or more parties have joint control and must act together to direct the activities that significantly affect the returns of the arrangement. Under IFRS 11 - Joint arrangement, the Company classifies its interest in joint arrangements as either joint operations or joint ventures. When making this assessment, the Company considers the structure and contractual terms of the arrangement, as well as the legal form of any separate vehicles, in addition to all other relevant facts and circumstances.
Joint operations are recognized on a proportionate consolidation basis by including the Company’s share of assets, liabilities, revenues and expenses and other comprehensive income in each of the respective consolidated accounts. Joint ventures are recognized using the equity method of accounting. The Company’s share of individual assets and liabilities are recognized as investments in the joint venture account on the consolidated statements of financial position, and revenues and expenses are recognized with net earnings as a gain/loss from investments in joint venture account on the consolidated statements of operations and comprehensive income.
Trinidad participates in a joint venture, Trinidad Drilling International (TDI), with Halliburton. Trinidad owns 60% of the shares of TDI and each of the joint parties have equal voting rights. Trinidad considers the investment to be a financial asset at fair value through profit or loss and recognizes changes in fair value of the investment in the statement of operations and comprehensive income (loss) as a gain (loss) from joint ventures.
Trinidad participates in other joint ventures that are considered immaterial for reporting purposes. In all cases, the joint venture partners have joint control over the relevant activities of the joint venture, and as such are accounted for in these consolidated financial statements using the equity method of accounting.
Financial instruments - recognition and measurement
All financial instruments are measured at fair value upon initial recognition of the transaction. Measurement in subsequent periods is dependent on whether the instrument is classified as a “financial asset or financial liability at fair value through profit or loss”, or “financial liabilities measured at amortized cost” or “financial assets or financial liabilities at fair value through other comprehensive income”.
The Company currently holds both the Trinidad Drilling International (TDI) joint venture as well as the Non-controlling interest as “financial assets or financial liabilities at fair value through profit or loss”. Changes in fair value are recognized in the consolidated statements of operations and comprehensive income. Trinidad assesses the value of the TDI joint venture and the non controlling interest liability by using a discounted cash flow model. This calculation requires the use of estimates, including: future drilling activity and utilization of the drilling rigs, prices, operating costs, discount rates, timing of new property and equipment and other assumptions. A change in an estimate used can change the calculated fair value of this investment. If the fair value calculated is different from the net book value of this investment, an entry is recorded with the offset recorded through the consolidated statements of operations and comprehensive income (loss).
40 TRINIDAD DRILLING

Trinidad’s “financial liabilities measured at amortized cost” consist of bank indebtedness, accounts payable and accrued liabilities, dividends payable, and long-term debt. They are recognized at amortized cost, using the effective interest rate method, at each reporting period, net of transaction costs directly attributable to the issuance of the long-term debt. Transaction costs related to the issuance of any long-term debt are netted against the carrying value of the associated long-term debt and amortized as part of financing costs over the life of that debt using the effective interest rate method.
The Company currently has no “financial assets or financial liabilities at fair value through other comprehensive income”.
New standards adopted
Statement of Cash Flows (IAS 7): The Company has adopted the disclosure requirements in Disclosure Initiative (Amendments to IAS 7) as of the effective date of January 1, 2017. Additional disclosures for changes in liabilities arising from financing activities has been included in Note 24 of the consolidated financial statements for the year ended December 31, 2017. As allowed by IAS 7, comparative information has not been presented.
New standards not yet adopted
A number of new standards and amendments to existing standards have been issued by the IASB that are effective after December 31, 2017 and, therefore, have not been applied to these financial statements. These new standards and amendments, and their anticipated impact on Trinidad’s consolidated financial statements once they are adopted, are as follows:
Financial Instruments (IFRS 9): In July 2014, the IASB issued final amendments to IFRS 9. These amendments to IFRS 9 introduce a single, forward-looking ‘expected loss’ impairment model for financial assets which will require more timely recognition of expected credit losses, and a fair value through other comprehensive income category for financial assets that are debt instruments.
The amendments are effective for annual periods beginning on or after January 1, 2018. Trinidad does not expect the change in the impairment model to have a material impact on the consolidated financial statements.
Revenue from Contracts with Customers (IFRS 15): In May 2014, the IASB issued IFRS 15, which replaces the previous guidance on revenue recognition and provides a framework to record revenue from contracts for the sale of goods or services, unless the contracts are in the scope of IAS 17 - Leases or other IFRS standards. Under IFRS 15, revenue is to be recognized to depict the transfer of goods or services in an amount that reflects the consideration to which the entity expects to be entitled following five steps:
1. Identify the contract with a customer2. Identify the performance obligations in the contract3. Determine the transaction price4. Allocate the transaction price to the performance obligations in the contract5. Recognize revenue when (or as) the entity satisfies a performance obligation
The new standard is effective for annual periods beginning on or after January 1, 2018, using either a full retrospective approach or a modified retrospective approach. Trinidad will adopt IFRS 15 on January 1, 2018. The Company is currently reviewing its sales contracts with customers and does not expect IFRS 15 to have a material impact on the consolidated financial statements. Upon adoption, the Company will expand its disclosures in the notes to the consolidated financial statements.
Leases (IFRS 16): In January 2016, IASB issued IFRS 16 to replace the guidance currently found in IAS 17. The new standard replaces the previous guidance on lease recognition and establishes principles for recognition, measurement, presentation and disclosure of leases, with the objective of ensuring that lessees and lessors provide relevant information that faithfully represents those transactions. The new standard brings most leases on-balance sheet for lessees under a single model, eliminating the distinction between operating and finance leases. Lessor accounting however will remain
2017 ANNUAL REPORT 41

largely unchanged and the distinction between operating and finance leases is retained. The amendments are effective for annual periods beginning on or after January 1, 2019, with early application permitted if IFRS 15, has also been applied. IFRS 16 will be adopted by Trinidad on January 1, 2019. The Company is currently reviewing contracts that are identified as leases and assessing the impact of this standard on its consolidated financial statements.
Disclosure Controls and Procedures and Internal Controls over Financial Reporting
There have been no significant changes in the Company's disclosure controls and procedures (DC&P) and internal controls over financial reporting (ICFR) for the year ended December 31, 2017. In addition, no material weaknesses or significant deficiencies have been identified in the design and operating effectiveness of these controls which could materially affect, or are reasonably likely to affect, Trinidad's ICFR.
Trinidad has limited the scope of its design of DC&P and ICFR to exclude the controls, policies and procedures of RigMinder. The Company does not believe that there are issues in the DC&P and ICFR included in RigMinder; however, due to on-going integration of systems, the Company has chosen to take the scope limitation. Trinidad acquired all of the issued and outstanding shares of RigMinder on August 25, 2017. The limitation is due to the time restraints for Management to assess the controls design and effectiveness, given the proximity of the acquisition to the period-end. From the date of acquisition on August 25, 2017, RigMinder contributed less than $0.1 million of revenue and $0.5 million of net loss before tax, respectively for the Company. Additionally, RigMinder had current assets and current liabilities as at December 31, 2017 of $0.4 million and $12.4 million, respectively, and non-current assets and non-current liabilities of $58.6 million and $7.0 million, respectively. Included in current and non-current liabilities are the contingent considerations related to the acquisition.
Related Party Transactions
Trinidad engages the law firm of Blake, Cassels & Graydon LLP to provide legal advice. One partner of this law firm is an officer of the Company. During the year ended December 31, 2017, Trinidad incurred legal fees of $2.0 million (2016 - $0.8 million) to Blake, Cassels & Graydon LLP. At December 31, 2017, $0.3 million was due to Blake, Cassels & Graydon LLP (December 31, 2016 - nil).
Trinidad is party to a joint venture arrangement with a wholly-owned subsidiary of Halliburton to operate drilling rigs outside of Canada and the United States through a jointly owned entity. During the year ended December 31, 2017, Trinidad recorded revenue from Halliburton of nil (2016 - $0.3 million).
Business Risks
The business of Trinidad is subject to certain risks and uncertainties. Prior to making any investment decision regarding Trinidad, investors should carefully consider, among other things, the risks described herein (including the risks and uncertainties listed in the Forward-Looking Statements section in this MD&A) and the risk factors set forth in the most recently filed Annual Information Form of the Company which is incorporated by reference herein. The Annual Information Form has been filed with SEDAR and can be accessed at www.sedar.com. Copies may be obtained on request and without charge, by contacting Trinidad at (403) 265-6525.
42 TRINIDAD DRILLING

Non-GAAP Measures Definitions
This MD&A contains references to certain financial measures and associated per share data that do not have any standardized meaning prescribed by IFRS and may not be comparable to similar measures presented by other companies. These financial measures are computed on a consistent basis for each reporting period and include: adjusted EBITDA, adjusted EBITDA from investments in joint ventures, working capital, Senior Debt to Bank EBITDA, Bank EBITDA to Cash Interest Expense, drilling days, operating days, utilization rate - drilling day, utilization rate - operating day, and rate per operating day or dayrate. These non-GAAP measures are identified and defined as follows:
“Adjusted EBITDA” is used by management and investors to analyze the Company's profitability based on the Company's principal business activities prior to how these activities are financed, how assets are depreciated and amortized and how the results are taxed in various jurisdictions. Additionally, in order to focus on the core business alone, amounts are removed related to foreign exchange, share-based payment expense, impairment expenses, the sale of assets, and fair value adjustments on financial assets and liabilities, as the Company does not deem these to relate to the core drilling business. Adjusted EBITDA also takes into account the Company’s portion of the principal activities of the joint venture arrangements by removing the (gain) from investments in joint ventures and including adjusted EBITDA from investments in joint ventures. Adjusted EBITDA is not intended to represent net (loss) as calculated in accordance with IFRS. Adjusted EBITDA is calculated using 100% of the related amounts from all entities controlled by Trinidad where Trinidad may not hold 100% of the outstanding shares.
Adjusted EBITDA is calculated as follows:
For the years ended December 31,
($ thousands) 2017 2016
Net (loss) (80,481) (53,635)
Plus:
Finance and transaction costs 42,059 55,824
Depreciation and amortization 199,962 171,746
Income taxes (58,815) (34,160)
EBITDA 102,725 139,775
Plus:
(Gain) on sale of assets (2,166) (11,317)
Impairment of property and equipment 2,993 -
Share-based payment expense 1,405 8,434
Foreign exchange loss (gain) 9,295 (3,374)
Fair value adjustments 2,052 (9,398)
(Gain) from investments in joint ventures (17,659) (12,929)
Adjusted EBITDA from investments in joint ventures 30,800 31,811
Adjusted EBITDA 129,445 143,002
2017 ANNUAL REPORT 43

“Adjusted EBITDA from investments in joint ventures” is used by management and investors to analyze the results generated by the Company's joint venture operations prior to how these activities are financed, how assets are depreciated and amortized and how the results are taxed in various jurisdictions. Additionally, in order to focus on the core drilling business, amounts related to foreign exchange, dividend expense, dividend re-class, impairment adjustments to property and equipment, as well as preferred share valuation and the sale of assets are removed. Lastly, amounts recorded for the revaluation on the investment of the TDI joint venture are removed as these are non-cash items and unrelated to the operations of the business. Adjusted EBITDA from investments in joint ventures is not intended to represent net (loss) as calculated in accordance with IFRS.
Adjusted EBITDA from investment in joint ventures is calculated as follows:
For the years ended December 31,
($ thousands) 2017 2016
Gain from investments in joint ventures 17,659 12,929
Plus:
Finance costs 518 1,169
Depreciation and amortization 21,769 21,617
Income taxes 1,901 2,901
EBITDA 41,847 38,616
Plus:
Loss (gain) on sale of property and equipment 447 (4)
Share-based payment expense - 91
Dividend - 14,891
Foreign exchange 349 1,055
TDI fair value adjustment (13,216) (7,353)
Preferred share valuation 6,359 (15,485)
Dividend re-class (4,986) -
Adjusted EBITDA from investments in joint ventures 30,800 31,811
“Working capital” is used by management and the investment community to analyze the operating liquidity available to the Company.
Working capital is derived from the consolidated statements of financial position and is calculated as follows:
As at December 31, December 31,
($ thousands) 2017 2016
Current assets 151,771 129,927
Less:
Current liabilities 107,339 81,806
Working capital 44,432 48,121
44 TRINIDAD DRILLING

“Senior Debt to Bank EBITDA” is defined as the consolidated balance of the revolving facility and other debt secured by a lien at quarter end to consolidated Bank EBITDA for the trailing 12 months (TTM). Bank EBITDA used in this financial ratio is calculated as net earnings before interest, taxes, depreciation and amortization, plus impairment expense, loss (gain) on sale of assets, loss (gain) from investments in joint ventures, share-based payment expense, fair value adjustments on financial assets and liabilities and unrealized foreign exchange. Bank EBITDA also includes all distributions received from the Company's joint ventures during the period.
“Bank EBITDA to Cash Interest Expense” is defined as the consolidated Bank EBITDA for TTM to the cash interest expense on all debt balances for TTM. Bank EBITDA used in this financial ratio is calculated as net earnings before interest, taxes, depreciation and amortization, plus impairment expense, loss (gain) on sale of assets, loss (gain) from investments in joint ventures, share-based payment expense, fair value adjustments on financial assets and liabilities and unrealized foreign exchange. Bank EBITDA also includes all distributions received from the Company's joint ventures during the period.
“Drilling days” is defined as rig days between spud to rig release.
“Operating days” is defined as moving days (move in, rig up and tear out) plus drilling days (spud to rig release).
“Utilization rate - drilling day” is defined as drilling days divided by total available rig days.
“Utilization rate - operating day” is defined as operating days divided by total available rig days.
“Rate per operating day” or “Dayrate” is defined as operating revenue (net of third party costs) divided by operating days (drilling days plus moving days).
2017 ANNUAL REPORT 45

Additional GAAP Measures Definitions
To assess performance, the Company uses certain additional GAAP financial measures within the financial statements and MD&A that are not defined terms under IFRS. Management believes that these measures provide useful supplemental information to investors, and provide the reader a more accurate reflection of our industry. These financial measures are computed on a consistent basis for each reporting period and include Operating revenue or Revenue, net of third party costs, Funds flow, Operating income, Operating income percentage and Operating income - net percentage. These additional GAAP measures are defined as follows:
"Operating revenue" or "Revenue, net of third party costs" is defined as revenue earned for drilling activities excluding all third party revenues. Third party revenues mainly consist of rental activities and other services provided by third parties for which Trinidad does not earn a mark-up on. This metric is used by analysts and investors to assess the operations of each segment based on the core drilling business alone and more accurately reflects the health of those operations. The operating revenue for each reportable segment is disclosed in the segmented information included in the consolidated financial statements.
“Funds flow” is used by management and investors to analyze the funds generated by Trinidad’s principal business activities prior to consideration of working capital, which is primarily made up of highly liquid balances. This balance is reported in the consolidated statements of cash flows included in the cash flows from operating activities section.
“Operating income” is used by management and investors to analyze overall and segmented operating performance. Operating income is not intended to represent an alternative to net (loss) or other measures of financial performance calculated in accordance with IFRS. Operating income is calculated from the consolidated statements of operations and comprehensive (loss) and from the segmented information contained in the notes to the consolidated financial statements. Operating income is defined as revenue less operating expenses.
“Operating income percentage” is used by management and investors to analyze overall and segmented operating performance, including third party recovery and third party costs, as well as inter-segment revenue and inter-segment operating costs. Operating income percentage is calculated from the consolidated statements of operations and comprehensive (loss) and from the segmented information in the notes to the consolidated financial statements. Operating income percentage is defined as operating income divided by revenue.
“Operating income - net percentage” is used by management and investors to analyze overall and segmented operating performance excluding third party recovery and third party costs, as well as inter-segment revenue and inter-segment operating costs, as these revenue and expenses do not have an effect on consolidated net (loss). Operating income - net percentage is calculated from the consolidated statements of operations and comprehensive (loss) and from the segmented information in the notes to the consolidated financial statements. Operating income - net percentage is defined as operating income less third party G&A expenses divided by revenue net of operating and G&A third party costs.
Trinidad is an industry-leading contract driller, providing safe, reliable, expertly-designed equipment operated by well-trained and experienced personnel. Trinidad's drilling fleet is one of the most adaptable, technologically advanced and competitive in the industry. Trinidad provides contract drilling and related services in Canada, the US, the Middle East and Mexico.
Brent Conway Lesley M. BolsterPresident and Chief Executive Officer Chief Financial Officer
46 TRINIDAD DRILLING

Management’s Report to the Shareholders
The financial statements of Trinidad Drilling Ltd. (“Trinidad” or the “Company”) and all information contained in this annual report are the responsibility of the management of Trinidad.
The consolidated financial statements have been prepared by management in accordance with International Financial Reporting Standards, and include certain estimates that are based on management’s best judgments. Actual results may differ from these estimates and judgments. In the opinion of management the consolidated financial statements are presented fairly in all material respects. The financial information contained elsewhere in the annual report has been reviewed to ensure consistency with that of the consolidated financial statements.
Management has developed and maintains a system of internal controls to provide reasonable assurance that transactions are properly authorized, assets are safeguarded and financial records are properly maintained to provide reliable information for the preparation of financial reporting.
The Audit Committee of Trinidad is responsible for reviewing and approving the financial statements and ensures that management fulfills its responsibility for financial reporting. The Audit Committee meets with management, as well as the external auditors, to discuss internal controls over the financial reporting process, auditing matters and financial reporting issues to satisfy itself that each party is properly discharging its responsibilities. The Audit Committee reports its findings to the Board of Directors for consideration in approving the consolidated financial statements. For the year ended December 31, 2017, the consolidated financial statements have been approved by the Board of Directors on the recommendation of the Audit Committee.
PricewaterhouseCoopers LLP, an independent firm of chartered accountants, was engaged by the Board of Directors and appointed by the shareholders to audit Trinidad’s consolidated financial statements in accordance with International Financial Reporting Standards and provide an independent professional opinion. PricewaterhouseCoopers has full and free access to the Audit Committee.
Brent Conway Lesley M. BolsterPresident and Chief Executive Officer Chief Financial Officer
February 26, 2018
2017 ANNUAL REPORT 47

Independent Auditor’s Report
To the Shareholders of Trinidad Drilling Ltd.
We have audited the accompanying consolidated financial statements of Trinidad Drilling Ltd. and its subsidiaries, which comprise the consolidated statements of financial position as at December 31, 2017 and December 31, 2016 and the consolidated statements of operations and comprehensive (loss), changes in equity, and cash flows for the years then ended, and the related notes, which comprise a summary of significant accounting policies and other explanatory information.
Management’s responsibility for the consolidated financial statements
Management is responsible for the preparation and fair presentation of these consolidated financial statements in accordance with International Financial Reporting Standards, and for such internal control as management determines is necessary to enable the preparation of consolidated financial statements that are free from material misstatement, whether due to fraud or error.
Auditor’s responsibility
Our responsibility is to express an opinion on these consolidated financial statements based on our audits. We conducted our audits in accordance with Canadian generally accepted auditing standards. Those standards require that we comply with ethical requirements and plan and perform the audit to obtain reasonable assurance about whether the consolidated financial statements are free from material misstatement.
An audit involves performing procedures to obtain audit evidence about the amounts and disclosures in the consolidated financial statements. The procedures selected depend on the auditor’s judgment, including the assessment of the risks of material misstatement of the consolidated financial statements, whether due to fraud or error. In making those risk assessments, the auditor considers internal control relevant to the entity’s preparation and fair presentation of the consolidated financial statements in order to design audit procedures that are appropriate in the circumstances, but not for the purpose of expressing an opinion on the effectiveness of the entity’s internal control. An audit also includes evaluating the appropriateness of accounting policies used and the reasonableness of accounting estimates made by management, as well as evaluating the overall presentation of the consolidated financial statements.
We believe that the audit evidence we have obtained in our audits is sufficient and appropriate to provide a basis for our audit opinion.
Opinion
In our opinion, the consolidated financial statements present fairly, in all material respects, the financial position of Trinidad Drilling Ltd. and its subsidiaries as at December 31, 2017 and December 31, 2016 and their financial performance and their cash flows for the years then ended in accordance with International Financial Reporting Standards.
Opinion In our opinion, the consolidated financial statements present fairly, in all material respects, the financial position of Trinidad Drilling Ltd. and its subsidiaries as at December 31, 2016 and December 31, 2015 and their financial performance and their cash flows for the years then ended in accordance with International Financial Reporting Standards. Chartered Professional Accountants Chartered Professional Accountants
February 26, 2018
48 TRINIDAD DRILLING

Consolidated Statements of Financial Position
As at December 31, December 31,
($ thousands) 2017 2016
Assets
Current Assets
Cash and cash equivalents (Note 4) 3,948 25,780
Accounts receivable 118,612 91,062
Inventory 5,971 7,907
Prepaid expenses 3,657 4,960
Asset held for sale (Note 6) 19,583 218
151,771 129,927
Property and equipment (Note 7) 1,363,815 1,482,897
Intangible assets and goodwill (Note 8) 90,339 33,706
Deferred income taxes (Note 11) 82,872 72,873
Investment in joint ventures (Note 9) 214,976 262,673
1,903,773 1,982,076
Liabilities
Current Liabilities
Accounts payable and accrued liabilities 106,694 79,388
Deferred revenue and customer deposits 645 459
Current portion of long-term debt (Note 10) - 1,959
107,339 81,806
Long-term debt (Note 10) 511,674 601,057
Contingent consideration (Notes 5 & 17) 7,035 -
Deferred income taxes (Note 11) 5,474 49,348
Non-controlling interest (Notes 12 & 17) 8,863 7,197
640,385 739,408
Shareholders’ Equity
Common shares (Note 13) 1,525,633 1,374,656
Contributed surplus 65,292 65,087
Accumulated other comprehensive income 128,655 179,499
Deficit (456,192) (376,574)
1,263,388 1,242,668
1,903,773 1,982,076
Commitments and contingencies (Note 18)
(See Notes to the Consolidated Financial Statements)
2017 ANNUAL REPORT 49

Consolidated Statements of Operations and Comprehensive (Loss)
For the years ended December 31,
($ thousands) 2017 2016
Revenue
Oilfield service revenue 499,978 359,889
Other revenue 1,637 2,255
501,615 362,144
Expenses
Operating expense (Note 22) 344,295 202,567
General and administrative (Note 22) 60,080 56,820
Depreciation and amortization (Note 7 & 8) 199,962 171,746
Foreign exchange (Note 22) 9,295 (3,374)
(Gain) on sale of assets (Note 7) (2,166) (11,317)
Impairment of property and equipment (Note 7) 2,993 -
614,459 416,442
(Gain) from investments in joint ventures (1) (Note 9) (17,659) (12,929)
Finance and transaction costs (Note 22) 42,059 55,824
Fair value adjustments (2) (Note 12) 2,052 (9,398)
(Loss) before income taxes (139,296) (87,795)
Income taxes
Current (Note 11) 929 (871)
Deferred (Note 11) (59,744) (33,289)
(58,815) (34,160)
Net (loss) (80,481) (53,635)
Other comprehensive (loss)
Foreign currency translation adjustment
for foreign operations, net of income tax (Note 23) (50,844) (24,448)
Foreign currency translation adjustment
for non-controlling interests, net of income tax (Note 12) (761) (144)
(51,605) (24,592)
Total comprehensive (loss) (132,086) (78,227)
Net (loss) attributable to:
Shareholders of Trinidad (79,618) (52,546)
Non-controlling interests (Note 12) (863) (1,089)
Total comprehensive (loss) attributable to:
Shareholders of Trinidad (130,462) (76,994)
Non-controlling interests (Note 12) (1,624) (1,233)
Earnings per share
Basic / Diluted (Note 15) (0.30) (0.24)
(1) (Gain) from investments in joint ventures includes Trinidad's portion of the net (gain) loss in all joint ventures as well as the fair value adjustment related to the TDI joint venture as this is held as a financial asset.
(2) Fair value adjustments includes the fair value adjustments on the contingent considerations related to the RigMinder business combination and the fair value of the non-controlling interests liability. For the year ended December 31, 2017, the fair value on the contingent consideration was less than $1.1 million (2016 - nil). For the year ended December 31, 2017, the fair value on the non-controlling interests liability was $3.1 million (December 31, 2016 - $(9.4) million).
(See Notes to the Consolidated Financial Statements)
50 TRINIDAD DRILLING

Consolidated Statements of Changes in Equity
For the years ended December 31, 2017 and 2016
($ thousands)
Common
shares
Contributed
surplus
Accumulated
other
comprehensive
income (1) (Deficit)
Total
equity
Balance at December 31, 2016 1,374,656 65,087 179,499 (376,574) 1,242,668
Issuance of shares (Note 13) 155,782 - - - 155,782
Share issuance costs (net of tax) (Note 13) (4,805) - - - (4,805)
Share-based payment expense (Note 14) - 205 - - 205
Total comprehensive (loss) (Note 23) - - (50,844) (79,618) (130,462)
Balance at December 31, 2017 1,525,633 65,292 128,655 (456,192) 1,263,388
Balance at December 31, 2015 1,374,656 64,884 203,947 (324,028) 1,319,459
Share-based payment expense (Note 14) - 203 - - 203
Total comprehensive (loss) (Note 23) - - (24,448) (52,546) (76,994)
Balance at December 31, 2016 1,374,656 65,087 179,499 (376,574) 1,242,668
(1) Accumulated other comprehensive income consists of the foreign currency translation adjustment. All amounts will be reclassified to profit or loss when specific conditions are met.
(See Notes to the Consolidated Financial Statements)
2017 ANNUAL REPORT 51

Consolidated Statements of Cash Flows
For the years ended December 31,($ thousands) 2017 2016
Cash (used in) provided byOperating activitiesNet (loss) (80,481) (53,635)
Adjustments for:Depreciation and amortization (Notes 6 & 7) 199,962 171,746
Foreign exchange (Note 22) 9,295 (3,374)
(Gain) on sale of assets (Note 7) (2,166) (11,317)
Impairment of property and equipment (Note 7) 2,993 -
(Gain) from investments in joint ventures (1) (Note 9) (17,659) (12,929)
Finance and transaction costs (Note 22) 42,059 55,824
Fair value adjustments (Note 12) 2,052 (9,398)
Income taxes (Note 11) (58,815) (34,160)
Interest income - (2)
Other (2) 2,009 11,811
Income taxes paid (1,643) (2,138)
Income taxes recovered 2,031 760
Interest paid (48,208) (50,572)
Interest received - 2
Funds flow 51,429 62,618
Change in non-cash operating working capital (Note 24) (30,954) (32,308)
Cash flow provided by operating activities 20,475 30,310
Investing activitiesPurchase of property and equipment (163,117) (44,326)
Proceeds from disposition of assets 3,996 18,894
Net investments in joint ventures (Note 9) 9,123 13,138
Distribution and dividends received from joint venture (Note 9) 40,149 21,509
Acquisition of RigMinder (net) (Note 5) (31,396) -
Purchase of intangibles (Note 8) (4,038) -
Change in non-cash working capital (Note 24) 24,820 14,726
Cash flow (used in) provided by investing activities (120,463) 23,941
Financing activitiesProceeds from long-term debt (Note 10) 164,268 138,252
Repayments of long-term debt (Note 10) (81,606) (227,346)
Purchase of non-controlling interest (Note 12) (200) -
Issuance of shares 149,500 -
Share issuance costs (Note 5) (6,561) -
Dividends paid - (2,221)
Proceeds from 2025 Senior Notes (Note 10) 461,860 -
Repayments of 2019 Senior Notes (Note 10) (591,670) -
Debt issuance costs (Note 24) (11,458) (762)
Cash flow provided by (used in) financing activities 84,133 (92,077)
Cash flow from operating, investing and financing activities (15,855) (37,826)
Effect of translation of foreign currency cash (5,977) (80)
(Decrease) in cash for the year (21,832) (37,906)
Cash and cash equivalents - beginning of year 25,780 63,686
Cash and cash equivalents - end of year 3,948 25,780
(1) (Gain) loss from investments in joint ventures includes Trinidad's portion of net (loss) income in all joint ventures and the TDI joint venture fair value adjustment as this is held as a financial asset.
(2) Other includes share-based payment expense of $1.4 million (2016 - $8.4 million) and elimination of upstream and downstream transactions between Trinidad and the Joint Venture Operations.
(See Notes to the Consolidated Financial Statements)
52 TRINIDAD DRILLING

NOTES TO THE CONSOLIDATED FINANCIAL STATEMENTS
1. Structure of the Corporation
Organization
Trinidad Drilling Ltd. (“Trinidad” or the “Company”) is incorporated under the laws of the Province of Alberta, Canada. The Company was formed by way of an arrangement under the Business Corporations Act of Alberta pursuant to an arrangement agreement effective March 10, 2008 between the Company and Trinidad Energy Services Income Trust. Trinidad’s principal place of business is located at 1000, 585 - 8th Avenue SW, Calgary, Alberta.
Operations
Trinidad is an industry-leading contract driller, providing safe, reliable, expertly-designed equipment operated by well-trained and experienced personnel. Trinidad's drilling fleet is one of the most adaptable, technologically advanced and competitive in the industry. Trinidad provides contract drilling and related services in Canada, the US, the Middle East and Mexico.
The Company trades on the Toronto Stock Exchange under the symbol TDG.
2. Basis of Presentation
Statement of compliance
These consolidated financial statements were prepared in accordance with International Financial Reporting Standards (IFRS) as issued by the International Accounting Standards Board (IASB).
These consolidated financial statements were authorized for issuance by the Board of Directors as of February 26, 2018.
Measurement basis
These consolidated financial statements are presented in Canadian dollars, assuming the Company will continue as a going concern for the foreseeable future. These consolidated financial statements are prepared on a historical cost basis except as specifically noted within these notes.
Segment reporting
An operating segment is a component of the Company that engages in business activities from which it earns revenue and incurs expenses, including revenue and expenses from transactions with other Trinidad segments. The Company determines its operating segments based on information that is internally generated and used by the chief operating decision makers within the Company to make determinations about allocation of resources and assessments of performance.
Trinidad noted that per IAS 8 - Operating segments (IAS 8), Trinidad's joint venture operations did not meet the quantitative thresholds required to be separately reportable. However, as management believes it would be useful for users of the financial statements to have this segment separately disclosed, this information was taken into consideration.
2017 ANNUAL REPORT 53

Accordingly, Trinidad has identified five operating segments.
• Canadian operations - includes land drilling services.
• US and international operations - includes land and barge drilling services located in both the US and international markets and technology operations in the US. The segment excludes all joint venture operations. (Note - As of December 31, 2016, Trinidad sold all barge rig assets.)
• Joint venture operations - includes US and international joint venture operations.
• Manufacturing operations - includes manufacturing work performed in each of the Canadian and US manufacturing divisions. (Note - As of December 31, 2016, Trinidad no longer operates the manufacturing divisions.)
• Corporate - includes all non-operating activities and acts as a support function to the other segments.
Use of judgment and estimates
The preparation of the consolidated financial statements requires management to make judgments and estimates that affect the reported amounts of assets, liabilities, income and expenses. Judgments and estimates are continually evaluated and are based on historical experience and expectations of future events. While judgments and estimates used by Trinidad are believed to be reasonable under current circumstances, actual results could differ.
Significant judgements are used in the application of accounting policies related to the following material amounts recognized in the consolidated financial statements:
a. Determination of functional currency. The determinations of the functional currency is a matter of determining the primary economic environment in which an entity operates. IAS 21 - The Effects of Changes in Foreign Exchange Rates (IAS 21) sets out a number of factors to apply in making the determination of the functional currency. However, applying the factors in IAS 21 does not always result in a clear indication of functional currency. Where IAS 21 factors indicate differing functional currencies within a subsidiary, Trinidad uses judgement in the ultimate determination of that subsidiary's functional currency. Judgement was applied in the determination of the functional currency of the Company's Mexican operating entity and labour company, whose functional currencies were determined to be the US dollar and Mexican peso, respectively. The functional currency of the Canadian operations was determined to be Canadian dollar and the US and international operations was determined to be the US dollar. The functional currency of the Manufacturing operations consisted of Canadian and US manufacturing divisions whose functional currencies were determined to be Canadian and US dollar, respectively. The functional currency of the Company's operating entities in the United Arab Emirates was determined to be the US dollar (refer to note 9 for details discussion of the determination of functional currency for joint venture operations).
b. Assessment of impairment indicators. Trinidad tests impairment of long-lived assets with determinate useful lives when indication of impairment exist. Application of judgement is required in determining whether an impairment test is warranted (note 7 and 8).
Trinidad uses significant estimates in the determination of a number of account balances. These estimates have significant risk of causing a material adjustment to the carrying amounts of the underlying assets and liabilities within the next fiscal year. Material accounts subject to significant estimates are as follows:
a. Depreciation of property and equipment. Refer to the Company's significant accounting policies (note 3) for a detailed discussion.
b. Income taxes. Refer to the Company's significant accounting policies (note 3) for a detailed discussion.
c. Impairment. Refer to the Company's significant accounting policies (note 3) for a detailed discussion of the valuation assessment and impairment of non-financial assets and financial instruments.
54 TRINIDAD DRILLING

d. Allowance of doubtful accounts. Trinidad regularly performs a review of outstanding accounts receivables balances greater than 90 days to determine eventual collectability. If an account is deemed uncollectible, a provisions for bad debt is recorded. Trinidad also analyzes the provisions for bad debt regularly to determine if any of the accounts provided for should be written off. These accounts which are deemed uncollectible could materially change as a result of changes in a customer's financial situation.
e. Revenue recognition. Refer to the Company's significant accounting policies (note 3) for a detailed discussion.
f. Purchase price equations. Refer to the business combinations note included in the Company's significant accounting policies (note 3) for a detailed discussion.
g. Contingent consideration. The contingent consideration relates to the liability incurred from the acquisition of RigMinder. Refer to the business combinations note included in the Company's significant account policies (note 3) for a detailed discussion.
Seasonality
Trinidad operates a substantial number of rigs in western Canada; therefore, operations are impacted by weather and seasonal factors. The winter season is typically a busy period as oil and natural gas companies take advantage of frozen ground conditions to move drilling rigs into regions that might otherwise be inaccessible to heavy equipment due to swampy conditions. Springtime normally encompasses a slow period referred to as spring break-up. During this period, melting conditions result in temporary municipal road bans that effectively prohibit the movement of drilling rigs. The remainder of the year is usually representative of average activity levels.
Trinidad’s expansion to the US and international markets has reduced its overall exposure to the seasonal factors that are present in its Canadian operations. These seasonal conditions typically limit Canadian drilling activity, whereas in the US and international areas, operators have more flexibility to work throughout the year. The activity in the US and international operations has allowed Trinidad to better manage its business with more sustainable cash flows throughout the annual cycle. However, industry conditions have an affect on how seasonality effects Trinidad's activity.
3. Significant Accounting Policies
Basis of consolidation
The consolidated financial statements include the accounts of Trinidad and the subsidiaries it controls. Control exists when the Company has power over the subsidiary, is exposed, or has rights, to variable returns from involvement with the subsidiary and has the ability to affect the returns through the use of its power over the subsidiary. The financial statements of the Trinidad subsidiaries are prepared for the same reporting period and apply policies that are consistent with the parent company. All inter-company balances and transactions between Trinidad and each of its wholly-owned subsidiaries have been eliminated.
Non-controlling interest
Non-controlling interests are investments in which Trinidad holds less than a 100 percent interest. These investments are initially measured at fair value or at the non-controlling interest’s proportionate share of the acquiree’s identifiable assets. The investment is increased or decreased by the non-controlling interest’s share of subsequent changes in net (loss) and comprehensive (loss), as well as dividends or cash disbursements paid to the investors. A change in the ownership interests that does not result in a loss of control is accounted for as an adjustment to equity, unless the investment is required to be classified as a liability.
For non-wholly owned subsidiaries, interests held by external parties that the Company consolidates are shown as non-controlling interest and are included in total net (loss) and total other comprehensive (loss). These interests are classified as a liability on the statement of financial position as the non-wholly owned subsidiary’s shares are required to be redeemed for cash on a fixed or determinable date.
2017 ANNUAL REPORT 55

Joint arrangements
A joint arrangement is an arrangement in which two or more parties have joint control and must act together to direct the activities that significantly affect the returns of the arrangement. Under IFRS 11 - Joint arrangement, the Company classifies its interest in joint arrangements as either joint operations or joint ventures. When making this assessment, the Company considers the structure and contractual terms of the arrangement, as well as the legal form of any separate vehicles, in addition to all other relevant facts and circumstances.
Joint operations are recognized on a proportionate consolidation basis by including the Company’s share of assets, liabilities, revenues and expenses and other comprehensive income in each of the respective consolidated accounts. Joint ventures are recognized using the equity method of accounting. The Company’s share of individual assets and liabilities are recognized as investments in the joint ventures account on the consolidated statements of financial position, and revenues and expenses are recognized with net earnings as a (gain) loss from investments in joint ventures account on the consolidated statements of operations and comprehensive income.
Trinidad participates in a joint venture, Trinidad Drilling International (TDI), with Halliburton. Trinidad owns 60% of the shares of TDI and each of the joint parties have equal voting rights. Trinidad considers the investment to be a financial asset at fair value through profit or loss and recognizes changes in fair value of the investment in the statements of operations and comprehensive income (loss) as a gain (loss) from joint ventures.
Trinidad participates in other joint ventures that are considered immaterial for reporting purposes. In all cases, the joint venture partners have joint control over the relevant activities of the joint venture, and as such are accounted for in these consolidated financial statements using the equity method of accounting.
56 TRINIDAD DRILLING

Cash and cash equivalents
Cash and cash equivalents are comprised of cash at bank and cash in hand, including offsetting bank overdrafts, short-term investments and similar instruments that have a maturity of three months or less at the date of acquisition. In reporting periods where bank overdrafts exceed cash and cash equivalents, the balance will be referred to as bank indebtedness.
Inventory
Inventory consists of parts, materials and labour related to the construction, recertification, refurbishment and maintenance of rigs and rig-related equipment. Inventory is measured at the lower of average cost or net realizable value.
Inventory cost is based on expenditures incurred to render the goods saleable and includes costs to acquire the parts, direct labour and related overhead. Net realizable value is based on the estimated selling price less cost to complete and sell in the ordinary course of business.
Assets held for sale
Non-current assets, and disposal groups, are classified as assets held for sale when the carrying amount is to be recovered principally through a sales transaction rather than through continued use. This condition is regarded as met only when the sale is highly probable and the asset or disposal group is available for immediate sale in its present condition. Management must be committed to the sale and it should be expected to be completed within one year from the date of classification. Non-current assets and disposal groups classified as held for sale are measured at the lower of the carrying value amount and fair value less cost to sell. Assets held for sale are not depreciated.
If an asset classified as an asset held for sale no longer meets the criteria required, whereby the completion of the sale within one year from the classification date is no longer relevant, or the Company has changed their plans of selling the asset, the asset is re-classified back to property and equipment. The value of the asset is then adjusted to the lower of either the carrying amount before the asset was classified as an asset held for sale, adjusted for depreciation and any other adjustments that would have taken place, or its recoverable amount at the date of the subsequent decision not to sell.
2017 ANNUAL REPORT 57

Property and equipment
Items of property and equipment are recorded at cost less accumulated depreciation and net impairment losses. Cost includes expenditures that are directly attributable to the acquisition of the asset. Costs associated with three year mandated major inspections, overhauls and re-certifications are capitalized. However, general repair and maintenance expenditures are expensed as incurred.
The cost of rigs constructed and upgrade projects includes cost of materials, direct labor, construction overhead and any other costs directly attributable in readying the asset for its intended use. Accumulated costs are reported as assets under construction until the related asset is ready for use, at which time it will be subject to depreciation. Advances to suppliers related to rig construction are reported as deposits on property and equipment and transferred to assets under construction as the underlying costs are incurred.
Disposals are removed at cost less accumulated depreciation and net impairment losses with any resulting gain or loss reflected as a separate line item in the consolidated statements of operations and comprehensive income.
When material parts of an item of property and equipment have different useful lives, they are accounted for as separate components. The cost less residual value of a component of property and equipment is depreciated over its estimated useful life as follows:
Rigs and related equipment
Land rigs
Drawworks, mast and substructure up to 20 years Straight-line (up to 10% salvage value)
Blow out preventer and boilers up to 15 years Straight-line
Top drives up to 15 years Straight-line (up to 10% salvage value)
Buildings and electrical up to 10 years Straight-line (up to 10% salvage value)
Mud pumps, and mud systems up to 10 years Straight-line
Drill pipe and tubular up to 6 years Straight-line
Recertification 1,000 drill days Unit-of-production
Other recertifications up to 5 years Straight-line
Hull up to 20 years Straight-line (up to 10% salvage value)
Major inspections 1,500 drill days Unit-of-production
Drilling rig spare equipment up to 15 years Straight-line (up to 10% salvage value)
Automotive and other equipment
Technology - EDR units up to 5 years Straight-line
Office furniture and other equipment 5 years Straight-line
Automotive equipment up to 4 years Straight-line (up to 10% salvage value)
Other assets
Buildings up to 25 years Straight-line
Leasehold Improvements term of lease
Construction equipment 5 to 20 years Straight-line
Useful lives and the depreciation methods are examined on an annual basis and adjustments, where applicable, are made on a prospective basis.
Borrowing costs
Trinidad capitalizes borrowing costs associated with specific and general debt that is directly attributable to the acquisition, construction or production of a qualifying asset as part of the cost of that asset.
58 TRINIDAD DRILLING

Intangible assets and goodwill
All intangible assets are carried at cost less accumulated amortization and net impairment losses. The cost of an intangible asset acquired in a business combination is initially measured at fair value at the date of acquisition. Internally generated intangible assets are initially measured at historical cost as expenditures are made starting from the date the expenditures qualify for recognition as an asset.
All intangible assets are amortized over their estimated useful lives as follows:
Acquired in business combinations
Patents and licensing agreements up to 10 years Straight-line
Technology up to 5 years Straight-line
Customer relationships up to 5 years Usage
Internally developed
Engineering and design up to 5 years Straight-line
Useful lives and the amortization methods are examined on an annual basis and adjustments, where applicable, are made on a prospective basis.
Goodwill arises only in business combinations and represents the excess of the purchase price over the fair values of the net assets acquired. Goodwill is carried at cost less accumulated impairment losses and is not subject to amortization.
Impairment of non-financial assets
Property and equipment and intangible assets with definitive lives are subject to an impairment test whenever there are indications that the carrying amount may not be recoverable. Goodwill is tested for impairment at least annually, on December 31, and more often if circumstances indicate its carrying amount may not be recoverable.
Assets are tested individually unless they do not generate cash inflows that are largely independent of other assets. Where cash inflows are not independent, individual assets are grouped into the smallest group of assets that generates independent cash inflows (“Cash Generating Units” or “CGUs”). The Company’s drilling related CGUs are aggregated by geographic location, based on rig type. The Company’s construction related assets are also aggregated into one CGU, as are the company's technology assets acquired through the acquisition of RigMinder. Goodwill is allocated to individual or groups of CGUs that are expected to benefit from the synergies of the business combination, in which the goodwill arose, with the grouping of CGUs being no larger than an operating segment.
The recoverable amount of an asset, CGU or group of CGUs is the greater of its value in use and its fair value less costs of disposal. Trinidad determines fair value less costs of disposal based on the best information available to reflect the amount that could be obtained from the disposal of the asset in an arm’s length transaction between knowledgeable and willing parties, net of estimates of the cost of the disposal. In assessing value in use, the estimated future cash flows of the asset, CGU or group of CGUs are discounted to present value using a discount rate that reflects current market assessments of the time value of money and the risks specific to the asset, CGU or group of CGUs.
An impairment loss is recognized if the carrying amount of an asset, CGU or group of CGUs exceeds its recoverable amount. Where an impairment loss arises on CGUs with allocated goodwill, the loss is allocated first to reduce the carrying amount of the goodwill and then to reduce the carrying amounts of the other assets in the CGUs on a pro rata basis. Impairment losses are recognized immediately as a separate line item in the consolidated statements of operations and comprehensive income.
2017 ANNUAL REPORT 59

A previous impairment, other than an impairment of goodwill, is subsequently assessed for any indications that the impairment is reduced or no longer exists. An impairment loss is reversed if there has been an increase in the recoverable amount of an asset or CGU compared to its current carrying value. Impairment losses are reversed only to the extent that the assets or CGUs carrying amount would not exceed the carrying amount that would have been reported if no impairment loss had been recognized. Impairment losses on goodwill are never reversed.
Income taxes
Income tax expense is comprised of current and deferred tax. Tax is recognized in the consolidated statements of operations and comprehensive income except to the extent that it relates to items recognized in other comprehensive income or equity on the statements of financial position.
Current tax
Current tax is calculated using tax rates which are enacted or substantively enacted at the end of the reporting period. Management periodically evaluates positions taken in tax returns with respect to situations in which applicable tax regulations are subject to interpretation. It establishes provisions where appropriate on the basis of amounts expected to be paid to taxation authorities.
Deferred tax
Deferred income tax is recognized, using the liability method, on temporary differences arising between the tax basis of assets and liabilities and their carrying amounts in the consolidated financial statements. Deferred income tax is determined using tax rates which are enacted or substantively enacted at the end of the reporting period and are expected to apply when the related deferred income tax asset is realized or the deferred income tax liability is settled.
Deferred tax liabilities are generally recognized for all taxable temporary differences, except for temporary differences that arise from goodwill which is not deductible for tax purposes. Deferred tax liabilities are also recognized for taxable temporary differences arising on investments in subsidiaries except where the reversal of the temporary difference can be controlled and it is probable that the difference will not reverse in the foreseeable future.
Deferred tax assets are recognized to the extent it is probable that taxable profits will be available against which the deductible balances can be utilized. All deferred tax assets are analyzed at each reporting period and reduced to the extent that it is no longer probable that the asset will be recovered. Deferred tax assets and liabilities are not recognized with respect to temporary differences that arise on initial recognition of assets and liabilities acquired other than in a business combination.
Income tax estimates
The Company computes an income tax provision in each of the jurisdictions in which it operates. However, actual amounts of income tax expense only become final upon filing and acceptance of the tax return by the relevant authorities, which occur subsequent to the issuance of the financial statements. Additionally, estimation of income taxes includes evaluating the recoverability of deferred tax assets based on an assessment of the ability to use the underlying future tax deductions before they expire against future taxable income. The assessment is based upon existing tax laws and estimates of future taxable income. To the extent estimates differ from the final tax return, earnings would be affected in a subsequent period.
60 TRINIDAD DRILLING

Uncertain tax positions
The Company is subject to taxation in numerous jurisdictions. There are many transactions and calculations for which the ultimate tax determination is uncertain during the ordinary course of business. The Company maintains provisions for uncertain tax positions that it believes appropriately reflect its risks with respect to tax matters under active discussion, audit, dispute or appeal with tax authorities, or which are otherwise considered to involve uncertainty. These provisions are made using the best estimate of the amount expected to be paid based on a qualitative assessment of all relevant factors. The Company reviews the adequacy of these provisions at the end of the reporting period. However, it is possible that at some future date an additional liability could result from audits by taxing authorities. Where the final outcome of these tax-related matters is different from the amounts that were initially recorded, such differences will affect the tax provisions in the period in which such determination is made.
Common shares
Common shares are classified as equity. Costs directly attributable to the issue of common shares are recognized as a reduction of equity, net of any tax effects.
Revenue recognition
Revenue for contract drilling is only recognized when drilling has occurred and collectability is reasonably assured. If collection is subsequently determined to be in doubt, an allowance is recognized against accounts receivable with a corresponding expense included within general and administrative expense in the consolidated statements of operations and comprehensive income; revenue is not adjusted.
Early termination revenue occurs when a customer has decided to negotiate the termination of an existing drilling contract before the expiration of the original terms of the contract. Early termination revenue is recognized when an amount has been agreed upon by both parties, collection is probable, and the Company does not have any further services to render in order to earn the estimated revenue. These amounts are generally recorded as lump sum payments when a contract is canceled. Some early termination contracts include a clause that would nullify a portion of the early termination revenue if the rig was re-contracted to a new customer. In these cases, the Company recognizes the early termination amounts on a monthly basis as earned until the contract is complete or the rig is re-contracted and the early termination clause is nullified. Amounts collected are recorded in deferred revenue initially and amortized into revenue per an appropriate recognition method.
Standby revenue occurs when a rig is contracted to a customer and drilling has been suspended for a period of time. The amount recorded is based on a standby rate included in the drilling contract. Standby revenues are recognized when the terms of the drilling contract include a standby clause, an amount has been agreed upon by both parties, and collection is probable. Standby contracts generally include a clause that if the rig is re-contracted to another customer, the standby rate is no longer applicable. Therefore, the Company recognizes these amounts on a monthly basis until the standby contract is complete or the rig is re-contracted and the standby contract is nullified.
2017 ANNUAL REPORT 61

Allowance for doubtful accounts
Trinidad regularly performs a review of outstanding accounts receivable balances greater than 90 days to determine eventual collectability. If an account is deemed uncollectible, a provision for bad debt is recorded. Trinidad also analyzes the provision for bad debt regularly to determine if any of the accounts provided for should be written off. These accounts that are deemed uncollectible could materially change as a result of changes in a customers’ financial situations.
Share-based payments
Incentive Option Plan
Compensation expense associated with options granted under the Company’s Incentive Option Plan (Option Plan) is deferred and recognized in general and administrative expense over the vesting period of the options. Awards issued under the Option Plan are equity-settled awards, and therefore, the expense is offset to contributed surplus. Trinidad measures the fair value of options at the date of grant using a Black-Scholes option pricing model. For options with graded vesting terms, fair value is determined for each vesting period as if it were a separate award. An estimate of forfeitures is applied to the total options expected to vest which is trued up to actual forfeitures at each vesting date.
Deferred Share Unit Plan
Units issued under the Company’s Deferred Share Unit (DSU) long-term incentive plan are measured at fair value when granted and subsequently re-measured at each reporting date. The associated expense is recognized entirely in general and administrative expense as the DSUs vest immediately. DSUs are cash-settled awards, and therefore, the expense is offset to accounts payable and accrued liabilities. Fair value of the DSUs is determined using the volume-weighted average of Trinidad’s stock price for the five day period preceding the reporting date.
Performance Share Unit Plan
Units issued under the Company’s Performance Share Unit (PSU) long-term incentive plan are initially measured based on fair value when granted. The fair value of outstanding units is re-measured at each reporting date. The associated expense is recognized in general and administrative expense over the vesting periods of the PSUs. Vesting of the PSUs occurs over a period of time determined at the date of grant and all PSUs are exercisable upon vesting. PSUs are cash-settled awards, and therefore the expense is offset to accounts payable and accrued liabilities. Fair value of the PSUs is determined using the volume-weighted average of Trinidad’s stock price for the five-day period preceding the reporting date, as well as certain performance factors assessed by management.
Stock Appreciation Rights Plan
Units issued under the Company’s Stock Appreciation Rights (SAR) long-term incentive plan are initially measured based on the fair value when granted. The fair value of outstanding units is re-measured at each reporting date. The associated expense is recognized in general and administrative expense over the vesting periods of the SARs. Vesting of the SARs occurs over a period of time determined at the date of the grant, taking into consideration the separate tranches issued. SARs are cash-settled awards, and therefore the expense is offset to accounts payable and accrued liabilities. Fair value of the SARs is calculated based on the spread of the grant price and Trinidad’s closing stock price at the date of valuation.
62 TRINIDAD DRILLING

Restricted Share Unit Plan
Units issued under the Company’s Restricted Share Unit (RSU) long-term incentive plan are initially measured based on the fair value when granted. The fair value of outstanding units is re-measured at each reporting date. The associated expense is recognized in general and administrative expense as the RSUs vest immediately. RSUs are cash-settled awards, and therefore the expense is offset to accounts payable and accrued liabilities. Fair value of the RSUs is determined using the volume-weighted average of Trinidad’s stock price for the five-day period preceding the reporting date.
Earnings per share
Basic earnings per share is computed by dividing net earnings attributable to the shareholders of Trinidad by the weighted average number of shares outstanding. Diluted earnings per share amounts are computed by dividing net earnings attributable to the shareholders of Trinidad plus interest on any dilutive convertible instruments by the weighted average dilutive shares outstanding. Dilutive shares are determined by taking the weighted average number of shares outstanding and giving effect to the potential dilution that would occur if in-the-money options granted pursuant to the Option Plan were exercised under the treasury stock method and the dilution, if any, that would occur upon the conversion of the convertible instruments. The treasury stock method assumes that proceeds received from the exercise of in-the-money options are used to repurchase Trinidad shares at market prices.
Foreign currency
Foreign currency transactions
Transactions in foreign currencies are translated into the functional currency of the applicable entity at the exchange rate in effect at the time of the transaction. Monetary items are then re-translated into the entity’s functional currency at each reporting period at the exchange rates in effect at the statements of financial position date. Non-monetary items are not re-translated. Revenues and expenses denominated in foreign currency are translated at rates in effect at the time of the transactions. Gains and losses on foreign currency transactions are included as a separate line item in the consolidated statements of operations and comprehensive income.
Foreign currency translation
Trinidad’s non-Canadian operations have functional currencies that differ from the Canadian dollar, and therefore, assets and liabilities are translated into Canadian dollars at the exchange rates in effect at the statements of financial position date and revenues and expenses are translated at the average exchange rates for the relevant period. Translation gains or losses are included in other comprehensive income. When the settlement of an inter-company receivable from or inter-company payable to a foreign operation is neither planned nor likely foreseeable in the future, foreign exchange gains or losses arising on the translation of those inter-company balances is considered a part of the net investment in the foreign operation and are recognized in other comprehensive income.
Financial instruments and hedge accounting
Trinidad’s financial instruments consist of cash and cash equivalents, accounts receivable, investment in TDI joint venture, accounts payable and accrued liabilities, dividends payable, limited partnership loan, long-term debt, contingent consideration and non-controlling interest liability. The fair value of these financial assets and liabilities approximates their carrying value, unless otherwise noted (see note 17).
2017 ANNUAL REPORT 63

Financial instruments - recognition and measurement
All financial instruments are measured at fair value upon initial recognition of the transaction. Measurement in subsequent periods is dependent on whether the instrument is classified as a “financial asset or financial liability at fair value through profit or loss”, or “financial liabilities measured at amortized cost” or “financial assets or financial liabilities at fair value through other comprehensive income”.
The Company currently holds the Trinidad Drilling International (TDI) joint venture, the non-controlling interests and the contingent consideration as “financial assets or financial liabilities at fair value through profit or loss”. Changes in fair values are recognized in the consolidated statements of operations and comprehensive income. Trinidad assesses the values of these instruments by using a discounted cash flow model. This calculation requires the use of estimates, including: future drilling activity and utilization of the drilling rigs, future equipment deployment milestones, prices, operating costs, discount rates, timing of new property and equipment and other assumptions. A change in an estimate used can change the calculated fair value of this investment. If the fair value calculated is different from the net book value of this investment, an entry is recorded with the offset recorded through the consolidated statements of operations and comprehensive income (loss).
Trinidad’s “financial liabilities measured at amortized cost” consist of bank indebtedness, accounts payable and accrued liabilities, dividends payable, and long-term debt. They are recognized at amortized cost, using the effective interest rate method, at each reporting period, net of transaction costs directly attributable to the issuance of the long-term debt. Transaction costs related to the issuance of any long-term debt are netted against the carrying value of the associated long-term debt and amortized as part of financing costs over the life of that debt using the effective interest rate method.
The Company currently has no “financial assets or financial liabilities at fair value through other comprehensive income”.
Financial instruments - fair value disclosures
Trinidad discloses its financial instruments within a hierarchy prioritizing the inputs to fair value measurements at the following three levels:
• Level 1 - Unadjusted quoted prices in active markets for identical assets or liabilities;
• Level 2 - Inputs other than quoted prices that are observable for the asset or liability either directly or indirectly; and
• Level 3 - Inputs that are not based on observable market data.
64 TRINIDAD DRILLING

Hedges
Trinidad utilizes derivative financial instruments to manage economic exposure to market risks relating to fluctuations in interest rates on outstanding floating rate debt. The Company formally documents all relationships between hedging instruments and the hedged items, the risk management objective and the method for assessing the effectiveness of the hedge. The effectiveness of the hedge is assessed both at inception of the hedge and throughout its term.
Trinidad’s US dollar-denominated Senior Notes have been designated as a hedge of the net investment in self-sustaining foreign operations. As a result, unrealized foreign exchange gains and losses on the US dollar-denominated Senior Notes are offset against foreign exchange gains and losses arising from the translation of the self-sustaining foreign subsidiaries’ accounts and are included in the cumulative translation account in other comprehensive income.
Derivative financial instruments are not used for trading or speculative purposes.
Business combinations
Business combinations are accounted for using the acquisition method whereby the total consideration paid by Trinidad, including assets given up, liabilities incurred or assumed, equity instruments issued, and applicable contingent considerations, is allocated to the fair value of the identifiable net assets of the acquired business. Any excess consideration over the fair value of the identifiable net assets is recognized as goodwill. If total consideration is less than the fair value of the identifiable net assets, the deficiency is reported entirely as a gain in the consolidated statements of operations and comprehensive income.
Contingent consideration is classified as a financial liability on the statement of financial position. Changes in the fair value of the contingent consideration that is a result of additional information obtained about facts and circumstances that existed at the acquisition date but were obtained subsequent to the acquisition date are considered measurement period adjustments. Adjustments of this nature are applied retrospectively to the provisional amounts recognized at the acquisition date.
Changes in the fair value of contingent consideration that is not a measurement period adjustment is recognized in the statements of operations and comprehensive loss as fair value adjustments.
Transaction costs directly attributable to a business combination, other than any costs associated with the issuance of debt or equity, are expensed as incurred.
New standards adopted
Statement of Cash Flows (IAS 7): The Company has adopted the disclosure requirements in Disclosure Initiative (Amendments to IAS 7) as of the effective date of January 1, 2017. Additional disclosures for changes in liabilities arising from financing activities has been included in Note 24 of the consolidated financial statements for the year ended December 31, 2017. As allowed by IAS 7, comparative information has not been presented.
2017 ANNUAL REPORT 65

New standards not yet adopted
A number of new standards and amendments to existing standards have been issued by the IASB that are effective after December 31, 2017 and, therefore, have not been applied to these financial statements. These new standards and amendments, and their anticipated impact on Trinidad’s consolidated financial statements once they are adopted, are as follows:
Financial Instruments (IFRS 9): In July 2014, the IASB issued final amendments to IFRS 9. These amendments to IFRS 9 introduce a single, forward-looking ‘expected loss’ impairment model for financial assets which will require more timely recognition of expected credit losses, and a fair value through other comprehensive income category for financial assets that are debt instruments.
The amendments are effective for annual periods beginning on or after January 1, 2018. Trinidad does not expect the change in the impairment model to have a material impact on the consolidated financial statements.
Revenue from Contracts with Customers (IFRS 15): In May 2014, the IASB issued IFRS 15, which replaces the previous guidance on revenue recognition and provides a framework to record revenue from contracts for the sale of goods or services, unless the contracts are in the scope of IAS 17 - Leases or other IFRS standards. Under IFRS 15, revenue is to be recognized to depict the transfer of goods or services in an amount that reflects the consideration to which the entity expects to be entitled following five steps:
1. Identify the contract with a customer
2. Identify the performance obligations in the contract
3. Determine the transaction price
4. Allocate the transaction price to the performance obligations in the contract
5. Recognize revenue when (or as) the entity satisfies a performance obligation
The new standard is effective for annual periods beginning on or after January 1, 2018, using either a full retrospective approach or a modified retrospective approach. Trinidad will adopt IFRS 15 on January 1, 2018. The Company is currently reviewing its sales contracts with customers and does not expect IFRS 15 to have a material impact on the consolidated financial statements. Upon adoption, the Company will expand its disclosures in the notes to the consolidated financial statements.
66 TRINIDAD DRILLING

Leases (IFRS 16): In January 2016, IASB issued IFRS 16 to replace the guidance currently found in IAS 17. The new standard replaces the previous guidance on lease recognition and establishes principles for recognition, measurement, presentation and disclosure of leases, with the objective of ensuring that lessees and lessors provide relevant information that faithfully represents those transactions. The new standard brings most leases on-balance sheet for lessees under a single model, eliminating the distinction between operating and finance leases. Lessor accounting however will remain largely unchanged and the distinction between operating and finance leases is retained. The amendments are effective for annual periods beginning on or after January 1, 2019, with early application permitted if IFRS 15, has also been applied. IFRS 16 will be adopted by Trinidad on January 1, 2019. The Company is currently reviewing contracts that are identified as leases and assessing the impact of this standard on its consolidated financial statements.
4. Cash and Cash Equivalents
As at December 31, December 31,
($ thousands) 2017 2016
Cash and cash equivalents 3,948 25,780
Cash and cash equivalents are comprised of cash at bank and cash on hand, less cheques in transit, as well as short-term investments and similar instruments that have a maturity of three months or less for Trinidad's wholly owned subsidiaries. The majority of the Company's bank accounts are tied to a master netting agreement, and as such, are disclosed as a total consolidated balance on the consolidated statements of financial position. The Company's bank accounts that are excluded from the master netting agreement had a total balance as at December 31, 2017 of $5.3 million (December 31, 2016 - $4.4 million).
Available within Trinidad’s credit facility is a $10.0 million Canadian bank overdraft and a $10.0 million US bank overdraft. Trinidad uses the bank overdraft as part of its short-term cash management strategy to minimize the requirement of carrying cash on hand to cover outstanding cheques and deposits. The bank overdraft is subject to the same terms and conditions as the credit facility (note 10).
5. Business Combination
Effective August 25, 2017, Trinidad acquired RigMinder Operating LLC (RigMinder). Through this strategic business acquisition, Trinidad acquired significant technology rights that are complementary to its industry-leading drilling fleet.
Trinidad acquired RigMinder for total consideration of $57.5 million. The purchase price is comprised of $30.8 million in cash, $6.3 million in common shares (3,910,364 shares at a deemed price per share of $1.6065), and $20.4 million in contingent consideration. Included in the short-term portion of the contingent consideration is a US$10.0 million payment, due on the later of the anniversary of the closing date and the achievement of certain equipment deployment milestones, and a hold back adjustment related to working capital. Included in the long-term portion of the contingent consideration is a potential earn-out payment due in 2020, dependent on the future performance of certain software acquired.
The following summarizes the major classes of consideration transferred at the acquisition date:
Classes of consideration transferred
($ thousands) August 25, 2017
Cash paid 30,755
Shares issued 6,282
Contingent consideration - short-term portion 12,346
Contingent consideration - long-term portion 8,070
Total consideration paid 57,453
2017 ANNUAL REPORT 67

The acquisition was accounted for using the acquisition method, whereby the assets acquired and the liabilities assumed were recorded at their fair values with the surplus of the aggregate consideration relative to the fair value of the identifiable net assets recorded as goodwill. The Company assessed the fair values of the net assets acquired based on management’s best estimate of the market value for each asset. Subsequent to the acquisition date, RigMinder’s operating results have been included in the Company’s revenues, expenses and capital spending.
Assets and liabilities acquired
($ thousands) August 25, 2017
Working capital (220)
Property and equipment 1,045
Goodwill 18,755
Intangible assets 37,873
Total assets acquired and liabilities assumed 57,453
The allocations and determinations of the consideration described above are preliminary and subject to change upon final adjustment. Due to additional information obtained about the facts and circumstances that existed at the acquisition date, adjustments were made to the purchase equation during the fourth quarter of 2017. These adjustments resulted in a decrease to the total consideration paid of $2.9 million, mainly related to changes in estimates included in the contingent liabilities. As well, adjustments in the fourth quarter included a decrease to working capital of $0.1 million, an increase to intangible assets of $9.5 million and a decrease to goodwill of $12.3 million.
The goodwill arises as a result of the assembled workforce and the synergies that are expected to be achieved as a result of combining the technology acquired with Trinidad's current rig fleet. None of the goodwill recognized was expected to be deductible for income tax purposes. With respect to the valuation of the intangible assets, the Company considered future expected cash flows generated from software and technology components acquired. Assumptions were made based on management's best estimates available at this time. As noted above, the estimates used to value the assets acquired and the liabilities assumed are preliminary and subject to change during the measurement period.
The net cash movement was included in the acquisition of RigMinder (net) in the consolidated statements of cash flows for the year ended December 31, 2017 as total cash paid of $31.4 million, which is the total amount of cash paid and transaction costs settled upon closing the acquisition; offset by cash acquired.
68 TRINIDAD DRILLING

For the year ended December 31, 2017, the Company incurred total transaction costs of $0.7 million related to the acquisition of RigMinder. These costs mainly related to due diligence and external legal fees and were included in finance and transaction costs on the consolidated statements of operations and comprehensive (loss).
Contingent consideration is considered a financial liability under IFRS and, as such, is revalued at each period end. With respect to the long-term portion of the contingent consideration related to the earn out payment, this would be considered a level 3 in the fair value hierarchy. Trinidad assessed the fair value of the contingent consideration using a discounted future cash flow model that compared the estimated future cash flows to the net book value of the asset at the period end date. The model incorporated the following assumptions:
1. A weighted average pre-tax discount rate of 11.85%, which considered the industry average cost of capital, past experience, asset specific risk and anticipated debt to equity levels.
2. Two year forecasted cash flows, taking into consideration current industry conditions, actual 2017 operating results and past experience. Trinidad has used RigMinder's unaudited 2017 prior period operations to estimate these disclosures.
At December 31, 2017, the fair value of the liability was lower than the carrying value and as such an adjustment of $1.1 million was recorded as fair value adjustments included in the consolidated statements of operations and comprehensive (loss).
For a discussion on the accounting treatment and consolidation methods applied to the above, please refer to the significant accounting policies described in note 3.
6. Assets Held For Sale
At December 31, 2017, the Company reclassified $19.6 million of property and equipment to assets held for sale, with the expectation that these assets will be sold in 2018. These assets included a building and land included in the Canadian operations, as well as top drives included in capital inventory in the US and international divisions that were being underutilized.
The top drives in the US and International segment had a carrying amount that exceeded the recoverable amount. As a result, an impairment of $3.0 million was recorded for the year ended December 31, 2017 (see note 7).
At December 31, 2016, the Company reclassified $0.2 million of assets to be held for sale, relating to a top drive included in capital inventory in the Canadian division that was being underutilized. During the first quarter of 2017, these assets were disposed of for proceeds of $0.3 million.
2017 ANNUAL REPORT 69

7. Property and Equipment
Property and equipment as at and for the periods ended December 31, 2017 and December 31, 2016 are as follows:
($ thousands)
Rigs and
related
equipment
Automotive
and other
equipment Buildings
Construction
equipment Land
Assets
under
construction Total
Cost
Balance as at January 1, 2016 2,865,180 33,733 54,203 3,836 12,228 97,111 3,066,291
Additions/transfers 105,293 118 - 44 - (76,182) 29,273
Disposals (124,331) (6,663) (35) (946) (88) (7,285) (139,348)
Assets held for sale (275) - - - - - (275)
Effect of foreign exchange (54,106) (565) (648) (53) (86) (867) (56,325)
Balance as at December 31, 2016 2,791,761 26,623 53,520 2,881 12,054 12,777 2,899,616
Additions/transfers 145,055 1,256 - - - 16,295 162,606
Acquired upon business combination 1,045 - - - - - 1,045
Disposals (33,918) (1,175) (403) (9) (67) (267) (35,839)
Assets held for sale (15,166) - (20,937) - (3,409) - (39,512)
Effect of foreign exchange (121,433) (611) (1,380) (34) (182) (884) (124,524)
Balance as at December 31, 2017 2,767,344 26,093 30,800 2,838 8,396 27,921 2,863,392
Accumulated depreciation
Balance as at January 1, 2016 1,378,044 16,635 11,971 3,373 - - 1,410,023
Depreciation 164,484 3,985 2,188 178 - - 170,835
Disposals (129,536) (4,126) (8) (844) - - (134,514)
Assets held for sale (57) - - - - - (57)
Effect of foreign exchange (29,048) (367) (104) (49) - - (29,568)
Balance as at December 31, 2016 1,383,887 16,127 14,047 2,658 - - 1,416,719
Depreciation 191,587 3,047 2,159 112 - - 196,905
Impairment loss 2,993 - - - - - 2,993
Disposals (33,164) (872) (182) (9) - - (34,227)
Assets held for sale (14,389) - (5,540) - - - (19,929)
Effect of foreign exchange (62,040) (477) (333) (34) - - (62,884)
Balance as at December 31, 2017 1,468,874 17,825 10,151 2,727 - - 1,499,577
Net book value
December 31, 2017 1,298,470 8,268 20,649 111 8,396 27,921 1,363,815
December 31, 2016 1,407,874 10,496 39,473 223 12,054 12,777 1,482,897
For the year ended December 31, 2017, disposals mainly related to various non-core assets in the US and Canadian divisions.
For the year ended December 31, 2017, Trinidad reviewed its rig fleet and related equipment. The Company identified top drives in its US and international operations that had a carrying amount that exceeded the recoverable amount. As a result, an impairment of $3.0 million was recorded for the year ended December 31, 2017 (December 31, 2016 - nil). The fair value of the top drives were determined based on the market demand. Refer to note 6 for further information.
The cost of assets under construction includes cost of materials, direct labour, construction overhead and any other costs directly attributable in readying the asset for its intended use. Accumulated costs are reported as assets under construction until the related asset is ready for use, at which time it will be subject to depreciation.
70 TRINIDAD DRILLING

In the third quarter of 2017, the Company reviewed the useful life estimates for all rigs and related equipment, and as a result adjusted the useful life estimates within the current depreciation policy. These adjustments were applied prospectively and caused an increase in depreciation expense for the year ended December 31, 2017 of approximately $14.4 million.
8. Intangible Assets and Goodwill
Intangible assets and goodwill as at and for the period ended December 31, 2017, and December 31, 2016, are as follows:
($ thousands)
Patents and
licensing
agreements Technology
Customer
relationships
Engineering
and design Goodwill Total
Cost
Balance as at January 1, 2016 3,000 - 900 1,082 205,408 210,390
Effect of foreign exchange - - - - (431) (431)
Balance as at December 31, 2016 3,000 - 900 1,082 204,977 209,959
Additions 3,145 893 - - - 4,038
Acquired upon business combination - 37,873 - - 18,755 56,628
Effect of foreign exchange (264) 143 - - (904) (1,025)
Balance as at December 31, 2017 5,881 38,909 900 1,082 222,828 269,600
Accumulated amortization and impairment
Balance as at January 1, 2016 3,000 - 176 78 172,088 175,342
Amortization - - 450 461 - 911
Balance as at December 31, 2016 3,000 - 626 539 172,088 176,253
Amortization 745 1,495 274 543 3,057
Effect of foreign exchange (25) (24) - - - (49)
Balance as at December 31, 2017 3,720 1,471 900 1,082 172,088 179,261
Net book value
December 31, 2017 2,161 37,438 - - 50,740 90,339
December 31, 2016 - - 274 543 32,889 33,706
Remaining useful life
December 31, 2017 (years) 1.50 4.67 - - n/a
Intangibles
• Patents and licensing agreements - licensing agreements include a method and apparatus for controlling the rotation of a drill string and is included in the US operations. Patents consist of a fully amortized patent application for a number of drilling rig component parts that were acquired in a previous business combination and were included in the Canadian operations.
• Technology - consists of technology and software assets acquired from the RigMinder acquisition and are included in the US and international operations (note 5).
• Customer relationships - consists of customer relationships acquired from a previous business combination and are included in the Canadian operations.
• Engineering and design - consists of costs related to work completed on standardized engineering and design drawings for new rig builds and are included in the Canadian operations.
2017 ANNUAL REPORT 71

Goodwill
Goodwill is a result of a number of business combinations and is generally attributable to anticipated synergies expected from those acquisitions. Goodwill by definition has no useful life; and therefore, is not amortized. However, goodwill is subject to impairment tests at least annually. For purposes of impairment testing, Trinidad assesses goodwill at the operating segment level.
At December 31, 2017, an impairment test was performed on the Canadian and US and International operating segments and it was determined that no impairment existed (2016 - $nil). The recoverable amounts of all cash generating units (CGUs) was based on its value in use and was determined by estimating the future cash flows that would be generated from the continuing operating of the relevant CGUs, incorporating the following assumptions:
1. A weighted average pre-tax discount rate of 11.81% to 11.85% (2016 - 11.17% to 11.42%) which considered the industry average cost of capital, past experience, asset specific risk and anticipated debt to equity levels.
2. Five year forecasted cash flows, taking into consideration current industry conditions, actual 2017 operating results and past experience (2016 - Cash flows were projected based on past experience, actual 2016 operating results, the 2017 forecast and the current industry conditions).
3. A terminal value was used for each of the 2017 and 2016 impairment model calculations assuming no annual growth rate for cash flows through the remainder of the segment’s life.
For the year ended December 31, 2017, the recoverable amount of all CGUs exceeded its carrying value such that any reasonable change in the key assumptions used in determining value in use would not result in an impairment (2016 - no impairment recognized).
As at December 31, 2017, goodwill of $50.7 million is comprised of $18.9 million in the Canadian operations and $31.8 million in the US and international operations (December 31, 2016 - goodwill of $32.9 million was comprised of $18.9 million in the Canadian operations and $14.0 million in the US and international operations).
72 TRINIDAD DRILLING

9. Investments In Joint Venture
Joint Ventures Loss (Gain) Reconciliation
For the years ended December 31,
($ thousands) 2017 2016
Trinidad Drilling International (gain) from investment (1) (4,735) (5,986)
Trinidad Drilling International fair value adjustment (13,216) (7,353)
Other joint arrangements net loss from investments 292 410
(Gain) from investments in joint ventures (17,659) (12,929)
(1) Included in the (gain) from investment is $0.2 million of upstream elimination (2016 - nil).
Joint Ventures Investments Reconciliation
As at December 31, December 31,
($ thousands) 2017 2016
Trinidad Drilling International investment balance 213,616 261,984
Other joint arrangements net loss from investments 1,360 689
Investment in joint ventures 214,976 262,673
Joint Venture - Trinidad Drilling International
Effective September 3, 2013, Trinidad entered into a joint venture arrangement with a wholly-owned subsidiary of Halliburton to operate drilling rigs for international projects outside of Canada and the US. The joint venture currently has operations in Saudi Arabia and Mexico and is exploring future growth opportunities in other international markets. The joint venture is conducting business under the name Trinidad Drilling International (TDI) through separately incorporated companies. Trinidad owns 60% of the shares of TDI and each of the joint parties have equal voting rights. The investment is held through common shares and mandatory redeemable preferred shares (MRPS) classified as liabilities. As the MRPSs are considered a liability, all dividends declared are recorded as an expense to net (loss) on the statement of operations and comprehensive (loss). Trinidad considers the investment to be a financial asset at fair value through profit or loss and recognizes changes in fair value of the investment in the statements of operations and comprehensive (loss) as a (gain) from investment in joint venture.
Continuity of Investment in TDI Joint Venture for Trinidad
Total Investment Year ended Year ended
($ thousands) December 31, 2017 December 31, 2016
Opening balance 261,984 294,511
Distribution and dividends received from joint venture (40,149) (21,509)
Gain from investment in joint venture (1) 4,735 5,986
Change in loan to joint venture (9,123) (13,138)
Elimination of downstream transactions (397) (1,062)
Fair value adjustment 13,216 7,353
Effect of foreign exchange (16,650) (10,157)
Ending balance 213,616 261,984
(1) Included in the (gain) from investment is $0.2 million of upstream elimination (2016 - nil).
2017 ANNUAL REPORT 73

Determination of functional currency. Management reviewed the primary factors under IAS 21 - The Effects of Changes in Foreign Exchange Rates, in order to determine the functional currency of TDI, including the country whose competitive forces and regulations determine the sales price and the currency that influences sales prices and costs related to labour and materials. As all rig contracts are negotiated and settled in US dollars, and the majority of expenses are quoted and paid in US dollars (including lease expenses and most capital costs), the functional currency for TDI was determined to be the US dollar for each of the subsidiaries, including those with drilling operations in Saudi Arabia and Mexico.
Translation gains and losses resulting from the translation of the Company’s investment into the Canadian dollar equivalent are for presentation purposes only and are included in equity as accumulated other comprehensive income. Trinidad records its portion of income in US dollars; therefore, this amount is calculated with no related translation adjustment.
Summarized financial information for TDI Summarized statements of operations and comprehensive (loss) income for TDI:
For the years ended, December 31,
($ thousands) 2017 2016
TDITrinidad
60% Share TDITrinidad
60% Share
Revenue
Oilfield service revenue 113,746 68,248 131,823 79,094
Other revenue 62 37 - -
113,808 68,285 131,823 79,094
Expenses
Operating expense 51,645 30,987 69,324 41,594
General and administrative 10,007 6,005 11,532 6,919
Depreciation and amortization 35,315 21,189 31,505 18,903
Foreign exchange (35) (21) 1,996 1,198
Finance costs 643 386 1,398 839
Loss on sale of property and equipment 1,095 657 - -
Dividend re-class (8,310) (4,986) - -
Dividend - - 24,818 14,891
Preferred share valuation 10,599 6,359 (25,809) (15,485)
Income before income tax 12,849 7,709 17,059 10,235
Income tax
Current 6,078 3,647 6,039 3,623
Deferred (771) (463) 1,044 626
Net income 7,542 4,525 9,976 5,986
Dividend re-class. During the year ended December 31, 2017, the TDI joint venture partners resolved to reclassify a dividend paid during the year ended December 31, 2016, to be issued as a return of capital. This adjustment was recorded in 2017 and referred to above as "Dividend re-class".
74 TRINIDAD DRILLING

Summarized statements of financial position for TDI: Amounts are presented at 100% of the value included in the statement of financial position for Trinidad Drilling International.
As at December 31, December 31,
($ thousands) 2017 2016
Assets
Current Assets
Cash and cash equivalents 48,788 78,008
Accounts receivable 10,647 23,494
Inventory 6,951 7,054
Prepaid expenses 801 2,578
67,187 111,134
Property and equipment 336,076 391,383
Deferred income taxes 3,507 3,208
406,770 505,725
Liabilities
Current Liabilities
Accounts payable and accrued liabilities 15,340 15,544
Preferred shares 240,211 425,930
Current portion of long-term debt - 11,789
255,551 453,263
Notes payable to joint venture partners 24,266 26,854
279,817 480,117
Shareholders' Equity
Common shares 23,508 29,484
Contributed surplus 102,500 -
Accumulated other comprehensive income 1,442 4,159
Deficit (497) (8,035)
126,953 25,608
406,770 505,725
Contributed surplus. During the year ended December 31, 2017, the TDI joint venture partners resolved to partially reduce a portion of the mandatory redeemable preferred shares (MRPS) and the ordinary shares. TDI assessed the economic substance of this transaction and determined that it was in the nature of a capital contribution. As such, it was reflected in equity as a transaction with the shareholders and disclosed above as "Contributed surplus". The transaction did not result in a distribution or change in the proportionate ownership of the joint venture partners.
2017 ANNUAL REPORT 75

Related party transactions
The related party transaction exchange amounts are determined depending on the nature of the transaction, and negotiations by both parties. They generally fall into two categories: shared services and sale of existing equipment.
• Shared services - TDI, and the shareholders of TDI, signed a shared-services agreement that outlines the costs that will be reimbursed and the rates based on an employee time allocation assessment.
• Sale of pre-existing equipment -This equipment is sold at a gain/loss on sale to the Company based on third-party valuations.
Related party transactions in the comparative period also included overhead allocation and markup costs on new build equipment completed by Trinidad's manufacturing division.
During the year ended December 31, 2017, Trinidad charged TDI general and administrative expenses related to shared services of $1.2 million (2016 - $2.6 million). As at December 31, 2017, TDI had an outstanding trade payable to Trinidad of $0.5 million (December 31, 2016 - $0.9 million) related to general and administrative expenses.
The joint shareholders of TDI have loaned funds, via promissory notes, to fund the importation of drilling rigs into Saudi Arabia. The funds are recoverable through operations in TDI within five years from date of advance and earn interest at 4.25% and mature in December 2020. As at December 31, 2017, the loan payable to the joint venture shareholders is $24.3 million, of which $14.7 million is payable to Trinidad (December 31, 2016 - total loan payable of $26.9 million of which $16.1 million was payable to Trinidad).
The joint shareholders of TDI had loaned funds, via promissory notes, to fund the importation of drilling rigs into Mexico. The funds were recoverable through operations in TDI within three years from date of advance, earned interest at LIBOR + 2.5% and matured in November 2017. As at December 31, 2017, the loan payable to the joint venture shareholders was nil (December 31, 2016 - total loan payable of $11.8 million of which $7.9 million was payable to Trinidad).
Fair value of investment in TDI joint venture
Trinidad assess the fair value of the investment using a discounted future cash flow model that compares the estimated future cash flows to the net book value of the asset at the period end date. The model incorporates the following assumptions:
1. A weighted average pre-tax discount rate of 11.85%, which considered industry average cost of capital, past experience, asset specific risk and anticipated debt to equity levels (2016 - 11.17%)
2. Five year forecasted cash flows, taking into consideration current industry conditions, actual 2017 operating results and past experience. (2016 - Cash flows were projected based on past experience, actual 2016 operating results, the 2017 forecast and the current industry conditions.)
3. A terminal value was used for each of the 2017 and 2016 fair value assessments assuming no annual growth rate for cash flows through the remainder of the segment’s life.
For the year ended December 31, 2017, it was determined that the fair value of the investment exceeded the net book value and as such an adjustment of $13.2 million was recorded (2016 - fair value of the investment was higher than the net book value and as such an adjustment of $7.4 million was recorded).
76 TRINIDAD DRILLING

10. Long-Term Debt
As at December 31, December 31,
($ thousands) 2017 2016
Limited partnership loan (1) - 1,959
2019 Senior Notes (a) - 602,758
2025 Senior Notes (b) 438,550 -
Credit Facility (c) 84,621 -
523,171 604,717
Less: unamortized debt issue costs (11,497) (1,701)
511,674 603,016
(1) At December 31, 2017, the outstanding balance of the Limited Partnership #3 loan had been settled.
a) On December 16, 2010, Trinidad issued US$450.0 million of 7.875% senior unsecured notes (2019 Senior Notes) for gross proceeds of US$446.7 million. The Canadian dollar equivalent on this date was $449.1 million. Interest was payable semi-annually in arrears on January 15 and July 15, and the 2019 Senior Notes were due in January 2019.
On January 25, 2017, Trinidad announced a cash tender offer to purchase any and all of the Company's outstanding 2019 Senior Notes for consideration of US$1,005 per US$1,000 principal amount. On February 8, 2017, approximately US$203.0 million of these notes were validly tendered for cash of US$204.9 million, including accrued and unpaid interest. The remainder of the notes were redeemed on March 10, 2017, for US$250.0 million including accrued and unpaid interest.
The 2019 Senior Notes were designated as a hedge of the net investment in self-sustaining foreign operations. Unrealized foreign exchange gains and losses on the 2019 Senior Notes were offset against foreign exchange gains and losses arising from the translation of the accounts of self-sustaining foreign subsidiaries. These gains and losses are included in the cumulative translation account in other comprehensive (loss).
b) On February 8, 2017 Trinidad issued US$350.0 million of 6.625% senior unsecured notes (2025 Senior Notes) for par value. The Canadian dollar equivalent on this date was $461.9 million. Interest is payable semi-annually in arrears on February 15 and August 15 and the 2025 Senior Notes mature in February 2025. On or after February 15, 2020, Trinidad has the option to redeem all or a portion of the 2025 Senior Notes at set redemption prices, which includes the principal amount plus any accrued and unpaid interest to the applicable redemption date. Trinidad incurred debt issue costs of $11.3 million related to the 2025 Senior Notes which will be amortized over the life of the 2025 Senior Notes using the effective interest rate method.
The 2025 Senior Notes have been designated as a hedge of the net investment in self-sustaining foreign operations. As a result, unrealized foreign exchange gains and losses on the 2025 Senior Notes are offset against foreign exchange gains and losses arising from the translation of the accounts of self-sustaining foreign subsidiaries. These gains and losses are included in the cumulative translation account in other comprehensive (loss).
c) On December 12, 2014, Trinidad terminated its existing credit facility from 2010 and entered into a new agreement, which was amended on December 14, 2015; June 24, 2016; January 27, 2017 and November 30, 2017. The new amended credit facility includes a Canadian revolving facility of $100.0 million, and a US revolving facility of $100.0 million. Included in the facility are a $10.0 million Canadian dollar bank overdraft and a $10.0 million US dollar bank overdraft. The facility requires quarterly interest payments based on Bankers Acceptance and LIBOR rates. The facility matures December 12, 2020, and is subject to annual extensions of an additional year on each anniversary date upon consent of the lenders holding two-thirds of the aggregate commitments under the credit facility. The members of the syndicated groups include major Canadian, US and international financial institutions. The debt is secured by a general guarantee over the assets of Trinidad and its subsidiaries.
2017 ANNUAL REPORT 77

At December 31, 2017 the following financial covenants were in place:
Senior Debt to Bank EBITDA Max of 2.5x
Bank EBITDA to Cash Interest Expense Min of 2.5x
Other covenants in effect include but are not limited to the following: incurring additional debt and liens on assets; investments, including advances to the TDI joint venture; asset sales; and making restricted payments. The new amended credit facility allows Trinidad to pay dividends provided that Trinidad's Senior Debt to Bank EBITDA covenant is less than five times. At December 31, 2017, Trinidad is in compliance with all covenants related to the credit facility.
At December 31, 2017, the Company had outstanding letters of credit of $8.7 million (December 31, 2016 - less than $0.6 million).
11. Income Taxes
The components of tax expense by segment for the years ended 2017 and 2016 were as follows:
For the years ended December 31,
($ thousands) 2017 2016
Current tax expense
Canada (5) (1,288)
US and international 934 417
929 (871)
Deferred tax (recovery)
Canada (20,982) (21,445)
US and international (38,762) (11,844)
(59,744) (33,289)
Total tax (recovery) (58,815) (34,160)
Trinidad’s income is subject to Canadian federal and provincial taxes, US federal and state taxes, and international federal taxes. For 2017 a $21.0 million recovery (2016 - $22.7 million recovery) relates to the Company’s Canadian entities resulting from operations in Alberta, British Columbia, Saskatchewan and Manitoba, and an $37.8 million recovery (2016 - $11.4 million recovery) pertains to the Company’s US and international operations.
Taxes on items recognized in other comprehensive income or directly in equity in 2017 and 2016 were as follows:
For the years ended December 31,
($ thousands) 2017 2016
Deferred tax on foreign exchange adjustments on debt (33,906) (43,104)
78 TRINIDAD DRILLING

Factors affecting tax expense for the year:
For the years ended December 31,
($ thousands) 2017 2016
Net (loss) before income tax (139,296) (87,795)
Corporate statutory tax rate 27.00% 27.00%
Tax expense at statutory rate (37,610) (23,705)
Non-taxable/non-deductible amounts 2,649 2,333
Statutory and other rate differences (27,078) (20,705)
Effect of US future tax rate change (3,166) -
Effect of change in timing of expected tax rates 180 1,359
Return to provision adjustment 4,547 4,173
Other 1,663 2,385
Effective income tax rate at 42.22% (2016 at 38.91%) (58,815) (34,160)
The effective tax rate on earnings of 42.22% in 2017 is higher than Canada’s statutory tax rate of 27.00% generally due to income which is taxed at rates different than those found in Canada as well as downstream elimination entries which are excluded for tax purposes. Specifically, while the Company generates revenues in numerous jurisdictions, the tax provision on earnings is computed after taking account of inter-company charges and credits among subsidiaries, as a result of their capital structure in addition to the various jurisdictions in which operations, technology and content assets are owned. For these reasons, the effective tax rate differs from the Canadian corporate tax rate. The Company’s effective tax rate and its cash tax cost depend on the laws of numerous countries and the provisions of multiple income tax conventions between various countries in which the Company operates.
A 1.0% increase in the effective tax rate would increase the 2017 income tax liability by approximately $1.4 million (2016 - $0.9 million).
At December 31, 2017, the consolidated statements of financial position included $1.6 million of current taxes receivable (December 31, 2016 - $3.7 million) within accounts receivable.
2017 ANNUAL REPORT 79

The movements of deferred tax assets and liabilities, without taking into consideration the offsetting of balances within the same tax jurisdiction, are shown below:
Deferred tax (liabilities)
($ thousands)
Property and equipment
and other
long lived assets Other Total
December 31, 2016 (282,248) (3,405) (285,653)
Expense to statement of operations 83,919 2,990 86,909
Translation and other 10,144 146 10,290
December 31, 2017 (188,185) (269) (188,454)
Deferred tax assets ($ thousands) Losses
Financing
costs
Foreign
exchange
swaps
Share-
based
payments
Cummulative
eligible
capital Other Total
December 31, 2016 260,803 1,884 43,104 3,086 301 - 309,178
(Benefit) expense to statement of operations (26,076) 586 - (1,728) 51 - (27,167)
Translation and other (6,986) (3) (9,198) 28 - - (16,159)
December 31, 2017 227,741 2,467 33,906 1,386 352 - 265,852
Net deferred tax assets (liabilities)
At December 31, 2017 77,398
At December 31, 2016 23,525
The net deferred tax liability is presented in the Consolidated Statements of Financial Position as follows:
As at December 31,
($ thousands) 2017 2016
Deferred tax asset 82,872 72,873
Deferred tax liability (5,474) (49,348)
Net deferred tax liability 77,398 23,525
80 TRINIDAD DRILLING

The estimated recovery period for the deferred tax balances is shown below:
As at December 31,
($ thousands) 2017 2016
Deferred tax (liabilities)
To be payable after more than 12 months (186,787) (282,777)
To be payable within 12 months (1,667) (2,876)
Total deferred tax (liabilities) (188,454) (285,653)
Deferred tax assets
To be recoverable after more than 12 months 263,216 307,535
To be recoverable within 12 months 2,636 1,643
Total deferred tax assets 265,852 309,178
Total net deferred tax asset (liability) 77,398 23,525
Loss carry-forwards of $963.1 million (2016 - $806.4 million) have been recognized for income tax purposes. They represent losses mainly located in Canada and the US, and are due to expire between 2029 and 2037.
Deferred tax assets are recognized for tax loss carry-forwards to the extent that the realization of the related tax benefit through future taxable profits is probable. The ability to realize the tax benefits of these losses is dependent upon a number of factors, including the future profitability of operations in the jurisdictions in which the tax losses arose.
The Company has temporary differences in respect of its investments in Canadian and foreign subsidiaries for which no deferred taxes have been recorded. As no taxes are expected to be paid in respect of the temporary differences related to its Canadian subsidiaries, the Company has not determined the amount of those temporary differences. The aggregate amount of temporary differences associated with investments in foreign subsidiaries for which a deferred tax liability has not been recognized is $231.7 million (2016 - $308.7 million).
12. Non-controlling Interests
The non-controlling interests relate to Midland C Ranch Holdings, LLC (Midland), CanElson 120601 Drilling Limited Partnership #1 (LP1), CanElson 120601 Drilling Limited Partnership #2 (LP2) and CanElson 120601 Drilling Limited Partnership #3 (LP3). The principal place of business for Midland is the US and the principal place of business for LP1, LP2 and LP3 is Canada.
On September 18, 2017, Trinidad acquired the remaining ownership of LP3 for consideration of $0.2 million. Effective September 30, 2017, Trinidad holds 100 percent of the share capital of the subsidiary. The carrying amount of the non-controlling interest liability on the date of acquisition was nil. As a result, Trinidad recognized an expense of $0.2 million representing the excess between the consideration paid and the carrying amount of the non-controlling interest liability.
The following table summarizes the information relating to the non-controlling interests:
For the years ended December 31,
($ thousands) 2017 2016
Opening balance 7,197 18,448
Comprehensive (loss) attributable to non-controlling interests (1,624) (1,233)
Change in fair value of liability 3,117 (9,398)
Foreign currency translation adjustment 173 (620)
Closing balance 8,863 7,197
2017 ANNUAL REPORT 81

Summarized statements of financial position for non-controlling interests
As at December 31, 2017 LP1 LP2 LP3(1) Midland Total
Non-controlling interests ownership percentage
($ thousands)
50% 45.6% 0% 50%
Current assets 1,370 895 - 3,031 5,296
Non-current assets 4,068 3,626 - 19,430 27,124
Current liabilities 1,250 3,100 - 1,798 6,148
As at December 31, 2016 LP1 LP2 LP3(1) Midland Total
Non-controlling interest ownership percentage
($ thousands)
50% 45.6% 50% 50%
Current assets 1,472 764 14 2,863 5,113
Non-current assets 4,288 4,067 4,336 20,409 33,100
Current liabilities 1,250 3,100 2,766 747 7,863
(1) On September 18, 2017, Trinidad acquired the remaining ownership interest of LP3.
Summarized statements of operations and comprehensive (loss) for non-controlling interests
For the year ended December 31, 2017 LP1 LP2 LP3(1) Midland Total
Non-controlling interest ownership percentage
($ thousands)
50% 45.6% 0% 50%
Revenue 3,594 2,028 - 8,576 14,198
Net (loss) (569) (607) (393) (212) (1,781)
Net (loss) attributable to non-controlling interests (284) (277) (196) (106) (863)
Total comprehensive (loss) attributable to non-controlling interests (284) (277) (196) (867) (1,624)
For the year ended December 31, 2016 LP1 LP2 LP3(1) Midland Total
Non-controlling interest ownership percentage
($ thousands)
50% 45.6% 50% 50%
Revenue 3,836 1,611 - 5,616 11,063
Net (loss) (142) (312) (797) (954) (2,205)
Net (loss) attributable to non-controlling interests (71) (142) (399) (477) (1,089)
Total comprehensive (loss) attributable to non-controlling interests (71) (142) (399) (621) (1,233)
(1) On September 18, 2017, Trinidad acquired the remaining ownership interest of LP3. For the year ended December 31, 2017 net (loss) attributable to non-controlling interest is recognized for the period January 1, 2017 to September 18, 2017, the period the partner still held a 50 percent interest.
82 TRINIDAD DRILLING

Fair value of non-controlling interest
Trinidad assess the fair value of the investment using a discounted future cash flow model that compares the estimated future cash flows to the carrying value of the investment at the period end date. The model incorporates the following assumptions:
1. A weighted average pre-tax discount rate of 11.81% to 11.85% (2016 - 11.17% to 11.42%) which considered the industry average cost of capital, past experience, asset specific risk and anticipated debt to equity levels.
2. Five year forecasted cash flows, taking into consideration current industry conditions, actual 2017 operating results and past experience (2016 - Cash flows were projected based on past experience, actual 2016 operating results, the 2017 forecast and the current industry conditions).
3. A terminal value for each of the 2017 and 2016 impairment model calculations assuming no annual growth rate for cash flows through the remainder of the segment’s life.
For the year ended December 31, 2017, Trinidad completed a valuation assessment of the non-controlling interests liability and determined that the fair value of the liability was lower than the net book value and as such an adjustment of $3.1 million was recorded to fair value adjustments included in the consolidated statements of operations and comprehensive (loss) (2016 - $9.4 million).
13. Common Shares
Authorized
Unlimited number of common shares, voting, participating:
For the years ended December 31,
(Number of shares) 2017 2016
Outstanding - beginning of year 222,087,270 222,087,270
Issuance of shares 47,460,317 -
Issued upon business combination 3,910,364 -
Outstanding - end of year 273,457,951 222,087,270
Holders of common shares are entitled to participate in dividends if and when declared by the Company.
On February 8, 2017, Trinidad closed a bought deal equity financing agreement, resulting in the issue of 47,460,317 common shares at a price of $3.15 per share, for gross proceeds of $149.5 million. Gross share issuance costs of $6.6 million were recorded net of tax of $1.8 million.
On August 25, 2017, Trinidad acquired all of the issued and outstanding shares of RigMinder Operating LLC for US$30.0 million, comprised of US$25.0 million in cash and US$5.0 million in common shares. Trinidad issued 3,910,364 shares at a deemed price per share of $1.6065, for a total value of $6.3 million (note 5).
On September 25, 2017, Trinidad filed a notice with the Toronto Stock Exchange (TSX) to make a normal course issuer bid (NCIB) to purchase outstanding shares on the open market. As approved by the TSX, Trinidad is authorized to purchase up to 23,032,913 common shares (which represent approximately ten percent of the Company's public float outstanding at the time of the bid) during the period September 28, 2017 to September 27, 2018, or until such time as the bid is completed or terminated at the Company's option. Any shares purchased under the bid are purchased on the open market through the facilities of the TSX at the prevailing market price at the time of the transaction. Common shares acquired under the bid will be canceled. For the year ended December 31, 2017, Trinidad did not purchase any outstanding shares.
2017 ANNUAL REPORT 83

14. Share-Based Payments
Incentive Option Plan
On March 10, 2008, Trinidad established an Option Plan to provide an opportunity for officers, employees and consultants of Trinidad and its affiliates to participate in the growth and development of the Company. Options generally vest on the first, second and third anniversary of the date of grant. They are exercisable for a period of five years from the date of grant. Under the Option Plan, a maximum of 4% of the outstanding common share balance is available to be issued.
The following summarizes the changes in outstanding options:
For the years ended December 31, 2017 2016
Number
Weighted average
exercise price
(CDN$) Number
Weighted average
exercise price
(CDN$)
Outstanding - beginning of year 1,160,320 5.24 880,891 7.35
Granted 617,615 2.35 480,675 2.22
Expired (251,549) 7.79 (123,815) 8.58
Forfeited (128,326) 3.17 (77,431) 5.22
Outstanding - end of year 1,398,060 3.69 1,160,320 5.24
The range of exercise prices for the options outstanding and exercisable at December 31, 2017 is as follows:
Total options outstanding Exercisable options
Number
Weighted average
exercise price
(CDN$)
Weighted average
remaining life
(years) Number
Weighted average
exercise price
(CDN$)
$0.00-$4.99 984,339 2.28 3.95 139,787 2.19
$5.00-$6.50 175,124 5.21 2.35 115,896 5.21
$6.51-$7.50 117,597 6.85 1.86 117,600 6.85
$7.51-$12.00 121,000 9.89 0.96 121,000 9.89
1,398,060 3.69 3.32 494,283 5.89
Trinidad uses the Black-Scholes option-pricing model to determine the estimated fair value of the options granted. During the year ended December 31, 2017, Trinidad had seven sets of options granted. The per share fair value of options granted for the year ended December 31, 2017 ranged between $0.49 and $1.83 based on the following assumptions (2016 - the per share fair value ranged between $0.42 and $0.62):
For options granted in the years ended December 31, 2017 2016
Share price (CDN$) 1.63 - 2.41 2.13 - 2.90
Exercise price (CDN$) 1.63 - 2.41 2.13 - 2.90
Volatility (%) 28.8 - 50.1 28.6 - 29.8
Expected life (years) 3.50 3.50
Dividend yield (%) - -
Forfeiture rate (%) 5.00 5.00
Risk free interest rate (%) 0.8 - 1.6 0.7 - 0.9
Volatility was determined based on Trinidad's historical daily trading price over the trailing period for the expected life of the awards. For the year ended December 31, 2017, Trinidad recognized share-based payment expense relating to outstanding options of $0.2 million (2016 - expense of $0.2 million).
84 TRINIDAD DRILLING

Deferred Share Unit Plan
On March 11, 2008, the Company established the Deferred Share Unit (DSU) Plan to provide a compensation system for members of the Board of Directors that is reflective of the responsibility, commitment and risk accompanying Board membership. Each DSU granted permits the holder to receive a cash payment equal to the volume weighted average share price for the five days preceding payment. DSUs vest immediately upon grant but are not exercisable until resignation or termination from the Board of Directors. DSU holders are entitled to share in dividends which are credited as additional DSUs at the dividend record date. The following summarizes the changes in outstanding DSUs:
For the years ended December 31,(Number of DSUs) 2017 2016
Outstanding - beginning of year 557,307 353,457
New grants 136,542 361,935
Exercised - (158,085)
Outstanding - end of year 693,849 557,307
The total fair value of DSUs at December 31, 2017 was $1.2 million (December 31, 2016 - $1.9 million) which represents total DSUs outstanding multiplied by the trailing five day volume weighted average share price of the Company’s underlying common shares as the DSUs have no exercise price. The liability is recorded in accounts payable and accrued liabilities in the consolidated statements of financial position.
For the year ended December 31, 2017, Trinidad recognized share-based payment recovery related to the outstanding DSUs of $0.7 million (2016 - expense of $1.5 million).
For the year ended December 31, 2017, no deferred share units were exercised (2016 - 158,085 deferred share units were exercised for total proceeds of $0.4 million).
Performance Share Unit Plan
On March 11, 2008, Trinidad established the Performance Share Unit (PSU) Plan to provide an opportunity for officers and employees of Trinidad to participate in the growth and development of the Company and to promote further alignment of interests between employees and the shareholders. PSUs are subject to Company performance metrics assessed by management with a three-year performance period. Each PSU granted permits the holder to receive a cash payment equal to the volume weighted average share price for the five days preceding payment adjusted for performance metrics. PSU holders are entitled to share in dividends which are credited as additional PSUs at the dividend record date.
The following summarizes the changes in outstanding PSUs:
For the years ended December 31,(Number of PSUs) 2017 2016
Outstanding - beginning of year 6,180,683 3,198,453
New grants 1,510,395 4,112,807
Exercised (2,971,496) (965,447)
Exchange of units (368,396) -
Forfeited (479,562) (165,130)
Outstanding - end of year 3,871,624 6,180,683
2017 ANNUAL REPORT 85

At December 31, 2017, there were no vested PSUs outstanding (December 31, 2016 - nil). Of the PSUs outstanding at December 31, 2017, 2,483,126 vest on December 1, 2018 and 1,388,498 vest on December 1, 2019. The total fair value of PSUs at December 31, 2017 was $3.2 million (December 31, 2016 - $7.2 million), which represents total PSUs outstanding multiplied by the trailing five day volume weighted average share price of the Company’s underlying common shares and adjusted for performance factors. The liability is recorded in accounts payable and accrued liabilities in the consolidated statements of financial position.
During the year ended December 31, 2017, Trinidad entered into an exchange agreement with certain officers and employees whereby the holders of specific PSUs exchanged their rights to these PSUs for restricted share units (RSUs). The PSUs were exchanged on a one-to-one basis for RSUs.
For the year ended December 31, 2017, Trinidad recognized a share-based payment expense related to the outstanding PSUs of $1.3 million (2016 - expense of $6.6 million).
Restricted Share Unit Plan
On January 1, 2017, Trinidad established the RSU Plan to provide an opportunity for officers and employees of Trinidad to promote further alignment of interests between employees and the shareholders. Each RSU granted permits the holder to receive a cash payment equal to the volume weighted average share price for the five days preceding payment. RSU holders are entitled to share in dividends which are credited as additional RSUs at the dividend record date.
For the years ended December 31,(Number of RSUs) 2017 2016
Outstanding - beginning of year - -
New grants 575,614 -
Exchange of units 368,396 -
Forfeited (10,758) -
Outstanding - end of year 933,252 -
At December 31, 2017, there were no vested RSUs outstanding (December 31, 2016 - nil). The total fair value of RSUs at December 31, 2017 was $0.8 million (December 31, 2016 - nil), which represents total RSUs outstanding multiplied by the trailing five day volume weighted average share price of the Company’s underlying common shares, as the RSUs have no exercise price. The liability is recorded in accounts payable and accrued liabilities in the consolidated statements of financial position.
For the year ended December 31, 2017, Trinidad recognized a share-based payment expense related to the outstanding RSUs of $0.8 million (2016 - nil).
86 TRINIDAD DRILLING

Stock Appreciation Rights Plan
On November 5, 2013, Trinidad established the Stock Appreciation Rights (SAR) Plan to provide an opportunity for officers and employees of Trinidad to promote further alignment of interests between employees and shareholders. Each SAR granted permits the holder to receive a cash payment equal to the spread of the closing sales price of the stock and the grant price for all vested SARs. The SARs generally vest a portion on the first, second and third anniversary of the grant date, and must be exercised within ten years from the grant date.
For the years ended December 31,(Number of SARs) 2017 2016
Outstanding - beginning of year 655,564 475,916
New grants 633,238 353,850
Forfeited (263,148) (174,202)
Outstanding - end of year 1,025,654 655,564
During the year ended December 31, 2017, 633,238 SARs were granted at an exercise price ranging between $1.63 and $2.41, respectively (2016 - 353,850 SARs were granted at an exercise price of $2.13).
At December 31, 2017, there were 297,168 vested SARs outstanding (December 31, 2016 - 215,650). The total fair value of SARs at December 31, 2017 was less than $0.1 million (December 31, 2016 - $0.1 million).
For the year ended December 31, 2017, Trinidad recognized a share-based payment recovery related to the outstanding SARs of $0.1 million (2016 - expense of $0.1 million).
15. Earnings Per Share
Basic earnings per share for the years ended December 31, 2017 and 2016, is based on the net (loss) attributable to Trinidad shareholders, as reported in the consolidated statements of operations and comprehensive (loss), and the weighted average number of common shares outstanding in the period.
Diluted earnings per share for the years ended December 31, 2017 and 2016, is based on the net (loss) attributable to Trinidad shareholders, as reported in the consolidated statements of operations and comprehensive (loss), and the basic weighted average number of common shares outstanding, both adjusted for dilutive factors as follows:
For the years ended December 31,
($ thousands except share data) 2017 2016
Net (loss) earnings attributable to Trinidad common shareholders
Basic (79,618) (52,546)
Diluted (79,618) (52,546)
Weighted average number of common shares
Basic 265,956,392 222,087,270
Stock options 58,013 409,725
Diluted 266,014,405 222,496,995
For the year ended December 31, 2017, 1,340,050 stock options were excluded from the calculation of diluted earnings per share as the effect would have been anti-dilutive (2016 - 750,595 stock options excluded).
2017 ANNUAL REPORT 87

16. Capital Management
Trinidad’s capital is comprised of debt, Senior Notes and shareholders’ equity, less cash and cash equivalents. Management regularly monitors total capitalization to ensure flexibility in the pursuit of ongoing initiatives, while ensuring that shareholder returns are being maximized. The overall capitalization of the Company is outlined below:
As at December 31, December 31,
($ thousands) 2017 2016
Limited Partnership Loans (1) - 1,959
Long-term debt (2) 84,621 -
2019 Senior Notes (2) - 602,758
2025 Senior Notes (2) 438,550 -
Total debt 523,171 604,717
Shareholders' equity 1,263,388 1,242,668
(Cash and cash equivalents) (3,948) (25,780)
Total capitalization 1,782,611 1,821,605
(1) At December 31, 2017, the outstanding balance of the Limited Partnership Loans was settled.(2) Balance outstanding without consideration of debt issue costs.
Management is focused on several objectives while managing the capital structure of the Company. Specifically:
a) Ensuring Trinidad has the financing capacity to continue to execute on opportunities to increase overall market share through strategic acquisitions and rig upgrade/maintenance programs;
b) Maintaining a strong capital base to ensure that investor, creditor and market confidence is secured, and ensuring Trinidad’s strategic objectives are met, while retaining an appropriate amount of leverage;
c) Providing shareholder return through profitable business opportunities that grow the Company and benefit other stakeholders, while also safeguarding the entity’s ability to continue as a going concern.
Trinidad manages its capital structure based on current economic conditions, the risk characteristics of the underlying assets, and Trinidad’s planned capital requirements, within guidelines approved by its Board of Directors. Total capitalization is maintained or adjusted by drawing on the existing debt facilities, issuing new debt or equity securities when opportunities are identified and through the disposition of under-performing assets to reduce debt or equity when required.
The Company’s syndicated loan facility is subject to two covenants, which are reported to the bank on a quarterly basis. These covenants, which include both the Senior Debt to Bank EBITDA and Bank EBITDA to Cash Interest Expense, are non-GAAP measures defined within the loan facility and used by management to monitor capital.
• Senior Debt to Bank EBITDA is defined as the consolidated balance of the revolving facility, outstanding letters of credit, account overdraft balances less any restricted cash on hand greater than $10 million, and other debt secured by a lien at quarter end to consolidated Bank EBITDA for the trailing 12 months (TTM). Bank EBITDA used in this financial ratio is calculated as net earnings before interest, taxes, depreciation and amortization, plus impairment expense, loss (gain) on sale of assets, loss (gain) from investments in joint ventures, share-based payment expense, fair value adjustments on financial assets and liabilities and unrealized foreign exchange. Bank EBITDA also includes all cash distributions received from the Company's joint ventures during the period. For the rolling four quarters ended December 31, 2017, this ratio was 0.70:1 (2016 - (0.07):1).
88 TRINIDAD DRILLING

• Bank EBITDA to Cash Interest Expense is defined as the consolidated Bank EBITDA for TTM to the cash interest expense on all debt balances for TTM. Bank EBITDA used in this financial ratio is calculated as net earnings before interest, taxes, depreciation and amortization, plus impairment expense, loss (gain) on sale of assets, loss (gain) from investments in joint ventures, share-based payment expense, fair value adjustments on financial assets and liabilities and unrealized foreign exchange. Bank EBITDA also includes all cash distributions received from the Company's joint ventures during the period. For the rolling four quarters ended December 31, 2017, this ratio was 3.55:1 (2016 - 2.61:1).
17. Financial Instruments
Trinidad’s financial instruments include cash and cash equivalents, accounts receivable, investment in TDI joint venture, accounts payable and accrued liabilities, long-term debt, non-controlling interests liability and contingent consideration. The carrying amounts of these financial instruments, reported on the Company’s consolidated statements of financial position approximates their fair values, with the exception of the 2019 Senior Notes and the 2025 Senior Notes, as follows:
As at December 31, 2017 December 31, 2016
($ thousands)Fair
ValueCarrying
Value Fair
ValueCarrying
Value
Financial assets at amortized cost:
Cash and cash equivalents 3,948 3,948 25,780 25,780
Accounts receivable 118,612 118,612 91,062 91,062
Financial assets at fair value through profit or loss:
Investment in TDI joint venture 213,616 213,616 261,984 261,984
Financial liabilities measured at amortized cost:
Accounts payable and accrued liabilities 106,694 106,694 79,388 79,388
Limited Partnership Loan - - 1,959 1,959
Credit Facility
Canadian Revolving Credit Facility (1) 40,766 40,766 - -
US Revolving Credit Facility (1)(2) 43,855 43,855 - -
2019 Senior Notes (1) - - 602,704 602,758
2025 Senior Notes (1) 427,586 438,550 - -
Financial liabilities at fair value through profit or loss:
Contingent consideration 7,035 7,035 - -
Non-controlling interests liability 8,863 8,863 7,197 7,197
(1) 2019 Senior Notes, 2025 Senior Notes and Credit Facilities are recorded at their gross amounts and do not include transaction costs incurred on their issuance.(2) US Revolving Credit Facility was equivalent to US$35.0 million at December 31, 2017 and nil at December 31, 2016.
Trinidad has estimated the fair value amounts using appropriate valuation methodologies and information available to management as of the valuation dates. The following methods and assumptions were used to estimate the fair value of each class of financial instrument for which it was practicable to estimate that value:
• Cash and cash equivalents, accounts receivable and accounts payable and accrued liabilities. The carrying amounts approximate fair value because of the short maturity of these instruments.
• Investment in TDI joint venture. The fair value of the investment reflects amounts that Trinidad has invested into the TDI joint venture and the expected future financial performance of the joint venture operations. The investment in joint venture is a level 3 in the fair value hierarchy. Inputs to the change in fair value of the investment in joint venture are disclosed in note 9.
• Long-term debt and limited partnership loan. The fair value of the various pieces of long-term debt (including amounts drawn on credit facilities) is based on the values owed to third-party financial institutions using current market price indicators. Long-term debt is a level 2 in the fair value hierarchy.
2017 ANNUAL REPORT 89

• Senior Notes. The fair value of the 2019 Senior Notes and the 2025 Senior Notes is based on the closing market price on the date of valuation. The 2019 Senior Notes and 2025 Senior Notes are a level 1 in the fair value hierarchy.
• Contingent consideration. The fair value of the contingent consideration is a level 3 in the fair value hierarchy. Inputs to the change in the fair value are disclosed in note 5.
• Non-controlling interests. The fair value of the non-controlling interests are a level 3 in the fair value hierarchy. Inputs to the change in fair value of the non-controlling interests are disclosed in note 12.
During the year ended December 31, 2017 and the year ended December 31, 2016, there were no transfers of any financial assets or liabilities between levels.
Financing costs
The carrying value of the 2025 Senior Notes and revolving credit facilities are recorded net of debt issuance costs. At December 31, 2017, the deferred issuance costs related to Trinidad's 2025 Senior Notes and revolving credit facilities was $11.5 million (December 31, 2016 - $1.7 million). Trinidad recorded finance costs of $2.3 million for the year ended December 31, 2017 relating to amortization of debt issuance costs (2016 - $5.3 million).
Nature and Extent of Risks Arising from Financial Instruments
Trinidad is exposed to a number of market risks arising through the use of financial instruments in the ordinary course of business. Specifically, Trinidad is subject to credit risk, liquidity risk, currency risk and interest rate risk.
Risks
Market risks
Financial Instrument Credit Liquidity Currency Interest rate
Measured at cost or amortized cost
Cash and cash equivalents X X X
Accounts receivable X X
Accounts payable and accrued liabilities X X
Current portion of long-term debt X X
Long-term debt X X X
Measured at fair value
Investment in TDI joint venture X X X
Non-controlling interests X X X
Contingent consideration X X
Credit risk
Trinidad is exposed to credit risk as a result of extending credit to customers prior to receiving payment for services to be performed, creating exposure on accounts receivable balances with trade customers. This exposure to credit risk is managed through a corporate credit policy whereby upfront evaluations are performed on all customers and credit is granted based on payment history, financial conditions and anticipated industry conditions. When a customer does not meet initial credit evaluations, work may be performed subject to a prepayment of services. Customer payments are continuously monitored to ensure the creditworthiness of all customers with outstanding balances and when collectability becomes questionable a provision for doubtful accounts is established.
90 TRINIDAD DRILLING

The following is a reconciliation of the change in the credit risk provision:
As at December 31, December 31,
($ thousands) 2017 2016
Reserve allowance - beginning of year 5,129 4,742
Increase in reserve recorded 5,489 458
Write-offs charged against the reserve (8,830) -
Recoveries of amounts previously written-off - (71)
Reserve allowance - end of year 1,788 5,129
As at December 31, 2017, Trinidad had accounts receivable of $4.7 million that were greater than 90 days for which no provision had been established (December 31, 2016 - $13.7 million). Of this accounts receivable balance, $0.3 million relates to accounts receivable from TDI (December 31, 2016 - $0.6 million). The Company believes that these amounts will be collected.
Liquidity risk
Liquidity risk is the risk that Trinidad will not be able to meet its financial obligations as they become due. The Company actively manages its liquidity through daily, weekly and longer-term cash outlook and debt management strategies. Trinidad’s policy is to ensure that sufficient resources are available either from cash balances, cash flows or undrawn committed bank facility, to ensure all obligations are met as they fall due. To achieve this objective, the Company:
• Maintains cash balances and liquid investments with highly-rated counter parties;
• Limits the maturity of cash balances; and
• Borrows the bulk of its debt needs under committed bank lines or other term financing.
The following maturity analysis shows the remaining contractual maturities for Trinidad’s financial liabilities:
As at December 31, 2017 Due within 2 - 3 4 - 5 After
($ thousands) 1 year years years 5 years
Accounts payable and accrued liabilities 94,297 - - -
Canadian Revolving Credit Facility 40,766 - - -
US Revolving Credit Facility 43,855 - - -
2025 Senior Notes (1) - - - 438,550
Contingent consideration 12,397 7,035 - -
Interest payments on contractual obligations 29,054 58,108 58,108 60,529
Total 220,369 65,143 58,108 499,079
(1) The financial liability of the 2025 Senior Notes represents the Canadian dollar face value at maturity in January of 2025.
Currency risk
Trinidad’s operations are affected by fluctuations in currency exchange rates due to the Company’s expansion into the US and international marketplace and reliance on US and international suppliers to deliver components used by these drilling operations. The exposure to realized foreign currency fluctuations from its US subsidiaries is mitigated due to the independence of the US and international operations from its Canadian parent for cash flow requirements to satisfy daily operations, creating a natural hedge. However, Trinidad is exposed to unrealized fluctuations in the gains and losses on consolidation, and US dollar-denominated inter-company balances between the US, international and Canadian entities. During the year ended December 31, 2017 and 2016, the Company had in place a net investment hedge on these foreign entities.
2017 ANNUAL REPORT 91

As at December 31, 2017 and 2016, portions of Trinidad’s cash and cash equivalents, accounts receivable, accounts payable and accrued liabilities and contingent consideration were denominated in US dollars. In addition, Trinidad’s US and international subsidiaries, and Trinidad’s investments in joint ventures, including all related joint venture gains and losses, are subject to foreign translation adjustments upon consolidation. Based on these US dollar financial instrument closing balances, net (loss) for the year ended December 31, 2017 would have fluctuated by $0.2 million (2016 - $0.1 million), and for the year ended December 31, 2017, other comprehensive (loss) would fluctuate by $11.0 million (2016 - $11.9 million), for every $0.01 variation in the value of the US/Canadian exchange rate.
Interest rate risk
Trinidad is exposed to risk related to changes in interest rates on borrowings under the credit facility which is subject to floating interest rates. As at December 31, 2017, Trinidad had $40.8 million outstanding debt on the Canadian dollar credit facility and $43.9 million outstanding debt on the US credit facility. A change of one percent in the interest rates for the year ended December 31, 2017 would cause a change of less than $0.3 million in interest costs (December 31, 2016 - $0.2 million).
18. Commitments and Contingencies
Commitments
Trinidad enters into drilling contracts with third parties for use of the Company’s drilling equipment. These contracts range from 12 months to five years. As well, Trinidad has several operating lease agreements on buildings and equipment. Operating lease expenses are included in general and administrative expenses and operating expenses in the consolidated statements of operations and comprehensive (loss). The Company does not have any contingent rental payments. The Company’s annual commitments are shown net of sublease income. The leases expire at various times through 2029 and there are no significant renewal or purchase options.
As at December 31, 2017 Due within 2 - 3 4 - 5 After
($ thousands) 1 year years years 5 years
Operating leases 3,623 5,839 5,205 15,598
Contingencies
Trinidad is involved in various legal actions which have occurred in the course of operations. Management is of the opinion that losses, if any, arising from such legal actions would not have a material effect on these consolidated financial statements.
92 TRINIDAD DRILLING

19. Segmented Information
The following presents the result of Trinidad’s operating segments
For the year ended
December 31, 2017
($ thousands)
United States
/ International
Operations
Canadian
Operations
Manufacturing
Operations
Joint Venture
Operations (1)
Inter-segment
Eliminations Corporate Total
Operating revenue 286,441 182,032 - - - - 468,473
Other revenue 56 1,518 - - - - 1,574
Third party recovery 12,770 18,735 - - - - 31,505
General and administrative - third party recovery - - - - - 460 460
Elimination of downstream transactions (12) (385) - - - - (397)
299,255 201,900 - - - 460 501,615
Operating costs 195,720 117,070 - - - - 312,790
Third party costs 12,770 18,735 - - - - 31,505
Operating income 90,765 66,095 - - - 460 157,320
Depreciation and amortization 114,942 83,471 1,549 - - - 199,962
(Gain) on sale of assets (1,772) (394) - - - - (2,166)
Impairment of property and equipment 2,993 - - - - - 2,993
116,163 83,077 1,549 - - - 200,789
Segmented (loss) income (25,398) (16,982) (1,549) - - 460 (43,469)
(Gain) from investments in joint ventures (1) - - - (17,659) - - (17,659)
General and administrative - - - - - 59,620 59,620
General and administrative - third party costs - - - - - 460 460
Foreign exchange - - - - - 9,295 9,295
Finance and transaction costs - - - - - 42,059 42,059
Fair value adjustments 2,915 (863) - - - - 2,052
Income taxes - - - - - (58,815) (58,815)
Net (loss) income (28,313) (16,119) (1,549) 17,659 - (52,159) (80,481)
Purchase of property and equipment 118,797 44,320 - - - - 163,117
1) The (gain) from investments in joint ventures reflects the Company’s share of the financial performance of the joint ventures during the period. The Company’s share of individual assets and liabilities are recognized as investments on the consolidated statements of financial position.
2017 ANNUAL REPORT 93
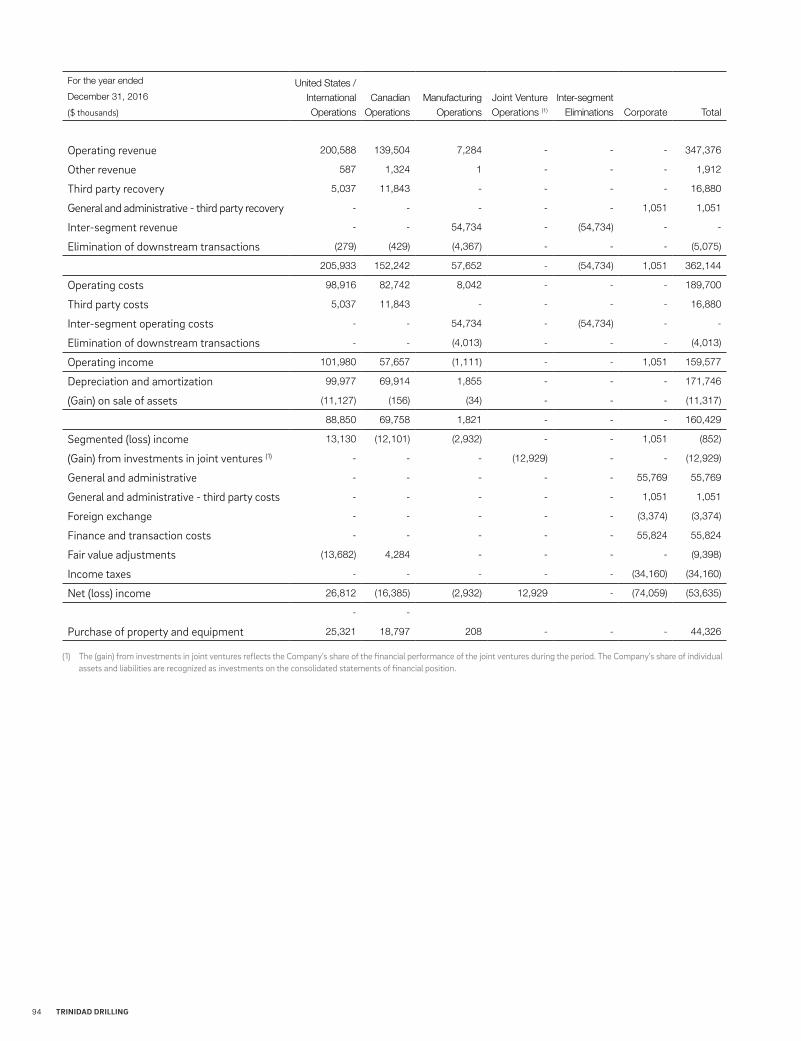
For the year ended
December 31, 2016
($ thousands)
United States /InternationalOperations
CanadianOperations
ManufacturingOperations
Joint VentureOperations (1)
Inter-segmentEliminations Corporate Total
Operating revenue 200,588 139,504 7,284 - - - 347,376
Other revenue 587 1,324 1 - - - 1,912
Third party recovery 5,037 11,843 - - - - 16,880
General and administrative - third party recovery - - - - - 1,051 1,051
Inter-segment revenue - - 54,734 - (54,734) - -
Elimination of downstream transactions (279) (429) (4,367) - - - (5,075)
205,933 152,242 57,652 - (54,734) 1,051 362,144
Operating costs 98,916 82,742 8,042 - - - 189,700
Third party costs 5,037 11,843 - - - - 16,880
Inter-segment operating costs - - 54,734 - (54,734) - -
Elimination of downstream transactions - - (4,013) - - - (4,013)
Operating income 101,980 57,657 (1,111) - - 1,051 159,577
Depreciation and amortization 99,977 69,914 1,855 - - - 171,746
(Gain) on sale of assets (11,127) (156) (34) - - - (11,317)
88,850 69,758 1,821 - - - 160,429
Segmented (loss) income 13,130 (12,101) (2,932) - - 1,051 (852)
(Gain) from investments in joint ventures (1) - - - (12,929) - - (12,929)
General and administrative - - - - - 55,769 55,769
General and administrative - third party costs - - - - - 1,051 1,051
Foreign exchange - - - - - (3,374) (3,374)
Finance and transaction costs - - - - - 55,824 55,824
Fair value adjustments (13,682) 4,284 - - - - (9,398)
Income taxes - - - - - (34,160) (34,160)
Net (loss) income 26,812 (16,385) (2,932) 12,929 - (74,059) (53,635)
- -
Purchase of property and equipment 25,321 18,797 208 - - - 44,326
(1) The (gain) from investments in joint ventures reflects the Company’s share of the financial performance of the joint ventures during the period. The Company’s share of individual assets and liabilities are recognized as investments on the consolidated statements of financial position.
94 TRINIDAD DRILLING

As at December 31, 2017
($ thousands)
United States /
International
Operations
Canadian
Operations
Manufacturing
Operations
Joint Venture
Operations (1)
Inter-segment
Eliminations Corporate Total
Property and equipment 882,091 481,363 361 - - - 1,363,815
Intangible assets and goodwill 71,441 18,898 - - - - 90,339
Total assets less deferred tax asset 1,075,423 524,301 6,201 214,976 - - 1,820,901
Deferred income tax asset (liability) (4,803) 82,876 (675) - - - 77,398
(1) The (gain) from investments in joint ventures reflects the Company’s share of the financial performance of joint ventures during the period. The Company’s share of individual assets and liabilities are recognized as an investment on the consolidated statements of financial position.
As at December 31, 2016
($ thousands)
United States /
International
Operations
Canadian
Operations
Manufacturing
Operations
Joint Venture
Operations (1)
Inter-segment
Eliminations Corporate Total
Property and equipment 907,182 555,542 20,173 - - - 1,482,897
Intangible assets and goodwill 13,991 19,172 543 - - - 33,706
Total assets less deferred tax asset 1,030,729 606,824 8,977 262,673 - - 1,909,203
Deferred income tax asset (liability) (45,151) 69,774 (1,098) - - - 23,525
(1) The (gain) from investments in joint ventures reflects the Company’s share of the financial performance of joint ventures during the period. The Company’s share of individual assets and liabilities are recognized as an investment on the consolidated statements of financial position.
20. Significant Customers
At December 31, 2017, Trinidad had long-term contracts in place with a number of significant oil and natural gas producing companies. For the year-ended December 31, 2017, Trinidad had one customer that provided a percentage of total revenue of 11% (2016 - one customer provided a percentage of total revenue of 13%).
21. Related Party Transactions
Trinidad engages the law firm Blake, Cassels & Graydon LLP to provide legal advice. One partner of this law firm is an officer of the Company. During the year ended December 31, 2017, Trinidad incurred legal fees of $2.0 million (2016 - $0.8 million) to Blake, Cassels & Gaydon LLP. At December 31, 2017, $0.3 million was due to Blake, Cassels & Graydon LLP (December 31, 2016 - nil).
2017 ANNUAL REPORT 95

Key Management Compensation
Key management personnel are persons having authority and responsibility for planning, directing and controlling the activities of the Company. Trinidad has identified key management personnel as directors, executive officers and department heads.
The following discloses the amounts recognized as expense during the year related to key management personnel:
For the years ended December 31,
($ thousands) 2017 2016
Wages and short-term benefits 6,803 4,870
Share-based expense 23 7,018
6,826 11,888
The following discloses the number of units in share-based payment plans held by key management personnel:
As at December 31, December 31,
(Number of units) 2017 2016
Deferred share units 693,849 557,313
Performance share units 2,216,891 3,673,072
Restricted share units 282,530 -
Included in the key executive employee contracts are clauses related to amounts received upon a change of control for Trinidad. For the year ended December 31, 2017, if there had been a change of control for Trinidad, the Company would be required to pay $8.2 million (2016 - $17.8 million).
96 TRINIDAD DRILLING

Legal Entities
The following is a list of active legal entities through which Trinidad conducts its operations excluding joint venture entities, all are 100% owned:
As at December 31, 2017
Entity Principal Activity Country of Incorporation
Trinidad Energy Services Income Trust Holding company Canada
Trinidad Well Servicing Ltd. Holding company Canada
Trinidad Holding Co. Holding company United States
Trinidad Drilling USA Ltd. Land drilling United States
Trinidad Drilling LP Land drilling United States
Trinidad Drilling LLC Land drilling United States
Trinidad Design & Manufacturing US, Inc. Construction United States
RigMinder Operating LLC Technology services United States
Axxis Drilling Inc. Land and offshore drilling United States
Axxis Drilling (Land) Inc. Land and offshore drilling United States
Axxis Drilling (Bareboat) Inc. Barge operations United States
CanElson Drilling (US) Inc. Holding company United States
CanElson Management, LLC Land drilling United States
TDL Luxembourg Ltd. Holding company Canada
TDL Financing Luxembourg SARL Holding company Luxembourg
Trinidad Luxembourg Ops Sarl Holding company Luxembourg
Trinidad Drilling International Ltd. Holding company Canada
TDL Mexico SA de CV Land drilling Mexico
Trinidad Drilling Services Mexico SA de CV Labour services Mexico
TDL Management Services DMCC Holding company Dubai
Trinidad Saudi LLC Land drilling Saudi Arabia
TDL Kuwait for Oil Rigs and Natural Gas Extraction Activities,Land drilling United Arab Emirates
Services and Facilities S.P.C.
Trinidad South America General Partner Ltd. Holding company Canada
Trinidad Drilling South America Limited Holding company Canada
Trinidad South American Limited Partnership Holding company Canada
Victory Rig Equipment Corporation Construction Canada
RigMinder Canada Inc. Technology services Canada
TDL Bermuda Ltd. Insurance company Bermuda
Trinidad Design and Manufacturing FZE Construction United Arab Emirates
1703090 Alberta Ltd. Holding company Canada
1735664 Alberta Ltd. Holding company Canada
1737804 Alberta Ltd. Holding company Canada
Canelson 120601 Drilling LP #3 Holding company Canada
2017 ANNUAL REPORT 97

22. Expenses By Nature
The Company presents certain expenses in the consolidated statements of operations and comprehensive (loss) by function. The following table presents these expenses by nature:
For the years ended December 31,
($ thousands) 2017 2016
Expenses
Wages and benefits 218,961 130,511
Materials and supplies 67,859 46,557
Third party costs 31,505 16,880
Repairs and maintenance 52,371 28,341
Research and development costs 151 -
External services and facilities 31,663 27,613
General and administrative - third party costs 460 1,051
Share-based payment expense 1,405 8,434
404,375 259,387
Allocated to:
Operating expense 344,295 202,567
General and administrative 60,080 56,820
404,375 259,387
Foreign exchange
Foreign exchange - realized 6,291 3,636
Foreign exchange - unrealized 3,004 (7,010)
9,295 (3,374)
Finance and transaction costs
Interest on long-term debt 37,600 49,907
Accretion of 2019 Senior Notes 53 611
Amortization of deferred financing costs 2,338 5,306
Transaction costs 2,068 -
42,059 55,824
98 TRINIDAD DRILLING

23. Foreign Currency Translation
The foreign currency translation adjustment relates to Trinidad’s non-Canadian operations that have functional currencies that differ from the Canadian dollar and exchange differences on Trinidad’s 2019 Senior Notes and 2025 Senior Notes held in US dollars. When the settlement of a balance is not foreseeable in the near future, foreign exchange gains and losses arising on the translation of inter-company balances are considered part of the net investment in the foreign operation. All amounts will be reclassified to profit or loss when specific conditions are met.
For the years ended December 31,
($ thousands) 2017 2016
Unrealized gain on translation of foreign operations
with functional currency different from Canadian dollar (77,027) (38,425)
Foreign exchange loss on net investment hedge with
US dollar denominated debt, net of tax (1) 26,183 13,977
Total foreign currency translation adjustment (50,844) (24,448)
(1) Net of income tax for the year ended December 31, 2017 is $9.2 million (2016 - $5.2 million).
24. Supplemental Information
Change in non-cash working capital balances:
For the years ended December 31,
($ thousands) 2017 2016
Accounts receivable (31,527) 21,295
Inventory 1,779 (3,548)
Prepaid expenses 47 1,504
Accounts payable and accrued liabilities 23,274 (5,346)
Deferred revenue 293 (31,487)
(6,134) (17,582)
Pertaining to:
Operations (30,954) (32,308)
Investing 24,820 14,726
(6,134) (17,582)
2017 ANNUAL REPORT 99

Reconciliation of liabilities to cash flows arising from financing activities:
Short-term Long-term
($ thousands) Borrowings Borrowings
As at December 31, 2016 1,959 601,057
Changes from financing cash flows
Proceeds from long-term debt - 164,268
Repayments of debt (1,959) (79,647)
Repayments of 2019 Senior Notes - (591,670)
Proceeds from 2025 Senior Notes - 461,860
Debt issuance costs - (11,458)
Non-cash changes -
Accretion of 2019 Senior Notes - 53
Amortization of deferred financing costs - 2,338
Translation adjustment of Senior Notes - (35,127)
As at December 31, 2017 - 511,674
25. Subsequent Event
Effective February 20, 2018, Trinidad announced that the Board of Directors has commenced a formal process to initiate a strategic review in an effort to enhance shareholder value. In connection with this process, the Board intends to undertake a comprehensive review to identify and consider a broad range of alternatives and their potential to enhance shareholder value. The Company does not intend to set a definite schedule to complete its evaluation or process and cautions that there are no assurances or guarantees that the process will result in a transaction or, if a transaction is undertaken, the terms or timing of such a transaction.
100 TRINIDAD DRILLING

ANNUAL MEETING
The Annual Meeting of shareholders will be held on May 8, 2018 at 10 am. Mountain Daylight Time in the Calgary Petroleum Club Cardium Room 319 – 5th Avenue S.W. Calgary, Alberta.
CORPORATE INFORMATION
Trinidad’s drilling fleet has always been one of the most adaptable, technologically advanced, and competitive in the industry—and we’re focused on keeping it that way. In 2017, this included undertaking an extensive rig upgrade program and the strategic acquisition of RigMinder.
We are meeting customers’ changing needs with integrated service offerings and cutting-edge automation and technology that unlocks potential and adds value. We have shown innovation in our rig designs, our product offerings to our customers and our day-to-day performance management. Moving into 2018, we are robustly equipped and strategically poised to deliver unparalleled value in the face of ever-changing markets, environments and challenges.
DIRECTORS
Michael HeierIndependent Businessman Cochrane, AB
Jim BrownIndependent Businessman Calgary, AB
Brian BurdenIndependent Businessman Calgary, AB
David HalfordIndependent Businessman Calgary, AB
Nancy LairdIndependent Businesswoman Calgary, AB
Ken SticklandIndependent Businessman Calgary, AB
MANAGEMENT
Brent ConwayPresident and Chief Executive Officer
Lesley BolsterChief Financial Officer
Laura IngramVice President, Finance
Adrian LachanceChief Operating Officer
Gavin LaneSenior Vice President, Canadian Operations
Ron ParentVice President, Human Resources, HSE and QMS
Nial ShepherdSenior Vice President, Trinidad Drilling International
BANKERS
Royal Bank of CanadaCalgary, AB
Wells FargoHouston, TX
AUDITORS
PricewaterhouseCoopers LLPChartered Professional Accountants Calgary, AB
LEGAL COUNSEL
Blake, Cassels & Graydon LLPCalgary, AB
REGISTRAR AND TRANSFER AGENT
TSX Trust CompanyToronto, ON
FOLD LINESFOLD LINES

TRINIDAD DRILLING LTD.1000, 585 - 8th Avenue SW | Calgary AB T2P 1G1
P: 403.265.6525 F: 403.265.4168 E: [email protected]
Download the latest presentations and financial results about Trinidad Drilling at: www.trinidaddrilling.com
Trinidad Drilling is traded on TSX under the symbol TDG
TRIN
IDA
D D
RILLIN
G 20
17 AN
NU
AL R
EPOR
TFOLD LINESFOLD LINES