trictide, a tricellulin-derived peptide to modulate cell
TRANSCRIPT

Trictide, a Tricellulin-Derived Peptide to Modulate Cell
Barriers and to Understand the Tricellular Organization of
Tight Junctions
Inaugural-Dissertation
to obtain the academic degree
Doctor rerum naturalium (Dr. rer. nat.)
Submitted to the Department of
Biology, Chemistry and Pharmacy
of Freie Universität Berlin
by Başak Arslan
from Istanbul
2018
The dissertation was written from 29 January 2015 till 9 October
2018 under supervision of PD Dr. Ingolf E. Blasig at the Leibniz-
Institut für Molekulare Pharmakologie (FMP).
1st Reviewer: PD Dr. Ingolf E. Blasig Molecular cell physiology
Leibniz-Institut für Molekulare Pharmakologie (FMP)
2nd Reviewer: Prof. Dr. Ursula Koch Institute of Biology
Freie Universität Berlin
Date of defence: 28.01.2019

ACKNOWLEDGMENTS
iii
ACKNOWLEDGEMENTS
Firstly, I would like to thank my supervisor PD Dr. Ingolf E. Blasig for his supervision and
support along my PhD studies, without him, this work will not be possible. I would also
like to thank Prof. Dr. Ursula Koch for reviewing my thesis. As much as Ingolf, I am
grateful to Dr. Reiner Haseloff for his constant support both intellectually and technically,
Dr. Rosel Blasig and Dr. Lars Winkler for helping me with complicated and stressful
animal experiments. I also thank my lovely collegues Dr. Sophie Dithmer, Dr. Olga
Breitkreuz-Korff who made this journey bearable and fun and Dr. Christian Staat whom I
learned a lot from.
I especially would like to thank Dr. Jimmi Cording who teached me almost everything I
know about my project and Berlin. Without him I could not be that excited about science
and pursue my science career in this cool city. Aside from Jimmi, I feel lucky to be part of
‘tricellulin team’ and to work with wonderful people and at this regard I am thankful to
Ramona Birke and Anneliese Krüger for being the best team members at the hardest days.
I am more than thankful to Dr. Burkhart Wiesner, Jenny Eichhorst and Dr. Martin
Lehmann who have always supported me to improve my project and provided everything I
need to finalize this degree. I am also thankful to Dr. Susanne Krug for her input in trictide
publication.
Most importantly I should express my gratitude to Dr. Philipp Berndt for just being there,
being my friend, supporting me emotionally and scientifically because I cannot imagine a
Ph.D. period without him. I also need to thank Erica Tornabene for coming to Berlin and
making my first summer colorful and Carolin Müller; we spent some great time together,
both in the lab and outside in the city.
I am grateful to know my dearest friends Aslıhan Karabacak, Gizem Inak and Yeşim
Yurtdaş who are my family in Berlin and Eray Sahin who helped me everytime I need.
Lastly, I am thankful for my actual family Ekrem-Aynur Arslan, Dilan Bozdağ and Dr.
Bilge Batu Oto who always trusted me and lent me hand regardless of distance.

iv
SUMMARY
Tricellulin (Tric) is a tight junction protein at tricellular contacts; however its exact structure,
function and regulation are unclear. Tric contributes to the paracellular tightening by intercellular
trans-interactions between its extracellular loops 2 (ECL2). Consequently, trictide, a peptide
derived from the Tric ECL2 was designed as a potential drug enhancer to specifically overcome
tissue barriers. This work is aimed to investigate the functional and molecular modulations of
tricellular contacts caused by trictide and to understand essential elements and protein interactions
of tricellular tight junctions (tTJ) for barrier formation.
Trictide increased the passage of ions, small and larger molecules up to 10 kDa in a concentration
dependent manner over duration from 16 h to 47 h after application to human colon epithelial cells.
Under normal conditions, lipolysis-stimulated lipoprotein receptor (LSR) and Tric localized at tTJs
while occludin (Occl), claudin-5 (Cldn5) and claudin-1 (Cldn1) localized at bicellular TJs (bTJ).
After trictide treatment, Tric and LSR moved from tTJs to bTJs, and the bTJ proteins Cldn1 and
Occl were internalized. Trictide also decreased the transcellular resistance of brain endothelial cells
after 14 h and caused enrichment of Cldn5 around the tri-cellular area. Trictide down-regulated
Occl, Tric, Cldn1, Cldn5 in epithelial cells and LSR, Occl, Cldn1 in mouse brain endothelial cells.
Trictide-initiated opening of the tricellular sealing tube revealed a Tric-free area at the tricellular
region as demonstrated by super resolution microscopy. In different cells, cis-interactions of Tric–
Tric (tTJs), Tric–Cldn1, Tric–marvelD3, and Occl–Occl (bTJs) were strongly reduced by trictide
treatment. In normal brain capillaries of different species, Tric was localized both at bTJs and tTJs
while LSR was found exclusively at tTJs. In vivo, trictide did not increase the uptake of small
molecules by mouse kidney and liver but tended to enhance brain uptake. Circular dichroism
spectroscopy and molecular modelling suggested that trictide consists of 50% β-sheet structure
resulting in an elongated conformation. Contrarily, scrambled trictide has a globular shape.
Molecular docking models of trictide support the assumption that outward-directed aromatic amino
acids are involved in a binding to tricellulin.
In conclusion, trictide is a novel and promising tool for overcoming cellular barriers at bTJs and
tTJs with the potential to improve permeation of small molecules. Moreover, after targeting the
cellular junctions, a connection has been disclosed between the disturbances of mutual interactions
and the resulting redistribution of TJ proteins and functional alterations of the barrier.

v
ZUSAMMENFASSUNG
Tricellulin (Tric) ist ein in trizellulären Kontakten lokalisiertes tight junction (TJ)-Protein;
seine genaue Struktur, Funktion und Regulation sind jedoch nicht bekannt. Tric trägt zur
parazellulären Dichtheit durch die Ausbildung interzellulärer trans-Interaktionen zwischen
seinen zweiten extrazellulären Schleifen (ECL2) bei. Daher wurde mit Trictid ein aus dem
ECL2 von Tric abgeleitetes Peptid entwickelt, das als potentieller Wirkungsverstärker die
spezifische Überwindung von Gewebsbarrieren ermöglichen soll. In der vorliegenden Arbeit
werden Trictid-induzierte funktionelle und molekulare Veränderungen trizellulärer Kontakte
untersucht um zum Verständnis essentieller Elemente und Proteininteraktionen von
trizellulären tight junc-tions (tTJ) für die Ausbildung von Barrieren beizutragen.
In Abhängigkeit von seiner Konzentration erhöhte Trictid die Passage von Ionen und Mole-
külen mit mM < 10 kDa innerhalb von 16 h bis 47 h nach Zugabe zu Kulturen humaner
Darmepithelzellen. Unter Normalbedingungen lokalisierten der Lipolyse-stimulierte Lipopro-
teinrezeptor (LSR) und Tric in den trizellulären tTJs, während Occludin (Occl), Claudin-5
(Cldn5) und Claudin-1 (Cldn1) in den bizellulären TJs (bTJs) gefunden wurden. Nach Trictid-
Behandlung erfolgte die Relokalisation von Tric und LSR zu den bTJ, und Cldn1 und Occl
wurden internalisiert. Darüber hinaus verringerte sich der transzelluläre Widerstand von Ge-
hirnendothelzellen 14 h nach Trictide-Zugabe, und eine Anreicherung von Cldn5 im trizellulä-
ren Bereich wurde beobachtet. Trictid-Applikation führte zur Herabregulation von Occl, Tric,
Cldn1, Cldn5 in Epithelzellen und von LSR, Occl und Cldn1 in murinen Gehirnendothelzel-
len. Untersuchungen mit superauflösender Mikroskopie zeigen, dass die Trictid-induzierte
Proteinrelokalisation die Ausbildung eines Tric-freien Bereichs in der trizellulären Region be-
wirkte. Die cis-Interaktionen Tric-Tric (tTJs), Tric–Cldn1, Tric–marvelD3 und Occl–Occl
(bTJs) wurden durch Trictid-Behandlung stark reduziert.
In normalen Gehirnkapillaren verschiedener Spezies lokalisierte Tric in den bTJs und tTJ,
während LSR ausschließlich in den tTJ gefunden wurde. In vivo wurde die Aufnahme kleiner
Moleküle durch Niere und Leber der Maus nicht durch Trictid beeinflußt, jedoch eine ten-
denziell erhöhte Aufnahme in das Gehirn beobachtet. Circulardichroismus-Spektroskopie und
molekulares Modelling lassen darauf schließen, dass Trictid zu 50% eine β-Faltblattstruktur
annimmt und in einer gestreckten Konformation vorliegt. Molekulares Docking von Trictid
legt nahe, dass auswärts gerichtete Aminosäuren für eine Bindung an Tric von Bedeutung sind.

Die durchgeführten Untersuchungen lassen den Schluß zu, dass Trictid ein neuartiges und
vielversprechendes Werkzeug für die Überwindung zellulärer Barrieren von bTJ und tTJ dar-
stellt und das Potential besitzt, als Permeationsverstärker für kleine Moleküle zu dienen. Dar-
über hinaus wurde durch die zielgerichtete Einflußnahme auf die zellulären Junctions ein Zu-
sammenhang zwischen der Störung der gegenseitigen Interaktionen und der daraus resultie-
renden Umverteilung der TJ-Proteine und den funktionalen Veränderungen der Barriere auf-
gedeckt.

TABLE OF CONTENTS
vii
TABLE OF CONTENTS
ACKNOWLEDGEMENTS ................................................................................................ III
SUMMARY ......................................................................................................................... IV
ZUSAMMENFASSUNG ..................................................................................................... V
LIST OF FIGURES ........................................................................................................... XII
LIST OF TABLES ............................................................................................................. XV
LIST OF SUPPLEMENTARY MATERIAL ................................................................... XVI
1. INTRODUCTION .......................................................................................................... 1
1.1. Organization and function of epithelium and endothelium..................................... 1
1.2. Tight junctions ........................................................................................................ 3
1.2.1. Bicellular and tricellular tight junctions .......................................................... 5
1.3. Tight junction proteins ............................................................................................ 7
1.3.1. Claudins ........................................................................................................... 7
1.3.2. Tight junction associated MARVEL proteins ................................................. 9
1.3.3. Occludin ......................................................................................................... 10
1.3.4. MarvelD3 ....................................................................................................... 11
1.3.5. Tricellulin ....................................................................................................... 12
1.4. Tight junction scaffolding proteins ....................................................................... 15
1.5. The Angulin-protein family .................................................................................. 16
1.6. Tricellular tight junctions in blood-brain barrier .................................................. 17
1.7. The importance of tricellular tight junctions in pathological events ..................... 18
1.8. Drug delivery by modulation of tight junctions .................................................... 19
1.9. Tight junction peptidomimetics ............................................................................ 19
1.10. State of research .................................................................................................... 21
2. AIM .............................................................................................................................. 23
3. MATERIALS AND METHODS ................................................................................. 24
3.1. Materials ................................................................................................................ 24
3.2. Methods ................................................................................................................. 33
3.2.1. Peptide design and synthesis .......................................................................... 33

TABLE OF CONTENTS
3.2.2. Cell Culture .................................................................................................... 33
3.2.2.1. Routine cell culture work ....................................................................... 33
3.2.2.2. Cryopreservation and thawing of cells ................................................... 34
3.2.2.3. Cell counting .......................................................................................... 34
3.2.2.4. Transfection and obtaining stable transfected cell lines ......................... 35
3.2.2.5. Cell cultivation on coverslips and filters ................................................ 35
3.2.2.6. Application of peptide on cells ............................................................... 35
3.2.3. Functional assays ........................................................................................... 36
3.2.3.1. Measuring transepithelial electrical resistance ....................................... 36
3.2.3.2. Permeation assays................................................................................... 37
3.2.3.3. Cell viability ........................................................................................... 38
3.2.3.4. Electric cell-substrate impedance sensing .............................................. 38
3.2.4. Histological methods ..................................................................................... 39
3.2.4.1. Obtaining cryosections ........................................................................... 39
3.2.4.2. Immunohistochemistry of cryosections.................................................. 39
3.2.5. Microscopic investigation .............................................................................. 40
3.2.5.1. Immunocytochemistry on cover glasses and filters ............................... 40
3.2.5.2. Live cell imaging .................................................................................... 40
3.2.5.3. Fluorescence resonance energy transfer ................................................. 41
3.2.5.4. Stimulated emission depletion microscopy (STED) .............................. 42
3.2.6. Protein biochemistry methods ....................................................................... 43
3.2.6.1. Cell lysis of eukaryotic cells .................................................................. 43
3.2.6.2. Determination of protein concentration ................................................. 44
3.2.6.3. Sodium dodecyl sulphate polyacrylamide gel electrophoresis............... 44
3.2.6.4. Western blot ........................................................................................... 45
3.2.6.5. Peptide detection in blood plasma .......................................................... 45
3.2.6.6. Expression and purification of maltose-binding protein tagged proteins ...
................................................................................................................ 46
3.2.6.7. Purificaton of His-tagged proteins ......................................................... 46
3.2.6.8. Co-immunoprecipitation ........................................................................ 46
3.2.7. In vivo investigations in mice ........................................................................ 47
3.2.7.1. Peptide injections and detection of fluorescent dyes.............................. 47
3.2.7.2. Obtaining blood plasma.......................................................................... 48
3.2.8. Molecular biological methods ....................................................................... 48

TABLE OF CONTENTS
3.2.8.1. Quantitative real time polymerase chain reaction .................................. 48
3.2.8.2. Molecular cloning................................................................................... 49
3.2.8.3. Preparation of electrocompetent bacteria ............................................... 51
3.2.8.4. Transformation of electrocompetent bacteria ......................................... 51
3.2.8.5. Site directed mutagenesis ....................................................................... 51
3.2.9. Biophysical methods ...................................................................................... 52
3.2.9.1. Circular dichroism spectroscopy ............................................................ 52
3.2.9.2. Three-dimensional structure prediction of peptides ............................... 53
3.2.9.3. Mass spectroscopic detection of peptides in the blood plasma .............. 54
3.2.10. Statistsics .................................................................................................... 54
4. RESULTS ..................................................................................................................... 55
4.1. Tricellulin is highly expressed in kidney and colon .............................................. 55
4.2. Tight junction proteins were detected in mouse and human brain sections .......... 56
4.3. Tricellulin peptidomimetic to permeabilize cell barrier ........................................ 58
4.3.1. Recombinant tricellulin extracellular loop two affects barrier integrity ........ 58
4.3.2. The synthetic peptide trictide affects human epithelial colorectal
adenocarcinoma cell line 2 ........................................................................................... 59
4.3.2.1. Trictide has a concentration dependent effect on cell barrier tightness
and a small concentration-difference between cytotoxicity and barrier opening ..... 60
4.3.2.2. The effect of trictide on the impedance of the cell barrier ..................... 61
4.3.2.3. Trictide opens the cellular barrier for molecules up to 10 kDa. ............. 62
4.3.2.4. D-amino acid derivative of trictide is not effective. ............................... 63
4.3.2.5. Trictide affects bicellular and tricellular tight junction proteins ............ 64
4.3.2.6. Trictide mainly causes down-regulation of tricellulin and occludin ...... 67
4.3.3. Effect of trictide on claudin-5 rich endothelial cells forming blood-brain
barrier ....................................................................................................................... 69
4.3.3.1. Trictide weakens the paracellular barrier of mouse brain endothelial cell
69
4.3.3.2. Up to 75 micromolar, trictide is not cytotoxic for mouse brain
endothelial cells ........................................................................................................ 70
4.3.3.3. Trictide down-regulates claudin-1, lipolysis stimulated lipoprotein
receptor and occludin in mouse brain endothelial cells ............................................ 71
4.3.3.4. Trictide concentrates claudin-5 and ZO-1 around tricellular contacts ... 73

TABLE OF CONTENTS
4.3.4. Tricellulin knockdown confirms the tricellulin dependent function of trictide .
....................................................................................................................... 76
4.3.5. Effect of trictide on Madin-Darby canine kidney and human embryonic
kidney cells ................................................................................................................... 78
4.3.5.1. Trictide affects tight junction protein-protein interactions..................... 78
4.3.5.2. Super resolution microscopy revealed opening of the tricellular sealing
tube ................................................................................................................ 80
4.3.5.3. Trictide redistributes occludin from bicellular junctions progressively
during 15 h of incubation .......................................................................................... 81
4.3.6. In vivo effect of trictide .................................................................................. 84
4.3.6.1. Trictide can be detected in mouse blood plasma up to 48 hours ............ 84
4.3.6.2. Junction proteins in mouse brain and kidney are highly affected by
trictide ................................................................................................................ 85
4.3.6.3. Trictide does not change Na-fluorescein uptake of kidney and liver,
while uptake in brain tends to be enhanced .............................................................. 87
4.3.6.4. Claudin-5 and occludin are altered in brain capillaries after trictide ad-
ministration .................................................................................................... 88
4.3.7. Trictide structure is predicted as a β-sheet formed by two β-strands with
surface-exposed aromatic residues. .............................................................................. 90
4.3.8. Single substitutions of aromatic residues in tricellulin extracellular loop 2 do
not alter localization of tricellulin. ............................................................................... 94
4.3.9. Homophillic tricellulin interactions are mediated by its C-terminal tail ....... 95
5. DISCUSSION............................................................................................................... 98
5.1. Tricellulin detected mostly in epithelial tissue dominant organs .......................... 98
5.2. Trictide opens cell barriers and improves the passage of ions and macromolecules
............................................................................................................................. 100
5.3. Trictide modulates localization and expression of tricellulin and other tight
junction proteins ............................................................................................................. 103
5.4. Trictide does not modulate properties of tissue barriers considerably ................ 106
5.5. Determination of trictide’s secondary structure and interaction with tricellulin 109
6. CONCLUSION .......................................................................................................... 111
REFERENCES .................................................................................................................. 114

TABLE OF CONTENTS
SUPPLEMENTARY MATERIAL.................................................................................... 132

LIST OF FIGURES
xii
LIST OF FIGURES
Fig. 1.1 The junctional complex in epithelial cells and endothelial cells .............................. 2
Fig. 1.2 The localization of tight junctions relative to other junctional components of
epithelial cells ........................................................................................................................ 3
Fig. 1.3. The structure of tight junctions ................................................................................ 4
Fig. 1.4 Structure of tricellular and bicellular tight junctions ................................................ 6
Fig. 1.5 Schematic illustration of claudin structure and their way of interaction .................. 8
Fig. 1.6 Classification of tight junction associated MARVEL domain containing proteins
(TAMPs) and the organization of TAMPs together with other junctional proteins ............ 10
Fig. 1.7 Scheme of predicted structure of tricellulin and occludin and isoforms of human
tricellulin .............................................................................................................................. 13
Fig. 1.8 Schematic illustration of brain microvascular endothelial cells and position of
tricellular tight junctions (tTJ) ............................................................................................. 17
Fig. 4.1 Tricellulin is highly expressed in most of the epithelial tissue dominant organs and
less in endothelial tissue dominant organs of mice .............................................................. 55
Fig. 4.2 Tricellulin localizes throughout cell-cell contacts and is enriched at tricellular
contacts in Z-direction of the mouse brain capillaries ......................................................... 56
Fig. 4.3 Tricellulin and lipolysis stimulated lipoprotein receptor (LSR) are expressed in
human brain capillaries and localize in contacts between tricellular membrane surface
patches. ................................................................................................................................ 57
Fig. 4.4 Administration of the recombinant extracellular loop 2 (ECL2) of human
tricellulin (Tric) causes redistribution of Tric and occludin (Occl) from the plasma
membrane to the cytosol and weakens the paracellular barrier of human colon carcinoma
epithelial (Caco-2) cells ....................................................................................................... 59
Fig. 4.5 150 µM non-cytotoxic trictide concentration weakens the paracellular barrier of
filter-cultured human colon carcinoma epithelial (Caco-2) cells after 16 h of incubation .. 60
Fig. 4.6 Trictide reversibly influences the barrier of human colon carcinoma epithelial
(Caco-2) cells ....................................................................................................................... 61
Fig. 4.7 150 µM of trictide opens the paracellular barrier of human colon carcinoma
epithelial (Caco-2) cells for small and larger molecules up to 10 kDa ................................ 63

LIST OF FIGURES
Fig. 4.8 D-amino acid trictide (D-trictide) does not have an effect on transcellular barrier
tightness of human colon carcinoma epithelial cells .......................................................... 64
Fig. 4.9 Proteins related to the tricellular tight junctions are strongly affected by 16 h
treatment with trictide .......................................................................................................... 65
Fig. 4.10 Trictide down-regulates expression of tricellulin, marvelD3, occludin and
claudins in human colon carcinoma epithelial cells ............................................................ 68
Fig. 4.11 Trictide weakens the paracellular barrier of mouse brain endothelial cells starting
from 9 h of incubation ......................................................................................................... 70
Fig. 4.12 ≤75 µM trictide is not cytotoxic for mouse brain endothelial cells (bEnd.3)....... 71
Fig. 4.13 Trictide down-regulates mRNA expression of claudin-1, LSR and occludin in
mouse brain endothelial cells ............................................................................................... 72
Fig. 4.14 Claudin-5 (Cldn5) and zonula occludens protein-1 (ZO-1) are enriched close to
tricellular area after trictide treatment ................................................................................. 73
Figure 4.15 Claudin-5 (Cldn5) and occludin (Occl) are internalized and enriched close to
tricellular area after trictide treatment ................................................................................. 74
Figure 4.16 Claudin-5 (Cldn5) is concentrated around tricellular area after trictide
treatment .............................................................................................................................. 75
Fig. 4.17 Tricellulin (Tric) knockdown cells confirmed that trictide function depends on
the presence of Tric .............................................................................................................. 77
Fig. 4.18 Trictide interferes with protein interactions of tricellulin (Tric) and with Occl
(occludin)-Occl association ................................................................................................. 79
Fig. 4.19 Trictide treatment opens tricellular tight junctions by removing tricellulin (Tric)
and occludin (Occl) from the tricellular cell contact area. .................................................. 80
Fig. 4.20 Live-cell imaging for 15 h reveals that trictide and TAMRA-trictide alter
localization of occludin and cause its redistribution from 2-cell contacts to cytosol .......... 83
Fig. 4.21 TAMRA-trictide (human) has a half-life of 12 h in mouse blood plasma ........... 85
Fig. 4.22 Trictide causes up-regulation of tricellulin (Tric) and claudin-5 (Cldn5), down-
regulation of lipolysis stimulated lipoprotein receptor (LSR) in brain. Trictide causes
down-regulation of Tric, marvelD3 (MD3), zonula occludens protein 1 (ZO1) and claudin-
25 (Cldn25) in kidney .......................................................................................................... 87
Fig. 4.23 Na-fluorescein uptake of kidney and liver does not change 4 h after trictide
administration, but uptake in brain tends to be higher ......................................................... 88
Fig. 4.24 Trictide injections caused slight alterations at the localization of claudin-5
(Cldn5) and tricellulin (Tric), and significant changes of the fluorescence intensity of

LIST OF FIGURES
Cldn5 and occludin (Occl) proteins ..................................................................................... 89
Fig. 4.25 Trictide has mainly the potential to form β-sheet ................................................. 91
Fig. 4.26 Trictide structure is predicted as a β-sheet formed by two β-strands with surface
exposed aromatic residues ................................................................................................... 92
Fig. 4.27 Potential aromatic binding mechanisms of trictide to the human tricellulin (Tric)
extracellular loop two (ECL2) ............................................................................................. 93
Fig. 4.28 Tricellulin (Tric) extracellular loop 2 (ECL2) mutations do not change Tric’s
tricellular localization .......................................................................................................... 95
Fig. 4.29 Tricellulin (Tric) binds to Tric with its C-terminal tail ........................................ 96
LIST OF TABLES
xv
LIST OF TABLES
Table 1. Occludin peptidomimetics ..................................................................................... 20
Table 2 Claudin peptidomimetics ........................................................................................ 21
Table 3 Chemicals ............................................................................................................... 25
Table 4 Devices ................................................................................................................... 26
Table 5 Consumables ........................................................................................................... 27
Table 6 Commercial solutions/enzymes and kits ................................................................ 27
Table 7 Antibodies ............................................................................................................... 28
Table 8 Plasmids .................................................................................................................. 29
Table 9 Primers used for qRT-PCR ..................................................................................... 30
Table 10 Primers used for mutagenesis PCR of hTric ECL2 .............................................. 30
Table 11 Primers used for amplification of recombinant proteins ...................................... 30
Table 12 Eukaryotic cells and bacteria ................................................................................ 31
Table 13 Fluorescent size markers for permeation experiments ......................................... 31
Table 14 Other colored markers .......................................................................................... 32
Table 15 Software ................................................................................................................ 32
Table 16 Peptide sequences ................................................................................................. 33
Table 17 Culturing conditions of eukaryotic cells ............................................................... 34
Table 18 Ingredients of cell lysis buffers ............................................................................. 44
Table 19 SDS-PAGE ........................................................................................................... 44
Table 20 Buffer and solutions for protein purification ........................................................ 46
Table 21 qRT-PCR protocol ................................................................................................ 49
Table 22 PCR protocol ........................................................................................................ 50
Table 23 Protocol of DNA restriction .................................................................................. 50
Table 24 Protocol of Ligation .............................................................................................. 51
Table 25 Gradient PCR protocol ......................................................................................... 52
Table 26 Messenger RNA (mRNA) expression of untreated mouse brain and kidney ....... 86

LIST OF SUPPLEMENTARY MATERIAL
xvi
LIST OF SUPPLEMENTARY MATERIAL
Table S1 Messenger RNA (mRNA) expression of tricellulin (Tric) in different wild type
(WT) mouse organs ........................................................................................................... 132
Table S2 Messenger RNA (mRNA) expression of designated proteins in human colon
carcinoma epithelial cells after peptide-free medium, 150 µM scrambled trictide and 150
µM trictide ......................................................................................................................... 132
Table S3 Messenger RNA (mRNA) expression of designated proteins in mouse brain
endothelial cells after peptide-free medium, 100 µM scrambled trictide, 75 µM and 100
µM trictide administration ................................................................................................. 133
Table S4 Messenger RNA (mRNA) expression of designated proteins in wild type (WT)
mouse brain and kidney upon phosphate-buffered saline (PBS) and 4 h and 24 h after 800
µM of trictide (3.6 µmol/kg) administrations. ................................................................... 133
Fig. S5 Trictide down-regulates mRNA expression of claudin-5, LSR, occludin and up-
regulates Cldn25 and ZO-1 in mouse brain endothelial cells. ........................................... 135

LIST OF ABBREVIATIONS
xvii
LIST OF ABBREVIATIONS
Actb β-actin
ANOVA Analysis of variance
APS Ammonium persulfate
BBB Blood-brain barrier
bEND.3 Mouse brain endothelial cell line
BRB Blood-retina barrier
BSA Bovine serum albumin
bTJ Bicellular tight junction
Caco-2 Human epithelial colorectal adenocarcinoma cells
CC Coiled coil
CD Circular dichroism
CFP Cyan fluorescent protein
Cldn Claudin
CNS Central nervous system
Ct Cycle threshold
DAPI 4′,6-diamidino-2-phenylindole
DMEM Dulbecco's Modified Eagle's Medium
DMSO Dimethyl sulfoxide
dNTP Deoxyribonucleotide triphosphate
DPBS Dulbecco's phosphate buffered saline
ECIS Electric cell-substrate impedance sensing
ECL Extracellular loop
EDTA Ethylenediaminetetraacetic acid
FCS Fetal calf serum
FD FITC dextran
FITC Fluorescein isothiocyanate
FRET Fluorescence resonance energy transfer
fw Forward primer
GAPDH Glyceraldehyde 3-phosphate dehydrogenase
GFP Green fluorescent protein
gSTED Gated stimulated emission depletion super-resolution
microscopy
h Human
h Hour
HBSS Hank's balanced salt solution
HEK Human embryonic kidney cells
His Histidine
HT 29/B6 Human colon epithelial adenocarcinoma cell line
ip Intraperitoneal
iv Intravenous
kDa Kilodalton
LSM Laser scanning microscopy
LSR Lipolysis stimulated lipoprotein receptor
LY Lucifer yellow
m Mouse
MAGUK Membrane-associated guanylate kinase

LIST OF ABBREVIATIONS
MBP Maltose binding protein
MBP Maltose binding protein
MD3 MarvelD3
MDCK-II Madin-Darby canine kidney cells
MEKK Mitogen-activated protein kinase kinase
min Minute
MTT Methylthiazolyldiphenyl-tetrazoliumbromide
Na-fluorescein Fluorescein sodium salt
ns Non-significant
Occl Occludin
PAGE Polyacrylamide gel electrophoresis
PB Phosphate buffer
PEG Polyethylene glycol
PEI Polyethylenimine
PFA Paraformaldehyde
PLL Poly(L-lysine)
qRT-PCR Quantitative real time polymerase chain reaction
rev Reverse primer
RTC Rat tail collagen
SDS Sodium dodecyl sulfate
SEM Standard error of the mean
shRNA Short hairpin ribonucleic acid
siRNA Small interfering ribonucleic acid
TAMP Tight junction associated MARVEL domain contain-
ing proteins
TAMRA 5-Carboxytetramethylrhodamine
TEMED Tetramethylethylenediamine
TER Transcellular electrical resistance
TFE Tetrafluoroethylene
TJ Tight junction
TM Transmembrane
Tric Tricellulin
Tric C-term Recombinant C-terminus of Tric protein
Tris-HCI Tris hydrochloride
TRQ Turquoise fluorescent protein
tTJ Tricellular tight junction
WT wild-type
YFP Yellow fluorescent protein
ZO-1 zonula occludens protein 1
λab Wavelength of the absorption
λem Wavelength of the emission
λex Wavelength of the excitation

INTRODUCTION
1
1. INTRODUCTION
It is essential to have separate compartments with different molecular compositions for the
development and maintenance of multicellular organisms. These compartments are defined
by various cellular sheets which function as barriers that maintain the distinct internal
environments of each compartment within the organs. For instance, renal tubules and blood
vessels are lined with epithelial and endothelial cellular sheets, respectively (Tsukita et al.,
2001). Tissue-specific intercellular junctions where individual cells are linked to each other
are a critical part of tissue barriers for maintaining the structural integrity. The intercellular
space between adjacent cells is sealed to prevent diffusion of solutes through the
intercellular space within these sheets. Tissue barriers constitute a line of defense against
microorganisms, toxins, and allergens (Chaplin, 2010). The junctional complex of simple
epithelial cells is located at the most-apical part of the lateral plasma membrane and
consists of three components: tight junctions, adherens junctions, and desmosomes in
vertebrates (Farquhar and Palade, 1963). Various human diseases are related to epithelial
or endothelial barrier dysfunctions caused by dismodulation of barrier properties like
stroke (Luissint et al., 2012; Marchiando et al., 2010) and brain tumors (Tiwary et al.,
2018). This causes loss of stromal homeostasis and alters fluid-electrolyte balance between
compartments. Disrupted barriers also permit bacterial invasions and allow metastatic cells
to break in and out of blood vessels (Mullin et al., 2005).
1.1. ORGANIZATION AND FUNCTION OF EPITHELIUM AND
ENDOTHELIUM
Epithelial tissues cover the inner and outer surfaces of the body and act as cellular
boundaries. Epithelium is one of the four basic tissue types covering muscle, nerve and
connective tissues. Epithelial cells has role in barrier formation, transcellular transport,
secretion and selective absorption between the compartments. Epithelia provide protection
against mechanical damage, entry of microorganisms, and dehydration. Epithelia have no
blood vessels, so it is dependent on the underlying connective tissue for nutrition by
diffusion of substances via the basement membrane. Epithelial cells are polarized, apically

INTRODUCTION
2
exposed to the lumen and basolaterally they are in contact with laterally adjacent epithelial
cells and the basement membrane (Fig. 1.1A). The cells of the epithelium are usually in
close proximity to each other and are rich in cell-cell contacts (Denker and Nigam, 1998;
Rodriguez-Boulan and Macara, 2014).
Fig. 1.1 The junctional complex in epithelial cells and endothelial cells. (A) Tight junction (purple) is
positioned at the apical part of epithelial cells. Adherens junctions (green) is located below the tight
junctions. The orange-belt in the middle is a part of the intracellular actin cytoskeleton that constitute
polarized epithelium. (B) In endothelium both tight junctions (purple) and adherens junctions (green) are
present but intermingled through the junctions. (Modified from Zihni et al., 2016)
Single layered endothelial cells cover blood and lymphatic capillaries and also cover the
myocardium. Endothelial cells adhere to one another through junctional structures formed
by transmembrane adhesive proteins that are responsible for homophilic cell-to-cell
adhesion (Fig 1.1B). In turn, the transmembrane proteins are linked to specific intracellular
partners that mediate anchorage to the actin cytoskeleton and, as a consequence, stabilize
junctions. Endothelial junctions control permeability to plasma solute, leukocyte
extravasation, and infiltration into inflamed areas. Junctional proteins can also transfer
intracellular signals, which modulate endothelial cell growth and apoptosis (Bazzoni,
2004).
Endothelial and epithelial cell junctions share common components. Both cell types have
two major types of junctions that are responsible for cell-to-cell adhesion: adherens
junctions (AJ) and tight junctions (TJ) (Fig. 1.1). Additionally, epithelial cells form
desmosomes (which are absent in the endothelium) and gap junctions that facilitate cell-to-
cell communication (Fig 1.2). Gap junctions are formed by connexions that are expressed
in the endothelium and function as channels for the intercellular passage of ions and small-
molecular-weight molecules (Bazzoni, 2004; Zihni et al., 2016) .

INTRODUCTION
3
Fig. 1.2 The localization of tight junctions relative to other junctional components of epithelial cells.
Schematic illustration of intestinal epithelial cells. The junctional complex containing TJs is circled. TJs are
located at the most apical position of lateral membrane. (B) Electron micrograph of the junctional complex in
mouse intestinal epithelial cells. The tight junction is circled. (Mv, microvilli; TJ, tight junction; AJ, adherens
junction; DS, desmosome.) Scale bar, 200 nm. (Modified from Tsukita et al., 2001)
In epithelial cells, junctions are better organized, with TJ and AJ following a well-defined
spatial distribution along the intercellular cleft. TJ (or zonula occludens) are concentrated
at the apical side of the rim, while AJ (or zonula adherens) are located below the TJ. In
contrast, the junctional architecture in endothelial cells is less defined and AJ are
intermingled with TJ along the cleft (Fig 1.1) (Bazzoni, 2004; Tsukita et al., 2001; Zihni et
al., 2016).
1.2. TIGHT JUNCTIONS
The tight junctions (TJ) were discovered by freeze-fracture electron microscopy, decades
before its molecular identification (Staehelin et al., 1969; Staehelin, 1973; Stevenson et al.,
1986). TJ strands were observed as a set of continuous or discontinues lines surrounding
the apical part of adjacent epithelial cells. The TJ strands can be seen on both sides of the
fracture plane. On the P-face, the protoplasmic side of the fracture, the TJ strands are
clearly visible. On the E-face, the exoplasmic side, empty grooves complementary to those
strands are detectable (Fig. 1.3A) (Shoichiro Tsukita et al., 2001). TJs appear as a series of
“kissing points” on ultrathin section electron micrographs (Fig. 1.3B) between the outer

INTRODUCTION
4
leaflets of the plasma membranes of neighboring cells (Fig. 1.3C). In simple epithelium,
AJs and desmosomes mechanically connect adjoining cells, whereas TJs are responsible
for intercellular sealing. The intercellular space between opposing membranes in AJs and
desmosomes is 15–20 nm apart while this space is completely removed at the “kissing
points” (Gumbiner, 1993; Schneeberger and Lynch, 2004).
Fig. 1.3. The structure of tight junctions. (A) An image of intestinal epithelial cell taken by freeze-fracture
replica electron microscopy. Tight junctions can be observed as continuous, intramembranous strands
o(arrowheads) on the P-face with complementary empty grooves on the E-face (arrows). (Mv, microvilli; Ap,
apical membrane; Bl, basolateral membrane.) Scale bar, 200 nm. (B) The kissing points: tight junctions
(arrowheads) seal intercellular space between two cells. (C) Three dimensional structural scheme of tight
junctions. Tight junction strands from membrane of two opposing cells interact to form the kissing points that
tighten intercellular space. (Modified from Tsukita et al., 2001)
There are two permeation pathways through cell barriers: the transcellular pathway passes
through the cell, crossing the apical and basolateral cell membranes, while the paracellular
pathway passes between the cells through the TJ. TJs function as a barrier for paracellular
diffusion of water, ions, metabolites and macromolecules. They also function as a fence,
separating apical from basolateral parts of the cell membrane. However, TJs are not simply
impermeable barriers. They show ion as well as size selectivity, and differ in tightness
depending on the cell type. Generally, the proximal segments in epithelia-forming tubules
such as intestine, nephron and sweat gland are more permeable; in comparison with TJs at
distal segments, which are categorized as slightly permeable. The tightest TJs are found in
skin and urinary bladder. Thus the sealing or permeability function of the TJ is strongly
determined by its molecular composition (Fromter and Diamond, 1972). TJ meshwork of
strands is formed by transmembrane proteins that play a role in the paracellular barriers.
TJs are also associated with cytosolic scaffolding proteins that form the platform between
the junctional membrane and cytoskeleton (Guillemot et al.,2008; Zahraoui et al., 2000).

INTRODUCTION
5
Mainly, TJ transmembrane proteins consist of claudins (Cldns) with 27 members in
mammals (Morita, et al., 1999) and TJ-associated MARVEL (MAL and related proteins
for vesicle trafficking and membrane link) proteins (TAMPs) (Blasig et al., 2011; Sánchez-
Pulido et al., 2002). TAMP family proteins are occludin (Occl) (Furuse et al., 1993),
tricellulin (Tric) (Ikenouchi et al., 2005) and marvelD3 (MD3) (Steed et al., 2009).
Cytosolic scaffolding proteins, such as zonula occludens protein (ZO)-1 to -3 belong to the
membrane-associated guanylate kinase (MAGUK) family (Stevenson et al., 1986).
1.2.1. Bicellular and tricellular tight junctions
In endothelial or epithelial cell sheets, TJs are located between two cells (bicellular TJs) or
where three cells (tricellular TJs) meet. These points are called either bicellular or
tricellular contacts. At tricellular contacts, apically localized bicellular TJ (bTJ) strands
meet and turn into basolateral direction to connect three cells. These triple pair structures
firmly attach and extend to form a structure called central sealing tube (Staehelin, 1973)
(Fig. 1.4A). Other bTJ strands connect to this central sealing tube laterally in order to
strengthen the TJ strand network (Wade and Karnovsky, 1974).

INTRODUCTION
6
Fig. 1.4 Structure of tricellular and bicellular tight junctions. (A) A schematic illustration of tricellular
and bicellular tight junctions. The central sealing tube in the middle is formed by tricellular tight junction
proteins; tricellulin and lipolysis-stimulated lipoprotein receptor (LSR) and elongates through basal direction.
(bTJ, bicellular tight junctions; tTJ, tricellular tight junctions). (Modified from Krug et al., 2017). (B) Freeze-
fracture replica electron microscopic image of tricellular tight junctions of neighbouring epithelial cells (from
mouse renal cortical collecting duct). Tricellullar TJ strands turn to extend basolaterally. Claudin-based tight
junctions can be observed at the bicellular area. (Modified from Staehelin et al., 1973)
Staehelin and his colleagues initially proposed the tricellular cell-cell TJ model in 1973.
Today the model is still valid and evolving with additional discoveries. Tric and LSR
(Lipolysis-stimulated lipoprotein receptor or Angulin-1) are the main actors of central
sealing at tricellular contacts (Krug et al., 2009; Masuda et al., 2011). The composition of
TJ proteins varies between bicellular and tricellular junctions. Bicellular TJs regulate
passage of small ions, water and constitute a barrier against other molecules while
macromolecules can pass through tricellular TJs (tTJ). The length of the central sealing
tube is about 1 µm, depending on the type of cell. Its radius is estimated as 5 nm, which
allows transfer of macromolecules up to 10 kDa (Krug et al., 2009; Staehelin, 1973; Wade
and Karnovsky, 1974).

INTRODUCTION
7
1.3. TIGHT JUNCTION PROTEINS
1.3.1. Claudins
Cldn1 and Cldn2 were the earliest discovered members of the Cldn family as integral
membrane proteins at TJs ( Furuse et al., 1998). Cldns are a large family of TJ proteins
with 26 members currently identified in human. Their molecular masses are between 21-34
kDa (Günzel and Yu, 2013; Mineta et al., 2011). Cldns belong to the tetraspan proteins,
thus possessing four transmembrane domains: an intracellular short N-terminal, an
intracellular longer C-terminal region, a small intracellular loop and two extracellular two
loops (ECL), of which the first loop is larger than the second. The first crystal structures of
Cldns provided more insight about spatial organization and ion homeostasis across TJs
(Suzuki et al., 2014). Cldn family includes a signature sequence (GLW) within ECL1 and
COOH-terminal PDZ-binding motif, through which most of the Cldns interact with tight-
junction associated scaffolding or adaptor proteins (Günzel and Yu, 2013).
According to phylogenetic analysis, Cldns with higher sequence similarity were grouped as
classical Cldns: 1-10, 14, 15, 17 and 19. Cldn 11, 16, 18, 21, 25 were accepted as non-
classic Cldn. (Krause et al., 2008; Mineta et al., 2011, Günzel and Fromm, 2012). Cldns
are also classified based on their physiological role in paracellular transport, complete
sealing (Cldn1, 3-6, 8, 9, 11, 14, 18, 19) and formation of channels that are permeable for
anions (Cldn10a and 17), cations (Cldn2, 10b and 15) or water (Cldn2) (Günzel and
Fromm, 2012). There is still not much information about the exact function of the rest of
the Cldn family (12, 13, 20, 22-27).
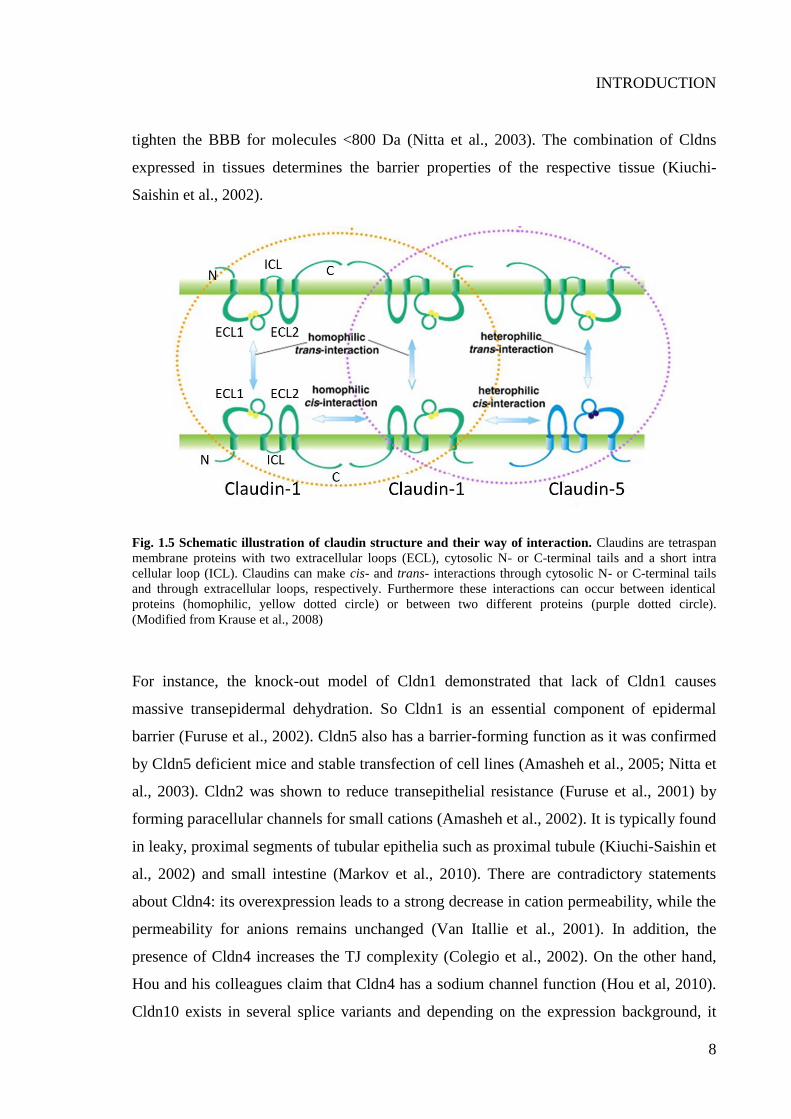
Homophilic and heterophilic interactions can take place between Cldns (Furuse et al.,
1999). If the interaction occurs between two Cldns within the plasma membrane of the
same cell, a cis-interaction prompts Cldn oligomerization (Piontek et al., 2008). The
interaction via the paracellular space between two cells is called trans-interaction (Fig.
1.5). Residues in the ECL1 are involved in the formation of paracellular ion pores and the
determination of their charge selectivity (Alexandre et al., 2007). ECL2 of Cldn5
contributes to trans-interaction between Cldn oligomers from two opposing plasma
membranes and generates polymerization of TJ strands within the paracellular space
(Piontek et al., 2008). This formation explains the specific role of Cldn5, which is to
INTRODUCTION
8
tighten the BBB for molecules <800 Da (Nitta et al., 2003). The combination of Cldns
expressed in tissues determines the barrier properties of the respective tissue (Kiuchi-
Saishin et al., 2002).
Fig. 1.5 Schematic illustration of claudin structure and their way of interaction. Claudins are tetraspan
membrane proteins with two extracellular loops (ECL), cytosolic N- or C-terminal tails and a short intra
cellular loop (ICL). Claudins can make cis- and trans- interactions through cytosolic N- or C-terminal tails
and through extracellular loops, respectively. Furthermore these interactions can occur between identical
proteins (homophilic, yellow dotted circle) or between two different proteins (purple dotted circle).
(Modified from Krause et al., 2008)
For instance, the knock-out model of Cldn1 demonstrated that lack of Cldn1 causes
massive transepidermal dehydration. So Cldn1 is an essential component of epidermal
barrier (Furuse et al., 2002). Cldn5 also has a barrier-forming function as it was confirmed
by Cldn5 deficient mice and stable transfection of cell lines (Amasheh et al., 2005; Nitta et
al., 2003). Cldn2 was shown to reduce transepithelial resistance (Furuse et al., 2001) by
forming paracellular channels for small cations (Amasheh et al., 2002). It is typically found
in leaky, proximal segments of tubular epithelia such as proximal tubule (Kiuchi-Saishin et
al., 2002) and small intestine (Markov et al., 2010). There are contradictory statements
about Cldn4: its overexpression leads to a strong decrease in cation permeability, while the
permeability for anions remains unchanged (Van Itallie et al., 2001). In addition, the
presence of Cldn4 increases the TJ complexity (Colegio et al., 2002). On the other hand,
Hou and his colleagues claim that Cldn4 has a sodium channel function (Hou et al, 2010).
Cldn10 exists in several splice variants and depending on the expression background, it

INTRODUCTION
9
functions as pore-forming Cldn with anion-selective (Cldn10a) (Van Itallie et al., 2006) or
cation-selective (Cldn10b) (Günzel et al., 2009) properties (Olinger et al., 2018). Claudin
domain containing (CLDND) 1 (Cldn25) is a non-classical Cldn (Mineta et al., 2011). It
was recently found that Cldn25 mRNA levels decreased transiently 24 h after cerebellar
hemorrhage. Moreover, Cldn25 knockdown increased the permeability of human bronchial
epithelial cells (HBECs) by small molecules (Ohnishi et al., 2017).This large functional
spectrum of Cldns is also reflected in specific expression patterns in the various endothelia
and epithelia.
1.3.2. Tight junction associated MARVEL proteins
The TAMP family shares a conserved tetra-spanning MARVEL domain, which is mostly
responsible for membrane apposition and is concentrated in cholesterol-rich microdomains
(Sánchez-Pulido et al., 2002). Members of the TAMP family are Occl (Furuse et al.,
1993), Tric (Ikenouchi et al., 2005) and MD3 (Steed et al., 2009) (Fig. 1.6A). The structure
of the TAMP family consists of four transmembrane domains, cytosolic N- and C-
terminus, an intracellular and two extracellular loops similar to Cldns (Raleigh et al.,
2010).
TAMPs have heterophilic (Occl-MD3, Tric-MD3) and homophilic (Occl, Tric, MD3) cis
interactions and homophilic trans interactions (Occl) (Cording et al., 2013; Raleigh et al.,
2010). TAMPs form TJ strands in the presence of another tight junction protein like a
Cldn. For instance, Cldn1 and Cldn5 improved enrichment of Occl and Tric at cell–cell
contacts. The membrane mobility of Occl and Tric was reduced when they were co-
expressed with Cldn1 (Cording et al., 2013). TAMP knockdowns cause greater reductions
in transepithelial electrical resistance (TER) compared to when TAMPs are knocked down
as combinations. This suggests that TAMPs make both overlapping and unique
contributions to TJ assembly and barrier function (Raleigh et al., 2010).
INTRODUCTION
10
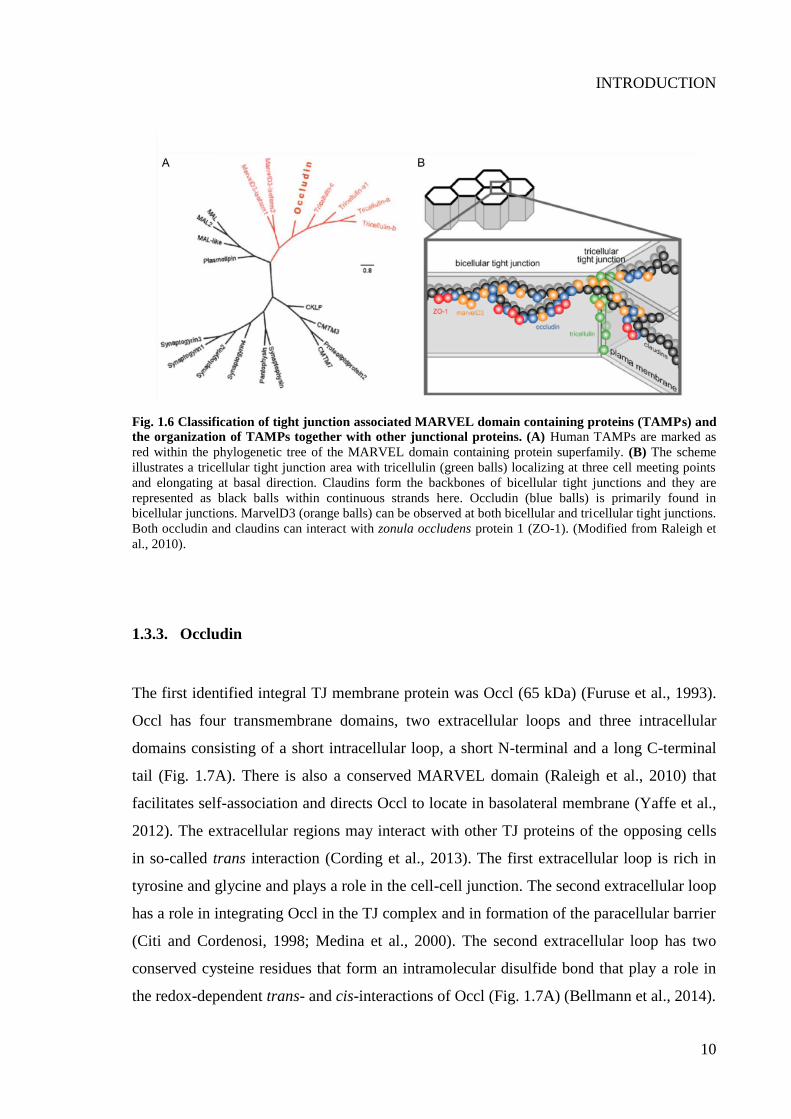
Fig. 1.6 Classification of tight junction associated MARVEL domain containing proteins (TAMPs) and
the organization of TAMPs together with other junctional proteins. (A) Human TAMPs are marked as
red within the phylogenetic tree of the MARVEL domain containing protein superfamily. (B) The scheme
illustrates a tricellular tight junction area with tricellulin (green balls) localizing at three cell meeting points
and elongating at basal direction. Claudins form the backbones of bicellular tight junctions and they are
represented as black balls within continuous strands here. Occludin (blue balls) is primarily found in
bicellular junctions. MarvelD3 (orange balls) can be observed at both bicellular and tricellular tight junctions.
Both occludin and claudins can interact with zonula occludens protein 1 (ZO-1). (Modified from Raleigh et
al., 2010).
1.3.3. Occludin
The first identified integral TJ membrane protein was Occl (65 kDa) (Furuse et al., 1993).
Occl has four transmembrane domains, two extracellular loops and three intracellular
domains consisting of a short intracellular loop, a short N-terminal and a long C-terminal
tail (Fig. 1.7A). There is also a conserved MARVEL domain (Raleigh et al., 2010) that
facilitates self-association and directs Occl to locate in basolateral membrane (Yaffe et al.,
2012). The extracellular regions may interact with other TJ proteins of the opposing cells
in so-called trans interaction (Cording et al., 2013). The first extracellular loop is rich in
tyrosine and glycine and plays a role in the cell-cell junction. The second extracellular loop
has a role in integrating Occl in the TJ complex and in formation of the paracellular barrier
(Citi and Cordenosi, 1998; Medina et al., 2000). The second extracellular loop has two
conserved cysteine residues that form an intramolecular disulfide bond that play a role in
the redox-dependent trans- and cis-interactions of Occl (Fig. 1.7A) (Bellmann et al., 2014).

INTRODUCTION
11
The C-terminus has an ELL domain consisting of an antiparallel coiled-coiled hairpin
structure (also called coiled-coil-domain). This conserved domain is originally found in the
RNA polymerase II elongation factor ELL. This domain may interact with other proteins
belonging to the MAGUK family (Li et al., 2005). This includes the proteins ZO-1, ZO-2
and ZO-3 (Tsukita and Furuse, 1998), as well as F-actin of the cytoskeleton (Wittchen et
al., 1999). The C-terminal tail of Occl and TRIC-a demonstrate considerable homology
(Ikenouchi et al., 2005).
To what extent Occl is essential for the TJ, is controversial. On the one hand, knockout
mice show no impairment of barrier function. On the other hand an essential barrier
function of Occl is demonstrated within the TJ strands (Schulzke et al., 2005). Moreover
postnatal growth retardations, like histological abnormalities in several tissues and male
sterility, are found in knockout mice (Saitou et al., 2000). In order to explain this weak
phenotype, a compensatory mechanism is proposed to maintain barrier integrity. For
instance, knockdown of Occl altered the localization of Tric from tTJs to bTJs. The
presence of Occl should exclude Tric from bTJs and support Tric’s tricellular localization
(Ikenouchi et al., 2008). This interplay between Occl and Tric supports the argument that
members of TAMP family have distinct but also overlapping functions enabling them to
compensate for each other (Raleigh et al., 2010). Last of all, Occl is accepted as a general
TJ marker because it is expressed in every epithelial and endothelial barrier (Blasig et al.,
2011).
1.3.4. MarvelD3
MD3 was discovered as the third member of TAMP family (Steed et al., 2009). The human
MD3 has two isoforms: MD3 isoform-1 contains 401 amino acids (44.9 kDa); isoform-2
comprises 410 amino acids (45.9 kDa). Two isoforms differ in the sequence of the
MARVEL domain and size of cytosolic C-terminal tail but are identical in N-terminal tail.
The C-terminal tail of MD3 does not have coiled coil domain unlike Occ and Tric. Since
the C-terminal tail is the binding site of Occl and Tric to ZO-1, it is assumed that MD3
does not interact with ZO-1 (Raleigh et al., 2010; Steed et al., 2009). It is expressed in
epithelial-rich tissues like colon, colonic epithelium, kidney (isoform-2) and liver (isoform-

INTRODUCTION
12
1) differentially (Raleigh et al., 2010). It localizes mostly at bicellular apical regions of
cells co-localizing with Occl and ZO-1 (Raleigh et al., 2010; Steed et al., 2009).
Depletion of MD3 does not have any effect on formation of functional paracellular barrier.
It does not cause mislocalization of other TJ proteins like Occl. Interestingly, TER is
increased after depletion of MD3 (Steed et al., 2009). It was demonstrated that MD3 is
transported to TJs immediately after synthesis and in accordance with TER development
(Raleigh et al., 2010). Taken together, MD3 is not essential for junctional association but
still a determinant of paracellular permeability.
In 2014, it was reported that MD3 is a dynamic junctional regulator of the MEKK1–c-Jun
NH2-terminal kinase (JNK) pathway (Steed et al., 2014). This pathway is responsible for
cell proliferation and migration. Expression levels of MD3 oppositely linked with JNK
activity, because MD3 recruits MEKK1 to junctions, causing for down-regulation of JNK
phosphorylation and inhibition of JNK-regulated transcriptional mechanisms. This
interplay between MD3 internalization and JNK activation is important for cell survival
and prevention of tumor formation (Steed et al., 2014).
1.3.5. Tricellulin
Tric (MarvelD2) is the first TJ protein discovered as a component of tTJs (Ikenouchi et al.,
2005). The genes encoding for both human Occl and Tric are located in human
chromosome 5. To date, four human isoforms of Tric have been described: TRIC-a is the
longest form with 558 amino acids (64 kDa) and is the most common point of reference
when Tric is mentioned. TRIC-a has four transmembrane regions: two extracellular loops
and three intracellular regions consisting of a short loop, a short N-terminal and a long C-
terminal region (Fig, 1.7A). It is composed of seven exons and has a C-terminal CC-
domain that is 32% identical to that of Occl (in total 51% similar) (Fig. 1.7B) (Riazuddin et
al., 2006). Tric N-terminal domain is suggested to be involved in guiding Tric to tricellular
contacts while the C-terminus is responsible from the basolateral translocation of Tric
(Westphal et al., 2010). The first extracellular loop is similar to Occl, rich in glycine and
tyrosine (49.5%), so it can be assumed that it is also necessary for the formation of cell-cell

INTRODUCTION
13
contacts. Mutations within TRIC-a lead to non-syndromic deafness (DFNB49) (Riazuddin
et al., 2006).
The isoform Tric-a1 (62 kDa TRIC-a1) is very similar to TRIC-a but lacks the third of the
seven exons. Tric-b (TRIC-b) is a shorter isoform (458 amino acids, 51 kDa) that is highly
different in the C-terminus of TRIC-a (Fig. 1.7B). The crystal structure of C-terminal
coiled-coil part has been recently reported as a potential component in dimeric
arrangement (Schuetz et al., 2017).
Fig. 1.7 Scheme of predicted structure of tricellulin and occludin and isoforms of human tricellulin. (A)
Both tricellulin and occludin are tetraspan membrane proteins with two extracellular loops, cytosolic N- and
C-terminal tail and a short intracellular loop. Tricellulin has a longer N-terminal tail while occludin has
longer extracellular loop. Their C-terminal tail is 32% identical to each other (Ikenouchi et al., 2005). (B)
The isoforms of human Tric. The numbers indicate the order of exons. The black bars of exon two mark the
predicted transmembrane domains, the red line marks the occludin coiled-coil domain, grey areas symbolize
untranslated segments (Riazuddin et al., 2006).
It was well known that bTJ proteins like Cldns (Furuse et al., 2002; Nitta et al., 2003) or
Occl (Schulzke et al., 2005) are tightening the cell barriers. However tricellular contacts
were considered as weak points within the barrier. With the discovery of Tric, it is now

INTRODUCTION
14
understood that Tric is the tightening component of epithelial cell barrier at tricellular
junctions (Ikenouchi et al., 2005). When Tric is expressed in an endogenously low Tric
expressing cell line, paracellular electrical resistance is increased and permeability to ions
and larger solutes is decreased (Krug et al., 2009). Tric knockdown experiments exhibited
that, in the absence of Tric, epithelial barrier tightness is not maintained in parallel with
cell confluency and the continuity of TJ network is considerably disturbed (Ikenouchi et
al., 2005). On the other hand, overexpression of Tric is decreasing permeability for
macromolecules (4-10 kDa) but not affecting the ion permeability (Krug et al., 2009). This
paradox suggested the tTJ central tube as a pathway for macromolecules based on its
calculated radius that can enable this passage (Krug et al., 2009; Staehelin, 1973). After
strong overexpression, tricellulin was detected at both tri- and bicellular contacts equally
(Krug et al., 2009). The systemic deletion of Tric in mice (Tric-/-
) causes progressive
hearing loss linked to the degeneration of cochlear hair cells (Kamitani et al., 2015).
It has already been stated that Tric has strong interactions with other TAMP members and
Cldns in addition to its compensatory functions. It was observed that under reducing
conditions, Occl weakens at bTJ and Tric shows co-localization with ZO-1 and partly with
Occl Two important information proceed. First Tric should compensate for Occl’s function
even though Occl and Tric do not interact directly (Cording et al., 2013; Raleigh et al.,
2010). Second, Tric trimerization at tricellular contacts should be disrupted so that it can be
shifted to bTJs (Cording et al., 2015). The Cys residues in ECL2 of Tric are important for
trans-interactions and paracellular sealing because trans-association is interrupted in the
absence of those residues as well as under reducing conditions. This relates the ECL2
region of Tric with extracellular binding of three Tric proteins at tTJs. The trimerization
and tightening effect of Tric between three cells is superimposed on tricellular cis-
interaction along one plasma membrane (Cording et al., 2015).
Tric is strongly expressed in epithelial-derived tissues like kidney, small intestine, stomach
and lung (Ikenouchi et al., 2005). It is expressed at medium levels in liver. Tric expression
is lower in organs having less epithelial tissue: spleen, lymph nodes, testis, brain
(Ikenouchi et al., 2005; Raleigh et al., 2010). Tric localization is also reported in brain
endothelial regions (cerebrum, cerebellum, retina, choroid plexus) and brain microvessels
(Iwamoto et al., 2014; Mariano et al., 2013). Likewise it has been stated that Tric

INTRODUCTION
15
expression in peripheral nervous system (sciatic nerve) is more abundant then in the central
nervous system (Kikuchi et al., 2010).
There is limited information about the regulatory mechanism over TJ formation and
maintenance. Tric might be phosphorylated (Ikenouchi et al., 2005). Even though c-Jun N-
terminal kinase is associated with Tric phosphorylation, it has not been clearly identified
(Kojima et al., 2010). Recently a mechanism pointing out the relation between Tric down-
regulation and ulcerative colitis (UC) was reported. It is found that in UC interleukin 13
receptor α2, a proinflammatory cytokine, downregulates Tric and increases luminal uptake
of antigens resulting from barrier defects (Kojima et al., 2010). Moreover, it was also
shown that posttranslational modifications like ubiquitination plays a role in down-
regulation of Tric at protein level after forming a complex with Tric (Jennek et al., 2017).
1.4. TIGHT JUNCTION SCAFFOLDING PROTEINS
The membrane-associated guanylate kinase (MAGUK) family proteins of TJs include the
ZO proteins that have three N-terminal PDZ domains, one Src homology 3 (SH3) domain
and a guanylate kinase (GUK) domain (Itoh et al., 1999). PDZ domain is a protein
interaction module that plays role in attaching receptor proteins in the membrane to
cytoskeletal components and regulates signal transduction complexes (Lee and Zheng,
2010). ZO-1 (Stevenson et al., 1986), ZO-2 (Gumbiner et al., 1991) and ZO-3 (Balda et al.,
1993) are members of ZO proteins. The ZO proteins are scaffold proteins, which on the
one hand bind directly to transmembrane proteins of the TJs and on the other hand are
connected with signalling and structural proteins for the regulation of TJ structure and
function (Fanning and Anderson, 2013). ZO-1 is the first junctional protein identified at
TJs (Stevenson et al., 1986) and ZO-1 deficient mice are embryonic lethal (Katsuno et al.,
2008). ZO-1 comprises N-terminal protein binding domain (PDZ1) for the main
transmembrane barrier proteins Cldns (Furuse et al., 1998), Occl (Fanning et al., 1998;
Furuse et al., 1994) and Tric through its conserved C-terminal CC-domain (Ikenouchi et
al., 2005; Riazuddin et al., 2006) and links TJ proteins directly to the actin cytoskeleton.
Knockdown of ZO-1 in epithelial cells caused delay in barrier formation (McNeil et al.,
2006; Umeda et al., 2004). Moreover it has been reported that Tric does not localize at tTJ

INTRODUCTION
16
in ZO-1 and-2 double negative cells (Ikenouchi et al., 2007). However once TJs are formed
in the ZO-1 lacking cells, TER and passage of large molecules were stated at normal levels
(Umeda et al., 2004). ZO proteins play an important role at the formation and function of
adherens junctions (Ikenouchi et al., 2007) and gap junctions (Giepmans and Moolenaar,
1998) in addition to TJs. ZO-1 is accepted as general marker for cell junctions.
1.5. THE ANGULIN-PROTEIN FAMILY
The angulin-proteins are single-pass transmembrane proteins, which localize at tTJs. The
family consists of LSR (angulin-1), immunoglobulin (Ig)-like domain-containing receptor
(ILDR)1 (angulin-2) and ILDR2 (angulin-3) proteins (Higashi et al., 2013; Masuda et al.,
2011). They are expressed in several epithelial tissues at different degrees (Higashi et al.,
2013). At least one splice isoform of angulin proteins localize at tTJs and scarcely at bTJs
(Higashi et al., 2013; Reaves et al., 2017). Immunoreplica of electron microscopy have
revealed LSR at the central sealing elements of tTJs. LSR is an important protein for
barrier function because knockdown of LSR in epithelial cells causes decrease in TER and
increase in macromolecular passage (Masuda et al., 2011). The expression of angulin-2
protein reverses the effect of LSR knockdown cells on TER and permeability of
macromolecules (Higashi et al., 2013). Moreover, knockout of angulin-2 protein causes
deafness with progressive cochlear hair cells degeneration (Higashi et al., 2015).
LSR knockdown cells also exhibited bicellular membrane localization of Tric instead of
tTJs. Contrarily LSR keeps its tricellular position at Tric knockdown cells (Masuda et al.,
2011). When angulin binding deficient mice is generated, it was observed that Tric is not
present at tTJs while angulin-2 can still localize at tTJs (Nayak et al., 2013). This suggests
that angulins are the foundation of tTJs at tricellular contacts and recruit Tric to tTJs. The
interaction between conserved cytoplasmic C-terminal tails of Tric and angulins is
necessary for recruitment of Tric to tTJs (Higashi et al., 2013; Masuda et al., 2011).
It is reported that LSR is a BBB enriched protein, expressed in parallel with BBB
development and specifically expressed at tTJs of CNS blood vessels. Thus, LSR knockout
mice cannot complete sealing of BBB and dies on embryonic day 15.5. Similarly,

INTRODUCTION
17
neurological disorder models that lack functional BBB showed down-regulation of LSR.
However LSR knockout mice have no impact on ultrastructure of TJ and the knockout also
does not affect expression and localization of other junctional proteins like Occl, Cldn5
and ZO-1 (Sohet et al., 2015).
Recently, a cancer protective role of LSR has been suggested. Hence LSR deficient
epithelial cancer cells show increased cell proliferation in vitro and larger cysts in 3D
cultures (Czulkies et al., 2016). Furthermore, knockdown of LSR causes increased cell
migration, proliferation and invasion in endometrial cancer cell lines (Shimada et al.,
2016).
1.6. TRICELLULAR TIGHT JUNCTIONS IN BLOOD-BRAIN BARRIER
The blood-brain barrier (BBB) is formed by endothelial cells lining brain microvessels. It
constitutes a barrier between circulating blood and central nervous system (brain and spinal
cord) (Fig. 1.8). The permeability through BBB is strictly controlled by several
mechanisms that include BBB specific proteins (transporters) responsible from
transcellular pathway and TJ proteins limiting the passage between adjacent endothelial
cells (Abbott, 2013; Greene and Campbell, 2016). This way BBB maintains the ionic
composition of the interstitial fluid bathing the neurons and also shields the gentle neuronal
tissue from blood borne agents like pathogens and immune cells. Through BBB, there is
low rate of vesicular transport and channels that provide rapid exchange of molecules are
not present (Greene and Campbell, 2016).
Fig. 1.8 Schematic illustration of brain microvascular endothelial cells and position of tricellular tight
junctions (tTJ). Single layered endothelial cells cover the blood capillaries and form a barrier between blood
circulation and brain. Since endothelial cells are more flat compared to epithelial cells, the structure of the
tTJs are also different. That is why, an exemplary tTJ of a brain capillary is illustrated above. EC, Blood
capillary formed by single endothelial cells (provided from I. E. Blasig).

INTRODUCTION
18
Cldn5 is the dominant tight-junction protein of the BBB because it is highly expressed in
capillary endothelial cells and seals the paracellular spaces (Nitta et al., 2003; Ohtsuki et
al., 2007). For the first time, Tric is found to be expressed in tTJs but also in bTJs of brain
microvascular endothelial cells (Mariano et al., 2013). Furthermore, both Tric and LSR
were specifically concentrated at TJs of brain and retina endothelial cells that contribute to
formation of BBB and brain-retinal barrier (BRB) (Iwamoto et al., 2014). Importance of
LSR - a tricellular tight junction protein - for sealing of BBB during embryonic
development has already been described in previous chapter (Sohet et al., 2015). Even
though tTJ in endothelial cells is not well-characterized yet, recent studies emphasize
presence of tTJs in brain endothelial cells and evidenced their role in the BBB formation
and tightness.
1.7. THE IMPORTANCE OF TRICELLULAR TIGHT JUNCTIONS IN
PATHOLOGICAL EVENTS
It was already explained that mutation of Tric causes non-syndromic deafness in humans
(Riazuddin et al., 2006). Angulin-family proteins and their functional importance have also
been discovered rather recently (chapter 1.5). LSR (angulin-1) was identified first as a
lipoprotein receptor (Yen et al., 1999) and liver-specific knockdown resulted with
hypertriglyceridemia in mice (Narvekar et al., 2009). In addition, human angulin-3 is
linked with type 2 diabetes (Dokmanovic-Chouinard et al., 2008), which might have
developed due to hypertriglyceridemia.
Numerous bacteria attack tricellular junctions to infect epithelial cells. For instance, S.
flexneri organizes extending pseudopodia at tricellular junctions in a Tric-dependent way
(Fukumatsu et al., 2012). On the other hand, group A Streptococcus bacteria is reported to
target tricellular junctions specifically by interaction with Tric to overcome the epithelial
barrier (Sumitomo et al., 2016). In pancreatic cancer cell lines, Tric is distributed from
membrane to nucleus with decreasing differentiation order. Tric expression in nucleus is
assumed to stimulate cell proliferation and finally related to lymph node metastasis
(Takasawa et al., 2016).

INTRODUCTION
19
1.8. DRUG DELIVERY BY MODULATION OF TIGHT JUNCTIONS
Most drugs cannot pass tissue barriers properly because of their size or hydrophilicity.
Hence, there are two ways of passage through cell sheets for drugs: transcellular and
paracellular routes. Several strategies have been developed to enhance drug passage
through tissue barriers via these routes. First strategy is to introduce prodrugs that are
inactive compounds by changing the transcellular permeability or increasing lipophilicity.
Passage can also be achieved by drugs coupled with specific ligand of transporters
(Brandsch et al., 2008). Those inactive compounds are activated by enzymatic reactions.
Recently liposomes (El Maghraby et al., 2008), filled with nanoparticles (Dai, Jiang, and
Lu, 2018; Kreuter and Gelperina, 2008) are also used for passage via BBB. The
paracellular strategies are mainly based on ultrasound (Burgess and Hynynen, 2014) and
mannitol (Kobrinsky et al., 1999). Other paracellular routes with small molecules are
sodium caprate (Lindmark et al., 1998), peptides (Nusrat et al.,2005) and small interfering
ribonucleic acid (siRNA)(Campbell et al., 2009) as promising ways of transiently
modulating the TJs. Thus, TJ proteins responsible from the paracellular tightening can be
modulated by TJ protein specific peptides.
1.9. TIGHT JUNCTION PEPTIDOMIMETICS
Peptides are derived from parts of TJ proteins specifically to target barriers and enhance
passage of small and large molecules. To date, Occl and Cldn derived peptides are more
common due to the fact that they are the most studied TJ proteins. The most related and
important Occl and Cldn derived peptides and their effects are summarized in Table 1 and
Table 2. Peptides are designed based on target tissue and its Cldn composition. Parts of
target TJ protein that is maintaining the paracellular tightness are explicitly selected. So far
all peptidomimetic methods are focused on opening bTJ areas. But recently tricellular TJ
proteins are discussed as a target molecule to enable passage of macromolecules (Cording
et al., 2017; Krug et al., 2017).
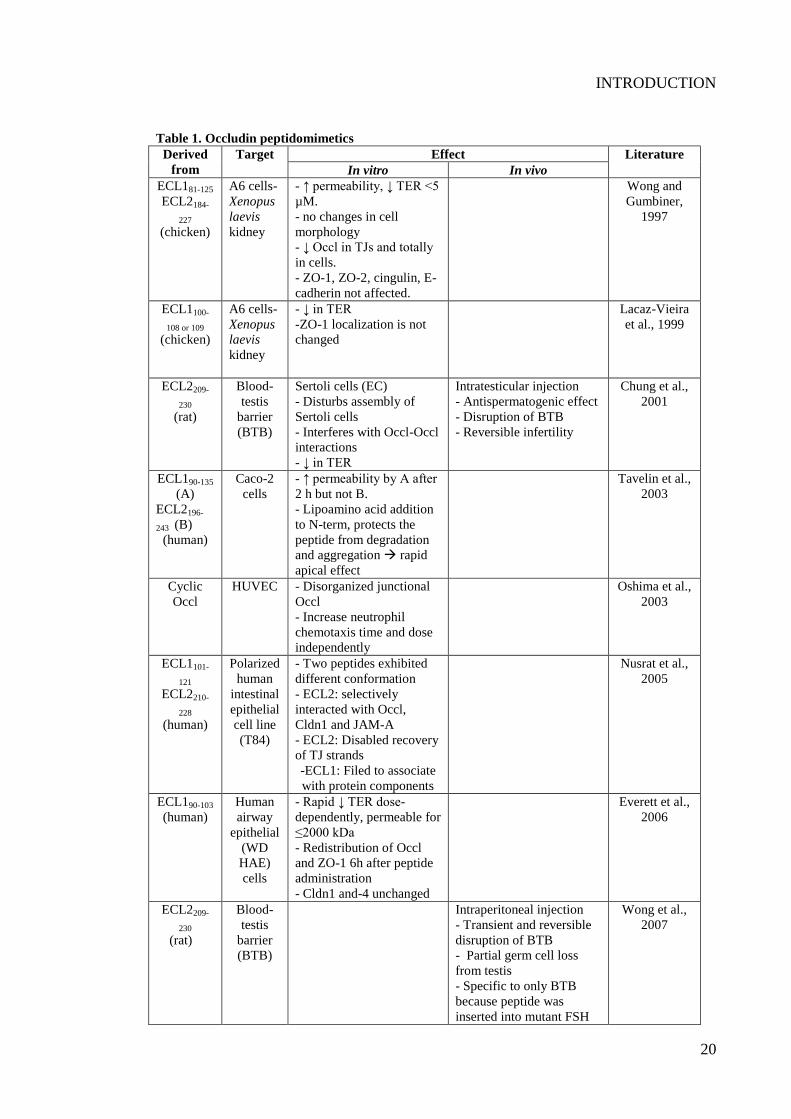
INTRODUCTION
20
Table 1. Occludin peptidomimetics
Derived
from
Target Effect Literature
In vitro In vivo
ECL181-125
ECL2184-
227
(chicken)
A6 cells-
Xenopus
laevis
kidney
- ↑ permeability, ↓ TER <5
µM.
- no changes in cell
morphology
- ↓ Occl in TJs and totally
in cells.
- ZO-1, ZO-2, cingulin, E-
cadherin not affected.
Wong and
Gumbiner,
1997
ECL1100-
108 or 109
(chicken)
A6 cells-
Xenopus
laevis
kidney
- ↓ in TER
-ZO-1 localization is not
changed
Lacaz-Vieira
et al., 1999
ECL2209-
230
(rat)
Blood-
testis
barrier
(BTB)
Sertoli cells (EC)
- Disturbs assembly of
Sertoli cells
- Interferes with Occl-Occl
interactions
- ↓ in TER
Intratesticular injection
- Antispermatogenic effect
- Disruption of BTB
- Reversible infertility
Chung et al.,
2001
ECL190-135
(A)
ECL2196-
243 (B)
(human)
Caco-2
cells
- ↑ permeability by A after
2 h but not B.
- Lipoamino acid addition
to N-term, protects the
peptide from degradation
and aggregation rapid
apical effect
Tavelin et al.,
2003
Cyclic
Occl
HUVEC - Disorganized junctional
Occl
- Increase neutrophil
chemotaxis time and dose
independently
Oshima et al.,
2003
ECL1101-
121
ECL2210-
228
(human)
Polarized
human
intestinal
epithelial
cell line
(T84)
- Two peptides exhibited
different conformation
- ECL2: selectively
interacted with Occl,
Cldn1 and JAM-A
- ECL2: Disabled recovery
of TJ strands
-ECL1: Filed to associate
with protein components
Nusrat et al.,
2005
ECL190-103
(human)
Human
airway
epithelial
(WD
HAE)
cells
- Rapid ↓ TER dose-
dependently, permeable for
≤2000 kDa
- Redistribution of Occl
and ZO-1 6h after peptide
administration
- Cldn1 and-4 unchanged
Everett et al.,
2006
ECL2209-
230
(rat)
Blood-
testis
barrier
(BTB)
Intraperitoneal injection
- Transient and reversible
disruption of BTB
- Partial germ cell loss
from testis
- Specific to only BTB
because peptide was
inserted into mutant FSH
Wong et al.,
2007

INTRODUCTION
21
↓, decrease; ↑, increase; ECL, extracellular loop; TER, transcellular electrical resistance; TJ, tight junctions;
HUVEC, human umbilical vein endothelial cells; Occl, occludin; ZO-1, zonula occludens protein-1; ZO-2,
zonula occludens protein-2; FSH, follicle stimulating hormone; EC, epithelial cells; Caco-2, human colon
carcinoma epithelial; Cldn1, claudin-1; JAM-A, junctional adhesion molecule-A.
Table 2. Claudin peptidomimetics
Derived
from
Target Effect Literature
In vitro In vivo Claudin-1
ECL153-80
Human
intestinal
epithelial
cells
T84
- Reversibly interferes with
TJ structure and function
- Interacted with Cldn1
and Occl
Oral administration
- ↑ permeability across
gastric epithelium, little
effect on small intestinal
epithelium
Mrsny et al.,
2008
Claudin-1
ECL153-81
(rat)
Rat
perineuri
al barrier
- Paracellular opening of
different epithelial barriers
-Redistributes Cldn1 and
Occl
- Peptide internalized by
clathrin pathway
-TJ morphology is altered
in a more parallel way
Perineurial injection in rats
- ↑ permeability ≤66 kDa
- ↓ Cldn1 mRNA, protein
expression
- Opening of blood-nerve
barrier, drug delivery
facilitation
Sauer et al.,
2014; Staat et
al., 2015;
Zwanziger et
al., 2012
Claudin-5
ECL153-81
(murine)
Blood-
brain
barrier
Brain endothelial and
Cldn5 transfected EC)
- ↑ permeability ≤40 kDa
- Cldn5 down-regulated
and redistributed from cell
contacts to cytosol
- Drug delivery enhanced
iv injections in mouse tail
- ↑ Brain uptake of small
molecules
Dithmer et al.,
2017
cCPE Intestinal
epitheliu
m with
Cldn3 or
Cldn4
- ↑ permeability ≤ 66 kDa,
↓ TER, ↓ of Occl, ZO-1
(Caco-2)
Rat jejunum epithelium
- ↑ permeability ≤ 20 kDa
Katahira et
al., 1997;
Kondoh et al.,
2006; Winkler
et al., 2009;
Veshnyakova
et al., 2012
↓, decrease; ↑, increase; ECL, extracellular loop; TJ, tight junctions; Occl, occludin; EC, epithelial cells;
Cldn1, claudin-1, Cldn5, claudin-5; Cldn3, claudin-3; Cldn4, claudin-4; iv, intravenous; cCPE, c-terminal
region of Clostridium perfringens enterotoxin; ZO-1, zonula occludens protein-1; Caco-2, human colon
carcinoma epithelial;
1.10. STATE OF RESEARCH
Tric is a unique TJ protein due to its tricellular localization and important role in maintain-
ing paracellular tightness. To date, most studies have focused on Tric’s barrier forming
function and interaction with other TJ proteins. However, it is necessary to have expression
profile of Tric in all organs and specific tissues. For instance, we lack clear information
about the localization of Tric in brain capillaries, the knowledge which would facilitate the
INTRODUCTION
22
investigation of endothelial cell barriers. Tric is located at the central of TJ network and it
interacts with both bicellular and tricellular TJ proteins because it extends through the ba-
solateral part. Certainly advancing technology and microscopy techniques will help to re-
veal the interaction and localization of TJ proteins establishing complicated TJ organiza-
tion.
It is known that TJ proteins compensate for each other when any one of them is knocked
down or modulated. Nevertheless, it is not possible to make detailed explanations without
the information about the signalling pathway that regulates transcription of Tric. The com-
plete crystal structure of Tric is unavailable. Likewise there is not much information about
the link between pathologies and altered Tric expression, structure and function. Most im-
portantly, Tric can be targeted in the course of developing a peptide-based barrier opening
approach like Cldn and Occl peptidomimetics. This would be a more specific therapeutic
strategy due to Tric’s distinct location.

AIM
23
2. AIM
There is limited knowledge about structure, function and regulation of tricellular contacts.
This study focused therefore on understanding the tricellular organization of TJ proteins
which is involved in tissue barriers. To modulate tricellular structure and paracellular
tightness, a tricellulin ECL2 derived peptide called “trictide” was designed. Tric ECL2
region plays a role in interactions of Tric between adhering cells and contributes to
paracellular tightness. The aim was to specify a peptidomimetic approach to tricellular
junctions by modulating tricellulin and to develop trictide as a potential drug enhancer to
overcome tissue barriers. Thus, functional and molecular alterations caused by trictide
were investigated.
Time- and concentration dependency of trictide on paracellular passage towards different
markers will be examined to demonstrate function of trictide as barrier opener. To
recognize the molecular basis of functional changes in barriers, the alterations in
localization of Tric and several Tric interacting TJ proteins will be inspected after trictide.
In addition, changes in the localization, disruption of cis-interactions between TJ proteins
within the plasma membrane, up- or down-regulation of protein and mRNA expressions
will be studied. After cellular studies, trictide administration in mice are planned to prove
the impact of trictide in vivo. Tracer uptake of major organs, mRNA expressions of TJ
proteins in brain and kidney and also stability of the peptide in blood plasma will be
investigated. In order to understand the molecular function of trictide, the tertiary structure
and secondary structural elements should be elucidated. The structure of non-functioning
control peptide (scrambled trictide) will also be analyzed to visualize structural differences
relevant to the effectiveness of the trictide. Finally, tricellular TJ morphology in brain
capillaries will be examined. In order to fully comprehend the functional consequences of
trictide treatment, localization and amount of TJ proteins within brain capillaries will be
inspected.
Overall, the functional and molecular modifications caused by trictide will enable to
realize necessary components and protein interactions of tricellular TJs for a functional
barrier. Moreover, trictide will be tested as a novel peptidomimetic by targeting the
tricellular TJs and opening the tissue barriers that can be considered as a drug enhancer in
future studies.

MATERIALS AND METHODS
24
3. MATERIALS AND METHODS
3.1. MATERIALS
The tables below summarize the chemicals and consumables used in this study, with the
supplier listed as well. Unless stated otherwise, all basic chemicals were purchased from
Thermo Fisher Scientific Inc., USA.

MATERIALS AND METHODS
25
Table 3. Chemicals
Substance Supplier
2-Methylbutane Carl Roth, Karlsruhe, Germany
Acetic acid VWR Chemicals, Darmstadt, Germany
Acetone VWR Chemicals, Darmstadt, Germany
Acetonitril J. T. Baker, Deventer, The Netherlands
Acrylamid/Bisacrylamid mixture 40% Carl Roth, Karlsruhe, Germany
Agarose Serva Electrophoresis GmbH, Heidelberg, Germany
Albumin Fraction Carl Roth, Karlsruhe, Germany
Ammoniumperoxidsulfate (APS) Bio-Rad Laboratories GmbH, Munich, Germany
Ampicillin Carl Roth, Karlsruhe, Germany
Collagen (rat tail) Roche, Mannheim, Germany
Dimethyl Sulphoxide(DMSO) Sigma-Aldrich, Steinheim, Germany
dNTP (Deoxynucleotide) mix(10 mM) Fermentas Life Science, St. Leon-Rot, Germany
Dulbecco's modified eagle medium Life Technologies, Darmstadt, Germany
Dulbecco's phosphate buffered saline Life Technologies, Darmstadt, Germany
Ethanol VWR Chemicals, Darmstadt, Germany
Ethylenediaminetetraacetic acid Carl Roth, Karlsruhe, Germany
Ethylenglykol Carl Roth, Karlsruhe, Germany
Fetal calf serum albumin Life Technologies, Darmstadt, Germany
Geneticin (G418) Carl Roth, Karlsruhe, Germany
Glycerol Carl Roth, Karlsruhe, Germany
Hank's balanced salt solution Life Technologies, Darmstadt, Germany
Hoechst 33342 Life Technologies, Darmstadt, Germany
Isopropanol Chemicals, Darmstadt, Germany
Kanamycin Carl Roth, Karlsruhe, Germany
L-cysteine Carl Roth, Karlsruhe, Germany
MEM Non-Essential Amino Acids Solution (100X) Life Technologies, Darmstadt, Germany
Methanol VWR Chemicals, Darmstadt, Germany
Milk powder Carl Roth, Karlsruhe, Germany
Opti-minimal-essential-medium Life Technologies, Darmstadt, Germany
Paraformaldehyde (PFA) Sigma-Aldrich, Steinheim, Germany
Penicillin/streptomycin Carl Roth, Karlsruhe, Germany
Polyethylenimine (PEI) Polyscience, Eppelheim, Germany
Poly-L-lysine (PLL) Sigma-Aldrich, Steinheim, Germany
Ponceau Sigma-Aldrich, Steinheim, Germany
Rotiphorese Gel 30 Carl Roth, Karlsruhe, Germany
Sodium- Dodecyl sulfate Sigma-Aldrich, Munich, Germany
Tetramethylethylenediamine Carl Roth, Karlsruhe, Germany
Trichloroacetic acid Carl Roth, Karlsruhe, Germany
Tricin Carl Roth, Karlsruhe, Germany
Tris Base Carl Roth, Karlsruhe, Germany
Triton X-100 Carl Roth, Karlsruhe, Germany
Trypsin/Ethylenediaminetetraacetic acid-solution Life Technologies, Darmstadt, Germany
Tween 20 Carl Roth, Karlsruhe, Germany
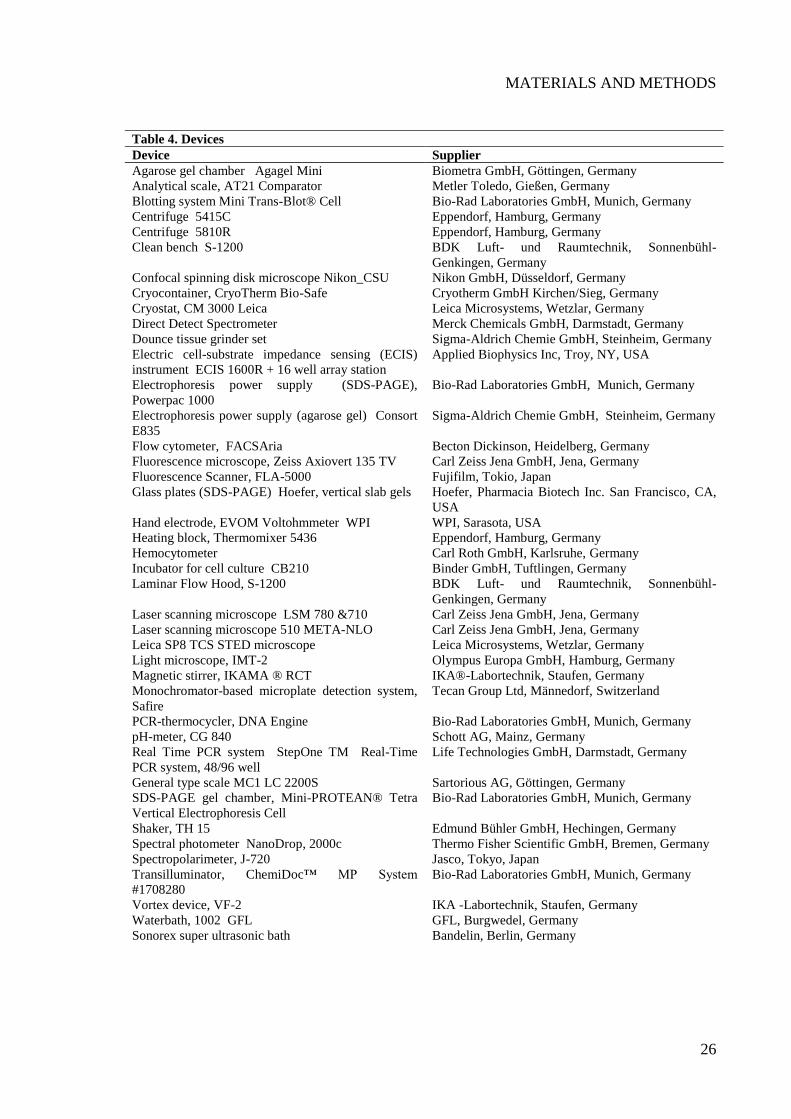
MATERIALS AND METHODS
26
Table 4. Devices
Device Supplier
Agarose gel chamber Agagel Mini Biometra GmbH, Göttingen, Germany
Analytical scale, AT21 Comparator Metler Toledo, Gießen, Germany
Blotting system Mini Trans-Blot® Cell Bio-Rad Laboratories GmbH, Munich, Germany
Centrifuge 5415C Eppendorf, Hamburg, Germany
Centrifuge 5810R Eppendorf, Hamburg, Germany
Clean bench S-1200 BDK Luft- und Raumtechnik, Sonnenbühl-
Genkingen, Germany
Confocal spinning disk microscope Nikon_CSU Nikon GmbH, Düsseldorf, Germany
Cryocontainer, CryoTherm Bio-Safe Cryotherm GmbH Kirchen/Sieg, Germany
Cryostat, CM 3000 Leica Leica Microsystems, Wetzlar, Germany
Direct Detect Spectrometer Merck Chemicals GmbH, Darmstadt, Germany
Dounce tissue grinder set Sigma-Aldrich Chemie GmbH, Steinheim, Germany
Electric cell-substrate impedance sensing (ECIS)
instrument ECIS 1600R + 16 well array station
Applied Biophysics Inc, Troy, NY, USA
Electrophoresis power supply (SDS-PAGE),
Powerpac 1000
Bio-Rad Laboratories GmbH, Munich, Germany
Electrophoresis power supply (agarose gel) Consort
E835
Sigma-Aldrich Chemie GmbH, Steinheim, Germany
Flow cytometer, FACSAria Becton Dickinson, Heidelberg, Germany
Fluorescence microscope, Zeiss Axiovert 135 TV Carl Zeiss Jena GmbH, Jena, Germany
Fluorescence Scanner, FLA-5000 Fujifilm, Tokio, Japan
Glass plates (SDS-PAGE) Hoefer, vertical slab gels Hoefer, Pharmacia Biotech Inc. San Francisco, CA,
USA
Hand electrode, EVOM Voltohmmeter WPI WPI, Sarasota, USA
Heating block, Thermomixer 5436 Eppendorf, Hamburg, Germany
Hemocytometer Carl Roth GmbH, Karlsruhe, Germany
Incubator for cell culture CB210 Binder GmbH, Tuftlingen, Germany
Laminar Flow Hood, S-1200 BDK Luft- und Raumtechnik, Sonnenbühl-
Genkingen, Germany
Laser scanning microscope LSM 780 &710 Carl Zeiss Jena GmbH, Jena, Germany
Laser scanning microscope 510 META-NLO Carl Zeiss Jena GmbH, Jena, Germany
Leica SP8 TCS STED microscope Leica Microsystems, Wetzlar, Germany
Light microscope, IMT-2 Olympus Europa GmbH, Hamburg, Germany
Magnetic stirrer, IKAMA ® RCT IKA®-Labortechnik, Staufen, Germany
Monochromator-based microplate detection system,
Safire
Tecan Group Ltd, Männedorf, Switzerland
PCR-thermocycler, DNA Engine Bio-Rad Laboratories GmbH, Munich, Germany
pH-meter, CG 840 Schott AG, Mainz, Germany
Real Time PCR system StepOne TM Real-Time
PCR system, 48/96 well
Life Technologies GmbH, Darmstadt, Germany
General type scale MC1 LC 2200S Sartorious AG, Göttingen, Germany
SDS-PAGE gel chamber, Mini-PROTEAN® Tetra
Vertical Electrophoresis Cell
Bio-Rad Laboratories GmbH, Munich, Germany
Shaker, TH 15 Edmund Bühler GmbH, Hechingen, Germany
Spectral photometer NanoDrop, 2000c Thermo Fisher Scientific GmbH, Bremen, Germany
Spectropolarimeter, J-720 Jasco, Tokyo, Japan
Transilluminator, ChemiDoc™ MP System
#1708280
Bio-Rad Laboratories GmbH, Munich, Germany
Vortex device, VF-2 IKA -Labortechnik, Staufen, Germany
Waterbath, 1002 GFL GFL, Burgwedel, Germany
Sonorex super ultrasonic bath Bandelin, Berlin, Germany
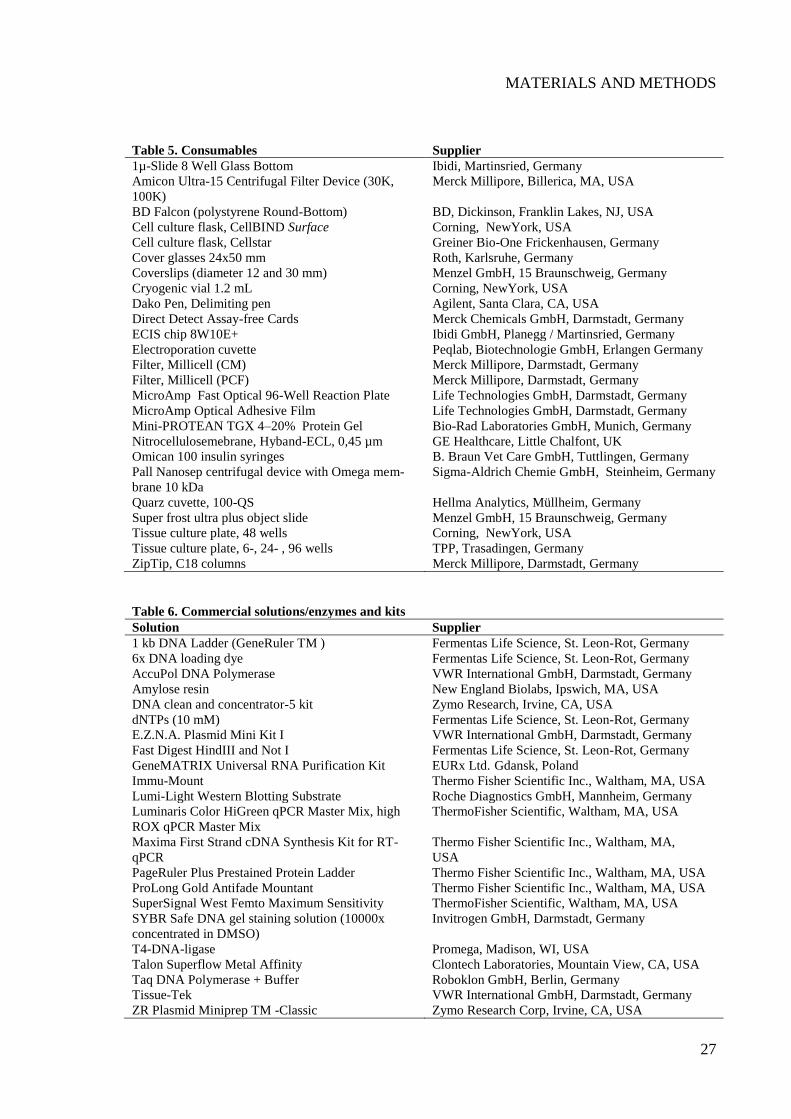
MATERIALS AND METHODS
27
Table 6. Commercial solutions/enzymes and kits
Solution Supplier
1 kb DNA Ladder (GeneRuler TM ) Fermentas Life Science, St. Leon-Rot, Germany
6x DNA loading dye Fermentas Life Science, St. Leon-Rot, Germany
AccuPol DNA Polymerase VWR International GmbH, Darmstadt, Germany
Amylose resin New England Biolabs, Ipswich, MA, USA
DNA clean and concentrator-5 kit Zymo Research, Irvine, CA, USA
dNTPs (10 mM) Fermentas Life Science, St. Leon-Rot, Germany
E.Z.N.A. Plasmid Mini Kit I VWR International GmbH, Darmstadt, Germany
Fast Digest HindIII and Not I Fermentas Life Science, St. Leon-Rot, Germany
GeneMATRIX Universal RNA Purification Kit EURx Ltd. Gdansk, Poland
Immu-Mount Thermo Fisher Scientific Inc., Waltham, MA, USA
Lumi-Light Western Blotting Substrate Roche Diagnostics GmbH, Mannheim, Germany
Luminaris Color HiGreen qPCR Master Mix, high
ROX qPCR Master Mix
ThermoFisher Scientific, Waltham, MA, USA
Maxima First Strand cDNA Synthesis Kit for RT-
qPCR
Thermo Fisher Scientific Inc., Waltham, MA,
USA
PageRuler Plus Prestained Protein Ladder Thermo Fisher Scientific Inc., Waltham, MA, USA
ProLong Gold Antifade Mountant Thermo Fisher Scientific Inc., Waltham, MA, USA
SuperSignal West Femto Maximum Sensitivity ThermoFisher Scientific, Waltham, MA, USA
SYBR Safe DNA gel staining solution (10000x
concentrated in DMSO)
Invitrogen GmbH, Darmstadt, Germany
T4-DNA-ligase Promega, Madison, WI, USA
Talon Superflow Metal Affinity Clontech Laboratories, Mountain View, CA, USA
Taq DNA Polymerase + Buffer Roboklon GmbH, Berlin, Germany
Tissue-Tek VWR International GmbH, Darmstadt, Germany
ZR Plasmid Miniprep TM -Classic Zymo Research Corp, Irvine, CA, USA
Table 5. Consumables Supplier
1µ-Slide 8 Well Glass Bottom Ibidi, Martinsried, Germany
Amicon Ultra-15 Centrifugal Filter Device (30K,
100K)
Merck Millipore, Billerica, MA, USA
BD Falcon (polystyrene Round-Bottom) BD, Dickinson, Franklin Lakes, NJ, USA
Cell culture flask, CellBIND Surface Corning, NewYork, USA
Cell culture flask, Cellstar Greiner Bio-One Frickenhausen, Germany
Cover glasses 24x50 mm Roth, Karlsruhe, Germany
Coverslips (diameter 12 and 30 mm) Menzel GmbH, 15 Braunschweig, Germany
Cryogenic vial 1.2 mL Corning, NewYork, USA
Dako Pen, Delimiting pen Agilent, Santa Clara, CA, USA
Direct Detect Assay-free Cards Merck Chemicals GmbH, Darmstadt, Germany
ECIS chip 8W10E+ Ibidi GmbH, Planegg / Martinsried, Germany
Electroporation cuvette Peqlab, Biotechnologie GmbH, Erlangen Germany
Filter, Millicell (CM) Merck Millipore, Darmstadt, Germany
Filter, Millicell (PCF) Merck Millipore, Darmstadt, Germany
MicroAmp Fast Optical 96-Well Reaction Plate Life Technologies GmbH, Darmstadt, Germany
MicroAmp Optical Adhesive Film Life Technologies GmbH, Darmstadt, Germany
Mini-PROTEAN TGX 4–20% Protein Gel Bio-Rad Laboratories GmbH, Munich, Germany
Nitrocellulosemebrane, Hyband-ECL, 0,45 µm GE Healthcare, Little Chalfont, UK
Omican 100 insulin syringes B. Braun Vet Care GmbH, Tuttlingen, Germany
Pall Nanosep centrifugal device with Omega mem-
brane 10 kDa
Sigma-Aldrich Chemie GmbH, Steinheim, Germany
Quarz cuvette, 100-QS Hellma Analytics, Müllheim, Germany
Super frost ultra plus object slide Menzel GmbH, 15 Braunschweig, Germany
Tissue culture plate, 48 wells Corning, NewYork, USA
Tissue culture plate, 6-, 24- , 96 wells TPP, Trasadingen, Germany
ZipTip, C18 columns Merck Millipore, Darmstadt, Germany

MATERIALS AND METHODS
28
IF, immunofluorescence; WB, western blot; IHC, immunohistochemistry; STED, stimulated emission deple-
tion.
Table 7. Antibodies
Primary antibodies Species Concentration Supplier
Anti-Tricellulin
# 48-8400
rabbit 0.25 mg/ml; IF 1:150,
STED 1:100 IHC 1:75,
WB:1:1000
Invitrogen, Thermo Fisher
Scientific, Schwerte,
Germany
Anti- Claudin-1
#51-9000
rabbit 0.5 mg/ml; IF 1:150,
STED 1:100, WB 1:1000
Invitrogen, Thermo Fisher
Scientific, Schwerte,
Germany
Anti-Occludin
#33-1500
mouse 0.5 mg/ml; IF: 1:150, IHC:
1:100, STED 1:100, WB
1:1000
Invitrogen, Thermo Fisher
Scientific, Schwerte,
Germany
Anti- Claudin-5
#34-1600
rabbit 0.25 mg/ml
WB: 1:1000
STED, IF: 1: 100
Invitrogen, Thermo Fisher
Scientific, Schwerte,
Germany
Anti- Claudin-5
#1548773A
mouse 0.5 mg/ml, IF, IHC 1:100 Invitrogen, Thermo Fisher
Scientific, Schwerte,
Germany
Anti- GAPDH
#G8795
mouse
1 mg/ml
WB 1:1000
Sigma-Aldrich, Munich,
Germany
Anti MarvelD3
# AV44715
rabbit 1 mg/ml
WB: 1:500
Sigma-Aldrich, Munich,
Germany
Anti- ZO-1
#339100
mouse 0.5 mg/ml
STED: 1:100
Invitrogen, Thermo Fisher
Scientific, Schwerte,
Germany
Anti- ZO-1
#LSC124822
rat 0.5 mg/ml
STED 1:100
BIOZOL Diagnostica
Vertrieb GmbH, Eching,
Germany
Anti-LSR
#ABIN949343
mouse 50 µg/ml IF: 1:150 IHC:
1:50 WB: 1:500
Abnova, Taipei City,
Taiwan
Anti-6X-His
#MA1-21315
mouse 1 mg/ml
WB 1:1000
Invitrogen™, Thermo
Fisher Scientific,
Schwerte, Germany
Secondary antibodies Species Concentration Supplier
Anti-Rabbit Atto 488
#18771
goat 1 mg/ml
IF 1:250
Sigma-Aldrich Chemie
GmbH, Steinheim,
Germany
Anti-Mouse_IgG-Cy3(555)
#A10520
goat 1 mg/ml
IF 1:250
Invitrogen, Thermo Fisher
Scientific, Schwerte,
Germany
Anti-Rabbit HRP
#1708241
goat 0.8 mg/ml
WB: 1:1000
Bio-Rad Laboratories Inc.,
Hercules, CA, USA
Anti-Mouse HRP
#1706516
goat 0.8 mg/ml
WB: 1:1000
Bio-Rad Laboratories Inc.,
Hercules, CA, USA
Alexa fluor 594 anti-rabbit IgG
Ref # A11072
goat 2 mg/ml
STED 1:300
Life Technologies,
Eugene, Oregon, USA
Alexa fluor 594 anti-rat IgG
Ref# A11007
goat 2 mg/ml
STED 1:300
Life Technologies,
Eugene, Oregon, USA
Alexa fluor 594 F(ab’)anti-mouse IgG
Ref#A11020
goat 2 mg/ml
STED 1:1000
Life Technologies,
Eugene, Oregon, USA
Abberior STAR 635P anti mouse IgG
#2-0002-007-5
goat 1 mg/ml
STED 1:300
Abberior GmbH,
Göttingen, Germany
Abberior STAR 635P anti rabbit IgG
#2-0012-007-2
goat 1 mg/ml
STED 1:300
Abberior GmbH,
Göttingen, Germany

MATERIALS AND METHODS
29
Table 8. Plasmids
Plasmid Characteristics Reference
pEYFP-C1-Tric 5.3 Kb; Ampr/Neor, SV 40 ori,
pUC ori, PCMV
IE; EYFP(reporter) N-terminal, tric
O. Huber, Charite-Berlin, 2009,
Germany
pECFP-C1-Tric 5.3 Kb; Ampr/Neor, SV 40 ori,
pUC ori, PCMV
IE; ECFP(reporter) N-terminal, tric
O. Huber, Charite-Berlin, 2009,
Germany
pEYFP-C1-Occl 5.3 Kb; Kanr/Neor, SV 40 ori, pUC
ori, PCMV
IE; EYFP(reporter) N-terminal,
occludin
C. Bellmann, FMP-Berlin, 2010,
Germany
pECFP-C1-Occl 5.3 Kb; Kanr/Neor, SV 40 ori, pUC
ori, PCMV
IE; ECFP(reporter) N-terminal,
occludin
C. Bellmann, FMP-Berlin, 2010,
Germany
pEYFP-C1-MD3 5.3 Kb; Kanr/Neor, SV 40 ori, pUC
ori, PCMV
IE; EYFP(reporter)N-terminal,
marvelD3
J. Cording, FMP-Berlin, 2011,
Germany
pECFP-C1-MD3 5.3 Kb; Kanr/Neor, SV 40 ori, pUC
ori, PCMV
IE; EYFP(reporter)N-terminal,
marvelD3
M. Balda, UCL-London, UK
pETRQ-C1-Cld1 5.3 Kb; Kanr/Neor, SV 40 ori, pUC
ori, PCMV
IE; EYFP(reporter) N-terminal,
Cld1
N. Gehne, FMP-Berlin, 2013,
Germany
pEYFP-N1-Cld1 5.3 Kb; Ampr/Neor, SV 40 ori,
pUC ori, PCMV
IE; EYFP(reporter) C-terminal,
Cld1
S. Müller, FMP-Berlin, 2006,
Germany
pMAL-C2X
6.7 kb; Ampr; pMB1 ori; M13 ori;
Ptac; lacIq; lacZα; Maltose-binding
protein (MBP) N-terminal
New England Biolabs (NEB),
Ipswich, USA

MATERIALS AND METHODS
30
Table 9. Primers used for qRT-PCR
Primer Sequence (5’→3’)
fw rev
hActb GGACTTCGAGCAAGAGATGG AGCACTGTGTTGGCGTACAG
hTric AGGCAGCTCGGAGACATAGA TCACAGGGTATTTTGCCACA
hOcln TCCAATGGCAAAGTGAATGA GCAGGTGCTCTTTTTGAAGG
hMarveld3 GGACCCGGAGAGAGACCAG CTCCGAAGGGGGTTCACT
hLSR GTGACCCTGCCCTGTACCTA TCAACGTAGGGGTTGTAGCC
hZO1 GAACGAGGCATCATCCCTAA CCAGCTTCTCGAAGAACCAC
hCldn1 CGATGCTTTCTGTGGCTAAAC GAGGGCATCACTGAACAGATAG
hCldn5 GAGGCGTGCTCTACCTGTTT GTACTTCACGGGGAAGCTGA
mActb TTTGAGACCTTCAACACCCC ATAGCTCTTCTCCAGGGAGG
mTric GAGAATCCTGGGTGTGGTGG TTTCGATGACAACGACGGGT
mOcln ACTCCTCCAATGGCAAAGTG CCCCACCTGTCGTGTAGTCT
mMarveld3 TGGAGAAGTCCCGTCAAAGC AGCCACTATAAGCCCCTCCA
mLSR
GACCTGACCTTCGAGCAGAC AGGAAGAAGAGGAGGCTTGC
mCldn1 GATGTGGATGGCTGTCATTG CGTGGTGTTGGGTAAGAGGT
mCldn5 CTGGACCACAACATCGTGAC GCCGGTCCAGGTAACAAAGA
mCldn12 AACTGGCCAAGTGTCTGGTC AGACCCCCTGAGCTAGCAAT
mCldn25 CTACATGGCGGCCTCCATAG CGATGCCGCTATTGTGGTTG
mZO1 CCCACCCCCATCTCAGAGTA GGGACAGCTTTAGGCATGGT
Table 11. Primers used for amplification of recombinant proteins
Primer Sequence (5’→3’)
fw rev
hTric C-
term(362-558)
GCATTAGCTTAAAGTTATGGAGGCATGA
G
GCTTATAGCGGCCGCTTAAGAATA ACC
TTG
Primers used for MBP-hTric ECL2
Primer Sequence (5’→3’)
fw rev
hTric
ECL2(313-336)
AATGATACCAACCGAGGTGGCCTCTGCT
AC
CCGGCAGAACACTGCATTCACTGGTGT
ATT
Table 10. Primers used for mutagenesis PCR of hTric ECL2
Primer Sequence (5’→3’)
fw rev
Y322I GGCCTCTGCATCTATCCGTTATTTAATA
CACCA
AAATAACGGATAGATGCAGAGGCCACC
TCG
Y322A GGCCTCTGCGCGTATCCGTTATTTAATA
CACCA
AAATAACGGATACGCGCAGAGGCCACC
TCG
F326A CCGTTAGCGAATACACCAGTG TGTATTCGCTAACGGATAGTAGCA
F334I GCAGTGATATGCCGGGTAGAAGGA CCGGCATATCACTGCATTCACTGG

MATERIALS AND METHODS
31
Different biological samples were listed in Table 12. In addition, C57BL/6 mice obtained
from the MDC animal facility (Berlin, Germany) were used for the purposes of this
dissertation.
Table 12. Eukaryotic cells and bacteria
Cell type/bacteria Description Source
bEND.3 Mouse brain endothelial cell line Zwanziger et al., 2012b
Caco-2 Human epithelial colorectal
adenocarcinoma cells
Bayer Pharma AG, Berlin,
Germany
HEK-293 Human embryonic kidney cells ATCC, Manassas, VA, USA
HT29/B6 Human epithelial colon
adenocarcinoma cells
S. Krug, Charite–Berlin, Germany
MDCK-II Madin-Darby canine kidney cells ATCC, Manassas, VA, USA
Escherichia coli BL21 Life Technologies, Darmstadt,
Germany
Table 13. Fluorescent size markers for permeation experiments
Size marker for permeation Supplier Fluorescence properties
FD10, 10 kDa Sigma-Aldrich Chemie
GmbH, Steinheim, Germany
λex = 485 nm, λem = 520 nm
FD40, 40 kDa Sigma-Aldrich Chemie
GmbH, Steinheim, Germany
λex = 485 nm, λem = 520 nm
Lucifer Yellow, 0.4 kDa Sigma-Aldrich Chemie
GmbH, Steinheim, Germany
λex = 425 nm, λem = 520 nm
Sodium fluorescein Sigma-Aldrich Chemie
GmbH, Steinheim, Germany
λex = 460 nm, λem = 515 nm
FD, fluorescein isothiocyanate–dextran; λab, wavelength of the absorption; λex, excitation wavelength; λem,
emission wavelength.
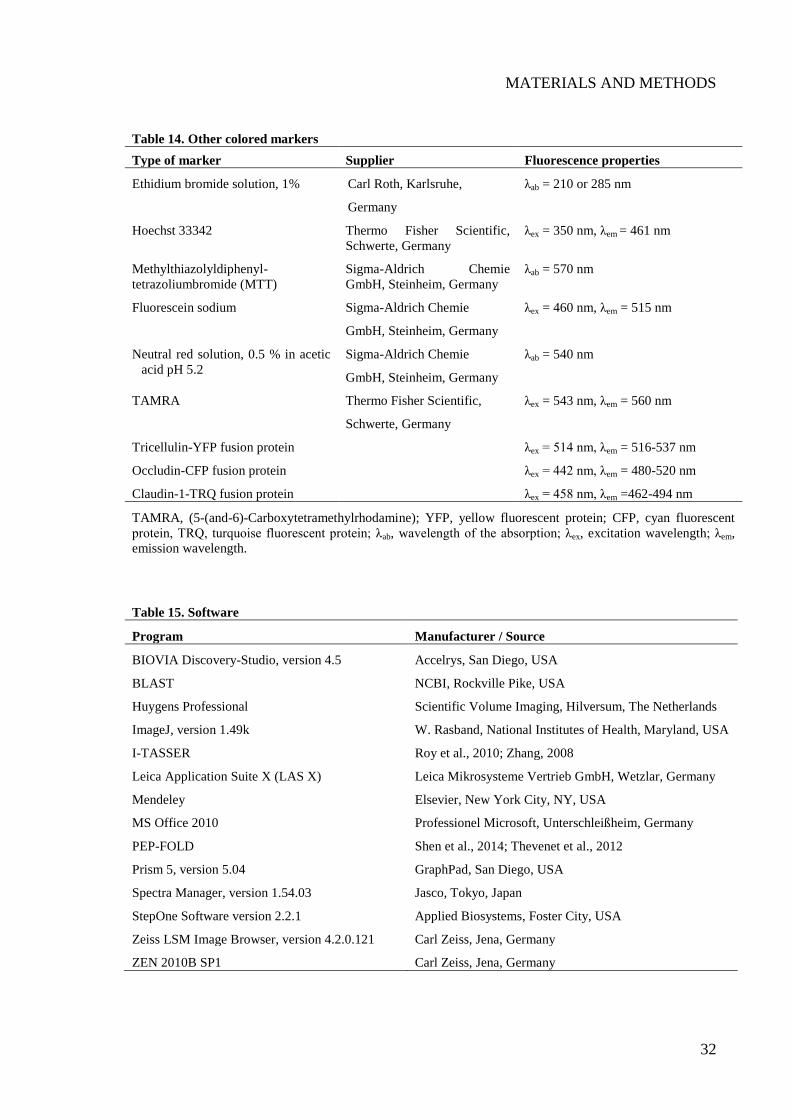
MATERIALS AND METHODS
32
Table 15. Software
Program Manufacturer / Source
BIOVIA Discovery-Studio, version 4.5 Accelrys, San Diego, USA
BLAST NCBI, Rockville Pike, USA
Huygens Professional Scientific Volume Imaging, Hilversum, The Netherlands
ImageJ, version 1.49k W. Rasband, National Institutes of Health, Maryland, USA
I-TASSER Roy et al., 2010; Zhang, 2008
Leica Application Suite X (LAS X) Leica Mikrosysteme Vertrieb GmbH, Wetzlar, Germany
Mendeley Elsevier, New York City, NY, USA
MS Office 2010 Professionel Microsoft, Unterschleißheim, Germany
PEP-FOLD Shen et al., 2014; Thevenet et al., 2012
Prism 5, version 5.04 GraphPad, San Diego, USA
Spectra Manager, version 1.54.03 Jasco, Tokyo, Japan
StepOne Software version 2.2.1 Applied Biosystems, Foster City, USA
Zeiss LSM Image Browser, version 4.2.0.121 Carl Zeiss, Jena, Germany
ZEN 2010B SP1 Carl Zeiss, Jena, Germany
Table 14. Other colored markers
Type of marker Supplier Fluorescence properties
Ethidium bromide solution, 1% Carl Roth, Karlsruhe,
Germany
λab = 210 or 285 nm
Hoechst 33342 Thermo Fisher Scientific,
Schwerte, Germany
λex = 350 nm, λem = 461 nm
Methylthiazolyldiphenyl-
tetrazoliumbromide (MTT)
Sigma-Aldrich Chemie
GmbH, Steinheim, Germany
λab = 570 nm
Fluorescein sodium Sigma-Aldrich Chemie
GmbH, Steinheim, Germany
λex = 460 nm, λem = 515 nm
Neutral red solution, 0.5 % in acetic
acid pH 5.2
Sigma-Aldrich Chemie
GmbH, Steinheim, Germany
λab = 540 nm
TAMRA Thermo Fisher Scientific,
Schwerte, Germany
λex = 543 nm, λem = 560 nm
Tricellulin-YFP fusion protein λex = 514 nm, λem = 516-537 nm
Occludin-CFP fusion protein λex = 442 nm, λem = 480-520 nm
Claudin-1-TRQ fusion protein λex = 458 nm, λem =462-494 nm
TAMRA, (5-(and-6)-Carboxytetramethylrhodamine); YFP, yellow fluorescent protein; CFP, cyan fluorescent
protein, TRQ, turquoise fluorescent protein; λab, wavelength of the absorption; λex, excitation wavelength; λem,
emission wavelength.

MATERIALS AND METHODS
33
3.2. METHODS
3.2.1. Peptide design and synthesis
Peptides were synthesized automatically by peptide chemistry facility (FMP-Berlin,
Germany) using 9H-fluoren-9-ylmethoxycarbonyl (Fmoc) chemistry. Identity and quality
of peptides were verified by high-performance liquid chromatography and mass
spectrometry, showing a purity of ≥95% (220 nm) and the expected masses. Trictide
(Table 16) comprises extracellular loop 2 (ECL2) of human tricellulin-a (Tric313–336);
Cys321 and Cys335 were replaced by Ser to avoid unspecific oligomerization. As a
control, a scrambled variant (scrambled peptide, Table 16) was used. Peptides were
amidated at the C-terminus. Trictide was labelled N-terminally with 5,6-
carboxytetramethylrhodamine (TAMRA) (Table 16).
3.2.2. Cell Culture
3.2.2.1. Routine cell culture work
The cells (Table 12) were incubated at 37 °C and 5% or 10% CO2 in cell-specific medium
and cell-culture flasks (Table 17). After washing (2x, Dulbecco's phosphate-buffered
saline, without Ca2+
and Mg2+
, DPBS-/-) and dissociation with
trypsin/ethylenediaminetetraacetic acid (EDTA) solution at 37 °C, they were resuspended
in the new medium and centrifuged (150xg, 4 min). The pellet was taken up in new
medium, resuspended and transferred on cell culture flasks (Table 17) or tissue culture
plates (Table 5).
Table 16. Peptide sequences
Peptide Description Sequence
Trictide ECL2 of human
tricellulin, 313–336
NDTNRGGLSYYPLFNTPVNAVFSR-NH2
Scrambled trictide Control peptide DNLNRGGASYTPFYLNVPNFVTSR-NH2
TAMRA-trictide TAMRA-
NDTNRGGLSYYPLFNTPVNAVFSR-NH2

MATERIALS AND METHODS
34
Table 17. Culturing conditions of eukaryotic cells
Cell type Medium compositions CO2 Culture flask Cell dissociation
bEnd.3 DMEM, 4.5 g/l glucose, 10%
FCS, 100 U/ml penicillin, 100
µg/ml streptomycin
10% Cellstar# 0.25%Trypsin/0.02%
EDTA
Caco-2 DMEM, 1 g/l glucose, 20%
FCS, 100 U/ml penicillin, 100
µg/ml streptomycin, 1x NEAA
5% CellBIND#
Surface
0.25%Trypsin/0.02%
EDTA
HT29/B6 RPMI 1640 Medium with
stable L-glutamine, 10% FCS,
100 U/ml penicillin, 100 µg/ml
streptomycin
5% Cellstar# 0.25%Trypsin/0.02%
EDTA
MDCK-II
HEK-293
DMEM, 1 g/l glucose, 20%
FCS, 100 U/ml penicillin, 100
µg/ml streptomycin*
10% Cellstar# 0.25%/0.05% Trypsin
/0.02% EDTA
* after transfection cultured with geneticin (final 0.5 µg/ml); DMEM, Dulbecco's modified eagle-medium;
EDTA, ethylenediaminetetraacetic acid; FCS, fetal calf serum albumin; NEAA, non-essential amino acids;
RPMI, Roswell Park Memorial Institute-Medium, %, (v/v); #, further information about products can be find in
Table 5.
3.2.2.2. Cryopreservation and thawing of cells
Almost confluent cells (around 85% conflueny) were washed (2x, DPBS-/-), dissociated
with trypsin/EDTA (Table 17) and centrifuged at 150xg, 4 min. The cell pellet was
resuspended in freezing medium (90% fetal calf serum (FCS), 10% DMSO) and aliquoted
in cryotubes. The tubes were first cooled down to -20 °C at a cooling rate of 1 °C/min and
finally stored in liquid nitrogen at -196 °C.
For reactivation, the cryoculture was thawed in a 37 °C water bath and immediately
resuspended in cell-specific medium (Table 17). This suspension was centrifuged (150xg,
4 min) to eliminate DMSO in freezing medium. After centrifugation, the cell pellet was
resuspended in new medium and transferred to a cell culture flask.
3.2.2.3. Cell counting
An aliquot of the cell suspension was diluted 1:2 with cell-specific medium. From that, 20
μl were applied to a Neubauer counting chamber. After counting the 4 counting areas, the
cell count/ml was calculated by taking the mean of cell number (total cell number/number
of counted areas) and multiplied by 104 and the dilution factor 2.

MATERIALS AND METHODS
35
3.2.2.4. Transfection and obtaining stable transfected cell lines
Tissue culture plates (6 wells) were used for the preparation of stably transfected cell lines.
Wells were coated with poly-L-lysine (PLL, 20 µg/ml in DPBS-/-) (1 h, 1.5 ml), washed
(2x, DPBS-/-) and HEK-293/MDCK-II cells seeded there (2.2.2.1). Medium was removed
and transfection procedure was initiated at a confluency of 90%. The plasmid DNA (2 µg)
as well as polyethyleneimine (PEI) (10 µl) were mixed separately with 250 µl Opti-
minimal essential medium per well and incubated for 5 min. Then the DNA and PEI were
mixed (1:1) and left for 20 min of additional incubation before finally being added to the
culture plates (3 ml transfection medium/10 cm2). The next day the selection antibiotic,
geneticin (final 0.5 μg/ml), was added. After 48 h the transfection success was verified by
microscopic analysis of the fluorescently tagged proteins.
3.2.2.5. Cell cultivation on coverslips and filters
For MDCK-II, HEK-293 and Caco-2 cells, the coverslips (1.1 cm2, 9.6 cm
2) were coated
with PLL (20 μg/ml in DPBS-/-) while for bEnd.3 cells the coverslips were coated with rat
tail collagen (0.67 mg/ml in 0.2% acetic acid). For each coverslip 0.3 ml/cm2 of coating
material is applied and incubated at 22 °C for 1.5 h. The coverslips were washed (DPBS-/-)
prior to cell seeding of the cells. The cells were seeded on coverslips under the conditions
described in 3.2.2.1.
For Caco-2 cells, the filters were coated with 150 μl rat tail collagen (0.67 mg/ml in 0.2%
acetic acid, 1:2 in DPBS-/-) per filter (type: CM, pore size 0.4 μm, Table 5) and dried
overnight on a 37 °C hot plate. The washing (DPBS-/-) step was followed by equilibration
of the filters with cell-specific medium (apical 400 μl, basal 600 μl, Table 17) for 2 h in the
incubator. Then 18·104
cells were seeded per filter (culture area: 4.2 cm2).
HT-29/B6 cells were grown on permeable supports (type: PCF, 3 µm pore-size, Table 5)
and left for monolayer differentiation for seven days.
3.2.2.6. Application of peptide on cells
The peptides (Table 16) were weighed by analytical balance (AT21 Comparator, Metler
Toledo) and dissolved in cell-specific medium (Table 17) at 37 °C. Before the peptide
treatment, the medium was taken off and replaced by peptide-containing medium.

MATERIALS AND METHODS
36
TAMRA-labelled peptides are first dissolved in DMSO (1% of total volume) and then in
cell-specific medium.
3.2.3. Functional assays
The tightness of the cell monolayer was determined by transcellular electrical resistance
(TER) and paracellular permeation measurements. While TER reflects permeability to
ions, permeation measurements enabled us to draw conclusions about the permeability of a
cell barrier for molecules of different sizes (Table 13). The combination of both methods
allows correlation of change, in the paracellular tightness and in the permeability for
certain molecular sizes.
3.2.3.1. Measuring transepithelial electrical resistance
The TER of the Caco-2 filter cultures (Table 17) was measured every 24 h with chopstick
electrodes (on a 37 °C hot plate, three measurements per filter, each value by 120°). Before
treatment, filter cultures reached TER values of 205.2±10.6 Ω•cm2
(empty control
subtracted, representative values of an experiment, n=21). For the calculation of TER, the
average electrical resistance of the empty filter (ΩL) was extracted from the mean electrical
resistance of the cell-grown filter (ΩZ) and multiplied by the growth area of the filters
(cm2).
𝑇𝐸𝑅 = (𝑅𝐶𝑒𝑙𝑙 𝑙𝑎𝑦𝑒𝑟 − 𝑅𝐸𝑚𝑝𝑡𝑦 𝑓𝑖𝑙𝑡𝑒𝑟) ∙ 𝐴 (Ω∙cm2)
𝑅𝐶𝑒𝑙𝑙 𝑙𝑎𝑦𝑒𝑟 Resistance of the cell layer between apical and basolateral compartment of cell containing
filter
𝑅𝐸𝑚𝑝𝑡𝑦 𝑓𝑖𝑙𝑡𝑒𝑟 Resistance of the cell layer between apical and basolateral compartment of cell-free filter
𝐴 Culture area
Filters were grouped leading to similar initial TER values and then were treated with
scramble peptide or trictide.

MATERIALS AND METHODS
37
3.2.3.2. Permeation assays
All steps were carried out with 37 °C pre-warmed solutions. Fluorescein isothiocyanate
(FITC)–dextran 10 (FD10, 10 kDa), FITC-dextran 4 (FD4, 4 kDa), lucifer yellow (LY, 457
Da) and FITC-dextran 40 (FD40, 40 kDa) were used as permeation markers (Table 13).
The permeation coefficient (PC) was calculated according to formula below.
[PC]=𝑑𝑄
𝑑𝑡 ∙
1
𝐴 ∙ 𝐶𝑖 ∙ 60 (cm/s)
dQ/dt Amount of the diffused permeation marker (µg/min)
A Growth area of filters (cm2)
Ci Initial concentration of size marker (apical) (µg/ml)
60 Conversion factor min to s
For experiments with Caco-2 cells, three filters were used per each condition. The filters
were placed on a 37 °C hot plate and washed 2x with Hank's balanced salt solution with
Ca2+
and Mg2+
(HBSS+/+) (apical 400 μl, basolateral 600 μl). Then the 400 μl permeation
solution (8 µM FD10, 0.4 mM FD4, 100 µM LY or 2.5 µM FD40 in HBSS +/+) was
applied apically and 600 μl HBSS+/+ was applied basolaterally. During 30 min of
incubation on 37 °C hot plate, every one filter from each condition was discarded every 10
min. 3 aliquots of 150 μl were removed from basolateral section of each filter and placed
on a tissue culture plate (96 wells). The fluorescence intensities of fluorescence markers
(Table 13) were measured with the fluorescence plate reader (Safire, Tecan).
The permeability measurements of the HT-29/B6 cells were taken in multi-well plates in
HEPES-Ringer containing unlabeled dextran 4 kDa (FD4; 0.4 mM) at 37 °C. After apical
addition of FITC-labeled and dialyzed 4 kDa dextran, basolateral samples were analyzed
for their FD4 concentration at 0, 20, 40, and 60, 120 min.

MATERIALS AND METHODS
38
3.2.3.3. Cell viability
Cell culture plates (48 wells) were coated with PLL (20 μg/ml in DPBS-/-, 0.3 ml/well, 5
h) and washed (DPBS-/-). Cells were seeded and grown until they became sufficiently
confluent to be tested with substances. Subsequently, the cells were washed (DPBS-/-) and
each well was treated with 200 μl of 2.3.5-triphenyltetrazolium chloride (MTT) solution
(0.5 mg/ml in Dulbecco's modified Eagle's medium (DMEM), 1 g/L glucose, without
phenol red) (Weyermann et al., 2005) or neutral red solution (0.005% in DMEM 1 g/l
glucose, without phenol red). After 3 h in the 37 °C incubator, cells were washed with 200
µl/well extraction solution (MTT: 5% Triton X-100, 2% 2N hydrochloric acid, 93%
isopropanol; neutral red: 1% acetic acid, 50% ethanol). After 15 min on the vibrator, the
absorbance of the homogenates was measured (MTT, 570 nm; neutral red, 540 nm) with a
fluorescence plate reader (Safire, Tecan).
3.2.3.4. Electric cell-substrate impedance sensing
Initially, the electric cell-substrate impedance sensing (ECIS) arrays (ECIS chip 8W10E+)
were cleaned by 10 mM L-cysteine (200 μl/well) and incubated for 10 min. This treatment
constitutes a hydrophilic layer and prepared the surface for protein adsorption. Furthermore
it reduces the variation between ECIS wells and improves reproducibility. After washing
(3x with cell-specific culture medium), cell-specific culture medium was added to the
arrays (200 μl/well) and a high current (3 mA), high frequency (64 kHz) pulse was applied
to clean the electrodes (electrical stabilization). The bEND.3 (5·104/well) and Caco-2
(15·104/well) cells were seeded into disposable 8-well electrode arrays of the ECIS and
placed in an incubator at 37 °C and 10% CO2 while the electrical resistance was recorded.
When stable TER values were reached [for bEnd.3 cells 1504±206 Ω·cm2 (n=8, peptide-
free medium controls) and for Caco-2 cells 1351±34 Ω·cm2 (n=10, peptide-free medium
controls) compared to the cell-free control with 311 ± 4 Ω × cm2], cells were treated with
trictide (50-150 µM), scrambled trictide (150 µM) or peptide-free medium only. The
transcellular electrical resistance (TER) was recorded over time (70-100 h) with 1 h
intervals, at multiple frequencies (between 100 and 80000 Hz) but 4000 Hz was used to
evaluate the TER.

MATERIALS AND METHODS
39
3.2.4. Histological methods
3.2.4.1. Obtaining cryosections
C57BL/6N mice between 8 and 20 weeks of age were sacrificed, their brains removed and
immediately frozen in 2-methylbutane on dry ice for 5 min. Unless the brains were
intended for immediate use, they were stored at -80 °C. Before cryosectioning, brains were
embedded in Tissue-Tek (Table 6) on a metal disc and adapted to -18 °C. 8 μm sections
were cut using a microtome blade (MX35 Ultra, ThermoFisher Scientific) at -18 °C. The
cut sections were transferred to super frost ultra plus object slides (Table 5) and let stand at
room temperature to eliminate excess water. The slides were stored at -80 °C.
The human cortical cryosections were already provided by AMS Biotechnology
(Abingdon, United Kingdom) as embedded in Tissue-Tek. They were prepared the same
way as mouse brains.
3.2.4.2. Immunohistochemistry of cryosections
Mounted cryosections were taken from -80 °C, fixed with methanol at -20 °C for 10 min.
After washing step (1x 0.5% BSA in DPBS-/-) for 5 min and 1x sterile water for 3 min) on
a shaker at room temperature, brain sections were circled with water-repelling pen (Dako
Pen). 100 µl of primary antibodies (Table 7) were diluted in 0.5% BSA in DPBS-/-, added
either together or separately, and left for overnight incubation at 4 °C. The slides were
washed again (3x 0.5% BSA in DPBS-/- for 5-10 min and 1x DPBS-/- for 3 min) on a
shaker. The secondary antibodies (Table 7) were diluted in DPBS-/-, 100 µl of antibody
solution was added on top of brain sections and left at room temperature for 1 h in a dark
place. The slides were washed (3x DPBS-/- for 5-10 min) on a shaker and then treated with
Hoechst 33342 (16.23 µM in DPBS-/-) for 10 min in the dark. Finally the slides were
washed (1x sterile water for 3 min), mounted with Immu-Mount (Table 6), and left for 30
min incubation on 37 °C hot plate. The immunostained slides were stored at 4 °C. For
STED microscopy, secondary antibodies were exchanged with STED specific antibodies
(Table 7). Cells were mounted in Prolong Gold Antifade (Table 6) and left for 24 h at
room temperature before STED microscopy session.

MATERIALS AND METHODS
40
3.2.5. Microscopic investigation
Unless stated otherwise, laser scanning microscopy (LSM 780 &710 Plan-Apochromat
63x/1.4 or 100x/1.4 oil lenses) was used together with ZEN 2010B SP1 software to
conduct the experiment. The settings were selected according to the fluorescence
properties of the secondary antibodies (Table 7) and markers (Table 14).
3.2.5.1. Immunocytochemistry on cover glasses and filters
The coverslips were placed in a 24-well-tissue culture plate and coated with PLL (20 μg/ml
in DPBS-/-, 0.3 ml/well, 1 h, for Caco-2 and MDCK-II cells) or rat tail collagen (0.67
mg/ml in 0.2% acetic acid, 50 µl/well, for bEND.3 cells). Cells were seeded and grown
until they became fully confluent. Before fixation, cells were washed twice with ice-cold
DPBS-/-. The coverslips were placed into a staining tray with ice-cold acetone for 5 min
and ice-cold ethanol for 1 min. After washing for 1 min with ice-cold DPBS-/-, samples
were treated with blocking buffer (1% bovine serum albumin (BSA), 0.05% tween20 in
DPBS-/-) for 15 min in order to prevent unspecific binding. Cells were incubated with a
primary antibody (Table 7) diluted in the blocking buffer for 1 h at room temperature and
in a humid chamber. The coverslips were washed (4x 2 min with DPBS-/- then 1x 2 min
with blocking buffer) and the cells were incubated with a fluorophore coupled secondary
antibody (Table 7), diluted in the blocking buffer for 30 min at room temperature and in a
dark humid chamber. Finally the coverslips were washed (4x 2 min with DPBS-/- then 1x
2 min with sterile water) and mounted with Immu-Mount and left for 30 min incubation on
37 °C hot plate.
For cells on filters, cells were first washed twice by addition of ice-cold DPBS-/- into
apical and basal compartments. The same fixation protocol as explained above was applied
by addition of fixing agents into apical compartments of the filters. Filters were then taken
out by cutting with a blade and treated with primary and secondary antibodies the same
way as the coverslips. Details related to microscopy techniques can be found in chapter
3.2.5.4.
3.2.5.2. Live cell imaging
The cells cultured on 9.6 cm2 coverslips (3.2.2.5) were washed 3 times with HBSS+/+,
microscoped in HBSS+/+ and kept in 37 °C chamber. The staining of the cell nuclei was

MATERIALS AND METHODS
41
carried out with Hoechst 33342 (5 μM in HBSS+/+, ≥10 min). For the live cell imaging
with spin disk confocal microscopy (Nikon_CSU, Germany), glass bottom 8-well cuvette
was coated with PLL (20 μg/ml in DPBS-/-, 0.3 ml/well, 1 h). YFP-occludin MDCK-II
cells were seeded on glass bottom 8-well cuvettes in (1:3, 0.3 ml/well, in no-phenol red
cell specific medium) and waited until they became confluent.
Plan-Apochromat 40x air objective was utilized, and the microscope was adjusted to zoom
automatically. Cells were kept inside a regulated chamber (37 °C and 5% CO2), and every
15 min an image was taken from each pre-saved position and condition over the course of
15 h. TAMRA-trictide was dissolved first in DMSO and then in cell-specific medium
[final 10 µM peptide concentration and 1% DMSO (v/v)]. Afterwards TAMRA-trictide
was added in wells (30 µl/well from 100 µM stock peptide solution) after the first image.
3.2.5.3. Fluorescence resonance energy transfer
The measurement of the fluorescence resonance energy transfer (FRET) is a distance
dependent, radiationless transfer of energy from an excited donor fluorophore to a suitable
acceptor fluorophore. FRET is only possible if the molecules are less than 10 nm apart
(Sekar and Periasamy, 2003). For analysis of cis-interactions between TJ proteins along the
cell membrane at cell–cell contacts, HEK cells growing on coverslips (9.6 cm2) were co-
transfected with plasmids encoding Cldn1–YFP and Cldn1-TRQ, YFP–Occl and CFP–
Occl, YFP–Tric and CFP–Tric, and CFP–MD3. After 48 h, transfectants were treated with
peptide-free medium, 50 µM scrambled peptide- and 50 µM trictide-containing medium,
respectively. After another 24 h, living cells were transferred into HBSS +/+ and analyzed
by ZEISS LSM 510 META NLO microscope using a PlanNeofluar 100x/1.3 oil objective.
For FRET at bTJs, acceptor photobleaching principle was applied (Cording et al., 2013;
Kenworthy, 2001). Photobleaching of YFP was performed using 30–40 pulses of the 514
nm argon laser line at 100% intensity (Table 14). Before and after acceptor bleaching, CFP
intensity (Table 14) images were recorded to calculate changes in donor fluorescence in
the area of cell-cell contacts. We always measured areas with similar CFP and YFP
fluorescence intensities. The FRET efficiency (EF) was calculated as below:

MATERIALS AND METHODS
42
𝐸𝐹=(𝐼𝑎 − 𝐼𝑏) · 100
𝐼𝑎
EF FRET efficiency
Ia CFP fluorescence intensity after photobleaching
Ib CFP fluorescence intensity before photobleaching
MDCK-II cells were used for FRET measurements in three-cell contacts and treated with
peptide-free medium, 50 µM scrambled peptide-, 50 µM and 100 µM trictide-containing
medium, respectively.
3.2.5.4. Stimulated emission depletion microscopy (STED)
The coverslips were placed in a 24-well-tissue culture plate and coated with PLL (20 μg/ml
in DPBS-/-, 0.3 ml/well, 1 h, for Caco-2 and MDCK-II cells) or rat tail collagen (0.67
mg/ml in 0.2% acetic acid, 50 µl/well, for bEND.3 cells). Cells were seeded and grown
until they became fully confluent. Before fixation, cells were washed three times with ice-
cold DPBS-/-. The coverslips were placed into a staining chamber with 4%
paraformaldehyde (PFA) for 15 min at room temperature. After washing three times with
ice-cold DPBS-/-, samples were treated with permeabilization buffer (0.1% Triton X-100
in DPBS-/-) for 10 min. Afterwards, the coverslips were rinsed three times with DPBS-/-
and left to incubate with blocking buffer (2% BSA in DPBS-/-) for 1 h at room
temperature. Cells were incubated with primary antibody dilutions (Table 7) (1% BSA in
DPBS-/-) overnight in a humid chamber at 4 °C. The coverslips were washed (3x 5 min
with DPBS-/-) and the cells were incubated with a STED-specific fluorophore coupled
secondary antibody (Table 7) (diluted in DPBS-/-) for 1 h in a dark humid chamber at
room temperature. Finally the coverslips were washed (3x 10 min with DPBS-/- then 2x 10
min with sterile water) and mounted with Prolong Gold Antifade (Thermo Fischer
Scientific) and left for 24 h incubation at room temperature before time gated STED
(gSTED) microscopy. STED imaging with time-gated detection was performed on a Leica
SP8 TCS STED microscope (Leica Microsystems) equipped with a pulsed white light
excitation laser (NKT Photonics).

MATERIALS AND METHODS
43
Dual-channel STED imaging was performed by sequentially exciting Atto647N and Alexa
594 at 646 nm and 598 nm, respectively. Both dyes were depleted with a 775 nm STED
laser. One optical section as acquired with an HC PL APO CS2 100x/1.40-N.A. oil
objective (Leica Microsystems) (a scanning format of 1.024x1.024 pixel, 8 bit sampling
and 6 fold zoom) can yield a pixel dimension of 18.9x18.9nm. Time-gated detection was
set from 0.3–6 ns for all dyes. Fluorescence signals were detected sequentially by hybrid
detectors at the appropriate spectral regions separated from the STED laser. To minimize
thermal drift, the microscope was housed in a heatable incubation chamber (LIS Life
Imaging Services). The effective lateral resolution of the SP8 TCS STED microscope was
previously determined using 40 nm fluorescent beads (Life Technologies;
excitation/emission maxima at 505/515 nm or 660/680 nm) to be 45 nm for the 647 nm
channel (Grauel et al., 2016). Raw data obtained from gSTED imaging were deconvolved
using Hygens Professional (Scientific Volume Imaging, Netherlands) software and
analyzed by custom macro (ImageJ).
3.2.6. Protein biochemistry methods
3.2.6.1. Cell lysis of eukaryotic cells
Cells were washed with ice cold DPBS-/- and, after removal of DPBS-/-, they were
scraped off with DPBS-/- (600 µl/9.6 cm2
well). The remaining cells were collected with
additional 600 µl of DPBS-/- and transferred into an eppendorf tube. The tube was
centrifuged (150xg, 4 min, 4 °C) and DPBS-/- was removed from cell pellet. Extraction
buffer (Table 18, 90 µl/per tube) was added on cell pellet. Cells were resuspended 3-5
times with a pipette and left for incubation on ice for 20 min. Following incubation, the
tube was centrifuged (13000xrpm, 1 min, 4 °C) and extraction buffer was discarded. The
pellet was homogenized with benzonase-mixture (5 µl/tube) (Table 18) again with a
pipette and placed in thermomixer at 37 °C for 10 min. After 10 min, the mixture was
homogenized well with a pipette (200 µl pipette tip) and mixed with solubilization buffer
(16.6 µl/per well) (Table 18). The mixture was incubated with a thermomixer (Table 4) at
97 °C for 3 min. Finally the extraction buffer (11.7 µl/tube) was added, protein
concentrations of the samples were measured (chapter 3.2.6.2) and stored at -80 °C.
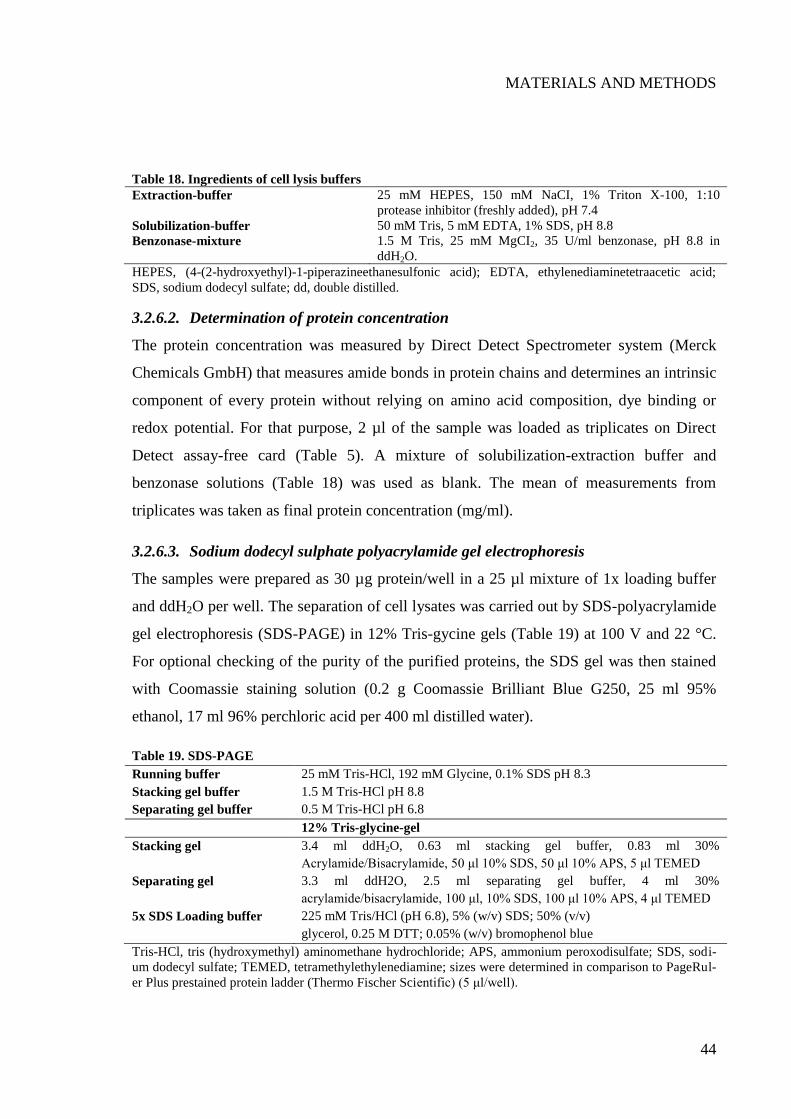
MATERIALS AND METHODS
44
Table 18. Ingredients of cell lysis buffers
Extraction-buffer 25 mM HEPES, 150 mM NaCI, 1% Triton X-100, 1:10
protease inhibitor (freshly added), pH 7.4
Solubilization-buffer 50 mM Tris, 5 mM EDTA, 1% SDS, pH 8.8
Benzonase-mixture 1.5 M Tris, 25 mM MgCI2, 35 U/ml benzonase, pH 8.8 in
ddH2O.
HEPES, (4-(2-hydroxyethyl)-1-piperazineethanesulfonic acid); EDTA, ethylenediaminetetraacetic acid; SDS, sodium dodecyl sulfate; dd, double distilled.
3.2.6.2. Determination of protein concentration
The protein concentration was measured by Direct Detect Spectrometer system (Merck
Chemicals GmbH) that measures amide bonds in protein chains and determines an intrinsic
component of every protein without relying on amino acid composition, dye binding or
redox potential. For that purpose, 2 µl of the sample was loaded as triplicates on Direct
Detect assay-free card (Table 5). A mixture of solubilization-extraction buffer and
benzonase solutions (Table 18) was used as blank. The mean of measurements from
triplicates was taken as final protein concentration (mg/ml).
3.2.6.3. Sodium dodecyl sulphate polyacrylamide gel electrophoresis
The samples were prepared as 30 µg protein/well in a 25 µl mixture of 1x loading buffer
and ddH2O per well. The separation of cell lysates was carried out by SDS-polyacrylamide
gel electrophoresis (SDS-PAGE) in 12% Tris-gycine gels (Table 19) at 100 V and 22 °C.
For optional checking of the purity of the purified proteins, the SDS gel was then stained
with Coomassie staining solution (0.2 g Coomassie Brilliant Blue G250, 25 ml 95%
ethanol, 17 ml 96% perchloric acid per 400 ml distilled water).
Table 19. SDS-PAGE
Running buffer 25 mM Tris-HCl, 192 mM Glycine, 0.1% SDS pH 8.3
Stacking gel buffer 1.5 M Tris-HCl pH 8.8
Separating gel buffer 0.5 M Tris-HCl pH 6.8
12% Tris-glycine-gel
Stacking gel 3.4 ml ddH2O, 0.63 ml stacking gel buffer, 0.83 ml 30%
Acrylamide/Bisacrylamide, 50 μl 10% SDS, 50 μl 10% APS, 5 μl TEMED
Separating gel 3.3 ml ddH2O, 2.5 ml separating gel buffer, 4 ml 30%
acrylamide/bisacrylamide, 100 μl, 10% SDS, 100 μl 10% APS, 4 μl TEMED
5x SDS Loading buffer 225 mM Tris/HCl (pH 6.8), 5% (w/v) SDS; 50% (v/v)
glycerol, 0.25 M DTT; 0.05% (w/v) bromophenol blue
Tris-HCl, tris (hydroxymethyl) aminomethane hydrochloride; APS, ammonium peroxodisulfate; SDS, sodi-
um dodecyl sulfate; TEMED, tetramethylethylenediamine; sizes were determined in comparison to PageRul-
er Plus prestained protein ladder (Thermo Fischer Scientific) (5 μl/well).

MATERIALS AND METHODS
45
3.2.6.4. Western blot
For the specific detection of a protein in a protein mixture, a Western blot analysis was
performed. After equilibration of the nitrocellulose membrane and the SDS gel for 10 min
in transfer buffer (25 mM Tris-HCl, 190 mM glycine, 20% methanol, pH 8.3), protein
transfer was carried out in a wet blot apparatus (Bio-Rad) at 4 °C for 1 h at 100 V. The blot
was blocked with 5% milk powder (Table 3) in TBST [50 mM Tris-HCl, 150 mM NaCl,
0.05% Tween-20 (Table 3), pH 7.4] for 1 h at room temperature on a shaker (Table 4).
Incubation with the primary antibodies was carried out in a suitable dilution (Table 7)
overnight at 4 °C. The peroxidase-coupled secondary antibody (1:1000 in 1% milk
powder, Table 5) was incubated after washing the membrane (6x, TBST) for 1 h at 22 °C.
After another washing step (6x, TBST), chemiluminescence detection of the proteins took
place: the membrane was wetted with 500 µl of developer solution [SuperSignal West
Femto Maximum Sensitivity Substrate (Table 6), luminol/enhancer solution and stable
peroxide solution were 1:1 mixed] for 5 min, and chemiluminescence in transilluminator
(Table 4) detected. The band intensities were analyzed by ImageJ.
3.2.6.5. Peptide detection in blood plasma
TAMRA-trictide (10 µM) was dissolved in 1% DMSO and completed with mouse blood
plasma (see chapter 3.2.7.2 for preparation). The blood plasma was incubated up to 48 h at
37 °C. At hour zero, as well as after 2, 4, 8, 12, 13, 24 h, and 48 h, 160 μl aliquots were
taken and precipitated with 60 µl of acetonitrile/99% ethanol (1:1) (30 min, 4 °C). After
centrifugation (20000xg, 15 min, 4 °C), supernatant was taken and filtered through
Nanosep 10K Omega filters (Table 5) by centrifugation (5000xg, 10 min, 17 °C) and
analyzed by SDS-PAGE. For the separation of the peptides with SDS-PAGE, 10 µl of the
filtrate was resuspended in 5x loading buffer (Table 19), denatured (5 min, 95 °C), cooled
on ice and separated in mini-protean TGX gel at 100 V and 22 °C (Table 4). The
fluorescence of TAMRA (Table 14) was detected in the gel documentation system and
measurement of band intensities quantified by the ImageJ software (Table 15).
Parallel to this experiment, stability of trictide in blood plasma was investigated.
Additional samples were prepared with trictide (800 µM) incubated [dissolved firstly in
DPBS-/- (10x)] in mouse blood plasma up to 48 h. After the separation of supernatant,
samples were filtered through 22 microns pipette tip filters (ZipTip C18 columns, Table 5)
and analyzed by mass spectrometry.
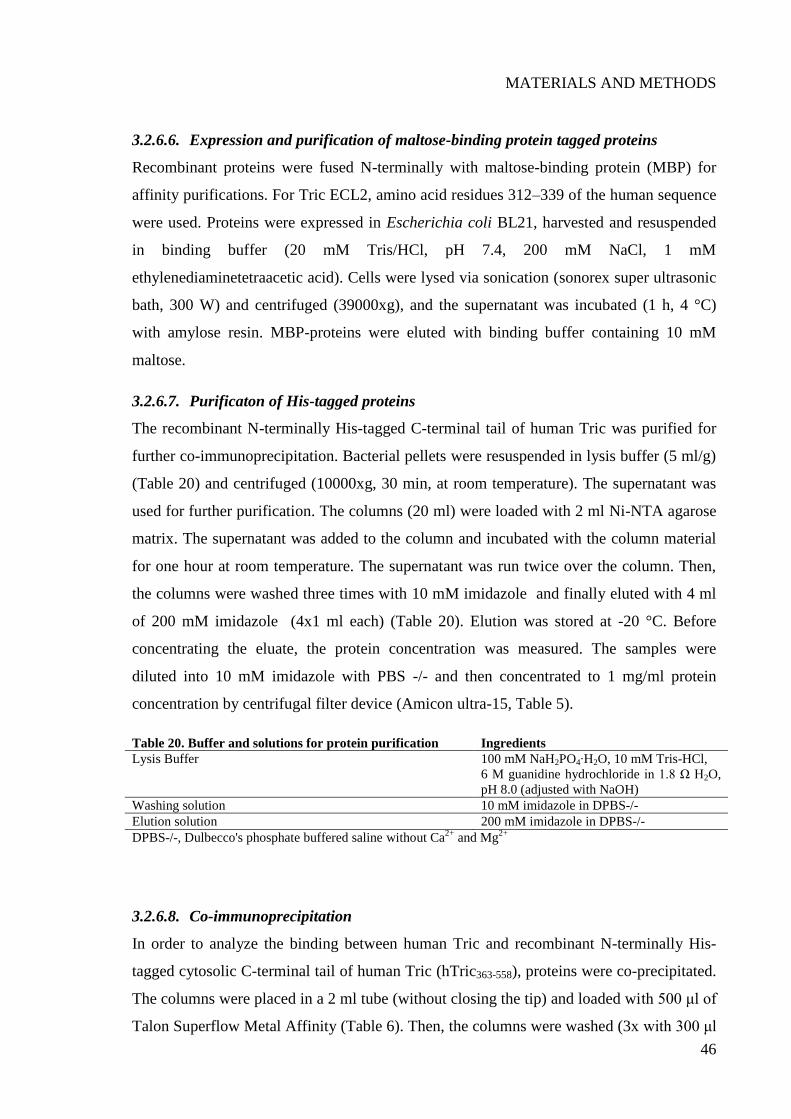
MATERIALS AND METHODS
46
3.2.6.6. Expression and purification of maltose-binding protein tagged proteins
Recombinant proteins were fused N-terminally with maltose-binding protein (MBP) for
affinity purifications. For Tric ECL2, amino acid residues 312–339 of the human sequence
were used. Proteins were expressed in Escherichia coli BL21, harvested and resuspended
in binding buffer (20 mM Tris/HCl, pH 7.4, 200 mM NaCl, 1 mM
ethylenediaminetetraacetic acid). Cells were lysed via sonication (sonorex super ultrasonic
bath, 300 W) and centrifuged (39000xg), and the supernatant was incubated (1 h, 4 °C)
with amylose resin. MBP-proteins were eluted with binding buffer containing 10 mM
maltose.
3.2.6.7. Purificaton of His-tagged proteins
The recombinant N-terminally His-tagged C-terminal tail of human Tric was purified for
further co-immunoprecipitation. Bacterial pellets were resuspended in lysis buffer (5 ml/g)
(Table 20) and centrifuged (10000xg, 30 min, at room temperature). The supernatant was
used for further purification. The columns (20 ml) were loaded with 2 ml Ni-NTA agarose
matrix. The supernatant was added to the column and incubated with the column material
for one hour at room temperature. The supernatant was run twice over the column. Then,
the columns were washed three times with 10 mM imidazole and finally eluted with 4 ml
of 200 mM imidazole (4x1 ml each) (Table 20). Elution was stored at -20 °C. Before
concentrating the eluate, the protein concentration was measured. The samples were
diluted into 10 mM imidazole with PBS -/- and then concentrated to 1 mg/ml protein
concentration by centrifugal filter device (Amicon ultra-15, Table 5).
Table 20. Buffer and solutions for protein purification Ingredients
Lysis Buffer 100 mM NaH2PO4∙H2O, 10 mM Tris-HCl,
6 M guanidine hydrochloride in 1.8 Ω H2O,
pH 8.0 (adjusted with NaOH)
Washing solution 10 mM imidazole in DPBS-/-
Elution solution 200 mM imidazole in DPBS-/-
DPBS-/-, Dulbecco's phosphate buffered saline without Ca2+
and Mg2+
3.2.6.8. Co-immunoprecipitation
In order to analyze the binding between human Tric and recombinant N-terminally His-
tagged cytosolic C-terminal tail of human Tric (hTric363-558), proteins were co-precipitated.
The columns were placed in a 2 ml tube (without closing the tip) and loaded with 500 μl of
Talon Superflow Metal Affinity (Table 6). Then, the columns were washed (3x with 300 μl

MATERIALS AND METHODS
47
of 10 mM imidazole in DPBS-/-) before being loaded with 500 μl of the concentrated
protein. The columns were completely sealed and left to incubate for 2 h at 8 °C. A
protein-free control was included for each protein sample. Afterwards, the supernatant was
removed and the columns were washed (3x with 300 µl of 10 mM imidazole). In the next
step, the columns (controls and samples) were each loaded with 300 μl cell lysates, sealed
and incubated overnight at 8 °C. The next day, the columns were washed (3x with 300 μl
of 10 mM imidazole in DPBS-/-) and transferred to a new 1.5 ml closable tube and loaded
with 80 μl of 200 mM imidazole for elution. The sealed columns were incubated at room
temperature for 45 min. Subsequently, the solutions were centrifuged (13000xg, up to 2
min, at room temperature) and the elution fraction was obtained. The final samples were
prepared for SDS-PAGE gel electrophoresis.
3.2.7. In vivo investigations in mice
The studies on mice were approved by the Office for Health and Social Affairs of Berlin
and carried out according to the valid German animal welfare regulations.
3.2.7.1. Peptide injections and detection of fluorescent dyes
C57BL/6N mice (10–19 weeks old, 18–23 g) were housed in MDC-Berlin animal facility,
kept on 12:12 h dark–light, and fed standard diet ad libitum according to German animal
welfare law in Berlin (G0030/13, LaGeSo).
For dye-uptake studies in organs, 800 µM of trictide dissolved in DPBS+/+ (3.6 µmol/kg)
were injected into the tail vein (i.v.). The injection volume was adjusted according to the
weight of the animals (for 22 g adult mouse, 100 μl of the fluorescent dye solution). After
4 or 24 h, 2% Na-fluorescein (376 Da, w/v, dissolved in DPBS+/+) was administered (i.v.).
After 10 min, mice were anesthetized with i.p. injection of anesthesia mixture (0.18 mg/g
ketamine and 0.024 mg/g xylazine in distilled water, 350 µl/mice). Under deep anesthesia,
mice chests were opened, hearts were prepared by insertion of a butterfly cannula in left
ventricle and perfused transcardially with 25 mL DPBS+/+ containing 6250 IU heparin
(flow rate 1.5 ml/min). The harvested brain, kidney and a lobe of liver were frozen in 2-
methylbutane on dry ice for 7 min and stored at -80 °C until further use.
MATERIALS AND METHODS
48
For the biochemical detection of the fluorescent dyes, 100 mg of the perfused brain, kidney
or liver were homogenized on ice in 250 μl DPBS+/+ (Dounce tissue homogenizer), 250 μl
of 60% trichloroacetic acid were added, and the homogenate was left for overnight
incubation at 4 °C. After centrifugation (18000xg, 20 min, 4 °C), the fluorescence intensity
of the Na-fluorescein within the supernatant was measured in 96-well plates at the
appropriate wavelength (Table 14) by a TECAN-reader (Table 4). A set of standard
samples was included within the same plate, and a standard curve obtained from those
samples was used to calculate the amount of Na-fluorescein uptake related to weight of
organs (µmol/kg).
3.2.7.2. Obtaining blood plasma
C57BL/6 mice were sacrificed immediately after cervical dislocation, and cardiac blood
was taken from the left ventricle. The blood was incubated with heparin (25 IU/ml) and
immediately mixed and centrifuged (750xg, 15 min, at room temperature). The yellow
fraction on top of the precipitate was transferred to a test tube and immediately used for
investigations of peptide stability as first use preference. Otherwise the fraction was stored
at -20 °C for later use.
3.2.8. Molecular biological methods
3.2.8.1. Quantitative real time polymerase chain reaction
Total RNA was isolated from tissue or eukaryotic cells by using the Universal RNA
Purification Kit (Table 6), transcribed into cDNA (complementary DNA) using the
Maxima First Strand cDNA Synthesis Kit (Table 6) for quantitative real time polymerase
chain reaction (qRT-PCR) and stored at -20 °C. The mouse- or human-specific primers
(Table 9) were designed by Philipp Berndt and tested for its binding specificity using Blast
(Table 15).
qRT-PCR was carried out in the StepOne Real-Time PCR System (Life Technologies
GmbH), according to the cycling protocol in Table 19, using the Luminaris Color HiGreen
high ROX qPCR Master Mix. The Master Mix contained a Taq polymerase that emits a
fluorescent signal upon binding to the double stranded cDNA. During qRT-PCR the
detected fluorescence increases proportionally to the DNA accumulation.

MATERIALS AND METHODS
49
20 μl of the reaction mix were pipetted according to Table 21 in each well of a MicroAmp
Fast Optical 96-well reaction plate (Table 5). For data analyses and export the StepOne
Software v2.2.1 (Table 15) was used. In order to evaluate the data, the cycle threshold (Ct)
value was set to 0.4, within the linear phase of the logarithmic amplification plot for all
tested primers. Ct value gives the number of cycles completed in order to detect a real
signal from the samples. Threshold is determined as a level above background
fluorescence. In order to calculate relative expression of the examined genes, Ct values
were normalized to β-actin (Actb, as a housekeeping gene): Actb (ΔCt = Cttarget - CtActb).
To compare the expression between two groups, ΔΔCt (ΔΔCt = ΔCtB - ΔCtA) was
calculated. cDNA amplification during the PCR is exponential. A single peak at the
calculated temperature indicated specific amplification of cDNA; therefore, unspecific
products were identified by melting curves.
Table 21. qRT-PCR protocol
Component Concentration Cycling protocol
Luminaris Color HiGreen
qPCR Master mix (2x)
1x Step Temperature
(°C)
Time Number of
cycles
Primer (fw) 0.3 µM Uracil-DNA
glycosylase
pre-treatment
50 2 min 1
Primer (rev) 0.3 µM Initial
denaturation
95 10 min 1
cDNA ≤ 0.5 ng/µl Denaturation
Annealing/
95
60
15 s
60 s
40
qRT-PCR, quantitative real time polymerase chain reaction; fw, forward; rev, reverse; cDNA,
complementary DNA.
3.2.8.2. Molecular cloning
A thermocycler (Bio-Rad Laboratories GmbH) was used to clone recombinant N-
terminally His-tagged cytosolic C-terminal tail of human Tric (hTric363-558) DNA from
N-terminally YFP-tagged human Tric cDNA using primers (Table 11). The composition of
PCR mixture and the thermal cycling conditions for a reaction volume of 30 μl are shown
in Table 20. The PCR product was purified using the DNA Clean and Concentrator-5 kit
(Table 4) according to the supplier’s manual. The concentration was photometrically
determined using the NanoDrop 2000c (Thermo Fisher Scientific GmbH).

MATERIALS AND METHODS
50
Table 22. PCR protocol
Component Concentration Cycling protocol
10x key buffer 1x Step Temperature
(°C)
Time Number of
cycles
dNTP mix 0.2 mM Initial
denaturation
95 2 1
Template DNA 0.5 ng/µl Denaturation 95 30 s 35
Primer (fw) 0.5 µM Annealing 65 45 s
Primer (rev) 0.5 µM Elongation 72 1
Taq DNA
Polymerase
1 µl Final
elongation
72 5 1
PCR, polymerase chain reaction; dNTP, deoxynucleotide fw, forward; rev, reverse; cDNA, complementary
DNA.
In order to ligate PCR product with the pET-28a (+) expression vector (Addgene, USA),
both DNA and target vector were digested with Hind III and Not I fast digest restriction
enzymes (Table 6). The restriction was performed in a volume of 40 μl for the PCR
product or 30 μl for the plasmid DNA (Table 23) at 37 °C for at least 4 h. After restriction,
the PCR product and the plasmid DNA were separated by agarose gel electrophoresis.
Agarose gel bands that were observed at the expected size were cut out. The DNA was
extracted using the Zymoclean Gel DNA Recovery Kit (Table 6) following the product
protocol. The concentration and the degree of purity of the extracted DNA were
determined by photometric measurement of the absorption at 260 and 280 nm using the
NanoDrop 2000c.
Table 23. Protocol of DNA restriction
Restriction of the PCR product Restriction of the plasmid product
Component Amount Component Amount
PCR product 30 µl Plasmid DNA 20 µl
Fast digest buffer (10x) 4 µl Fast digest buffer (10x) 3 µl
Fast digest enzyme (HindIII) 2 µl Fast digest enzyme (HindIII) 2 µl
Fast digest enzyme (NotI) 2 µl Fast digest enzyme (NotI) 2 µl
PCR, polymerase chain reaction.
The ligation of the PCR product and the linearized plasmid DNA was performed in 20 μl
of reaction mix (Table 24) for 14 h at 16 °C. The ligase was inactivated by heating at 65 °C
for 10 min.
MATERIALS AND METHODS
51
Table 24. Protocol of Ligation
Component Concentration
Ligase buffer (10x) 1x
Plasmid DNA 5 ng/µl
PCR product Molar ratio of 5:1 plasmid DNA
T4 DNA ligase 20 units/µl
3.2.8.3. Preparation of electrocompetent bacteria
An E. coli BL21 culture in 500 ml LB medium was grown (200xg, 37 °C, without
antibiotic) until it reached an OD 600 nm=0.6. After cooling for 30 min on ice and
centrifuging (3000xg, 10 min, 4 °C), the pellet was resuspended in 160 ml ice-cold
distilled water, divided into four portions and centrifuged again (1500xg, 15 min, 4 °C).
Supernatants were discarded and pellet was resuspended with 40 ml of ice-cold distilled
water and centrifuged (1500xg, 15 min, 4 °C). The pellet was resuspended in 10%
glycerol. After centrifugation for the last time (1500 g, 15 min, 4 °C), it was resuspended
in 1 ml of ice-cold 10% glycerol, aliquoted and stored at -80 °C.
3.2.8.4. Transformation of electrocompetent bacteria
An aliquot of 150 μl of electrocompetent bacteria was thawed on ice and transferred into
an electroporation cuvette together with 0.5 μl of the plasmid DNA. The bacteria were
exposed to 1.8 kV, allowing the cells to take up the plasmid. The transformed bacteria
were immediately incubated with 500 μl LB medium at 37 °C for 1 h. Selection of positive
clones was provided by kanamycin (100 μg/ml) containing agar plates. The bacteria was
plated on agar plates and incubated overnight at 37 °C. The next day we picked positive
clones from single colonies. Mini-cultures (5 ml of LB medium with 100 μg/ml
Kanamycin) were inoculated and left for overnight incubation (200xg, 37 °C). Those mini-
cultures were either used for preparation of glycerol stocks or purification of plasmid DNA
by DNA purification kits (Table 6).
3.2.8.5. Site directed mutagenesis
Aromatic residues in tricellulin extracellular loop 2 (Y322, Y323, F326, F334) were
mutated into alanine or isoleucine (Chapter 4.3.8). Primers that carry the modified codon
were given in Table 10. The PCR master mix with a volume of 80 μl (Table 25) contained
an AccuPOL DNA Polymerase (Table 6) with high proofreading capacity for replication of
the plasmid DNA. Gradient PCR program (51, 51.3, 52.5, 54.2, 56.5, 59.1, 61.8, 64.5, 67,

MATERIALS AND METHODS
52
69.1, 70.6, 71.5 °C) was applied due to high variation between the melting temperatures of
primers. The PCR product was purified using the DNA Clean and Concentrator-5 kit
(Table 6) following the product instructions.
Table 25. Gradient PCR protocol
Component Concentration Cycling protocol
AccuPol buffer
(10x)
1x Step Temperature
(°C)
Time Number of
cycles
dNTP mix 0.2 mM Initial
denaturation
95 2 min 1
Template DNA 500 ng/rxn Denaturation 95 1 min 35
Primer (fw) 0.2 µM Annealing 51-71.5 °C 30 s
Primer (rev) 0.2 µM Elongation 72 11 min
Taq DNA
Polymerase
0.025 U/µl Final
elongation
72 5 min 1
PCR, polymerase chain reaction; dNTP, deoxynucleotide; rxn, reaction; fw, forward; rev, reverse; cDNA,
complementary DNA.
3.2.9. Biophysical methods
3.2.9.1. Circular dichroism spectroscopy
The circular dichroism (CD) spectroscopy was applied to detect possible structural
differences between effective and ineffective peptides. The technique is based on optically
active substances absorbing different degrees of circularly polarized light. Therefore,
tricellulin peptides (50 μM) were dissolved in phosphate buffer (10 mM, pH 7.2) in order
to determine the proportion of secondary structural elements (α-helix, β-sheet, β-loop). The
remaining portion was considered disordered. By adding the surfactant SDS (0.5 mM in
phosphate buffer) below the critical micelle concentration (9-10 mM, (Niraula et al., 2014),
a possible induction of β-sheet structures should be examined (Zhong and Johnson, 1992).
Above the critical micelle concentration, SDS led to the induction and stabilization of α-
helices (Gopal et al., 2012). Trifluoroethanol (60% TFE in phosphate buffer) has the
property of favoring induction of α-helices (Buck, 1998). The measurements were taken
with the spectropolarimeter J-720 (Table 4), at 22 °C, from 190-260 nm, in 0.1 cm quartz
cuvettes (Table 5). Per measurement, 8 accumulations were made with a resolution of 0.1
nm and a measuring speed of 20 nm/min. For analysis, the data was subtracted from the
buffer-based spectrum. Molar residual ellipticity [θ] was calculated considering the amino
acid number using the Spectra Manager program (Corrêa and Ramos, 2009): characteristic

MATERIALS AND METHODS
53
of α-helical elements in L-AS peptides are ellipticity minima at 208 and 222 nm, and a
maximum at 192 nm. For β-sheet structures, there is a minimum at 217 nm and a
maximum at 195 nm. Unordered elements show a minimum <200 nm (Greenfield and
Fasman, 1969). The secondary structural components of the peptides were determined with
the Spectra Manager using reference spectra (Yang, Wu & Martinez, 1986).
[𝜃] = 𝜃
10 ∙𝐶 ∙𝑑 (deg∙ 𝑐𝑚2 ∙ 𝑑𝑒𝑐𝑖𝑚𝑜𝑙−1)
[𝜃]𝑀𝑅𝐸 = 𝜃
𝑛 (deg∙ 𝑐𝑚2 ∙ 𝑑𝑒𝑐𝑖𝑚𝑜𝑙−1)
𝜃 Ellipticity (mdeg)
C Molar concentration (mol·l-1
)
d Layer thickness of the cuvette (cm)
n Number of the amino acids
3.2.9.2. Three-dimensional structure prediction of peptides
3D-structure model of trictide peptides was prepared using the program Pepfold
(http://bioserv. rpbs.univ-paris-diderot.fr/PEP-FOLD/) (Shen et al., 2014)Thévenet et al.,
2012). Different models varying in their 3D-structure were obtained; models fitting best to
experimental data were selected for further analysis. To gain insight into the binding
mechanism of trictide, we created docking models of the Pepfold trictide model to the
iTasser (Table 15) model of human Tric ECL2. The suggested binding surfaces were based
on the hydrophobic potentials of the two structures and were depicted using Discovery
Studio Visualizer (Table 15).

MATERIALS AND METHODS
54
3.2.9.3. Mass spectroscopic detection of peptides in the blood plasma
For mass spectrometric detection of TAMRA peptides in blood plasma, samples were
prepared according to procedures detailed in chapter 3.2.6.5, concentrated (rotary vacuum
concentrator, 45 °C, 5.5 torr/min vacuum), and dissolved in 5% acetonitrile/0.1% TFA in
an ultrasonic bath (Table 4). The sample was desalted and re-concentrated using ZipTip
C18 columns (Table 5). After washing (3x, 50% acetonitrile, 0.1% TFA) and equilibration
(3x, 0.1% TFA, pH 7.0), the columns were loaded with the sample by pipetting 10 times.
After washing (3x, 0.1% TFA, pH 7.0), the sample was eluted in 1.5 µl 65%
acetonitrile/0.3% TFA directly on an Opti-TOF 384er plate (Thermo fischer scientific). For
each sample, 0.5 μl of α-cyano-4-hydroxycinnamic acid (5 mg/ml in 75% acetonitrile/0.3%
TFA) was added. Peptides were detected with the mass spectrometer (AB SCIEX TOF /
TOF 5800, SCIEX, Germany).
3.2.10. Statistsics
Data analysis and generation of graphs were achieved by employing GraphPad Prism®
5.04 and Microsoft Excel 2010 (Table 15). Results are given as mean±SEM. One-way
analysis of variance (ANOVA) followed by Dunn’s multiple comparison test were used to
determine significant difference between two groups. The two-way ANOVA test followed
by Bonferroni’s comparison test was used to determine significant differences between
more than two groups. Differences were considered significant if p≤0.05 for n ≥4 (*
p≤0.05, ** p≤0.01, *** p≤0.001, ****p≤0.0001).

RESULTS
55
4. RESULTS
4.1. TRICELLULIN IS HIGHLY EXPRESSED IN KIDNEY AND COLON
For selection of suitable model systems for tricellulin derived peptidomimetic research, the
expression of tricellulin was compared among different organs. Tric mRNA levels were
quantified in several organs isolated from WT mice: brain (cortex and whole), eye, kidney
(cortex and medulla), heart, lung, liver, testis, spleen, jejunum, duodenum, ileum and colon
(Table S1). The lowest Tric expressing organs were spleen, brain cortex, testis and whole
brain. Organs expressing Tric at medium levels were heart, ileum, jejunum, lung and
duodenum. Colon was the highest Tric expressing organ, followed by kidney medulla,
kidney cortex, liver and eye (Fig. 4.1). Due to high expression in the colon, we chose colon
carcinoma cell line (Caco-2) as a cell culture model for modulating barrier permeability.
Fig. 4.1 Tricellulin is highly expressed in most of the epithelial tissue dominant organs and less in
endothelial tissue dominant organs of mice. Messenger RNA (mRNA) expression of wild-type mice
organs was given. Four organs with the lowest tricellulin expression were given as blue bars, and the rest of
the organs expressing tricellulin at higher levels were given as red bars. mRNA normalized to β-actin (Actb)
(ΔCt = Ctjunction protein - Ctactin); Ct, Cycle threshold; mean±SEM, n=8.

RESULTS
56
4.2. TIGHT JUNCTION PROTEINS WERE DETECTED IN MOUSE AND
HUMAN BRAIN SECTIONS
The aim of the following experiment is to observe tricellular cell-cell contacts particularly
in mouse brain capillaries to reveal localization of Tric with respect to other TJ proteins.
Imaging of Tric in brain tissues is an unsolved problem due to the low expression levels
and the unique morphology of tricellular contacts of capillary endothelial cells in general
and of brain capillary specifically. Human and mouse brain slices were immunostained to
observe localization of Tric (3-cell TJ marker), Cldn5 (2-cell TJ marker), Occl (2-cell TJ
marker), ZO-1 (general junction marker) and LSR (3-cell TJ marker). Occl and Cldn5
expression are well-described at the BBB, and their expression was known to be higher
than that of other TJ proteins (Mariano et al., 2013; Pan et al., 2017). That is why they
were used as co-staining for confirmation of brain capillaries.
Fig. 4.2 Tricellulin localizes throughout cell-cell contacts and is enriched at tricellular contacts in Z-
direction of the mouse brain capillaries. (A) Immunohistochemical images of brain slices (8 µm
cryosections) were given. Brain capillaries from region of forebrain cortex were stained with rabbit anti-
tricellulin (Tric), mouse anti-occludin (Occl) and mouse anti-claudin5 (Cldn5) antibodies. Tricellular contact
points (white arrows). (B) 3D reproduction of Z-stacks. Tricellulin signal extends via Z-direction (see
intersection points on side windows). Tricellular contacts were emphasized in 2X enlarged images.

RESULTS
57
Both Occl-Tric and Cldn5-Tric co-stainings gave signal along the bicellular contacts of the
capillary. Tric signal (green) was stronger at points where three capillary contacts join
together (Fig. 4.2A, white arrows). Three-dimensional reproduction using Z-stack images
demonstrated the extension of dot-like Tric signals (yellow) through the Z-direction at
tricellular contact of the capillaries (Fig. 4.2B, insets).
The second objective of this chapter was to visualize localization of tricellular TJ markers
in human brain microvessels. Tric and LSR both localize at tricellular contacts (Iwamoto
et. al., 2014; Sohet et al., 2015) while Occl and ZO-1 proteins localize to bicellular
capillary contacts. Tric was expressed and observed at tricellular contacts with dot-like
structure (Fig. 4.3A, white arrows). Labelling with LSR-ZO1 antibody combination
revealed that LSR was also expressed and localized precisely at tricellular contacts of brain
capillaries (Fig 4.3A, green arrows).
Fig. 4.3 Tricellulin and lipolysis stimulated lipoprotein receptor (LSR) are expressed in human brain
capillaries and localize in contacts between tricellular membrane surface patches. Immunohistochemical
images of human brain cortex slices (8 µm cryosections) were stained with mouse anti-occludin (Occl),
rabbit anti-tricellulin (Tric), rabbit anti-LSR and rat anti-zonula occludens protein 1 (ZO-1) antibodies. (A)
Co-staining of Occl and Tric: tricellular Tric localization (white arrows), co-staining of LSR and ZO-1:
tricellular LSR localization (green arrows). (B) 3D reproduction of Z-stacks. Tricellulin (white arrow) and
LSR (green arrow) signal extended through Z-direction. Tricellular contacts were emphasized in 2X enlarged
images.

RESULTS
58
After the three-dimensional reproduction using Z-stack images, the distinct tricellular
localization of LSR (green arrows) and enrichment of Tric (white arrows) extending in Z-
direction was observed relative to the bicellular capillary contacts (Fig. 4.3B). Imaging TJ
proteins within healthy brain tissues enabled us to compare their localization and
expression pattern to tissues of the peptide administered animals.
4.3. TRICELLULIN PEPTIDOMIMETIC TO PERMEABILIZE CELL BARRIER
4.3.1. Recombinant tricellulin extracellular loop two affects barrier integrity
Recombinant MBP fused ECL2 of Tric was used to investigate its effect on the
transepithelial electrical resistance (TER) of Caco-2 cells. MBP treated cells (negative
control) displayed a non-significant decrease of TER to 78 ± 18%, and furthermore 90 µM
MBP-Tric ECL2 treatment decreased to 78 ± 10%. However, 280 µM MBP-Tric ECL2
clearly dropped TER to 53 ± 6% after 24 h (Fig. 4.4A).
In order to identify changes at protein level in parallel to the TER changes, transwell filters
were investigated immunocytochemically. MBP-Tric ECL2-free media treated samples
showed typical Occl localization at bicellular contacts and Tric localization at tricellullar
contacts (Fig. 4.4B, green arrowheads). Confocal microscopy resolution did not enable
distinct localization of Occl and Tric at tricellular contacts (see chapter 4.3.5.2). That is the
reason for the overlapping (yellow) signal of Occl (red) and Tric (green) at tricellular
contacts (Fig. 4.4B, see enlarged images). Occl staining was sharp and continuous in the
bicellular area. Samples treated with 280 µM MBP did not change normal localization of
both proteins. 90 µM MBP-Tric ECL2 treatment resulted in internalization of vesicles and
submembranous attachment of Occl protein along bicellular regions of cells. Tric signals
were localizing at bicellular cell membrane (Fig. 4.4B, green arrows) and also at
internalized vesicles (yellow arrows). But there were still Tric molecules localizing at
tricellular contacts (Fig. 4.4B, green arrowheads). 280 µM MBP-Tric ECL2 increased the
degree of internalization for both Occl and Tric. Occl was observed at internalized vesicles
together with Tric (Fig. 4.4B, yellow arrows) and its signal was decreased at cell
membrane compared to the untreated sample. Tric localization was also observed at
bicellular area (green arrows) that was unusual compared to the untreated control (Fig.

RESULTS
59
4.4B). Due to the clear effect of recombinant Tric ECL2 on paracellular localization
tightness reduction, Tric ECL2 region has been selected as an approach for overcoming
cellular barriers at bTJs and tTJs, with the potential to improve drug delivery transiently.
Fig. 4.4 Administration of the recombinant extracellular loop 2 (ECL2) of human tricellulin (Tric)
causes redistribution of Tric and occludin (Occl) from the plasma membrane to the cytosol and
weakens the paracellular barrier of human colon carcinoma epithelial (Caco-2) cells. (A) Transepithelial electrical resistance (TER) after 24 h of incubation with MBP (maltose binding protein) or
MBP–Tric ECL2. One-way ANOVA test was applied prior to Dunnett’s comparison post hoc test.
Mean±SEM, n=3, * P < 0.01 relative to untreated control. (B) Immunocytochemistry showed effects of
MBP–Tric ECL2 compared with MBP-Tric ECL2-free (untreated) and MBP treatment alone; incubation
time: 24 h. Green arrowheads indicate tricellular localization of Tric; yellow arrows indicate intracellular
Tric and Occl; green arrows indicate dot-like localization of Tric at the bicellular plasma membrane.
4.3.2. The synthetic peptide trictide affects human epithelial colorectal
adenocarcinoma cell line 2
The experiments with MBP-Tric ECL2 showed promise for further development of a Tric
ECL-based approach to cell barrier modulation. Trictide, a synthetic peptide, was derived
from human Tric ECL2 due to reproducibility and pharmaceutical applications. The effect

RESULTS
60
of trictide was investigated in a variety of epithelial and endothelial cell lines chosen
according to their TJ protein expression profile. Caco-2 cells were used preferentially in
this chapter for trictide investigations due to their high Tric and broad transmembranous TJ
protein’s expression profile (Berndt, 2017).
4.3.2.1. Trictide has a concentration dependent effect on cell barrier tightness and a
small concentration-difference between cytotoxicity and barrier opening
A variety of trictide concentrations were tested in filter experiments in order to analyze
trictide’s concentration dependency on tightness of cell barrier. TER was measured after
16 h of incubation with the peptide. TER values relative to the untreated sample (194±7
Ω·cm2) are given in Fig. 4.5A.
50 µM trictide showed insignificant increase (11.3%) and absolute TER value of 216±9
Ω·cm2. 100 µM trictide decreased TER to 90% (174±8 Ω·cm
2). 125 µM trictide exhibited
80% of TER (154±2 Ω·cm2). Only 150 µM trictide and 200 µM trictide significantly
decreased TER to 56% (109±13 Ω·cm2) and 21% (154±2 Ω·cm
2),
respectively. 150 µM
scrambled trictide displayed TER of 94% (181±7 Ω·cm2) (Fig. 4.5A). Consequently, a
remarkable trictide action was recorded with concentrations ≥ 150 µM.
Fig. 4.5 150 µM non-cytotoxic trictide concentration weakens the paracellular barrier of filter-cultured
human colon carcinoma epithelial (Caco-2) cells after 16 h of incubation. (A) Transcellular electrical
resistance (TER) values of trictide and scrambled trictide are given in comparison to peptide-free control
(untreated). n=6. (B) Cell viability measurement with MTT [3-(4.5-dimethylthiazol-2-yl)-2.5-
diphenyltetrazolium bromide] was applied for cells that were treated with the same concentrations as for TER
measurements. As positive control, Triton X-100 was included, n=4. (A-B) One-way ANOVA test was
applied prior to Dunnett’s comparison post hoc test. Mean±SEM, *** P < 0.001 relative to untreated control.

RESULTS
61
In order to measure cell viability levels after peptide administration, MTT assay was used.
Percentages of cell viability compared to untreated control were: 50 µM (104±2%), 100µM
(107±2%), 125 µM (106±3 %), 150 µM (90±2%), 200 µM (64±2%), scrambled trictide
(105±7%), and 0.1% triton (37±4%) (Fig. 4.5B). Therefore, ≤150 µM trictide as well as the
scrambled peptide were not cytotoxic, and higher concentrations of trictide should be
avoided as they might be toxic.
4.3.2.2. The effect of trictide on the impedance of the cell barrier
Changes in cell impedance due to trictide administration were measured by electric cell-
substrate impedance sensor (ECIS) over time, which allowed calculation of TER. 150 µM
trictide exhibited an increasing resistance up to 163±17% over 16 h, and then the TER
drastically decreased to 104±16% after 47 h. 100 µM of trictide caused increase in TER
between 16 and 47 h from 110±2 % to 142±4%. Resistance after scrambled trictide
remained almost the same at 0 h (86±4%), 16 h (82±7%) and 47 h (83±8%). Thus, trictide
appeared to be active after 16 h of incubation; scrambled trictide did not show any effect
on the resistance during the same period of time (Fig. 4.6).
Fig. 4.6 Trictide reversibly influences the barrier of human colon carcinoma epithelial (Caco-2) cells.
Effect on transcellular electrical resistance (TER) upon 100 µM and 150 µM trictide and 150 µM scrambled
trictide administration compared to peptide-free medium (untreated). Measurements were taken by electric
cell-substrate impedance sensor allowing calculation of TER. The graph initiated with peptide
administration; at 47 h peptide containing medium was exchanged for peptide-free medium. Total incubation
time, 70 h; dotted lines, time points of statistical calculations; two-way ANOVA test was applied prior to
Bonferroni’s comparison post hoc test; mean±SEM; n=4; ** P ≤ 0.01 (47 h compared to 16 h), *** P ≤ 0.001
(versus untreated control).

RESULTS
62
At 47 h, the recovery process was initiated, by exchanging the peptide-containing medium
for peptide-free medium. The 150 µM trictide treated sample exhibited an increase of TER
up to 136±30% at 69 h. This finding is an indicator of cell barrier recovery followed by
removal of peptide. The 100 µM trictide group exhibited slight decline of TER from 142%
at 47 h to 138 ± 9% at 70 h. Scrambled trictide did not show any change in TER after the
addition of peptide-free medium (Fig. 4.6).
The data displayed unexpected TER increase at 16 h, which would indicate barrier
tightening. ECIS measures cellular impedance that reflects transcellular resistance in an
alternating current circuit. The dissimilarity between chopstick measurements and ECIS
could be due to this technical difference. Repetition of experiment is necessary to confirm
this effect.
4.3.2.3. Trictide opens the cellular barrier for molecules up to 10 kDa.
Filter experiments always showed the reduction of transcellular electrical resistance by
trictide. Permeation measurements were performed in order to reveal the size of the
opening in the barrier. Earlier, the tricellular central sealing tube was calculated as a radius
of approximately 5 nm, which allows for the passage of globular macromolecules with a
molecular weight of up to 10 kDa (Krug, et. al. 2009; Staehelin, 1973). Paracellular
permeability for passage of small molecules and large molecules was measured with
fluorescent tracers (LY, 0.45 kDa; FD10, 10kDA, FD40, 40 kDa).
It was observed that 100 µM trictide non-significantly reduced the passage of small
molecules to 60±11%. 125 µM trictide showed no change in permeability (106±29%).
Passage increased up to 225±26% with 150 µM trictide. 150 µM scrambled trictide did not
considerably affect permeability (78±9%). Untreated sample showed basis permeability
coefficient for small molecules at 31±5·10-10
cm/s throughout the observation (Fig. 4.7A).
Paracellular permeability measurements for large molecules like FD10 showed for 100 µM
trictide 65±15% passage of larger molecules, which is not significant relative to untreated
control. 125 µM trictide (92±32%) and 150 µM scrambled trictide 98±22% did not affect
passage at all. However, the degree of paracellular permeability for 10 kDa sized
molecules increased to 221±54% with 150 µM trictide, which was more than 2 times the
permeability of the untreated control. Untreated cells showed control permeability
coefficient for the passage of large molecules at 13±2·10-10
cm/s (Fig. 4.7B).

RESULTS
63
The degree of paracellular permeability for much larger molecules like FD40 was
measured as: 100 µM trictide (53±34%), 125 µM trictide (66±21%), 150 µM trictide
(108±30%), and 150 µM scrambled trictide (120±49%). None of the concentrations
significantly affected permeability towards 40 kDa molecules. The untreated sample
exhibited a permeability coefficient of 1.4±1·10-10
cm/s for those much larger molecules
(Fig. 4.7C).
Fig. 4.7 150 µM of trictide opens the paracellular barrier of human colon carcinoma epithelial (Caco-2)
cells for small and larger molecules up to 10 kDa. (A) Effect of trictide and scrambled trictide on
paracellular permeability coefficient of lucifer yellow (0.4 kDa). (B) FITC (fluorescein isothiocyanate)
Dextran 10 kDa. (C) FITC Dextran 40 kDa. Values were related to substance-free control (untreated) and
given as percentage; total incubation time: 16 h; ns, non-significant. One-way ANOVA test was applied prior
to Dunnett’s comparison post hoc test. Mean±SEM, n=5, ** P < 0.01, *** P < 0.001
Consequently, 150 µM was the only concentration that caused a significant increase in
permeability of small and larger molecules. However, there was no opening for a 40 kDa
molecule to pass.
4.3.2.4. D-amino acid derivative of trictide is not effective.
Substitution of physiological L-amino acids with non-physiological D-amino acids might
decrease the substrate recognition and binding affinity by proteolytic enzymes (Di, 2015)
and may increase stability of respected peptide. For that reason, a trictide with D-
conformation was synthesized. Initial experiments were executed with higher
concentrations than used for L-trictide such as 200 and 300 µM. Even those high
concentrations did not cause any drop of TER or any barrier opening activity (Fig. 4.8A).
Likewise paracellular permeability of 10 kDa molecules did not increase due to the
incubation with D-trictide (Fig. 4.8B).

RESULTS
64
Fig. 4.8 D-amino acid trictide (D-trictide) does not have an effect on transcellular barrier tightness of human colon carcinoma epithelial cells. (A) Transepithelial electrical resistance (TER) (B) Paracellular
permeability of FITC (fluorescein isothiocyanate) Dextran 10 kDa. (A-B) Values were related to substance-
free medium (untreated). Total incubation time: 16 h. One-way ANOVA test was applied prior to Dunnett’s
comparison post hoc test. Mean±SEM, n=3, ns: non-significant, versus untreated control.
4.3.2.5. Trictide affects bicellular and tricellular tight junction proteins
In order to be acquainted with alterations at protein level and to investigate how individual
TJ proteins were affected by trictide, immunocytochemistry was applied. It was
stimulating to examine alterations of Occl and Tric together due to their compensating
regulation over each other (Raleigh et al., 2010) Occl-Cldn1 and Tric-Cldn1 co-stainings
were selected due to information in the literature that affirms the contribution of Cldn1 to
the enrichment of Occl and Tric at cell-cell contacts (Cording et al., 2013). Tric-LSR co-
staining was included considering that both LSR and Tric molecules are required for
normal tTJ formation and barrier integrity (Masuda et al., 2011). As described in detail in
chapter 4.3.2.1, 150 µM trictide was the active concentration in barrier opening of Caco-2
cells. But at cellular level, we observed that this concentration was altering localization of
TJ proteins too drastically and making it impossible to observe small modifications of
individual proteins (Fig. 4.9). That is why mainly 100 µM of trictide was applied as a
milder concentration during the following experiments.

RESULTS
65
Fig. 4.9 See figure legend on the next page.

RESULTS
66
Fig. 4.9 Proteins related to the tricellular tight junctions are strongly affected by 16 h treatment with
trictide. (Continuation of A and B from page 11) Human epithelial colorectal adenocarcinoma cells were
grown until confluency and then incubated with peptide-free (untreated), scrambled peptide and trictide
containing medium. Z-stack images were taken by confocal laser scanning microscopy and maximum
intensity Z-projection method was performed. (A) Occludin (Occl) and tricellulin (Tric) co-stainings: In the
untreated and scrambled trictide treated sample, Tric was localized to tricellular tight junctions (tTJs) (yellow
arrowheads), whereas Occl was localized to bicellular tight junctions (bTJs). After 100 µM trictide treatment,
Occl and Tric were internalized (white arrows). Tric localization was extended to bTJs after both 100 and
150 µM trictide treatments (green arrowheads). (B) Lipolysis-stimulated lipoprotein receptor (LSR) and Tric
co-stainings: In the untreated and scrambled trictide treated sample, Tric and LSR localized exclusively to
tTJs (yellow arrowheads). Trictide addition led to co-internalization of Tric and LSR (white arrows), and to
extended signals of Tric and LSR towards bTJs (green arrowheads). (C) Occl and claudin-1 (Cldn1) co-
stainings: In the untreated and scrambled trictide treated sample, Cldn-1 and Occl localized exclusively to
bTJs (green arrowheads). After trictide treatment, Cldn-1 and Occl co-internalized (white arrows), and
concentrated signals appeared around tTJs (red arrowhead).
In untreated samples, Tric localizes as a dot-like structure where 3-cells come together,
while Occl localizes mainly at cell borders where 2-cells meet (Fig. 4.9A, yellow
arrowheads). After treatment with 100 µM trictide for 16 h, immunocytochemical stainings
revealed discontinuous Occl staining and elongated Tric staining through bicellular plasma
membrane (Fig. 4.9A, green arrowheads).

RESULTS
67
LSR and Tric signals of untreated and scrambled trictide treated samples were observed as
yellow dots at tricellular contacts (Fig. 4.9B, yellow arrowheads). Samples labelled with
LSR and Tric exhibited co-internalization of both proteins (white arrows) and signals
extending from tTJs to bTJs when cells were administered with 100 µM or 150 µM trictide
(Fig. 4.9B, green arrowheads).
In untreated samples, Occl and Cldn1 co-stainings showed yellow co-localizing signals
along cell-cell contacts (Fig. 4.9C, green arrowheads). Only with scrambled trictide, the
green signal was more abundant than the yellow signal that indicates reduction of Occl and
increase of Cldn1. The distribution of Occl and Cldn1 along the entire cell surface was
different. The reason for that is Caco-2 cells growing upwards in various degrees, resulting
in variable cell heights. These variations cause maximum intensity projected Z-stacks to
reveal different amounts of Occl and Cldn1 at different levels. After 100 µM trictide,
Cldn1 remained near the tricellular area (Fig. 4.9C, red arrowhead) and Cldn1 signal was
reduced at bicellular area. Occl was dispersed discontinuously throughout bTJs, and
proteins were co-internalized after 100 and 150 µM of trictide (Fig. 4.9C, white arrows).
To sum up, 100 µM of scrambled trictide did not cause considerable changes to the typical
localization of Tric, LSR, Occl, and Cldn1 (Fig. 4.9A, B, C, second column). After
treatment with 150 µM trictide, alterations in the localization of these TJ proteins were
intensified due to the presence of the greater concentration of the peptide (Fig. 4.9A, B, C,
fourth column). In this chapter, it was confirmed that the mechanism of trictide affecting
cell barrier integrity also modifies localization of tricellular and bicellular TJ proteins.
4.3.2.6. Trictide mainly causes down-regulation of tricellulin and occludin
The remarkable effect of trictide on barrier integrity and increase of permeability of the
barrier raised the question of what happens at expression levels of TJ proteins. Therefore,
mRNA expressions of TAMPs, LSR, Cldn1, Cldn5 and ZO-1 were analyzed by qRT-PCR
in Caco-2 cells (Table.S2). mRNA values (2ΔCt
) (see chapter 3.2.8.1) of proteins expressed
in untreated controls were: Tric (12±0.7•10-3
), Occl (18±3•10-3
), MD3 (7±0.7•10-4
), LSR
(16±2•10-3
), Cldn1 (4±0.1•10-3
), Cldn5 (30±6•10-7
), and ZO-1 (7±1•10-3
).
Thus, incubation with 150 µM trictide decreased mRNA expression of several TJ proteins
significantly compared to untreated control. As expected, trictide reduced Tric mRNA
down to 43±10%. Even though there is no similarity found between human marveld3

RESULTS
68
(MD3) and scrambled peptide, MD3 mRNA was reduced by both scrambled trictide
(51±6%) and trictide (37±8%). Cldn1 expression was decreased to 58±10%; Cldn5
expression was similarly decreased (60±13%) by trictide (Fig. 4.10A). The latter result
directed trictide investigation to work on a cell line with higher Cldn5 expression level
because Caco-2 cells do not express high levels of Cldn5 (see chapter 4.3.3.3).
Fig. 4.10 Trictide down-regulates expression of tricellulin, marvelD3, occludin and claudins in human
colon carcinoma epithelial cells. (A) Effect on messenger RNA (mRNA) of designated proteins upon
trictide and scrambled trictide treatment compared to untreated control (2ΔΔCt
) (blue dotted line). mRNA
normalized to β-actin (Actb) (ΔCt = Ctjunction protein - Ctactin); Ct, Cycle threshold; total incubation time, 16 h;
two-way ANOVA test was applied prior to Bonferroni’s comparison post hoc test; mean±SEM; n=10; * P ≤
0.05, ** P ≤ 0.01, *** P ≤ 0.001 versus untreated control. (B) Effect on tight junction protein expressions
upon trictide treatment compared to peptide-free medium (untreated). Expression levels were determined by
Western blotting followed by densitometry analysis of protein band intensities. Expression levels were
normalized to GAPDH (Glyceraldehyde 3-Phosphate Dehydrogenase) and compared to untreated control.
Total incubation time, 16 h; one-way ANOVA test was applied prior to Dunnett’s comparison post hoc test;
mean±SEM; n ≥5; * P ≤ 0.05 versus untreated control. (C) Examples of Western blotted TJ protein bands
were given. Expected protein sizes are: tricellulin (Tric), 64 kDa; occludin (Occl), 65 kDa; marvelD3
(MD3), 45 kDa; anti-lipolysis stimulated lipoprotein receptor (LSR), 71.4 kDa; claudin-1 (Cldn1), 23 kDa.
U.T, untreated; T.T, 150 µM trictide treated; 30 µg protein/ well was loaded.

RESULTS
69
Protein expressions of TAMPs, LSR and Cldn1 were measured to examine whether mRNA
changes were reflected in protein quantities. As a result of 150 µM trictide administration,
Tric expression decreased to 40±11% and Occl expression decreased to 42±8%. The rest of
the proteins exhibited expression levels such as: MD3 (50±10%), LSR (77±22%) and
Cldn1 (80±18%) (Fig. 4.10B). Only Tric and Occl were down-regulated significantly
compared to the untreated control samples, and stated effects can be also observed in the
given protein bands (Fig. 4.10C).
4.3.3. Effect of trictide on claudin-5 rich endothelial cells forming blood-brain
barrier
In chapter 4.3.2.6, it was stated that Cldn5 mRNA expression of Caco-2 cells was affected
by trictide treatment. Thus, trictide investigations were performed with mouse brain
endothelial cells (bEnd.3) expressing high Cldn5 amount. Unfortunately, bEnd.3 cells
express limited numbers of TJ proteins in high amounts such as: Occl, Cldn5, Cldn12
(Berndt, 2017). That is why it was not possible to investigate interplay between Cldn5 and
Tric.
4.3.3.1. Trictide weakens the paracellular barrier of mouse brain endothelial cells
The ECIS measurements in Fig. 4.11 showed TER change relative to the untreated sample
plotted against the time, starting with peptide addition. Effects of each condition were
statistically calculated compared to untreated cells. Before treatment, all cells reached a
stable TER of 1077.8±44.4 Ω·cm2 (n=4). Untreated control cells showed TER of
1503.7±206.5 Ω·cm2 after 21 h of administration. 50 µM trictide (95±9%) and scrambled
trictide (98±7%) had no effect on TER during the administration time.
Significant effect of 100 µM trictide on TER started at 9 h (75±8%) and developed further
at 10 h (66±9%) and 11 h (58±1%). At the end of the incubation time TER was decreased
to 16±1%. On the other hand, 75 µM trictide decreased TER gradually and significantly
starting from 14 h (62±3%) and decreased further at 15 h (57±3%), 16 h (51±2%), 17 h
(46±2%) and 18 h (42±2%) of incubation (Fig. 4.11).
Trictide was known to open epithelial cell barriers after 16 h of incubation (see chapter
4.3.2.1). Investigations with endothelial cell barrier confirmed that trictide reduced
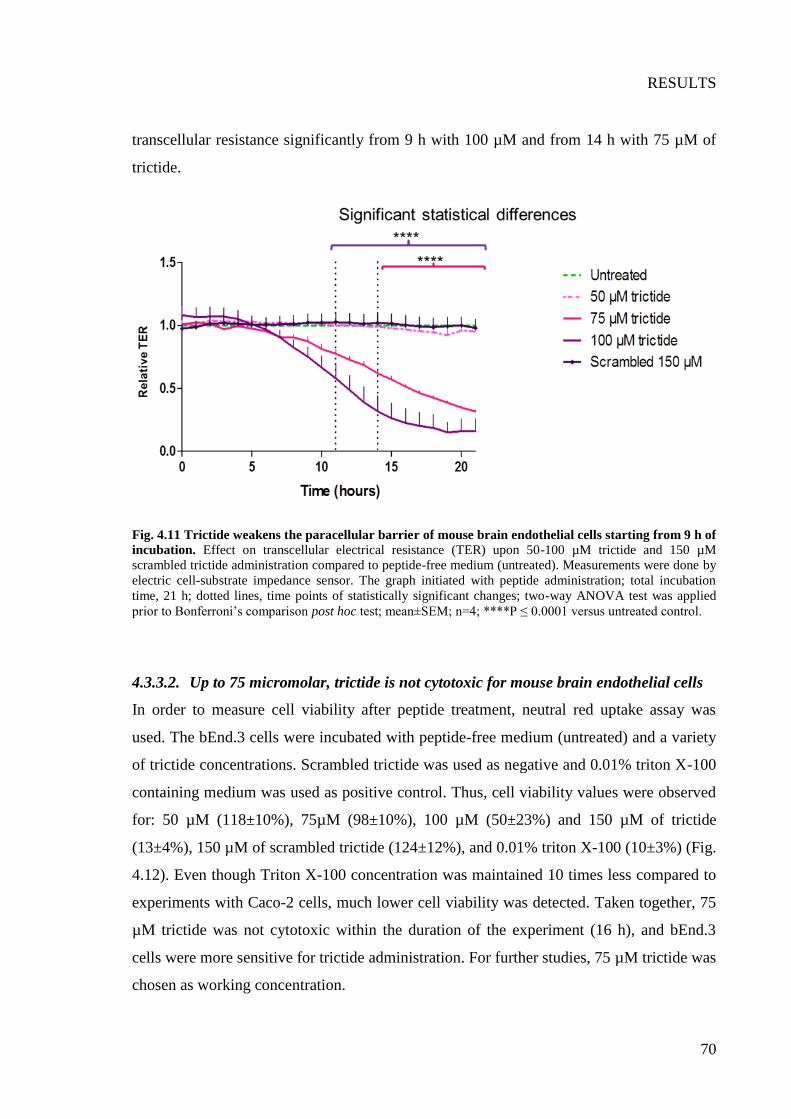
RESULTS
70
transcellular resistance significantly from 9 h with 100 µM and from 14 h with 75 µM of
trictide.
Fig. 4.11 Trictide weakens the paracellular barrier of mouse brain endothelial cells starting from 9 h of
incubation. Effect on transcellular electrical resistance (TER) upon 50-100 µM trictide and 150 µM
scrambled trictide administration compared to peptide-free medium (untreated). Measurements were done by
electric cell-substrate impedance sensor. The graph initiated with peptide administration; total incubation
time, 21 h; dotted lines, time points of statistically significant changes; two-way ANOVA test was applied
prior to Bonferroni’s comparison post hoc test; mean±SEM; n=4; ****P ≤ 0.0001 versus untreated control.
4.3.3.2. Up to 75 micromolar, trictide is not cytotoxic for mouse brain endothelial cells
In order to measure cell viability after peptide treatment, neutral red uptake assay was
used. The bEnd.3 cells were incubated with peptide-free medium (untreated) and a variety
of trictide concentrations. Scrambled trictide was used as negative and 0.01% triton X-100
containing medium was used as positive control. Thus, cell viability values were observed
for: 50 µM (118±10%), 75µM (98±10%), 100 µM (50±23%) and 150 µM of trictide
(13±4%), 150 µM of scrambled trictide (124±12%), and 0.01% triton X-100 (10±3%) (Fig.
4.12). Even though Triton X-100 concentration was maintained 10 times less compared to
experiments with Caco-2 cells, much lower cell viability was detected. Taken together, 75
µM trictide was not cytotoxic within the duration of the experiment (16 h), and bEnd.3
cells were more sensitive for trictide administration. For further studies, 75 µM trictide was
chosen as working concentration.
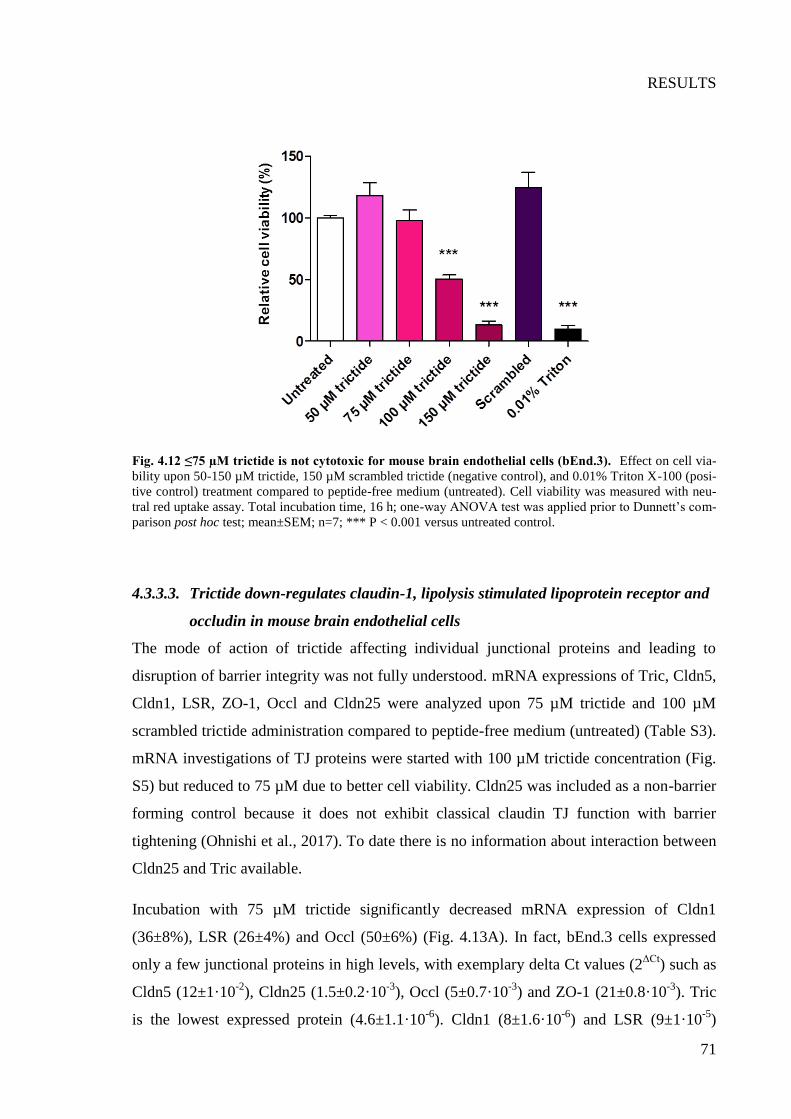
RESULTS
71
Fig. 4.12 ≤75 µM trictide is not cytotoxic for mouse brain endothelial cells (bEnd.3). Effect on cell via-
bility upon 50-150 µM trictide, 150 µM scrambled trictide (negative control), and 0.01% Triton X-100 (posi-
tive control) treatment compared to peptide-free medium (untreated). Cell viability was measured with neu-
tral red uptake assay. Total incubation time, 16 h; one-way ANOVA test was applied prior to Dunnett’s com-
parison post hoc test; mean±SEM; n=7; *** P < 0.001 versus untreated control.
4.3.3.3. Trictide down-regulates claudin-1, lipolysis stimulated lipoprotein receptor and
occludin in mouse brain endothelial cells
The mode of action of trictide affecting individual junctional proteins and leading to
disruption of barrier integrity was not fully understood. mRNA expressions of Tric, Cldn5,
Cldn1, LSR, ZO-1, Occl and Cldn25 were analyzed upon 75 µM trictide and 100 µM
scrambled trictide administration compared to peptide-free medium (untreated) (Table S3).
mRNA investigations of TJ proteins were started with 100 µM trictide concentration (Fig.
S5) but reduced to 75 µM due to better cell viability. Cldn25 was included as a non-barrier
forming control because it does not exhibit classical claudin TJ function with barrier
tightening (Ohnishi et al., 2017). To date there is no information about interaction between
Cldn25 and Tric available.
Incubation with 75 µM trictide significantly decreased mRNA expression of Cldn1
(36±8%), LSR (26±4%) and Occl (50±6%) (Fig. 4.13A). In fact, bEnd.3 cells expressed
only a few junctional proteins in high levels, with exemplary delta Ct values (2ΔCt
) such as
Cldn5 (12±1·10-2
), Cldn25 (1.5±0.2·10-3
), Occl (5±0.7·10-3
) and ZO-1 (21±0.8·10-3
). Tric
is the lowest expressed protein (4.6±1.1·10-6
). Cldn1 (8±1.6·10-6
) and LSR (9±1·10-5
)

RESULTS
72
exhibited greater expression compared to Tric but were still expressed less compared to
Cldn5, Cldn25, Occl and ZO-1.
Protein expression level of Cldn5 upon 75 µM trictide application was tested to inspect
whether mRNA change was reflected by protein amount and compared to untreated
control. Cldn5 was up to 177±75% up-regulated, but this effect was insignificant due to
high variation among samples (Fig. 4.13B). An example of analyzed protein bands can be
observed in figure 4.13C.
Fig. 4.13 Trictide down-regulates mRNA expression of claudin-1, LSR and occludin in mouse brain
endothelial cells. (A) Effect on messenger RNA (mRNA) of designated proteins; upon trictide and
scrambled trictide treatment compared to untreated control (2ΔΔCt
) (red dotted line). mRNA normalized to β-
actin (Actb) (ΔCt = Ctjunction protein - Ctactin); Ct, Cycle threshold; total incubation time, 16 h; two-way
ANOVA test was applied prior to Bonferroni’s comparison post hoc test; mean±SEM; n≥8; * P ≤ 0.05, *** P
≤ 0.001, ****P ≤ 0.0001 versus untreated control. (B) Effect on claudin-5 (Cldn5) expressions upon trictide
treatment compared to peptide-free medium (untreated). Expression levels were determined by Western
blotting followed by densitometry analysis of protein band intensities. Expression levels were normalized to
GAPDH (glyceraldehyde 3-phosphate dehydrogenase) and compared to untreated control. Total incubation
time, 16 h; student’s t-test was applied prior to Mann Whitney post hoc test; mean±SEM; n=4. (C) Examples
of Western blotted Cldn5 (22 kDa) protein bands were given. Cldn1, claudin-1; Tric, tricellulin; LSR, anti-
lipolysis stimulated lipoprotein receptor; Cldn25, claudin-25; ZO-1, zonula occludens protein-1; Occl,
occludin; U.T, untreated; 75 µM trictide treated.
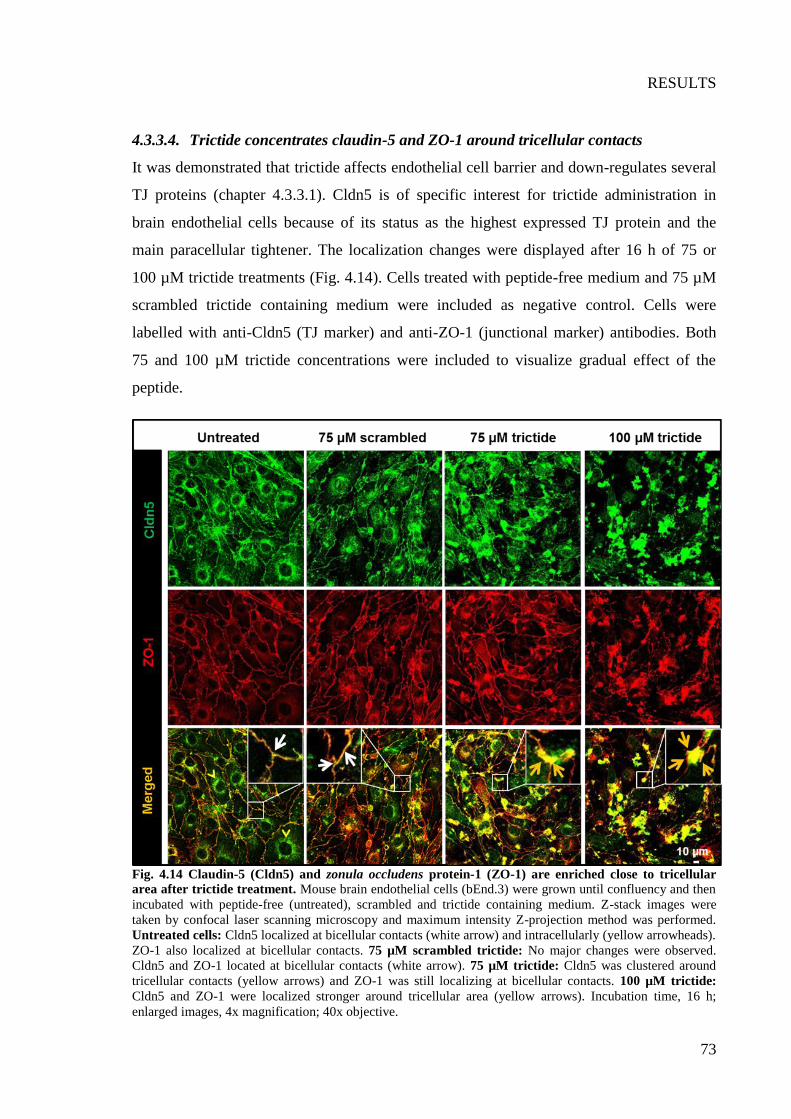
RESULTS
73
4.3.3.4. Trictide concentrates claudin-5 and ZO-1 around tricellular contacts
It was demonstrated that trictide affects endothelial cell barrier and down-regulates several
TJ proteins (chapter 4.3.3.1). Cldn5 is of specific interest for trictide administration in
brain endothelial cells because of its status as the highest expressed TJ protein and the
main paracellular tightener. The localization changes were displayed after 16 h of 75 or
100 µM trictide treatments (Fig. 4.14). Cells treated with peptide-free medium and 75 µM
scrambled trictide containing medium were included as negative control. Cells were
labelled with anti-Cldn5 (TJ marker) and anti-ZO-1 (junctional marker) antibodies. Both
75 and 100 µM trictide concentrations were included to visualize gradual effect of the
peptide.
Fig. 4.14 Claudin-5 (Cldn5) and zonula occludens protein-1 (ZO-1) are enriched close to tricellular
area after trictide treatment. Mouse brain endothelial cells (bEnd.3) were grown until confluency and then
incubated with peptide-free (untreated), scrambled and trictide containing medium. Z-stack images were
taken by confocal laser scanning microscopy and maximum intensity Z-projection method was performed.
Untreated cells: Cldn5 localized at bicellular contacts (white arrow) and intracellularly (yellow arrowheads).
ZO-1 also localized at bicellular contacts. 75 µM scrambled trictide: No major changes were observed.
Cldn5 and ZO-1 located at bicellular contacts (white arrow). 75 µM trictide: Cldn5 was clustered around
tricellular contacts (yellow arrows) and ZO-1 was still localizing at bicellular contacts. 100 µM trictide:
Cldn5 and ZO-1 were localized stronger around tricellular area (yellow arrows). Incubation time, 16 h;
enlarged images, 4x magnification; 40x objective.

RESULTS
74
Untreated samples showed staining at bicellular contacts for both Cldn5 (green) and ZO-1
(red) (Fig. 4.14, white arrow). Cldn5 antibody also showed intracellular staining around
cell nucleus. After scrambled trictide (75 µM) treatment, signals were dominantly observed
at bicellular contacts (Fig. 4.14, white arrows). In the 75 µM trictide treated samples,
bicellular localization of Cldn5 was reduced and green signal was redistributed to
concentrate around tricellular contacts (Fig. 4.14, red arrows). At those points, the signal
manifested itself yellow due to the fact that ZO-1 protein also moved close to tricellular
contacts. 100 µM trictide caused greater alterations compared to 75 µM. The staining of
Cldn5 as well as ZO-1 at bicellular contacts was severely reduced. A greater part of the
signals was concentrated as a yellow signal around tricellular areas (Fig. 4.14, yellow
arrows).
Fig. 4.15 Claudin-5 (Cldn5) and occludin (Occl) are internalized and enriched close to tricellular area
after trictide treatment. Mouse brain endothelial cells (bEnd.3) were grown until confluency and then
incubated with peptide-free (untreated) and trictide containing medium. Z-stack images were taken by
confocal laser scanning microscopy and maximum intensity Z-projection method was performed. Untreated
cells: Cldn5 and Occl localized at bicellular and tricellular contacts (white arrows). 100 µM trictide: both
Cldn5 (green arrows) and Occl (red arrows) were internalized and observed at subcellular areas. Cldn5 and
Occl were redistributed from bicellular contacts to intracellular area and clustered around tricellular contacts
(yellow arrows). Incubation time, 16 h; enlarged images, 4x magnification; 63x objective.

RESULTS
75
Modifications of Cldn5 and Occl localizations were further observed after trictide
administration. Untreated cells exhibited sharp staining of Cldn5 (green) and Occl (red) at
bicellular contacts that overlapped also at tricellular contacts (Fig. 4.15, white arrows).
After 100 µM trictide treatment, Occl was highly internalized and detected also at
subcellular areas (Fig. 4.15, red arrows) that were likewise close to tricellular contacts
(Fig. 4.15, yellow arrows). Although Cldn5 was internalized to a lesser degree compared to
Occl, it can be still found at bicellular contacts (Fig. 4.15, green arrows). Just like Cldn5
and ZO-1 stainings, Cldn5 and Occl signals were concentrated around some tricellular
contacts.
Fig. 4.16 Claudin-5 (Cldn5) is concentrated around tricellular area after trictide treatment. Mouse
brain endothelial cells (bEnd.3) were grown until confluency and then incubated with peptide-free (untreated)
and trictide containing medium. Individual cell contacts were imaged using confocal microscopy and STED
super-resolution microscopy. The deconvoluted STED image showed further background reduction.
Untreated cells: Cldn5 and ZO-1 localized at bicellular and tricellular contacts (yellow arrows). 100 µM
trictide: Cldn5 and ZO-1 were clustered around tricellular contacts (enlarged). ZO-1 could also be observed
at bicellular contacts (red arrowheads). Incubation time, 16 h; enlarged images, zoom: 6.0; 100x objective.
The opening of the mouse endothelial cell barrier was clearly demonstrated according to
results in chapter 4.3.3.1. But it was not yet understood if the barrier was open exclusively
at tricellular or additionally at bicellular areas. However, immunocytostainings of trictide
administered bEnd.3 cells showed clear modification of localization for Cldn5, ZO-1 and

RESULTS
76
Occl as they tend to concentrate around the tricellular contacts. To comprehend detailed
structure of the tricellular area, images with stimulated emission depletion (STED) super-
resolution microscopy were taken. The cells were treated with 100 µM trictide-containing
and peptide-free medium (untreated).
Untreated cells showed typical localization of Cldn5 and ZO-1 at bicellular junctions.
Confocal microscopy pictures of Cldn5 (green) and ZO-1 (red) showed overlapping signals
(orange-like) along the plasma membrane. However, STED images enabled to present
distinct signals of Cldn5 and ZO-1 at cell contacts. Deconvoluted STED images further
decreased the background noise at bicellular contacts and demonstrated organization of
individual junctional proteins (Fig. 4. 16, yellow arrows).
Consequently, 100 µM trictide treated cells revealed reduced signal of Cldn5 at the plasma
membrane and formation of clustering Cldn5 signals at the periphery of tricellular
contacts. ZO-1 signal remained at bicellular contacts (Fig. 4. 16, red arrowheads).
Deconvoluted STED images revealed an opening in the centre of the tricellular region.
This strong modulation of highly barrier forming TJ protein Cldn5 indicates opening of
endothelial cell barriers tricellularly.
4.3.4. Tricellulin knockdown confirms the tricellulin dependent function of trictide
As a control experiment, TER and the permeability for FD4 were investigated in Tric
knockdown cells. Thus, human colon epithelial adenocarcinoma cell line HT 29/B6 was
transfected with either a vector containing shRNA sequence targeting Tric (shTric) or the
empty vector. Two clones of shTric were used: shTric20= 20% and shTric50 = 50% of
initial tricellulin expression (Fig. 4.16C). Cells were seeded on filters and treated with 150
µM trictide or 150 µM scrambled trictide for 24 h. Cells transfected with the empty vector
and administered with scrambled trictide constructed the control group.
Cells transfected with the empty vector and treated with trictide showed significant
decrease of TER compared to the scrambled trictide treatment. The shTric50 clone also
displayed significant decrease of TER after trictide, compared to scrambled trictide
administration. However, the shTric20 clone did not demonstrate any difference in TER
between trictide and scrambled trictide applications (Fig. 4.17A). In this case, the cell
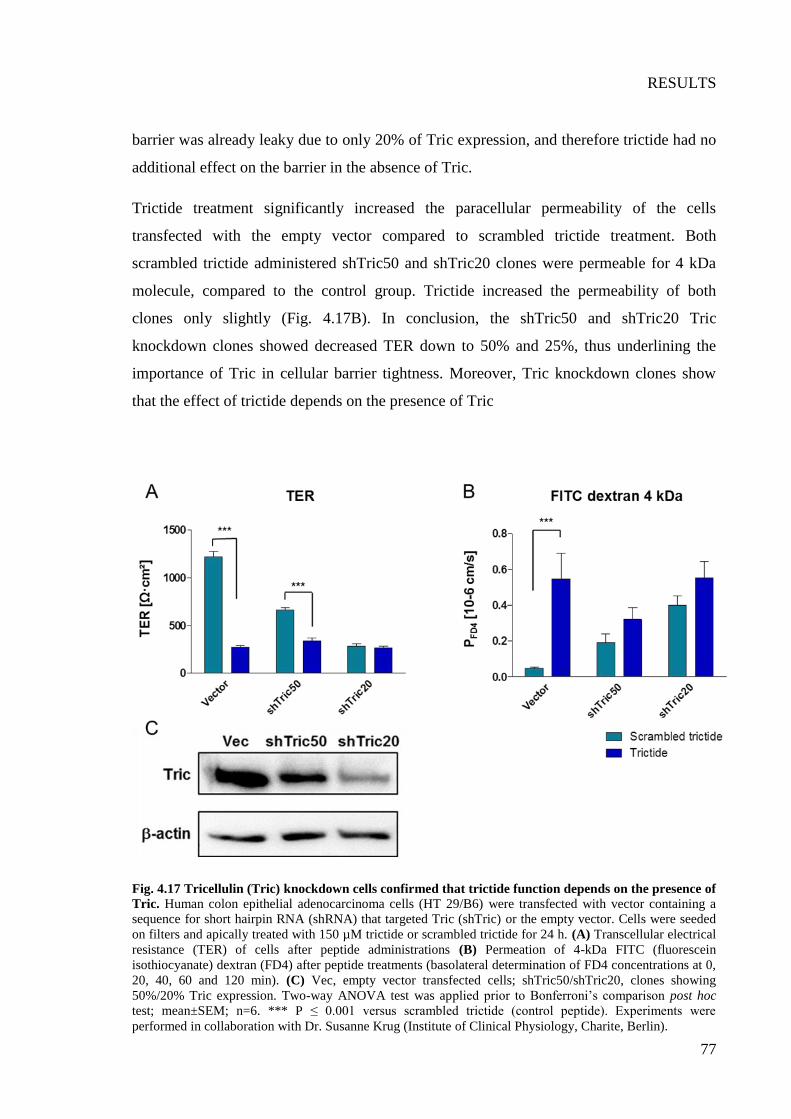
RESULTS
77
barrier was already leaky due to only 20% of Tric expression, and therefore trictide had no
additional effect on the barrier in the absence of Tric.
Trictide treatment significantly increased the paracellular permeability of the cells
transfected with the empty vector compared to scrambled trictide treatment. Both
scrambled trictide administered shTric50 and shTric20 clones were permeable for 4 kDa
molecule, compared to the control group. Trictide increased the permeability of both
clones only slightly (Fig. 4.17B). In conclusion, the shTric50 and shTric20 Tric
knockdown clones showed decreased TER down to 50% and 25%, thus underlining the
importance of Tric in cellular barrier tightness. Moreover, Tric knockdown clones show
that the effect of trictide depends on the presence of Tric
Fig. 4.17 Tricellulin (Tric) knockdown cells confirmed that trictide function depends on the presence of
Tric. Human colon epithelial adenocarcinoma cells (HT 29/B6) were transfected with vector containing a
sequence for short hairpin RNA (shRNA) that targeted Tric (shTric) or the empty vector. Cells were seeded
on filters and apically treated with 150 µM trictide or scrambled trictide for 24 h. (A) Transcellular electrical
resistance (TER) of cells after peptide administrations (B) Permeation of 4-kDa FITC (fluorescein
isothiocyanate) dextran (FD4) after peptide treatments (basolateral determination of FD4 concentrations at 0,
20, 40, 60 and 120 min). (C) Vec, empty vector transfected cells; shTric50/shTric20, clones showing
50%/20% Tric expression. Two-way ANOVA test was applied prior to Bonferroni’s comparison post hoc
test; mean±SEM; n=6. *** P ≤ 0.001 versus scrambled trictide (control peptide). Experiments were
performed in collaboration with Dr. Susanne Krug (Institute of Clinical Physiology, Charite, Berlin).

RESULTS
78
4.3.5. Effect of trictide on Madin-Darby canine kidney and human embryonic
kidney cells
Since HEK cells are embryonic cells, they do not express TJs. Hence, experiments
conducted with HEK cells enable analysis of proteins without interference from other TJ
proteins. Fluorescence resonance energy transfer (FRET) assay was used to determine the
cis-interactions for different TJ proteins and to define specific binding sites of trictide at
the molecular level. MDCK-II cells express TJ proteins endogenously and form a
paracellular barrier. They were used to examine interactions between Tric-Tric after
trictide administration. MDCK-II cells were also ideal for STED due to their homogenous
propagation over microscopic cover glasses that reduced background and uneven
deposition of cells.
4.3.5.1. Trictide affects tight junction protein-protein interactions
The association of TJ proteins along the plasma membrane is termed cis-interaction. To
study this association, FRET efficiencies between CFP and YFP-labelled proteins were
measured. Possible alterations of interactions between TJ proteins caused by 50 µM
trictide and 50 µM scrambled trictide treatments in comparison to the peptide-free medium
in HEK cells after 24 h were investigated. Subsequently, FRET efficiencies were measured
by LSM microscopy (Fig. 4.18).
The strong bicellular homophilic cis-interaction of Cldn1 was not changed by either the
scrambled peptide or trictide (Cording et al., 2013). Similarly, bicellular heterophilic cis-
interactions for Cldn1–Occl and Cldn1-MD3, that do not involve Tric, were not affected.
As expected, cis-interactions in Tric-containing protein combinations were reduced by
trictide. The cis-interaction of Cldn1 with Tric was disrupted by 50%; Tric with MD3
completely disappeared after incubation with trictide (Fig. 4.18 B). Fluorescent images of
cell-cell contacts between co-transfected Tric and Cldn1 expressing cells showed
localization of both proteins at bicellular contacts after peptide administrations (Figure
4.18A). It is usual to observe Tric at bicellular area in the TJ protein transfected HEK cell
systems (Cording et al., 2013).
Occl localization was strongly affected from trictide application in Caco-2 cells (see
chapter 4.3.2.5). In order to examine this effect, Occl-Occl FRET efficiencies were

RESULTS
79
measured after trictide and scrambled trictide. Accordingly, the data showed that
homophilic cis-interaction of Occl decreased to 47% after trictide treatment compared to
untreated control (Fig. 4.18B).
Fig. 4.18 Trictide interferes with protein interactions of tricellulin (Tric) and with Occl (occludin)-Occl
association (A) Human embryonic kidney (HEK-293) cells transiently expressing Claudin-1 (Cldn1)-YFP
and CFP-Tric were treated with peptide free, scrambled trictide or trictide-containing medium. Both proteins
localized at bicellular contacts (orange arrowheads). (B) cis-Interactions of homo- and heterophilic protein
combinations as determined by fluorescence resonance energy transfer (FRET) in co-transfected HEK cells
after treatment with 50 µM of trictide or scrambled trictide. The protein pairs were transfected as YFP- and
CFP-fusion proteins, respectively. (C) Co-transfected Madin-Darby canine kidney cells (MDCK-II)
transiently expressing CFP- and YFP-Tric treated with scrambled trictide or trictide; the proteins were
localized at tricellular contacts (yellow arrowheads). Due to overexpression of Tric, signals were also
observed in cytosol. (D) Trictide treatment leads to a loss of Tric-Tric cis-interaction, as demonstrated by
FRET in co-transfected MDCK-II cells. (B-D) MD3, marvelD3; YFP/CFP, yellow/cyan fluorescent protein;
total incubation time, 24 h; one-way ANOVA test was applied prior to Dunnett’s comparison post hoc test;
mean±SEM; n=19; ** P ≤ 0.01, *** P < 0.001 versus untreated control.
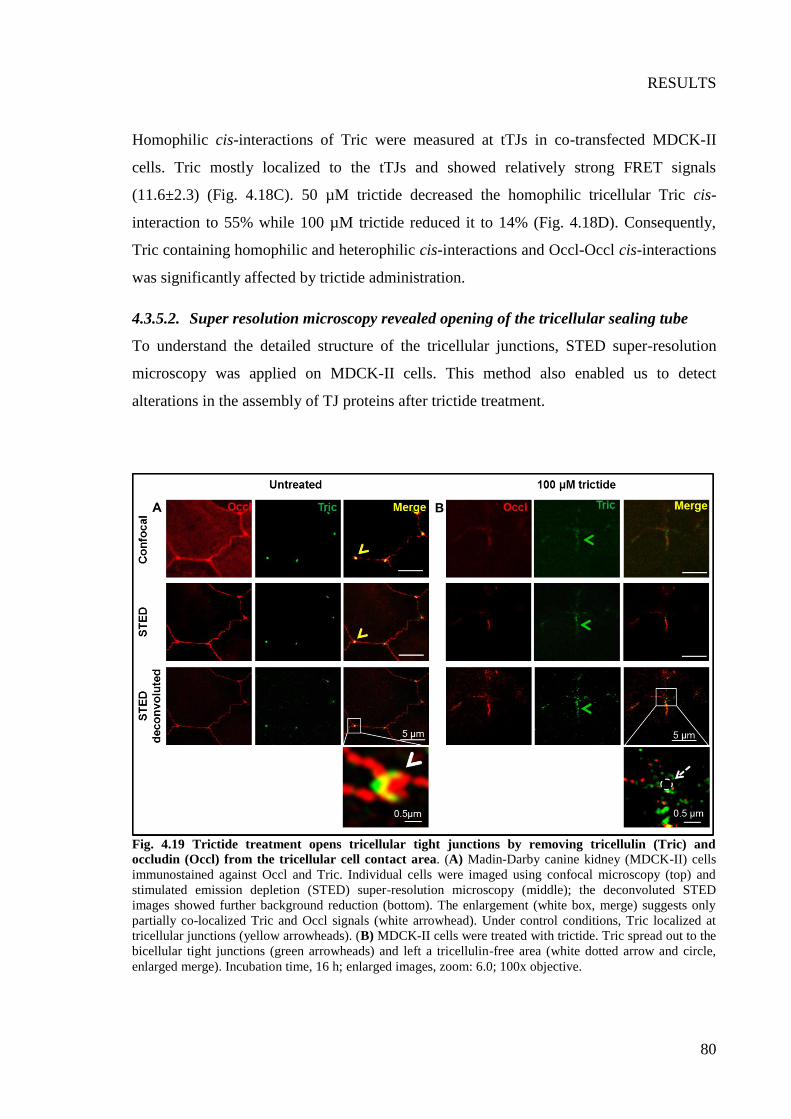
RESULTS
80
Homophilic cis-interactions of Tric were measured at tTJs in co-transfected MDCK-II
cells. Tric mostly localized to the tTJs and showed relatively strong FRET signals
(11.6±2.3) (Fig. 4.18C). 50 µM trictide decreased the homophilic tricellular Tric cis-
interaction to 55% while 100 µM trictide reduced it to 14% (Fig. 4.18D). Consequently,
Tric containing homophilic and heterophilic cis-interactions and Occl-Occl cis-interactions
was significantly affected by trictide administration.
4.3.5.2. Super resolution microscopy revealed opening of the tricellular sealing tube
To understand the detailed structure of the tricellular junctions, STED super-resolution
microscopy was applied on MDCK-II cells. This method also enabled us to detect
alterations in the assembly of TJ proteins after trictide treatment.
Fig. 4.19 Trictide treatment opens tricellular tight junctions by removing tricellulin (Tric) and
occludin (Occl) from the tricellular cell contact area. (A) Madin-Darby canine kidney (MDCK-II) cells
immunostained against Occl and Tric. Individual cells were imaged using confocal microscopy (top) and
stimulated emission depletion (STED) super-resolution microscopy (middle); the deconvoluted STED
images showed further background reduction (bottom). The enlargement (white box, merge) suggests only
partially co-localized Tric and Occl signals (white arrowhead). Under control conditions, Tric localized at
tricellular junctions (yellow arrowheads). (B) MDCK-II cells were treated with trictide. Tric spread out to the
bicellular tight junctions (green arrowheads) and left a tricellulin-free area (white dotted arrow and circle,
enlarged merge). Incubation time, 16 h; enlarged images, zoom: 6.0; 100x objective.

RESULTS
81
Untreated cells exhibited typical localization of Occl at bicellular and Tric at tricellular
junctions. Confocal microscopy pictures of Occl (red) and Tric (green) showed yellow
points at tricellular junctions (Fig. 4.19A, yellow arrowheads). These could be interpreted
as co-localization of both proteins at tTJs (Fig. 4.19A, upper row). However, STED
pictures showed cell junctions with less background, and it was possible to detect TJ
proteins aligning along the cell membrane with 50 nm resolution (Fig. 4.19A, middle row).
Deconvoluted STED images further decreased the background noise at tricellular junctions
and demonstrated that Tric and Occl co-localized only partially at tTJs (Fig. 4.19A, lower
row). Tric stands in the center and Occl surrounds it from three bicellular contact ends
(Fig. 4.19A, enlarged image, white arrowhead).
100 µM trictide treated cells revealed elongated signals of Tric from tTJs to bTJs in
confocal images (green arrowheads) (Fig. 4.19B, upper row). STED, in particular
deconvoluted images, revealed a Tric-free area in the center of the tricellular region (Fig.
4.19B, enlarged image, white dashed circle and arrow). The absence of Tric suggests that
tricellular sealing tube is open and could enable paracellular passage of molecules through
tricellular contact. It also supports the argument that trictide binds Tric and affects
tricellular area preferentially. However, we should also consider other mechanisms like
internalization and down-regulation of Tric as potentially leading to localization changes.
4.3.5.3. Trictide redistributes occludin from bicellular junctions progressively during 15
h of incubation
Our objective was to observe the time course of cellular modifications caused by trictide
and fluorescently labelled TAMRA-trictide. Spin disk confocal microscopy was used for
live-cell imaging in long-term time-lapse. This technique is useful for imaging
fluorescence samples for longer durations without being bleached. Therefore YFP-Occl
transfected MDCK-II cells were used to emphasize cellular borders with TJ marker protein
Occl. This enabled us to track the effect of trictide without using any other marker that
might disturb the monolayer after long-lasting treatment.
Untreated cells maintained continuous and linear cell membrane and tricellular contacts
throughout the experiment (Fig. 4.20A, yellow arrows). 100 µM of trictide caused
disruption and redistribution of Occl at cellular borders. Occl signals were reduced at some
bicellular contacts and enriched at others where 3-cells are come together in 6 h and 9 h

RESULTS
82
images (Fig. 4.20B, white arrowheads). Between 12 h and 15 h, it became clear that YFP-
Occl signal was weakened at bicellular contacts progressively and finally enriched
intracellularly (Fig. 4.20B, white arrows).
Cells administered with 10 µM TAMRA-trictide containing medium had two different
fluorescent signals: YFP-Occl (green) and TAMRA-trictide (red). This combination
allowed the investigation of peptide’s mode of action by comparison of the influence on
cellular borders and peptide’s localization. The lesser concentration was used to avoid
saturated fluorescence intensity of TAMRA and to maintain TJ visibility before Occl is
removed from the cell junctions. It was observed that starting from 6 h of peptide
treatment, YFP-Occl signal deteriorated at tricellullar contacts (Fig. 4.20C, dotted circles),
and these areas (central-tube like) were filled with fluorescently labelled trictide (Fig.
4.20D, red arrows). From 12 h, the effect on cell contacts was further expanded to 2-cell
contacts that caused accumulation of TAMRA-trictide in greater amounts up to 2 µm deep
submembranously. After 15 h of treatment, fluorescent peptide was localizing
intracellularly around most of the bicellular contacts and causing disappearance of cell
contacts.
The internalization and enrichment of Occl protein around tricellular contacts after trictide
was presented in chapter 4.3.3.4. Furthermore it was found that Occl expression is
significantly down-regulated consequent to trictide administration. So the outcome of this
live-cell imaging (Fig. 4.20) is in accordance with previous chapters and enabled us to
acquire more information about the mode of action. Trictide first affects tTJs, then starts
transfer of TJ proteins to bicellular contacts, and finally causes internalization of proteins.
Even though trictide’s binding mechanism is not fully understood, it evidently disturbs
association of TJ proteins in a way that alters their localization and affects the integrity of
bi- and tricellular junctions.

RESULTS
83
Fig. 4.20 See figure legend on the next page.
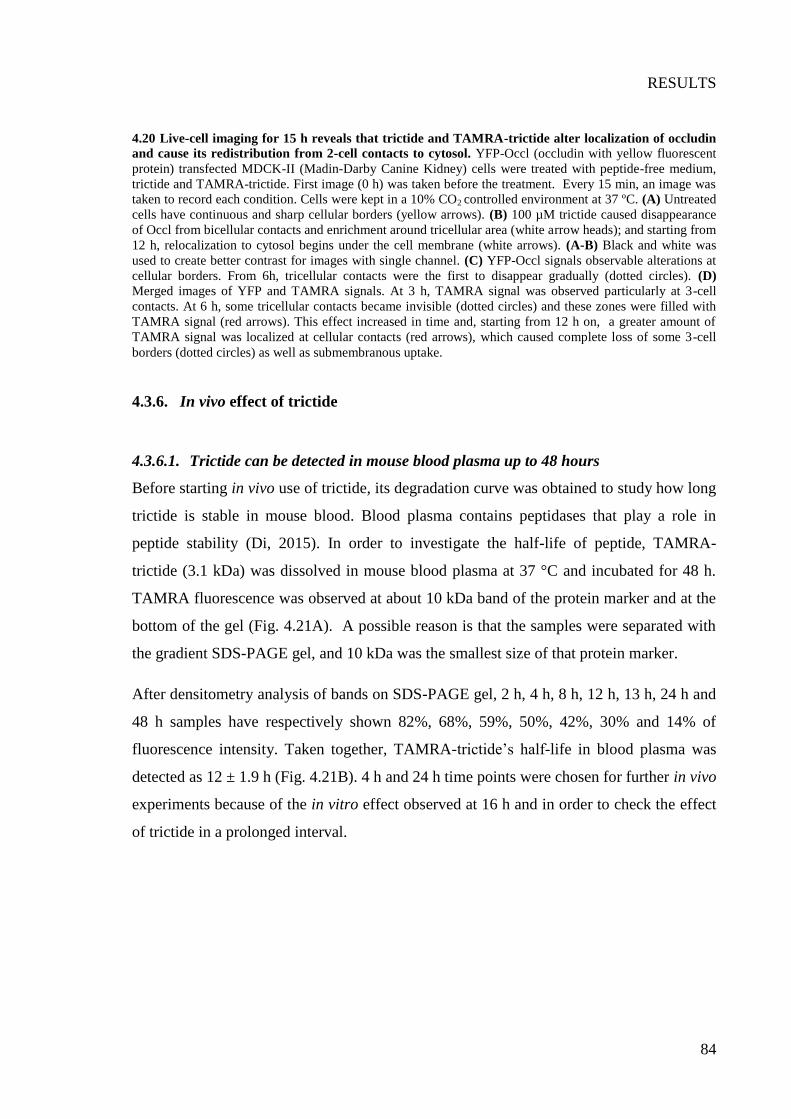
RESULTS
84
4.20 Live-cell imaging for 15 h reveals that trictide and TAMRA-trictide alter localization of occludin
and cause its redistribution from 2-cell contacts to cytosol. YFP-Occl (occludin with yellow fluorescent
protein) transfected MDCK-II (Madin-Darby Canine Kidney) cells were treated with peptide-free medium,
trictide and TAMRA-trictide. First image (0 h) was taken before the treatment. Every 15 min, an image was
taken to record each condition. Cells were kept in a 10% CO2 controlled environment at 37 ºC. (A) Untreated
cells have continuous and sharp cellular borders (yellow arrows). (B) 100 µM trictide caused disappearance
of Occl from bicellular contacts and enrichment around tricellular area (white arrow heads); and starting from
12 h, relocalization to cytosol begins under the cell membrane (white arrows). (A-B) Black and white was
used to create better contrast for images with single channel. (C) YFP-Occl signals observable alterations at
cellular borders. From 6h, tricellular contacts were the first to disappear gradually (dotted circles). (D)
Merged images of YFP and TAMRA signals. At 3 h, TAMRA signal was observed particularly at 3-cell
contacts. At 6 h, some tricellular contacts became invisible (dotted circles) and these zones were filled with
TAMRA signal (red arrows). This effect increased in time and, starting from 12 h on, a greater amount of
TAMRA signal was localized at cellular contacts (red arrows), which caused complete loss of some 3-cell
borders (dotted circles) as well as submembranous uptake.
4.3.6. In vivo effect of trictide
4.3.6.1. Trictide can be detected in mouse blood plasma up to 48 hours
Before starting in vivo use of trictide, its degradation curve was obtained to study how long
trictide is stable in mouse blood. Blood plasma contains peptidases that play a role in
peptide stability (Di, 2015). In order to investigate the half-life of peptide, TAMRA-
trictide (3.1 kDa) was dissolved in mouse blood plasma at 37 °C and incubated for 48 h.
TAMRA fluorescence was observed at about 10 kDa band of the protein marker and at the
bottom of the gel (Fig. 4.21A). A possible reason is that the samples were separated with
the gradient SDS-PAGE gel, and 10 kDa was the smallest size of that protein marker.
After densitometry analysis of bands on SDS-PAGE gel, 2 h, 4 h, 8 h, 12 h, 13 h, 24 h and
48 h samples have respectively shown 82%, 68%, 59%, 50%, 42%, 30% and 14% of
fluorescence intensity. Taken together, TAMRA-trictide’s half-life in blood plasma was
detected as 12 ± 1.9 h (Fig. 4.21B). 4 h and 24 h time points were chosen for further in vivo
experiments because of the in vitro effect observed at 16 h and in order to check the effect
of trictide in a prolonged interval.
RESULTS
85
Fig. 4.21 TAMRA-trictide (human) has a half-life of 12 h in mouse blood plasma. 10 µM of TAMRA-
trictide was dissolved in mouse blood plasma and incubated at 37 ºC up to 48 h. (A) Fluorescence image of
gradient SDS-PAGE gel bands pertaining to the indicated incubation times. First sample was blood plasma
without fluorescent peptide (negative control). Bands were observed close to the level of 10 kDa marker
protein. (B) Fluorescence intensity of bands was assessed by densitometry analysis. Dashed blue line
indicates half-life of the peptide at about 12 h. Red line indicates intensity of a 4 h sample that was
preferentially selected for the experiments described in the following chapters. Values were relative to the 0 h
sample (as 100% of fluorescence intensity); mean ± SEM; n=3.
4.3.6.2. Junction proteins in mouse brain and kidney are highly affected by trictide
Brain and kidney barriers were both essential targets to be examined when the effect of
trictide was tested as a potential drug enhancer. The primary objective was to measure
changes in several junctional proteins at mRNA level. For this purpose, 800 µM trictide
(3.6 µmol/kg dissolved in phosphate-buffered saline) or phosphate-buffered saline (control
group) was administered (100 µl/22 g mice) to mice which were sacrificed after 4 h or 24
h. Absolute mRNA expressions (2ΔCt
values) of the junction proteins are given in Table 26
and Table S4.

RESULTS
86
Table 26. Messenger RNA (mRNA) expression of untreated mouse brain and kidney
Absolute mRNA expressions (2ΔCt
) Brain Kidney
Tric 13±3·10-5
32±1·10-4
LSR 68±7·10-5
47±3·10-4
Occl 10±0.4·10-4
68±2·10-4
Cldn5 39±1·10-4
ZO-1 8±1·10-3
7.9±0.2·10-3
Cldn12 34±3·10-4
Cldn25 67±2·10-4
42±2·10-4
MD3 19±1·10-5
Cldn1 44±1·10-4
mRNA normalized to β-actin (Actb) (ΔCt = Ctjunction protein - Ctactin); Ct, Cycle threshold; mean ± SEM; n
≥4; Tric, tricellulin; LSR, lipolysis stimulated lipoprotein receptor; Occl, occludin; Cldn5, claudin-5; ZO-1,
zonula occludens protein 1; Cldn12, claudin-12; Cldn25, claudin-25; MD3, marvelD3; Cldn1, claudin-1.
In brain, 24 h after trictide administration, Cldn5 was up-regulated compared to 4 h after
application (1.75 fold) and control group (1.4 fold). Tric was also up-regulated after 24 h
compared to 4 h after application (1.9 fold) and control group (1.7 fold). On the other hand,
LSR was down-regulated after 4 h of treatment compared to control group (58±5%) (Fig.
4.22A).
In kidney, Tric expression was reduced to 65±5% after 4 h and to 32±1% 24 h after trictide
injections. MD3 expression was decreased to 38±9% 24 h after trictide administration.
This effect was highly significant compared to both 4 h (94±8%) and control group mRNA
levels. ZO-1 mRNA was first up-regulated 1.3 fold (131±11%) at 4 h, then down-regulated
(94±1%) 24 h after the treatment (Fig. 4.22B). Cldn25 mRNA was expressed in kidney at
almost the same level as in the brain (Table 26). Cldn25 was down-regulated to 58±1% 24
h after the injections, and this down-regulation is statistically significant compared to 4 h
after application (97±9%) and control group (Fig. 4.22B). The data of mRNA expressions
suggests that trictide has a time-dependent gradual effect at mRNA level. Due to the strong
alterations of important barrier-forming TJ proteins (Tric, Cldn5 and LSR), barrier
properties of mouse brain, kidney and liver were investigated after trictide injections.

RESULTS
87
Fig. 4.22 Trictide causes up-regulation of tricellulin (Tric) and claudin-5 (Cldn5), down-regulation of
lipolysis stimulated lipoprotein receptor (LSR) in brain. Trictide causes down-regulation of Tric,
marvelD3 (MD3), zonula occludens protein 1 (ZO1) and claudin-25 (Cldn25) in kidney. Effect on
messenger RNA (mRNA) of designated proteins (2ΔΔCt
); upon 800 µM of trictide (3.6 µmol/kg) compared to
phosphate-buffered saline (PBS) (red dotted line) intravenous injections (100 µl/ 22 g mouse). 4 h and 24 h
after the administrations, animals were sacrificed and their brains and kidneys were isolated and prepared for
quantitative real-time polymerase chain reaction. (A) mRNA expression of junction proteins in trictide
administered mouse brain. (B) mRNA expression of junction proteins in trictide injected mouse kidney.
mRNA normalized to β-actin (Actb) (ΔCt = Ctjunction protein - Ctactin); Ct, Cycle threshold; Cldn12, claudin-12;
Cldn1, claudin-1; two-way ANOVA test was applied prior to Bonferroni’s comparison post hoc test; mean ±
SEM; n≥4; * P ≤ 0.05, ** P ≤ 0.01, ****P ≤ 0.0001 versus PBS control.
4.3.6.3. Trictide does not change Na-fluorescein uptake of kidney and liver, while
uptake in brain tends to be enhanced
Tric was found to be highly expressed in mouse liver and kidney but low in brain (chapter
4.1). Thus, in vivo experiments were performed to explore trictide’s effect on barrier
properties of brain, liver and kidney. PBS or 800 µM of Trictide (3.6 µmol/kg) was
administered to mice (100 µl/22 g mice) intravenously. After 4 h of peptide injection, mice
were injected again intravenously with Na-fluorescein (0.5 mmol/kg, 100 µl/22 g) and
afterwards perfused for ~10 min. The graphs below show comparison between Na-
fluorescein uptake of kidney, liver and brain taken from trictide or PBS injected animals
(Fig. 4.23).
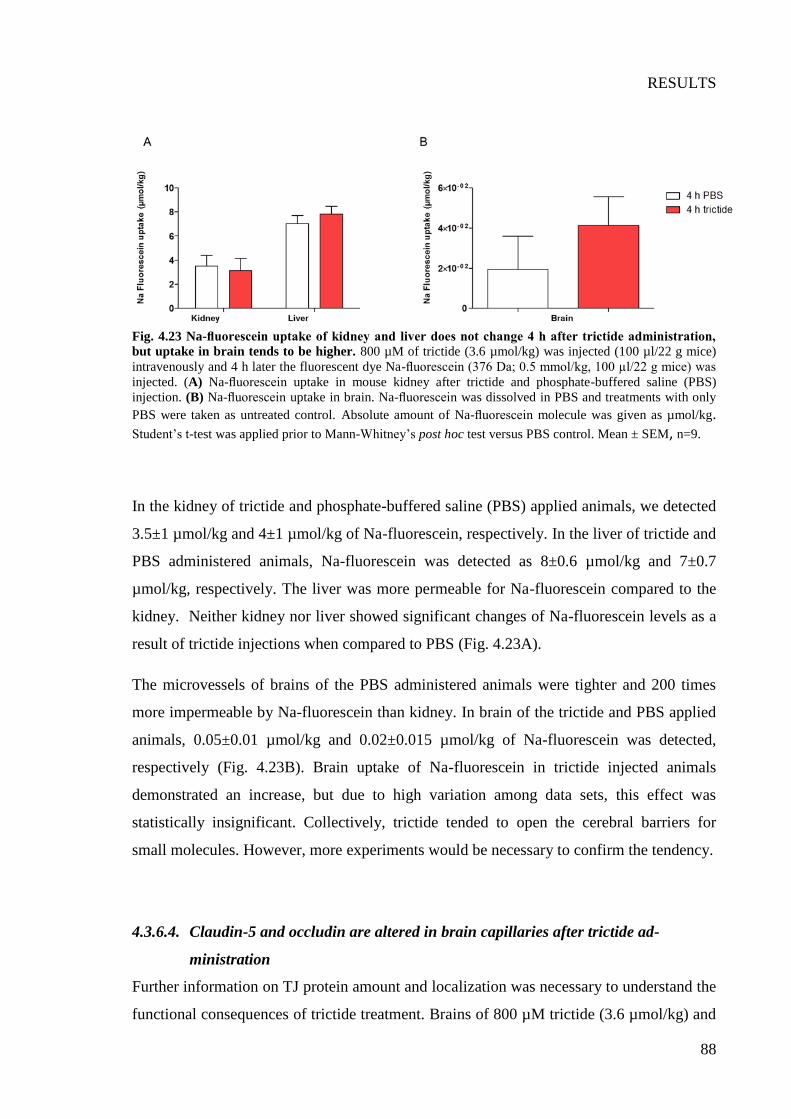
RESULTS
88
Fig. 4.23 Na-fluorescein uptake of kidney and liver does not change 4 h after trictide administration,
but uptake in brain tends to be higher. 800 µM of trictide (3.6 µmol/kg) was injected (100 µl/22 g mice)
intravenously and 4 h later the fluorescent dye Na-fluorescein (376 Da; 0.5 mmol/kg, 100 µl/22 g mice) was
injected. (A) Na-fluorescein uptake in mouse kidney after trictide and phosphate-buffered saline (PBS)
injection. (B) Na-fluorescein uptake in brain. Na-fluorescein was dissolved in PBS and treatments with only
PBS were taken as untreated control. Absolute amount of Na-fluorescein molecule was given as µmol/kg.
Student’s t-test was applied prior to Mann-Whitney’s post hoc test versus PBS control. Mean ± SEM, n=9.
In the kidney of trictide and phosphate-buffered saline (PBS) applied animals, we detected
3.5±1 µmol/kg and 4±1 µmol/kg of Na-fluorescein, respectively. In the liver of trictide and
PBS administered animals, Na-fluorescein was detected as 8±0.6 µmol/kg and 7±0.7
µmol/kg, respectively. The liver was more permeable for Na-fluorescein compared to the
kidney. Neither kidney nor liver showed significant changes of Na-fluorescein levels as a
result of trictide injections when compared to PBS (Fig. 4.23A).
The microvessels of brains of the PBS administered animals were tighter and 200 times
more impermeable by Na-fluorescein than kidney. In brain of the trictide and PBS applied
animals, 0.05±0.01 µmol/kg and 0.02±0.015 µmol/kg of Na-fluorescein was detected,
respectively (Fig. 4.23B). Brain uptake of Na-fluorescein in trictide injected animals
demonstrated an increase, but due to high variation among data sets, this effect was
statistically insignificant. Collectively, trictide tended to open the cerebral barriers for
small molecules. However, more experiments would be necessary to confirm the tendency.
4.3.6.4. Claudin-5 and occludin are altered in brain capillaries after trictide ad-
ministration
Further information on TJ protein amount and localization was necessary to understand the
functional consequences of trictide treatment. Brains of 800 µM trictide (3.6 µmol/kg) and

RESULTS
89
PBS injected mice were cut as thin cryosections and labelled with anti-Cldn5, Tric, Occl
and ZO-1 antibodies. Brain capillaries were imaged by STED microscopy to enable
observation of changes, especially at 3-cell junctions on a molecular level.
Fig. 4.24 Trictide injections caused slight alterations at the localization of claudin-5 (Cldn5) and
tricellulin (Tric), and significant changes of the fluorescence intensity of Cldn5 and occludin (Occl)
proteins. (A) Immunofluorescent STED images of brain capillary of phosphate-buffered saline (PBS)
injected mice (control group). (B) Immunofluorescent STED images of brain capillaries after 800 µM (3.6
µmol/kg) trictide treatment. Tric weakened at tricellular junctions and Cldn5 became poriferous. White
arrows, Tric enrichment at tricellular contacts; dashed lines, representative capillary border; 8 µm brain
cryosections; zoom: 6.0; 100x objective. (C) Fluorescence intensities of brain capillaries from PBS vs. 800
µM trictide injected mice. Cldn5 was down- and Occl was up-regulated after trictide administration. Tric
showed tendency of down-regulation. Zonula occludens protein-1, ZO-1; incubation time after injections, 4
h; measurements were performed with ImageJ; two-way ANOVA test was applied prior to Bonferroni’s
comparison post hoc test; mean±SEM; n=6-16; * P ≤ 0.05, ** P ≤ 0.01 versus PBS control.

RESULTS
90
Cldn5 was included as dominant TJ marker of the BBB and ZO-1 as general cell-cell
contact marker in order to confirm the structures displayed in the images as a brain
capillary (Fig. 4.24A). No greater changes of the localization of Cldn5, ZO-1 and Occl
were observed in the brain capillaries of the trictide group. However, the fluorescence
intensity of Cldn5 and Occl appeared slightly altered in the 2-cell junctions. The Cldn5
intensity was weakened and the contact line seemed to become poriferous (Fig. 4.24B).
Tric signal was not only visible in tricellular but also at bicellular junctions (Fig. 4.24A). It
was possible to distinguish specific Tric signal at tricellular junctions also after trictide
administration. Nevertheless, decline of Tric signal occurred in 3-cell junctions after
trictide treatment in some slices (Fig. 4.24B, white arrows).
Since visual examination of microscopy images was insufficient to prove up- or down-
regulations of the latter proteins, fluorescence intensities of brain capillaries were
quantified for Tric, Cldn5, Occl, and ZO-1. According to that analysis, Cldn5 signal was
reduced and Occl signal increased significantly in brain capillaries of trictide injected
mice. Tric tended towards reduction, while ZO-1 tended to increase (Fig. 4.24C).
Although trictide has a 12 h half-time in blood plasma (Fig. 4.21B), trictide injections did
not significantly increase permeability of brain, kidney and liver barriers (Fig. 4.23). In
addition, there were significant mRNA expression alterations of Cldn5 and Tric in brain,
and of Tric, MD3 and Cldn25 in kidney at 4 h and 24 h after trictide injections (Fig. 4.22).
For further in vivo studies, more experimentation is necessary; barrier permeability and
protein expressions should be more carefully studied approximately 12 h after the
administration.
4.3.7. Trictide structure is predicted as a β-sheet formed by two β-strands with
surface-exposed aromatic residues.
In order to understand trictide’s key structural components for its barrier opening function,
trictide and scrambled trictide were analyzed with CD spectroscopy. The spectra were
compared with reference spectra (Yang et. al., 1986) in order to determine the proportion
of secondary structural elements. On the other hand, 3D structure models of peptides were
obtained and verified by the peptide structure prediction program (PEP-FOLD).

RESULTS
91
Trictide and scrambled trictide mostly showed β–sheet followed by random coil propensity
in phosphate buffer. Moreover, in micelles of SDS a pronounced β–sheet conformation was
found for both trictide and scrambled trictide. TFE favored a weak α-helical secondary
structure propensity, which was not different for trictide and scrambled trictide at
representative wavelengths (Fig. 4.25A). Accordingly, the molar ellipticity (Θ) did not
exhibit a statistically significant difference from characteristic ellipticity minimum (217
nm for β-sheet, 208 and 222 nm for α-helix).
Fig. 4.25. Trictide has mainly the potential to form β-sheet. (A) Circular dichroism spectrograms of
trictide (50 μM) and scrambled trictide (50 μM) in different solvents. Random coil propensity of the peptides
in 10 mM phosphate buffer (PB) (pH 7.4). β-sheet propensity of trictide in PB with 0.5 mM sodium dodecyl
sulfate (SDS) [minimum at 216 nm (red dotted line). Helical propensity of trictide in PB with 60% 2.2.2-
trifluoroethanol (TFE) (two minima expected between 207-222 nm (black dotted lines)], respectively. (B) CD
spectroscopy data (mean±SEM; n=6) and prediction of secondary structural elements by PEP-FOLD.
Abbreviations and conditions as in (A). CD spectroscopy was executed in collaboration with Christian Staat
and Sophie Dithmer.
Structural prediction analysis of trictide by CD spectroscopy revealed high β-sheet
propensity in phosphate buffer (55%) combined with unstructured random domains (36%).
Conditions promoting β-sheet formation (0.5 mM SDS) did not increase the propensity of
peptide to form β-sheet (53%) or unstructured (35%) elements. TFE, an agent which
supports α-helix formation in peptides, only slightly increased the α-helix content from 0 to
11±1%, indicating a very low α-helical potential of trictide (Fig. 4.25B left). The

RESULTS
92
prediction of secondary structural elements by 3D model of trictide with the highest
thermodynamic stability showed a large β-sheet fraction (50%) accompanied by
unstructured segments (33%), just like predictions obtained from CD spectroscopy
(Fig.4.25B).
Scrambled trictide also displayed high β-sheet content in phosphate buffer (54%)
combined with random domains (37%). SDS buffer affected the scrambled trictide affinity
to form β-sheet (43%) or unstructured (39%) elements. The α-helix content of scrambled
trictide was also as low as trictide and did not increase significantly by TFE (Fig. 4.25B).
Taken together, trictide’s β-sheet and random domains propensity obtained from CD
spectroscopy was comparable to PEP-FOLD modeling. Molecular modeling of the
scrambled trictide with the PEP-FOLD program revealed a remarkably greater amount of
randomly arranged amino acids, a lower percentage of β-sheets, and no β-turns when
compared to the trictide structure. α-Helices were not predicted, neither in trictide nor in
the scrambled trictide model. Thus α-helice is not an essential factor for the structure of the
trictide, but β-sheet is important. Since β-sheet is not a discriminating factor, it was not
clear how the β-strands need to be arranged to enable its function.
Fig. 4.26 Trictide structure is predicted as a β-sheet formed by two β-strands with surface-exposed
aromatic residues. (A) PEP-FOLD model of trictide with the highest thermodynamic stability based on
circular dichroism spectroscopic measurements. More than 50% of trictide showed β-sheet propensity of two
β-strands (light blue) connected by a β-turn (green); the aromatic amino acids were localized sidewise of β-
sheet. (B) The PEP-FOLD model of the scrambled peptide exhibited three β-strands compared to trictide
with two β-strands, no β-turn, and a greater amount of random structuring. (A, B) F13, -14, -20, -22, Y10, -
11, and -14 correspond to the amino acid positions in the respective peptide.

RESULTS
93
The importance of aromatic residues in trans-interaction for TJ proteins was previously
revealed for Cldn5 ECL2 (Piontek et al., 2008b). Aromatic amino acids such as F14 and
Y11 were concentrated at the β-turn of the trictide molecule, with outward directed side
chains. Two further aromatic amino acids (Y10, F22) locate at the surface of the β-sheet or
in its close proximity. The β-sheet is formed by two β-strands resulting in an elongated
conformation (Fig. 4.26A). Secondary structure modeling of the scrambled trictide showed
that the aromatic amino acids are randomly distributed along the peptide. Three β-strands
form a more compact β-sheet compared to trictide (Fig. 4.26B). The outward directed
aromatic amino acids are the most important structural difference between trictide and
scrambled trictide. This may account for trictide’s efficiency.
Fig. 4.27 Potential aromatic binding mechanisms of trictide to the human tricellulin (Tric)
extracellular loop two (ECL2). (A) Parallel interaction model proposing binding of Y323’-Y323 and F326’
(trictide) with F334 (Tric ECL2) while F334’ (trictide) binds to Y322. (B) Antiparallel interaction model
proposing binding of Y323-Y323’, Y322 (Tric ECL2)-F326’ (trictide) and F326 (Tric ECL2)-F334’
(trictide). Blue, hydrophilic surface; brown, hydrophobic surface; asterisk, disulfide bridge between yellow
thiol residues. Molecular modeling was executed in collaboration with Jimmi Cording.
Two alternative mechanisms of trictide association with the ECL2 of Tric are shown in
Fig. 4.27. In a parallel interaction mode, the aromatic residues Y323´, F326´ and F334´ in
trictide form a hydrophobic surface at one side of the peptide structure. The postulated
structure of the Tric-ECL2 exhibits a complementary hydrophobic surface formed by
Y322, Y323 and F334 (Fig. 4.27A). Alternatively, Y323´, F326´and F334´ of trictide
might bind in an antiparallel interaction mode to the hydrophobic binding surface at the
Tric-ECL2 structure (Y322, Y323 and F326) (Fig. 4.27B).

RESULTS
94
To conclude, prediction of secondary structural elements did not point out important
differences, but 3D modeling of the peptides highlighted the importance of tertiary
structure and positions of aromatic amino acids.
4.3.8. Single substitutions of aromatic residues in tricellulin extracellular loop 2 do
not alter localization of tricellulin.
The structure of trictide obtained from the molecular modelling approach, taken together
with the ECL2 model of Tric, indicated the essential role of ECL2 aromatic amino acids in
Tric. This prompted us to consider these amino acids as potential binding determinants.
Aromatic residues in ECL2 region of Cldn5 were proven to play a major role in Cldn5’s
trans-interactions and enrichment at Cldn5-contacts (Piontek et al., 2008b). In addition,
Tyr and Phe (Y322, Y323, F326, F334) residues of Tric ECL2 were highly conserved
among vertebrate species (human, chimpanzee, orangutan, bovine, rat, mouse, xenopus)
(Cording et al., 2015). In order to examine individual contributions of Y322, F326 and
F334 amino acids into trans-interaction of Tric, single amino acids were exchanged by
hydrophobic Ala or Ile residues (Fig. 4.28A). Localization pattern of substituted
recombinant Tric was inspected by live-cell imaging (Fig. 4.28B).
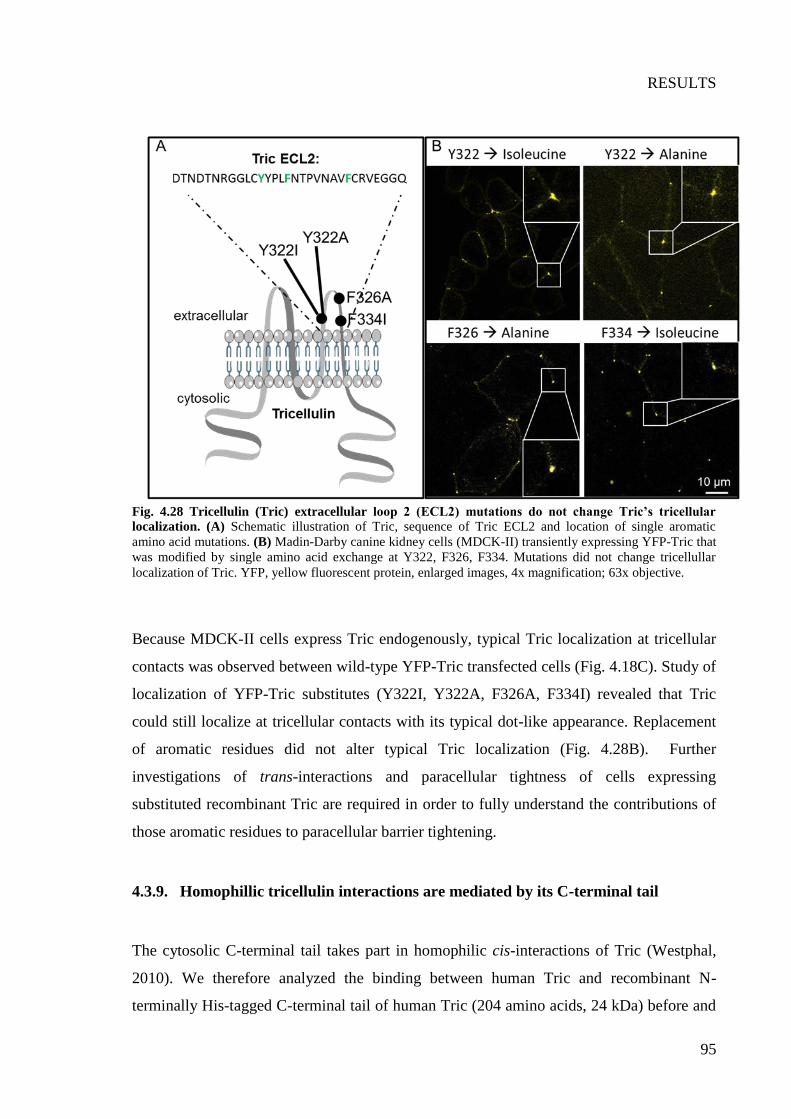
RESULTS
95
Fig. 4.28 Tricellulin (Tric) extracellular loop 2 (ECL2) mutations do not change Tric’s tricellular
localization. (A) Schematic illustration of Tric, sequence of Tric ECL2 and location of single aromatic
amino acid mutations. (B) Madin-Darby canine kidney cells (MDCK-II) transiently expressing YFP-Tric that
was modified by single amino acid exchange at Y322, F326, F334. Mutations did not change tricellullar
localization of Tric. YFP, yellow fluorescent protein, enlarged images, 4x magnification; 63x objective.
Because MDCK-II cells express Tric endogenously, typical Tric localization at tricellular
contacts was observed between wild-type YFP-Tric transfected cells (Fig. 4.18C). Study of
localization of YFP-Tric substitutes (Y322I, Y322A, F326A, F334I) revealed that Tric
could still localize at tricellular contacts with its typical dot-like appearance. Replacement
of aromatic residues did not alter typical Tric localization (Fig. 4.28B). Further
investigations of trans-interactions and paracellular tightness of cells expressing
substituted recombinant Tric are required in order to fully understand the contributions of
those aromatic residues to paracellular barrier tightening.
4.3.9. Homophillic tricellulin interactions are mediated by its C-terminal tail
The cytosolic C-terminal tail takes part in homophilic cis-interactions of Tric (Westphal,
2010). We therefore analyzed the binding between human Tric and recombinant N-
terminally His-tagged C-terminal tail of human Tric (204 amino acids, 24 kDa) before and

RESULTS
96
after trictide administration. The purified protein was incubated with Caco-2 cell lysate for
a co-immunoprecipitation assay. The eluted fraction of the bound proteins was analyzed by
Western Blot. The blot was cut into two pieces. The upper part ≥ 55 kDa was incubated
with anti-Tric antibody due to the larger size of the protein (64 kDa); the lower part was
incubated with anti-His antibody (Fig. 4.29).
The existence of N-terminally His-tagged C-terminal tail of human Tric (Tric C-term)
construct was confirmed by recognition of anti-His antibody at the expected size (blue box,
Fig 4.29). Furthermore, binding of the Tric C-term to full length Tric within the cell lysate
was displayed by recognition of anti-Tric antibody (red box, Fig. 4.29). Co-
immunoprecipitation data proved that homophilic binding of Tric occurs also via its C-
terminal tail in addition to the extracellular domain (see chapter 4.3.5.1, Fig. 4.18D). The
protein band surrounded by green box was observed in between 55 and about 40 kDa and
interpreted as dimer of the Tric C-term construct. This dimer was observed in the upper
part of the blot incubated with anti-Tric antibody that was designed to recognize C-
terminal tail of Tric. The control lane contained only Tric C-term construct without cell
lysate, and therefore no protein band was observed. No considerable change in the amount
of bound protein fractions (Tric + Tric C-term) was observed consequent to trictide
treatment (Fig. 4.29). However, it is essential to conduct more experiments to draw a
conclusion about this effect.

RESULTS
97
4.29 Tricellulin (Tric) binds to Tric with its C-terminal tail. Recombinant N-terminally His
(polyhistidine)-tagged C-terminal tail of human Tric (Tric C-term) was incubated with human colon
carcinoma epithelial cells for 2 h and purified by co-immunoprecipitation method. Control (Cntrl) lane
includes only Tric C-term construct and no cell-lysate. Mw, molecular weight; UT, untreated cell lysate; TT,
150 µM trictide treated cell lysate; incubation time with trictide, 16 h. Upper part of the blot incubated with
anti-Tric antibody, lower part of the blot incubated with anti-His antibody. Red box, full-length Tric (64
kDa); green box, dimer of the Tric C-term (48 kDa); blue box, Tric C-term (24 kDa).

DISCUSSION
98
5. DISCUSSION
Tricellulin is a tight junction protein that mostly localizes at the tricellular tight junctions
and constitutes a cellular barrier by restricting passage of macromolecules through the
paracellular pathway (Ikenouchi et al., 2005; Krug et al., 2009). The ECL2 region of Tric
is known to be involved in trans-association of two Tric proteins and extracellular binding
of three Tric proteins at tTJs. A Tric ECL2 derived peptide called “trictide” was designed
to modulate the tricellular structure, hence the paracellular tightness. Before trictide was
developed, all peptide-based strategies for opening barriers were based on the modulation
of bTJ proteins. Therefore this thesis focuses on revealing tricellular organization of TJ
proteins and altering this organization to increase paracellular permeability.
5.1. TRICELLULIN DETECTED MOSTLY IN EPITHELIAL TISSUE
DOMINANT ORGANS
In previous studies, the Tric expression profile among several mice organs was
investigated (Ikenouchi et al., 2005; Raleigh et al., 2010). Analysis of Tric mRNA
expression in mice organs enabled us to compare epithelial versus endothelial dominant
organs. Additionally, Tric expression in brain is compared to the rest of the covered organs
including different parts of small intestine and colon.
We found that colon is the highest Tric expressing organ and brain is one of the low Tric
expressing endothelial dominant organs. When Tric was identified for the first time, it was
found to be expressed in epithelial-derived tissues excessively (Ikenouchi et al., 2005;
Schlüter et al., 2007). They detected high Tric expression especially in small intestine,
kidney and lung. It was expressed at medium level in liver and at much lower level in testis
and brain. Those results are consistent with the findings of this thesis, except the fact that
parts of small intestine expressed at lower degrees compared to liver according to our
examinations. Ikenouchi et al. (2005) used northern blotting whereas in this thesis qRT-
PCR has been used for Tric profiling. Thus, variances might be caused by different
DISCUSSION
99
methods or other factors like sex and age differences etc. On the other hand, Raleigh and
his colleagues (2010) used two different techniques to analyze mouse Tric in different
organs. Chip-based analysis of transcript profiles demonstrated the highest Tric expression
in kidney, stomach, liver and lung, relatively. Semi-quantitative RT-PCR showed the
highest Tric expression in colon and jejunal epithelium (Raleigh et al., 2010). Tric
expression in brain was mostly found at low levels in both studies (Ikenouchi et al., 2005;
Raleigh et al., 2010). Their results were also consistent with the results of our study, which
investigated Tric expression within mouse organs. Moreover, the greater part of our
investigation is constituted on the stated value of Caco-2 cells as high Tric expressing cell
models (Raleigh et al., 2010).
Cerebral capillary endothelial cells contain TJs that seal between neighboring cells to form
a continuous blood vessel. The volume of capillary and endothelial cell constitutes around
1% and 0.1% of the whole brain tissue volume, respectively (Pardridge et al., 1990). Due
to low percentage of capillary endothelial cells throughout the brain, expressions of TJ
proteins within brain capillaries cannot be abundant. Even though Tric is detected in low
levels in the whole brain, it is expressed higher in the peripheral nervous system compared
to the central nervous system, according to mRNA analysis and immunohistostainings
(Kikuchi et al., 2010). Tric was detected by immunofluorescence stainings of different
frozen mice organ sections (Iwamoto et al., 2014). In mouse cerebrum and cerebellum,
both Tric and LSR were observed at triendothelial contacts (Iwamoto et al., 2014). On the
other hand, Mariano and her colleagues (2013) observed Tric localizing at cell membrane
including both bicellular and tricellular regions, nuclear and perinuclear areas of cultured
endothelial cells, and also co-localizing with Cldn5 in brain microvessels (Mariano et al.,
2013). The latter result is similar to our findings because Tric is observed at bicellular
contacts and co-localizing with Occl and Cldn5 in mouse brain capillaries. In addition, we
demonstrated localization of Tric at tTJs extending through Z-direction. In human brain
microvessels, we observed Tric and LSR more precisely at tricellular contacts similar to
previous findings (Iwamoto et al., 2014; Sohet et al., 2015). It is not possible to make a
clear statement about Tric localization due to different results of ex vivo immunostainings
of human and mouse brain. However, many factors determine the quality of an
immunostaining; like antibody specificity and cross reactivity, low protein expression and
background vs. noise ratio that might affect the results. Taken together, the results of this

DISCUSSION
100
experiment are consistent with previous results and can be improved when considering said
factors.
5.2. TRICTIDE OPENS CELL BARRIERS AND IMPROVES THE PASSAGE OF
IONS AND MACROMOLECULES
In previous studies, TJ peptidomimetics were only derived from Cldns or Occl and targeted
to open the cellular barrier at bTJs. It was demonstrated that Cldn peptides have potential
to modulate bTJ structure and paracellular barrier (Dithmer et al., 2017; Staat et al., 2015;
Zwanziger, Hackel, et al., 2012). For the first time with this study, we focus on opening
paracellular barrier at tricellular contacts. Thus, Tric has been selected as a target because
it was the first TJ protein discovered at tTJ which contributes to paracellular tightness
(Ikenouchi et al., 2005; Krug et al., 2009). Trictide does not show any homology to parts of
other TJ proteins. That is why, trictide is assumed to bind Tric more specifically at a
certain region of the TJ mainly the tTJs. On the other hand, there is limited knowledge of
pathways and mechanisms behind transcriptional regulation of Tric (see chapter 1.3.2.3)
which makes it difficult to evaluate the acquired data.
The ECL parts of two opposing TJ proteins were known to play role in trans-interactions
(Piontek et al., 2008). Similarly, Cys residues in Tric’s ECL2 are found to be involved in
its trans-interactions (Cording et al., 2015). As first-step of trictide, a recombinant protein
was produced from the ECL2 region of human Tric fused with the purification tag MBP.
MBP-Tric ECL2 opens the human colorectal adenocarcinoma cell (Caco-2) barrier for ions
and causes localization changes of TJ proteins. Occludin is observed at submembranous
region and internalized within intracellular vesicles. Tric is also internalized, mostly
together with Occl and shifted to bicellular area. These effects are detected progressively
depending on the increasing concentration of the construct. It is unlikely to see a clear
effect on Occl because an earlier experiment showed that Occl and Tric do not interact
directly (Raleigh et al., 2010). This effect is further investigated by measuring cis-
interactions between TJ proteins and their expression levels (see chapter 5.3).
DISCUSSION
101
Recombinant protein MBP-Tric ECL2 has provided promising results regarding the
modulation of TJ proteins and opening of a cell barrier. This is the reason why trictide (2.7
kDa), a chemically synthesized peptide, has been designed from the ECL2 part of human
Tric313–336. Using a synthetic peptide is preferred to a recombinant protein because it is
cheaper, more reproducible, and allows for easier pharmaceutical applications.
In order to investigate functional alterations like barrier opening and permeability for ions
and macromolecules, and to use a homologous human system for the human trictide, Caco-
2 cells with high Tric expression were used primarily (Berndt, 2017). In previous studies,
peptides were applied for 24-48 h (Dithmer et al., 2017; Sauer et al., 2014; Staat et al.,
2015; Zwanziger, Hackel, et al., 2012). We incubated the cells with trictide for 16 h
because significant effects were obtained at this time. Trictide has a concentration-
dependent effect on both epithelial and endothelial cell lines. The encompassed
concentrations are also tested for cytotoxicity. For Caco-2 cells, 150 µM of trictide is the
preferred working concentration because this concentration increases ion permeability
significantly without causing cytotoxicity. Previous studies also used similar
concentrations in vitro such as 200 µM (Staat et al., 2015) and 100 to 300 µM (Zwanziger,
Hackel, et al., 2012) of Cldn1; and 300 µM of Cldn5 (Dithmer et al., 2017)
peptidomimetics. The working concentration of Cldn5 peptide was also not cytotoxic,
similar to trictide (Dithmer et al., 2017).
The trictide effect is also sequence specific because scrambled trictide does not change any
of the barrier properties. The permeability is increased for molecules up to 10 kDa in
addition to ions. This finding is consistent with that of previous studies undertaken without
peptidomimetics or other treatments. These results proved that Tric selectively tightens for
molecules 4 to 10 kDa (Krug et al., 2009). Hereby we show that by altering Tric’s
function, molecules with 0.4 and 10 kDa are able to pass through central sealing tube while
much bigger sizes (≥40 kDa) cannot. The minimum radius of tTJ central sealing tube was
estimated as 5 nm, (Staehelin, 1973) and the Stokes radius of 10 kDa molecules is 2.3 nm
(Staehelin, 1973). Therefore, a 10 kDa molecule can permeate through tTJ central sealing
tube. Earlier studies using Caco-2 cells and markers of identical size (0.4 and 10 kDa)
reported similar significant increase in paracellular permeability for those markers in
addition to ions (Staat et al., 2015; Zwanziger, Hackel, et al., 2012).

DISCUSSION
102
Interestingly, we saw that 100 µM of trictide decreases permeability compared to untreated
control. ECIS measurements also support this finding with slowly increasing TER of 100
µM trictide. The same effect is observed with 50 µM trictide at filter experiments. Taken
together, a threshold concentration between 50 and 100 µM of trictide is assumed to be
effective. Cells’ recovery from trictide is analyzed by ECIS. We observed that after 21 h of
exposure to trictide (at 47 h), medium is exchanged and the decreasing slope of TER
changes to an increasing slope. This reversal can be interpreted as cell recovery.
D-amino acid derivative of trictide is also considered in this study. Non-physiological D-
amino acids are proven to be degraded slower compared to L-amino acids because of their
reverse conformation (Di, 2015; Werle et al., 2006). Besides, my colleagues obtained
stronger barrier opening with D-amino acid derivative of a Cldn5 peptidomimetic in vivo
(Dithmer et al., 2017). Unfortunately, we did not see any effect of D-trictide in vitro, even
when double concentrations of trictide were administered. D-trictide was therefore
excluded from in vivo experiments. The reason for non-functioning D-trictide could be an
improperly formed tertiary structure. This may be clarified by CD spectroscopy
experiments in the future.
Trictide causes alteration of Cldn5 mRNA expression in Caco-2 cells (see chapter 5.3),
which prompted in vitro investigations of endothelial cells. Cldn5 is expressed in a much
lower amount in Caco-2 cells (Table S2) compared to mouse brain endothelial cells (Table
S3). Besides, it is important to understand the potential of trictide at blood-brain barrier
focused applications. Therefore, once trictide’s efficacy was determined, it was
administered to mouse brain endothelial cells and barrier propertiesafter trictide has been
investigated. Trictide opens the endothelial cell barrier with 75 µM and 100 µM
concentrations starting from 9 h of incubation. When mouse brain endothelial cells were
treated with Cldn5 (300 µM) derived peptides, the TER was reduced to a steady-state after
24 h (Dithmer et al., 2017). In addition, toxicity tests of Cldn5 derived peptides displayed
higher viability compared to trictide, which exhibits cell toxicity starting from 100 µM.
Taken together with the cell cytotoxicity results, it can be stated that the therapeutic
window of trictide is much narrower compared to Cldn5 derived peptides. 50 µM of
trictide does not have an effect, while 100 µM is highly toxic for cells. The working
concentration of Cldn5 derived peptides is also four times higher than trictide without any
cytotoxicity. Scrambled trictide is non-functioning and also not cytotoxic at all.

DISCUSSION
103
Earlier, LSR, Tric and Occl were knocked down to reveal their involvement in barrier
formation and possible interplays between Tric-Occl and LSR-Tric (Ikenouchi et al., 2005;
Ikenouchi et al., 2008; Masuda et al., 2011). According to our research, the tightness of
cell barrier decreases with decreasing Tric expression as it was stated at the discovery of
Tric (Ikenouchi et al., 2005). So trictide does not cause an additional effect on that already
leaky barrier, and the effect of trictide depends on the presence of Tric.
5.3. TRICTIDE MODULATES LOCALIZATION AND EXPRESSION OF
TRICELLULIN AND OTHER TIGHT JUNCTION PROTEINS
Our investigations of barrier functions revealed the fact that both epithelial and endothelial
cell barriers open after trictide administration. However, it is important to recognize which
molecular modulations cause this aperture in order to understand the contribution of
individual TJ proteins in barrier formation and the mechanism of barrier opening. There
are two scenarios that may explain the process through which trictide binds to Tric. The
first scenario assumes that trictide binds to the ECL2 part of Tric and specifically interferes
with the trans-interactions between the proteins that form tTJs (Cording et al., 2015). The
trictide influences the barrier function and eases paracellular passage of compounds
through epithelial and endothelial monolayers. Previous research asserts that after
synthesis, Tric-Occl complexes are transported together to the edges of elongating
bicellular junctions and get separated when tricellular contacts are formed (Westphal et al.,
2010). Thus, the second scenario suggests that trictide binds to Tric ECL2 at bicellular
contacts just after synthesis and before it reaches tricellular contacts. Therefore our
experiments were designed to visualize localization of several TJ proteins and test their
expression at mRNA and protein levels.
We observed that in epithelial cells, Tric is elongated from tTJs to bTJs. This effect is
similar to what is observed under pathological conditions like hypoxia (Cording et al.,
2015). Either by disturbing trans-interactions between the ECL2 parts of Tric or by being
bound to Tric before reaching tTJs, trictide disrupts trimerization and destabilizes
tricellular contacts. Interestingly, Occl is highly affected by trictide treatments. The typical
bicellular signal of Occl is decreased, and the degree of internalization is increased. The

DISCUSSION
104
expression of both mRNA and protein is also down-regulated. It was previously stated that
Occl is highly dynamic at cell membrane. External factors like temperature and the amount
of cholesterol at cell membrane affect the mobile fraction of Occl. Thus, the membrane
fluidity is important for Occl and determines barrier function in parallel (Shen et al., 2008).
In order to understand trictide’s effect on Occl, we conducted FRET analysis to test
whether Occl-Occl cis-interactions are affected. According to FRET, Occl-Occl
interactions are highly affected and results are consistent with microscopic investigations.
Nevertheless it was stated in previous studies that Occl and Tric do not bind directly
(Raleigh et al., 2010). That is why we assume that this must be an indirect effect like the
previously revealed interplay between Occl and Tric (Ikenouchi et al., 2008). Occl
transfected MDCK-II cells are treated with trictide and observed live with spin-disk
microscopy for 15 h. Consequently, we found that Occl is moved towards tTJs
progressively. At 12 h, internalization is visible especially from tricellular contacts. The
internalization increases over time and bicellular signal is severely decreased. The current
investigation also tests fluorescently labelled TAMRA-trictide. As expected, TAMRA
signal is concentrated at tricellular area and loss of Occl signal overlaps with increasing
TAMRA signal. Based on these data, a claim can be made that the peptide acts first at tTJ,
which is then followed by bTJ, and interferes with the membrane fluidity of Occl - a
determiner of barrier properties.
In epithelial cells, LSR is also elongated from tTJs to bTJs acting together with Tric.
Previously, LSR was reported to interact with Tric directly or indirectly through its
cytoplasmic domain. In addition, Tric knockdown cells did not show any alteration at
localization of LSR (Masuda et al., 2011). However, in our study Tric has changed its
localization after trictide that might have caused LSR to elongate towards bTJs together.
LSR expression at mRNA level is also highly affected by trictide treatment just like Tric.
Cldn1 and Cldn5 are known to improve enrichment of Occl and Tric at cell–cell contacts
(Cording et al., 2013). We observed that Cldn1 is translocated to tricellular contacts and
led to a concentrated signal around tricellular area as a result of peptide administration.
Furthermore, it is highly internalized and down-regulated at mRNA level. In previous
studies, it was observed that a Cldn1 derived peptide similarly reduces membrane-
localization of Cldn1(Mrsny et al., 2008). FRET analysis shows that Cldn1-Tric
interactions are significantly decreased, whereas Cldn1-Cldn1 interactions remain constant

DISCUSSION
105
after trictide. Cldn5 is examined with endothelial cells due to high expression levels. Just
like Cldn1, Cldn5 signal is decreased at bTJs but increased around tTJs and extremely
internalized. Cldn5 mRNA is 40% down-regulated in epithelial cells and 35% decreased in
endothelial cells. Detection of Cldn1 and Cldn5 at tricellular contacts can be explained
either by compensatory mechanisms (Cording et al., 2015; Breitkreuz-Korff, 2018) or shift
of TJ proteins to unstabilized tricellular area.
The mRNA of ZO-1 is not affected by trictide in epithelial cells and only insignificantly
decreased in endothelial cells. It is not expected to see a vast effect of trictide on ZO-1
protein. However, we observed that ZO-1 is also internalized and lessened at bicellular
contacts. In addition, STED images confirmed that typical localization of ZO-1 is disturbed
and, additionally, ZO-1 is assembled like a circle at tricellular contacts. Similar results are
obtained with STED images of Tric and Occl proteins in MDCK-II cells. Both results can
be interpreted as a confirmation of the opening of unstabilized tricellular contacts, which
increase permeability of small and large molecules.
FRET measurements confirmed that generally Tric involving protein-protein interactions
are affected by trictide except Occl-Occl interactions, which are possibly affected
indirectly by compensatory mechanisms (Ikenouchi et al., 2008). This strengthens the
argument that Tric is specifically modulated directly from trictide applications.
Nevertheless, other TJ proteins are also found to change their localization and down-
regulate their expression as a result of an indirect or direct trictide influence. The reason
for these modulations is not completely understood.
To sum up, both scenarios are supported by the acquired data, such as elongated signals at
tTJs, disturbed TJ signals at bTJs, and unstabilized tricellular contacts. Indeed, microscopic
investigations revealed the fact that tricellular area is preferentially and highly affected by
trictide. Moreover, Tric is modulated at every expression level, and trictide’s action
depends on Tric’s presence. Most of the affected proteins have direct or indirect relations
with Tric, except Occl. It is also important to acquire more information about
transcriptional regulation of TJ proteins in order to explain down and up-regulations of
their mRNA appropriately.
DISCUSSION
106
5.4. TRICTIDE DOES NOT MODULATE PROPERTIES OF TISSUE BARRIERS
CONSIDERABLY
During in vitro studies, concentration and incubation time are optimized, and the effect of
peptide is examined using various methods. Our objective was to test the drug passage
through tissue barriers of several organs. Trictide is administered via intravenous injections
to avoid the first-pass effect that greatly reduces a drug’s concentration before it reaches
systemic circulation. We selected the highest dose (800 µM) that is soluble without a
solubility enhancer. The administered dose is well tolerated by the animals, weight gain
continues, no behavioral differences are observed compared to control group, and no
edema are observed. Trictide increases the permeability significantly after 16 h in vitro.
However, the proteolytic degradation by plasma proteins plays an additional role in blood
stability and exposure time of the peptide (Werle & Föger, 2018). Ex vivo peptide stability
tests within blood plasma demonstrated that peptide is still detectable up to 48 h, and its
half-life endures approximately 12 h. Therefore, exposure time is expected between 4 h to
24 h. Unlike in previous studies (Sauer et al., 2014; Zwanziger, Hackel, et al., 2012),
exposure time is kept shorter in order to observe a short-term effect (4 h) in addition to a
long-term effect (24 h) . On account of the plasma half-life being determined ex vivo, the
further metabolic and excretion processes responsible for elimination of the peptides are
not considered (Diao & Meibohm, 2013).
After 4 h and 24 h of injections, mRNA expression of several TJ proteins is investigated in
the organ of interest (brain) and the organ with higher Tric expression (kidney). TJ proteins
are selected and grouped for different organs according to their expression levels. In brain,
Cldn5 and Tric are highly up-regulated after 24 h of trictide injections, compared to the
PBS control. These two proteins are important because Cldn5 is the dominant TJ protein in
BBB, and Tric is the target protein of trictide. Interestingly, both proteins are slightly
down-regulated after 4 h as a short-term effect. LSR is also significantly down-regulated
after 4 h. We expected to see in vivo effect of trictide much earlier compared to in vitro,
considering previous studies (Dithmer et al., 2017). Tric, Cldn1, Cldn5 (in colonic
epithelial cells) and LSR, Cldn1, Occl (in mouse endothelial cells) are down-regulated
after trictide administrations (16 h) during the in vitro experiments. When in vivo and in
vitro results are compared in the sense of exposure time, it is notable that 4 h of exposure

DISCUSSION
107
time after peptide injections has a similar influence on mRNA expressions of TJ proteins
with 16 h of peptide incubation. The overexpression of Cldn5 and Tric found after 24 h of
trictide can be an indicator of compensatory mechanism between TJ proteins. Similar
mechanisms are observed between Cldn1-Cldn3 (Breitkreuz-Korff, 2018), Tric-Occl
(Cording et al., 2015; Ikenouchi et al., 2008) and Tric-LSR (Masuda et al., 2011). On the
other hand, previous studies demonstrated that when Cldn1 targeting peptides were
injected into perineurium, the permeability of small and macromolecules was enhanced
and Cldn1 was down-regulated even after 48 h (Sauer et al., 2014; Zwanziger, Hackel, et
al., 2012). Since the outcomes of both in vivo peptidomimetics are different, the reason
behind Cldn5 and Tric up-regulations cannot be totally understood.
In kidney, Tric and MD3 are down-regulated gradually from 3 h to 24 h of trictide
exposure. Tric is highly expressed in mouse kidney as well as in colon (see chapter 4.1).
Therefore, it is reasonable to state that Tric and MD3 are affected in a similar way as
during in vitro experiments. Besides, the effect of trictide on a high Tric expressing organ
is quite comparable to the findings of previous peptidomimetic studies (Dithmer et al.,
2017; Sauer et al., 2014; Zwanziger, Hackel, et al., 2012). Taken together, these findings
show that trictide affected kidney in a more progressive and consistent way, and much
earlier, which can be explained by the peptide’s water-soluble characteristic.
Cldn25 is a recently discovered TJ protein and known to be expressed in brain cerebellum
abundantly (Ohnishi et al., 2017). Cldn25 is used as a control protein in our mRNA
examinations because its sequence is not similar to Tric, (Berndt, 2017) and to date there is
no information about the interaction of Cldn25 and Tric. Surprisingly, Cldn25 is not
affected by trictide in brain, yet it is significantly down-regulated after 24 h of trictide
exposure in kidney. The expression level of Cldn25 in different organs is unknown, and
that is why we are interested by prospects of future studies on Cldn25 expression in
kidney.
The most important part of in vivo investigation is fluorescent uptake of the tissue barriers
after trictide. Therefore, animals were injected with Na-fluorescein (376 Da) after 4 h of
trictide injections. The preliminary tests at 4 h and 24 h intervals did not reveal any
meaningful difference. A significant effect was obtained at the 4 h interval in previous
studies (Dithmer et al., 2017). Hence, we continued with 4 h injections for the uptake tests.
DISCUSSION
108
Na-fluorescein uptake of kidney and liver is not enhanced by trictide injections. Brain has
a tendency to increase the uptake after trictide administration, but the effect is insignificant
due to high variability among datasets. Nevertheless, by increasing the number of
experiments and by applying further optimizations, trictide’s potential for increasing BBB
permeability can be revealed to a greater extent. C5C2, a Cldn5 peptide, was also
administered intravenously at nearly the same dosage (3.5 µmol/kg). The D-amino acid
derivative of C5C2 triggered the strong barrier opening and significant increase of the
brain uptake (Dithmer et al., 2017). Another peptide derived from Cldn5 is also
administered intravenously (2.9 µmol/kg). Evaluations have determined that this peptide
increases Na-fluorescein uptake of brain only if it is applied three times: at 0 h, 18 h and 21
h (Breitkreuz-Korff, 2018). Thus, the applications of trictide can be optimized similarly in
order to enhance the brain’s Na-fluorescein uptake.
The brain sections of trictide injected animals have been prepared for microscopic
investigations. There were no major alterations in the localization of TJ proteins on brain
microvessels that can be spotted visually. Similarly, the immunohistochemical stainings of
brain cryosections of mice treated with Cldn5 derivative did not show a clear peptide-
mediated effect on Cldn5 localization in the TJs (Breitkreuz-Korff, 2018). However, the
Cldn5 signal of brain microvessels from the trictide injected group is detected as more
porous, and total fluorescence is quantified as weaker compared to that of the PBS group.
Furthermore, the tricellular localization of Tric on brain capillaries is slightly decreased
after trictide injection. Surprisingly, the total fluorescence of Occl is quantified as
intensifying significantly in trictide injected animal brains. Unfortunately,
immunohistochemical stainings of trictide injected brain sections cannot provide much
information. More evident changes can be observed within 24 h trictide exposed animal
brains. Since brain is the only organ that shows a tendency of increasing Na-fluorescein
uptake, it was stimulating to examine possible TJ protein modulations in brain. And yet,
the data obtained do not confirm proper functional or visual alterations in vivo.

DISCUSSION
109
5.5. DETERMINATION OF TRICTIDE’S SECONDARY STRUCTURE AND
INTERACTION WITH TRICELLULIN
The structure of trictide is proposed by CD spectroscopy and molecular modeling as an
elongated β-sheet composed of two β-strands with aromatic residues located at the surface
of the peptide. The scrambled peptide exhibits three β-strands in a more compact
organization and with numerous randomly structured sequence fragments. The aromatic
amino acids are positioned in a totally different orientation compared to the trictide
structure. The notable difference between the two structures can be the reason of the lack
of efficacy of the scrambled peptide. Earlier studies have described how trans-interactions
between ECLs of Cldns are mediated by hydrophobic interactions of aromatic amino acids;
we suggest a similar binding mechanism for trictide (Krause et al., 2008; Suzuki et al.,
2014).
The sequence of trictide was not modified to optimize its function like the Cldn5 derived
peptidomimetic (C5C2). When the α-helical propensity of C5C2 is reduced by C-terminal
truncation, this reduction remarkably eliminates barrier-opening function. Distinct from
Tric ECL2 and trictide binding mechanism, hydrogen bond association was proposed
between ECL2 of Cldn5 and C5C2 (Dithmer et al., 2017).
Like trictide, Cldn1 derived peptide has mostly β-sheet propensity, which is important for
its function (Zwanziger, Hackel, et al., 2012). The conserved aromatic residues among
classical claudins (Piehl et al., 2010); Phe and Tyr are suggested as binding elements
between Cldn1 ECL2 and the peptide (Suzuki et al., 2014, Staat, doctoral dissertation
2015). Similarly, the highly conserved amino acids of Tric ECL2, among vertebrate
species, (Cording et al., 2015) are understood to play a role in trictide association
In order to confirm this mechanism, the aromatic core amino acids of Tric ECL2 are
exchanged one by one with amino acids, which are again hydrophobic and smaller in size.
MDCK-II cells are transfected with those recombinant proteins. The typical localization of
Tric remains unchanged, which suggests complete trans-interactions between ECL2s and
stable tricellular contacts. Further investigation of the barrier properties of Tric ECL2
mutated cells is necessary to understand binding mechanism better. Instead of exchanging
aromatic core amino acids individually, all four of them, or different combinations of these

DISCUSSION
110
four amino acids, can be replaced. Until now only the C-terminal coiled-coil domain part
of Tric crystal structure has been revealed (Schuetz et al., 2017). Additional data relevant
to Tric’s 3D structure will stimulate this line of scientific inquiry.
In earlier studies, the structure of Tric ECL2 did not show considerable secondary structure
elements (Cording et al., 2015). The structure of Tric ECL2 and trictide has been modelled
by different methods. The detected differences should be caused by the missing disulfide
bond in trictide. The docking model presents two possible binding mechanisms,
considering that the interactions occur between the hydrophobic surfaces. These binding
mechanisms may explain the disruption of tricellular trans-interactions and the opening of
the paracellular cleft observed in super-resolution STED microscopy and permeation
measurements.

CONCLUSION
111
6. CONCLUSION
Tricellulin (Tric) is a tricellular tight junction (TJ) protein that establishes a barrier by
sealing the intercellular cleft between tricellular cell-cell contacts. We have only limited
information about the exact structure, function and transcriptional regulation of Tric. This
study was conceived in order to better understand the contribution of Tric and other TJ
proteins to the formation of the tricellular contact and maintenance of the proper barrier
function.
Trictide, a synthetic peptide derived from the second extracellular loop of Tric, has been
developed to affect Tric for modulating paracellular tightness to initiate temporary opening
of cell barriers. The functional, structural and molecular changes caused by the peptide
have been examined in order to understand its mode of action and its potential for
pharmacological use. With this work, for the first time tricellular TJs are targeted by using
Tric peptidomimetics for a transient opening.
When all functional and molecular alterations are considered together, it can be stated that
trictide administration opens the cellular barrier transiently for small molecules and
macromolecules until 40 kDa, concentration- and time-dependently. Furthermore, the
disruption of tricellular contacts is revealed by various microscopy techniques such as laser
scanning confocal, gated stimulated emission depletion (STED) and spin disk confocal
microscopy. So it has became clear that destabilization of tricellular contact organization
takes place together with the barrier opening.
However, the molecular alterations at tricellular contacts may not be the only reason for
the trictide-induced barrier opening. Because occludin (Occl) - a bicellular TJ protein - is
shown to be highly internalized at the cell membrane, it is down-regulated at both mRNA
and protein level and the homophilic cis-interaction of Occl is highly decreased after
trictide. Since there is no information to date about direct interaction between Tric and
Occl, trictide’s influence on Occl is assumed as an indirect or unspecific effect.
Additionally, MD3, LSR, Cldn1 and Cldn5 are down-regulated at mRNA but not at protein
level. Therefore, they are not considered as direct targets. Considering long-term (15 h)
live-cell screening of trictide displaying initial decomposition of cell junctions at tricellular

CONCLUSION
112
contacts, the alteration of other tricellular or bicellular TJ proteins should be a secondary
effect.
The determined working concentration of the peptide was not toxic for cells. Since the
therapeutic window of trictide is relatively narrow, concentrations between 125 and 150
µM would be worth for further investigations of the barrier opening activity.
Trictide has been implemented into in vivo experiments in order to modulate tissue
barriers. We only observed a tendency of increased intake of small molecules into the
brain. In vivo investigation of trictide still needs further optimization of administration as
well as for the modification of the peptide. To optimize the pharmacokinetic profile of
trictide and to minimize its recognition by peptidases, the peptide should be PEGylated or
modified by fatty acids. The use of D-amino acids has been another option to increase
trictide’s stability and availability in the blood. However, D-trictide does not efficiently
alter barrier properties, most probably due to its conformational problems.
Moreover, trictide should be modified, as successfully applied in previous studies for
claudin peptidomimetics (Dithmer et al., 2017) for instance by extension. Moreover, basic
amino acids such as arginine, histidine and lysine should be introduced, which is known to
enhance cell penetration of the peptide and gain admission into the cell (Madani et al.,
2011). Most importantly, aromatic amino acids that are proposed to form the binding core
should be exchanged to prove their importance in trictide’s efficacy.
Due to its unique structure and function, Tric is expressed among all tissue barriers of all
organs, unlike Cldn5, which is abundantly expressed only in a few organs, for instance in
the capillaries of the brain. As Tric appears in ubiquitary distribution in all barriers,
systemic administration is impossible to modulate a specific barrier selectively. Therefore,
local administration is recommended. A drug combined with trictide could be given
directly to the artery of a certain organ, like intra-arterial use of some chemotherapeutics in
treating retinoblastoma (Yamane et al., 2004). The opening of the tissue barrier and the
facilitated uptake of a certain drug by trictide will provide advantages in treatment
protocols. Trictide’s usage in tissues with tighter barriers like the brain and eye is
particularly beneficial. Because by facilitating intracellular uptake of the drug, the dose of
the drug could be lowered and drug efficacy could be increased.

CONCLUSION
113
The general relevance of this dissertation is found in its novel revelations about molecular
modifications of the addressed TJ proteins triggered by trictide-induced Tric modulation.
The barrier opening for molecules smaller than 40 kDa and destabilization of tricellular
contacts is the proof of mechanism that trictide interferes with the interaction between the
opposing extracellular regions of Tric contributing to the paracellular tightness. We
propose trictide as a drug enhancer to increase the permeability of TJ-based tissue barriers
and thereby effectuate a general drug-delivery strategy.

REFERENCES
114
REFERENCES
Abbott, N. J. (2013). Blood-brain barrier structure and function and the challenges for CNS
drug delivery. Journal of Inherited Metabolic Disease, 36(3), 437–449.
https://doi.org/10.1007/s10545-013-9608-0
Alexandre, M. D., Jeansonne, B. G., Renegar, R. H., Tatum, R., & Chen, Y. H. (2007). The
first extracellular domain of claudin-7 affects paracellular Cl- permeability.
Biochemical and Biophysical Research Communications, 357(1), 87–91.
https://doi.org/10.1016/j.bbrc.2007.03.078
Amasheh, S., Meiri, N., Gitter, A. H., Schöneberg, T., Mankertz, J., Schulzke, J. D., &
Fromm, M. (2002). Claudin-2 expression induces cation-selective channels in tight
junctions of epithelial cells. Journal of Cell Science, 115(Pt 24), 4969–4976.
https://doi.org/10.1242/jcs.00165
Amasheh, S., Schmidt, T., Mahn, M., Florian, P., Mankertz, J., Tavalali, S., … Fromm, M.
(2005). Contribution of claudin-5 to barrier properties in tight junctions of epithelial
cells. Cell and Tissue Research, 321(1), 89–96. https://doi.org/10.1007/s00441-005-
1101-0
Asma Nusrat, G. Thomas Brown,Jeffrey Tom, Alex Drake, Tam T.T. Bui, Cliff Quan, and
R. J. M. (2005). Multiple Protein Interactions Involving Proposed Extracellular Loop
Domains of the Tight Junction Protein Occludin. Molecular Biology of the Cell,
16(8), 1725–1734. https://doi.org/10.1091/mbc.E04
Balda, M. S., Gonzalez-Mariscal, L., Matter, K., Cereijido, M., & Anderson, J. M. (1993).
Assembly of the tight junction: The role of diacylglycerol. Journal of Cell Biology,
123(2), 293–302. https://doi.org/10.1083/jcb.123.2.293
Bazzoni, G. (2004a). Endothelial Cell-to-Cell Junctions: Molecular Organization and Role
in Vascular Homeostasis. Physiological Reviews, 84(3), 869–901.
https://doi.org/10.1152/physrev.00035.2003
Bazzoni, G. (2004b). Endothelial Cell-to-Cell Junctions: Molecular Organization and Role
in Vascular Homeostasis. Physiological Reviews, 84(3), 869–901.
https://doi.org/10.1152/physrev.00035.2003
Beeman, N. E., Baumgartner, H. K., Webb, P. G., Schaack, J. B., & Neville, M. C. (2009).
Disruption of occludin function in polarized epithelial cells activates the extrinsic
pathway of apoptosis leading to cell extrusion without loss of transepithelial
resistance. BMC Cell Biology, 10(1), 85. https://doi.org/10.1186/1471-2121-10-85

REFERENCES
115
Bellmann, C., Schreivogel, S., Günther, R., Dabrowski, S., Schümann, M., Wolburg, H., &
Blasig, I. E. (2014). Highly conserved cysteines are involved in the oligomerization of
occludin-redox dependency of the second extracellular loop. Antioxidants & Redox
Signaling, 20(6), 855–67. https://doi.org/10.1089/ars.2013.5288
BERNDT, P. (2017). Claudins and tight junction-associated MARVEL proteins at the
blood-brain barrier – contribution to paracellular barrier formation. (Doctoral
dissertation). Retrieved from https://refubium.fu-berlin.de/handle/fub188/8149
Blasig, I., Bellmann, C., Cording, J., & Vecchio, G. (2011). Occludin protein family:
oxidative stress and reducing conditions. Antioxidants & Redox. Retrieved from
/citations?view_op=view_citation&continue=/scholar%3Fhl%3Den%26as_sdt%3D0,
5%26scilib%3D1&citilm=1&citation_for_view=PD5Opp4AAAAJ:u5HHmVD_uO8
C&hl=en&oi=p
Brandsch, M., Knütter, I., & Bosse-Doenecke, E. (2008). Pharmaceutical and
pharmacological importance of peptide transporters. The Journal of Pharmacy and
Pharmacology, 60(5), 543–585. https://doi.org/10.1211/jpp.60.5.0002
Breitkreuz-Korff, O. (2017) Charakterisierung und Modulation von Claudinen zur
Öffnung der Blut-Hirn-Schranke (Doctoral dissertation). Retrieved from
https://refubium.fu-berlin.de/bitstream/handle/fub188/4165/Dissertation_
Olga_Breitkreuz-Korff.pdf?sequence=1
Buck, M. (1998). Trifluoroethanol and colleagues: cosolvents come of age. Recent studies
with peptides and proteins. Quarterly Reviews of Biophysics, 31(3), 297–355.
Burgess, A., & Hynynen, K. H. (2014). Drug delivery across the blood-brain barrier using
focused ultrasound. Expert Opinion on Drug Delivery, 11(5), 711–721.
https://doi.org/10.1517/17425247.2014.897693
Campbell, M., Nguyen, A. T. H., Kiang, A.-S., Tam, L. C. S., Gobbo, O. L., Kerskens, C.,
… Humphries, P. (2009). An experimental platform for systemic drug delivery to the
retina. Proceedings of the National Academy of Sciences of the United States of
America, 106(42), 17817–22. https://doi.org/10.1073/pnas.0908561106
Chaplin, D. D. (2010). Overview of the immune response. Journal of Allergy and Clinical
Immunology, 125(2 SUPPL. 2), S3–S23. https://doi.org/10.1016/j.jaci.2009.12.980
Chung, N. P., Mruk, D., Mo, M. Y., Lee, W. M., & Cheng, C. Y. (2001). A 22-amino acid
synthetic peptide corresponding to the second extracellular loop of rat occludin
perturbs the blood-testis barrier and disrupts spermatogenesis reversibly in vivo.

REFERENCES
116
Biology of Reproduction, 65(5), 1340–1351.
https://doi.org/10.1095/biolreprod65.5.1340
Citi, S., & Cordenosi, M. (1998). Tight junction proteins. Biochim. Biophys. Acta, 1448, 1–
11.
Colegio, O. R., Van Itallie, C. M., McCrea, H. J., Rahner, C., & Anderson, J. M. (2002).
Claudins create charge-selective channels in the paracellular pathway between
epithelial cells. American Journal of Physiology. Cell Physiology, 283(1), C142–
C147. https://doi.org/10.1152/ajpcell.00038.2002
Cording, J., Arslan, B., Staat, C., Dithmer, S., Krug, S. M., Krüger, A., … Haseloff, R. F.
(2017). Trictide, a tricellulin-derived peptide to overcome cellular barriers. Annals of
the New York Academy of Sciences, 1405(1), 89–101.
https://doi.org/10.1111/nyas.13392
Cording, J., Berg, J., Käding, N., Bellmann, C., Tscheik, C., Westphal, J. K., … Blasig, I.
E. (2013). In tight junctions, claudins regulate the interactions between occludin,
tricellulin and marvelD3, which, inversely, modulate claudin oligomerization. Journal
of Cell Science, 126(Pt 2), 554–64. https://doi.org/10.1242/jcs.114306
Cording, J., Günther, R., Vigolo, E., Tscheik, C., Winkler, L., Schlattner, I., … Blasig, I. E.
(2015). Redox Regulation of Cell Contacts by Tricellulin and Occludin: Redox-
Sensitive Cysteine Sites in Tricellulin Regulate Both Tri- and Bicellular Junctions in
Tissue Barriers as Shown in Hypoxia and Ischemia. Antioxidants & Redox Signaling,
0(0), 150608093200004. https://doi.org/10.1089/ars.2014.6162
Corrêa, D. H. a, Ramos, C. H. I., & Correa, D. (2009). The use of circular dichroism
spectroscopy to study protein folding, form and function. African J Biochem Res,
3(5), 164–173. https://doi.org/not available
Czulkies, B. A., Mastroianni, J., Lutz, L., Lang, S., Schwan, C., Schmidt, G., …
Papatheodorou, P. (2016). Loss of LSR affects epithelial barrier integrity and tumor
xenograft growth of CaCo-2 cells. Oncotarget, 8(23), 37009–37022.
https://doi.org/10.18632/oncotarget.10425
Dai, T., Jiang, K., & Lu, W. (2018). Liposomes and lipid disks traverse the BBB and
BBTB as intact forms as revealed by two-step Förster resonance energy transfer
imaging. Acta Pharmaceutica Sinica B, 8(2), 261–271.
https://doi.org/10.1016/j.apsb.2018.01.004
Denker, B. M., & Nigam, S. K. (1998). Molecular structure and assembly of the tight

REFERENCES
117
junction. Am J Physiol, 274(1 Pt 2), F1-9. Retrieved from
http://www.ncbi.nlm.nih.gov/entrez/query.fcgi?cmd=Retrieve&db=PubMed&dopt=Ci
tation&list_uids=9458817
Di, L. (2015). Strategic approaches to optimizing peptide ADME properties. The AAPS
Journal, 17(1), 134–43. https://doi.org/10.1208/s12248-014-9687-3
Diao, L., & Meibohm, B. (2013). Pharmacokinetics and Pharmacokinetic--
Pharmacodynamic Correlations of Therapeutic Peptides. Clinical Pharmacokinetics,
52(10), 855–868. https://doi.org/10.1007/s40262-013-0079-0
Dithmer, S., Staat, C., Müller, C., Ku, M. C., Pohlmann, A., Niendorf, T., … Winkler, L.
(2017). Claudin peptidomimetics modulate tissue barriers for enhanced drug delivery.
Annals of the New York Academy of Sciences, 1397(1), 169–184.
https://doi.org/10.1111/nyas.13359
Dokmanovic-Chouinard, M., Chung, W. K., Chevre, J.-C., Watson, E., Yonan, J.,
Wiegand, B., … Leibel, R. L. (2008). Positional Cloning of “Lisch-like”, a Candidate
Modifier of Susceptibility to Type 2 Diabetes in Mice. PLoS Genetics, 4(7),
e1000137. https://doi.org/10.1371/journal.pgen.1000137
E.PALADE, M. G. F. and G. (1963). JUNCTIONAL COMPLEXES IN VARIOUS
EPITHELIA. The Journal of Cell Biology, 17, 375–412.
https://doi.org/10.1083/jcb.17.2.375
El Maghraby, G. M., Barry, B. W., & Williams, A. C. (2008). Liposomes and skin: From
drug delivery to model membranes. European Journal of Pharmaceutical Sciences,
34(4–5), 203–222. https://doi.org/10.1016/J.EJPS.2008.05.002
Elizabeth McNeil, Christopher T. Capaldo, and I. G. M. (2006). Zonula Occludens-1
Function in the Assembly of Tight Junctions in Madin-Darby Canine Kidney
Epithelial Cells. Molecular Biology of the Cell, 17(2), 1922–1932.
https://doi.org/10.1091/mbc.E05
Everett, R. S., Vanhook, M. K., Barozzi, N., Toth, I., & Johnson, L. G. (2006). Specific
modulation of airway epithelial tight junctions by apical application of an occludin
peptide. Molecular Pharmacology, 69(2), 492–500.
https://doi.org/10.1124/mol.105.017251
F. Lacaz-Vieira1, M.M.M. Jaeger2, P. Farshori3, B. K. (1999). Small Synthetic Peptides
Homologous to Segments of the First External Loop of Occludin Impair Tight
Junction Resealing. Membrane Biology, 168, 289–297.

REFERENCES
118
https://doi.org/10.1007/s00232-001-0030-4
Fanning, A. S., & Anderson, J. M. (2013). Regulate the Assembly of Cellular Junctions,
113–120. https://doi.org/10.1111/j.1749-6632.2009.04440.x.Zonula
Fanning, A. S., Jameson, B. J., Jesaitis, L. A., & Anderson, J. M. (1998). The tight junction
protein ZO-1 establishes a link between the transmembrane protein occludin and the
actin cytoskeleton. Journal of Biological Chemistry, 273(45), 29745–29753.
https://doi.org/10.1074/jbc.273.45.29745
Fukumatsu, M., Ogawa, M., Arakawa, S., Suzuki, M., Nakayama, K., Shimizu, S., …
Sasakawa, C. (2012). Shigella targets epithelial tricellular junctions and uses a
noncanonical clathrin-dependent endocytic pathway to spread between cells. Cell
Host and Microbe, 11(4), 325–336. https://doi.org/10.1016/j.chom.2012.03.001
Furuse, M., Fujita, K., Hiiragi, T., Fujimoto, K., & Tsukita, S. (1998). Claudin-1 and -2:
Novel integral membrane proteins localizing at tight junctions with no sequence
similarity to occludin. Journal of Cell Biology, 141(7), 1539–1550.
https://doi.org/10.1083/jcb.141.7.1539
Furuse, M., Furuse, K., Sasaki, H., & Tsukita, S. (2001). Conversion of zonulae
occludentes from tight to leaky strand type by introducing claudin-2 into Madin-
Darby canine kidney I cells. Journal of Cell Biology, 153(2), 263–272.
https://doi.org/10.1083/jcb.153.2.263
Furuse, M., Hata, M., Furuse, K., Yoshida, Y., Haratake, A., Sugitani, Y., … Tsukita, S.
(2002). Claudin-based tight junctions are crucial for the mammalian epidermal
barrier: A lesson from claudin-1-deficient mice. Journal of Cell Biology, 156(6),
1099–1111. https://doi.org/10.1083/jcb.200110122
Furuse, M., Hirase, T., Itoh, M., Nagafuchi, A., Yonemura, S., Tsukita, S., & Tsukita, S.
(1993). Occludin: A novel integral membrane protein localizing at tight junctions.
Journal of Cell Biology, 123(6 II), 1777–1788. https://doi.org/10.1083/jcb.123.6.1777
Furuse, M., Itoh, M., Hirase, T., Nagaftichi, A., Yonemura, S., Tsukita, S., & Tsukita, S.
(1994). Direct association of occludin with ZO-1 and its possible involvement in the
localization of occludin at tight junctions. Journal of Cell Biology, 127(6 I), 1617–
1626. https://doi.org/10.1083/jcb.127.6.1617
Furuse, M., Sasaki, H., & Tsukita, S. (1999). Between Tight Junction Strands. Cell, 147(4),
891–903.
Giepmans, B. N. G., & Moolenaar, W. H. (1998). The gap junction protein connexin43

REFERENCES
119
interacts with the second PDZ domain of the zona occludens-1 protein. Current
Biology, 8(16), 931–934. https://doi.org/10.1016/S0960-9822(07)00375-2
Gopal, R., Park, J. S., Seo, C. H., & Park, Y. (2012). Applications of Circular Dichroism
for Structural Analysis of Gelatin and Antimicrobial Peptides, 3229–3244.
https://doi.org/10.3390/ijms13033229
Grauel, M. K., Maglione, M., Reddy-Alla, S., Willmes, C. G., Brockmann, M. M.,
Trimbuch, T., … Rosenmund, C. (2016). RIM-binding protein 2 regulates release
probability by fine-tuning calcium channel localization at murine hippocampal
synapses. Proceedings of the National Academy of Sciences, 113(41), 11615–11620.
https://doi.org/10.1073/pnas.1605256113
Greene, C., & Campbell, M. (2016). Tight junction modulation of the blood brain barrier:
CNS delivery of small molecules. Tissue Barriers, 4(1).
https://doi.org/10.1080/21688370.2015.1138017
Greenfield, N., & Fasman, G. D. (1969). Computed Circular Dichroism Spectra for the
Evaluation of Protein Conformation. Biochemistry, 8(10), 4108–4116.
https://doi.org/10.1021/bi00838a031
Guillemot, L., Paschoud, S., Pulimeno, P., Foglia, A., & Citi, S. (2008). The cytoplasmic
plaque of tight junctions: A scaffolding and signalling center. Biochimica et
Biophysica Acta - Biomembranes, 1778(3), 601–613.
https://doi.org/10.1016/j.bbamem.2007.09.032
Gumbiner, B., Lowenkopf, T., & Apatira, D. (1991). Identification of a 160-kDa
polypeptide that binds to the tight junction protein ZO-1. Proceedings of the National
Academy of Sciences of the United States of America, 88(8), 3460–4.
https://doi.org/10.1073/pnas.88.8.3460
Gumbiner, B. M. (1993). Breaking through the tight junction barrier. The Journal of Cell
Biology, 123(6), 1631 LP-1633. Retrieved from
http://jcb.rupress.org/content/123/6/1631.abstract
Günzel, D., & Yu, A. S. L. (2013). Claudins and the modulation of tight junction
permeability. Physiological reviews (Vol. 93).
https://doi.org/10.1152/physrev.00019.2012
Higashi, T., Katsuno, T., Kitajiri, S. I., & Furuse, M. (2015). Deficiency of angulin-
2/ILDR1, a tricellular tight junction-associated membrane protein, causes deafness
with cochlear hair cell degeneration in mice. PLoS ONE, 10(3).

REFERENCES
120
https://doi.org/10.1371/journal.pone.0120674
Higashi, T., Tokuda, S., Kitajiri, S. -i., Masuda, S., Nakamura, H., Oda, Y., & Furuse, M.
(2013). Analysis of the “angulin” proteins LSR, ILDR1 and ILDR2 - tricellulin
recruitment, epithelial barrier function and implication in deafness pathogenesis.
Journal of Cell Science, 126(16), 3797–3797. https://doi.org/10.1242/jcs.138271
Hou, J., Renigunta, A., Yang, J., & Waldegger, S. (2010). Claudin-4 forms paracellular
chloride channel in the kidney and requires claudin-8 for tight junction localization.
Proceedings of the National Academy of Sciences of the United States of America,
107, 18010–18015. https://doi.org/10.1073/pnas.1009399107
Ikenouchi, J., Furuse, M., Furuse, K., Sasaki, H., Tsukita, S., & Tsukita, S. (2005).
Tricellulin constitutes a novel barrier at tricellular contacts of epithelial cells. The
Journal of Cell Biology, 171(6), 939–45. https://doi.org/10.1083/jcb.200510043
Ikenouchi, J., Sasaki, H., Tsukita, S., Furuse, M., & Tsukita, S. (2008). Loss of occludin
affects tricellular localization of tricellulin. Molecular Biology of the Cell, 19(11),
4687–93. https://doi.org/10.1091/mbc.E08-05-0530
Ikenouchi, J., Umeda, K., Tsukita, S., Furuse, M., & Tsukita, S. (2007). Requirement of
ZO-1 for the formation of belt-like adherens junctions during epithelial cell
polarization. Journal of Cell Biology, 176(6), 779–786.
https://doi.org/10.1083/jcb.200612080
Itoh, M., Morita, K., & Tsukita, S. (1999). Characterization of ZO-2 as a MAGUK family
member associated with tight as well as adherens junctions with a binding affinity to
occludin and α catenin. Journal of Biological Chemistry, 274(9), 5981–5986.
https://doi.org/10.1074/jbc.274.9.5981
Iwamoto, N., Higashi, T., & Furuse, M. (2014). Localization of angulin-1/LSR and
tricellulin at tricellular contacts of brain and retinal endothelial cells in vivo. Cell
Structure and Function, 39(1), 1–8. https://doi.org/10.1247/csf.13015
Jennek, S., Mittag, S., Reiche, J., Westphal, J. K., Seelk, S., Dörfel, M. J., … Huber, O.
(2017). Tricellulin is a target of the ubiquitin ligase itch. Annals of the New York
Academy of Sciences, 1397(1), 157–168. https://doi.org/10.1111/nyas.13349
Kamitani, T., Sakaguchi, H., Tamura, A., Miyashita, T., Yamazaki, Y., Tokumasu, R., …
Tsukita, S. (2015). Deletion of Tricellulin Causes Progressive Hearing Loss
Associated with Degeneration of Cochlear Hair Cells. Scientific Reports,
5(December), 1–12. https://doi.org/10.1038/srep18402

REFERENCES
121
Katahira, J., Inoue, N., Horiguchi, Y., Matsuda, M., & Sugimoto, N. (1997). Molecular
cloning and functional characterization of the receptor for Clostridium perfringens
enterotoxin. The Journal of Cell Biology, 136(6), 1239–47.
https://doi.org/10.1083/jcb.136.6.1239
Kenworthy, A. K. (2001). Imaging protein-protein interactions using fluorescence
resonance energy transfer microscopy. Methods, 24(3), 289–296.
https://doi.org/10.1006/meth.2001.1189
Kikuchi, S., Ninomiya, T., Tatsumi, H., Sawada, N., & Kojima, T. (2010). Tricellulin is
expressed in autotypic tight junctions of peripheral myelinating Schwann cells. The
Journal of Histochemistry and Cytochemistry : Official Journal of the Histochemistry
Society, 58(12), 1067–73. https://doi.org/10.1369/jhc.2010.956326
Kiuchi-Saishin, Y., Gotoh, S., Furuse, M., Takasuga, A., Tano, Y., & Tsukita, S. (2002).
Differential expression patterns of claudins, tight junction membrane proteins, in
mouse nephron segments. Journal of the American Society of Nephrology : JASN,
13(4), 875–886.
Kobrinsky, N. L., Packer, R. J., Boyett, J. M., Stanley, P., Shiminski-Maher, T., Allen, J.
C., … Finlay, J. L. (1999). Etoposide With or Without Mannitol for the Treatment of
Recurrent or Primarily Unresponsive Brain Tumors: A Children’s Cancer Group
Study, CCG-9881. Journal of Neuro-Oncology, 45(1), 47–54.
https://doi.org/10.1023/A:1006333811437
Kojima, T., Fuchimoto, J., Yamaguchi, H., Ito, T., Takasawa, A., Ninomiya, T., …
Sawada, N. (2010). c-Jun N-terminal kinase is largely involved in the regulation of
tricellular tight junctions via tricellulin in human pancreatic duct epithelial cells.
Journal of Cellular Physiology, 225(3), 720–733. https://doi.org/10.1002/jcp.22273
Kondoh, M., Takahashi, A., Fujii, M., Yagi, K., & Watanabe, Y. (2006). A novel strategy
for a drug delivery system using a claudin modulator. Biological & Pharmaceutical
Bulletin, 29(9), 1783–9. https://doi.org/10.1248/bpb.29.1783
Krause, G., Winkler, L., Mueller, S. L., Haseloff, R. F., Piontek, J., & Blasig, I. E. (2008).
Structure and function of claudins. Biochimica et Biophysica Acta, 1778(3), 631–45.
https://doi.org/10.1016/j.bbamem.2007.10.018
Kreuter, J., & Gelperina, S. (2008). Use of nanoparticles for cerebral cancer. Tumori,
94(2), 271–277.
Krug, S., Amasheh, S., Richter, J., Milatz, S., & Günzel, D. (2009). Tricellulin forms a

REFERENCES
122
barrier to macromolecules in tricellular tight junctions without affecting ion
permeability. Molecular Biology of the. Retrieved from
/citations?view_op=view_citation&continue=/scholar%3Fhl%3Den%26as_sdt%3D0,
5%26scilib%3D1&citilm=1&citation_for_view=PD5Opp4AAAAJ:d1gkVwhDpl0C
&hl=en&oi=p
Krug, S. M., Hayaishi, T., Iguchi, D., Watari, A., Takahashi, A., Fromm, M., … Kondoh,
M. (2017). Angubindin-1, a novel paracellular absorption enhancer acting at the
tricellular tight junction. Journal of Controlled Release, 260(March), 1–11.
https://doi.org/10.1016/j.jconrel.2017.05.024
Lee, H. J., & Zheng, J. J. (2010). PDZ domains and their binding partners: Structure,
specificity, and modification. Cell Communication and Signaling, 8, 1–18.
https://doi.org/10.1186/1478-811X-8-8
Li, Y., Fanning, A. S., Anderson, J. M., & Lavie, A. (2005). Structure of the conserved
cytoplasmic C-terminal domain of occludin: Identification of the ZO-1 binding
surface. Journal of Molecular Biology, 352(1), 151–164.
https://doi.org/10.1016/j.jmb.2005.07.017
Lindmark, T., Schipper, N., Lazorová, L., de Boer, a G., & Artursson, P. (1998).
Absorption enhancement in intestinal epithelial Caco-2 monolayers by sodium
caprate: assessment of molecular weight dependence and demonstration of transport
routes. Journal of Drug Targeting, 5(3), 215–23.
https://doi.org/10.3109/10611869808995876
Luissint, A.-C., Artus, C., Glacial, F., Ganeshamoorthy, K., & Couraud, P.-O. (2012).
Tight junctions at the blood brain barrier: physiological architecture and disease-
associated dysregulation. Fluids and Barriers of the CNS, 9(1), 23.
https://doi.org/10.1186/2045-8118-9-23
Marchiando, A. M., Graham, W. V., & Turner, J. R. (2010). Epithelial barriers in
homeostasis and disease. Annual Review of Pathology, 5, 119–144.
https://doi.org/10.1146/annurev.pathol.4.110807.092135
Mariano, C., Palmela, I., Pereira, P., Fernandes, A., Falcão, A. S., Cardoso, F. L., … Brito,
M. A. (2013). Tricellulin expression in brain endothelial and neural cells. Cell and
Tissue Research, 351(3), 397–407. https://doi.org/10.1007/s00441-012-1529-y
Markov, A. G., Veshnyakova, A., Fromm, M., Amasheh, M., & Amasheh, S. (2010).
Segmental expression of claudin proteins correlates with tight junction barrier

REFERENCES
123
properties in rat intestine. Journal of Comparative Physiology B: Biochemical,
Systemic, and Environmental Physiology, 180(4), 591–598.
https://doi.org/10.1007/s00360-009-0440-7
Masuda, S., Oda, Y., Sasaki, H., Ikenouchi, J., Higashi, T., Akashi, M., … Furuse, M.
(2011). LSR defines cell corners for tricellular tight junction formation in epithelial
cells. Journal of Cell Science, 124(Pt 4), 548–55. https://doi.org/10.1242/jcs.072058
Medina, R., Rahner, C., Mitic, L. L., Anderson, J. M., & Van Itallie, C. M. (2000).
Occludin localization at the tight junction requires the second extracellular loop.
Journal of Membrane Biology, 178(3), 235–247.
https://doi.org/10.1007/s002320010031
Mineta, K., Yamamoto, Y., Yamazaki, Y., Tanaka, H., Tada, Y., Saito, K., … Tsukita, S.
(2011). Predicted expansion of the claudin multigene family. FEBS Letters, 585(4),
606–612. https://doi.org/10.1016/j.febslet.2011.01.028
Morita, K., Furuse, M., Fujimoto, K., & Tsukita, S. (1999). Morita, K., Furuse, M.,
Fujimoto, K., & Tsukita, S. (1999). Claudin multigene family encoding four-
transmembrane domain protein components of tight junction strands. Proceedings of
the National Academy of Sciences of the United States of America, 96(2), 5.
Proceedings of the National Academy of Sciences of the United States of America,
96(2), 511–6. https://doi.org/10.1073/pnas.96.2.511
Mrsny, R. J., Brown, G. T., Gerner-Smidt, K., Buret, A. G., Meddings, J. B., Quan, C., …
Nusrat, A. (2008). A key claudin extracellular loop domain is critical for epithelial
barrier integrity. The American Journal of Pathology, 172(4), 905–915.
https://doi.org/10.2353/ajpath.2008.070698
Mullin, J. M., Agostino, N., Rendon-Huerta, E., & Thornton, J. J. (2005). Keynote review:
Epithelial and endothelial barriers in human disease. Drug Discovery Today, 10(6),
395–408. https://doi.org/10.1016/S1359-6446(05)03379-9
Narvekar, P., Diaz, M. B., Krones-Herzig, A., Hardeland, U., Strzoda, D., Stohr, S., …
Herzig, S. (2009). Liver-specific loss of lipolysis-stimulated lipoprotein receptor
triggers systemic hyperlipidemia in mice. Diabetes, 58(5), 1040–1049.
https://doi.org/10.2337/db08-1184
Nayak, G., Lee, S. I., Yousaf, R., Edelmann, S. E., Trincot, C., Van Itallie, C. M., …
Riazuddin, S. (2013). Tricellulin deficiency affects tight junction architecture and
cochlear hair cells. Journal of Clinical Investigation, 123(9), 4036–4049.
REFERENCES
124
https://doi.org/10.1172/JCI69031
Niraula, T. P., Bhattarai, A., & Chatterjee, S. K. (2014). Critical micelle concentration of
sodium dodecyl sulphate in pure water and in methanol-water mixed solvent media in
presence and absence of KCl by surface tension and viscosity methods, 11(1), 103–
112. https://doi.org/10.3126/bibechana.v11i0.10388
Nitta, T., Hata, M., Gotoh, S., Seo, Y., Sasaki, H., Hashimoto, N., … Tsukita, S. (2003).
Size-selective loosening of the blood-brain barrier in claudin-5-deficient mice.
Journal of Cell Biology, 161(3), 653–660. https://doi.org/10.1083/jcb.200302070
Ohnishi, M., Ochiai, H., Matsuoka, K., Akagi, M., Nakayama, Y., Shima, A., … Inoue, A.
(2017). Claudin domain containing 1 contributing to endothelial cell adhesion
decreases in presence of cerebellar hemorrhage. Journal of Neuroscience Research,
95(10), 2051–2058. https://doi.org/10.1002/jnr.24040
Olinger, E., Houillier, P., & Devuyst, O. (2018). Claudins: a tale of interactions in the thick
ascending limb. Kidney International, 93(3), 535–537.
https://doi.org/10.1016/j.kint.2017.09.032
Oshima, T., Blaschuk, O., Gour, B., Symonds, M., Elrod, J. W., Sasaki, M., … Alexander,
J. S. (2003). Tight junction peptide antagonists enhance neutrophil trans-endothelial
chemotaxis. Life Sciences, 73(13), 1729–1740. https://doi.org/10.1016/S0024-
3205(03)00511-3
Pan, R., Yu, K., Weatherwax, T., Zheng, H., Liu, W., & Liu, K. J. (2017). Blood Occludin
Level as a Potential Biomarker for Early Blood Brain Barrier Damage Following
Ischemic Stroke. Scientific Reports, 7(January), 1–9.
https://doi.org/10.1038/srep40331
Pardridge, W. M., Triguero, D., & Farrell, C. R. (1990). Downregulation of blood-brain
barrier glucose transporter in experimental diabetes. Diabetes, 39(9), 1040–1044.
https://doi.org/10.2337/diab.39.9.1040
Piehl, C., Piontek, J., Cording, J., Wolburg, H., & Blasig, I. E. (2010). Participation of the
second extracellular loop of claudin-5 in paracellular tightening against ions, small
and large molecules. Cellular and Molecular Life Sciences, 67(12), 2131–2140.
https://doi.org/10.1007/s00018-010-0332-8
Piontek, J., Winkler, L., Wolburg, H., Müller, S. L., Zuleger, N., Piehl, C., … Blasig, I. E.
(2008a). Formation of tight junction: determinants of homophilic interaction between
classic claudins. The FASEB Journal : Official Publication of the Federation of

REFERENCES
125
American Societies for Experimental Biology, 22(1), 146–158.
https://doi.org/10.1096/fj.07-8319com
Piontek, J., Winkler, L., Wolburg, H., Müller, S. L., Zuleger, N., Piehl, C., … Blasig, I. E.
(2008b). Formation of tight junction: determinants of homophilic interaction between
classic claudins. FASEB Journal : Official Publication of the Federation of American
Societies for Experimental Biology, 22(1), 146–58. https://doi.org/10.1096/fj.07-
8319com
Raleigh, D. R., Marchiando, A. M., Zhang, Y., Shen, L., Sasaki, H., Wang, Y., … Turner,
J. R. (2010). Tight Junction-associated MARVEL Proteins MarvelD3, Tricellulin, and
Occludin Have Distinct but Overlapping Functions. Molecular Biology of the Cell,
21(7), 1200–1213. https://doi.org/10.1091/mbc.E09-08-0734
Reaves, D. K., Hoadley, K. A., Fagan-Solis, K. D., Jima, D. D., Bereman, M., Thorpe, L.,
… Fleming, J. M. (2017). Nuclear Localized LSR: A Novel Regulator of Breast
Cancer Behavior and Tumorigenesis. Molecular Cancer Research, 15(2), 165–178.
https://doi.org/10.1158/1541-7786.MCR-16-0085-T
Riazuddin, S., Ahmed, Z. M., Fanning, A. S., Lagziel, A., Kitajiri, S., Ramzan, K., …
Friedman, T. B. (2006). Tricellulin Is a Tight-Junction Protein Necessary for Hearing.
The American Journal of Human Genetics, 79(6), 1040–1051.
https://doi.org/http://dx.doi.org/10.1086/510022
Rodriguez-Boulan, E., & Macara, I. G. (2014). Organization and execution of the epithelial
polarity programme. Nature Reviews Molecular Cell Biology, 15(4), 225–242.
https://doi.org/10.1038/nrm3775
Saitou, M., Furuse, M., Sasaki, H., Schulzke, J. D., Fromm, M., Takano, H., … Tsukita, S.
(2000). Complex phenotype of mice lacking occludin, a component of tight junction
strands. Molecular Biology of the Cell, 11(12), 4131–42.
https://doi.org/10.1091/mbc.11.12.4131
Sánchez-Pulido, L., Martín-Belmonte, F., Valencia, A., & Alonso, M. A. (2002).
MARVEL: A conserved domain involved in membrane apposition events. Trends in
Biochemical Sciences, 27(12), 599–601. https://doi.org/10.1016/S0968-
0004(02)02229-6
Sauer, R. S., Krug, S. M., Hackel, D., Staat, C., Konasin, N., Yang, S., … Rittner, H. L.
(2014). Safety, efficacy, and molecular mechanism of claudin-1-specific peptides to
enhance blood-nerve-barrier permeability. Journal of Controlled Release, 185(1), 88–

REFERENCES
126
98. https://doi.org/10.1016/j.jconrel.2014.04.029
Schlüter, H., Moll, I., Wolburg, H., & Franke, W. W. (2007). The different structures
containing tight junction proteins in epidermal and other stratified epithelial cells,
including squamous cell metaplasia. European Journal of Cell Biology, 86(11–12),
645–655. https://doi.org/10.1016/j.ejcb.2007.01.001
Schneeberger, E. E., & Lynch, R. D. (2004). The tight junction: a multifunctional complex.
American Journal of Physiology. Cell Physiology, 286(6), C1213–C1228.
https://doi.org/10.1152/ajpcell.00558.2003
Schuetz, A., Radusheva, V., Krug, S. M., & Heinemann, U. (2017). Crystal structure of the
tricellulin c-terminal coiled-coil domain reveals a unique mode of dimerization.
Annals of the New York Academy of Sciences, 1405(1), 147–159.
https://doi.org/10.1111/nyas.13408
Schulzke, J. D., Gitter, A. H., Mankertz, J., Spiegel, S., Seidler, U., Amasheh, S., …
Fromm, M. (2005). Epithelial transport and barrier function in occludin-deficient
mice. Biochimica et Biophysica Acta - Biomembranes, 1669(1), 34–42.
https://doi.org/10.1016/j.bbamem.2005.01.008
Sekar, R. B., & Periasamy, A. (2003). Fluorescence resonance energy transfer (FRET)
microscopy imaging of live cell protein localizations. Journal of Cell Biology, 160(5),
629–633. https://doi.org/10.1083/jcb.200210140
Shen, L., Weber, C. R., & Turner, J. R. (2008). The tight junction protein complex
undergoes rapid and continuous molecular remodeling at steady state. Journal of Cell
Biology, 181(4), 683–695. https://doi.org/10.1083/jcb.200711165
Shen, Y., Maupetit, J., Derreumaux, P., & Tufféry, P. (2014). Improved PEP-FOLD
Approach for Peptide and Miniprotein Structure Prediction. Journal of Chemical
Theory and Computation, 10(10), 4745–4758. https://doi.org/10.1021/ct500592m
Shimada, H., Satohisa, S., Kohno, T., Takahashi, S., Hatakeyama, T., Konno, T., …
Kojima, T. (2016). The roles of tricellular tight junction protein lipolysis-stimulated
lipoprotein receptor in malignancy of human endometrial cancer cells. Oncotarget,
7(19). https://doi.org/10.18632/oncotarget.8408
Sohet, F., Lin, C., Munji, R. N., Lee, S. Y., Ruderisch, N., Soung, A., … Daneman, R.
(2015). LSR/angulin-1 is a tricellular tight junction protein involved in blood-brain
barrier formation. Journal of Cell Biology, 208(6), 703–711.
https://doi.org/10.1083/jcb.201410131
REFERENCES
127
Staat, C., Coisne, C., Dabrowski, S., Stamatovic, S. M., Andjelkovic, A. V., Wolburg, H.,
… Blasig, I. E. (2015). Mode of action of claudin peptidomimetics in the transient
opening of cellular tight junction barriers. Biomaterials, 54, 9–20.
https://doi.org/10.1016/j.biomaterials.2015.03.007
Staat, C. (2015) Claudin-Peptide zur Modulation der tight junction-Dichtheit (Doctoral
dissertation). Retrieved from https://refubium.fu-berlin.de/handle/fub188/5840
Staehelin, L. A., Mukherjee, T. M., & Williams, A. W. (1969). Freeze-etch appearance of
the tight junctions in the epithelium of small and large intestine of mice. Protoplasma,
67(2–3), 165–184. https://doi.org/10.1007/BF01248737
Staehelin L.A. (1973). Further observations on the fine structure of freeze-cleaved tight
junctions. Journal of Cell Science, 13, 763–786. https://doi.org/10.1007/BF00339283
Steed, E., Elbediwy, A., Vacca, B., Dupasquier, S., Hemkemeyer, S. A., Suddason, T., …
Matter, K. (2014). MarvelD3 couples tight junctions to the MEKK1-JNK pathway to
regulate cell behavior and survival. Journal of Cell Biology, 204(5), 821–838.
https://doi.org/10.1083/jcb.201304115
Steed, E., Rodrigues, N. T. L., Balda, M. S., & Matter, K. (2009). Identification of
MarvelD3 as a tight junction-associated transmembrane protein of the occludin
family. BMC Cell Biology, 10(95), 1–14. https://doi.org/10.1186/1471-2121-10-95
Stevenson, B. R., Siliciano, J. D., Mooseker, M. S., & Goodenough, D. A. (1986).
Identification of Z0-1: a high molecular weight polypeptide associated with tight
junction (zonula occludens) in a. J. Cell Biol, 103(September), 755–766.
https://doi.org/10.1083/jcb.103.3.755
SUMIO OHTSUKI, SAORI SATO, HIROFUMI YAMAGUCHI, M. K., & TOMOKO
ASASHIMA, A. T. T. (2007). Exogenous Expression of Claudin-5 Induces Barrier
Properties in Cultured Rat Brain Capillary Endothelial Cells. Journal of Cellular
Physiology, 210, 81–86. https://doi.org/10.1002/JCP
Sumitomo, T., Nakata, M., Higashino, M., Yamaguchi, M., & Kawabata, S. (2016). Group
A Streptococcus exploits human plasminogen for bacterial translocation across
epithelial barrier via tricellular tight junctions. Scientific Reports, 7(January), 1–8.
https://doi.org/10.1038/srep20069
Suzuki, H., Nishizawa, T., Tani, K., Yamazaki, Y., Tamura, a, Ishitani, R., … Fujiyoshi,
Y. (2014). Crystal structure of a claudin provides insight into the architecture of tight
junctions. Science (New York, N.Y.), 344(6181), 304–307.
REFERENCES
128
https://doi.org/10.1126/science.1248571
Takasawa, A., Murata, M., Takasawa, K., Ono, Y., Osanai, M., Tanaka, S., … Sawada, N.
(2016). Nuclear localization of tricellulin promotes the oncogenic property of
pancreatic cancer. Scientific Reports, 6, 1–12. https://doi.org/10.1038/srep33582
Tatsuya Katsuno, †, Kazuaki Umeda, §?, Takeshi Matsui, ¶, Masaki Hata, #, Atsushi
Tamura,* Masahiko Itoh, @, Takeuchi, K., … *Laboratory. (2008). Deficiency of
Zonula Occludens-1 Causes Embryonic Lethal Phenotype Associated with Defected
Yolk Sac Angiogenesis and Apoptosis of Embryonic Cells. Molecular Biology of the
Cell, 19(1), 2465–2475. https://doi.org/10.1091/mbc.E07
Tavelin, S., Hashimoto, K., Malkinson, J., Lazorova, L., Toth, I., & Artursson, P. (2003).
A new principle for tight junction modulation based on occludin peptides. Molecular
Pharmacology, 64(6), 1530–40. https://doi.org/10.1124/mol.64.6.1530
Thévenet, P., Shen, Y., Maupetit, J., Guyon, F., Derreumaux, P., & Tufféry, P. (2012).
PEP-FOLD: An updated de novo structure prediction server for both linear and
disulfide bonded cyclic peptides. Nucleic Acids Research, 40(W1), 288–293.
https://doi.org/10.1093/nar/gks419
Tiwary, S., Morales, J. E., Kwiatkowski, S. C., Lang, F. F., Rao, G., & McCarty, J. H.
(2018). Metastatic brain tumors disrupt the blood-brain barrier and alter lipid
metabolism by inhibiting expression of the endothelial cell fatty acid transporter
Mfsd2a. Scientific Reports, 8(1), 1–13. https://doi.org/10.1038/s41598-018-26636-6
Tsukita, S., & Furuse, M. (1998). Overcoming barriers in the study of tight junction
functions: from occludin to claudin. Genes to Cells : Devoted to Molecular & Cellular
Mechanisms, 3(9), 569–573.
Tsukita, S., Furuse, M., & Itoh, M. (2001). Multifunctional strands in tight junctions.
Nature Reviews. Molecular Cell Biology, 2(4), 285–293.
https://doi.org/10.1038/35067088
Umeda, K., Matsui, T., Nakayama, M., Furuse, K., Sasaki, H., Furuse, M., & Tsukita, S.
(2004). Establishment and Characterization of Cultured Epithelial Cells Lacking
Expression of ZO-1. Journal of Biological Chemistry, 279(43), 44785–44794.
https://doi.org/10.1074/jbc.M406563200
Van Itallie, C. M., Rogan, S., Yu, A., Vidal, L. S., Holmes, J., & Anderson, J. M. (2006).
Two splice variants of claudin-10 in the kidney create paracellular pores with
different ion selectivities. American Journal of Physiology. Renal Physiology, 291(6),
REFERENCES
129
F1288–F1299. https://doi.org/10.1152/ajprenal.00138.2006
Van Itallie, C., Rahner, C., & Anderson, J. M. (2001). Regulated expression of claudin-4
decreases paracellular conductance through a selective decrease in sodium
permeability. Journal of Clinical Investigation, 107(10), 1319–1327.
https://doi.org/10.1172/JCI12464
Veshnyakova, A., Piontek, J., Protze, J., Waziri, N., Heise, I., & Krause, G. (2012).
Mechanism of Clostridium perfringens enterotoxin interaction with claudin-3/-4
protein suggests structural modifications of the toxin to target specific claudins.
Journal of Biological Chemistry, 287(3), 1698–1708.
https://doi.org/10.1074/jbc.M111.312165
Wade, J. B., & Karnovsky, M. J. (1974). The structure of the zonula occludens: A single
fibril model based on freeze-fracture. Journal of Cell Biology, 60(1), 168–180.
https://doi.org/10.1083/jcb.60.1.168
Werle, M., & Bernkop-Schnürch, A. (2006). Strategies to improve plasma half life time of
peptide and protein drugs. Amino Acids, 30(4), 351–367.
https://doi.org/10.1007/s00726-005-0289-3
Werle, M., & Föger, F. (2018). Peroral peptide delivery: Peptidase inhibition as a key
concept for commercial drug products. Bioorganic & Medicinal Chemistry, 26(10),
2906–2913. https://doi.org/10.1016/J.BMC.2017.08.028
Westphal, J., Dörfel, M., Krug, S., & Cording, J. (2010). Tricellulin forms homomeric and
heteromeric tight junctional complexes. Cellular and Molecular Life. Retrieved from
/citations?view_op=view_citation&continue=/scholar%3Fhl%3Den%26as_sdt%3D0,
5%26scilib%3D1&citilm=1&citation_for_view=PD5Opp4AAAAJ:u-
x6o8ySG0sC&hl=en&oi=p
Weyermann, J., Lochmann, D., & Zimmer, A. (2005). A practical note on the use of
cytotoxicity assays. International Journal of Pharmaceutics, 288(2), 369–376.
https://doi.org/10.1016/j.ijpharm.2004.09.018
Winkler, L., Gehring, C., Wenzel, A., Müller, S. L., Piehl, C., Krause, G., … Piontek, J.
(2009). Molecular determinants of the interaction between clostridium perfringens
enterotoxin fragments and claudin-3. Journal of Biological Chemistry, 284(28),
18863–18872. https://doi.org/10.1074/jbc.M109.008623
Wittchen, E. S., Haskins, J., & Stevenson, B. R. (1999). Protein Interactions at the Tight
Junction, 274(49), 35179–35185.
REFERENCES
130
Wong, C.-H., Mruk, D. D., Lee, W. M., & Cheng, C. Y. (2007). Targeted and reversible
disruption of the blood-testis barrier by an FSH mutant-occludin peptide conjugate.
FASEB Journal : Official Publication of the Federation of American Societies for
Experimental Biology, 21(2), 438–48. https://doi.org/10.1096/fj.05-4144com
Wong, V., & Gumbiner, B. M. (1997). Synthetic peptide corresponding to the extracellular
domain of occludin perturbs the tight junction permeability barrier. Journal of Cell
Biology, 136(2), 399–409. https://doi.org/10.1083/jcb.136.2.399
Yaffe, Y., Shepshelovitch, J., Nevo-yassaf, I., Yeheskel, A., & Shmerling, H. (2012). The
MARVEL transmembrane motif of occludin mediates oligomerization and targeting
to the basolateral surface in epithelia. https://doi.org/10.1242/jcs.100289
Yamane, T., Kaneko, A., & Mohri, M. (2004). The technique of ophthalmic arterial
infusion therapy for patients with intraocular retinoblastoma. International Journal of
Clinical Oncology, 9(2), 69–73. https://doi.org/10.1007/s10147-004-0392-6
Yang, J. T., Wu, C. S. C., & Martinez, H. M. (1986). Calculation of Protein Conformation
from Circular Dichroism. Methods in Enzymology, 130(C), 208–269.
https://doi.org/10.1016/0076-6879(86)30013-2
Yen, F. T., Masson, M., Clossais-Besnard, N., André, P., Grosset, J. M., Bougueleret, L.,
… Bihain, B. E. (1999). Molecular cloning of a lipolysis-stimulated remnant receptor
expressed in the liver. Journal of Biological Chemistry, 274(19), 13390–13398.
https://doi.org/10.1074/jbc.274.19.13390
Zahraoui, A., Louvard, D., & Galli, T. (2000). Tight junction, a platform for trafficking
and signaling protein complexes [In Process Citation]. J Cell Biol, 151(5), F31-6.
Retrieved from http://www.ncbi.nlm.nih.gov/cgi-
bin/Entrez/referer?http://www.jcb.org/cgi/content/full/151/5/F31
Zhong, L., & Johnson, W. C. (1992). Environment affects amino acid preference for
secondary structure. Proceedings of the National Academy of Sciences, 89(10), 4462–
4465. https://doi.org/10.1073/pnas.89.10.4462
Zihni, C., Mills, C., Matter, K., & Balda, M. S. (2016). Tight junctions: From simple
barriers to multifunctional molecular gates. Nature Reviews Molecular Cell Biology,
17(9), 564–580. https://doi.org/10.1038/nrm.2016.80
Zwanziger, D., Hackel, D., Staat, C., Böcker, A., Brack, A., Beyermann, M., … Blasig, I.
E. (2012). A peptidomimetic tight junction modulator to improve regional analgesia.
Molecular Pharmaceutics, 9(6), 1785–1794. https://doi.org/10.1021/mp3000937
REFERENCES
131
Zwanziger, D., Staat, C., Andjelkovic, A. V., & Blasig, I. E. (2012). Claudin-derived
peptides are internalized via specific endocytosis pathways. Annals of the New York
Academy of Sciences, 1257(1), 29–37. https://doi.org/10.1111/j.1749-
6632.2012.06567.x

132
SUPPLEMENTARY MATERIAL
Table S1 Messenger RNA (mRNA) expression of tricellulin (Tric) in different wild type (WT) mouse
organs
Genotype Whole
brain
Brain
cortex
Spleen Testis Eye Heart Lung
Tri
c WT (7.8±1.3)
×10-1
(7.3±0.9)
×10-1
(7.7±1)
×10-1
(18±3.5)
×10-1
8.8±1.9
3.8±1.1
5.1±1.1
Genotype Liver Kidney
cortex
Kidney
medulla
Jejunum Duodenum Ileum Colon
Tri
c WT (1.6±0.3)
×101
(1.6±0.3)
×101
(2.5±0.6)
×101
5.4±1.2 3.8±0.5 4.3±0.7 7±0.5
Table contains numerical values from Fig. 4.1. mRNA expression of Tricellulin (Tric) in C57BL/6 mouse
normalized to β-actin (Actb) (ΔCt = Ctjunction protein - Ctactin); Ct, Cycle threshold; mean ± SEM, n = 8.
Table S2 Messenger RNA (mRNA) expression of designated proteins in human colon carcinoma epi-
thelial cells after peptide-free medium, 150 µM scrambled trictide and 150 µM trictide administra-
tions.
Untreated 150 µM trictide 150 µM scrambled
trictide
Tric (12±0.7)
×10-3
(5.3±1.2)
×10-3
(10.7±0.7)
×10-3
Occl (1.8±0.3)
×10-2
(1.3±0.2)
×10-2
(1.6±0.1)
×10-2
MD3 (7.3±0.7)
×10-4
(2.7±0.6)
×10-4
(3.8±0.5)
×10-4
LSR (1.6±0.2)
×10-2
(1±0.05)
×10-2
(1.7±0.09)
×10-2
Cldn1 (4.4±0.1)
×10-3
(2.6±0.5)
×10-3
(6.8±0.5)
×10-3
Cldn5 (3±0.6)
×10-6
(1.8±0.4)
×10-6
(3.9±0.4)
×10-6
ZO-1 (7.4±1)
×10-3
(8±0.5)
×10-3
(4.8±0.3)
×10-3
Table contains absolute values (ΔCt) of Fig. 4.10. mRNA expressions normalized to β-actin (Actb) (ΔCt =
Ctjunction protein - Ctactin); Ct, Cycle threshold; Tric, tricellulin; Occl, occludin; MD3, marvelD3; LSR, anti-
lipolysis stimulated lipoprotein receptor; Cldn1, claudin-1; Cldn5, claudin-5; ZO-1, zonula occludens protein
1; mean ± SEM, n = 10.
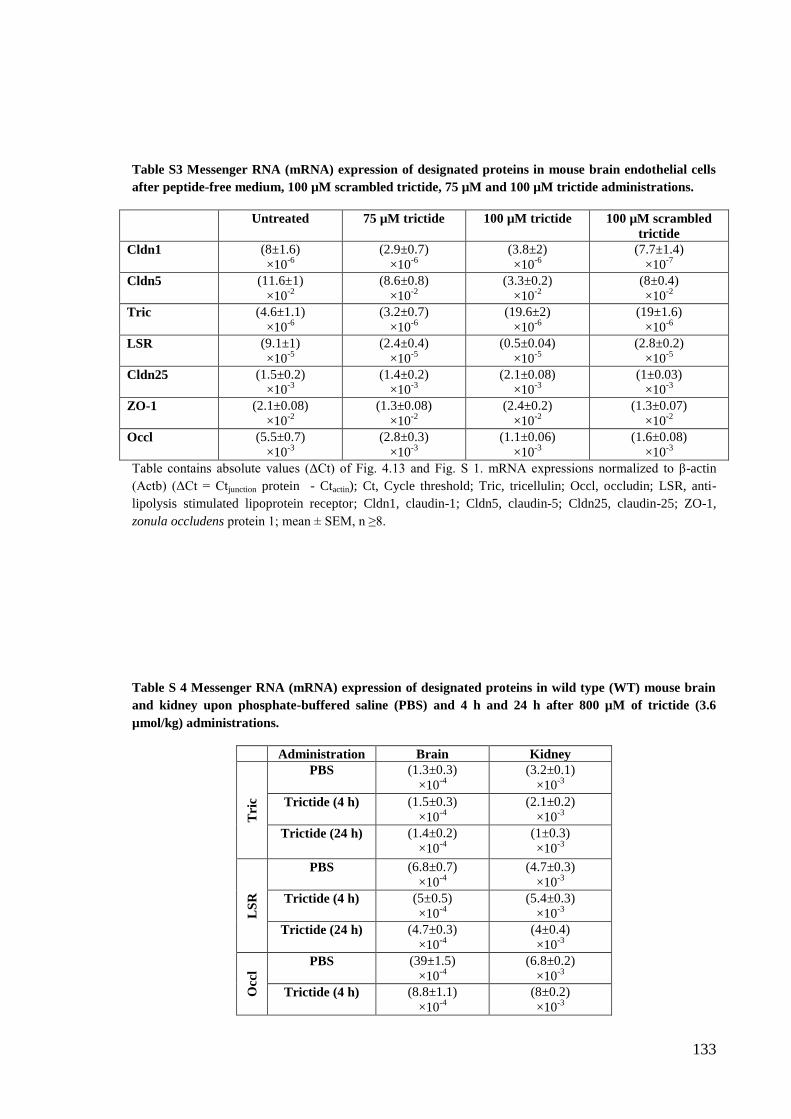
133
Table S3 Messenger RNA (mRNA) expression of designated proteins in mouse brain endothelial cells
after peptide-free medium, 100 µM scrambled trictide, 75 µM and 100 µM trictide administrations.
Untreated 75 µM trictide 100 µM trictide 100 µM scrambled
trictide
Cldn1 (8±1.6)
×10-6
(2.9±0.7)
×10-6
(3.8±2)
×10-6
(7.7±1.4)
×10-7
Cldn5 (11.6±1)
×10-2
(8.6±0.8)
×10-2
(3.3±0.2)
×10-2
(8±0.4)
×10-2
Tric (4.6±1.1)
×10-6
(3.2±0.7)
×10-6
(19.6±2)
×10-6
(19±1.6)
×10-6
LSR (9.1±1)
×10-5
(2.4±0.4)
×10-5
(0.5±0.04)
×10-5
(2.8±0.2)
×10-5
Cldn25 (1.5±0.2)
×10-3
(1.4±0.2)
×10-3
(2.1±0.08)
×10-3
(1±0.03)
×10-3
ZO-1 (2.1±0.08)
×10-2
(1.3±0.08)
×10-2
(2.4±0.2)
×10-2
(1.3±0.07)
×10-2
Occl (5.5±0.7)
×10-3
(2.8±0.3)
×10-3
(1.1±0.06)
×10-3
(1.6±0.08)
×10-3
Table contains absolute values (ΔCt) of Fig. 4.13 and Fig. S 1. mRNA expressions normalized to β-actin
(Actb) (ΔCt = Ctjunction protein - Ctactin); Ct, Cycle threshold; Tric, tricellulin; Occl, occludin; LSR, anti-
lipolysis stimulated lipoprotein receptor; Cldn1, claudin-1; Cldn5, claudin-5; Cldn25, claudin-25; ZO-1,
zonula occludens protein 1; mean ± SEM, n ≥8.
Table S 4 Messenger RNA (mRNA) expression of designated proteins in wild type (WT) mouse brain
and kidney upon phosphate-buffered saline (PBS) and 4 h and 24 h after 800 µM of trictide (3.6
µmol/kg) administrations.
Administration Brain Kidney
Tri
c
PBS (1.3±0.3)
×10-4
(3.2±0.1)
×10-3
Trictide (4 h)
(1.5±0.3)
×10-4
(2.1±0.2)
×10-3
Trictide (24 h)
(1.4±0.2)
×10-4
(1±0.3)
×10-3
LS
R
PBS (6.8±0.7)
×10-4
(4.7±0.3)
×10-3
Trictide (4 h)
(5±0.5)
×10-4
(5.4±0.3)
×10-3
Trictide (24 h)
(4.7±0.3)
×10-4
(4±0.4)
×10-3
Occ
l
PBS (39±1.5)
×10-4
(6.8±0.2)
×10-3
Trictide (4 h)
(8.8±1.1)
×10-4
(8±0.2)
×10-3

134
Trictide (24 h)
(7.9±0.5)
×10-4
(6.2±0.1)
×10-3
MD
3
PBS (1.9±0.1)
×10-4
Trictide (4 h)
(1.8±0.2)
×10-4
Trictide (24 h)
(0.7±0.2)
×10-4
C
ldn
5
PBS (3.9±0.1)
×10-3
Trictide (4 h)
(3.2±0.05)
×10-3
Trictide (24 h)
(5.6±0.8)
×10-3
ZO
-1
PBS (7.9±1.1)
×10-3
(7.8±0.2)
×10-3
Trictide (4 h)
(7±0.9)
×10-3
(10.3±0.9)
×10-3
Trictide (24 h)
(6.2±0.3)
×10-3
(7.5±1)
×10-3
Cld
n1
PBS (4.4±0.9)
×10-3
Trictide (4 h)
(4.9±0.2)
×10-3
Trictide (24 h)
(4.1±0.4)
×10-3
Cld
n1
2
PBS (3.4±0.3)
×10-3
Trictide (4 h)
(3.4±0.09)
×10-3
Trictide (24 h)
(3.4±0.04)
×10-3
Cld
n2
5
PBS (6.7±0.2)
×10-3
(4.2±0.2)
×10-3
Trictide (4 h)
(6.4±0.2)
×10-3
(4.1±0.4)
×10-3
Trictide (24 h)
(6±0.3)
×10-3
(2.5±0.6)
×10-3
Table contains absolute values (ΔCt) of Fig. 4.22. mRNA expressions normalized to β-actin (Actb) (ΔCt =
Ctjunction protein - Ctactin); Ct, Cycle threshold; Tric, tricellulin; Occl, occludin; MD3, marvelD3; LSR, anti-
lipolysis stimulated lipoprotein receptor; Cldn1, claudin-1; Cldn5, claudin-5; Cldn12, claudin-12; Cldn25,
claudin-25; ZO-1, zonula occludens protein 1; mean ± SEM, n ≥4.

135
Fig. S5 Trictide down-regulates mRNA expression of claudin-5, LSR, occludin and up-regulates
Cldn25 and ZO-1 in mouse brain endothelial cells. (A) Effect on messenger RNA (mRNA) of designated
proteins; upon trictide and scrambled trictide treatment compared to untreated control (2ΔΔCt
) (red dotted
line). mRNA normalized to β-actin (Actb) (ΔCt = Ctjunction protein - Ctactin); Ct, Cycle threshold; total incubation
time, 16 h; two-way ANOVA test was applied prior to Bonferroni’s comparison post hoc test; Mean ± SEM;
n =10; ** P ≤ 0.01, *** P ≤ 0.001 versus untreated control. Cldn1, claudin-1; Cldn5, claudin-5; Cldn25,
claudin-25; Tric, tricellulin; Occl, occluding; LSR, anti-lipolysis stimulated lipoprotein receptor; ZO-1, zonu-
la occludens protein 1.

136
Basak Arslan
Education
Since 2015 Ph.D. in Biology, Freie University Berlin, Faculty of Biology, Chemistry
and Pharmacy, Berlin
2011 – 2012 M.Sc. in Molecular Biotechnology, University of Birmingham (UoB),
School of Biosciences Edgbaston, Birmingham
2006 – 2011 B.Sc. in Biological Sciences and Bioengineering, Sabanci University
(SU), Faculty of Engineering& Natural Sciences (FENS) İstanbul
Minor: Chemistry
Fluor Daniel Corporation Scholarship: Awarded for outstanding accom-
plishment (2008).
Publication: Arslan, B.*, Cording, J.
*, Staat, C., Dithmer, S., Krug, S. M., Krüger, A., Berndt, P.,
Günther, R., Winkler, L., Blasig, I. E. and Haseloff, R. F. (2017). Trictide, a tricellulin-
derived peptide to overcome cellular barriers. Annals of the New York Academy of Sciences,
1405(1), 89–101. https://doi.org/10.1111/nyas.13392
* These authors contributed equally to this work.
Presentations:
B. Arslan. Trictide, a tricellulin-derived peptide to overcome cellular barriers. 19th Bad Her-
renalber transporter and barrier meeting. 2017. Bad Herrenalb, Germany.
J. Cording, B. Arslan, A. Krüger, R. Günther, C. Staat and I.E. Blasig. TricSI - Development of a
Tricellulin Peptidomimetic to Modify Tissue Barriers. Tight junctions and their proteins interna-
tional conference. 2016. Berlin, Germany. (Selected for short talk in addition to poster presenta-
tion)
B. Arslan, J. Cording, A. Krüger, R. Günther, C. Staat and I.E. Blasig. TricSI - Development of a
Tricellulin Peptidomimetic to Modify Tissue Barriers. German Society for Experimental and Clini-
cal Pharmacology and Toxicology (DGPT) meeting. 2016. Berlin, Germany.

137
Declaration of Authorship
I hereby certify that this submitted thesis has been composed by me and is based on my
own work, unless stated otherwise. No other person’s work has been used without
acknowledgement in this thesis. All references and verbatim extracts have been quoted,
and all sources of information, including graphs and data sets, have been specifically
acknowledged.
Berlin, 9 October 2018
Başak Arslan