triad healthcare network - north carolina medical … langley chief operating officer triad...
TRANSCRIPT

www.TriadHealthCareNetwork.com
Elissa LangleyChief Operating Officer
Triad HealthCare Network
Triad HealthCare Network, A Next Generation ACONC ACO Council Meeting
November 16, 2017

www.TriadHealthCareNetwork.com
Triad HealthCare NetworkAgenda
• Why the need for ACOs?
• THN – Structure and Contracts
• Evolution towards Risk and Next Gen ACO
• THN Performance to date
• Population Health Strategies to Manage Risk
• Lessons Learned along the way
• Vision for the Future
2

3
4

5

Triad HealthCare NetworkUnderstanding the Impact of System Design
www.TriadHealthCareNetwork.com7 7
“Every system is perfectly designed to get the results it gets.”
- Paul Batalden, M.D.Dartmouth Medical School
“If we keep doing what we have been doing, we'll keep getting what we've always gotten"—an expensive, high-tech, inefficient health-care system. "The health-care system needs to be redesigned.”
Dartmouth Medicine, Spring 2006

www.TriadHealthCareNetwork.com12
Triad HealthCare NetworkTwo Roads….
CutsRealign Incentives
through Reform

Triad HealthCare NetworkFounding principles
• Empower physicians to lead and drive healthcare transformation
• Engage physicians to develop new, value-based models of care
• Provide resources to physicians to meet the growing demands of accountability and transparency
• Create greater collaboration and trust among physicians, hospitals, patients and payers
• Establish our brand as a clinically integrated system of care delivering superior value measured by high quality outcomes, affordability, and exceptional customer experience
www.TriadHealthCareNetwork.com
13
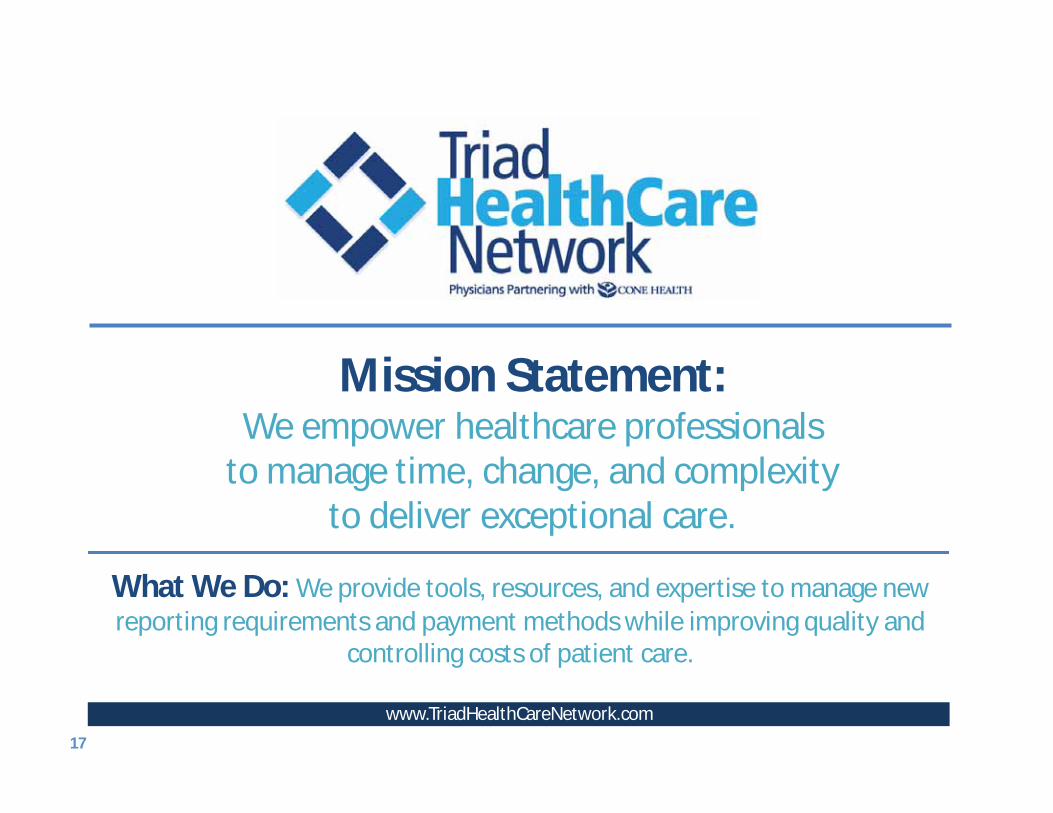
Mission Statement:We empower healthcare professionals
to manage time, change, and complexity to deliver exceptional care.
www.TriadHealthCareNetwork.com
What We Do: We provide tools, resources, and expertise to manage new reporting requirements and payment methods while improving quality and
controlling costs of patient care.
17

Commander’s Intent:THN exists to lower the cost of care and improve the quality/outcomes
of the populations we manage.
www.TriadHealthCareNetwork.com18
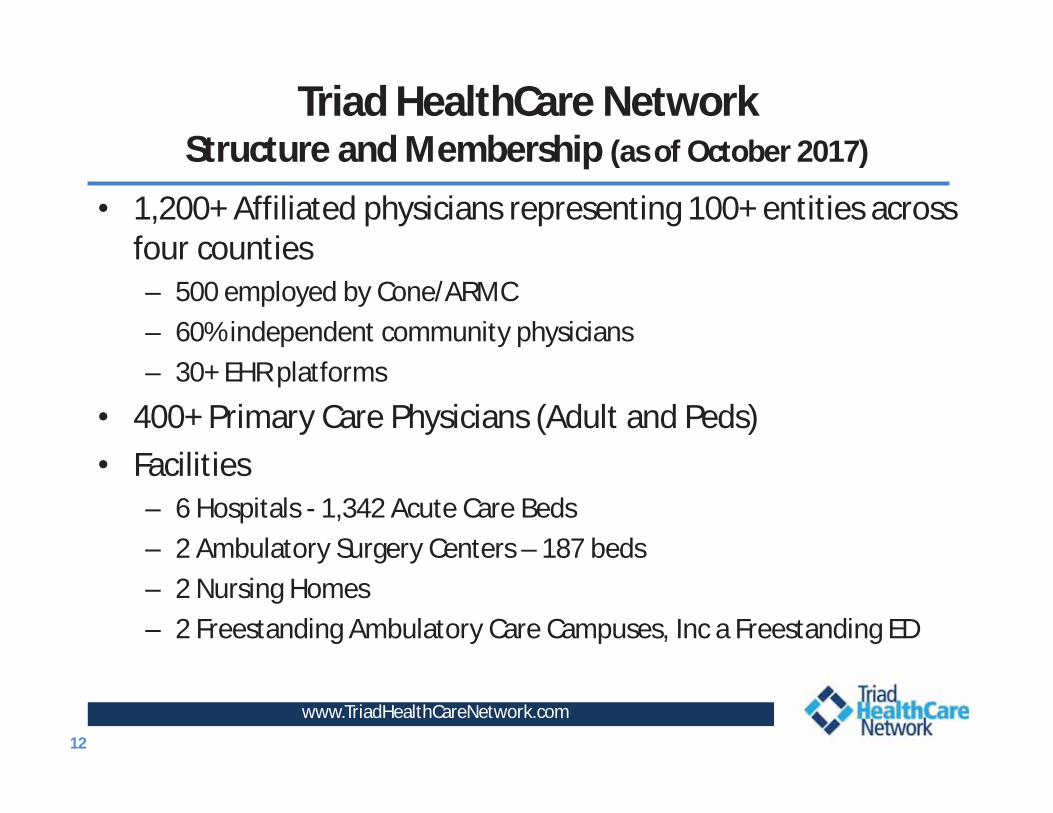
Triad HealthCare NetworkStructure and Membership (as of October 2017)
• 1,200+ Affiliated physicians representing 100+ entities across four counties– 500 employed by Cone/ARMC– 60% independent community physicians– 30+ EHR platforms
• 400+ Primary Care Physicians (Adult and Peds)• Facilities
– 6 Hospitals - 1,342 Acute Care Beds– 2 Ambulatory Surgery Centers – 187 beds– 2 Nursing Homes – 2 Freestanding Ambulatory Care Campuses, Inc a Freestanding ED
www.TriadHealthCareNetwork.com12

Triad HealthCare NetworkCurrent Contracts (as of October 2017)
www.TriadHealthCareNetwork.com13 13
• Next Generation ACO 1 32,000 • Cone Health employees/dependents 2 18,000• Cigna Accountable Care Collaborative 3 9,500• United Medicare Advantage 4 11,000• Humana Medicare Advantage 5 11,000• HealthTeam Advantage PPO MA 6 12,000
93,500 Patients 1 One of 44 ACOs in the country selected by CMS; Take 100% risk2 Provide case management, disease management, wellness services3 Commercial Shared Savings Agreement4 100% Risk Agreement – non-capitated5 Take full global capitated risk on 10,000 Humana HMO Gold members; Shared savings ii agreement on 1,000 Humana Medicare Advantage PPO6 Take full global capitated risk risk; Cone-based MA plan launched 1/1/16

Triad HealthCare NetworkMarket/Location
www.TriadHealthCareNetwork.com


www.TriadHealthCareNetwork.com
Triad HealthCare NetworkValue for Physicians
• THN to provide value-added services and resources to assist practices– IT resources to support population management– Patient Engagement Tools– Care Management team– Coding assistance and education– Assistance to achieve Patient-Centered Medical Home
recognition– Submission of quality measures for the Physician Quality
Reporting System (PQRS)– Qualification as an Advanced Alternative Payment Model– Joint contracting for quality/cost savings incentive plans
with payers
16
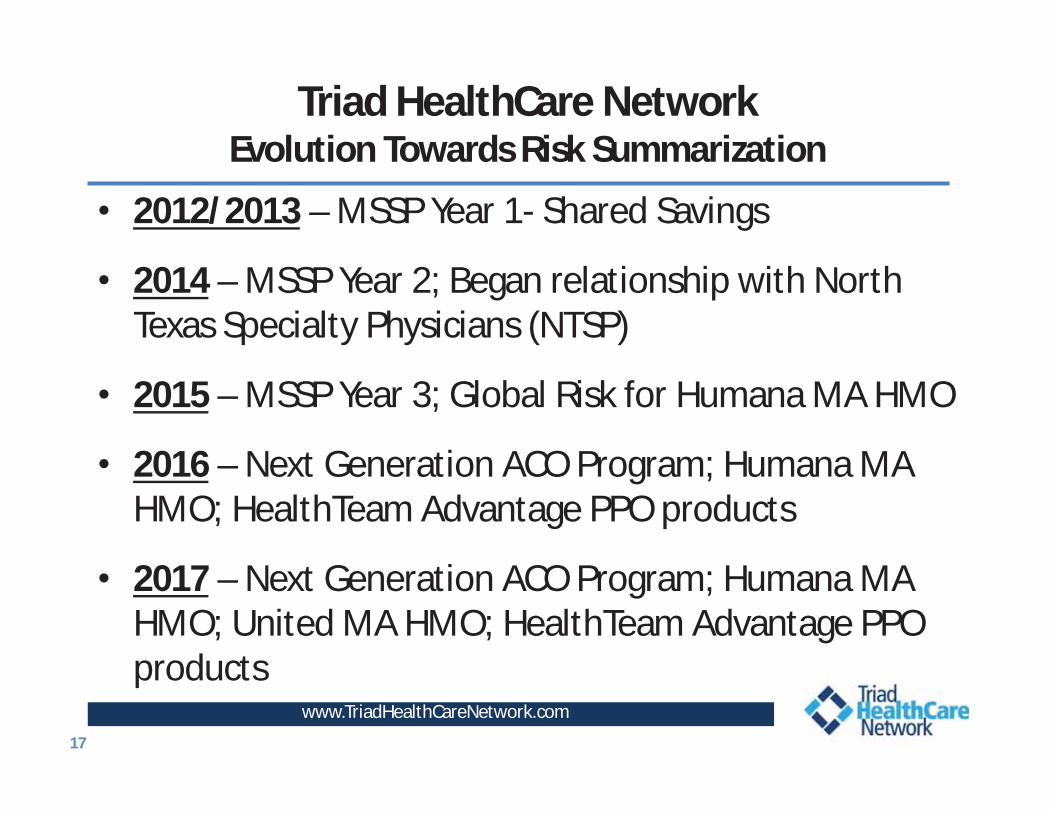
Triad HealthCare NetworkEvolution Towards Risk Summarization
• 2012/2013 – MSSP Year 1- Shared Savings
• 2014 – MSSP Year 2; Began relationship with North Texas Specialty Physicians (NTSP)
• 2015 – MSSP Year 3; Global Risk for Humana MA HMO
• 2016 – Next Generation ACO Program; Humana MA HMO; HealthTeam Advantage PPO products
• 2017 – Next Generation ACO Program; Humana MA HMO; United MA HMO; HealthTeam Advantage PPO products
www.TriadHealthCareNetwork.com17

www.TriadHealthCareNetwork.com
Triad HealthCare NetworkMedicare Shared Savings Program: Challenges
• Beneficiary Alignment – Retrospective, Plurality of E&M Codes, includes Specialists, varies quarterly, final list unknown until last quarter
• Timeliness of Data – Receive quarterly reports and membership changes months after the fact, e.g., 2nd quarter received in Nov
• Short term “shelf life” – benchmark is historical which factors in savings generated; increases difficulty to earn savings
• Minimum Savings Rate - Can generate savings, but get no “share” • Difficult to achieve savings in already efficient areas – historical
benchmarks are lower ($8,600 THN versus $11,750 Houston)• Savings amounts limited (50%-60%) and significantly impacted by
quality scores

www.TriadHealthCareNetwork.com19
Next Generation ACO Program• NGACO Program began in 2016 as part of Center for
Medicare/Caid Innovation (CMMI) (18 ACOs)• Tests theory whether strong financial incentives,
coupled with tools to support better patient engagement and care management, can improve health outcomes and lower expenditures
• Annual Benchmark based on 2014 claims experience and trended for National & Regional factors
• 100% upside and downside risk• Have to report on 33 Quality Metrics• Special Waivers

Triad HealthCare NetworkPopulation Based Payments
www.TriadHealthCareNetwork.com
• ACO determines a percentage reduction to the base FFS payments of its Next Generation Participants and Preferred Providers for care supplied to Next Generation PY-aligned beneficiaries.
• PBP-participating Next Generation Participants and Preferred Providers must agree in writing to the percentage reduction.
• CMS will pay the projected total annual amount taken out of the base FFS rates to the ACO in monthly payments.

www.TriadHealthCareNetwork.com
PBP Preferred Providers• Skilled Nursing Facilities(SNF)
–Total SNFs Participating: 30 Contracted• 21 Available for SNF Waiver
• Home Health Agencies (HHA)–Total HHAs Participating: 6 Contracted
21

www.TriadHealthCareNetwork.com
• Benchmark:• Next Gen uses experience for 2014, which was a high expenditure year for THN
and projects forward. • MSSP Track 3 uses a weighted experience of three years, with shared savings
added back in; 2013 was a favorable year, with low expenditures, even with earned shared savings added resulting in a lower benchmark.
• Risk Scores: NextGen allows up to a 3% increase in benchmark due to risk scores; MSSP only adjusts downward.
• Regional Trends: • Next Generation benchmark uses national trends, adjusted for regional
performance.• These trends would be much higher than the assumed ACO trend, thus favoring
NextGen compared to MSSP.
• Projections:• All projections favored NextGen over MSSP Track 3
Triad HealthCare NetworkMSSP vs NextGen ACO
THN PerformanceTo date
www.TriadHealthCareNetwork.com

www.TriadHealthCareNetwork.com
Triad HealthCare NetworkMSSP Performance
24

www.TriadHealthCareNetwork.com
2015 MSSP Quality Performance
Points Earned without Total Quality Possible Quality Points Domain
Domain Improvement Points Points Improvement Points Earned ScorePatient/Caregiver Experience 15.4 16 0.48 15.88 99.25%Care Coordination/Patient Safety 20.5 22 1.8 22 100%Preventive Health 14.2 16 2.24 16 100%At Risk Population 10.95 12 2.24 12 100%
61.05 66 6.76 65.88 99.81%

Triad HealthCare NetworkMedicare Shared Savings Program
Triad HealthCare NetworkMedicare Shared Savings Program
51
Top 5 in the Country
www.TriadHealthCareNetwork.com

2016 Next Generation ACO Results
www.TriadHealthCareNetwork.com
ACO Name Total Aligned Beneficiaries1
Total Benchmark Expenditures2, 3
Total Actual Expenditures for
Aligned Beneficiaries
Total Benchmark Expenditures Minus Total
Aligned Beneficiary
Expenditures4
Total Benchmark Minus Aligned
Beneficiary Expenditures as %
of Total Benchmark5
Earned Shared Savings
Payments/Owe Losses6
Baroma 26,839 $409,714,191 $394,083,864 $15,630,327 3.8% $12,254,177
THN 27,780 $265,825,827 $254,870,817 $10,955,011 4.1% $10,735,910Iowa Health 67,919 $615,801,716 $602,373,441 $13,428,275 2.2% $10,527,767
• THN was number two (2) in country for Total Shared Savings with a Savings Of $10.7 Million!
• THN was number (1) in the country for Total Savings Percentage with a savings rate of 4.1%!
• (Note that the #1 NGACO had a benchmark of over $15,000 as
compared to ours, which was about $9,500.)

THN Secret Sauce
www.TriadHealthCareNetwork.com
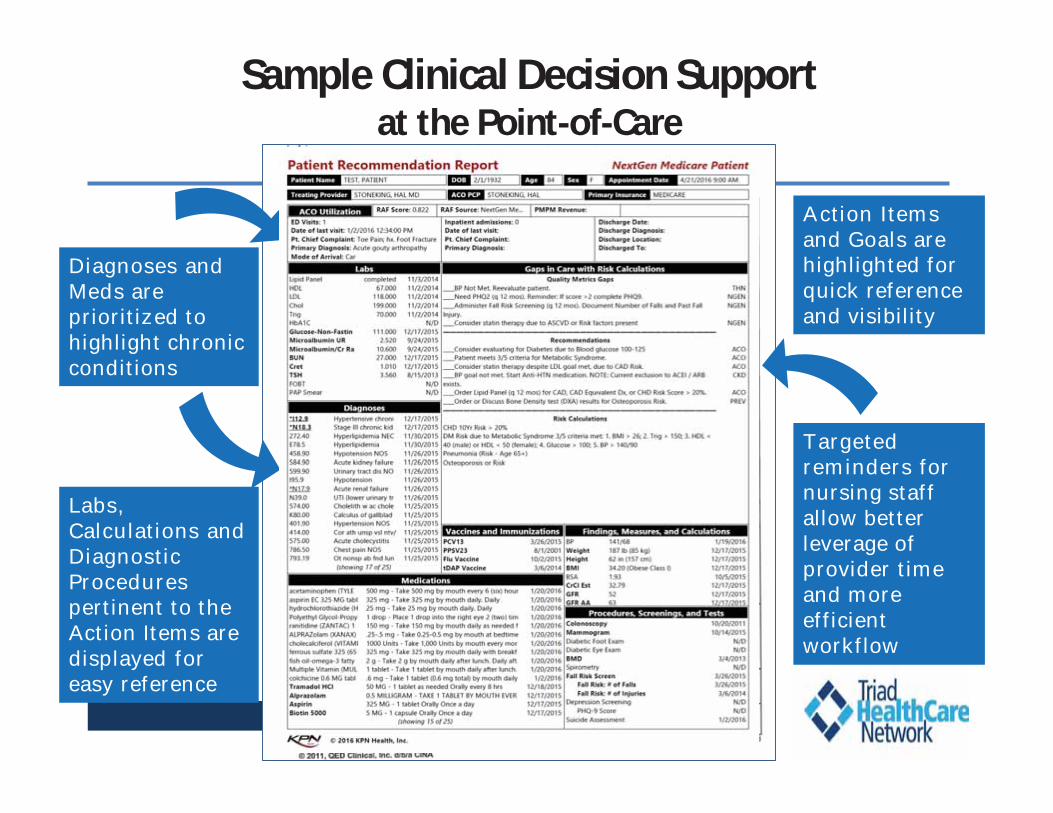
Sample Clinical Decision Supportat the Point-of-Care
www.TriadHealthCareNetwork.com
Practice Performance Feedback
Diagnoses and Meds are prioritized to highlight chronic conditions
Action Itemsand Goals are highlighted for quick reference and visibility
Targeted reminders for nursing staff allow better leverage of provider time and more efficient workflow
Labs, Calculations and Diagnostic Procedurespertinent to the Action Items are displayed for easy reference

Transition of Care Tool

Triad HealthCare Network2016 Projects to Manage Cost/Quality
www.TriadHealthCareNetwork.com31
• Congestive Heart Failure (CHF) patients• COPD patients• Sepsis (diagnosis, treatment, prevention)• Transitions of Care (Inpatient to Outpatient)• End of Life Planning• Quality Metrics (HEDIS and Stars)• Out of Network Utilization• Skilled Nursing Facility Utilization• Appropriate Coding (management of Risk Adjustment
Factor (“RAF”))

ReDS™ Technology To Decrease Cost Of Heart Failure
Worldwide
• 19 Million People, 1 Million Hospitalizations
• Increased Prevalence Among The Elderly
• Cost: $108 Billion Annually
United States
• 5.7 Million People
• Significantly Impacts Quality Of Life
• Cost: $32 Billion Annually, Direct & Indirect
Triad HealthCare Network
• 4,000 Patients And Highest Cost ICD
• Cost $85M+ In Claims
• Readmission Rate 19.6% And 90% Of HF Patients That Go To ED Get Admitted
www.TriadHealthCareNetwork.com
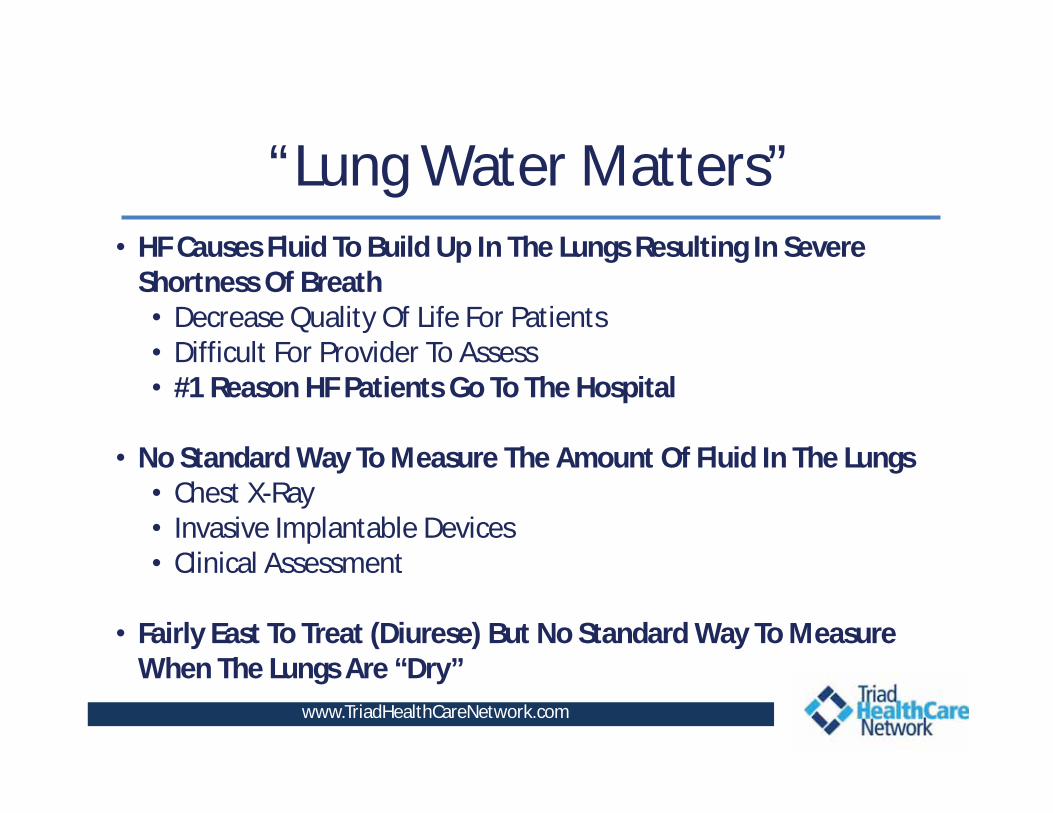
“Lung Water Matters”• HF Causes Fluid To Build Up In The Lungs Resulting In Severe
Shortness Of Breath• Decrease Quality Of Life For Patients• Difficult For Provider To Assess• #1 Reason HF Patients Go To The Hospital
• No Standard Way To Measure The Amount Of Fluid In The Lungs• Chest X-Ray• Invasive Implantable Devices• Clinical Assessment
• Fairly East To Treat (Diurese) But No Standard Way To Measure When The Lungs Are “Dry”
www.TriadHealthCareNetwork.com

Technology & Product
ReDSTM System Technology
Radar (RF) monitoring and imaging technology
Military see-through-wall technology
Cleared for market at the
USA
www.TriadHealthCareNetwork.com
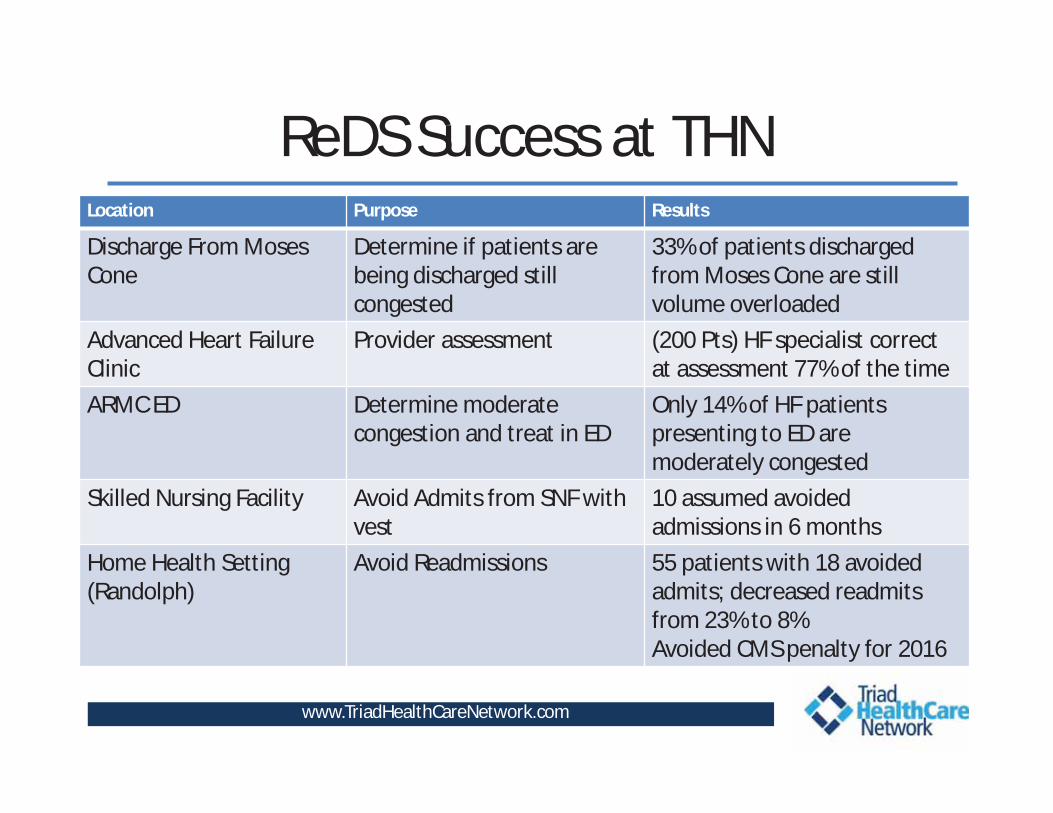
ReDS Success at THNLocation Purpose Results
Discharge From Moses Cone
Determine if patients are being discharged still congested
33% of patients discharged from Moses Cone are still volume overloaded
Advanced Heart FailureClinic
Provider assessment (200 Pts) HF specialist correct at assessment 77% of the time
ARMC ED Determine moderate congestion and treat in ED
Only 14% of HF patients presenting to ED are moderately congested
Skilled Nursing Facility Avoid Admits from SNF with vest
10 assumed avoided admissions in 6 months
Home Health Setting (Randolph)
Avoid Readmissions 55 patients with 18 avoided admits; decreased readmitsfrom 23% to 8%Avoided CMS penalty for 2016
www.TriadHealthCareNetwork.com

Questions We Wanted To Answer• Are We Discharging HF Patients From The Hospital who Still
Have Fluid In Their Lungs?• YES
• Can This Device Be Utilized For Individual Patients At The Point Of Care, Rather Than One Patient / Vest?• YES
• Can The Vest Prevent An Admission Once Symptoms Begin?• YES
• Can We Keep Patients Out Of The Hospital By Utilizing This Technology? • YES
www.TriadHealthCareNetwork.com

ROIInitial $100K Investment In August 2016
• 25 Assumed Avoided Admissions At $10K = $250K
Savings
• Rural Hospital Penalized 3 Years For HF Readmissions,
Avoided $800K Penalty In 2016
• ReDS™ Reading At Discharge May Help Identify The High
Risk HF Patient
• Decrease average all cause HF Readmissions from
19.6% to 15.1% at Moses Cone Hospitalwww.TriadHealthCareNetwork.com

THN Sepsis Project Objectives
• THN and Cone Health will develop a standardized, system-level approach for sepsis care that is both effective and sustainable in order to:
• Reduce mortality for all coded sepsis patients• Reduce post-op sepsis• Appropriately and quickly identify sepsis “present on
admission”, as well as identify sepsis in Inpatients to reduce healthcare acquired conditions
• Project Scope:• Adults >18 presenting to the ED or IP units at all Cone Health
facilities with Pilot focus at Moses Cone Hospitalwww.TriadHealthCareNetwork.com
13

Sepsis Project Data Analysis
• Primary Metric One AnalysisOverall Mortality reduced from 14% system wide to 10% which is top decile by end of FY 2016 (9/30/2016)Rate observed as of 9/30/2016 has fallen from 14% to 11.5% and continuing to decreaseComparison of actual cases since interventions began in April 2016:
October 2015 – March 2016 = 12.7% mortalityApril 2016 – September 2016 = 10.3% mortality
19% drop in mortality since April 2016!!!
• Primary Metric Two AnalysisIncrease CMS Sepsis Bundle Compliance to 34%, reducing mortality rate by at least 15% per CMS guidelines by
end of FY ‘16 (September 30, 2016)Bundle Compliance rate as of 9/30/2016 has increased from 15% to 33% and continuing to climbComparison of actual cases since interventions began in April 2016:
October 2015 – March 2016 = 24.2% complianceApril 2016 – September 2016 = 38.0% compliance
36% increase in bundle compliance since April 2016!!!
www.TriadHealthCareNetwork.com
13

Process Metrics (Total Cases) Oct-15 Nov-15 Dec-15 Jan-16 Feb-16 Mar-16 Apr-16 May-16 Jun-16 Jul-16 Aug-16 Sep-16 YTD FY16
Benchmark
Overall Sepsis Mortality Rate Observed 10.4% 16.1% 14.4% 13.8% 11.5% 10.6% 9.7% 11.7% 10.4% 11.6% 8.8% 9.3% 11.5% 10.0%
Mortality Severe/Shock Observed 20.8% 32.8% 29.9% 30.8% 24.4% 23.8% 26.6% 30.0% 30.4% 29.3% 24.0% 23.0% 27.1% 21.3%
Mortality Severe/Shock O/E 0.84 1.03 1.04 1.00 0.91 0.83 0.95 1.06 1.17 1.15 0.84 0.88 0.98 0.85
Overall Sepsis Mortality O/E 0.77 0.91 0.87 0.86 0.74 0.75 0.73 0.87 0.84 0.91 0.64 0.74 0.80 0.82
Readmission O/E 0.58 0.69 0.76 0.90 0.31 0.82 0.44 0.49 0.78 0.34 0.37 0.59 0.86
LOS O/E 0.73 0.80 0.79 0.83 0.76 0.98 0.95 0.97 0.95 1.00 0.95 0.95 0.89 0.91
CMS Sepsis Core Measure Metric (Abstracted Sample)
Oct-15 Nov-15 Dec-15 Jan-16 Feb-16 Mar-16 Apr-16 May-16 Jun-16 Jul-16 Aug-16 Sep-16 YTD FY16
Benchmark
Severe Sepsis/Septic Shock Early Management Bundle Compliance (SEP-1)
15.9% 17.4% 26.8% 23.9% 30.2% 25.3% 39.3% 47.6% 40.2% 34.3% 27.5% 39.7% 30.7% 34%
Numerator (100% Compliance) 7 8 11 21 26 20 42 49 35 36 30 46 331 FY16 TotalDenominator (Total Cases) 44 46 41 88 86 79 107 103 87 105 109 116 1011 32.74%
Compliance for Total Called Code Sepsis Cases - ED to ICU (Severe & Shock)
Oct-15 Nov-15 Dec-15 Jan-16 Feb-16 Mar-16 Apr-16 May-16 Jun-16 Jul-16 Aug-16 Sep-16 YTD FY16 Benchmark
Lactate drawn and resulted within 3-hours 71.0% 83.0% 82.0% 90.0% 89.0% 84.0% 85.0% 76.0% 73.0% 89.0% 96.0% 93.0% 84.3% 95%
Abx Admin within 3 hours 69.0% 80.0% 64.0% 85.0% 96.0% 92.0% 97.0% 94.0% 93.0% 96.0% 99.0% 97.0% 88.5% 95%
Fluid Admin 30ml/kg 40.0% 34.0% 31.0% 35.0% 34.0% 42.0% 68.0% 36.0% 47.0% 51.0% 49.0% 43.0% 42.5% 95%
Obtain Blood culture prior to Abx 84.0% 79.0% 74.0% 83.0% 84.0% 82.0% 74.0% 75.0% 68.0% 86.0% 95.0% 85.0% 80.8% 95%
Green: Meets/Exceeds Benchmark Red: Below Benchmark
Overall Sepsis Mortality Raw Data (Total) Oct-15 Nov-15 Dec-15 Jan-16 Feb-16 Mar-16 Apr-16 May-16 Jun-16 Jul-16 Aug-16 Sep-16
Outcome Cases - Mortality 346 323 390 392 442 470 464 480 422 415 430 430 Oct. 15' - Mar. 16' (Pre-Intervention) 2363 299 12.7%Total Deaths for Outcome Cases 36 52 56 54 51 50 45 56 44 48 38 40 Apr. 16' - Sept. 16' (Post- 2641 271 10.3%Overall Sepsis Mortality Rate Observed 10.4% 16.1% 14.4% 13.8% 11.5% 10.6% 9.7% 11.7% 10.4% 11.6% 8.8% 9.3% 18.9%
Cone Health System Sepsis DashboardProject Goal: Reduce overall mortality system wide for all coded sepsis from 14% to 10% (Top Decile)
Overall % Reduction in Mortality
Overall Mortality Reduction (Goal = 10%)
Emergency Department Process Measure Performance (ED to ICU pts)
CMS Performance Project Goal: Increase CMS Sepsis Bundle Compliance to 34%, reducing mortality rate by at least 15% per CMS guidelines
0%20%40%60%80%
100%
Lactate drawn andresulted within 3-
hours
Abx Admin within3 hours
Fluid Admin30ml/kg
Obtain Bloodculture prior to
Abx
FY16 Benchmark YTD
0.00
0.20
0.40
0.60
0.80
1.00
Overall Sepsis MortalityO/E
Readmission O/E LOS O/E
YTD FY16 Benchmark
Significant Results
Significant Results

42
Full Project Improvement Plan Implementation began October 2016
Results Significant!
www.TriadHealthCareNetwork.com

www.TriadHealthCareNetwork.com43
Triad HealthCare NetworkLearnings – Are we defining healthcare too narrowly?
Common Issues with High Utilizers – are these issues “healthcare”?• Lack of social support • Unsafe to remain at home• Lack of transportation • Financially challenged• Health literacy and/or problem solving skills• Family health education needs • Chronic health condition with daily management challenges* • Poly-pharmacy/ medication barrier issues*• Patient linkage needed to community resources• Lack of patient follow-up with a primary provider*
*Clinical Issues – traditional ‘healthcare’ definition
www.TriadHealthCareNetwork.com44
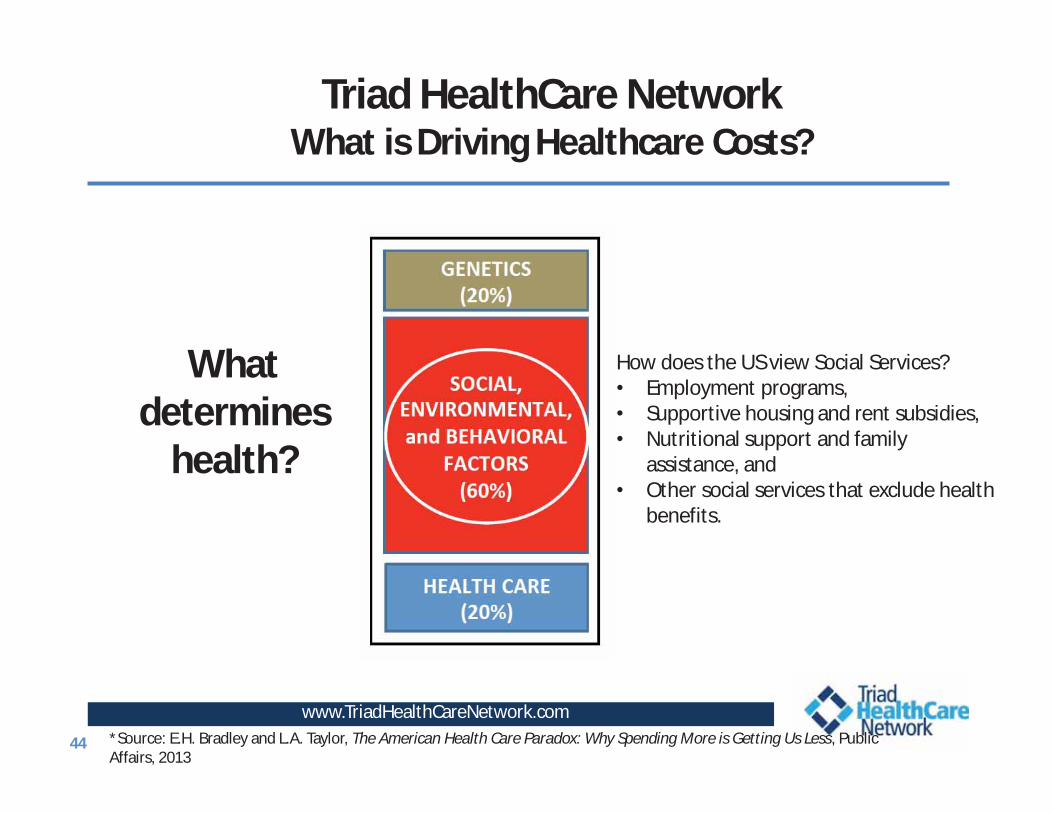
Triad HealthCare NetworkWhat is Driving Healthcare Costs?
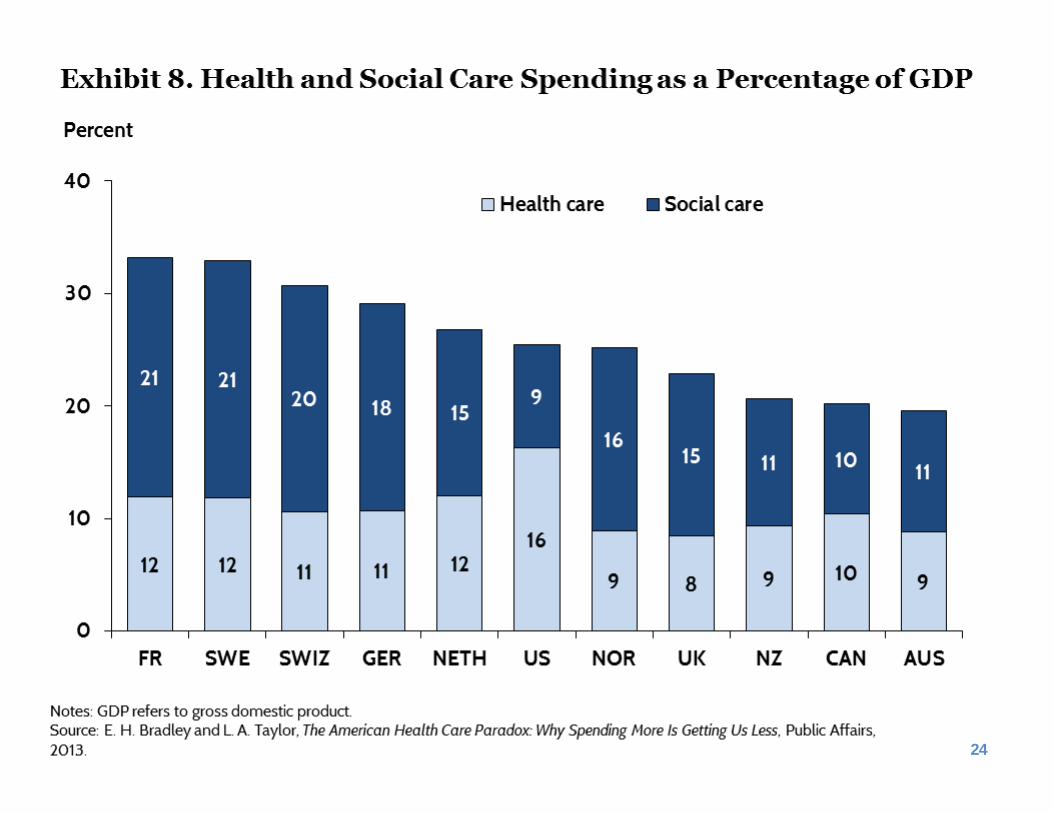
*Source: E.H. Bradley and L.A. Taylor, The American Health Care Paradox: Why Spending More is Getting Us Less, Public Affairs, 2013
How does the US view Social Services?• Employment programs,• Supportive housing and rent subsidies,• Nutritional support and family
assistance, and • Other social services that exclude health
benefits.
What determines
health?
24

Triad HealthCare Network2015/2016 NextGen Learnings
www.TriadHealthCareNetwork.com46
• If you want to lower costs, keep people out of the hospital• Admitted patients account for 17% of the population (5k), but
62% of costs
• CHF/COPD patients account for almost 40% of costs
• The Myth of the 5%
• Traditional Care Management has not been very effective for highest risk as deployed
• Must monitor patient engagement/ readiness to change

Triad HealthCare Network2017 Projects to Manage Cost/Quality
www.TriadHealthCareNetwork.com47
• Comprehensive Care Patient• Identify the patients who will have more cost in the future
• They may or may not have CHF, COPD, CKD/ESRD
• Identify what, if any, interventions will reduce that cost• Post-acute care
• Transition of Care, SNF• Reducing unnecessary utilization; better coordination
• Out of Network Utilization• End of Life Strategies• Variation Reporting

Triad HealthCare Network2017 Pilot Projects
www.TriadHealthCareNetwork.com48
• Paramedicine – EMS home visits for high complex• Palliative Care Home Visits• Telehealth – Video Visits• Behavioral Health Integration/Expansion
– Pushing out depression screening - proactive– Tele Psych – resource and follow up
• Automated Rx dispensing/reminders• Medical Therapy Management – Improve Compliance• Post Acute Care Incentive Program
– Population Based Payments

Triad HealthCare NetworkParamedicine Pilot
www.TriadHealthCareNetwork.com49
0
20
40
60
80
100
120
Category 1
Paramedicine ED visits and Admissions 3 months prior and 3 months post intervention
ED prior ED post Admit Prior Admit Post
40 ED visits prior24 ED visits after
98 Admits prior
29 Admits after
70%
40%
N=54
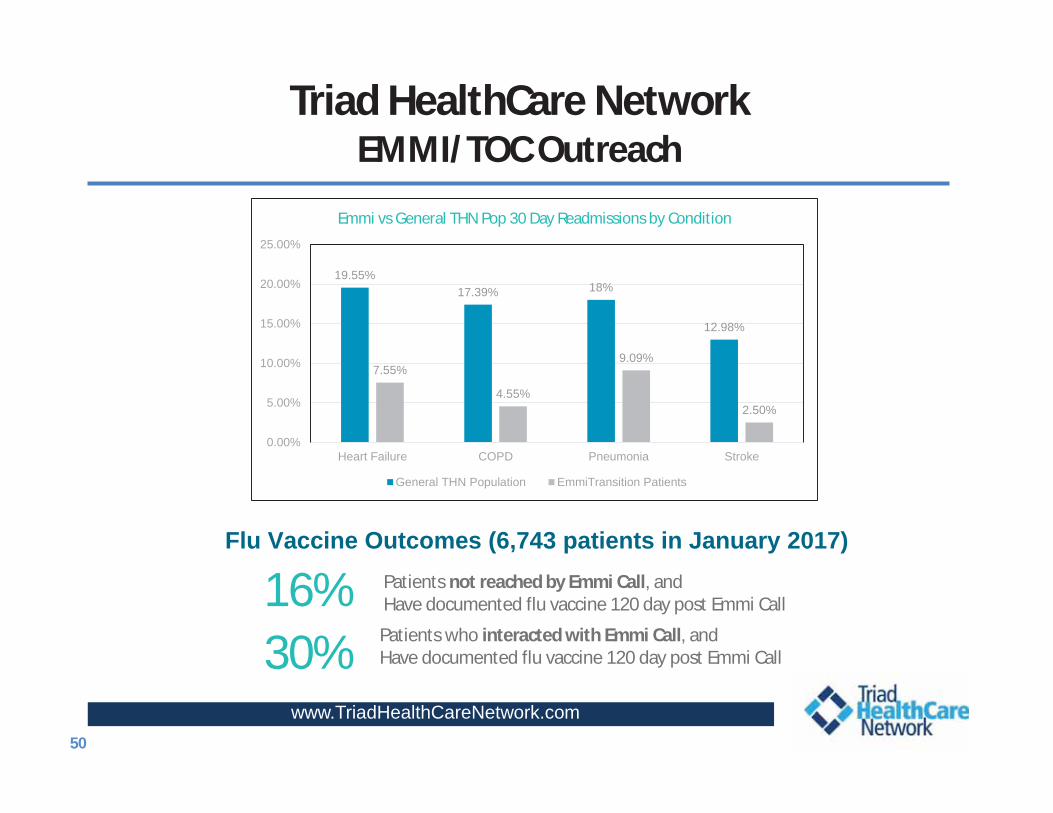
Triad HealthCare NetworkEMMI/TOC Outreach
www.TriadHealthCareNetwork.com50
19.55%17.39% 18%
12.98%
7.55%
4.55%
9.09%
2.50%
0.00%
5.00%
10.00%
15.00%
20.00%
25.00%
Heart Failure COPD Pneumonia Stroke
Emmi vs General THN Pop 30 Day Readmissions by Condition
General THN Population EmmiTransition Patients
30% Patients who interacted with Emmi Call, andHave documented flu vaccine 120 day post Emmi Call
16% Patients not reached by Emmi Call, andHave documented flu vaccine 120 day post Emmi Call
Flu Vaccine Outcomes (6,743 patients in January 2017)

Lessons Learned/Keys To Success • Physician Leadership and Engagement is Paramount• Information Technology Infrastructure is Key• Focus on the entire continuum of care: End of Life and
Post-acute Dollars are Big • Culture Change as must Move Health System from
Reactive to Proactive• Transition from Individual Physicians Care to Care
Management Team Approach• Embrace Population Health Management Approaches• Seek ways to engage patients (Engaged Practice results in
Engaged patient)
Measure, Adjust and Improve….This is an ongoing process

www.TriadHealthCareNetwork.com
Triad HealthCare NetworkVision for the Future
• Align provider behavior to improve quality, cost, and access– Develop and monitor outcomes that matter– Collaborate with physicians to improve efficiency across the
continuum– Use incentives and capitation to promote innovation in care
delivery
• Develop a high performing integrated network of preferred providers and community partners
• We believe that the highest quality and the most integrated care is, in fact, Exceptional Care!
16

www.TriadHealthCareNetwork.com53
Triad HealthCare Network
Questions?
Elissa LangleyChief Operating Officer