tri-state regional workforce alliance, economic report, 2016 update
TRANSCRIPT

0
REGIONAL
ECONOMIC
REPORT, 2016
UPDATE An assessment of the Tri-State Region’s economic and demographic
identity
ABSTRACT This report examines the
demographic, economic, and
industrial profile of the Tri-State
Region. Analyses showed that
educational attainment, income
levels, and unemployment rates have
all improved in the region since
2009. However, educational
attainment and household income
remain relatively low, while poverty
rates remain high. Stakeholders
should be proactive in addressing
these issues and put forth initiatives
at the intersections of social policy
and economic development. The
special focus of this report is the
health services sector. Analysis
reveals that it is becoming an
increasingly important part of the
region’s economic identity for which
policymakers should create
workforce development and industrial recruitment initiatives.
Lucas Stewart B.S. Candidate, Economics
1
A. Introduction The Tri-State Regional Workforce Alliance, Inc. (TSRWA), established in March 2009
as a nonprofit organization, serves a 26 county region spanning Alabama, Georgia and
Tennessee.i Overall, the TSRWA serves to collaboratively advance the region’s economic
competitiveness and develop workforce talent. Recently, the TSRWA created a web-based toolii
aimed at promoting the data-driven formation of regionally focused, sector-oriented labor market
strategies. The current report serves to supplement their work and focuses on assessing the
region’s demographic and economic identity.
The first section provides historical comparisons of key labor market statistics, and gives
an overview of current labor market conditions, making use of data underlying the TSRWA’s
previously developed web tool. Next, the region’s industrial sector is assessed. The discussion
begins with historical comparisons, and then shifts to analyze current leading industrial sectors
for the area, with a special focus on the healthcare sector. The report concludes with synthesized
findings from data analyses and recommendations aimed at aiding the region in maintaining its
economic competitiveness in both the short- and long-term.
B. Regional Demographic and Economic Assessment
1. Population
Between 2009 and 2014, the Tri-State Region experienced population growth of 3.1%. In
comparison, the respective states with counties in the region saw the following population
growth rates: Alabama (1.3%), Georgia (3.0%), and Tennessee (2.3%). Population growth in the
area also surpassed nationwide population growth of 2.4% for the period.

2
2. Age
Age Group 2009 2014 Percentage Change
Under 15 19.8% 18.8% -5.4%
15 to 19 6.4% 6.5% 1.6%
20 to 34 19.7% 18.2% -7.5%
35 to 54 27.9% 27.2% -2.8%
55 to 64 11.9% 12.6% 6.5%
65 and over 14.3% 15.8% 10.2%
Table 1. Tri-State Region’s Age Distribution, 2009 vs. 2014
An important aspect of the population related to economic growth and development is
age distribution. Table 1 shows that, overall, the region experienced growth in its population
aged 55 years old and older, while the relative portion represented by younger residents either
declined or remained essentially the same from 2009 to 2014. The relative portion of the total
population represented by those in the working-age population (15 to 64 years old) declined by
2.1%, while the representation of the (approximated) prime working-age population (20 to 54
years old) decreased by 4.7%, between 2009 and 2014. Current statistics indicate that the
working-age population (15 to 64 years old) represents 64.0% of the total population, which is
comparatively lower than the same populations’ representation in the following geographical
units: AL (66.3%), GA (67.6%), TN (66.6%), and US (66.8%).
Changes in the population’s age structure have important implications for the region’s
economy. As more individuals move into retirement, policymakers need to ensure that the future
workforce is able to meet the demands of employers – particularly of those operating in
advanced, highly-competitive industries.
3
According to a recent report from the Brookings Institution, advanced industrial sectors
operating within the Tri-State Region are growing in importance.iii,iv From 2010 to 2013,
advanced industries experienced employment growth of 6.4% in the Chattanooga, TN-GA
metropolitan statistical area (MSAv). In addition, output from this sector grew by 8.0% in the
area for the same period. These percentage changes were the 9th largest and 6th largest in the
nation, respectively. Advanced sectors of importance include: (1) Architectural, Engineering, and
Related Services, (2) Management, Scientific, and Technical Consulting Services, and (3) Motor
Vehicle Parts Manufacturing. Each of these industries experienced more than 10.0% growth in
employment between 2010 and 2013.
Workforce development initiatives should be established that focus on employers’ needs
in these sectors for entry-level positions. In addition, on-the-job training and continuing
education offerings should be made available to mid-level career professionals who will be
replacing higher-skilled persons entering retirement. Such measures would improve the
economic competitiveness and viability of the region by increasing labor mobility and attracting
new, more demanding employers to the area.
4
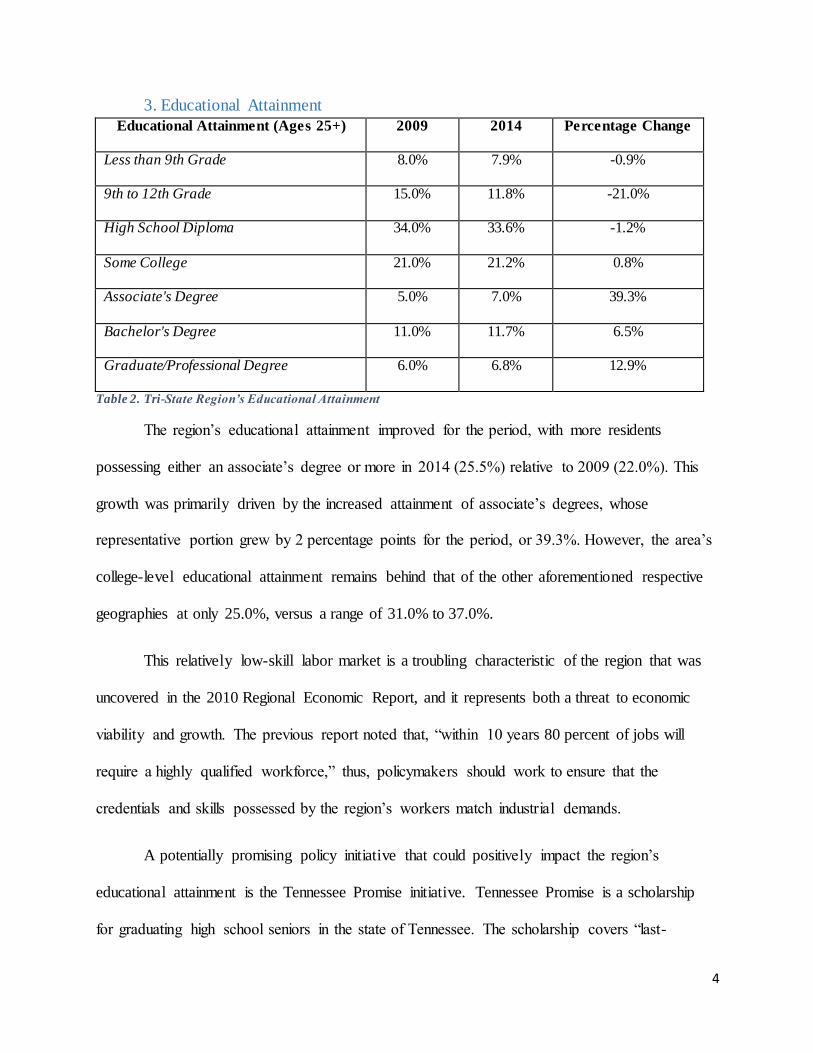
3. Educational Attainment
Educational Attainment (Ages 25+) 2009 2014 Percentage Change
Less than 9th Grade 8.0% 7.9% -0.9%
9th to 12th Grade 15.0% 11.8% -21.0%
High School Diploma 34.0% 33.6% -1.2%
Some College 21.0% 21.2% 0.8%
Associate's Degree 5.0% 7.0% 39.3%
Bachelor's Degree 11.0% 11.7% 6.5%
Graduate/Professional Degree 6.0% 6.8% 12.9%
Table 2. Tri-State Region’s Educational Attainment
The region’s educational attainment improved for the period, with more residents
possessing either an associate’s degree or more in 2014 (25.5%) relative to 2009 (22.0%). This
growth was primarily driven by the increased attainment of associate’s degrees, whose
representative portion grew by 2 percentage points for the period, or 39.3%. However, the area’s
college-level educational attainment remains behind that of the other aforementioned respective
geographies at only 25.0%, versus a range of 31.0% to 37.0%.
This relatively low-skill labor market is a troubling characteristic of the region that was
uncovered in the 2010 Regional Economic Report, and it represents both a threat to economic
viability and growth. The previous report noted that, “within 10 years 80 percent of jobs will
require a highly qualified workforce,” thus, policymakers should work to ensure that the
credentials and skills possessed by the region’s workers match industrial demands.
A potentially promising policy initiative that could positively impact the region’s
educational attainment is the Tennessee Promise initiative. Tennessee Promise is a scholarship
for graduating high school seniors in the state of Tennessee. The scholarship covers “last-

5
dollarvi” tuition and fees for two years at state community colleges, colleges of applied
technology, or other eligible schools that offer associate's degrees.
Currently there are 122 community and technical colleges in AL, GA, NC, and TN
(IPEDS, 2015). The first year of Tennessee Promise led to 24.7% and 20.0% increases in first-
time freshmen enrollment at Tennessee community colleges and colleges of applied technology,
respectively (THEC, 2016). The potential benefits of this policy are sizable, and surrounding
geographies (e.g., the entirety of the Tri-State Region) could gain from the policies positive
externalities such as higher wages, lower unemployment, and increased tax revenues.
4. Race and Ethnicity
Race & Ethnicity Classificationvii 2009 2014 Percentage Change
White 84.5% 87.1% 3.1%
Black/African American 7.5% 7.6% 2.2%
American Indian/Alaskan Native 0.4% 0.4% 12.3%
Asian 0.8% 1.0% 14.0%
Native Hawaiian/Pacific Islander 0.0% 0.0% -0.9%
Two or More Races 1.1% 1.8% 62.8%
Table 3. Tri-State Region’s Racial and Ethnic Distribution
As of 2014, the racial and ethnic distribution of the region’s population was
predominantly white, at 87.1%. Black/African American persons represented 7.6% of the total,
while the remaining racial and ethnic classifications amounted to less than 2%. This distribution
is essentially unchanged from 2009, however, we expect the area’s population to become
increasingly diverse over time.
6
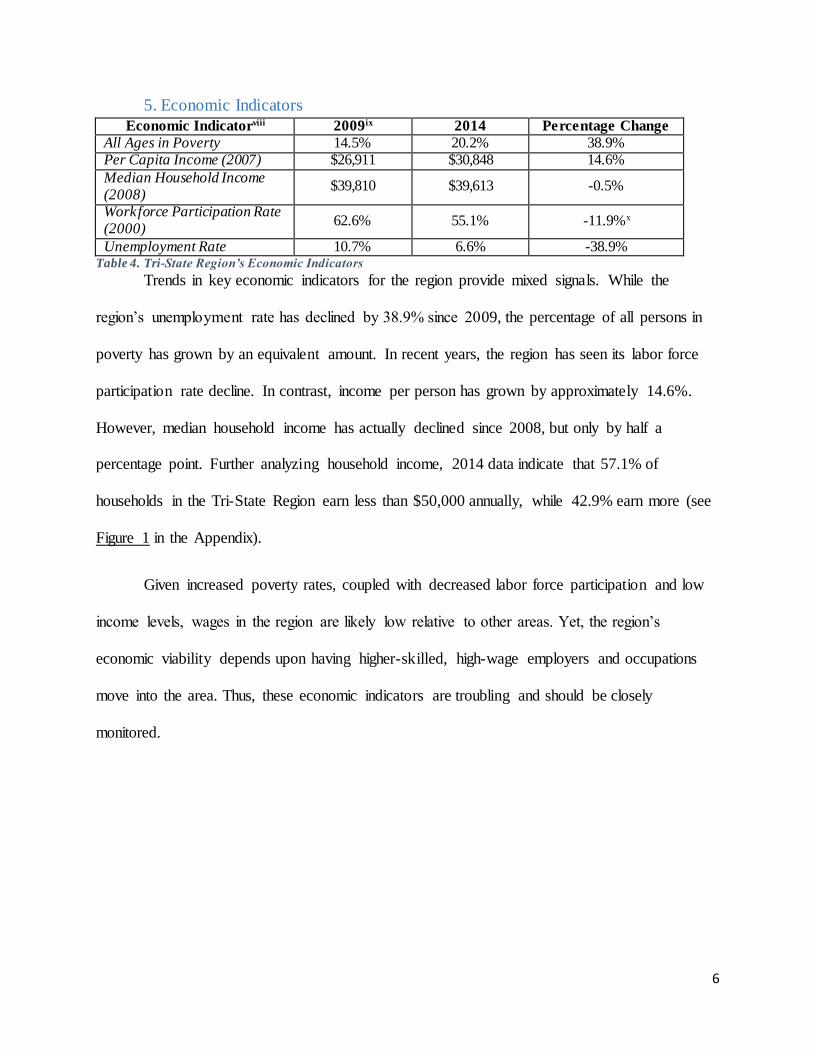
5. Economic Indicators
Economic Indicatorviii 2009ix 2014 Percentage Change
All Ages in Poverty 14.5% 20.2% 38.9% Per Capita Income (2007) $26,911 $30,848 14.6%
Median Household Income (2008)
$39,810 $39,613 -0.5%
Workforce Participation Rate (2000)
62.6% 55.1% -11.9%x
Unemployment Rate 10.7% 6.6% -38.9% Table 4. Tri-State Region’s Economic Indicators
Trends in key economic indicators for the region provide mixed signals. While the
region’s unemployment rate has declined by 38.9% since 2009, the percentage of all persons in
poverty has grown by an equivalent amount. In recent years, the region has seen its labor force
participation rate decline. In contrast, income per person has grown by approximately 14.6%.
However, median household income has actually declined since 2008, but only by half a
percentage point. Further analyzing household income, 2014 data indicate that 57.1% of
households in the Tri-State Region earn less than $50,000 annually, while 42.9% earn more (see
Figure 1 in the Appendix).
Given increased poverty rates, coupled with decreased labor force participation and low
income levels, wages in the region are likely low relative to other areas. Yet, the region’s
economic viability depends upon having higher-skilled, high-wage employers and occupations
move into the area. Thus, these economic indicators are troubling and should be closely
monitored.
7
Geographical Unit
All Ages
in Poverty
Percent
Workforce
Participation
Rate
Per
Capita
Income
Median
Household
Income
Unemployment Rate
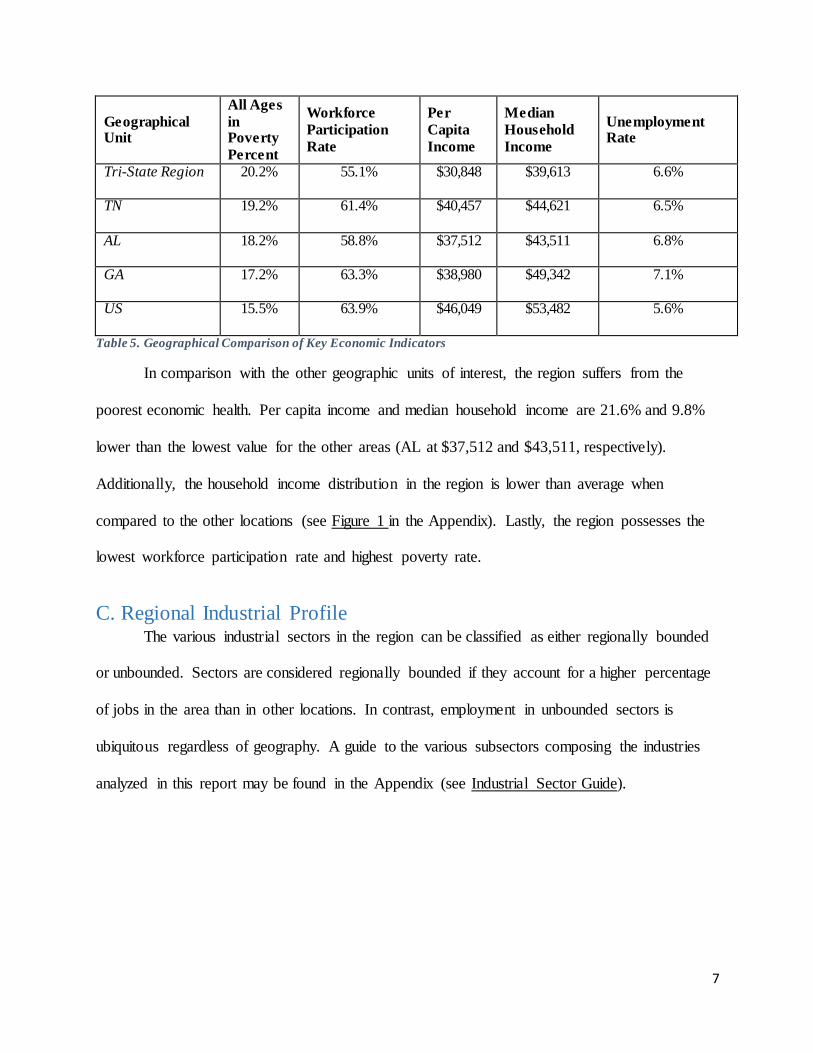
Tri-State Region 20.2% 55.1% $30,848 $39,613 6.6%
TN 19.2% 61.4% $40,457 $44,621 6.5%
AL 18.2% 58.8% $37,512 $43,511 6.8%
GA 17.2% 63.3% $38,980 $49,342 7.1%
US 15.5% 63.9% $46,049 $53,482 5.6%
Table 5. Geographical Comparison of Key Economic Indicators
In comparison with the other geographic units of interest, the region suffers from the
poorest economic health. Per capita income and median household income are 21.6% and 9.8%
lower than the lowest value for the other areas (AL at $37,512 and $43,511, respectively).
Additionally, the household income distribution in the region is lower than average when
compared to the other locations (see Figure 1 in the Appendix). Lastly, the region possesses the
lowest workforce participation rate and highest poverty rate.
C. Regional Industrial Profile The various industrial sectors in the region can be classified as either regionally bounded
or unbounded. Sectors are considered regionally bounded if they account for a higher percentage
of jobs in the area than in other locations. In contrast, employment in unbounded sectors is
ubiquitous regardless of geography. A guide to the various subsectors composing the industries
analyzed in this report may be found in the Appendix (see Industrial Sector Guide).

8
1. Regionally Bounded Industrial Sectors
Regionally Bounded Industrial Sector
Percentage of
Total Jobs
(2009)
Percentage of
Total Jobs
(2014)
Percentage Change
Transportation Product and Delivery
8.1% 9.1% 12.3%
Fabric Product Manufacturing 5.8% 6.9% 20.6% Specialized Economies 4.1% 5.9% 44.1%
Table 6. Percentage of Total Jobs Accounted for by Regionally Bounded Industrial Sectors, 2009 vs. 2014
In 2009, the rank order – in terms of the percent of total jobs accounted for – of the
sectors that form the region’s economic fingerprint were: (1) transportation product and delivery
(8.1%), (2) fabric product manufacturing (5.8%), and (3) specialized economies (4.1%). While
that same rank order held for 2014, the rank order of percentage growth in representation of total
jobs was opposite. However, the changes in terms of percentage points were relatively small (see
Table 6). Relative to other geographies, the percent of total jobs represented by either the fabric
product manufacturing or specialized economies sectors is greater in the Tri-State Region,
however, transportation product and delivery occupations have less of a presence in the region
relative to both AL and TN (see Table 8 in the Appendix).
As of 2014, based on metropolitan statistical area (MSA) and county-level occupational
employment data, jobs in the transportation product and delivery sector were most heavily
concentrated in southeastern TN, Cherokee County, NC, and DeKalb County, AL, while fabric
product manufacturing positions were most prevalent in Bartow, Gilmer and Gordon County,
GA, as well as the Dalton, GA MSA. Occupations in the specialized economies sector were
focused in Cherokee and Graham County, NC (see Tables 11 - 14 in the Appendix). It is
important for policymakers/stakeholders to keep these occupational employment concentrations
in mind for purposes of workforce development and attracting new employers to the region.

9
2. Regionally Unbounded Industrial Sectors
Sector Pct of Total
Jobs (2009)
Pct of Total
Jobs (2014) Percentage Change
Extractive Industries 2.6% 0.2% -91.6%
Construction 7.5% 4.1% -45.5%
Finance, Information and
Real Estate (FIRE) 9.0% 6.6% -26.2%
Professional and Business
Services 10.5% 10.4% -1.5%
Other Services 21.6% 21.9% 1.8%
Health Services 8.3% 11.1% 33.5%
Leisure and Hospitality 7.5% 11.2% 50.3%
Table 7. Percentage of Total Jobs Accounted for by Regionally Unbounded Industrial Sectors, 2009 vs. 2014
Excluding “other services” – 2009 data from the TSRWA show that professional and
business services (10.5%), finance, information and real estate (FIRE) (9.0%), and health
services (8.3%) were the leading regionally unbounded sectors in terms of percentage of total
jobs. Extractive industries had the smallest sectoral representation at only 2.6%. Between 2009
and 2014, leisure and hospitality and health services experienced the greatest growth, with each
increasing by more than 33.0%. Over the same period, construction and FIRE underwent the
largest percentage point declines (3.4 and 2.4 percentage points, respectively), while extractive
industries felt the most sizable percentage decrease. These results are not surprising given the
dampened economic activity in these sectors resulting from the Great Recession of 2007 –
2009.xi
For 2014, again excluding “other services,” leisure and hospitality, health services, and
professional and business services represented the largest sectors at 11.2%, 11.1%, and 10.4% of

10
total jobs, respectively. The remaining regionally unbounded sectors accounted for less than
7.0% of total jobs, with extractive industries only amounting to 0.2%.
The rank order of and percentage changes in the proportion of total jobs represented by
the various regionally unbounded industrial sectors should be closely monitored by
policymakers, employers and employees alike. Sectors with a low employment presence and/or
experiencing declines in employment pose issues for employers, workers, and policymakers.
Persons affiliated with these sectors, including policymakers, must innovate in order to survive
(and hopefully thrive) in a dynamic economy. Alternatively, sectors with a high employment
presence and/or growth sectors represent both the strengths and opportunities possessed by the
Tri-State Region; policy initiatives can be targeted at these sectors to improve the area’s
economic competitiveness.
3. Health Services
The health services sector is already an integral part of the Tri-State Region’s economy: it
represents 11.1% of total jobs in the region, and it has experienced job growth of nearly 3
percentage points since 2009 (see Table 7 above). This sectors’ significance will only continue
growing: the Bureau of Labor Statistics (BLS) estimates that health services jobs will account for
more than one-third of US projected job growth from 2014 to 2024 (BLS, Current Employment
Statistics (CES)).
The health services sector is comprised of the following subsectors: (1) ambulatory
healthcare services, (2) hospitals, (3) nursing and residential care facilities, and (4) social
assistance. The services in this sector are delivered by trained and credential professiona ls, and
typical occupations include home health aides, licensed practical and license vocational nurses
(LPN and LVN), and medical and health services managers. Additionally, the field comprises
11
higher level practitioners such as nurse practitioners, general physicians, dentists, optometrists,
etc.
The sector possesses positive economic characteristics. According to preliminary May
2016 estimates from the BLS, the average hourly earnings of all employees in the health services
sector is $25.93, or $51,860 annually, while the national unemployment rate for all persons
employed in this sector stands at only 2.9% (BLS, CES). Additionally, a sizable portion of jobs
in health services require only an associate’s degree or postsecondary vocational award,
including LPNs and LVNs, occupational and physical therapy assistants, diagnostic medical
sonographers and dental hygienists. These occupations are expected to experience employment.
Also, national employment projections indicate that nurse practitioners, physical therapists and
optometrists will all see their occupations grow by 27.0% or greater between 2014 and 2024
(BLS, Employment Projections).
Overall, the health services sector is becoming increasingly relevant to the region’s
economy, thus, efforts should be made to ensure that educational credentials and job skills
possessed by the area’s workforce match industry standards in order to optimize employment in
and the economic impact of this sector. Additionally, health services, coupled with other growth
sectors, provides policymakers with the opportunity to forge a “new economy” for the Tri-State
Region, solidifying overall economic viability and sustainability through collaboration with
those currently operating in the sectors constituting the region’s economic identity.
Some important factors pertaining to the health services sector for
policymakers/stakeholders to bear in mind are: (1) aging population and (2) the Patient
Protection and Affordable Care Act (PPACA, aka, ACA). As residents in the Tri-State Region
continue aging, the health services sector should continue growing due to increased demand for

12
health-related treatment/procedures. Thus, an area of focus for workforce development may be
geriatric care, particularly home health aides.
While the impacts of an aging/retiring population are relatively straightforward as they
pertain to healthcare, those posed by the passage and implementation of the ACA are more
uncertain. With a greater portion of the population insured, one could reasonably assume that
demand for the services of healthcare workers/providers will increase. However, the magnitude
and composition of such a demand effect may be altered by other factors. If states choose to
expand Medicaid, this may further increase demand for health services by expanding coverage.xii
In addition, factors outside of the legislation such as regional income levels may contribute to
demand for healthcare. Lastly, some insurers have dropped out of the Marketplace exchanges
after experiencing losses – this could lead to higher premiums and dampened demand through
limited coverage options.
D. Conclusion and Recommendations Between 2009 and 2014, the Tri-State Region saw improvements in educational
attainment, per capita income levels and the unemployment rate. Promising initiatives such as
Tennessee’s Labor Education Alignment Program (LEAP) are aiding in this progress by aligning
the skills and credentials of postsecondary graduates with industry demands.
In addition, the health services sector is growing in importance for the region’s economy.
Given the strong wage characteristics and employment projections possessed by occupations in
this sector, policymakers should integrate this sector into economic development policies both
now and in the future. Furthermore, the changing US healthcare landscape should be attentively
tracked to ensure that current and future policies are adjusted accordingly.

13
However, other changes during the period highlight present and emerging challenges that
will require intervention efforts from stakeholders. These are elaborated upon below:
1. Aging population: As the region’s population continues aging, age composition should
be closely monitored by policymakers as the size of the prime working age population
(25 to 54 years old) plays a significant role in economic growth.
2. Educational attainment: While college-level (postsecondary vocational award or
associate’s degree and beyond) educational attainment improved over the past five years,
the region continues to lag behind surrounding geographies. Policymakers should
continue improving educational and job-skill development interventions to mitigate the
present low-skill labor market and ensure that the area’s workforce maintains pace with
industry standards.
3. Poverty: Low-income/high-poverty levels are economic issues for the region.
Stakeholders should collaborate to establish innovative policies focused on reducing
these problems: investments in workforce development and new employer recruitment
offer two potentially useful policy levers.
Based on the above challenges, we recommend that policymakers in the area collaborate to
undertake further research focused on alleviating multidimensional poverty in the Tri-State
Region. Components of multidimensional poverty include: (1) low income, (2) low educational
attainment, (3) geographical disparities of income and educational attainment, (4) lack of health
insurance, and (5) unemployment.xiii By analyzing these facets and forming policies to mitigate
their effects, policymakers can improve the performance of the region’s economy. Such efforts
will require significant collaboration and outreach beyond the scope of previous work, but the

14
central outcome of a more productive, positive workforce warrants the undertaking of such a
project.

15
E. Appendix
Figure 1. Geographical Comparison of Household Income Distributions, 2014
*Note: The two highest household income ranges ($150,000 to $199,999 and $200,000 or more)
each represent 5.0% or less of the respective geographies household income distributions. Thus, data labels are not presented.
Geographical
Unit
Percentage of Total Jobs
Transportation Product and
Delivery
Fabric Product
Manufacturing
Specialized
Economies
Tri-State Region 9.1% 6.9% 5.9%
US 6.7% 0.3% 3.8%
AL 10.6% 0.9% 5.0%
GA 7.3% 1.4% 3.9%
NC 5.5% 1.3% 5.7%
TN 10.6% 0.4% 4.8%
Table 8. Geographical Comparison of Regionally Bounded Sectoral Concentration, 2014
8.7%
8.2%
8.7%
9.9%
7.2%
8.5%
6.4%
6.3%
5.6%
7.0%
5.3%
7.0%
12.8%
11.9%
11.3%
12.9%
10.7%
13.7%
11.9%
11.8%
10.8%
11.4%
10.2%
12.4%
14.9%
14.9%
14.0%
14.4%
13.5%
15.3%
18.1%
18.1%
18.0%
17.2%
17.8%
18.3%
10.9%
11.4%
11.5%
10.8%
12.2%
10.7%
10.0%
10.6%
11.6%
10.3%
13.0%
9.2%
0.0% 10.0% 20.0% 30.0% 40.0% 50.0% 60.0% 70.0% 80.0% 90.0% 100.0%
TN
NC
GA
AL
US
Tri-State Region
Less than $10,000 $10,000 to $14,999 $15,000 to $24,999 $25,000 to $34,999
$35,000 to $49,999 $50,000 to $74,999 $75,000 to $99,999 $100,000 to $149,999
$150,000 to $199,999 $200,000 or more
16
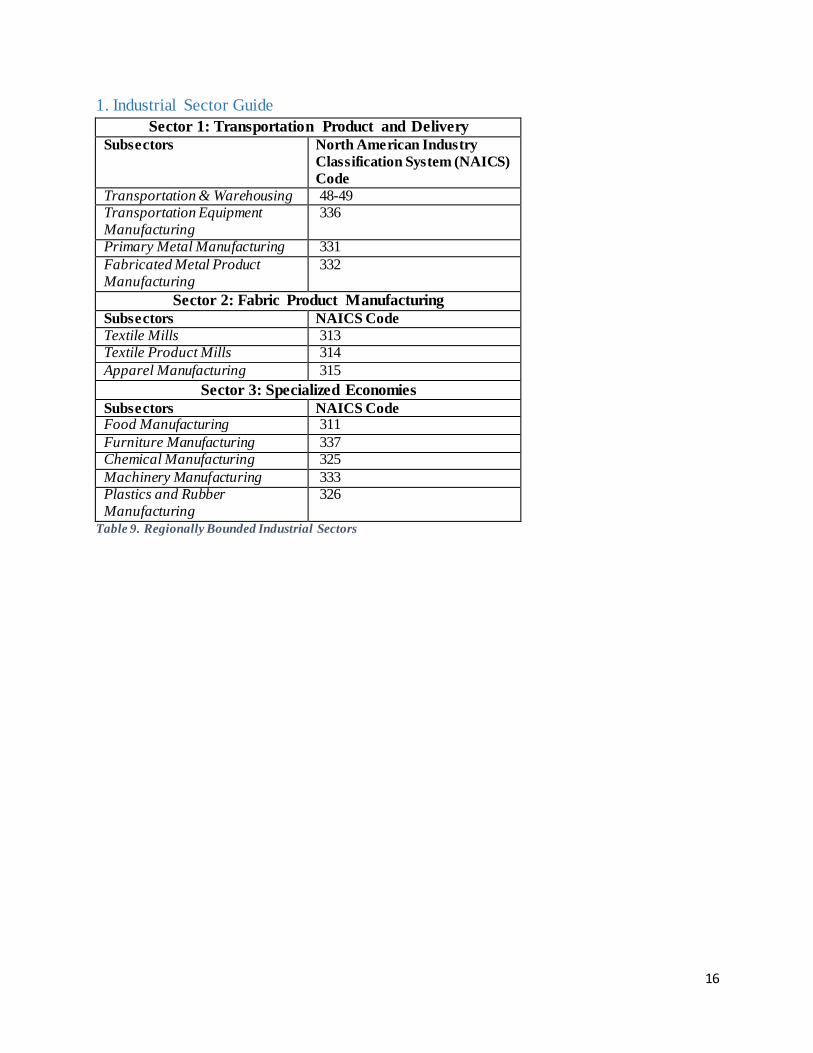
1. Industrial Sector Guide
Sector 1: Transportation Product and Delivery
Subsectors North American Industry
Classification System (NAICS)
Code
Transportation & Warehousing 48-49 Transportation Equipment Manufacturing
336
Primary Metal Manufacturing 331
Fabricated Metal Product Manufacturing
332
Sector 2: Fabric Product Manufacturing
Subsectors NAICS Code
Textile Mills 313 Textile Product Mills 314
Apparel Manufacturing 315
Sector 3: Specialized Economies
Subsectors NAICS Code Food Manufacturing 311
Furniture Manufacturing 337 Chemical Manufacturing 325
Machinery Manufacturing 333 Plastics and Rubber Manufacturing
326
Table 9. Regionally Bounded Industrial Sectors

17
Sector A: Construction
Subsector NAICS Code Construction 23
Sector B: Leisure and Hospitality
Subsector NAICS Code Arts, Entertainment, and Recreation
71
Accommodation and Food Services
72
Sector C: Health Services
Subsector NAICS Code
Healthcare and Social Assistance 62
Sector D: Professional and Business Services
Subsector NAICS Code
Professional, Scientific, and Technical Services
54
Management of Companies and Enterprises
55
Administrative and Support and Waste Management and Remediation Services
56
Sector E: Finance, Information and Real Estate (FIRE)
Subsector NAICS Code
Finance and Insurance 52 Information 51
Real Estate and Rental and Leasing
53
Sector F: Extractive Industries (Natural Resources and
Mining)
Subsector NAICS Code
Agriculture, Forestry, Fishing and Hunting
11
Mining Quarrying, and Oil and Gas Extraction
21
Sector G: Other Services
Subsector NAICS Code Utilities 22
Wholesale Trade 42 Retail Trade 44 – 45
Educational Services 61
Other Services, Except Public Administration
81
Table 10. Regionally Unbounded Industrial Sectors
18
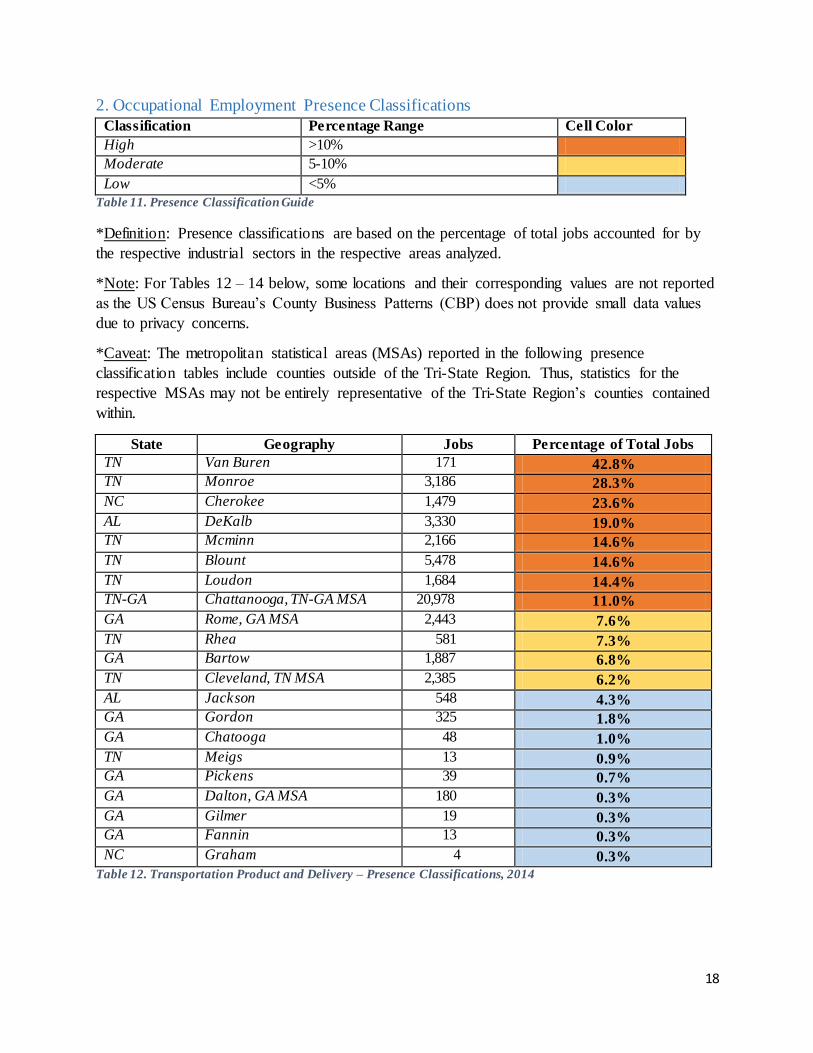
2. Occupational Employment Presence Classifications
Classification Percentage Range Cell Color
High >10%
Moderate 5-10%
Low <5%
Table 11. Presence Classification Guide
*Definition: Presence classifications are based on the percentage of total jobs accounted for by
the respective industrial sectors in the respective areas analyzed.
*Note: For Tables 12 – 14 below, some locations and their corresponding values are not reported
as the US Census Bureau’s County Business Patterns (CBP) does not provide small data values
due to privacy concerns.
*Caveat: The metropolitan statistical areas (MSAs) reported in the following presence
classification tables include counties outside of the Tri-State Region. Thus, statistics for the
respective MSAs may not be entirely representative of the Tri-State Region’s counties contained
within.
State Geography Jobs Percentage of Total Jobs
TN Van Buren 171 42.8%
TN Monroe 3,186 28.3%
NC Cherokee 1,479 23.6%
AL DeKalb 3,330 19.0%
TN Mcminn 2,166 14.6%
TN Blount 5,478 14.6%
TN Loudon 1,684 14.4%
TN-GA Chattanooga, TN-GA MSA 20,978 11.0%
GA Rome, GA MSA 2,443 7.6%
TN Rhea 581 7.3%
GA Bartow 1,887 6.8%
TN Cleveland, TN MSA 2,385 6.2%
AL Jackson 548 4.3%
GA Gordon 325 1.8%
GA Chatooga 48 1.0%
TN Meigs 13 0.9%
GA Pickens 39 0.7%
GA Dalton, GA MSA 180 0.3%
GA Gilmer 19 0.3%
GA Fannin 13 0.3%
NC Graham 4 0.3%
Table 12. Transportation Product and Delivery – Presence Classifications, 2014

19
State Geography Jobs Percentage of Total Jobs GA Gordon 5,928 32.7%
GA Dalton, GA MSA 17,461 30.6% GA Gilmer 810 13.4%
GA Bartow 3,379 12.1% AL DeKalb 1,666 9.5%
NC Graham 62 4.1% TN Monroe 445 4.0%
GA Rome, GA MSA 1,260 3.9% TN Mcminn 290 2.0%
GA Fannin 73 1.6%
TN Cleveland, TN MSA 609 1.6% TN-GA Chattanooga, TN-GA MSA 2,719 1.4%
AL Jackson 158 1.3% TN Loudon 31 0.3%
NC Cherokee 16 0.3% Table 13. Fabric Product Manufacturing – Presence Classifications, 2014
State Geography Jobs Percentage of Total Jobs NC Cherokee 3,523 56.3%
NC Graham 359 23.6% TN Mcminn 1,403 9.5%
TN Loudon 1,101 9.4% GA Gordon 1,632 9.0%
GA Bartow 2,390 8.6% GA Rome, GA MSA 2,002 6.2%
TN-GA Chattanooga, TN-GA MSA 11,581 6.1% TN Cleveland, TN MSA 2,177 5.7%
AL Jackson 548 4.3% GA Dalton, GA MSA 2,363 4.1%
AL DeKalb 496 2.8% TN Grundy 33 2.4%
TN Monroe 229 2.0% GA Fannin 66 1.5%
GA Gilmer 66 1.1%
TN Blount 380 1.0% GA Pickens 52 0.9%
Table 14. Specialized Economies – Presence Classifications, 2014
20
3. Data Sources
1. Population Estimates – US Census Bureau, 2010 – 2014 American Community Survey
(ACS) 5-Year Estimates1
2. Educational Attainment – same as above
a. Number of Community and Technical Colleges – U.S. Department of
Education. Institute of Education Sciences, National Center for Education
Statistics. Integrated Postsecondary Education Data System (IPEDS), Final
Release Data, 2014-20152
b. Tennessee Promise Year 1 Performance – Tennessee Higher Education
Commission (THEC)3
3. Racial and Ethnic Distribution – same as above
4. Economic Indicators
a. All Ages in Poverty – Small Area Income and Poverty Estimates (SAIPE), State
and County Estimates for 20144
b. Per Capita Income – US Department of Commerce, Bureau of Economic
Analysis (BEA), Regional Data: Local Area Personal Income and Employment5
c. Median Household Income – 2014 ACS 5-Year Estimates
d. Workforce Participation Rate
i. National Estimates – US Department of Labor (DOL), Bureau of Labor
Statistics (BLS), Current Population Survey (CPS)6
ii. State and County Estimates – US DOL, BLS, Local Area Unemployment
Statistics (LAUS)7
e. Unemployment Rate
i. National Estimates – same as above
ii. State and County Estimates – same as above
5. Regional Industrial Profile
a. National, State and County Estimates – US DOL, BLS, Quarterly Census of
Employment & Wages (QCEW)8
b. Metropolitan Statistical Area (MSA) Estimates – US DOL, BLS, Occupational
Employment Statistics (OES)9
Notes:
1. All data from this source was collected using the US Census Bureau’s American
FactFinder tool, found here: http://factfinder.census.gov/faces/nav/jsf/pages/index.xhtml.
2. Institutional data was collected using the following tool (URL -
https://nces.ed.gov/ipeds/datacenter/InstitutionByGroup.aspx)
3. Infographic with information related to Tennessee Promise may be found here (URL -
https://www.tn.gov/thec/article/tn-promise-year-1-infographic)
4. Data was assembled using the Interactive SAIPE Data and Mapping Tool (URL -
https://www.census.gov/did/www/saipe/data/interactive/saipe.html)
5. Data was gathered using the BEA’s Interactive Data Application (URL -
http://www.bea.gov/itable/)

21
6. CPS Labor Force Statistics were collected using the one-screen data search here:
http://www.bls.gov/cps/#data
7. LAUS data were assembled using the multi-screen data search here:
http://www.bls.gov/data/#unemployment; also, as LAUS does not contain population
estimates, 2014 ACS 5-Year Estimates were used for the adult population denominator of
the workforce participation rate formula.
8. QCEW statistics were gathered using the multi-screen data search here:
www.bls.gov/data/#employment.
9. OES data were gathered from the following web page:
http://www.bls.gov/oes/tables.htm.
i The 2010 Regional Sector-Based Analysis and Report from Tri-State Regional Workforce Alliance, Inc. indicated
that a 30-county region, including 2 counties (Cherokee and Graham) in North Carolina, formed the economic
identity and geographic scope of the Tri-State Region. Thus, estimates for these 2 counties may be present in the
current report. ii The web-based tool may be found here: http://www.nsparc.msstate.edu/sites/Tri-State-Website/. iii The referenced report is titled America’s Advanced Industries: What They Are, Where They Are, and Why They
Matter. The report, along with useful interactive data tools, may be found here -
https://www.brookings.edu/research/americas -advanced-industries-what-they-are-where-they-are-and-why-they-
matter/. iv Quoting directly from the Brookings’ report, the authors identified advanced industries using the following
criteria: (1) “An industry’s R&D spending per worker must fall in the 80th percentile of industries or higher,
exceeding $450 per worker,” and (2) “The share of workers in an industry whose occupations require a high degree
of STEM knowledge must also be above the national average, or 21 percent of all workers.” v In laymen’s terms, a metropolitan statistical area (MSA) is a geographical region possessing a re latively high core
population density with close economic connections in the area. For a more precise, detailed definition, see the
following: http://www.census.gov/population/metro/about/. vi Last-dollar scholarships cover the gap between the direct cost of enrollment (tuition and fees) and aid from federal,
state, and institutional grants (Carruthers & Fox, 2015). vii According to the US Census Bureau, persons who identify their origin as Hispanic, Latino, or Spanish may be of
any race. Thus, related statistics are not exclusively reported for these persons. For additional information, please
consult the following: http://www.census.gov/population/hispanic/about/faq.html. viii Per capita income is in current dollars (not adjusted for inflation). Household income is inflation adjusted (USD
2014). Unemployment rates are not seasonally adjusted and pertain to persons 16 years and o ver. ix Statistics presented here represent the most recent data reported on the TSRWA web page under Basic Economic
Indicators and Demographics. A parenthetical reference for the year data was collected for the respective statistics
not collected in 2009 is provided. x The workforce participation rate percentage change should be interpreted with caution as the US economy was
thriving in 2000 relative to later years, and the impacts of the Great Recession are likely still present in recent data. xi Periods of economic recession are defined by the National Bureau of Economic Research (NBER) and can be
found here: http://www.nber.org/cycles.html. xii States have the option to expand Medicaid; however, none of the states comprising the Tri-State Region have
chosen to enact this measure. xiii These dimensions come from an April 2016 report from the Brookings Institution titled Five Evils:
Multidimensional Poverty and Race in America by Richard Reeves, Edward Rodrigue, and Elizabeth Kneebone.