trf limited board of directors - trf.co.in · fifty fifth annual report 2017-18 2 55th annual...
TRANSCRIPT


1
TRF LIMITEDCIN : L74210JH1962PLC000700
BOARD OF DIRECTORS(As on May 29, 2018)
Mr. Sandip Biswas - Chairman
Mr. Ranaveer Sinha
Mr. Dipankar Chatterji
Mr. Sabyasachi Hajara
Ms. Neera Saggi
Mr. Dibyendu Bose
Mr. Rajesh Ranjan Jha
Mr. Vinayak K. Deshpande
Mr. Sanjay Rajoria - Managing Director
MANAGEMENT(As on May 29, 2018)
Mr. Sanjay Rajoria - Managing Director
Mr. Sumit Shubhadarshan - Vice President, Commercial
Mr. Anil Kumar Singh - Vice President, Operations
Mr. Sandeep Kumar Tanwar - Officer on Special Duty
Mr. Akhileshwar K. Pandey - Sr. General Manager, Life Cycle Services
Mr. Ashish Banerjee - Chief Design, Engg. & Tech.
Mr. K.S. Mathai Mathew - Chief Financial Officer
Mr. Mediomah H. Patel - Chief Business Excellence
Mr. Amitabh Chandra Jha - Chief Human Resource Officer
Mr. S.S. Karim - General Manager, Supply Chain
Mr. Dev Chandra Jha - Chief Business Development
Mr. Subhashish Datta - Chief Commercial
Registered Office
11, Station Road, Burmamines, Jamshedpur- 831 007
Phone : 91 657 3046500 / 3046598 Fax : 91 657 2345732
Website : www.trf.co.in
Bankers Axis Bank Dena Bank
Bank of Baroda HDFC Bank
Canara Bank IDBI Bank
Central Bank of India Indian Bank
Kotak Mahindra Bank
Auditors Cost Auditors Secretarial AuditorsM/s Price Waterhouse & Co. Chartered Accountants LLP M/s Shome & Banerjee M/s P. K Singh & Associates
Chartered Accountants Cost Accountants Company Secretaries
(Firm Registration No. 304026E/E-300009) (Firm Registration No. 000001) (Firm Registration No.
P2002JH045700)
Registrars & Transfer AgentsTSR Darashaw Limited
6-10, Haji Moosa Patrawala Indl. Estate, (Near Famous Studio)
20, Dr. E. Moses Road, Mahalaxmi, Mumbai – 400 011
Tel. no. : (022) 6656-8484 Fax no. : (022) 6656-8494
E-mail : [email protected]
Website : www.tsrdarashaw.com

Fifty Fifth Annual Report 2017-18
2
55th Annual General Meeting of TRF Limited will be held on Friday, July 27, 2018 at the
Main Hall, Beldih Club, Northern Town, Jamshedpur - 831 001 at 12.30 p.m.
Members are requested to kindly bring their copies of the Annual Report to the meeting.
Contents
Notice .................................................................................................................................................................................................... 3 - 16
Highlights .................................................................................................................................................................................................. 17
Directors’ Report and Management Discussion and Analysis ........................................................................................ 18 - 57
Corporate Governance Report .................................................................................................................................................. 58 - 70
Funds Flow Statement .......................................................................................................................................................................... 71
Summarised Balance Sheet and Statement of Profit and Loss .............................................................................................. 72
Auditors’ Report .............................................................................................................................................................................. 73 - 79
Balance Sheet........................................................................................................................................................................................... 80
Profit and Loss Account ........................................................................................................................................................................ 81
Cash Flow Statement .................................................................................................................................................................... 82 - 83
Statement of changes in equity for the yer ended 31st March, 2018 ................................................................................. 84
Notes forming part of the Financial Statements .............................................................................................................. 85 - 129
Annexure -1 as per SEBI Circular No. CIR/CFD/CMD/56/2016 dated 27.05.2016.................................................130 - 131
Consolidated Financial Statement :
Auditors’ Report ..........................................................................................................................................................................132 - 137
Consolidated Balance Sheet ..............................................................................................................................................................138
Consolidated Statement of Profit and Loss .......................................................................................................................139 - 140
Consolidated Cash Flow Statement .....................................................................................................................................141 - 142
Consolidated Statement of changes in equity for the yer ended 31st March, 2018 .................................................... 143
Notes forming part of the Financial Statements ..............................................................................................................144 -199
AGM Venue Route Map .......................................................................................................................................................................200

3
NoticeNotice is hereby given that the 55th Annual General Meeting of TRF Limited will be held at Main Hall, Beldih Club,
Northern Town, Jamshedpur-831001 on Friday, July 27, 2018 at 12.30 p.m. to transact the following business:
Ordinary Business :
1. To receive, consider and adopt –
a) The Standalone Financial Statements of the Company for the year ended March 31, 2018 and the report of the
Directors and Auditors thereon, and
b) The Consolidated Financial Statements of the Company for the year ended March 31, 2018 and the report of the
Auditors thereon.
2. To appoint a Director in place of Mr. Rajesh Ranjan Jha (DIN: 07715246), who retires by rotation and being
eligible, offers himself for re-appointment.
Special Business:
3. Appointment of Mr. Vinayak Kashinath Deshpande as a Director
To consider and if thought fit, to pass with or without modification, the following Resolution as an Ordinary Resolution:
“RESOLVED THAT Mr. Vinayak Kashinath Deshpande (DIN: 00036837), who was appointed in terms of Section 161 of
the Companies Act, 2013 by the Board of Directors as an Additional Director of the Company with effect from May
29, 2018 and holds office upto the date of this Annual General Meeting of the Company and in respect of whom the
Company has received a notice in writing from a member under Section 160 of the Companies Act, 2013, proposing his
candidature for the office of Director of the Company, be and is hereby appointed as a Director of the Company, liable
to retire by rotation.”
4. Appointment of Mr. Sanjay Rajoria as a Director
To consider and if thought fit, to pass with or without modification, the following Resolution as an Ordinary Resolution:
“RESOLVED THAT Mr. Sanjay Rajoria (DIN: 08063280), who was appointed in terms of Section 161 of the Companies
Act, 2013 by the Board of Directors as an Additional Director of the Company with effect from February 1, 2018 and
holds office upto the date of this Annual General Meeting of the Company and in respect of whom the Company has
received a notice in writing from a member under Section 160 of the Companies Act, 2013, proposing his candidature
for the office of Director of the Company, be and is hereby appointed as a Director of the Company, not liable to retire
by rotation.”
5. Appointment of Mr. Sanjay Rajoria as Managing Director
To consider and if thought fit, to pass with or without modification, the following Resolution as a Special Resolution:
“RESOLVED THAT pursuant to Sections 196, 197, 203 and any other applicable provisions of the Companies Act, 2013
(“Act”) and the Rules made there under, as amended from time to time, read with Schedule V to the Act, the Company
hereby approves the appointment and terms of remuneration of Mr. Sanjay Rajoria (DIN: 08063280), as Managing
Director of the Company for the period from February 1, 2018 to January 31, 2021 not liable to retire by rotation, upon
the terms and conditions as mentioned in the draft agreement submitted to this meeting, the details of which are set
out in the Explanatory Statement annexed to the Notice convening this meeting, including the remuneration to be
paid in the event of loss or inadequacy of profits in any financial year, with liberty to the Directors to alter and vary the
terms and conditions of the said appointment in such manner so as to not exceed the limits specified in Schedule V to
the Act, as may be agreed to between the Board of Directors and Mr. Sanjay Rajoria within the applicable provisions of
the Companies Act, 2013.
RESOLVED FURTHER THAT the Board be and is hereby authorized to take all such steps as may be necessary, proper and
expedient to give effect to this Resolution.”
6. Ratification of remuneration of Cost Auditors
To consider and if thought fit, to pass with or without modification, the following Resolution as an Ordinary Resolution:
“RESOLVED THAT pursuant to and in accordance with the provisions of Section 148 and other applicable provisions, if
any, of the Companies Act, 2013 and rules there under, the Cost Auditors, M/s. Shome & Banerjee, (Firm Registration No.

Fifty Fifth Annual Report 2017-18
4
000001) having office at Kolkata – 700 017, appointed by the Board of Directors of the Company, to conduct the audit
of the cost records of the Company for the financial year ending March 31, 2019, be paid a consolidated remuneration
of Rs. 3,50,000 (plus GST as applicable) and they shall also be entitled to re-imbursement of out of pocket expenses as
may be incurred by them, if any, during the course of their assignment;
RESOLVED FURTHER THAT the Directors, Chief Financial Officer, Compliance Officer, Company Secretary of the Company
be and are hereby severally authorized to take all actions and do all such acts, deeds, matters and things as may be
necessary or desirable in connection with or incidental to giving effect to the above resolution.”
NOTES:
a) A MEMBER ENTITLED TO ATTEND AND VOTE AT THE MEETING IS ENTITLED TO APPOINT ONE OR MORE PROXY (IES) TO
ATTEND AND VOTE ON A POLL INSTEAD OF HIMSELF/HERSELF. A PROXY NEED NOT BE A MEMBER OF THE COMPANY.
Pursuant to provisions of section 105 of the Companies Act, 2013, a person can act as proxy on behalf of members
not exceeding fifty and holding in the aggregate not more than ten per cent of the total share capital of the company
carrying voting rights. Provided that a member holding more than ten per cent of the total share capital of the company
may appoint a single person as proxy and such person shall not act as proxy for any other person or shareholder.
The instrument appointing the proxy in order to be effective should be deposited, duly completed and signed, at the
registered office of the company NOT LESS THAN FORTY-EIGHT HOURS BEFORE THE COMMENCEMENT OF THE MEETING.
A proxy form is sent herewith. Proxies submitted on behalf of the companies, societies etc., must be supported by an
appropriate resolution/authority, as applicable.
b) In case of joint holder attending the meeting, only such joint holder who is higher in the order of names will be entitled
to vote.
c) Explanatory Statement pursuant to Section 102 of the Companies Act, 2013, in respect of the business under Item Nos.
3, 4, 5 & 6 above, are annexed hereto.
d) The Board of Directors of your Company comprised of 8 directors as on March 31, 2018 of which 4 directors viz. Mr.
Ranaveer Sinha, Mr. Dipankar Chatterji, Mr. Sabyasachi Hajara and Ms. Neera Saggi are Independent Directors who are
not liable to retire by rotation in terms of Sections 149 and 152 of the Companies Act, 2013. Mr. Rajesh Ranjan Jha is
liable to retire by rotation at this AGM and is proposed to be re-appointed as director at this AGM. Mr. Sanjay Rajoria
being Managing Director is not liable to retire by rotation, as per terms of his appointment. Mr. Vinayak Kashinath
Deshpande was appointed as an Additional Director by the Board of Directors of the Company at its meeting held on
May 29, 2018 and his candidature is proposed as Director for the approval of the shareholders at this Annual General
Meeting.
e) The relevant details of Directors seeking appointments/re-appointment under Item Nos. 2 , 3, 4 & 5 above are also
annexed.
f ) The Register of Members and Share Transfer books of the Company will remain closed from July 17, 2018 to July 20,
2018 (both days inclusive).
g) Shareholders holding shares in the physical form are requested to notify any change in their address/mandate/bank
details /e-mail address to TSR Darashaw Limited, the Registrars and Transfer Agents, to facilitate better services. Pursuant
to the relevant provisions of Section 124 of the Companies Act, 2013, the amount of dividend remaining unpaid or
unclaimed for a period of seven years from the date of its transfer to the unpaid/unclaimed dividend account of the
Company is required to be transferred to the Investors Education and Protection Fund (IEPF) set up by the Government
of India.
h) Members who have not yet en-cashed their dividend warrant for the financial year ended March 31, 2011 and onwards,
are requested to make their claims to the Registrars & Transfer Agents of the Company without any delay. Members,
who still have their holdings in physical form are requested to convert them into dematerialized form (under
ISIN No. INE391D01019).
i) Electronic copy of the Notice of the aforesaid Annual General Meeting (AGM) of the Company inter alia indicating
the process and manner of e-voting along with Attendance Slip and Proxy Form is being sent to all the Members

5
whose email IDs are registered with the Company’s Registrars and Share Transfer Agents/Depository Participants(s) for
communication purposes unless any Member has requested for a hard copy of the same. For Members who have not
registered their email IDs, physical copies of the Notice of the aforesaid AGM of the Company inter alia indicating the
process and manner of e-voting along with Attendance Slip and Proxy Form is being sent.
j) Members are requested to register their e-mail addresses with the Company / Depository Participant to enable us to
send you the Report and Accounts, Notices etc. in electronic mode, as a measure of support to the Green Initiative in
Corporate Governance of the Ministry of Corporate Affairs, Government of India.
k) In terms of Part A of Schedule VII of SEBI (Listing Obligations and Disclosure Requirements) Regulations, 2015, for
registration of transfer of securities, the transferee(s) as well as transferor(s) are required to furnish a copy of their PAN
card along with transfer documents for registration of transfer of securities.
Further for securities market transaction and/or for off- market or private transactions involving transfer of shares in
physical form, the transferee(s) as well as transferor(s) shall furnish a copy of PAN card to the Company for registration
of such transfer of securities.
All intended transferee(s) are, therefore, requested to furnish a self certified copy of their PAN Card along with the
relevant transfer deed for registration of transfer of shares. Please note that the shares lodged for transfer without self
certified copy of PAN Card of the transferee(s) shall be returned under objection.
l) Members desirous of any additional information as regards the Accounts are requested to write to the Company at an
early date so as to enable the management to keep the information ready at the meeting.
m) Members are requested to bring the admission slips along with their copies of the Annual Report to the meeting.
n) The Company has provided facility of e-voting to its members as prescribed under the Companies Act, 2013 read
with Regulation 44 of SEBI (Listing Obligations and Disclosure Requirements) Regulations, 2015. The instructions for
e-voting are annexed to this Notice.
o) The Board of Directors of your Company has appointed Mr P K Singh of M/s P K Singh & Associates, Company Secretaries
as the Scrutinizer for conducting the e- voting process in a fair and transparent manner.
p) The Register of Contracts or Arrangements in which Directors are interested, maintained under Section 189 of the
Companies Act, 2013, will be available for inspection by the members at the Annual General Meeting.
q) The Register of Directors and Key Managerial Personnel and their shareholding, maintained under Section 170 of the
Companies Act, 2013 read with Rules issued there under will be available for inspection by the members at the Annual
General Meeting.
r) Voting through electronic means
I. In compliance with the provisions of Section 108 of the Companies Act, 2013 and Rule 20 of the Companies
(Management and Administration) Rules, 2014 and Regulation 44 of SEBI (Listing Obligations and Disclosure
Requirements) Regulations, 2015, the Company is pleased to provide members facility to exercise their rights
to vote at the 55th Annual General Meeting (AGM) by electronic means and the business may be transacted
through e-Voting services provided by National Securities Depository Limited (NSDL). In order to enable the
members, who do not have the access to e-voting facility, to send their assent or dissent in writing in respect of
the resolution as set out in this Notice, the Company is enclosing a Ballot Form with the Notice. Instructions for
Ballot Form are given at the back of the said Form and instructions for e-voting are given in here below.
II. The facility for voting through ballot paper shall be made available at the AGM and the members attending the
meeting who have not cast their vote by remote e-voting shall be able to exercise their right at the meeting
through ballot paper.
III. The members who have cast their vote by remote e-voting or through Ballot Form prior to the AGM may also
attend the AGM but shall not be entitled to cast their vote again.
IV. The remote e-voting period commences on Tuesday, July 24, 2018 (9:00 am) and ends on Thursday, July 26, 2018
(5:00 pm). During this period members of the Company, holding shares either in physical form or in dematerialized
form, as on the cut-off date of July 20, 2018, may cast their vote by remote e-voting. The remote e-voting module

Fifty Fifth Annual Report 2017-18
6
shall be disabled by NSDL for voting thereafter. Once the vote on a resolution is cast by the member, the member
shall not be allowed to change it subsequently.
V. The instructions for e-voting are as under:
a) In case a shareholder receiving e-mail from NSDL or is already registered for e-voting:
The way to vote electronically on NSDL e-Voting system consists of “Two Steps” which are mentioned below:
Step 1 : Log-in to NSDL e-Voting system at https://www.evoting.nsdl.com/
Step 2 : Cast your vote electronically on NSDL e-Voting system.
Details on Step 1 is mentioned below:
To Log-into NSDL e-Voting website :
1. Visit the e-Voting website of NSDL. Open web browser by typing the following URL: https://www.
evoting.nsdl.com/ either on a Personal Computer or on a mobile.
2. Once the home page of e-Voting system is launched, click on the icon “Login” which is available under
‘Shareholders’ section.
3. A new screen will open. You will have to enter your User ID, your Password and a Verification Code as
shown on the screen.
Alternatively, if you are registered for NSDL eservices i.e. IDEAS, you can log-in at https://eservices.
nsdl.com/ with your existing IDEAS login. Once you log-in to NSDL eservices after using your log-in
credentials, click on e-Voting and you can proceed to Step 2 i.e. Cast your vote electronically.
4. Your User ID details are given below :
Manner of holding shares i.e. Demat (NSDL
or CDSL) or Physical
Your User ID is:
a) For Members who hold shares in demat
account with NSDL.
8 Character DP ID followed by 8 Digit Client ID
For example if your DP ID is IN300*** and Client ID is
12****** then your user ID is IN300***12******.
b) For Members who hold shares in demat
account with CDSL.
16 Digit Beneficiary ID
For example if your Beneficiary ID is 12**************
then your user ID is 12**************
c) For Members who hold shares in Physical
Form.
EVEN Number followed by Folio Number registered
with the company
For example if folio number is 001*** and EVEN is
101456 then user ID is 101456001***
5. Your password details are given below:
a) If you are already registered for e-Voting, then you can use your existing password to login and
cast your vote.
b) If you are using NSDL e-Voting system for the first time, you will need to retrieve the ‘initial
password’ which was communicated to you. Once you retrieve your ‘initial password’, you need to
enter the ‘initial password’ and the system will direct you to change your password.
c) How to retrieve your ‘initial password’?
(i) If your email ID is registered in your demat account or with the company, your ‘initial
password’ is communicated to you on your email ID. Trace the email sent to you from NSDL
from your mailbox. Open the email and open the attachment i.e. “TRF remote e-Voting.pdf”
file. Open the “TRF remote e-Voting.pdf” file. The password to open the .pdf file is your 8

7
digit client ID for NSDL account, last 8 digits of client ID for CDSL account or folio number for
shares held in physical form. The .pdf file contains your ‘User ID’ and your ‘initial password’.
(ii) If your email ID is not registered, your ‘initial password’ is communicated to you on your
postal address.
6. If you are unable to retrieve or have not received the “Initial password” or have forgotten your password:
a) Click on “Forgot User Details/Password?” (If you are holding shares in your demat account with
NSDL or CDSL) option available on www.evoting.nsdl.com.
b) Physical User Reset Password?” (If you are holding shares in physical mode) option available on
www.evoting.nsdl.com.
c) If you are still unable to get the password by aforesaid two options, you can send a request at
[email protected] mentioning your demat account number/folio number, your PAN, your name
and your registered address.
7. After entering your password, tick on Agree to “Terms and Conditions” by selecting on the check box.
8. Now, you will have to click on “Login” button.
9. After you click on the “Login” button, Home page of e-Voting will open.
Details on Step 2 is given below:
To cast your vote electronically on NSDL e-Voting system
1. After successful login at Step 1, you will be able to see the Home page of e-Voting. Click on e-Voting. Then,
click on Active Voting Cycles.
2. After click on Active Voting Cycles, you will be able to see all the companies “EVEN” in which you are holding
shares and whose voting cycle is in active status.
3. Select “EVEN” of company for which you wish to cast your vote.
4. Now you are ready for e-Voting as the Voting page opens.
5. Cast your vote by selecting appropriate options i.e. assent or dissent, verify/modify the number of shares for
which you wish to cast your vote and click on “Submit” and also “Confirm” when prompted.
6. Upon confirmation, the message “Vote cast successfully” will be displayed.
7. You can also take the printout of the votes cast by you by clicking on the print option on the confirmation
page.
8. Once you confirm your vote on the resolution, you will not be allowed to modify your vote.
OTHER INSTRUCTIONS:
VI. Institutional shareholders (i.e. other than individuals, HUF, NRI etc.) are required to send scanned copy (PDF/
JPG Format) of the relevant Board Resolution/ Authority letter etc. with attested specimen signature of the duly
authorized signatory(ies) who are authorized to vote, to the Scrutinizer by e-mail to pramodkumar.pcs@gmail.
com with a copy marked to [email protected].
VII. It is strongly recommended not to share your password with any other person and take utmost care to keep
your password confidential. Login to the e-voting website will be disabled upon five unsuccessful attempts to
key in the correct password. In such an event, you will need to go through the “Forgot User Details/Password?” or
“Physical User Reset Password?” option available on www.evoting.nsdl.com to reset the password.
VIII. In case of any queries, you may refer to the Frequently Asked Questions (FAQs) for Shareholders and e-voting
user manual for Shareholders available at the Downloads section of www.evoting.nsdl.com or call on toll free no.:
1800-222-990 or send a request at [email protected]
IX. If you are already registered with NSDL for e-voting then you can use your existing user ID and password/PIN for
casting your vote.

Fifty Fifth Annual Report 2017-18
8
X. You can also update your mobile number and e-mail id in the user profile details of the folio which may be used
for sending future communication(s).
XI. The voting rights of members shall be in proportion to their shares of the paid up equity share capital of the
Company as on the cut-off date of July 20, 2018.
XII. Any person, who acquires shares of the Company and become member of the Company after dispatch of the
notice and holding shares as of the cut-off date i.e. July 20, 2018, may obtain the login ID and password by sending
a request at [email protected] or Issuer/RTA.
However, if you are already registered with NSDL for remote e-voting then you can use your existing user ID and
password for casting your vote. If you forgot your password, you can reset your password by using “Forgot User
Details/Password” option available on www.evoting.nsdl.com or contact NSDL at the following toll free no.: 1800-
222-990.
XIII. A member may participate in the AGM even after exercising his/her right to vote through remote e-voting or
Ballot Form via post but shall not be allowed to vote again at the AGM.
XIV. A person, whose name is recorded in the register of members or in the register of beneficial owners maintained
by the depositories as on the cut-off date only shall be entitled to avail the facility of remote e-voting as well as
voting at the AGM through ballot paper.
XV. Mr P K Singh, Practicing Company Secretary (Membership No. FCS- 5878 & C.P. No.19115 of M/s P K Singh has been
appointed as the Scrutinizer to scrutinize the e-voting process in a fair and transparent manner.
XVI. The Chairman shall, at the AGM, at the end of discussion on the resolutions on which voting is to be held, allow
voting with the assistance of scrutinizer, by use of “Polling Paper” for all those members who are present at the
AGM but have not cast their votes by availing the remote e-voting facility or Ballot Form via Post.
XVII. The Scrutinizer shall after the conclusion of voting at the general meeting, will first count the votes cast at the
meeting and thereafter unblock the votes cast through remote e-voting in the presence of at least two witnesses
not in the employment of the Company and shall make, not later than three days of the conclusion of the AGM,
a consolidated scrutinizer’s report of the total votes cast in favour or against, if any, to the Chairman or a person
authorized by him in writing, who shall countersign the same and declare the result of the voting forthwith.
XVIII. The Results declared along with the Scrutinizer’s Report shall be placed on the Company’s website www.trf.co.in
and on the website of NSDL immediately on declaration of results by the Chairman or by the person authorized by
him in writing and shall also be immediately communicated to the Stock Exchanges where the company’s shares
are listed.
(s) All documents referred to in the accompanying Notice and the Explanatory Statement and the Annual Report of
financial year 2017-18 will be available on the Company’s Corporate website www.trf.co.in for download and also shall
be open for inspection at the Registered Office of the Company, on all working days, except Saturdays, between 9.30
am and 4.00 pm up to the date of this AGM.
By Order of the Board of Directors
Registered Office:
11, Station Road, K Sujit Mathai Mathew
Burmamines, Chief Financial Officer
Jamshedpur- 831007
Dated: May 29, 2018

9
ANNEXURE TO NOTICEExplanatory Statements pursuant to Section 102 of the Companies Act, 2013
As required under Section 102 of the Companies Act, 2013 (hereinafter referred to as ‘the Act’) the following Explanatory
Statement sets out all material facts relating to the Special Business set out from Item Nos. 3, 4, 5 & 6 of the accompanying
Notice dated May 29, 2018.
Item No. 3
Mr. Vinayak Kashinath Deshpande is presently the Managing Director of Tata Projects Limited. He is a graduate in Chemical
Engineering (1980) from IIT, Kharagpur, having over 36 years of work experience in different roles, in diverse industries;
starting with the design and sales of boilers and captive power plants at Thermax, to industrial automation and process
controls at Tata Honeywell.
At Tata Honeywell, he was the Managing Director of its India business for five years till 2004-05, wherein he grew the
company’s operations pan India, to achieve about 300% growth. Thereafter he had a successful stint as the Executive
President (Operations) of Tata Teleservices.
Mr. Deshpande took charge as Managing Director of Tata Projects in July, 2011. Since then Tata Projects has doubled its
turnover, and achieved all-round excellence in its business of Industrial Infrastructure. In 2014-15, he had been instrumental
in diversifying the company’s business in `Urban Infrastructure’ and ‘Civil & Environment sectors’, wherein the company has
won projects to build Urban Metro systems and High Rise buildings.
Today Tata Projects has an order book of about Rs. 30,000 Cr, and is poised for rapid growth. With the future in mind, the
company would be ̀ focusing on its six Business Units – EPC, Transmission & Distribution, Transportation, Civil & Environment,
Urban Infrastructure and Quality Services.
Under his mentorship, Tata Projects has been voted consecutively for the last 5 years as `India’s Most Admired’ and `Fastest
Growing Construction Company’ by `Construction World’ journal. Mr. Deshpande too was voted as the Infrastructure Person
of the Year for 2016-17.
Mr. Vinayak Kashinath Deshpande has been appointed as an Additional Director of the Company with effect from May 29,
2018 and holds office upto the ensuing AGM. The Company has received a notice under Section 160 of the Act from a
member proposing his appointment as a director at the ensuing AGM.
The Nomination and Remuneration Committee at its meeting held on May 29, 2018 recommended his appointment as a
Director of the Company liable to retire by rotation.
Considering the vast experience of Mr. Vinayak Deshpande, the Board is of the opinion that his appointment will be of
immense benefit to the Company and commends for the shareholders approval.
Mr. Vinayak Deshpande and/or his relatives may be deemed to be concerned or interested in the proposed Resolution in so
far as it relates to his own appointment.
Save and except above, none of the other directors or key managerial personnel of the Company, or their relatives are, in any
way concerned or interested, financially or otherwise, in the proposed resolution.
Your Board recommends passing of resolution under Item 3 as an Ordinary Resolution.
Item no. 4 & 5
Mr. Sanjay Rajoria is a graduate in Mining Engineering from MBM Engineering College, Jodhpur. He is also the holder of 1st
class Mine’s Managers Certificate from Director General of Mines & Safety, Dhanbad. He successfully completed two months
training programme in New South Wales, Sydney on “Mine Planning”. He also has CEDEP Management Programme from
INSEAD France to his credit. He has over 30 years of experience in Tata Steel Limited where he has held various positions.
He joined Tata Steel in 1988 as Graduate Engineer Trainee and held various positions such as Assistant Manager, Manager,
Chief and General Manager. He has led Jamadoba Group of Collieries as Chief from 2005 to 2010. He was appointed as Chief
(Mine Planning and High Wall Technology) in November 2010. From July 2011 he worked as General Manager (Operations) in
West Bokaro Open Cast Mine of Tata Steel. He again worked as General Manager (Operations) in Jharia Division (underground
mines) from 2016 to July 2017. As in charge of opencast and underground mines, he was responsible for operations of
Mines, wash plant & other Administrative & Management functions which included corporate social responsibilities and HR
practices. Prior to joining TRF he was working as General Manager, Raw Materials and Infrastructure Projects at Tata Steel.

Fifty Fifth Annual Report 2017-18
10
The Board considered and approved the recommendation of the Nomination and Remuneration Committee for appointment
of Mr. Sanjay Rajoria as the Managing Director of the Company for a period of 3 (three) years from February 1, 2018 to
January 31, 2021 subject to approval of members.
The extract of the terms and conditions of appointment and remuneration of his agreement, as approved by Nomination
and Remuneration Committee and Board is as under:
1 Term and Termination
1.1 Subject as hereinafter provided, this Agreement shall remain in force up to January 31, 2021 for a period of 3 years from
the Date of Appointment unless terminated earlier.
1.2 This Agreement may be terminated earlier, without any cause, by either Party by giving to the other Party six months’
notice of such termination or the Company paying six months’ remuneration which shall be limited to provision of
Salary, Benefits, Perquisites, Allowances and any pro-rated Incentive Remuneration (paid at the discretion of the Board),
in lieu of such notice.
2. Duties & Powers
2.1 The Managing Director shall devote his whole time and attention to the business of the Company and perform
such duties as may be entrusted to him by the Board from time to time and separately communicated to him and
exercise such powers as may be assigned to him, subject to the superintendence, control and directions of the Board
in connection with and in the best interests of the business of the Company and the business of one or more of its
associated companies and / or subsidiaries, including performing duties as assigned to the Managing Director from
time to time by serving on the boards of such associated companies and / or subsidiaries or any other executive body
or any committee of such a company.
2.2 The Managing Director shall not exceed the powers so delegated by the Board pursuant to clause 2.1 above.
2.3 The Managing Director undertakes to employ the best of his skill and ability and to make his utmost endeavours to
promote the interests and welfare of the Company and to conform to and comply with the policies and regulations of
the Company and all such orders and directions as may be given to him from time to time by the Board.
2.4 Mr. Sanjay Rajoria shall undertake his duties from such location as may be directed by the Board.
3. Remuneration
3.1 So long as the Managing Director performs his duties and conforms to the terms and conditions contained in this
Agreement, he shall, subject to such approvals as may be required, be entitled to the following remuneration subject
to deduction at source of all applicable taxes in accordance with the laws for the time being in force.
a. Salary: Rs 2,71,160 per month in the salary scale of Rs. 2,00,000 to Rs 4,50,000 per month. The annual increments
which will be effective 1st April each year, will be decided by the Board and will be merit-based and take into
account the Company’s performance as well.
b. Benefits, Perquisites, Allowances:
In addition to the basic salary referred to in (a) above, the Managing Director shall be entitled to:
A. *Rent-free residential accommodation (furnished or otherwise) the Company bearing the cost of repairs,
maintenance, society charges and utilities (e.g. gas, electricity and water charges) for the said accommodation.
OR
* House Rent, House Maintenance and Utility Allowances aggregating 85% of the basic salary.
(in case residential accommodation is not provided by the Company)
B. Hospitalisation, Transport, Telecommunication and other facilities:
(i) Hospitalisation and major medical expenses for self, spouse and dependent (minor) children and
dependent parents;
(ii) Car, with driver provided, maintained by the Company for official and personal use.
If car is not provided then he shall be entitled to car compensation allowance of Rs 46,000/- per month.
(iii) Telecommunication facilities including broadband, internet and fax.
(iv) Housing Loan as per the Rules of the Company.

11
C. Other perquisites and allowances given below subject to a maximum of 55% of the annual salary;
The categories of perquisites / allowances to be included within the 55% limit shall be -
a) Allowances for Helper/ Education of Children/
Other Allowances 33.34%
b) Leave Travel Concession/Allowance 8.33%
c) Medical allowance 8.33%
50.00%
d) Personal Accident Insurance) @ actuals subject
e) Club Membership fees ) to a cap of … 5.00%
55.00%
D. Contribution to Provident Fund, Superannuation Fund or Annuity Fund and Gratuity Fund as per the Rules
of the Company.
E. The Managing Director shall be entitled to leave in accordance with the Rules of the Company. Privilege
Leave earned but not availed by the Managing Director is encashable in accordance with the Rules of the
Company.
c. Performance Bonus/Commission: The Managing Director shall be entitled to annual performance linked bonus
and/or Commission, not exceeding 200 % of the annual salary, based on certain performance criteria and such
other parameters laid down by the Board/ Committees thereof. These amounts (if any) will be paid after the
Annual Accounts have been approved by the Board and adopted by the Shareholders.
3.2 Minimum Remuneration: In the event of absence or inadequacy of profits of the Company in any financial year during
the period of the Managing Director’s appointment, the Company shall pay to the Managing Director remuneration by
way of salary, benefits, perquisites and allowances, performance linked bonus/commission, as specified above, subject
to provisions of the Act and Schedule V of the Act.
3.3 The Managing Director shall not, so long as he functions as the Managing Director of the Company entitled to receive
any fee for attending any meetings of the Board or any Committee thereof.
3.4 The entire remuneration package of the Managing Director shall, however be subject to the overall ceiling laid down
under Section 196 and 197 of the Act and conditions of Schedule V of the Act.
3.5 The Managing Director may be entitled to Long Term Incentive Plan (LTIP) as per the Tata Steel Group Company’s norms,
subject to the approval and discretion of the Board of Directors of the Company. This would be applicable in lieu of the
Special Retirement Benefits for MD/ED as per the Tata Group norms.
4. Variation
The terms and conditions of the appointment of the Managing Director and / or this Agreement may be altered and
varied from time to time by the Board as it may, in its discretion deem fit, irrespective of the limits stipulated under
Schedule V to the Act or any amendments made hereafter in this regard in such manner as may be agreed to between
the Board and the Managing Director, subject to such approvals as may be required.
5. Intellectual Property
5.1 The Parties acknowledge that the Managing Director may make, discover or create Intellectual Property (IP) in the
course of his employment and agree that in this respect the Managing Director has a special obligation to protect such
IP and use it to further the interests of the Company, or any of its associated companies or subsidiaries.
5.2 Subject to the provisions of the laws relating to intellectual property for the time being in force in India, if at any time
during his employment, the Managing Director makes or discovers or participates in the making or discovery of any
IP relating to or capable of being used in the business for the time being carried on by the Company or any of its
subsidiaries or associated companies, full details of the Intellectual Property shall immediately be communicated by
him to the Company and such IP shall be the absolute property of the Company. At the request and expense of the
Company, the Managing Director shall give and supply all such information, data, drawings and assistance as may
be required to enable the Company to exploit the IP to its best advantage and the Managing Director shall execute

Fifty Fifth Annual Report 2017-18
12
all documents and do all things which may be necessary or desirable for obtaining patent or other protection for the
Intellectual Property in such parts of the world as may be specified by the Company and for vesting the same in the
Company or as it may direct.
5.3 The Managing Director hereby irrevocably appoints the Company as his attorney in his name and on his behalf to
sign or execute any such instrument or do any such thing and generally to use his name for the purpose of giving to
the Company or its nominee the full advantage of the provisions of this clause 6 and if in favour of any third Party, a
certificate in writing signed by any director or the secretary of the Company that any instrument or act falls within the
authority conferred by this clause shall be conclusive evidence that such is the case.
5.4 If the IP is not the property of the Company, the Company shall, subject to the provisions of the applicable laws for the
time being in force, have the right to acquire for itself or its nominee, the Managing Director’s rights in the IP within 3
months after disclosure pursuant to clause 5.2 above on fair and reasonable terms.
5.5 The rights and obligations under this clause shall continue in force after termination of the Agreement in respect of
IP relating to the period of the Managing Director’s employment under the Agreement and shall be binding upon his
heirs and legal representatives.
6. Confidentiality
6.1 The Managing Director is aware that in the course of his employment he will have access to and be entrusted with
information in respect of the business and finances of the Company including intellectual property, processes and
product specifications, etc. and relating to its dealings, transactions and affairs and likewise in relation to its subsidiaries,
associated companies, customers or clients all of which information is or may be of a confidential nature.
6.2 The Managing Director shall not except in the proper course of performance of his duties during or at any time after the
period of his employment or as may be required by law divulge to any person whatever or otherwise make use of and
shall use his best endeavors to prevent the publication or disclosure of any confidential information of the Company or
any of its subsidiaries or associated companies or any of its or their suppliers, agents, distributors or customers.
6.3 All notes, memoranda, documents and confidential information concerning the business of the Company and its
subsidiaries or associated companies or any of its or their suppliers, agents, distributors or customers which shall be
acquired, received or made by the Managing Director during the course of his employment shall be the property of the
Company and shall be surrendered by the Managing Director to the Company upon the termination of his employment
or at the request of the Board at any time during the course of his employment.
7. Non-competition
The Managing Director covenants with the Company that he will not, during the continuance of his employment with
the Company, without the prior written consent of the Board, carry on or be engaged, directly or indirectly, either on his
own behalf or on behalf of any person, or as manager, agent, consultant or employee of any person, firm or company,
in any activity or business, in India or overseas, which shall directly or indirectly be in competition with the business of
the Company or its holding company or its subsidiaries or associated companies. The application of this clause needs
to be read in conjunction with the relevant clauses in the Tata Code of Conduct, referred to in Clause 10 below.
8. Selling Agency
The Managing Director, so long as he functions as such, undertakes not to become interested or otherwise concerned,
directly or through his spouse and / or children, in any selling agency of the Company.
9. Tata Code of Conduct
The provisions of the Tata Code of Conduct shall be deemed to have been incorporated into this Agreement by
reference. The Managing Director shall during his term, abide by the provisions of the Tata Code of Conduct in spirit
and in letter and commit to assure its implementation.
10. Personnel Policies
All Personnel Policies of the Company and the related Rules which are applicable to other employees of the Company
shall also be applicable to the Managing Director, unless specifically provided otherwise.
11. Summary termination of employment
The employment of the Managing Director may be terminated by the Company without notice or payment in lieu of
notice:

13
a. If the Managing Director is found guilty of any gross negligence, default or misconduct in connection with or
affecting the business of the Company or any subsidiary or associated company to which he is required by the
Agreement to render services; or in the event of any serious or repeated or continuing breach (after prior warning)
or non-observance by the Managing Director of any of the stipulations contained in the Agreement; or in the
event the Board expresses its loss of confidence in the Managing Director.
12. Termination due to physical / mental incapacity
In the event the Managing Director is not in a position to discharge his official duties due to any physical or mental
incapacity, the Board shall be entitled to terminate his contract on such terms as the Board may consider appropriate
in the circumstances.
13. Resignation from directorships
Upon the termination by whatever means of his employment under the Agreement:
The Managing Director shall immediately cease to hold offices held by him in any holding company, subsidiaries or
associate companies without claim for compensation for loss of office by virtue of Section 167 (1)(h) of the Act and shall
resign as trustee of any trusts connected with the Company.
The Managing Director shall not without the consent of the Board at any time thereafter represent himself as connected
with the Company or any of its subsidiaries and associated companies.
14. Agreement co-terminus with employment / directorship
If and when this Agreement expires or is terminated for any reason whatsoever, Mr Sanjay Rajoria will cease to be the
Managing Director and also cease to be a Director of the Company. If at any time, the Managing Director ceases to be
a Director of the Company for any reason whatsoever, he shall cease to be the Managing Director and this Agreement
shall forthwith terminate. If at any time, the Managing Director ceases to be in the employment of the Company for any
reason whatsoever, he shall cease to be a Director and Managing Director of the Company.
15. Other Directorships
The Managing Director covenants with the Company that he will not during the continuance of his employment with
the Company accept any other directorships in any company or body corporate without the prior written consent of
the Board.
In accordance with the provisions of Sections 196, 197, 203, and Schedule V and other applicable provisions, if any,
of the Companies Act, 2013, read with applicable rules, and other applicable laws, as amended up-to-date, the terms
of appointment of Mr. Sanjay Rajoria as the Managing Director are placed before the Members in the Annual General
Meeting for their approval. In the event the Company has no profits or inadequate profits in a financial year, approval
of the shareholders is sought by way of Special Resolution for payment of remuneration to Mr. Sanjay Rajoria, as the
Managing Director, as laid down in Section II of Part II of Schedule V of the Companies Act, 2013. This will be valid for
the aforesaid period of his appointment.
The draft agreement to be entered into with Mr. Sanjay Rajoria is available for inspection by Members of the Company
at its Registered Office between 11.00 AM to 1.00 PM on any working day, except on Saturdays.
None of the other Directors or Key Managerial Personnel of the Company, or their relatives is, in any way, concerned or
interested, financially or otherwise, in the proposed resolution.
Your Board recommends passing of the resolution under item 4 & 5 as an ordinary resolution and special resolution,
respectively.
Item No.6
The Board on the recommendation of Audit Committee, has approved the re-appointment of M/s. Shome & Banerjee,
the Cost Auditors, to conduct the audit of cost records of the Company for the financial year 2018-19 at a consolidated
remuneration of Rs.3,50,000/- (Plus GST as applicable ) and they shall also be entitled to re-imbursement of out of pocket
expenses as may be incurred by them, if any, during the course of their assignment.
Pursuant to the provisions of Section 148 of the Companies Act, 2013 and the rules made there under (including any statutory
modification(s) or re-enactment thereof for the time being in force), read with such other provisions under applicable law,
the remuneration payable to the Cost Auditors would require subsequent ratification from the members of the Company.
Fifty Fifth Annual Report 2017-18
14
None of the Directors or Key Managerial Personnel of the Company, or their relatives is, in any way, concerned or interested,
financially or otherwise, in the proposed resolution.
Your Board recommends passing of the resolution under Item no. 6 of the notice as an Ordinary Resolution.
By Order of the Board of Directors
Registered Office:
11, Station Road, K Sujit Mathai Mathew
Burma Mines, Chief Financial Officer
Jamshedpur – 831 007.
Dated: May 29, 2018
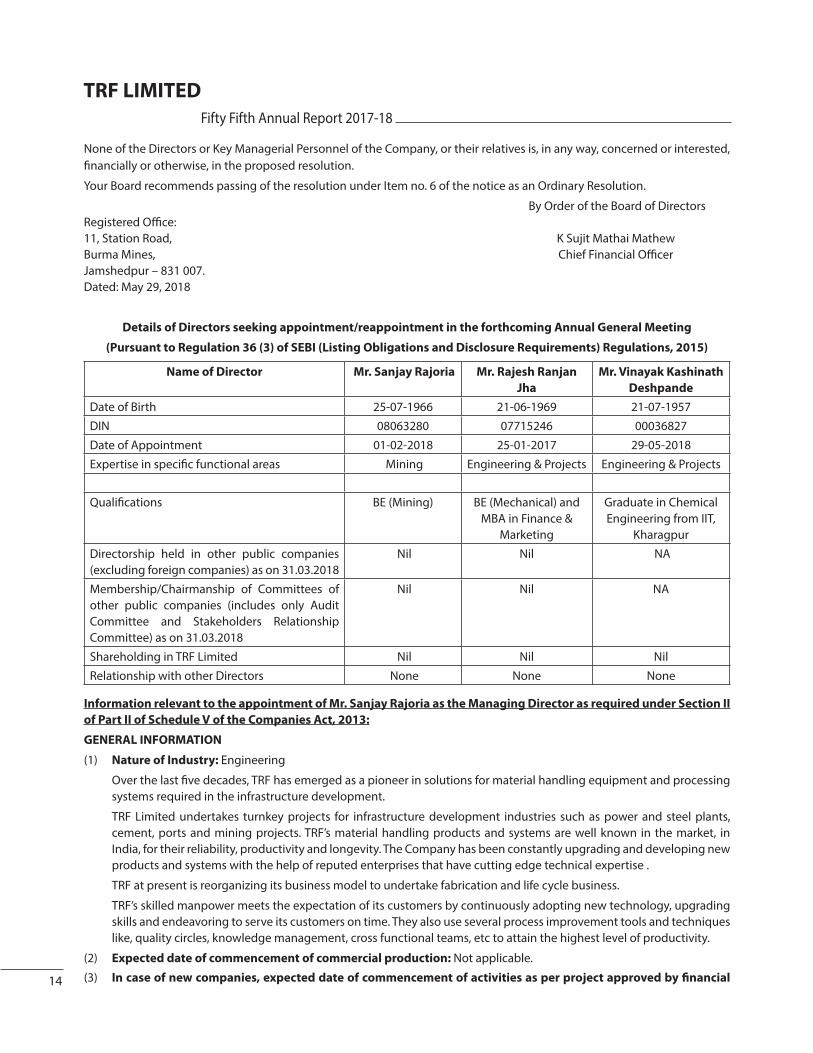
Details of Directors seeking appointment/reappointment in the forthcoming Annual General Meeting
(Pursuant to Regulation 36 (3) of SEBI (Listing Obligations and Disclosure Requirements) Regulations, 2015)
Name of Director Mr. Sanjay Rajoria Mr. Rajesh Ranjan
Jha
Mr. Vinayak Kashinath
Deshpande
Date of Birth 25-07-1966 21-06-1969 21-07-1957
DIN 08063280 07715246 00036827
Date of Appointment 01-02-2018 25-01-2017 29-05-2018
Expertise in specific functional areas Mining Engineering & Projects Engineering & Projects
Qualifications BE (Mining) BE (Mechanical) and
MBA in Finance &
Marketing
Graduate in Chemical
Engineering from IIT,
Kharagpur
Directorship held in other public companies
(excluding foreign companies) as on 31.03.2018
Nil Nil NA
Membership/Chairmanship of Committees of
other public companies (includes only Audit
Committee and Stakeholders Relationship
Committee) as on 31.03.2018
Nil Nil NA
Shareholding in TRF Limited Nil Nil Nil
Relationship with other Directors None None None
Information relevant to the appointment of Mr. Sanjay Rajoria as the Managing Director as required under Section II
of Part II of Schedule V of the Companies Act, 2013:
GENERAL INFORMATION
(1) Nature of Industry: Engineering
Over the last five decades, TRF has emerged as a pioneer in solutions for material handling equipment and processing
systems required in the infrastructure development.
TRF Limited undertakes turnkey projects for infrastructure development industries such as power and steel plants,
cement, ports and mining projects. TRF’s material handling products and systems are well known in the market, in
India, for their reliability, productivity and longevity. The Company has been constantly upgrading and developing new
products and systems with the help of reputed enterprises that have cutting edge technical expertise .
TRF at present is reorganizing its business model to undertake fabrication and life cycle business.
TRF’s skilled manpower meets the expectation of its customers by continuously adopting new technology, upgrading
skills and endeavoring to serve its customers on time. They also use several process improvement tools and techniques
like, quality circles, knowledge management, cross functional teams, etc to attain the highest level of productivity.
(2) Expected date of commencement of commercial production: Not applicable.
(3) In case of new companies, expected date of commencement of activities as per project approved by financial

15
institutions appearing in the prospectus:
Not applicable.
(4) Financial performance during last three years: (Rs. in lakhs)
Financial Parameters 2015-16 2016-17 2017-18
Turnover (Sales) 54,321.59 50,583.46 35,153.15
Net Profit/(Loss) before Tax (467.36) (4,933.70) (16,555.80)
Net Profit/(Loss) after Tax as per Statement of Profit and Loss (467.36) (2,691.10) (14,597.65)
Amount of dividend Nil Nil Nil
Rate of dividend declared (%) Nil Nil Nil
(5) Export performance and net foreign exchange earnings: (Rs. in lakhs)
2015-16 2016-17 2017-18
Foreign exchange earnings including deemed export 21,081.06 18,338.05 4,445.36
Foreign exchange expenditure outgoings equivalent 442.46 332.92 421.50
(6) Foreign investments or collaborations, if any:
Litton Systems Inc., U.S.A. hold 1.98% of the equity capital of the Company.
II. INFORMATION ABOUT THE APPOINTEES:
A) Background Details
1(a) Educational Qualification : Mr. Sanjay Rajoria is a graduate in Mining from the MBM Engineering College,
Jodhpur. He is also the holder of 1st class Mine’s Managers Certificate from the Director General of Mines &
Safety, Dhanbad. He successfully completed two months training programme in New South Wales, Sydney
on “Mine Planning”.
1(b) Experience :
He has over 30 years of experience in Tata Steel Limited in various positions.
2. Past remuneration (including contribution to PF, Superannuation fund, gratuity fund & Commission) for last 3 years:
The remuneration paid to Mr Sanjay Rajoria by his previous organisation is as under:
Financial year Remuneration (Rs in lakhs)
2017-18 117.38
2016-17 102.99
2015-16 80.58
3. Recognition and awards: Mr Rajoria is the holder of 1st class Mine’s Managers Certificate from the Director
General of Mines & Safety, Dhanbad. He successfully completed two months training programme in New South
Wales, Sydney on “Mine Planning”. He also has CEDEP Management Programme from INSEAD France to his credit.
4. Job profile and his suitability:
(a) Job Profile
Managing Director reporting to the Board.
TRF is engaged in -
(i) Design, engineering, procurement, supply, civil and structural works, electrical and instrumentation
systems, fabrication, erection and testing of bulk material handling equipment and systems;
(ii) Design, supply, installation and commissioning of Port & Yard equipment and services;
(iii) Project/Construction Management on EPC basis for setting up material handling plants;
His responsibilities include-
(i) Sustainable operations of the Company through efficient and optimum utilisation of Company’s
resource viz., man, material and money. Growth of the various divisions.
(ii) Entering into strategic tie-ups and alliances for advancement of the business of the Company.

Fifty Fifth Annual Report 2017-18
16
(iii) Development of new businesses.
(iv) Employee satisfaction.
(v) Customer satisfaction.
(vi) Enhancing shareholder value.
(b) Suitability
He joined Tata Steel in 1988 as Graduate Trainee and held various positions such as Assistant Manager, Manager,
Chief and General Manager. He has led Jamadoba Group of Collieries as Chief from 2005 to 2010. He was
appointed as Chief (Mine Planning and High Wall Technology) in November 2010. From July 2011 he worked
as General Manager (Operations) in West Bokaro Open Cast Mine of Tata Steel. He again worked as General
Manager (Operations) in Jharia Division (underground mines) from 2016 to July 2017. As in charge of opencast
and underground mines, he was responsible for operations of Mines, wash plant & other Administrative &
Management functions which included corporate social responsibilities and HR practices. Prior to joining TRF he
was working as General Manager, Raw Materials and Infrastructure Projects at Tata Steel.
In view of Mr Rajoria’s vast experience in various operations of Tata Steel and the high esteem in which he held in
the corporate circle for his business acumen and leadership qualities, the Board considers Mr Rajoria as the most
suitable professional for shouldering the responsibility of the Managing Director of the Company.
5. Remuneration proposed:
Salary Rs 2,71,160 per month in the salary scale of Rs. 2,00,000 to Rs 4,50,000
per month
Perquisites & Allowances Not exceeding 140% of the annual salary
Performance Bonus/Commission Not exceeding 200 % of the annual salary, based on certain performance
criteria and such other parameters laid down by the Board/ Committees
thereof.
Minimum Remuneration only in
case of absence or inadequacy of
profits during any financial year
To be paid by way of salary, performance linked remuneration, perquisites
& allowances, subject to the limits specified in Part II in Section II to
Schedule V of the Companies Act, 2013.
6. Comparative Remuneration Profile with respect to industry, size of the Company, profile of the position and
person :
The remuneration proposed is commensurate with respect to the industry, size of the Company & profile of the
person.
7. Pecuniary relationship directly or indirectly with the Company, or relationship with the managerial person, if any:
Apart from receiving remuneration as Managing Director, Mr Sanjay Rajoria has no other pecuniary relationship
directly/indirectly with the Company. Mr Sanjay Rajoria is not having any interest in the capital of the Company,
directly or indirectly or through any statutory structure. He is also not having any direct or indirect interest or
related to the directors or promoters of the Company.
III. OTHER INFORMATION:
(1) Inadequate profits:
The Company is seeking the permission of the shareholders for making payment to the appointee’s remuneration in
any of the three years of his appointment/re- appointment, as laid down in Part II in Section II to Schedule V of the
Companies Act, 2013, only in the event the Company has no profit or inadequate profits in any such financial year.
(2) Steps taken or proposed to be taken for improvement:
a) Efforts to get more orders for projects and equipment supply
b) Improvement in productivity and optimum utilisation of resources of the Company.
c) Turnaround of the company.
(3) Expected increase in productivity and profits in measurable terms:
The Company, by adoption of measures as aforesaid, expects higher turnover in future years with associated
increase in profits and productivity.

17
HighlightsRupees in lakhs
2017-18
Consolidated
2016-17
Consolidated
2015-16
Consolidated
2014-15
Consolidated
2013-14
Consolidated
Sales & Service (Net ) 44,177.58 60,250.00 101,304.72 112,591.52 117,453.39
Other Income 488.57 712.13 759.16 627.27 1,443.58
Exceptional Item - 418.67 -34.05 2,777.11 2,972.50
Employee Cost 6,848.19 6,140.45 11,097.59 11,596.00 10,889.36
Depreciation 499.46 552.97 964.98 1,374.65 1,233.98
Finance Cost 4,894.5 4,775.79 5,651.13 5,804.09 5,886.38
Profit & (Loss) before exceptional
items & taxes
(18,497.89) (7,993.78) (3,853.75) (8,222.76) (5,644.35)
Provision for taxes ( net) / write back (1,802.62) (2,111.95) (206.56) - 149.01
Profit & (Loss) after taxes from
continuing operation(16,695.27) (5,463.16) - - -
Profit & (Loss) after taxes from
discontinued operation3,283.92 3,053.02 (4,094.36) (6,304.75) (2,820.86)
Profit & (Loss) after taxes for the year (13,411.35) (2,410.14) - - -
Dividend (%) - - - - -
Works Production 17,671.11 26,793.22 27,627.11 27,901.81 26,450.34
Progress Billing 25,762.86 38,010.87 40,946.41 50,270.37 50,522.96
As on
31.03.2018
As on
31.03.2017
As on
31.03.2016
As on
31.03.2015
As on
31.03.2014
Net Fixed Assets 19,445.56 20,981.00 22,641.48 9,995.16 10,973.75
Share Capital 1,100.44 1,100.44 1,100.44 1,100.44 1,100.44
Reserves & Surplus (21,182.79) (9,237.54) (5,972.62) (2,719.71) 4,546.78
Net Worth (20,082.35) (8,137.10) (4,872.18) (1,619.27) 5,647.31
Borrowings 33,028.25 47,869.20 55,733.65 54,248.27 59,907.76
Net worth per share ( Rs.) (182.49) (73.94) (44.27) (14.71) 53.14
Debt Equity Ratio (1.64:1) (5.88:1) (11.44:1) (37.16:1) 10.61:1
No of Employees 1,060 1,376 1,340 1,319 1,390

Fifty Fifth Annual Report 2017-18
18
DIRECTORS’ REPORT
To the Members
The Directors present the 55th Annual Report and Annual Accounts on the business and operations of your company along
with summary of standalone and consolidated financial statements for the year ended 31st March, 2018.
A. Financial Results
Figures in Rupees Lakhs
TRF Standalone TRF Group
FY’18 FY’17 FY’18 FY’17
Revenue from operations 35,395.12 51,978.69 44,177.58 60,250.00
Other income 535.73 996.15 488.57 712.13
Total income from operations 35,930.85 52,974.84 44,666.15 60,962.13
Total expenses excluding finance costs & Depreciation 50,148.74 52,929.39 58,513.24 63,710.98
Profit / (loss) from operations before finance costs,
depreciation and exceptional items
(14,217.89) 45.45 (13,847.09) (2,748.85)
Finance Cost 4,674.16 4,561.54 4,894.50 4,775.79
Depreciation 366.75 417.61 499.46 552.97
Profit/ (loss) before share of profit/(loss) of joint
ventures, exceptional item and tax
(19,258.80) (4,933.70) (19,241.05) (8,077.61)
Share of profit/(loss) from joint ventures - - 743.16 83.83
Profit / (loss) before exceptional items and tax (19,258.80) (4,933.70) (18,497.89) (7,993.78)
Exceptional items 2,703.00 - - 418.67
Profit / (loss) before tax (16,555.80) (4,933.70) (18,497.89) (7,575.11)
Tax expense (1,958.15) (2,242.60) (1,802.62) (2,111.95)
Net profit / (loss) after tax from continuing operation (14,597.65) (2,691.10) (16,695.27) (5,463.16)
Profit/(loss) after tax from discontinued operation - - 3283.92 3,053.02
Profit/(loss) after tax for the year (14,597.65) (2,691.10) (13,411.35) (2,410.14)
Other Comprehensive Income 0.07 (230.79) 1,446.00 (1,116.45)
Total Comprehensive Income (14,597.58) (2,921.89) (11,965.35) (3,526.59)
Transfer of Reserves : In view of losses, there is no transfer from profit and loss account to general reserve.
Dividend : No dividend has been recommended by the Directors for the financial year under review.
Management Discussion And Analysis
The Management Discussion and Analysis as required by the Securities and Exchange Board of India (Listing Obligations
and Disclosure Requirements) Regulations, 2015 (Listing Regulations) is incorporated herein by reference and forms an
integral part of this report (Annexure 1).
B. Economic Outlook
The global economy is experiencing recovery, reflecting a rebound in investment, manufacturing activity and trade.
The upswing in global investment and trade continued in the second half of 2017. At 3.8%, global growth in 2017 was
the fastest since 2011. With favorable market sentiment and accommodative financial conditions, global growth is
expected to grow at a rate of 3.9% in both 2018 and 2019.
The Indian economy in H1 FY’18 decelerated due to the effects of demonetization, GST implementation, NPA overhang
of Banks and impact on agricultural income. However H2 FY’18 has witnessed robust signs of revival- economic growth

19
improved as the temporary shocks due to demonetization and GST implementation began to fade and the synchronous
global recovery helped boost exports. Central Statistics office (CSO) has estimated India’s growth projection at 6.6% in
FY’18 lower than 7.1% in FY’17.
As a result of a host of measures taken by the government to improve business climate, India jumped 30 spots on the
World Bank’s Ease of Doing Business rankings.
C. Operation & Performance
TRF
While the broader economy witnessed improvement, infrastructure growth remained sluggish. During the year some
of the major over-leveraged companies in the infrastructure, power generation and steel sector were referred to
National Company Law Tribunal (NCLT) under Insolvency and Bankruptcy Code (IBC). Some of them were customers of
the Company. As a result the business was adversely affected.
The emphasis inter-alia during the year was to complete the existing projects. To have a greater focus on project
performance and completion, an Executive Committee of the Board was formed to review and monitor the project
status. The said committee met regularly during the year. It is expected that three major projects which are in advanced
stage of completion will be completed during the year. Other projects which have been completed, the focus will be to
accomplish their financial closure and collect retention money.
The company has also restructured its business divisions to improve synergies and to take-up new business avenues
of fabrication and Life Cycle Services. Life cycle business envisages Operation & Maintenance, Spares and Services,
refurbishment, and segment servicing. During the year, Life Cycle Services achieved order load of over Rs 100 crore.
The Company is also exploring opportunity to further its business with Tata Steel, for which approval of shareholders
has been obtained by way of postal ballot. Opportunities are being explored in the areas of Design, Engineering
and Supervision, Fabrication, Construction and Life Cycle services. The above measures will assist in improving the
performance of the Company.
During the year the Company received orders for the highest number of Wagon Tipplers and Side Arm Chargers – (six
sets) achieved so far in a financial year. The company successfully manufactured and delivered Load Haul Dumpers and
Travelling Plough Feeders.
Going forward, the Focus will be on furthering order book from Tata Steel. The focus for non Tata Steel business will be
to complete Performance Guarantee test of projects which are in an advanced stage of completion, reduce debtors and
cost.
Operations and Performance of Subsidiary Companies
York Group
YORK Group of companies manufactures trailer axles, assembles trailer suspension kits and distributes a full range
of truck / trailer components. York has manufacturing facilities in India and China, assembly units in Singapore and
Australia and sales and service offices in other places of the world.
Major performance highlights for FY 17-18 of York Group are as under:
Introduced 6 new products this year including New Light weight Air suspensions, Fabricated Mechanical
suspensions, Agricultural un-braked axles.
AIS 113 approvals were taken for more than 30 trailers in India. Market share also increased from 30% to 36% in
India
Axle production increased both in India and China to maximise per shift capacities.
Undertook development of a number of new suppliers in China and India, especially for Casting products, to cope
with shortage in supplies. New suppliers were developed for Air suspensions in Turkey to reduce costs.
FY 17-18 has been the best ever performance in the history of York. The turnover for York Group in FY’17-18 was
Rs 56734.83 lakhs (Incl. excise), compared to Rs 41486.39 lakhs (Incl. excise) in FY’ 16-17. The consolidated Profit
Before Tax for FY 17-18 was Rs 2102.93 lakhs compared to Rs 234.64 lakhs in FY’ 16-17.

Fifty Fifth Annual Report 2017-18
20
As a part of restructuring of subsidiaries, the approval of shareholders has been obtained by way of postal ballot for
divestment of the entire stake held by the Company’s wholly-owned subsidiaries TRF Singapore Pte Ltd (hereinafter
referred as ‘TRFS’) & TRF Holdings Pte Ltd (hereinafter referred as ‘TRFH’) in York Transport Equipment (Asia) Pte Ltd
(hereinafter referred as “York”), (York is a step down wholly owned subsidiary of the Company) to SAF-Holland GMBH
on a cash free, debt free basis at an enterprise value of USD 40 million (subject to working capital adjustment) based
on the binding offer received from the buyer SAF-Holland GMBH and Sale and Purchase Agreement entered with the
buyer. Of the proceeds received from divestment, an amount of US$ 21.4 million has been used to satisfy the loan taken
at the time of acquisition of 49% stake in York. The said Loan was novated to York as such the said amount of US$ 21.4
million has been repaid to York.
Dutch Lanka Trailer Manufacturers Ltd (DLT)
DLT based in Sri Lanka, manufactures and exports Ports and Road trailers globally.
The turnover of DLT Group in FY’17-18 was Rs 5321.09 (Incl excise) lakh compared to Rs 5501.05 lakh during previous
year. The consolidated Profit Before Tax of DLT Group for FY’17-18 was Rs 818.99 lakh compared to a Profit of Rs
482.93 lakh in FY’16-17. The improved performance of the Company was on account of increase in profitability of Tata
International DLT in FY 2017-18.
Major performance highlights for FY 17-18 of DLT Group are as under:
Developed stainless steel tanker, 70t terminal trailer with fabricated main beam and 50t customized low bed
trailers.
Achieved higher customer satisfaction with the introduction of spares package along with bulk trailer purchases
to leading terminal operators.
Tata International DLT Pvt Ltd (Tata DLT):
The turnover of the Tata International DLT, the joint venture company of DLT, for FY’17-18 was Rs. 35567.94 (Incl. excise)
lakh against Rs.19155.31 (Incl. excise) lakh in previous year. The Profit Before Tax for FY’17-18 was Rs 2206.82 lakh
compared to a Profit of Rs 326.38 lakh in FY’16-17. The improved performance of Tata International DLT was on account
of growth in turnover by 85.68 % in FY’17-18 and growth in profitability by an overwhelming 576.15%.
The increase in sale was due to growth in prime mover segment and capacity expansion at Nigoji Plant in Q4 ’16-17.
Major performance highlights for FY 17-18 of TATA DLT are as under:
The Fully Built Commercial vehicle (FBV) sales to Tata Motors increased by about 25% during the year under
review
Further the company also commenced FBV business with Ashok Leyland.
Hewitt Robins International Ltd (HRIL)
HRIL, which is engaged in the business of bulk material handling, has one of the widest ranges of vibrating screens,
feeders, crushers, mobile crushing plants, screens etc. The Company has manufacturing facilities in the U.K and caters
to the demand primarily in European markets.
The turnover of HRIL in FY’17-18 was Rs 3459.53 lakh compared to Rs 2772.35 lakh during the previous year. The Profit
before Tax of HRIL for FY’17-18 was Rs 688.94 lakh compared to a Profit of Rs 452.85 lakh in FY’16-17.
Major performance highlights for FY 17-18 of HRIL are as under:
Achieved £274,000 of orders from Tarmac Buxton
Revenue from equipment sales exceeded target by 14% and from spares & service by 25%. Achieved reduction of
warranty costs by 30%
New test facility enabled product development
Successfully manufactured Flip Flow Screen Girder
Adithya Automotive Applications (AAA)
AAA having its manufacturing facility in Lucknow manufactures tippers and related products for Tata Motors and other
Original Equipment Manufacturers (OEMs).

21
During the year under review as a part of restructuring of subsidiaries the Company divested the entire stake in AAA to
the JV partner at a consideration of Rs 30.60 crore.
In terms of the fourth proviso to sub section 1 of section 136 of the Companies Act 2013, the separate audited accounts
of each of the subsidiaries are available on the website of the Company at www.trf.co.in. Any shareholder who wants a
copy of the audited financial statement of the Company’s subsidiaries can request for the same. Shareholders can send
an email at [email protected] or write a letter to the Company Secretary of the Company addressed to the registered
office. The details of all subsidiaries and joint ventures are given in Annexure 2. There has been no new addition of
subsidiaries/Joint Ventures during the year under review. The Company has in terms of Listing Regulations adopted a
Policy for determining material subsidiaries. The said policy is available on the website of the Company at www.trf.co.in
D. CSR and Affirmative Action (CSR & AA)
TRF ladies association under guidance of the Company officials has undertaken various CSR initiatives in the areas of
education, literacy, health, employability, environment protection and climate change. The Company encourages its
employees to voluntarily participate in various welfare activities.
In view of losses incurred since FY’12-13 the provisions of Section 135(5) of the Companies Act, 2013 which mandates
to spend at least 2% of the average net profit of last three years towards CSR are not applicable to the Company.
E. Human Resource and Industrial Relations
Human resource development, retention and engagement continue to be a focus area. The company conducted
technical competency assessment of workers and officers during the year. Further behavioral review was done through
‘Thomas Profiling’. Based on the outcomes of the assessment done reduction and rationalization of manpower was
undertaken. Further organization structure was revamped to meet the new business opportunities and challenges.
F. Corporate Governance
Pursuant to Regulation 27 of SEBI (Listing Obligations and Disclosure Requirements Regulations), 2015 executed with
the Stock Exchanges, a Management Discussion and Analysis, Corporate Governance Report, Managing Director’s
declaration regarding compliance to code of conduct and Auditors’ Certificate regarding compliance to conditions of
Corporate Governance are made a part of the Annual Report.
Board Meetings
The Board met 8 times during the year. The details are given in the Corporate Governance report that forms a part of
the Annual Report.
Selection of New Directors and Board membership criteria
The Nomination and Remuneration Committee works with the Board to determine the appropriate characteristics skills
and experts for the Board as a whole and its individual members with the objective of having a Board with diverse
background and expertise. Characteristics expected of all directors include independence, integrity, high personal and
professional ethics, sound business judgment and ability to participate effectively in deliberations. The policy has been
given in this report as Annexure-3
Director induction / familiarization
All individual directors inducted into the Board are given an orientation. Presentations are made by the Managing
Director and senior management and also visit to the factory is organized. The policy on the company’s familiarization
programme is posted on the Company’s website www.trf.co.in.
Evaluation
The evaluation of the Board, Board Committees and directors were carried out in accordance with the provisions of
Companies Act, 2013, SEBI LODR and Guidance note issued by SEBI vide circular no SEBI/CFD/CMD/CIR/2017/004
dated January 4, 2017. Questionnaire forms were circulated to all the directors for their feedback on Board, Board
Committee and director evaluation. A meeting of the independent directors was held on March 26, 2018 where they
reviewed and discussed the feedback on the functioning of the Board, Board Committees, Chairman, other directors,
guidance provided by directors to the management outside the meetings and the quality, quantity and timeliness
of flow of information between the Company and the Board. The Nomination and Remuneration Committee (NRC)

Fifty Fifth Annual Report 2017-18
22
at its meeting held on March 26, 2018 also reviewed the feedback on the evaluation of the functioning of the Board,
Board Committees, Chairman and other directors. The Board reviewed and discussed the feedback of the meeting. The
Chairman of the Board had one–on-one meeting with the independent directors and Chairman of NRC had one-on-
one meeting with executive directors.
Compensation policy for the Board and Senior Management
Based on the recommendations of the Nomination & Remuneration Committee (NRC), the Board has approved
the remuneration policy for the directors, Key Managerial Personnel and all other employees of the Company. The
remuneration policy for Directors, Key Managerial Personnel and other employees is given in this report as Annexure-4.
Independent Directors Declaration
The company has received the necessary declaration from each independent director in accordance with the section
149 (7) of the Companies Act 2013 that he/ she meets the criteria of independence as laid out in sub-section (6) of
Section 149 of the Companies Act, 2013 and Regulation 16 (1) (b) of the Listing Regulations.
Appointment /Reappointment
i) Mr. Rajesh Ranjan Jha
The shareholders at their Annual General Meeting held on July 27, 2017 had appointed Mr Sandip Biswas (DIN
: 00518430), Mr Dibyendu Bose (DIN : 00282821) and Mr Rajesh Ranjan Jha (DIN : 07715246) as non-executive
non-independent director, liable to retire by rotation. As per the provisions of section 152(6) of the Companies
Act, 2013 Mr Rajesh Ranjan Jha, retire by rotation at the ensuing Annual General Meeting and being eligible offers
himself for re-appointment.
ii) Mr. Vinayak Kashinath Deshpande
The Board at its meeting held on May 29, 2018 considered the recommendation of the Nomination and
Remuneration Committee and appointed of Mr Vinayak Kashinath Deshpande as an Additional Director hold
office upto the date of the ensuing Annual General Meeting. The Company has received a notice from a member
proposing his appointment as a Director of the Company at the ensuing Annual General Meeting. He shall be
liable to retire by rotation.
Mr. Vinayak Kashinath Deshpande is a graduate in Chemical Engineering (1980) from IIT, Kharagpur, he has over 36
years of work experience in different roles, in diverse industries; starting with the design and sales of boilers and
captive power plants at Thermax, to industrial automation and process controls at Tata Honeywell.
At Tata Honeywell, he was the Managing Director of its India business for five years till 2004-05, wherein he grew
the company’s operations pan India, to achieve about 300% growth. Thereafter he had a successful stint as the
Executive President (Operations) of Tata Teleservices.
Mr. Deshpande took charge as Managing Director of Tata Projects in July, 2011. Since then Tata Projects has
doubled its turnover and achieved all-round excellence in its business of Industrial Infrastructure.
Under his mentorship, Tata Projects has been voted consecutively for the last 5 years as `India’s Most Admired’ and
`Fastest Growing Construction Company’ by `Construction World’ journal. Mr. Deshpande too was voted as the
Infrastructure Person of the Year for 2016-17. This year, Tata Projects also featured amongst `Economic Times Best
Infrastructure Brands’.
iii) Mr Sanjay Rajoria
The Board at its meeting held on January 29, 2018 considered the recommendation of the Nomination and
Remuneration Committee and appointed of Mr Sanjay Rajoria as the Managing Director of the Company for a
period of 3 (three) years with effect from February 1, 2018.
Mr. Sanjay Rajoria is a graduate in Mining Engineering. He is also the holder of 1st class Mine’s Managers Certificate
from the Director General of Mines & Safety, Dhanbad. He successfully completed two months training programme
in New South Wales, Sydney on “Mine Planning”. He also has CEDEP Management Programme from INSEAD France
to his credit. He has over 30 years of experience in Tata Steel Limited where he has held various positions.
He joined Tata Steel in 1988 as Graduate Engineer Trainee and held various positions such as Assistant Manager,

23
Manager, Chief and General Manager. He has led Jamadoba Group of Collieries as Chief from 2005 to 2010.
He was appointed as Chief (Mine Planning and High Wall Technology) in November 2010. From July 2011 he
worked as General Manager (Operations) in West Bokaro Open Cast Mine of Tata Steel. He again worked as
General Manager (Operations) in Jharia Division (underground mines) from 2016 to July 2017. As in charge of
opencast and underground mines, he was responsible for operations of Mines, wash plant & other Administrative
& Management functions which included corporate social responsibilities and HR practices. Prior to joining TRF
he was working as General Manager, Raw Materials and Infrastructure Projects at Tata Steel.
Mr. Sanjay Rajoria holds office as an additional director upto the ensuing Annual General Meeting. The Company
has received notice from a member proposing his appointment as director. It is proposed to appoint Mr Sanjay
Rajoria as director and Managing Director, not liable to retire by rotation at the ensuing Annual General Meeting.
Relinquishment
i) Mr. P S Reddy
Mr P S Reddy relinquished the Managing Director’s Office and membership of the Board with effect from February
1, 2018 for an assignment in Tata Steel Group. The Directors and Management placed on record their sincere
appreciation for the valued contribution made by Mr P S Reddy during his tenure.
Key Managerial Personnel (KMP)
Pursuant to Section 203 of the Companies Act, 2013 the Key Managerial Personnel of the Company are:
1) Mr Sanjay Rajoria, Managing Director
2) Mr K. Sujit Mathai Mathew, Chief Financial Officer
3) Mr Tarun Kr Srivastava, Company Secretary.
The Key Managerial Personnel appointed during the year are as under:
Sl. No. Name Designation Date of Appointment
1 Mr Sanjay Rajoria Managing Director February 1, 2018
2 Mr K Sujit Mathai Mathew Chief Financial Officer February 1, 2018
KMPs ceased during the year are as under :
Sl.No. Name Designation Date of cessation
1 Mr P. S. Reddy Managing Director February 1, 2018
2 Mr Subhashish Datta Chief Financial Officer February 1, 2018
Managerial Remuneration
Details of remuneration as required under section 197(12) of the Companies Act, 2013 read with Rule 5 of the Companies
(Appointment & Remuneration of Managerial Personnel) Rules, 2014 is given in Annexure 5.
Directors Responsibilities Statement
Based on the representations received from the Operating Management, pursuant to Section 134(5) of the Companies
Act, 2013, the Board of Directors, to the best of their knowledge and ability, confirm that:
In preparation of annual accounts, the applicable accounting standards have been followed and that there are no
material departures in the preparation of the annual accounts.
Accounting policies were selected in consultation with statutory auditors and were applied consistently and
judgments and estimates made are reasonable and prudent so as to give a true and fair view of the state of affairs
of the Company as at the end of the financial year and of the profit / loss of the Company for the relevant period;
Proper and sufficient care has been taken, to the best of their knowledge and belief for the maintenance of
adequate accounting records in accordance with the provisions of the Companies Act, 2013, for safeguarding the
assets of the Company and for preventing and detecting fraud and other irregularities;
The annual accounts have been prepared on a going concern basis;

Fifty Fifth Annual Report 2017-18
24
The company has in place an established internal financial control system and the said systems are adequate and
operating effectively. Steps are also being taken to further improve the same.
The company has in place a system to ensure compliance with the provisions of all applicable laws and the system
is adequate. Steps are also being taken to further improve the legal compliance monitoring.
Audit Committee
The constitution of the Audit Committee, Terms of Reference and the dates on which meetings of the Audit Committee
were held are mentioned in the Corporate Governance Report for FY’17-18 forming a part of this Annual Report.
There has been no instance where Board has not accepted the recommendations of the Audit Committee during the
year under review.
Internal Financial Controls
The Board of Directors of the Company are responsible for ensuring that Internal Financial Controls have been laid
down in the Company and that such controls are adequate and operating effectively. The foundation of Internal
Financial Controls (IFC) lies in the Tata Code of Conduct, policies and procedures adopted by the management,
corporate strategies, annual business planning process, management reviews, management system certifications and
risk management framework.
The Company has in place an established internal financial control system designed to ensure proper recording of
financial and operational information and compliance of various internal control and other regulatory and statutory
compliances commensurate with the scale, size and complexity of its operations. The controls based on the prevailing
business conditions and processes have been tested during the year and no reportable material weakness in the design
or effectiveness was observed. The framework on Internal Financial Control over Financial Reporting has been reviewed
by the internal and external auditors.
The Audit Committee has also reviewed the effectiveness of internal controls and compliance control, related party
transaction, the status of Internal Financial Control and Key Accounting Controls.
Related party transactions
Details of transaction with related parties in Form AOC-2 is given in Annexure 6. The details of transactions with related
parties as per Ind AS 24 are disclosed in notes to accounts.
The Company has adopted a Policy on Related Party Transactions. The said policy is available on the website of the
Company at www.trf.co.in.
Whistle Blower Policy/Vigil Mechanism
The details of Whistle Blower Policy/Vigil Mechanism existing in the Company are mentioned in the Corporate
Governance Report for FY’17-18 forming part of this Annual Report.
Disclosure under Sexual Harassment of women at Workplace (Prevention, Prohibition & Redressal) Act, 2013
TRF has a stringent policy for prevention of sexual harassment of women at workplace and management takes a zero-
tolerance approach towards those indulging in any form of sexual misconduct. TRF has constituted a committee as
required under the Sexual Harassment of Women at Workplace (Prevention, Prohibition and Redressal) Act, 2013.
During the year, the Company received 2 complaints of sexual harassment, both complaints have been resolved by
taking appropriate action.
Risk Management Policy
The Board had at its meeting held on 26th December, 2005 adopted Risk Management Framework for the Company
for identification and prioritization of various risks based on pre determined criteria relating to i) Strategic Risk ii)
Operational Risk and iii) Functional Risk. The Company has developed risk registers and has identified key risks and has
also framed risk mitigation plan for the same. During the year the risk management executive Committee comprising
of senior Head of Department’s have revisited, assessed the current risks and risk management plan.
Risk management process in the Company is an on-going activity and steps are being taken to improve the same.

25
Explanations to Audit Report
The Statutory Auditors Report on Standalone Financial statement and the Secretarial Audit Report for the Financial Year
2017-18 does not contain any qualification which warrants comments from the Board of Directors.
The Statutory Auditors Report on Consolidated Financial statement contains a modified opinion of the auditors as
under:
Explanation to Qualifications/Modified opinion
The Statutory Auditors have expressed concern over the reasonableness of the assumptions made to estimate the
future cash flow projections of a subsidiary (Dutch Lanka Trailer Manufacturers Limited) (DLT) which manufactures and
markets trailers internationally and have accordingly expressed their inability to determine whether any adjustment is
necessary to the carrying amount of the goodwill on consolidation and have made a qualified opinion in their report
on Consolidated Financial Statement for the year ended March 31, 2018.
DLT has started generating profits from FY 2017-18. Revenue projected by DLT Group for next five years are achievable
considering improvement in market conditions. The performance of DLT Group is expected to improve in future.
Therefore, the management is of view that the sales projections are achievable and no further impairment provision is
required.
G. Statutory Auditors
M/s Price Waterhouse & Co, Chartered Accountants LLP (PwC) (Firm Registration No. 304026E/E-300009) were appointed
as auditors by the members at their 54th Annual General Meeting held on July 27, 2017 to hold office for 5 years from
the conclusion of the said 54th AGM until the conclusion of 59th AGM .
H. Cost Auditors
As per Section 148 of the Companies Act, 2013 read with the Companies (Cost Records and Audit) Rules, 2014 the
company is required to have audit of its cost records conducted by a Cost Accountant in practice.
The Board of Directors had re-appointed M/s Shome & Banerjee, Cost Accountants (Firm Registration no 000001),
Kolkata as Cost Auditors of the Company for the financial year 2017-18. The remuneration of the said auditors was
approved by the members at their last Annual General Meeting held on July 27, 2017. The Cost Audit Report along with
annexures for the FY 2016-17 was filed within the stipulated time.
M/s Shome & Banerjee, Cost Accountants have been re-appointed by the Board as Cost Auditors of the Company for the
financial year 2018-19. In terms of section 148 approval of members is sought at the ensuing Annual General Meeting
for appointment and payment of remuneration to the said auditors.
I. Secretarial Auditors & Secretarial Audit Report
The Board of Directors had re-appointed M/s P. K. Singh & Associates, Practising Company Secretaries (Firm Registration
No P2002JH045700) having their office at Room no 309, Vikash Bhawan (AIADA), Main Road, Adityapur, Jamshedpur-
831013 as Secretarial Auditors of the Company for the financial year 2017-18. The Secretarial Audit Report for FY’17-18
is given in Annexure 7.
J. Extract of Annual Return
Extract of Annual Return in Form MGT 9 as required under section 92(3), 134(3)(a) of the Companies Act, 2013 read with
Rule 12 of the Companies (Management and Administration) Rules, 2014 is given in Annexure 8.
K. Legal Orders
There are no Significant/material orders of Courts/ tribunal/regulation affecting the Company’s going concern status.
However, members’ attention is drawn to the statement on contingent liabilities, commitments in the notes forming
part of the Financial Statements.
L. Loans, Guarantees or Investments
Details of Loans, Guarantees and Investments as required under section 186 of the Companies Act, 2013 is given in
Annexure 9.

Fifty Fifth Annual Report 2017-18
26
M. Environment: (conservation of Energy, technology absorption, foreign exchange earnings)
Although the operations of the Company at Jamshedpur and at its project sites are basically non-polluting in nature,
adequate precautions are taken to comply with all regulatory requirements in this regard at all locations. In addition
to ensuring compliance with the legal norms, the Company continues its efforts towards urban beautification and
tree plantation. As required under section 134(3)(m) of the Companies Act, 2013 read with Rule 8(3) of the Companies
(Accounts) Rules, 2014 the relevant particulars are given in the Annexure 10.
N. Deposit
As in the previous year, the Company has not accepted/ renewed any fixed deposits during the year.
O. Other Disclosures
No director of the Company occupies the position of Managing Director or Whole time Director in any of the
subsidiaries of the Company.
Changes affecting the financial position of the Company from the end of the financial year up to the date of the
report will be reported in Q1’18-19 results.
There has been no change in the nature of business of the Company during the year under review.
At the ensuing AGM, no new Independent Director is being appointed.
The Company has not given loan to its employees to purchase or subscribe fully paid up shares in the Company in
terms of Section 67(3)(c) of the Companies Act, 2013 and Rule 16(4) of Companies (Share Capital and Debentures)
Rules, 2014.
The provisions of Section 131(1) of the Companies Act, 2013 are not applicable. The average net profits for the
immediately preceding three financial years are negative.
In view of losses incurred in immediately preceding 3 financial years the provisions of Section 135(5) of the
Companies Act, 2013 relating to CSR are not applicable.
The Company has not issued shares with differential voting rights, sweat equity shares, employee stock option.
ACKNOWLEDGEMENT
We thank our shareholders, customers, vendors, investors, business associates and bankers for their continued support during
the year. We place on record appreciation of the contribution made by all the employees towards improving productivity and
in the implementation of various initiatives to reduce internal costs and bring about improvement in operational efficiencies.
We also thank our workers’ union for their cooperation and support.
On behalf of the Board of Directors
Sandip Biswas
Place: Kolkata Chairman
Date: May 29, 2018 DIN : 00518430

27
Annexure-1
Management Discussion & Analysis1. Industry, Structure and Development
At 3.8%, Global growth in 2017 was the fastest since 2011. According to International Monetary Fund (IMF), the
global economy is experiencing a recovery, the most broad-based since 2010. With favorable market sentiment and
accommodative financial conditions, global growth is expected to grow at 3.9% rate in both 2018 and 2019. IMF has
estimated India’s economic growth at 6.7% in FY’18 and projected a growth of 7.4% for FY’19 on hopes of further boost
to investment and increased private consumption.
The Indian economy, despite rebound in global economy witnessed slowdown in the first half due to inter alia the
effect of demonetization, Goods and Services Tax (GST) implementation and Non-Performing Assets (NPA) overhang in
Banks . Central Statistics office (CSO) has estimated India’s growth at 6.6% in FY’18 lower than 7.1% in FY’17.
FY’19 Union budget aims to strengthen the rural economy and country’s infrastructure. Infrastructure basket spend
has seen an increase of 21% (Rs 5.97 trillion) of which Rs 2.04 trillion is the outlay for Smart Cities mission, Rs 0.77
trillion under AMRUT programme focussed on providing water, sewerage and transportation for cities and Rs 1.48
trillion towards strengthening and enhancing railway capacities. There is also emphasis on road construction under
the Bharatmala Pariyojana, with government aiming to build 35,000 km of roads at an investment of Rs 5.35 trillion.
In the Ports and Waterways segments, cargo traffic grew at a CAGR of 4.02% and the Government implemented the
Sagarmala project to modernise ports and augment their capacity. Out of 152 such projects, 52 are under construction
and 1 was completed in December 2017. Overall, the allocation to Roads, Railways, Shipping, Urban development and
Aviation increased by 16%, 32%, 20%, 2% and 144% respectively in the budget. The higher outlay in infrastructure is
expected to boost demand in the sectors TRF operates in, especially Steel and Cement. “
Index of Industrial Production, a composite Indicator of output growth across sectors, registered a Cumulative growth
of 4.3% in FY’18. The Index of Manufacturing, Mining and Electricity sector grew by 4.5%, 2.3% and 5.4% respectively
while Capital Goods index, a barometer for investments in the economy registered a growth of 3.7 % during the year.
During the year some of the major over-leveraged companies in the infrastructure, power generation and steel sector
were referred to National Company Law Tribunal (NCLT) under Insolvency and Bankruptcy Code (IBC). Overall the
sectors that company operates in remained depressed, adversely impacting the business of the Company. Resolution
under IBC and effective monitoring of credit quality by Banks is expected to provide stable and favorable markets from
FY’19 onwards.
Meanwhile, the Company is reorienting its business structure and pursuing new business avenues of fabrication and
Life Cycle Services. Life cycle business envisages Operation and Maintenance, spares and services, refurbishment and
segment servicing. The Company is also exploring opportunity to further its business with Tata Steel, for which approval
of shareholders has been obtained by way of postal ballot. The above measures will improve the performance of the
Company.
2. Opportunities
a. Significant opportunities of growth exists over the next few years in key sectors such as Steel, Ports, Mining and
Power for equipment and life cycle services
b. Opportunities in the Structural business including fabrication and erection
c. Opportunity of partnering with Tata Steel for its growth projects.
3. Threats
a. Emergence of Global players delivering extended range of products endowed with latest technology
b. Extended period of weak investment growth to result in shortage of orders
c. Company’s inability to meet the pre-qualification criteria of positive net worth to result in loss of orders
d. Delay in Performance Guarantee (PG) test leading to delay in collection of retention money and site closure
4. Financial Performance
On standalone basis, total income from operations of your Company during the year was Rs. 35,930.85 lakhs (Previous
year Rs.52,974.84 lakhs). Loss before tax for the year was Rs.16,555.80 lakhs (Previous year loss before tax was Rs.
4933.70 lakhs).

Fifty Fifth Annual Report 2017-18
28
On consolidated basis, total income from operations of your Company during the year was Rs.44,666.15 lakhs, (Previous
year Rs. 60,962.13 lakhs). Loss before tax for the year was Rs. 18,497.89 lakhs (Previous year Loss before tax was
Rs.7,575.11 lakhs). Total comprehensive loss for the year was Rs. 11,965.35 lakhs (Previous year Rs.3,526.59 lakhs).
Segment-wise Performance
Standalone :
The Projects and Services segment has posted a revenue of Rs.24,865.49 lakhs (Previous Year Rs.38,267.28 lakhs) and
the Products and Services segment has posted a revenue of Rs. 18,785.82 lakhs (Previous Year Rs. 27,610.10 lakhs),
including inter segmental revenue of Rs. 8,256.19 lakhs (Previous year Rs.13,898.69 lakhs).
The Projects and Services segment posted a segmental Loss of Rs.15,326.24 lakhs (Previous Year loss of Rs.4,756.19
lakhs). The Products and Services segment has recorded a Profit of Rs. 692.26 lakhs (Previous Year profit of Rs.4,201.45
lakhs). The loss after deducting Interest, other un-allocable expenditure/ income and Income Tax from the segmental
results has been Rs. 14,597.65 lakhs (Previous Year loss of Rs. 2,691.10 lakhs).
Consolidated :
The Projects and Services segment has posted a revenue of Rs. 24865.49 lakhs (Previous Year Rs 38,267.28 lakhs) and
the Products and Services segment has posted a revenue of Rs. 27,568.28 lakhs (Previous Year Rs.35,881.41 lakhs),
including inter segmental revenue of Rs. 8,256.19 lakhs (Previous year Rs. 13,898.69 lakhs).
The Projects and Services segment posted a segmental Loss of Rs. 15, 236.24 lakhs (Previous Year loss of Rs. 4,756.19
lakhs). The Products and Services segment has recorded a Profit of Rs.1,523.14 lakhs (Previous Year profit of Rs.5,230.62
lakhs). The Loss of the Company after deducting Interest, other unallocable expenditure/income and Income Tax from
the segmental results, has been Rs. 13,411.35 lakhs (Previous Year loss of Rs.2,410.14 lakhs).
5. Outlook for the Power, Steel, Port and Mining sector in which your company operates is detailed below:
Power Sector:
The Power sector continued to struggle with low capacity utilization. The plant load factor (PLF) for coal and lignite
based power plants has been below 65% since 2014-15 was at 60.67% in FY’18. The PLF for central power plants was
72.35% while PLF of state and private sector was very low at 56.83% and 55.32 % in FY’18. The excess capacity has been
a limiting factor for fresh investments in the Thermal power sector space and the reason for stressed assets in the power
sector.
Central Electricity Authority (CEA) has set a higher electricity generation target from conventional sources at 126,000
million units (MU) in FY’19, nearly 6.7% higher than FY’18. This target is expected to help improve the PLF for the sector,
especially private power plants in FY’19.
Though no major Capex is expected in the power sector in FY’19, the company however sees opportunity in terms of
refurbishment, equipment supply and spares.
Steel Sector:
India’s production of crude steel was 102.33 million tonnes (mt) in FY’18, an increase of 4.25% over FY’17 which clocked
98.15 mt. Total finished steel production for sale was 104.978 mt, an increase of 3.1% year on year. Consumption of total
finished steel was 90.68 mt, an increase of 7.9%. Export of total finished steel reached 9.62 mt, an increase of 16.7%
while Import of total finished steel was 7.482 mt, an increase of 3.5%. The Crude steel capacity reached 134.66 mt, a
growth of 5%.
Demand revival, resolution of stressed assets referred to National Company Law Tribunal (NCLT) leading and
consolidation is expected to boost capacity utilization. New capacities ramp-up are expected in FY’19 to meet the
demand growth.
Port Sector:
The major ports recorded a growth of 4.77% and together handled 679.35 million tonnes (mt) of cargo during FY’18 as
against 648.39 mt handled in FY’17. During the period from FY’16 to FY’18, the cargo handling capacity addition has
stood at 487 mt across the major ports.
Government is continuously looking to augment capacities to develop eco-friendly and economic mode of

29
transportation along inland waterway and coastal shipping routes under the Sagarmala Programme. This includes the
creation of new berths and mechanization of the ports for achieving a quicker turnaround.
This port led economic development is expected to present a huge business opportunity for TRF in the coming years
Mining Sector:
During April – December 2017, India’s mineral output grew by 6.2 per cent year-on-year to reach US$ 28.14 billion.
The contribution of coal was the highest at around US$ 9.76 billion (34.68%), followed by crude petroleum at US$ 7.56
billion (26.87%), iron-ore at US$ 3.57 billion (12.69%per cent) and natural gas (utilized) at US$ 3.08 billion (10.95%).
Auction of Coal mines expected in FY’19 as per the Coal Mines (Special Provisions) Act, 2015 and Mines and Minerals
(Development and Regulation) Act, 1957 is expected to bring in efficiency into the coal sector due to increased
competition and deployment of best possible technology into the sector. Increased competition in the market will lead
to high domestic production, better utilization of mining resources and assured coal supply.
6. Risks and Concerns
At present liquidity is a major challenge to the operations of the Company and has the potential to affect ‘going concern’
status of the company. As such Company is taking proactive measures to complete Performance Guarantee tests and
collect retention monies, special emphasis is being made for collection from debtors and engagement with customers
to ensure liquidity for operations. Further the restructuring of subsidiaries will improve the liquidity of the Company
and help performance of the Company.
Adequate steps are being taken to mitigate the risks. Further to improve risk management framework a revised
Risk Management policy was adopted to make the guiding framework of risk management compatible to current
circumstances.
7. Statutory Compliance
After obtaining confirmation from the various units of the Company on compliance to all statutory requirements, a
declaration regarding compliance with the provisions of the various statutes is made jointly by the Managing Director
and Company Secretary at each Board Meeting. The Company Secretary / Compliance Officer ensures compliance with
the SEBI regulations and provisions of the Listing Agreement and acts as the Compliance Officer for prevention of
insider trading and ensures compliance with the Tata Guidelines on Insider Trading.
8. Internal Control System
The internal control systems and procedure are continuously monitored to enhance its effectiveness and to be
commensurate with the scale and nature of its operations. M/s Deloitte the Company’s outsourced- internal auditors,
directly report to the Audit Committee. During the year, the Audit Committee of the Board regularly met to discharge
its functions as required pursuant to the Listing Regulations. The Audit Committee reviews compliance to the Revenue
Recognition and Provisioning Policy of the Company. Internal audit activities are undertaken as per the Annual Audit
Plan duly approved by the Audit Committee.
The Audit Committee regularly meets with the statutory auditors to ascertain their views on the adequacy of internal
controls and their observations on the financial reports.
9. Developments in Human Resources/Industrial Relations front
Human Resource continues to be a key focus area. Total manpower as on April 1, 2018 was 657. Capability building
continued to be a top priority.
The industrial relations in your Company continues to be healthy and cordial. The Workers’ Union actively supported all
important initiatives of the Company.
Cautionary Statement
Statements in the Management Discussion and Analysis describing the Company’s objectives, projections, estimate,
expectations may be “forward-looking statements” within the meaning of applicable securities laws and regulations.
Actual results could differ materially from those expressed or implied. Important factors that could make a difference to
the Company’s operations include economic conditions affecting demand/supply and price conditions in the domestic
and overseas markets in which the Company operates, changes in the Government regulations, tax laws and other
statutes and incidental factors.

Fifty Fifth Annual Report 2017-18
30 Sta
tem
en
t p
urs
ua
nt
to S
ec
tio
n 1
29
(3)
of
the
Co
mp
an
ies
Ac
t, 2
01
3 [
FO
RM
AO
C-1
]
Pa
rt A
: S
ub
sid
iari
es
Rs.
in la
c
Sr.
No
Nam
e of
Sub
sidi
ary
Com
pany
Repo
rtin
g
Curr
ency
Exch
ange
Rate
Shar
e
Capi
tal
Rese
rves
& S
urpl
us
(Oth
er
equi
ty)
Tota
l Ass
ets
Tota
l
Liab
ilitie
s
(Oth
er th
an
equi
ty)
Inve
stm
ents
incl
uded
in
Tota
l Ass
ets
Turn
over
/
Tota
l
Inco
me
Profi
t
Befo
re T
ax
Prov
isio
n
for
Taxa
tion
Profi
t Aft
er
Taxa
tion
Prop
osed
Div
iden
d
% o
f
Shar
e
hold
ing
Coun
try
1.TR
F Si
ngap
ore
Pte
Lim
ited
SGD
49.6
524
,965
.74
(2,2
46.0
4)23
,875
.26
1,15
5.56
21,3
35.7
327
.63
(294
.04)
-(2
94.0
4)-
100.
00Si
ngap
ore
2.TR
F H
oldi
ng P
te L
imite
dU
SD65
.04
-(4
,177
.39)
11,4
68.1
815
,645
.57
11,4
60.3
7-
(573
.97)
-(5
73.9
7)-
100.
00Si
ngap
ore
3.Yo
rk T
rans
port
Equ
ipm
ent (
Asi
a)
Pte
Ltd
( Not
e-1)
USD
65.0
47,
411.
325,
411.
6727
,595
.47
14,7
72.4
85,
667.
5817
,338
.53
633.
0311
3.75
519.
28-
100.
00Si
ngap
ore
4.Yo
rk T
rans
port
Equ
ipm
ent (
Indi
a)
Pvt L
td
INR
1.00
5,58
4.04
1,15
4.90
16,5
33.8
110
,070
.04
-41
,191
.41
2,21
6.17
969.
471,
246.
70-
100.
00In
dia
5.Yo
rk T
rans
port
Equ
ipm
ent P
ty L
tdAU
D50
.08
2,65
0.01
(3,3
62.5
7)35
1.98
1,06
4.52
-5,
503.
8642
.24
15.9
026
.34
-10
0.00
Aus
tral
ia
6.Yo
rk S
ales
(Tha
iland
) Com
pany
Lim
ited
THB
2.09
81.9
81,
870.
561,
998.
5746
.03
-96
8.85
75.6
716
.80
58.8
7-
100.
00Th
aila
nd
7.Yo
rk T
rans
port
Equ
ipm
ent (
SA)
(Pty
) Ltd
ZAR
5.50
14.6
351
.02
68.9
83.
35-
295.
6541
.26
0.06
41.2
0-
100.
00So
uth
Afr
ica
8.Re
dnet
Pte
Ltd
USD
65.0
4-
(592
.09)
(590
.39)
1.69
--
(3.2
1)-
(3.2
1)-
100.
00Si
ngap
ore
9.PT
Yor
k En
gine
erin
gID
R0.
005
66.5
8(2
54.7
9)(1
81.5
7)6.
65-
--
--
-10
0.00
Indo
nesi
a
10.
YTE
Spec
ial P
rodu
cts
Co. L
imite
dU
SD65
.04
-54
8.89
619.
3570
.46
1,99
0.30
168.
02(1
39.2
7)-
(139
.27)
-10
0.00
Sing
apor
e
11.
Qin
gdao
YTE
Spe
cial
Pro
duct
s Co
.
Lim
ited
CNY
10.3
413
1.02
(2,3
80.9
3)2,
082.
014,
331.
92-
10,2
18.0
9(4
09.0
9)-
(409
.09)
-10
0.00
Chin
a
12.
York
Tra
nspo
rt E
quip
men
t
(Sha
ngha
i) Co
. Ltd
CNY
10.3
41,
951.
32(2
99.4
5)1,
620.
71(3
1.17
)-
-(8
3.65
)-
(83.
65)
-10
0.00
Chin
a
13.
Dut
ch L
anka
Tra
iler M
anuf
actu
rers
Lim
ited
USD
65.0
474
5.42
457.
595,
471.
384,
268.
391,
093.
953,
863.
1719
.12
1.12
18.0
0-
100.
00Sr
ilank
a
14.
Dut
ch L
anka
Eng
inee
ring
(Priv
ate)
Lim
ited
LKR
0.42
64.9
640
8.13
1,00
2.74
529.
65-
1,68
2.35
75.6
622
.32
53.3
4-
100.
00Sr
ilank
a
15.
Dut
ch L
anka
Tra
ilers
LLC
OM
R16
9.45
253.
42(1
02.4
0)21
0.09
59.0
7-
--
--
-70
.00
Om
an
16.
Hew
itt R
obin
s In
tern
atio
nal L
tdG
BP92
.28
1.85
4,08
3.46
5,24
5.75
1,16
0.43
-3,
459.
5368
8.95
132.
0955
6.86
- 10
0.00
Uni
ted
King
dom
17.
Hew
itt R
obin
s In
tern
atio
nal
Hol
ding
Ltd
GBP
92.2
8-
68.3
8 2,
836.
92
2,76
8.54
2,
836.
92
- -
- -
- 10
0.00
Uni
ted
King
dom
An
ne
xu
re-2

31
Annexure-3
Policy on directors appointment including criteria for determining qualifications, positive
attributes, independence of a director:
The Board has adopted comprehensive Governance Guidelines for Tata Companies which inter alia provides policy/
framework for a) Role of the Board, Chairman, Directors, b) Board composition, c) Criteria for appointment of directors
(Executive, non-independent and independent), d) Criteria for independence e) remuneration of directors f ) Code of
conduct for executive/non-independent and independent directors g) Board, Committee and Director evaluation process
and questionnaire format.
As laid down in the aforementioned Governance Guidelines, it is the responsibility of the Nomination and Remuneration
Committee to develop competency requirement for the Board based on the industry and strategy of the Company. The
Board composition analysis is made with an in-depth understanding of the Company, including its strategies, environment,
operations, financial condition and compliance requirement. The guidelines put in place a transparent board nomination
process and the appointment of directors are made keeping in view to bring in diversity of thought, experience, knowledge,
perspective, age and gender. Non-executive directors bring an external view and judgment on the issues of strategy, risk,
performance, capital and other resources, key appointments and business conduct. The guidelines prescribe that retired
MD/ED/employees are not invited to join the Board of the company as non-executive directors. However, such person may
continue as non-executive director of its subsidiaries/ joint venture/associates/fellow subsidiaries and other Tata Companies.
All non-independent non-executive directors are liable to retire by rotation and they are to be selected through a formal
process by the Nomination and Remuneration Committee and confirmed by the Board.
A director is considered to be an independent director if he meets the criteria for independence as laid down under the
Companies Act, 2013 and listing regulations. The Governance Guidelines prescribe that while recommending appointment
of an independent director, the Nomination and Remuneration Committee shall consider the manner in which the function
and domain expertise of the individual contributes to the overall skill-domain mix of the Board. Independent directors
appointed are thought/practice leaders in their respective functions/domain.
Part B : Joint Ventures (As per the equity method)
Sr.
No.
Name of Joint Venture Latest
Audited
Balance
Sheet
Date
Shares of Joint Venture held by the Company on the year end Profit/(Loss) for the Year
Number of
Shares
Amount of
Investment
in Joint
Venture
Extend of
Holding
Description
of how there
is Significant
influence
Reason
why joint
venture is not
consolidated
Net worth
attributable to
shareholding
as per the latest
Balance Sheet
Considered in
consolidation
(Incl other
comprehensive
income)
Not
Considered in
consolidation
1 Adithya Automotive
Applications Pvt. Limited
Note 2 Not
Applicable
96.50 -
2 Tata International DLT Private
Limited
31.03.2018 8,540,000 854 50% Not
Applicable
1,867.03 745.11 -
Note. 1: In terms of share purchase agreement dated March 21, 2108 with SAF Holland GMBH , the group has decided to divest its entire stake in York
group and the same has been classified as held for sale.
Note. 2: In terms of share purchase agreement dated October 31, 2107 with JL Power venture Pvt Ltd, Coventurer of Adithya Automotive Applications Pvt
Ltd, the Company’s entire stake of 51% has been transferred and it ceased to be a jointly controlled entity w.e.f. February 4, 2018.

Fifty Fifth Annual Report 2017-18
32
Annexure- 4
Policy for remuneration of directors, KMP and other employees
The existing policy for remuneration of non-executive directors, executive directors, Key Managerial Personnel, Senior
Management and other employees as at the commencement of the Act was reviewed by the Nomination and Remuneration
Committee at its meeting held on May 1, 2015. The existing policy was continued. The Non-Executive Directors are paid
remuneration by way of sitting fees and commission. The commission is paid at the rate not exceeding 1% of net profits
computed in accordance with Section 198 of the Companies Act, 2013. The Nomination and Remuneration Committee
recommends the annual commission to be paid to the Non-Executive Directors. The distribution of commission amongst
Non-Executive Directors is placed before the Board. The Commission is distributed on the basis of their attendance and
contribution to the Board and its Committees meetings.
The Company pays remuneration by way of salary, perquisites and allowances (fixed component) and Commission/
Performance Linked Remuneration (variable component) payable to the Managing/ Whole-time Director(s). The payment
of Commission (as a percent of profit)/Performance Linked Bonus is determined by the Board at the end of the financial year
based on the recommendations of the Nomination and Remuneration Committee.
The Company pays remuneration comprising of the following to Key Managerial Personnel, Senior Management and other
employees:
Fixed Pay : Basic, DA(paid to workers only) House Rent allowance, Conveyance Allowance, Special/other allowance,
LTC
Retiral Benefits : Provident Fund, Gratuity, Super Annuation Fund(to officers)
Variable Pay: Bonus/Profit Sharing based on the profit of the Company
Perks and Benefits :
Group Accident Policy
Medical Hospitalization Facilities for employees at TATA Hospitals in Jamshedpur
Medical Insurance (Kolkata) / Medical Reimbursements (Other Sites)
Life Cover Scheme (20 months’ Salary)
Housing Colony, Club, Welfare Centre, Clinic and Dispensary
Car Scheme for senior and middle management.
Uniform Allowance, Uniform Maintenance Allowance and Washing Allowance for Employees at site.
Remuneration of Officers is revised annually based on the performance and Workers remuneration is revised as per Wage
Agreements.
TRF Ltd has adopted long term incentive plan viz Smart Variable Allowance to retain talent.

33
Annexure-5
Particulars of Remuneration pursuant to Section 197(12) read with Rule 5 of the Companies
(Appointment & Remuneration of Managerial Personnel) Rules, 2014
1. The ratio of the remuneration of each director to the median remuneration of the employees of the Company
for the financial year.
Sl.
No.
Name of Director Total
Remuneration
Paid In
Fy’17-18
Rs in lakh
Ratio to Median
Remuneration
of officers
(Director
remuneration/
Median
Remuneration)
Ratio to
Median
Remuneration
of workers
Ratio to
Median
Remuneration
of all
employees
Non-Executive Directors $
1 Mr Sandip Biswas NA NA NA NA
2 Mr Ranaveer Sinha 5.75 0.96 1.90 1.06
3 Mr Dipankar Chatterji 8.25 1.38 2.73 1.52
4 Mr Sabyasachi Hajara 7.00 1.17 2.32 1.29
5 Ms Neera Saggi 8.50 1.42 2.81 1.57
6 Mr. Rajesh Ranjan Jha NA NA NA NA
7 Mr Dibyendu Bose NA NA NA NA
Executive Director
8 Mr P S Reddy (MD upto 31.01.18) 60.47 11.95 23.61 13.16
9 Mr Sanjay Rajoria (appointed as MD
w.e.f 01.02.18)
9.98 10.85 21.48 11.93
$ The Non-executive directors were paid sitting fee for attending meeting of the Board and its committees. Directors
who are full time employees of Tata Steel are not being paid any sitting fee.

Fifty Fifth Annual Report 2017-18
34
2. The percentage increase in remuneration of each director, Managing Director, Chief Financial Officer and
Company Secretary
Sl. No. Name of Director Total Gross
Remuneration for
FY 2016-17 Rs in
lakh
Total Gross
Remuneration for FY
2017-18 Rs in lakh
% increase
Non-Executive Directors $
1 Mr Sandip Biswas NA NA NA
2 Mr Ranaveer Sinha 6.25 5.75 -
3 Mr Dipankar Chatterji 8.25 8.25 -
4 Mr Sabyasachi Hajara 6.00 7.00 -
5 Ms Neera Saggi 8.00 8.50 -
6 Mr. Rajesh Ranjan Jha NA NA -
7 Mr Dibyendu Bose NA NA -
Executive Directors
8 Mr P S Reddy (MD upto 31.01.18) 67.02 60.47 * 9 % increase in
basic salary
9 Mr. Sanjay Rajoria
(appointed as MD w.e.f 01.02.18)
- 9.98 ** NA
Chief Financial Officer
13 Mr K. Sujit Mathai Mathew
(Appointed w.e.f 01-02-18)
- 8.42 NA
14 Mr. Subhashish Datta
(Ceased w.ef 01-02-18)
48.40 41.20*** 7.5% increase in
basic salary
Company Secretary
15 Mr. Tarun Kumar Srivastava 15.10 16.29 10% increase in
basic salary
* During the last financial year, Mr. P.S. Reddy was employed with TRF for 10 months only from April 1, 2017-January 31,
2018
** During the last financial year, Mr. Sanjay Rajoria was employed with TRF for 2 months only from February 1, 2018 -
March 31, 2018
*** During the last financial year, Mr. Subhashish Datta was the Chief Financial Officer for 10 months only from April 1, 2017
- March 31, 2018
$ The Non-executive directors were paid sitting fee for attending meeting of the Board and its committees. No other form
of remuneration was paid to the non-executive directors during FY’ 16-17 or FY’17-18. The rate of sitting fee paid is as
under:

35
Sl.No. Board/Committee Rate of sitting fee per
meeting for FY 16-17
Rs
Rate of sitting fee per
meeting for FY 17-18
Rs
1 Board Meeting 50,000 50,000
2 Audit Committee 50,000 50,000
3 Nomination & Remuneration Committee 50,000 50,000
4 Executive Committee 50,000 50,000
5 Committee of Directors N.A 50,000
5 Corporate Social Responsibility Committee 25,000 25,000
6 Stakeholders Relationship Committee 25,000 25,000
There has been no increase in the rate of sitting fee during the FY’ 17-18.
3. The percentage increase in the median remuneration of employees in the financial year
Sl. No. Category % increase of median remuneration
1 Officers 7.07
2 Workers 4.28
3 Total Officers & Workers 6.36
4. Number of Permanent Employees on the rolls of the Company
Sl. No. Category No. of persons on Roll
As on April 1, 2018
1 Officers 410
2 Workers 247
Total 657
5. Average percentile increase already made in the salaries of employees other than the managerial personnel
in the last financial year and its comparison with the percentile increase in the managerial remuneration and
justification thereof
Average increase in remuneration
of Officers in FY 17-18
%
increase in remuneration
of MD
%
Ratio of increment of
MD to that of Officers
5.93 9 % 1.26
6. Affirmation regarding payment of remuneration as per the remuneration policy of the Company
The remuneration paid to directors, key managerial personnel and other employees are as per remuneration policy of
the Company.

Fifty Fifth Annual Report 2017-18
36 7.
Sta
tem
en
t o
f D
isc
losu
re p
urs
ua
nt
to S
ec
tio
n 1
97
of
the
Co
mp
an
ies
Ac
t, 2
01
3.
[R
ea
d w
ith
Ru
le 5
(2)
of
Co
mp
an
ies
(Ap
po
intm
en
t a
nd
Re
mu
ne
rati
on
of
Ma
na
ge
ria
l P
ers
on
ne
l) R
ule
s, 2
01
4]
N
AM
ES
OF
TO
P 1
0 E
MP
LO
YE
ES
IN
TE
RM
S O
F R
EM
UN
ER
AT
ION
DR
AW
N D
UR
ING
TH
E F
INA
NC
IAL
YE
AR
20
17
-18
Sl.
No.
Nam
eD
esig
nat
ion
Rem
un
erat
ion
(Rs.
In L
akh
s)
Qu
alifi
cati
on
Tota
l
Exp
erie
nce
(Yea
rs A
pp
rox.
)
Dat
e o
f
Co
mm
ence
men
t
of E
mp
loym
ent
Ag
e
(Yea
r)
Last
Em
plo
ymen
t
1Po
limer
a Sr
iniv
asa
Red
dy
Man
agin
g D
irec
tor
60.4
7*M
. Tec
h, I
nd
ust
rial
Eng
inee
rin
g
3029
-May
-15
55Ta
ta S
teel
Lim
ited
2Su
mit
Sh
ub
had
arsh
anV
ice
Pres
iden
t-C
om
mer
cial
55.6
1**
B.Sc
., IC
WA
, C.A
.,
MB
A
241-
Sep
-17
49Ta
ta S
teel
Lim
ited
3Su
bh
ash
ish
Dat
taC
hie
f, C
om
mer
cial
49.4
4B.
Co
m (H
), C
FA, F
CS,
FCM
A
2901
-Mar
-16
51Th
iess
Min
escs
Ind
ia
Pvt
. Lim
ited
4Sa
nd
eep
Ku
mar
Tan
war
Offi
cer
on
Sp
ecia
l Du
ty42
.44
B.E.
Mec
han
ical
2916
-Ju
n-1
651
Tata
Ste
el L
imit
ed
5B
isw
ajit
Sh
awC
hie
f, B
uss
. Dev
. & E
ner
gy
& In
fr
29.4
8B.
Tech
, Ele
ctro
nic
s31
15-F
eb-1
155
Tata
Pro
ject
s Li
mit
ed
6A
shis
h B
aner
jee
Ch
ief D
esig
n, E
ng
inee
rin
g
and
Tec
hn
olo
gy
28.6
4P
GD
(In
du
stri
al
Man
agem
ent)
3306
-Sep
t-10
53Ji
nd
al S
teel
an
d P
ow
er
Lim
ited
7Pr
itam
Lah
iri
Hea
d, C
ivil
and
Str
uct
ura
l27
.61
B.E.
, Civ
il15
14-J
un
-16
54Te
chn
ip In
dia
Lim
ited
8M
edio
mah
H. P
atel
Ch
ief,
Bu
sin
ess
Exce
llen
ce25
.73
PG
D, M
anag
emen
t37
1-Ju
l-07
57Ta
ta S
teel
Lim
ited
9A
mit
abh
Ch
and
ra J
ha
Ch
ief H
um
an R
eso
urc
e O
ffice
r23
.91*
*P
GD
(Mg
mt)
211-
Au
g-1
748
Tata
Ste
el L
imit
ed
10Su
nil
Ku
mar
So
ni
Hea
d, S
trat
egic
So
urc
ing
, SC
M23
.52
B.Te
ch, E
lect
rica
l &
MB
A M
arke
tin
g
2529
-Oct
-12
48D
egre
mo
nt
Ind
ia L
imit
ed
*
Du
rin
g t
he
last
fin
an
cia
l ye
ar
Mr.
Po
lime
ra S
rin
iva
sa R
ed
dy
wa
s e
mp
loye
d w
ith
th
e C
om
pa
ny
for
10
mo
nth
s o
nly
fro
m A
pri
l 1, 2
01
7 t
o J
an
ua
ry 3
1, 2
01
8.
**
M
r S
um
it S
hu
bh
ad
ars
ha
n a
nd
Mr
Am
ita
bh
Ch
an
dra
Jh
a a
re o
n d
ep
uta
tio
n f
rom
Tat
a S
tee
l.

37
Annexure- 6
FORM NO. AOC -2(Pursuant to clause (h) of sub-section (3) of section 134 of the Act and Rule 8(2) of the Companies (Accounts) Rules, 2014)
Form for disclosure of particulars of contracts/arrangements entered into by the company with related parties’ referred to
in sub-section (1) of section 188 of the Companies Act, 2013 including certain arms length transactions under third proviso
thereto
1. Details of contracts or arrangements or transactions (C/A/T) not at arm’s length basis:
Name of related
party and nature
of relationship
Nature of
C/A/T
Duration of
C/A/T
Salient terms
of C/A/T
including the
value, if any
Justification
for entering
into such
C/A/T
Date(s) of
approval by
the Board
Amount
paid as
advances,
if any
Date on which the SR
was passed in general
meeting as required
under section 188(1)
NIL
2. Details of material contracts or arrangement or transactions (C/A/T) at arm’s length basis:
Name(s) of the
related party
and nature of
relationship
Nature of
C/A/T
Duration of
the C/A/T
Salient terms of the
contracts or arrangements
or transactions including
the value, if any
Date(s) of approval by
the Board, if any
Amount paid as
advances, if any
The Company did not had any transaction with related parties during the year coming under the purview of section 188 of
the Companies Act, 2013. The details of transactions as per Ind AS- 24 are disclosed in the Notes to Accounts for FY’17-18.

Fifty Fifth Annual Report 2017-18
38
Annexure-7
SECRETARIAL AUDIT REPORTFORM NO. MR-3
FOR THE FINANCIAL YEAR ENDED MARCH 31, 2018
[Pursuant to Section 204(1) of the Companies Act, 2013 and Rule No. 9 of The Companies (Appointment and
Remuneration of Managerial Personnel) Rules, 2014]
To,
The Members,
TRF Limited
11, Station Road, Burmamines,
Jamshedpur, Jharkhand
We have conducted the secretarial audit of the compliance of applicable statutory provisions and the adherence to good
corporate practices by TRF Limited (hereinafter called the Company). Secretarial Audit was conducted in a manner that
provided us a reasonable basis for evaluating the corporate conducts/statutory compliances and expressing our opinion
thereon.
Based on our verification of company’s books, papers, minute books, forms and returns filed and other records maintained by
the Company and also the information provided by the Company, its officers, agents and authorized representatives during
the conduct of secretarial audit, we hereby report that in my opinion, the Company has, during the audit period covering
the financial year ended March 31, 2018, complied with the statutory provisions and that the Company has proper Board-
processes and compliance mechanism in place to the extent, in the manner and subject to the reporting made hereinafter.
We have examined the books, papers, minute books, forms and returns filed and other records maintained by the Company
for the financial year ended on March 31, 2018 according to the provisions of:
Sl No. Name of Act, Rules, Regulation
1 The Companies Act, 2013 (the Act) and the rules made thereunder;
2 The Securities Contracts (Regulation) Act, 1956 (‘SCRA’) and the rules made thereunder;
3 The Depositories Act, 1996 and the Regulations and bye-laws framed thereunder;
4 Foreign Exchange Management Act, 1999 and the rules and regulations made thereunder;
5 The following Regulations and Guidelines prescribed under the Securities and Exchange Board of India Act,
1992 (‘SEBI Act’):-
5(a) The Securities and Exchange Board of India (Listing Obligations and Disclosure Requirements) Regulations, 2015;
5 (b) The Securities and Exchange Board of India (Substantial Acquisition of Shares and Takeovers) Regulations, 2013;
5 (c) The Securities and Exchange Board of India (Prohibition of Insider Trading) Regulations, 2015;
5 (d) The Securities and Exchange Board of India (Registrars to an Issue and Share Transfer Agents) Regulations, 1993,
regarding the Companies Act and dealing with client;
6 Employees Provident Fund and Miscellaneous Provisions Act, 1952
7 Employees State Insurance Act, 1948
8 Public Liability Insurance Act, 1991
9 Environment Protection Act, 1986
10 Water (Prevention and Control of Pollution) Act, 1974 and Water Cess Act, 1977

39
Sl No. Name of Act, Rules, Regulation
11 Air (Prevention and Control of Pollution) Act, 1981
12 Hazardous Wastes (Management, Handling and Transboundary Movement) Rules, 2008
13 Factories Act, 1948
14 Contract Labour (Regulation and Abolition) Act, 1970
15 The Industrial Employment Standing Orders Act, 1946
16 Employees Compensation Act, 1923
17 Employment Exchange (Compulsory Notification of Vacancies) Act, 1961
18 Apprenticeship Act, 1961
19 Batteries management & Handling Rules, 2001
20 Indian Stamp Act, 1999
21 Industrial Dispute Act, 1947
22 Maternity Benefits Act, 1961
23 Minimum Wages Act, 1948
24 Payment of Bonus Act, 1965
25 Payment of Gratuity Act, 1972
26 Equal Remuneration Act, 1976
27 Payment of Wages Act, 1936
We have also examined compliance with the applicable clauses of the following:
(i) Secretarial Standards issued by The Institute of Company Secretaries of India.
(ii) The Listing Agreements entered into by the Company with Stock Exchanges pursuant to the Securities and Exchange
Board of India (Listing Obligations and Disclosure Requirements) Regulations, 2015.
During the period under review the Company has substantially complied with the provisions of the Act, Rules, Regulations,
Guidelines, Standards, etc mentioned above.
We further report that the Board of Directors of the Company is duly constituted with proper balance of Executive Directors,
Non Executive Directors and Independent Directors. The changes in the composition of the Board of Directors that took
place during the period under review were carried out in compliance with the provisions of the Act.
We further report that:
Adequate notice is given to all the Directors to schedule the Board Meetings, agenda and detailed notes on agenda were
sent at least seven days in advance, and a system exists for seeking and obtaining further information and clarifications on
the agenda items before the meeting and for meaningful participation at the meeting.
All the decisions at board meetings and committee meetings are carried out with majority or unanimously as recorded in the
minutes of the meetings of the Board of Directors or the Committee of the Board, as the case may be.
We further report that there are adequate systems and processes in the Company commensurate with the size and operations
of the Company to monitor and ensure compliance with applicable laws, rules, regulations and guidelines.
We further report that during the audit period, there were no instances of:
(i) Public / Rights /debentures / sweat equity.
(ii) Redemption / buy-back of securities.

Fifty Fifth Annual Report 2017-18
40
(iii) Merger / amalgamation / reconstruction etc.
(iv) Foreign technical collaborations.
During the year Company disinvested its entire stake in Aditya Automotive Applications Pvt. Limited, company had 51%
stake and proper compliance made in this regard.
For, P.K. Singh & Associates
(Firm’s Registration No. P2002JH045700)
(Pramod Kumar Singh)
(Partner)
FCS No.: 5878
C P No.: 19115
Place: Jamshedpur
Date: April 20, 2018
This Report is to be read with our letter of even date which is annexed as “Annexure –A” and forms an integral part of this
report.
‘Annexure- A’
To,
The Members
TRF Limited
Our report of even date is to be read along with this letter.
1. Maintenance of Secretarial records is the responsibility of the management of the Company. Our Responsibility is to
express an opinion on these secretarial records based on our audit.
2. We have followed the audit practices and the processes as were appropriate to obtain reasonable assurance about the
correctness of the contests of the secretarial records. The verification is based on test basis to ensure the correct facts
are reflected in audit records. We believe that the processes and practices, we followed provide a reasonable basis for
our opinion.
3. We have not verified the correctness and the appropriateness of the financial records and Books of Accounts of the
company.
4. Wherever required we have obtained the Management Representation about the compliance of laws, rules and
regulation and happening of events etc.
5. The Compliance of the provisions of Corporate and other applicable laws, rules, regulations, standards is the
responsibility of the management. Our examination is limited to the verification procedure on test basis.
6. The Secretarial Audit Report is neither an assurance as to the future viability of the Company nor of the efficacy of
effectiveness with which the management has conducted the affairs of the Company.
For, P. K. Singh & Associates
(Firm’s Registration No. P2002JH045700)
(Pramod Kumar Singh)
(Partner)
FCS No.: 5878
C P No.: 19115
Place: Jamshedpur
Date: April 20, 2018

41
Annexure -8
Form No. MGT-9EXTRACT OF ANNUAL RETURN
As on the financial year ended on 31/03/2018 of TRF LIMITED
I. REGISTRATION AND OTHER DETAILS:
i) CIN:- L74210JH1962PLC000700
ii) Registration Date : 20-Nov-62
iii) Name of the Company TRF Limited
iv) Category / Sub-Category of the Company : Manufacturing
v) Address of the Registered office and contact
details:
11, Station Road, Burmamines, Jamshedpur- 831007
vi) Whether listed company YES
vii) Name, Address and Contact details of Reg-
istrar and Transfer Agent, if any:
TSR DARASHAW LIMITED, 20, DR. E. MOSES ROAD,
6-10, HAJI MOOSA PATRAWALA INDEL. ESTATE MAHALAXMI,
MUMBAI-400011 PH.NO.022-66568484 FAX NO. 022-66568494
II. PRINCIPAL BUSINESS ACTIVITIES OF THE COMPANY
All the business activities contributing 10 % or more of the total turnover of the company shall be stated:-
Sl.
No.
Name and Description of main products / services NIC Code of the
Product/ service
% to total turnover
of the company
1 All types of material handling machinery / equipments such
as stackers, reclaimers, stacker-cum-reclaimers, ship loaders/
unloaders, general conveyors
84283200
2 All types of Idler Rollers 84313901
3 All types of machinery/equipment for sorting, screening,
separating etc
84741001
III. PARTICULARS OF HOLDING, SUBSIDIARY AND ASSOCIATE COMPANIES -
Sl.
No.
NAME AND ADDRESS OF THE COMPANY CIN/GLN HOLDING/
SUBSIDIARY/
ASSOCIATE
%OF
SHARES
HELD
APPLICABLE
SECTION
1 York Transport Equipment (Asia) Pte Ltd - No.5,
Tuas Avenue 6, Singapore 639295
198900157E Subsidiary 100 2(87)
2 YTE Special Products Pte Ltd - No.5, Tuas Avenue
6, Singapore 639295
199405736E Subsidiary 100 2(87)
3 Rednet Pte Ltd - 122 Pioneer Road,
Singapore 639583
200104893K Subsidiary 100 2(87)
4 York Sales (Thailand) Co. Ltd- 2101 Moo 1,
Old Railway Road, Samrong Nua, Muang
Samutprakarn 10270
01 055 390 49 224 Subsidiary 100 2(87)

Fifty Fifth Annual Report 2017-18
42
Sl.
No.
NAME AND ADDRESS OF THE COMPANY CIN/GLN HOLDING/
SUBSIDIARY/
ASSOCIATE
%OF
SHARES
HELD
APPLICABLE
SECTION
5 Qingdao YTE Special Products Ltd- No.18 Huishi
Road Licang District, Qingdao, China 266100
370202230021470 Subsidiary 100 2(87)
6 York Transport Equipment (Shanghai) Ltd-
Building 2,NO 299 Yuanxi Road,Nanhui Industrial
District, Shanghai, China
310114002001887 Subsidiary 100 2(87)
7 York Transport Equipment (India) Pvt Ltd - Gat
no. 537 & 538, Badhalwadi,Vill. Navlakh Umbre,
Near Talegaon MIDC, Tal. Maval,
Dist. Pune - 410507
U60200PN2008FTC146906 Subsidiary 100 2(87)
8 York Transport Equipment Pty Limited - 13
Monterey Road, Dandenong, Victoria 3175
25 006 303 206 Subsidiary 100 2(87)
9 YTE Transport Equipment (SA) Pty Limited - 51
Todd Avenue, Villieria 0186 Pretoria, South Africa
1996/008685/07 Subsidiary 100 2(87)
10 PT York Engineering - Ruko Bukit Beruntung,
Block C-2 Batam, Indonesia
02.412.100.6-215.000 Subsidiary 100 2(87)
11 Hewitt Robins International Holdings Ltd,
Huntingdon Court, Huntingdon Way, Measham,
Derbyshire, DE127NQ,U.K
06044884 Subsidiary 100 2(87)
12 Hewitt Robins International Ltd,Huntingdon
Court, Huntingdon Way, Measham, Derbyshire,
DE127NQ,U.K
01552299 Subsidiary 100 2(87)
13 TRF Singapore Pte Limited- 6 Battery Road, #10-
01, Singapore- 049906
200718178D Subsidiary 100 2(87)
14 TRF Holdings Pte Limited- 6 Battery Road,
#10-01, Singapore- 049906
201202468E Subsidiary 100 2(87)
15 Dutch Lanka Trailer Manufactures
Limited,Nattandiya Road, Dankotuwa, Sri Lanka
PB 175 Subsidiary 100 2(87)
16 Dutch Lanka Engineering (Private) Limited,No.
575, 1st Floor, Orumix Building, Nawala Road,
Rajagiriya, Sri Lanka
PV 7006 Subsidiary 100 2(87)
17 Tata International DLT (Pvt) Limited, Gat No
281 & 284, Village Santosh Nagar (Waki), Taluka
Khed, Off Pune Nasik Road, Pune- 410501
U34200PN2005PTC152193 Joint
Venture Co
50 2(87)
18 DLT LLC Oman, PO Box 453, PC 217, Salalah, Al-
Awqdain, Sultanate of Oman
CR 1036351 Subsidiary 70 2(87)

43
IV.
Sh
are
ho
ldin
g P
att
ern
(E
qu
ity
Sh
are
Ca
pit
al
Bre
ak
up
as
pe
rce
nta
ge
of
To
tal
Eq
uit
y)
Na
me
of
the
Co
mp
an
y :
TR
F L
IMIT
ED
(I)
Ca
teg
ory
-wis
e S
ha
re H
old
ing
Cat
eg
ory
cod
e
(I)
Cat
eg
ory
of
Sh
are
ho
lde
r (I
I)N
um
be
r o
f sh
are
s h
eld
at
the
be
gin
nin
g
of
the
ye
ar
1st
Ap
ril,
20
17
“Nu
mb
er
of
Nu
mb
er
of
sha
res
he
ld a
t th
e e
nd
of
the
ye
ar
31
st M
arc
h, 2
01
8
% C
ha
ng
e
du
rin
g t
he
yea
rD
em
atP
hys
ica
lTo
tal
% o
f
Tota
l Sh
are
De
mat
Ph
ysic
al
Tota
l%
of
Tota
l Sh
are
(A)
Pro
mo
ters
(1)
Ind
ian
(a)
Ind
ivid
uals
/ H
ind
u U
ndiv
ided
Fam
ily0
00
0.00
00
00.
000.
00
(b)
Cen
tal G
over
nmen
t0
00
0.00
00
00.
000.
00
(c)
Stat
e G
over
nmen
ts(s
)0
00
0.00
00
00.
000.
00
(d)
Bod
ies
Cor
por
ate
3755
235
037
5523
534
.12
3755
235
037
5523
534
.12
0.00
(e)
Bank
s / F
inan
cial
Inst
itut
ions
00
00.
000
00
0.00
0.00
(f)
Any
Oth
er (s
pec
ify)
00
00.
000
00
0.00
0.00
- Tru
st0
00
0.00
00
00.
000.
00
Su
b-T
ota
l (A
) (1
)3
75
52
35
03
75
52
35
34
.12
37
55
23
50
37
55
23
53
4.1
20
.00
(2)
Fore
ign
(a)
NRI
s - I
ndiv
idua
ls0
00
0.00
00
00.
000.
00
(b)
Oth
er In
div
idua
ls0
00
0.00
00
00.
000.
00
(c)
Bod
ies
Cor
por
ate
00
00.
000
00
0.00
0.00
(d)
Bank
s / F
inan
cial
Inst
itut
ions
00
00.
000
00
0.00
0.00
(e)
Qua
lified
For
eign
Inve
stor
00
00.
000
00
0.00
0.00
(f)
Any
Oth
er (s
pec
ify)
00
00.
000
00
0.00
0.00
Su
b-T
ota
l (A
) (2
)0
00
0.0
00
00
0.0
00
.00
Tota
l Sh
are
ho
ldin
g o
f P
rom
ote
r (A
) = (A
)(1
)+(A
)(2
)3
75
52
35
03
75
52
35
34
.12
37
55
23
50
37
55
23
53
4.1
20
.00

Fifty Fifth Annual Report 2017-18
44
Cat
eg
ory
cod
e
(I)
Cat
eg
ory
of
Sh
are
ho
lde
r (I
I)N
um
be
r o
f sh
are
s h
eld
at
the
be
gin
nin
g
of
the
ye
ar
1st
Ap
ril,
20
17
“Nu
mb
er
of
Nu
mb
er
of
sha
res
he
ld a
t th
e e
nd
of
the
ye
ar
31
st M
arc
h, 2
01
8
% C
ha
ng
e
du
rin
g t
he
yea
rD
em
atP
hys
ica
lTo
tal
% o
f
Tota
l Sh
are
De
mat
Ph
ysic
al
Tota
l%
of
Tota
l Sh
are
(B)
Pu
bli
c S
ha
reh
old
ing
(1)
Inst
itu
tio
ns
(a)
Mut
ual F
und
s18
580
100
1868
00.
1710
022
532
50.
00-0
.17
(b)
Bank
s / F
inan
cial
Inst
itut
ions
1956
225
1522
077
0.20
3516
917
1636
885
0.34
0.13
(c)
Cen
tal G
over
nmen
t0
00
0.00
00
00.
000.
00
(d)
Stat
e G
over
nmen
ts(s
)0
00
0.00
00
00.
000.
00
(e)
Vent
ure
Cap
ital
Fun
ds
00
00.
000
00
0.00
0.00
(f)
Insu
ranc
e C
omp
anie
s38
3514
939
840.
0438
3514
939
840.
040.
00
(g)
Fore
ign
Inst
itut
iona
l Inv
esto
rs0
00
0.00
00
00.
000.
00
(h)
Fore
ign
Vent
ure
Cap
ital
Inve
stor
s0
00
0.00
00
00.
000.
00
(i)A
ny O
ther
(sp
ecify
)0
00
0.00
00
00.
000.
00
- OC
Bs /
Fore
ign
Com
pan
ies
021
7500
2175
001.
980
2175
0021
7500
1.98
0.00
Su
b-T
ota
l (B
) (1
)4
19
77
22
02
64
26
22
41
2.3
83
91
04
21
95
90
25
86
94
2.3
6-0
.02
(2)
No
n-I
nst
itu
tio
ns
(a)
Bod
ies
Cor
por
ate
iIn
dia
n10
9303
127
8510
9581
69.
9611
2410
126
8111
2678
210
.24
0.28
iiO
vers
eas
00
00.
000
00
0.00
0.00
(b)
Ind
ivid
uals
-
iIn
div
idua
l sha
reho
lder
s ho
ldin
g no
min
al s
hare
cap
ital
upto
Rs.
1 la
kh
4028
913
4506
0244
7951
540
.71
4178
524
3556
4145
3416
541
.20
0.50
iiIn
div
idua
l sha
reho
lder
s ho
ldin
g no
min
al s
hare
cap
ital
in e
xces
s of
Rs.
1 la
kh
1402
996
014
0299
612
.75
1220
318
012
2031
811
.09
-1.6
6
(c)
Any
Oth
er (S
pec
ify)
-IEPF
acc
ount
00
00.
0085
537
085
537
0.78
0.78
-Dire
ctor
s &
rela
tive
s0
00
0.00
100
100.
000.
00
- Tru
st20
00
200
0.00
476
047
60.
000.
00
-BC
NBF
C84
090
8409
0.08
2319
50
2319
50.
210.
13
Su
b-t
ota
l (B
) (2
)6
53
35
49
45
33
87
69
86
93
66
3.4
96
63
21
61
35
83
22
69
90
48
36
3.5
20
.03
Tota
l Pu
bli
c S
ha
reh
old
ing
(B) =
(B)(
1)+
(B)(
2)
65
75
52
66
73
65
17
24
91
77
65
.88
66
71
26
55
77
91
27
24
91
77
65
.88
0.0
0
TOTA
L (A
)+(B
)1
03
30
76
16
73
65
11
10
04
41
21
00
.00
10
42
65
00
57
79
12
11
00
44
12
10
0.0
00
.00
(C)
Shar
es h
eld
by
Cus
tod
ians
for G
DRs
& A
DRs
00
00.
000
00
0.00
0.00
1Pr
omot
er a
nd P
rom
oter
Gro
up0
00
0.00
00
00.
000.
00
2Pu
blic
00
00.
000
00
0.00
0.00
GR
AN
D T
OTA
L (A
)+(B
)+(C
)1
03
30
76
16
73
65
11
10
04
41
21
00
.00
10
42
65
00
57
79
12
11
00
44
12
10
0.0
00
.00

45Sh
are
ho
ldin
g P
att
ern
(E
qu
ity
Sh
are
Ca
pit
al
Bre
ak
up
as
pe
rce
nta
ge
of
To
tal
Eq
uit
yN
am
e o
f th
e C
om
pa
ny
: T
RF
LIM
ITE
D
(II)
Sh
are
ho
ldin
g o
f P
rom
ote
rs
Sr.
No
.
Sh
are
ho
lde
r’s
Na
me
Sh
are
ho
ldin
g a
t th
e b
eg
inn
ing
of
the
ye
ar
1st
Ap
ril,
20
17
Sh
are
ho
ldin
g a
t th
e e
nd
of
the
ye
ar
31
st M
arc
h,
20
18
% C
ha
ng
e
in s
ha
re
ho
ldin
g
du
rin
g
the
ye
ar
No
. o
f
Sh
are
s
% o
f to
tal
Sh
are
s o
f th
e
Co
mp
an
y
% o
f S
ha
res
Ple
dg
ed
/
en
cu
mb
ere
d t
o
tota
l sh
are
s
No
. o
f
Sh
are
s
% o
f to
tal
Sh
are
s o
f th
e
Co
mp
an
y
% o
f S
ha
res
Ple
dg
ed
/
en
cu
mb
ere
d t
o
tota
l sh
are
s
1Ta
ta S
tee
l Lim
ite
d3
75
32
75
34
.11
0.0
03
75
32
75
34
.11
0.0
00
.00
2TA
TA IN
DU
ST
RIE
S L
IMIT
ED
19
60
0.0
20
.00
19
60
0.0
20
.00
0.0
0
TO
TA
L3
75
52
35
34
.12
0.0
03
75
52
35
34
.12
0.0
00
.00
(III
) C
ha
ng
e i
n P
rom
ote
rs’ S
ha
reh
old
ing
(p
lea
se s
pe
cif
y,
if t
he
re i
s n
o c
ha
ng
e)
Shar
eho
ldin
g a
t th
e
beg
inn
ing
of t
he
year
01
.04
.20
17
Cu
mm
ula
tive
Sh
areh
old
ing
du
rin
g t
he
year
Seri
al
no
PAN
Folio
/Ben
efici
ary
Acc
ou
nt
no
Nam
e o
f th
e
Shar
eHo
lder
Dat
eR
easo
nN
o.o
f Sh
ares
% o
f to
tal
Shar
es o
f th
e
com
pan
y
No
.of S
har
es%
of t
ota
l
Shar
es o
f th
e
com
pan
y
1.1
AA
AC
T28
03
MIN
30
03
60
20
01
21
28
Tata
Ste
el L
imit
ed0
1-A
pr-
20
17
At
the
beg
inn
ing
of t
he
year
18
7,5
86
1.7
01
87
,58
61
.70
1.1
31
-Mar
-20
18
At
the
end
of t
he
year
00
.00
18
7,5
86
1.7
0
1.2
IN3
00
36
02
23
88
15
9Ta
ta S
teel
Lim
ited
01
-Ap
r-2
01
7A
t th
e b
egin
nin
g o
f th
e ye
ar3
,56
5,6
89
32
.40
3,5
65
,68
93
2.4
0
1.2
31
-Mar
-20
18
At
the
end
of t
he
year
00
.00
3,5
65
,68
93
2.4
0
1To
tal f
or
AA
AC
T28
03
M
Pan
To
tal :
3,7
53
,27
53
4.1
13
,75
3,2
75
34
.11
2.1
AA
AC
T40
58
LIN
30
00
11
10
18
76
37
Tat
a In
du
stri
es
Lim
ited
01
-Ap
r-2
01
7A
t th
e b
egin
nin
g o
f th
e ye
ar1
,96
00
.02
1,9
60
0.0
2
2.1
31
-Mar
-20
18
At
the
end
of t
he
year
00
.00
1,9
60
0.0
2
2To
tal f
or
AA
AC
T40
58
L
Pan
To
tal :
1,9
60
0.0
21
,96
00
.02

Fifty Fifth Annual Report 2017-18
46 (IV
) S
ha
reh
old
ing
Pa
tte
rn o
f to
p t
en
Sh
are
ho
lde
rs (
oth
er
tha
n D
ire
cto
rs,
Pro
mo
ters
an
d H
old
ers
of
GD
Rs
an
d A
DR
s) :
Sh
are
ho
ldin
g a
t th
e
be
gin
nin
g o
f th
e y
ea
r
01
.04
.20
17
Cu
mm
ula
tive
Sh
are
ho
ldin
g d
uri
ng
the
ye
ar
Se
ria
l
no
PAN
Foli
o/B
en
efi
cia
ry
Acc
ou
nt
no
Na
me
of
the
Sh
are
Ho
lde
rD
ate
Re
aso
nN
o.o
f
Sh
are
s
% o
f to
tal
Sh
are
s o
f th
e
com
pa
ny
No
.of
Sh
are
s
% o
f to
tal
Sh
are
s o
f th
e
com
pa
ny
1.1
AA
BP
L961
8GIN
3001
5910
0263
42D
ilip
kum
ar L
akh
i01
-Ap
r-20
17A
t th
e b
egin
nin
g o
f th
e ye
ar24
9,22
72.
2624
9,22
72.
26
31-M
ar-2
018
At
the
end
of t
he
year
00.
0024
9,22
72.
26
1To
tal f
or
AA
BP
L9
61
8G
Pa
n T
ota
l :2
49
,22
72
.26
24
9,2
27
2.2
6
2.1
TRL0
0003
52TR
L000
0352
Litt
on
Sys
tem
s In
c01
-Ap
r-20
17A
t th
e b
egin
nin
g o
f th
e ye
ar21
7,50
01.
9821
7,50
01.
98
2.1
31-M
ar-2
018
At
the
end
of t
he
year
00.
0021
7,50
01.
98
2To
tal f
or
TR
L0
00
03
52
Pa
n T
ota
l :2
17
,50
01
.98
21
7,5
00
1.9
8
3.1
AA
HP
S642
3N12
0445
0000
3215
95N
imis
h C
han
du
lal S
hah
01-A
pr-
2017
At
the
beg
inn
ing
of t
he
year
00.
000
0.00
3.1
27-O
ct-2
017
Incr
ease
114,
000
1.04
114,
000
1.04
3.1
24-N
ov-
2017
Dec
reas
e-5
000.
0011
3,50
01.
03
3.1
31-M
ar-2
018
At
the
end
of t
he
year
00.
0011
3,50
01.
03
3To
tal f
or
AA
HP
S6
42
3N
Pa
n T
ota
l :0
0.0
01
13
,50
01
.03
4.1
AA
AC
J888
4A12
0445
0000
0003
33Ja
mis
h In
vest
men
t P
vt. L
td.
01-A
pr-
2017
At
the
beg
inn
ing
of t
he
year
106,
000
0.96
106,
000
0.96
4.1
31-M
ar-2
018
At
the
end
of t
he
year
00.
0010
6,00
00.
96
4To
tal f
or
AA
AC
J88
84
A
Pa
n T
ota
l :1
06
,00
00
.96
10
6,0
00
0.9
6
5.1
AA
AC
O07
75B
1302
3400
0039
7331
O.P
.J Fi
nanc
ial S
ervi
ces
(P) L
td.
01-A
pr-
2017
At
the
beg
inn
ing
of t
he
year
50,0
000.
4550
,000
0.45
5.1
26-M
ay-2
017
Incr
ease
13,2
130.
1263
,213
0.57
5.1
02-J
un
-201
7In
crea
se3,
531
0.03
66,7
440.
61
5.1
09-J
un
-201
7In
crea
se4,
000
0.04
70,7
440.
64
5.1
16-J
un
-201
7D
ecre
ase
-744
-0.0
170
,000
0.64
5.1
04-A
ug
-201
7In
crea
se5,
000
0.05
75,0
000.
68
5.1
17-N
ov-
2017
Incr
ease
25,0
000.
2310
0,00
00.
91
5.1
31-M
ar-2
018
At
the
end
of t
he
year
00.
0010
0,00
00.
91
5To
tal f
or
AA
AC
O0
77
5B
Pa
n T
ota
l :5
0,0
00
0.4
51
00
,00
00
.91

47
Sh
are
ho
ldin
g a
t th
e
be
gin
nin
g o
f th
e y
ea
r
01
.04
.20
17
Cu
mm
ula
tive
Sh
are
ho
ldin
g d
uri
ng
the
ye
ar
Se
ria
l
no
PAN
Foli
o/B
en
efi
cia
ry
Acc
ou
nt
no
Na
me
of
the
Sh
are
Ho
lde
rD
ate
Re
aso
nN
o.o
f
Sh
are
s
% o
f to
tal
Sh
are
s o
f th
e
com
pa
ny
No
.of
Sh
are
s
% o
f to
tal
Sh
are
s o
f th
e
com
pa
ny
6.1
AER
PA44
82K
1302
3400
0036
3194
An
il Ja
in01
-Ap
r-20
17A
t th
e b
egin
nin
g o
f th
e ye
ar10
0,00
00.
9110
0,00
00.
91
6.1
31-M
ar-2
018
At
the
end
of t
he
year
00.
0010
0,00
00.
91
6To
tal f
or
AE
RP
A4
48
2K
Pa
n T
ota
l :1
00
,00
00
.91
10
0,0
00
0.9
1
7.1
AA
AC
A70
11Q
1203
3200
0771
9863
An
gel
Fin
cap
Pri
vate
Lim
ited
01-A
pr-
2017
At
the
beg
inn
ing
of t
he
year
8,97
60.
088,
976
0.08
7.1
07-A
pr-
2017
Dec
reas
e-2
000.
008,
776
0.08
7.1
14-A
pr-
2017
Dec
reas
e-7
12-0
.01
8,06
40.
07
7.1
21-A
pr-
2017
Dec
reas
e-3
000.
007,
764
0.07
7.1
05-M
ay-2
017
Dec
reas
e-9
37-0
.01
6,82
70.
06
7.1
12-M
ay-2
017
Dec
reas
e-2
,250
-0.0
24,
577
0.04
7.1
19-M
ay-2
017
Incr
ease
130.
004,
590
0.04
7.1
26-M
ay-2
017
Incr
ease
570.
004,
647
0.04
7.1
02-J
un
-201
7In
crea
se11
50.
004,
762
0.04
7.1
09-J
un
-201
7In
crea
se15
0.00
4,77
70.
04
7.1
16-J
un
-201
7In
crea
se10
0.00
4,78
70.
04
7.1
30-J
un
-201
7D
ecre
ase
-25
0.00
4,76
20.
04
7.1
07-J
ul-
2017
Dec
reas
e-2
00.
004,
742
0.04
7.1
14-J
ul-
2017
Dec
reas
e-8
50.
004,
657
0.04
7.1
21-J
ul-
2017
Dec
reas
e-1
140.
004,
543
0.04
7.1
27-J
ul-
2017
Incr
ease
2,15
70.
026,
700
0.06
7.1
04-A
ug
-201
7In
crea
se2,
001
0.02
8,70
10.
08
7.1
11-A
ug
-201
7In
crea
se7,
651
0.07
16,3
520.
15
7.1
18-A
ug
-201
7In
crea
se2,
005
0.02
18,3
570.
17
7.1
25-A
ug
-201
7D
ecre
ase
-250
0.00
18,1
070.
16
7.1
01-S
ep-2
017
Dec
reas
e-4
,294
-0.0
413
,813
0.13
7.1
08-S
ep-2
017
Dec
reas
e-3
860.
0013
,427
0.12

Fifty Fifth Annual Report 2017-18
48
Sh
are
ho
ldin
g a
t th
e
be
gin
nin
g o
f th
e y
ea
r
01
.04
.20
17
Cu
mm
ula
tive
Sh
are
ho
ldin
g d
uri
ng
the
ye
ar
Se
ria
l
no
PAN
Foli
o/B
en
efi
cia
ry
Acc
ou
nt
no
Na
me
of
the
Sh
are
Ho
lde
rD
ate
Re
aso
nN
o.o
f
Sh
are
s
% o
f to
tal
Sh
are
s o
f th
e
com
pa
ny
No
.of
Sh
are
s
% o
f to
tal
Sh
are
s o
f th
e
com
pa
ny
7.1
15-S
ep-2
017
Dec
reas
e-2
,108
-0.0
211
,319
0.10
7.1
22-S
ep-2
017
Dec
reas
e-3
,090
-0.0
38,
229
0.07
7.1
29-S
ep-2
017
Incr
ease
87,7
700.
8095
,999
0.87
7.1
06-O
ct-2
017
Dec
reas
e-1
,750
-0.0
294
,249
0.86
7.1
13-O
ct-2
017
Incr
ease
14,0
000.
1310
8,24
90.
98
7.1
27-O
ct-2
017
Incr
ease
100.
0010
8,25
90.
98
7.1
03-N
ov-
2017
Incr
ease
600.
0010
8,31
90.
98
7.1
17-N
ov-
2017
Dec
reas
e-2
00.
0010
8,29
90.
98
7.1
24-N
ov-
2017
Incr
ease
1,99
90.
0211
0,29
81.
00
7.1
01-D
ec-2
017
Dec
reas
e-2
,009
-0.0
210
8,28
90.
98
7.1
08-D
ec-2
017
Incr
ease
2,84
30.
0311
1,13
21.
01
7.1
15-D
ec-2
017
Incr
ease
134
0.00
111,
266
1.01
7.1
22-D
ec-2
017
Dec
reas
e-8
29-0
.01
110,
437
1.00
7.1
29-D
ec-2
017
Incr
ease
2,95
00.
0311
3,38
71.
03
7.1
05-J
an-2
018
Dec
reas
e-2
,525
-0.0
211
0,86
21.
01
7.1
12-J
an-2
018
Incr
ease
983
0.01
111,
845
1.02
7.1
19-J
an-2
018
Dec
reas
e-9
68-0
.01
110,
877
1.01
7.1
26-J
an-2
018
Dec
reas
e-6
0.00
110,
871
1.01
7.1
02-F
eb-2
018
Dec
reas
e-1
,059
-0.0
110
9,81
21.
00
7.1
09-F
eb-2
018
Dec
reas
e-4
,655
-0.0
410
5,15
70.
96
7.1
23-F
eb-2
018
Dec
reas
e-9
,486
-0.0
995
,671
0.87
7.1
09-M
ar-2
018
Dec
reas
e-8
37-0
.01
94,8
340.
86
7.1
16-M
ar-2
018
Incr
ease
359
0.00
95,1
930.
87
7.1
30-M
ar-2
018
Dec
reas
e-2
000.
0094
,993
0.86
7.1
31-M
ar-2
018
At
the
end
of t
he
year
00.
0094
,993
0.86
7To
tal f
or
AA
AC
A7
01
1Q
Pa
n T
ota
l :8
,97
60
.08
94
,99
30
.86

49
Sh
are
ho
ldin
g a
t th
e
be
gin
nin
g o
f th
e y
ea
r
01
.04
.20
17
Cu
mm
ula
tive
Sh
are
ho
ldin
g d
uri
ng
the
ye
ar
Se
ria
l
no
PAN
Foli
o/B
en
efi
cia
ry
Acc
ou
nt
no
Na
me
of
the
Sh
are
Ho
lde
rD
ate
Re
aso
nN
o.o
f
Sh
are
s
% o
f to
tal
Sh
are
s o
f th
e
com
pa
ny
No
.of
Sh
are
s
% o
f to
tal
Sh
are
s o
f th
e
com
pa
ny
8.1
IN30
0708
1065
6671
Inve
sto
r Ed
uca
tio
n A
nd
Pro
tect
ion
Fu
nd
Au
tho
rity
Min
istr
y O
f Co
rpo
rate
Aff
airs
01-A
pr-
2017
At
the
beg
inn
ing
of t
he
year
00.
000
0.00
8.1
01-D
ec-2
017
Incr
ease
570
0.01
570
0.01
8.1
08-D
ec-2
017
Incr
ease
84,9
450.
7785
,515
0.78
8.1
15-D
ec-2
017
Incr
ease
220.
0085
,537
0.78
8.1
31-M
ar-2
018
At
the
end
of t
he
year
00.
0085
,537
0.78
8To
tal f
or
EX
EM
PT
CA
TG
Pa
n T
ota
l :0
0.0
08
5,5
37
0.7
8
9.1
AA
OFP
4817
C13
0142
0000
0588
26Pu
nam
chan
d R
amn
aray
an
Rat
hi
01-A
pr-
2017
At
the
beg
inn
ing
of t
he
year
55,8
000.
5155
,800
0.51
9.1
31-M
ar-2
018
At
the
end
of t
he
year
00.
0055
,800
0.51
9To
tal f
or
AA
OF
P4
81
7C
Pa
n T
ota
l :5
5,8
00
0.5
15
5,8
00
0.5
1
10.1
AA
NP
U43
03R
1201
0600
0169
8362
Ind
erp
al S
ing
h U
ber
oi
01-A
pr-
2017
At
the
beg
inn
ing
of t
he
year
51,8
780.
4751
,878
0.47
10.1
31-M
ar-2
018
At
the
end
of t
he
year
00.
0051
,878
0.47
10To
tal f
or
AA
NP
U4
30
3R
Pa
n T
ota
l :5
1,8
78
0.4
75
1,8
78
0.4
7
11.1
AJI
PB
3294
JIN
3037
1910
9611
31B
alak
um
ar K
anar
ath
Paya
ttiy
ath
01-A
pr-
2017
At
the
beg
inn
ing
of t
he
year
00.
000
0.00
11.1
15-D
ec-2
017
Incr
ease
10,0
000.
0910
,000
0.09
11.1
19-J
an-2
018
Incr
ease
20,0
000.
1830
,000
0.27
11.1
09-F
eb-2
018
Incr
ease
20,0
000.
1850
,000
0.45
11.1
31-M
ar-2
018
At
the
end
of t
he
year
00.
0050
,000
0.45
11To
tal f
or
AJI
PB
32
94
J
Pa
n T
ota
l :0
0.0
05
0,0
00
0.4
5
12.1
AA
NP
U43
01P
1201
0600
0170
6239
Surj
it K
aur
Ub
ero
i01
-Ap
r-20
17A
t th
e b
egin
nin
g o
f th
e ye
ar56
,370
0.51
56,3
700.
51
12.1
16-J
un
-201
7D
ecre
ase
-10,
000
-0.0
946
,370
0.42
12.1
31-M
ar-2
018
At
the
end
of t
he
year
00.
0046
,370
0.42
12To
tal f
or
AA
NP
U4
30
1P
Pa
n T
ota
l :5
6,3
70
0.5
14
6,3
70
0.4
2

Fifty Fifth Annual Report 2017-18
50
TRF LIMITED - Top 10
Sr.
no.
Name No of shares as
on 31.03.2017
No of
shares as on
31.03.2018
Net Changes % to
Capital
1 Dilipkumar Lakhi 249,227 249,227 0 0.00
2 Litton Systems Inc 217,500 217,500 0 0.00
3 Nimish Chandulal Shah 114,000 113,500 -500 0.00
4 Jamish Investment Pvt. Ltd. 106,000 106,000 0 0.00
5 O.P.J Financial Services (P) Ltd. 50,000 100,000 50000 0.45
6 Anil Jain 100,000 100,000 0 0.00
7 Angel Fincap Private Limited 8,976 94,993 86017 0.78
8Investor Education And Protection Fund
Authority Ministry Of Corporate Affairs0 85,537 85537 0.78
9 Punamchand Ramnarayan Rathi 55,800 55,800 0 0.00
10 Inderpal Singh Uberoi 51,878 51,878 0 0.00
11 Balakumar Kanarath Payattiyath 0 50,000 50000 0.45
12 Surjit Kaur Uberoi 56,370 46,370 -10000 -0.09

51(V)
Sh
are
ho
ldin
g o
f D
ire
cto
rs a
nd
Ke
y M
an
ag
eri
al
Pe
rso
nn
el
Sh
are
ho
ldin
g a
t th
e
be
gin
nin
g o
f th
e y
ea
r
01
.04
.20
17
Cu
mm
ula
tiv
e
Sh
are
ho
ldin
g d
uri
ng
the
ye
ar
Se
ria
l
no
PA
NF
oli
o/B
en
efi
cia
ry
Acc
ou
nt
no
Na
me
of
the
Sh
are
Ho
lde
r
Da
teR
ea
son
No
.of
Sh
are
s
% o
f to
tal
Sh
are
s o
f th
e
com
pa
ny
No
.of
Sh
are
s
% o
f to
tal
Sh
are
s o
f th
e
com
pa
ny
1.1
AN
DP
S0
85
2Q
IN3
00
12
61
10
92
34
3 R
an
ave
er
Sin
ha
01
-Ap
r-2
01
7A
t th
e b
eg
inn
ing
of
the
ye
ar
10
0.0
01
00
.00
1.1
31
-Ma
r-2
01
8A
t th
e e
nd
of
the
ye
ar
00
.00
10
0.0
0
1To
tal f
or
AN
DP
S0
85
2Q
Pa
n T
ota
l :1
00
.00
10
0.0
0
DE
TAIL
S O
F K
EY
MA
NA
GE
RIA
L P
ER
SO
NN
EL
1.1
P. S
. Re
dd
y0
1-A
pr-
20
17
At
the
be
gin
nin
g o
f th
e y
ea
r0
0.0
00
0.0
0
1.1
31
-Ma
r-2
01
8A
t th
e e
nd
of
the
ye
ar
00
.00
00
.00
1To
tal
Pa
n T
ota
l :0
0.0
00
0.0
0
2.1
Sa
nja
y R
ajo
ria
01
-Ap
r-2
01
7A
t th
e b
eg
inn
ing
of
the
ye
ar
00
.00
00
.00
2.1
31
-Ma
r-2
01
8A
t th
e e
nd
of
the
ye
ar
00
.00
00
.00
2To
tal
Pa
n T
ota
l :0
0.0
00
0.0
0
3.1
Su
bh
ash
ish
Da
tta
01
-Ap
r-2
01
7A
t th
e b
eg
inn
ing
of
the
ye
ar
00
.00
00
.00
3.1
3
1-M
ar-
20
18
At
the
en
d o
f th
e y
ea
r0
0.0
00
0.0
0
3To
tal
Pa
n T
ota
l :0
0.0
00
0.0
0
4.1
K. S
ujit
Mat
ha
i
Mat
he
w
01
-Ap
r-2
01
7A
t th
e b
eg
inn
ing
of
the
ye
ar
00
.00
00
.00
4.1
31
-Ma
r-2
01
8A
t th
e e
nd
of
the
ye
ar
00
.00
00
.00
4 P
an
To
tal :
00
.00
00
.00
5.1
Taru
n K
r S
riv
ast
ava
01
-Ap
r-2
01
7A
t th
e b
eg
inn
ing
of
the
ye
ar
00
.00
00
.00
5.1
31
-Ma
r-2
01
8A
t th
e e
nd
of
the
ye
ar
00
.00
00
.00
5To
tal
Pa
n T
ota
l :0
0.0
00
0.0
0

Fifty Fifth Annual Report 2017-18
52
VI. INDEBTEDNESS
Indebtedness of the Company including interest outstanding/accrued but not due for payment
Rs in lakhs
Secured Loans
excluding
deposits
Unsecured
Loans
Deposits Total
Indebtness
Indebtedness at the beginning of the financial year
i) Principal Amount 38,100.94 0 0 38,100.94
ii) Interest due but not paid 112.85 0 112.85
iii) Interest accrued but not due 39.88 0 0 39.88
Total (i+ii+iii) 38,253.67 - - 38,253.67
Change in Indebtedness during the financial year
Addition 12,812.29 - 0 12,812.29
Reduction 13,836.90 - 0 13,836.90
Net Change (1,024.61) - 0 (1,024.61)
Indebtedness at the end of the financial year
i) Principal Amount 37,105.77 - 37,105.77
ii) Interest due but not paid 120.80 0 120.80
iii) Interest accrued but not due 2.49 0 2.49
Total (i+ii+iii) 37,229.06 - 37,229.06

53
VI. REMUNERATION OF DIRECTORS AND KEY MANAGERIAL PERSONNEL
A. Remuneration to Managing Director, Whole-time Directors and/or Manager:
Sl.
no.
Particulars of Remuneration Total amount
Rs in Lakhs
Total amount
Rs in Lakhs
Name of MD: Mr P. S. Reddy Mr Sanjay Rajoria
1 Gross salary
(a) Salary as per provisions 60.47 9.98
contained in section 17(1)
of the Income Tax Act,1961
(b) Value of perquisites under 0 0
section 17(2) of the Income
Tax Act, 1961
(c ) Profits in lieu of salary under 0 0
section 17(3) of the Income
Tax Act, 1961
2 Stock Option 0.00 0.00
3 Sweat Equity 0.00 0.00
4 Commission
- as % of profit 0.00 0.00
performance linked profit 0.00 0.00
5 Others, please specify 0 0
Total (A) 60.47 9.98
Ceiling as per the Act 120.00 120.00

Fifty Fifth Annual Report 2017-18
54 B.
Re
mu
ne
rati
on
to
oth
er
dir
ec
tors
:
Am
t in
Rs
Lak
hs
Sl.
no
.P
art
icu
lars
of
Re
mu
ne
rati
on
Na
me
of
Dir
ect
or
Tota
l
Ind
ep
en
de
nt
Dir
ec
tors
Mr.
RA
NA
VE
ER
SIN
HA
Mr.
DIP
AN
KA
R
CH
AT
TE
RJI
Mr.
SA
BY
AS
AC
HI
HA
JAR
A
Ms.
NE
ER
A
SA
GG
I
Fe
e f
or
att
en
din
g b
oa
rd/
com
mit
tee
me
eti
ng
s
5.7
58
.25
7.0
08
.50
29
.50
Co
mm
issi
on
00
00
0
Oth
ers
, ple
ase
sp
eci
fy0
00
00
Tota
l (1
)5
.75
8.2
57
.00
8.5
02
9.5
0
Oth
er
No
n-E
xe
cu
tiv
e D
ire
cto
rs *
Mr
Sa
nd
ip B
isw
as
Mr
Dib
ye
nd
u B
ose
Mr
Ra
jesh
Ra
nja
n J
ha
Fe
e f
or
att
en
din
g b
oa
rd /
com
mit
tee
me
eti
ng
s
0.0
00
.00
00
.00
Co
mm
issi
on
Oth
ers
, ple
ase
sp
eci
fy
Tota
l (2
)0
.00
0.0
00
.00
0.0
0
Tota
l (B
)=(1
+2
)2
9.5
0
Tota
l Ma
na
ge
ria
l Re
mu
ne
rati
on
70
.45
Ove
rall
Ce
ilin
g a
s p
er
the
Act
12
0
* N
o s
itti
ng
fe
e is
pa
id t
o t
ho
se d
ire
cto
rs w
ho
are
in w
ho
le t
ime
em
plo
yme
nt
wit
h T
ata
Ste
el G
rou
p C
om
pa
nie
s

55
C. REMUNERATION TO KEY MANAGERIAL PERSONNEL OTHER THAN MD/MANAGER/WTD
Amt In Rs lakhs
Sl. no. Particulars of Remuneration Key Managerial Personnel Total
Mr Subhashish
Datta
CFO
upto 31.01.18
Mr K. Sujit
Mathai Mathew
CFO
w.e.f 01.02.18
Mr. Tarun
Srivastava
Company
Secretary
1 Gross salary
(a) Salary as per provisions contained in
section 17(1) of the Income-tax Act,1961
41.2 8.42 14.92 64.54
(b) Value of perquisites u/s 17(2) Income-tax
Act,1961
0.15 0 1.37 1.52
(c) Profits in lieu of salary under section 17(3)
Income- tax Act, 1961
0 0 0 0
2 Stock Option 0 0 0 0
3 Sweat Equity 0 0 0 0
4 Commission
- as % of profit 0 0 0 0
- others, specify… 0 0 0 0
5 Others, please specify
Total 41.20 8.42 16.29 65.91
VII. PENALTIES / PUNISHMENT/ COMPOUNDING OF OFFENCES:
TYPE
Section of
the
Companies
Act
Brief
Description
Details of Penalty/
Punishment/
Compounding/
Fees imposed
Authority[RD/
NCLT/COURT]
Appeal made,
if any (give
details)
A. COMPANY
Penalty NA NA NA NA N.A
Punishment NA N.A N.A N.A N.A
Compounding NA N.A N.A N.A N.A
B. DIRECTORS
Penalty NA N.A N.A N.A N.A
Punishment NA N.A N.A N.A N.A
Compounding NA N.A N.A N.A N.A
C OTHER OFFICERS IN DEFAULT
Penalty NA N.A N.A N.A N.A
Punishment NA N.A N.A N.A N.A
Compounding NA N.A N.A N.A N.A
Remarks : No proceedings under the Companies Act, 1956 or Companies Act, 2013 has been initiated against the Company
during the year under review.

Fifty Fifth Annual Report 2017-18
56
Annexure- 9
Details of Loans, Investments and Corporate Guarantees as on 31st March 2018
Loans : Nil
Investments Rs. In lakhs
a) Subsidiaries
i) TRF Singapore Pte. Ltd., Singapore 18,126.82
5,02,88,324 shares of SGD 1 each
ii) TRF Holdings Pte. Ltd., Singapore *
1 share of SGD 1 each
b) Other Investments
i) HDFC Bank Ltd - 2,500 shares of Rs. 2 each 0.05
ii) Nicco Jubilee Park Ltd - 30,000 shares of Rs. 10 each 3.00
Less: Provision for diminution of Rs 3.00 lakhs
* represent values below Rs. 1,000

57
Annexure- 10
Details regarding Conservation of Energy, Technology absorption, Expenditure on R&D, Foreign exchange earnings
and outgo as per Rule 8(3) of Companies (Accounts) Rules, 2014
A. Conservation of Energy: 2017-18
i) Steps taken or Impact on conservation of energy Design optimization in selection of motor for equipment
& project.
Use of energy efficient welding machine at our workshop.
Mandatory switching off the lights, fans, ACs etc at non
working place.
ii) Steps taken by the company for utilising alternative
sources of energy
Exploring use of solar energy in various material handling
equipment & system.
iii) Capital investment on energy conservation
equipments
NIL
B. Technology absorption :
i) Efforts made towards technology absorption Jointly developing Flip Flow Screen with HRIL to meet the
marketing requirement.
ii) Benefits derived (like product Improvement,
cost reduction, product development or import
substitution)
We are developing linear motion screen (3100 mm x
8500mm) for Tata Steel, Kalinganagar.
Successful commissioning of Travelling Plough Feeder
for coke wharf which is performing well since its
commissioning.
Developed Load Haul Dumper (LHD) for underground
mines for Tata Steel, Jamadoba.
Developed Side Discharge Loader (SDL) with CRD for Tata
Steel, Jamadoba.
iii) In case of imported technology (imported during
the last three years reckoned from the beginning of
the financial year)-
N.A
a) details of technology imported
b) the year of import
c) whether the technology has been fully absorbed
d) If not fully absorbed, areas where absorption has
not taken place, and the reasons thereof; and
iv) Expenditure incurred on research and development Rs.104.81 lakhs
C. Foreign Exchange Earnings and Outgo:
Inflows during the year – Rs.20.11 lakhs
Outflows during the year- Rs.421.50 lakhs

Fifty Fifth Annual Report 2017-18
58
Corporate Governance Report for the year 2017-18(As required under Part C of Schedule V of the SEBI (Listing Obligations and Disclosure Requirements) Regulations, 2015
(Listing Regulations)
1. A brief statement on Company’s philosophy on Code of Governance
The Company has set itself the objective of achieving technological leadership in its area of business. As a part of its
growth strategy, the Company is adopting the ‘best practices’ that are followed in the area of Corporate Governance
across various geographies and emphasizes the need for full transparency and accountability in all its transactions
in order to protect the interests of its stakeholders. The Board considers itself as a Trustee of its Shareholders and
acknowledges its responsibilities towards them for creation and safeguarding their wealth.
2. Board of Directors
The Company had a non-executive Chairman during the year under review and the number of Independent Directors
(4) is 50% of the total number of directors (8 as on 31.03.2018). The Company also has a women director on its Board.
The number of non-executive Directors (7) is more than that required under Regulation 17. [Regulation 17 mandates
that not less than fifty per cent of the board of directors shall comprise of non-executive director]. The independent
directors meet the criteria of independence as required under the Companies Act, 2013 and Regulation 16 (1) (b) of
Listing Regulations as on 31.03.2018.
No Independent Director of the Company serves as a whole-time director of a listed Company. No Independent Director
is a director in more than seven listed companies and as director of more than 10 public companies.
No director is a member in more than 10 committees of public companies nor acts as a chairperson of more than 5
committees across all listed entities in terms of Regulation 26(1) of Listing Regulations.
The shareholders at its General Meeting held time to time have approved appointment of Independent Directors for
fixed tenure not exceeding as prescribed under the Companies Act, 2013. The Company issued letter of appointment
to all its Independent Directors as per Schedule IV to the Companies Act, 2013 and the terms and conditions of such
appointment have been disclosed on the website of the Company at http://www.trf.co.in
The names and categories of the Directors on the Board, their attendance at Board Meetings during the financial year
and at the last Annual General Meeting, along with the number of Directorships and Committee Memberships held by
them in other public companies are given below:
Name Category No. of Board
meetings
attended
during
2017-18
Whether
attended
the AGM
held on July
27, 2017
No. of directorship in
other Companies as on
March 31, 2018@
#No. of committee
positions in other
Companies held as on
March 31, 2018
As
Chairman
As Director As
Chairman
As Member
Mr. Sandip Biswas
Chairman
DIN-00518430
(w.e.f. 07.04.2017)
Non-Independent
Non-Executive
Director
8 Yes 1 4 - -
Mr. Ranaveer Sinha
DIN-00103398
Independent
Director
4 Yes - 1 - -
Mr. R. V. Raghavan *
DIN-01754139
(upto 03.04.2017)
Independent
Director
- N.A. - - - -
Mr. Dipankar Chatterji
DIN-00031256
Independent
Director
8 Yes - 7 3 3
Mr. Sabyasachi Hajara
DIN-00004485
Independent
Director
8 No - 4 3 2
Ms. Neera Saggi
DIN-00501029
Independent
Director
7 Yes - 7 1 6

59
Name Category No. of Board
meetings
attended
during
2017-18
Whether
attended
the AGM
held on July
27, 2017
No. of directorship in
other Companies as on
March 31, 2018@
#No. of committee
positions in other
Companies held as on
March 31, 2018
As
Chairman
As Director As
Chairman
As Member
Mr. Dibyendu Bose
DIN-00282821
Non- Independent
Non-Executive
Director
7 Yes 1 - - -
Mr. Rajesh Ranjan Jha**
DIN-07715246
Non- Independent
Non-Executive
Director
6 Yes - - - -
Mr. P. S. Reddy
Managing Director
DIN- 03181178
(Upto 31.01.2018)
Executive Director 7 Yes - - - -
Mr. Sanjay Rajoria
Managing Director
DIN-08063280
(w.e.f. 01.02.2018)
Executive Director 1 N.A. - - - -
Mr. Vinayak Kashinath
Deshpande***
DIN:00036827
(w.e.f. 29.05.2018)
Non-Independent
Non-Executive
Director
N.A. N.A. N.A. N.A. N.A. N.A.
* Retired as per terms of his appointment with effect from April 4, 2017.
** Retire by rotation at the 55th Annual General Meeting in accordance with the provisions of the Companies Act, 2013
and is eligible for re-appointment (refer Directors’ Report).
*** Appointed as an Additional Director with effect from May 29, 2018 and holds office upto the date of ensuing Annual
General Meeting of the Company and being proposed to appoint him as a Director at the 55th Annual General Meeting.
@ Excludes directorship of private company which is not a subsidiary of a public company, Companies under section 8 of
the Companies Act, 2013, foreign body corporate, Society, AOP
# Only covers Membership/ Chairmanship of Audit Committee and Stakeholders Relationship Committee of public
limited companies.
The Board met eight times during the financial year 2017-18 and the gap between any two meetings did not exceed
120 days. The dates on which the Board meetings were held are as follows:
(i) April 7, 2017 (ii) May 23, 2017 (iii) July 27, 2017 (iv) August 18, 2017 & adjourned meeting on September 28, 2017 (v)
November 6, 2017 (vi) December 5, 2017 (vii) January 29, 2018 and (viii) February 20, 2018.
As per declarations received by the Company none of the directors are related to each other in terms of the definition of
“relative”. As per section 2(77) of the Companies Act, 2013 read with Rule 4 of the Companies (Specification of Definition
Details) Rules, 2014.
Mr. Ranaveer Sinha (Independent, Non-Executive Director) holds 10 (ten) Equity Shares of the Company jointly with his
spouse as on March 31, 2018. Apart from Mr. Ranaveer Sinha no other director holds any share of the Company.
Details of familiarization programmes imparted to independent directors are disclosed at Company’s web site at: www.
trf.co.in
At each meeting the Board reviews status of compliance of all laws applicable to the Company. Information as required
in terms of Part A of Schedule II read with Regulation 17(7) of Listing Regulations was furnished at the Board meeting(s).
Code of Conduct:
The Tata Code of Conduct, as adopted by the Company, is applicable to the Executive Director and Senior Management
Personnel and other Executives of the Company. The said code is posted on the website of the Company. The Company

Fifty Fifth Annual Report 2017-18
60
has received confirmation from the Managing Director as well as Senior Management Personnel regarding compliance
of the code during the year under review.
The Board at its meeting held on December 26, 2005, has adopted ‘Code of Conduct for Non-Executive Directors’ of
the Company. The Board at its meeting held on February 10, 2015 adopted a revised code which prescribed inter-alia
duties of Independent Directors, acting in the interest of the Company, to avoid conflict of interest, compliance to
all applicable laws in their individual capacity & safeguard of confidentiality of information. The Company has also
received confirmations from the Non-Executive Directors regarding compliance of the code during the year under
review.
Separate Meeting of Independent Directors :
During the year, separate meeting of the Independent Directors was held on March 26, 2018, without the attendance of
non-independent directors and members of the management. All Independent Directors attended the said meeting.
3. Audit Committee
The Audit Committee of the Board has been functioning since 1997. The Board at its meeting held on April 18, 2014
stated that terms of reference, power and role of Audit Committee shall be as specified in the Companies Act, 2013 and
the listing regulations (erstwhile listing agreement with stock exchanges), as amended from time to time. The broad
terms of reference of the Audit Committee are as stated in Part C of Schedule II read with Regulation 18(3) of Listing
Regulations. .
The composition of the Audit Committee and the details of the meetings of the Committee attended by the Directors
during the financial year 2017-18, are given below:
Name of Member Category No. of meetings attended
Mr. Dipankar Chatterji, Chairman Independent Director 6
Mr. R. V. Raghavan (upto 04.04.2017) Independent Director -
Ms. Neera Saggi Independent Director 5
Mr. Dibyendu Bose (w.e.f. 07.04.2017) Non-Independent
Non-Executive Director
5
Mr. Ranaveer Sinha (w.e.f. 01.11.2017) Independent Director 2
The Committee met six times during the financial year 2017-18 and the gap between any two meetings did not exceed
120 days. The dates on which the said meetings were held are as follows :
(i) May 23, 2017 (ii) June 2, 2017 (iii) July 27, 2017 and adjourned meeting on September 28, 2017 (iv) November 6, 2017
(v) January 29, 2018 and (vi) February 20, 2018.
All members are financially literate and the Chairman is a Chartered Accountant. The Audit Committee meetings were
attended by the Chief Financial Officer and Chief Internal Auditor. Other senior executives of the Company attended
the meetings as invitee. Representatives of the external internal auditors attended the meeting to give presentation
on Internal Audit report and on matters where their presence was required. Representatives of the Statutory Auditors
attended all meetings held for consideration of accounts/ results and on matters where their presence was required.
Company Secretary acts as the Secretary to the Committee. Chairman of the Audit Committee attended the Annual
General Meeting held on July 27, 2017 to answer shareholders queries.
4. Nomination and Remuneration Committee
The Nomination and Remuneration Committee of the Board has been in operation since 1995. The Board at its meeting
held on April 18, 2014 stated that terms of reference, power and role of Nomination and Remuneration Committee
shall be as specified in the Companies Act, 2013 and the listing regulations (erstwhile listing agreement with stock
exchanges), as amended from time to time. The broad terms of reference of the Nomination and Remuneration
Committee are to:
“Formulation of the criteria for determining qualifications, positive attributes and independence of a director”.

61
The committee will consider periodically reviewing the composition of the Board with the objective of achieving
an optimum balance of size, skills, independence, knowledge, age, gender and experience.
accordance with criteria laid, and recommend the Board of Directors their appointment and removal.
performance evaluation of independent directors.
team members of the company (as defined by this committee).
and individual directors. This shall include “Formulation of criteria for evaluation of Independent Directors and
the Board.” Additionally, the committee may also oversee the performance review process of the KMP and the
executive team of the company.
employees.
company.
rewards and recognition, talent management and succession planning (specifically for Board, KMP and executive
team).
annual increments), perquisites and commission/performance linked remuneration to be paid to the Managing/
Whole-time Directors of the Company and also recommend retiral benefits to be paid to the Managing/Whole-
time Directors under the Tata Group Retirement Benefits Guidelines adopted by the Board.
The Nomination and Remuneration Committee also considers the annual commission payable to the Non-Executive
Directors. The distribution of commission amongst Non-Executive Directors is placed before the Board. The Commission
is calculated on the basis of their attendance and contribution to the Board and its Committees meetings.
The composition of the Committee and the details of the meetings attended by the Directors during the financial year
2017-18 are as follows:
Name of Member Category No. of meeting attended
Mr. Sabyasachi Hajara, Chairman Independent Director 4
Mr. Sandip Biswas (w.e.f. 07.04.2017) Non-executive Director 4
Mr. Ranaveer Sinha Independent Director 4
The Committee met four times during the financial year 2017-18. The dates on which the said meetings were held are
as follow:
(i) May 23, 2017 (ii) November 6, 2017 (iii) January 27, 2018 and (iv) March 26, 2018.
5. Remuneration of Directors
The Non-Executive Directors are paid remuneration by way of sitting fees and commission. No sitting fees is paid to such
non-executive directors who hold executive position in a group company. The commission is payable at the rate not
exceeding 1% of net profits computed in accordance with Section 197 of the Companies Act, 2013.
The Company pays remuneration by way of salary, perquisites and allowances (fixed component) and Commission/
Performance Linked Remuneration (variable component) payable to the Managing/Whole-time Director(s) as determined
by the Board at the end of the financial year based on the recommendations of the Remuneration Committee.

Fifty Fifth Annual Report 2017-18
62
Details of remuneration paid to Non-Executive Directors in the financial year 2017-18 towards sitting fees for attending
the Board & its Committee meetings for the financial year 2017-18 are as follows:
Name of Director Sitting Fees paid
in FY 2017-18
Rs.
Mr. Ranaveer Sinha 5,75,000
Mr. R.V. Raghavan -
Mr. Dipankar Chatterji 8,25,000
Mr. Sabyasachi Hajara 7,00,000
Ms. Neera Saggi 8,50,000
Total 29,50,000
Apart from payment of sitting fee and reimbursement of expenses for attending meetings, the Company did not have
any pecuniary relationship with any Non-Executive Directors during the financial year 2017-18. Criteria of making
payment to Non-executive director is available on the Company’s website at www.trf.co.in
Details of remuneration paid to the Executive Director(s) for the financial year 2017-18 are as follows:
Name Salary
Rs. lakhs
Perquisites &
Allowances*
Rs. lakhs
Commission/
performance linked
incentives
Rs. lakhs
Stock Options
Mr. P.S. Reddy
Managing Director
(upto 31.01.2018)
30.52 29.95 Nil Nil
Mr. Sanjay Rajoria
Managing Director
(w.e.f. 01.02.2018)
4.93 5.05 Nil Nil
* Includes contribution to the Provident Fund and Superannuation Fund.
Period of Contract of
Mr. Sanjay Rajoria, : Three years, from 01.02.2018 to 31.01.2021.
Managing Director The contract may be terminated by either party giving the other party six
months’ notice or the Company paying six months’ salary in lieu thereof.
There is no separate provision for payment of severance fees.
Company has no stock option scheme for its employees, directors.
Criteria for Performance evaluation :
The Guidance note issued by SEBI vide circular no SEBI/CFD/CMD/CIR/2017/004 dated January 4, 2017 read with the
provisions of Companies Act, 2013 and SEBI LODR prescribe the criteria and guidelines for performance evaluation
of Board, Board Committees and Directors. Further the Company has adopted Board Governance Guidelines which
prescribe certain additional criteria for Tata Companies. The evaluation process lays down detailed questionnaire
and criteria. The criteria inter-alia includes attendance, contribution at meetings, guidance/support to management
outside meetings.
6. Stakeholders Relationship Committee
The terms of reference of the Stakeholders Relationship Committee is to review and monitor the system of redressal of
Investors’ grievances including complaints related to transfer of shares, issue of duplicate share certificates, transmission
of shares, non-receipt of annual reports and non-receipt of declared dividend, etc.

63
The composition of the Stakeholders Relationship Committee and details of the meeting attended by the Directors are
given below:
Name of Member Category No. of meeting attended
Mr. Ranaveer Sinha, Chairman Independent Director 1
Mr. Dipankar Chatterji Independent Director 1
Mr. P.S. Reddy, Managing Director
(upto 31.01.2018)
Executive Director -
Mr. Sanjay Rajoria, Managing Director
(w.e.f. 01.02.2018)
Executive Director 1
The Committee met once during the financial year 2017-18 on March 26, 2018.
Name, designation & address of Compliance Officer : Ms. Pallavi Gupta
Compliance Officer
TRF Limited
11, Station Road, Burma Mines,
Jamshedpur - 831 007.
Phone: (0657) 3046250
Fax: (0657) 2345732
E-mail: [email protected]
No. of complaints received from the investors during the financial year 2017 – 18 : 1
No. not solved to the satisfaction of the investors as on 31.03.2018 : 0
No. of pending complaints as on 31.03.2018 : 0
7. Other Committees:
In addition to the above Committees on Corporate Governance, the Board has also constituted following committees
to ensure greater transparency in the functioning of Board:
Executive Committee:
An Executive Committee of the Board is constituted by the Board at its meeting held on November 6, 2017 upon
recommendation of Nomination and Remuneration Committee for monitoring of projects and laid down the following
mandate and terms of reference:
a. Mandate:
i. A detailed review of the tendering process followed by the company in obtaining contracts for large projects
valued at over Rs 50 cr. (including cost benchmarking, justification and process validation)
ii. The Committee will also be responsible for the oversight and governance of the project management process
including “integrated timelines” and “cost to complete” for projects constituting at least 80% of the total outstanding
project order load for TRF
iii. The Committee will review the Risk management process of the project
iv. The Project Steering Committee / Project Management Office would submit a monthly progress report of
the integrated project timeline and cost to complete, pipeline of orders in the next 4 weeks, risk analysis of the project
and key concerns, amount spent and rolling cash plan for following 3 months
b. Reporting: The Committee will report to the Board
c. Attendees : By invitation, representatives from Project Steering Committee and Project Management Office, or
such other people as deemed necessary.
d. Quorum: A quorum of the Committee shall comprise any two members present in person or through electronic
medium.
e. Secretary: The Company Secretary to be the Convener of the Executive Committee.
f. Frequency:
i. The Committee usually to meet on a monthly basis but will meet as and when required on a short notice
ii. The secretary to prepare and circulate the timetable of the scheduled meetings for each calendar year

Fifty Fifth Annual Report 2017-18
64
The composition of the Executive Committee and the details of the meeting of the Committee attended by the Directors
during the financial year 2017-18, are given below:
Name of Director Category No. of meetings attended
Mr. Rajesh Ranjan Jha
Chairman
Non-Independent
Non-Executive Director
4
Ms. Neera Saggi
Member
Independent
Non-Executive Director
4
Mr. P.S. Reddy
Managing Director
Member
(upto 31.01.2018)
Executive Director 3
Mr. Sanjay Rajoria
Managing Director
Member
(w.e.f. 01.02.2018)
Executive Director 1
The Committee met four times during the financial year 2017-18 on the following dates:
(i) November 27, 2017 (ii) December 14, 2017 (iii) January 11, 2018 and (iv) February 13, 2018
8. Subsidiary Companies
The Company has adopted Policy for determining material subsidiaries. York Transport Equipment (India) Pvt. Ltd.
(York, India) are ‘Material non-listed Indian Subsidiary’. As per the provisions of Regulation 16(c) of Listing Regulations,
Mr. Ranaveer Sinha, Independent Director was appointed as a director on the Board of York Transport Equipment (India)
Pvt. Ltd. (York, India).
The minutes of the subsidiary companies are placed before the Board of Directors of the Company and the attention of
the Directors is drawn to all significant transactions and arrangements entered into by the subsidiary companies.
9. General body meetings
Location and time where last three Annual General Meetings were held:
Year and Date Time Venue
27.07.2017 12.30 p.m. Main Hall, Beldih Club
Northern Town, Jamshedpur-831001
30.07.2016 12.00 Noon Main Hall, Beldih Club
Northern Town, Jamshedpur-831001
26.09.2015 12.00 Noon Auditorium of Shavak Nanavati Technical Institute
N-Road, Bistupur, Jamshedpur-831001
The Special Resolutions passed in the previous three Annual General Meetings are as under:
AGM Date Special Resolutions Passed
27.07.2017 There was no special resolution.
30.07.2016 Appointment of Mr. Srinivasa Reddy Polimera as Managing Director for a period of three
years from April 1, 2016 to March 31, 2019
26.09.2015 Appointment of Mr. Srinivasa Reddy Polimera as Dy. Managing Director for a period of three
years from May 29, 2015 to May 28, 2018
No Extra-ordinary General Meeting of the shareholders was held during the financial year.
No special resolution was put to vote through postal ballot in the previous three Annual General Meetings and no such
special resolution through postal ballot is proposed for this year also.
In compliance with the provisions of section 108 of the Companies Act, 2013 read with Rule 20 of the Companies
(Management and Administration) Rules, 2014 and Clause 35B of the then applicable listing agreement, the Company

65
had provided its members the facility to exercise their voting rights by electronic means through e-voting services
provided by National Securities Depository Limited (NSDL) to vote on the resolutions of the AGM held on July 27,
2017. Further to enable those members who do not have access to e-voting facility the Company had sent the physical
ballot form along with the pre-paid envelope to all shareholders. The voting right was fixed as on cutoff date and the
shareholders were requested to either vote electronically during the e-voting period stated in the notice or sent the
completed ballot form so as to reach the scrutinizer within the cutoff date specified in the ballot form.
Further for those shareholders who had attended the 54th AGM held on July 27, 2017 and had not voted either through
e-voting or by way of ballot form, the facility to vote by way of poll/ballot conducted at the meeting was provided.
Mr. P.K. Chakravarty, ACS was appointed as scrutinizer for all the three modes of voting provided to the shareholders.
The combined result of all the three modes of voting was announced to the stock exchanges and was also posted on
the Company’s website.
10. Disclosures
i) There are no material significant related party transactions which have potential conflict with the interest of the
Company at large. The related party transactions are given in the notes to the Balance Sheet and Statement of
Profit & Loss.
ii) Whistle Blower Policy /Vigil Mechanism:
The Board of Directors at their meeting held on December 26, 2005, approved the Whistle Blower Policy that
provides a formal mechanism for all employees of the Company to approach the Ethics Counselor / Chairman
of the Audit Committee of the Company and make a protected disclosure about unethical behaviour, actual or
any suspected fraud or violation of the Company’s Code of Conduct. The Board at its meeting held on August
2, 2014 adopted revised Whistle Blower Policy in terms of Section 177(9) of the Companies Act, 2013 read with
Regulation 22 of the Listing Regulations. The revised policy provides framework for directors and employees to
report concerns of unethical behaviour, actual or suspected, fraud or violation of the Company’s code of conduct
or ethics policy and provides mechanism for directors and employees of the Company to approach the Ethics
Counselor / Chairman of the Audit Committee of the Company.. The Whistle Blower Policy is an extension of
the Tata Code of Conduct, which requires every employee to promptly report to the management any actual or
possible violation of the Code or an event he becomes aware of, that could affect the business or reputation of the
Company.
iii) The Company has fulfilled the following non-mandatory requirements as prescribed in Part E of Schedule II of the
Listing regulations with the Stock Exchanges:
a) The Company has appointed separate persons to the post of Chairman and Managing Director.
iv) The Company has adopted policy for determining “Material Subsidiaries’’. The said policy is available on the
company’s website at www.trf.co.in
v) The Company has adopted a Policy for Related Party Transactions. The said policy is available on the company’s
website at www.trf.co.in
vi) The Board had at its meeting held on 26th December, 2005 adopted Risk Management Framework for the Company
for identification and prioritization of various risks based on pre determined criteria relating to i) Strategic Risk ii)
Operational Risk and iii) Functional Risk. The Company has developed risk registers and has identified key risks
and has also framed risk mitigation plan for the same. During the year the risk management executive Committee
comprising of senior Head of Department’s have revisited, assessed the current risks and risk management plan.
Risk management process in the Company is an on-going activity and steps are being taken to improve the same.
vii) Register of Contracts is placed at each meeting of the Board of Directors as per the requirements of the Companies
Act, 2013.
viii) Management Discussion and Analysis Report forms a part of the Director’s Report.
ix) The Company has not raised any proceeds from public issue, rights issue, preferential issue, etc. during the year.
11. Means of communication
The quarterly and annual results along with the segmental report are generally published in Financial Express (in
English) & Hindustan, Dainik Bhaskar, Daninik Jagran, Prabhat Khabar, Uditvani (in Hindi) and also displayed on the
Company’s website at www.trf.co.in shortly after its submission to the Stock Exchanges.
Any significant event is first informed to the Stock Exchanges and then posted on the Company’s website.

Fifty Fifth Annual Report 2017-18
66
12. General Shareholder Information
i) AGM: Date, time and venue : Main Hall, Beldih Club
Northern Town, Jamshedpur – 831001
ii) As required under Regulation 36(3) of Listing Regulations, particulars of Directors seeking appointment/
reappointment are annexed to the Notice of the Annual General Meeting to be held on July 27, 2018.
iii) Financial Calendar : April to March
Annual General Meeting : July 27, 2018
Dividend Payment : No dividend payment
iv) Date of book closure : July 17, 2018 to July 20, 2018 (both days inclusive)
v) Dividend Payment date : N.A.
vi) Listing on Stock Exchange : The Company’s shares are listed on -
(1) BSE Ltd. (BSE)
(2) National Stock Exchange of India Ltd. (NSE)
(3) The Calcutta Stock Exchange Ltd. (CSE).
The Company has paid the annual listing fees to all the Stock
Exchanges for the financial year 2017-18.
vii) Stock Code/Symbol : 505854 (BSE), TRF (NSE) & 10030045 (CSE)
viii) Market Information:
Market Price Data: High, Low (based on the closing prices) and volume during each month in last financial year, as
under:
BSE NSE
High
(Rs.)
Low
(Rs.)
Volume
(No. of Shares)
High
(Rs.)
Low
(Rs.)
Volume
(No. of Shares)
Apr-17 277.95 238.85 974278 278.40 237.55 3643340
May-17 276.40 218.05 458861 276.75 216.85 1597326
Jun-17 250.55 228.40 288702 251.10 228.75 1061256
Jul-17 257.70 226.80 599988 256.55 226.95 2234144
Aug-17 223.05 193.30 282118 222.60 194.15 909045
Sep-17 260.70 211.45 991997 259.85 211.50 3289000
Oct-17 255.20 238.15 411774 255.20 237.60 1342205
Nov-17 275.20 211.15 656899 275.80 211.30 3030389
Dec-17 304.50 239.35 1082944 304.60 239.40 6355250
Jan-18 286.10 226.25 202032 286.85 224.20 488535
Feb-18 237.20 214.10 79667 236.25 211.80 334796
Mar-18 230.10 198.85 136741 232.35 200.00 556159

67
ix) Performance of Company’s Share Price
The performance of the Company’s share prices in comparison to broad-based indices BSE 500 during the financial
year 2017-18, is as under:
x) Registrar & Transfer Agents:
TSR Darashaw Limited Contact person : Ms. Shehnaz Billimoria
6-10, Haji Moosa Patrawala Ind Estate, Tel. no. : (022) 6656-8484
(Near Famous Studio) 20, Dr. E. Moses Road, Fax no. : (022) 6656-8494
Mahalaxmi, Mumbai – 400 011 E-mail : [email protected]
Website : www.tsrdarashaw.com
xi) Share transfer system:
a) Physical Form:
Share transfers in physical form can be lodged either at the Registered Office of the Company or with TSR
Darashaw Ltd, the Registrar & Transfer Agents, at the above-mentioned address or any of their branch offices,
addresses of which are available on their website.
Transfers are normally processed within 15 days from the date of receipt, provided the documents are
complete in all respects. Certain executives (including the Managing Director) are severally empowered to
approve transfers.

Fifty Fifth Annual Report 2017-18
68
b) Demat Form:
The Company has made arrangements to dematerialize its shares through National Securities Depository
Limited (NSDL) and Central Depository Services (India) Limited (CDSL) and Company’s ISIN No. is
INE391D01019.
xii) a) Distribution of shareholdings as on 31.03.2018:
Shareholding of nominal value of Shareholders Share Amount
Rs. Number % to total Rs. % to total
UPTO - 5000 18,939 90.82 2,10,61,290 19.14
5001 - 10000 1,082 5.19 83,28,410 7.57
10001 - 20000 438 2.10 65,06,750 5.91
20001 - 30000 147 0.71 37,82,760 3.44
30001 - 40000 59 0.28 21,33,810 1.94
40001 - 50000 55 0.26 25,94,740 2.36
50001 - 100000 65 0.31 45,82,460 4.16
100001 and above 68 0.33 6,10,53,900 55.48
TOTAL 20,853 100.00 11,00,44,120 100.00
b) Shareholding pattern as on 31.03.2018:
Sl. No. Category No. of Shares %
I. Promoters/Associate companies, etc. 37,55,235 34.12
II. Financial Institutions 41,194 0.37
III. Foreign Financial Institution 0 0
IV. OCBs/Foreign Companies 2,17,500 1.98
V. Other Bodies Corporate/Trusts/LLP 11,27,258 10.24
VI. IEPF Account 85,537 0.78
VII. BC-NBFC 23,195 0.21
VIII. Directors & Relatives 10 0.00
IX. General Public 57,54,483 52.30
TOTAL 1,10,04,412 100.00
c) Shareholders holding more than 1% of the Equity Share capital as on 31.03.2018:
Sl. No. Name of shareholders No. of shares held %
1. Tata Steel Limited 37,53,275 34.11
2. Dilipkumar Lakhi 2,49,227 2.26
3. Litton Systems Inc. 2,17,500 1.98
4. Nimish Chandulal Shah 1,13,500 1.03
TOTAL 43,33,502 39.38
xiii) Dematerialization of shares and liquidity:
94.75% of the share capital of the Company had been dematerialized till March 31, 2018. The Company’s shares
are frequently traded on BSE and NSE.
xiv) The Company has no outstanding GDR/ADR/Warrants or any convertible instruments.
xv) The Company has adopted Forex Risk Management Policy and hedging of exposure are undertaken as per the
said policy
xvi) Plant location : 11, Station Road, Burma Mines,
Jamshedpur – 831 007, Jharkhand.

69
TO
THE MEMBERS OF
TRF LIMITED
DECLARATION OF COMPLIANCE TO THE CODE OF CONDUCT
BY DIRECTORS AND SENIOR MANAGEMENT PERSONNEL
This is to confirm that the Company has adopted a Code of Conduct for its employees including the Managing Director and
Whole time Director(s). In addition, the Company has adopted a Code of Conduct for its Non-Executive Directors. Both these
Codes are hosted on the Company’s web site.
I confirm that the Company has received from the senior management team of the Company and the Members of the Board
as on date, a declaration of compliance with the Code of Conduct for the financial year 2017-18 as applicable to them.
For the purpose of this declaration, Senior Management Team means the employees in the cadre of General Manager and
above, including Company Secretary, as on March 31, 2018.
Place : Mumbai, Sanjay Rajoria
Date : April 24, 2018 Managing Director
xvii) Address for correspondence : TRF LIMITED,
A TATA Enterprise,
11, Station Road, Burma Mines, Jamshedpur – 831 007.
Tel.: (0657) 2345727/3046326
Fax: (0657) 2345732
E-mail: [email protected]
Web-site: www.trf.co.in
13. Reconciliation of Share Capital Audit
A qualified Practicing Company Secretary carried out the Share Capital Reconciliation Audit to reconcile the total issued
and paid up capital with National Securities Depository Limited (NSDL) and Central Depository Services (India) Limited
(CDSL) with the total issued and listed capital. The audit confirms that the total issued/ paid up capital is in agreement
with the total number of Shares in the physical form and the total number of dematerialized shares held with NSDL and
CDSL.
14. CEO/CFO Certification
Managing Director and Chief Financial Officer have submitted the required Certificate to the Board at its meeting held
on April 24, 2018, wherein the Audited Accounts of the Company for the financial year 2017-18 were considered.
15. A Certificate from the Secretarial Auditors of the Company, M/s. P.K. Singh & Associates, Company Secretaries regarding
due Compliance of conditions stipulated in Schedule V (E) of the Listing Regulations is annexed hereto.

Fifty Fifth Annual Report 2017-18
70
INDEPENDENT AUDITOR’S CERTIFICATION ON CORORATE GOVERNANCE
TO THE MEMBERS OF
TRF LIMITED
1. This certificate is issued in accordance with the terms of our engagement letter dated 15th April, 2018
2. We P.K. Singh & Associates, Company Secretaries, the Secretarial Auditors of TRF Limited (“the Company”), have examined the
compliance of conditions of Corporate Governance by the Company, for the year ended on 31 March 2018, as stipulated in
regulations 17 to 27 and clauses (b) to (i) of regulation 46(2) and Para C and D of Schedule V of the SEBI (Listing Obligations
and Disclosure Requirements), 2015 (the Listing Regulation).
Managements’ Responsibility
3. The compliance of conditions of Corporate Governance is the responsibility of the Management. This responsibility includes
the design, implementation and maintenance of internal control and procedures to ensure the compliance with the conditions
of the Corporate Governance stipulated in Listing Regulations.
Auditor’s Responsibility
4. Our responsibility is limited to examining the procedures and implementation thereof, adopted by the Company for ensuring
compliance with the conditions of the Corporate Governance. It is neither an audit nor an expression of opinion on the
financial statements of the Company.
5. We have examined the Minutes Book, Stock Exchange Reporting, Legal Compliance Documents, Accounts, Directors
Declaration and other relevant records and documents maintained by the Company for the purposes of providing reasonable
assurance on the compliance with Corporate Governance requirements by the Company.
6. We have carried out an examination of the relevant records of the company in accordance with the Guidance Note on
Certificate of Corporate Governance issued by the Institute of the Company Secretaries of India (The ICSI).
7. We have complied with the relevant applicable requirements of the Standard on Quality Control (SQC) 1, Quality Control
for Firms that perform Audits and Reviews of Historical Financial Information and other assurance and Related Services
Engagements
Opinion
8. Based on our examination of the relevant records and according to the information and explanations provided to us and
the representations provided by the Management, we certify that the Company has complied with conditions of Corporate
Governance as stipulated in regulations 17 to 27 and Clauses (b) to (i) of regulations 46(2) and Para C and D of Schedule V of
the Listing Regulations during the year ended March 31, 2018
9. We state that such compliance is neither an assurance as to the future viability of the Company nor the efficiency or
effectiveness with which the management has conducted the affairs of the company
For P. K. Singh & Associates
Company Secretaries
(Firm’s Registration No. P2002JH045700)
Pramod Kumar Singh (Partner)
(FCS. 5878 | C.P. No. 19115)
Place: Jamshedpur ,
Dated: April 24, 2018

71
Standalone Fund Flow StatementRs. In Lakhs
2017-18 2016-17 2015-16 2014-15 2013-14
SOURCES
1 Cash Generated from Operation
- Profit /(Loss) After Taxes - - - - -
- Add: depreciation - - - - -
Sub-total - - - - -
2 Increase in Loan Funds
- Bank Borrowings - 4,572 594 -
3 Decrease in working Capital 16,872 8,318 - 7,643 -
4 Decrease in Investment - 23 - -
5 Decrease in Loan to subsidiaries 362 252 141 - 7,672
6 Capital expenditure (net) - 25 149 -
Total 17,234 8,570 4,761 8,386 7,672
UTILISATION
1 Cash utilised in Operation
- Loss After Taxes 14,598 2,922 467 8,735 2,523
- Add: depreciation (344) (411) (332) (349) (416)
Sub-total 14,254 2,511 135 8,386 2,107
2 Capital expenditure (net) 27 71 - - 161
3 Increase in Investment - - - - 7,596
4 Dividend including tax on dividend, if ap-
plicable
- - - - -
5 Increase in interest free loan to subsidiary - - - - -
6 Increase in Working Capital - - 4,626 - 1,372
7 Deferred Tax (provided) / write back (net)
for the year
1,958 2,352 - - (4,370)
8 Adjusted in General Reserve - - - - -
9 Decrease in Bank Borrowing 995 3,636 - - 806
Total 17,234 8,570 4,761 8,386 7,672

Fifty Fifth Annual Report 2017-18
72
Summarised Balance Sheet as at March 31, 2018 As at
March 31, 2018
As at
March 31, 2017
WHAT THE COMPANY OWNED Rs Lakh Rs Lakh
1 Fixed Assets (Net) 2,790.81 3,111.35
2 Capital Work-in-progress - -
3 Non current assets 21,244.15 23,838.75
4 Current assets 51,128.54 66,287.26
5 Total assets 75,163.50 93,237.36
WHAT THE COMPANY OWED
6 Non current liabilities 4,772.86 9,927.83
7 Current liabilities 89,367.09 87,704.03
THE COMPANY’s NET WORTH
8 Shareholders’ Equity (18,976.45) (4,394.50)
(i.e. the excess of what the company owned over what the company owed)
Represented by
Share capital
Rs 1100.44 lakh (Previous year - Rs 1100.44 lakh)
Other Equity
Rs (20076.89) lakh (Previous year - Rs (5494.94) lakh) 75,163.50 93,237.36
Summarised Statement of Profit and Loss for the year 2017-18Year ended
March 31, 2018
Year ended
March 31, 2017
1 Income Rs Lakh Rs Lakh
Net sales & services 35,395.12 51,978.69
Other income 535.73 996.15
Total income 35,930.85 52,974.84
2 Profit/(Loss) before Interest, Depreciation, Exceptional/Extraordinary
Items and Taxes
-14,217.89 45.45
Less:
Depreciation 366.75 417.61
Finance Cost 4,674.16 4,561.54
3 Profit/(Loss) before Exceptional/Extraordinary Items and Taxes (19,258.80) (4,933.70)
4 Exceptional items ( Profit on disposal of Investment in Joint Venture ) 2,703.00 -
5 Profit/(Loss) before Taxes (16,555.80) (4,933.70)
6 Provision for taxes / (write back) -1,958.15 -2,242.6
7 Profit/(Loss) after Taxes (14,597.65) (2,691.10)
8 Other Comprehensive Income (11.16) (240.07)
9 Balance in Profit and Loss Account brought forward (20,434.96) (17,503.79)
10 Amount available for appropriation (35,043.77) (20,434.96)
11 Appropriations
Proposed dividend - -
Tax on proposed dividend - -
General Reserve - -
Balance carried to Balance Sheet (35,043.77) (20,434.96)

73
INDEPENDENT AUDITORS’ REPORT
To the Members of TRF LimitedReport on the Standalone Indian Accounting Standards (Ind AS) Financial Statements
1. We have audited the accompanying standalone financial statements of TRF Limited (“the Company”), which comprise
the Balance Sheet as at March 31, 2018, the Statement of Profit and Loss (including Other Comprehensive Income), the
Cash Flow Statement and the Statement of Changes in Equity for the year then ended and a summary of the significant
accounting policies and other explanatory information.
Management’s Responsibility for the Standalone Ind AS Financial Statements
2. The Company’s Board of Directors is responsible for the matters stated in Section 134(5) of the Companies Act, 2013
(“the Act”) with respect to the preparation of these standalone Ind AS financial statements to give a true and fair view
of the financial position, financial performance (including other comprehensive income), cash flows and changes in
equity of the Company in accordance with the accounting principles generally accepted in India, including the Indian
Accounting Standards specified in the Companies (Indian Accounting Standards) Rules, 2015 (as amended) under
Section 133 of the Act. This responsibility also includes maintenance of adequate accounting records in accordance
with the provisions of the Act for safeguarding of the assets of the Company and for preventing and detecting frauds
and other irregularities; selection and application of appropriate accounting policies; making judgments and estimates
that are reasonable and prudent; and design, implementation and maintenance of adequate internal financial controls,
that were operating effectively for ensuring the accuracy and completeness of the accounting records, relevant to the
preparation and presentation of the standalone Ind AS financial statements that give a true and fair view and are free
from material misstatement, whether due to fraud or error.
Auditors’ Responsibility
3. Our responsibility is to express an opinion on these standalone Ind AS financial statements based on our audit.
4. We have taken into account the provisions of the Act and the Rules made thereunder including the accounting and
auditing standards and matters which are required to be included in the audit report under the provisions of the Act
and the Rules made thereunder.
5. We conducted our audit of the standalone Ind AS financial statements in accordance with the Standards on Auditing
specified under Section 143(10)of the Act and other applicable authoritative pronouncements issued by the Institute
of Chartered Accountants of India. Those Standards and pronouncements require that we comply with ethical
requirements and plan and perform the audit to obtain reasonable assurance about whether the standalone Ind AS
financial statements are free from material misstatement.
6. An audit involves performing procedures to obtain audit evidence about the amounts and the disclosures in the
standalone Ind AS financial statements. The procedures selected depend on the auditors’ judgment, including the
assessment of the risks of material misstatement of the standalone Ind AS financial statements, whether due to fraud
or error. In making those risk assessments, the auditor considers internal financial control relevant to the Company’s
preparation of the standalone Ind AS financial statements that give a true and fair view, in order to design audit
procedures that are appropriate in the circumstances. An audit also includes evaluating the appropriateness of the
accounting policies used and the reasonableness of the accounting estimates made by the Company’s Directors, as
well as evaluating the overall presentation of the standalone Ind AS financial statements.
7. We believe that the audit evidence we have obtained is sufficient and appropriate to provide a basis for our audit
opinion on the standalone Ind AS financial statements.
Opinion
8. In our opinion and to the best of our information and according to the explanations given to us, the aforesaid standalone
Ind AS financial statements give the information required by the Act in the manner so required and give a true and fair
view in conformity with the accounting principles generally accepted in India, of the state of affairs of the Company as

Fifty Fifth Annual Report 2017-18
74
at March 31, 2018, and its total comprehensive income (comprising of loss and other comprehensive income), its cash
flows and the changes in equity for the year ended on that date.
Emphasis of Matter
9. We draw your attention to the following matters:
a) Note No. 11(1) to the Financial Statements, with respect to retention money receivable amounting to Rs. 24058.87
Lakhs as at March 31, 2018, included under Trade receivable, which are realizable subject to completion of the
performance guarantee tests as per the terms of the contracts.
b) Note No. 43.02 to the Financial Statements with respect to the losses incurred by the company and erosion of its net
worth and preparation of the financial results on going concern assumption, based on the reasons / assumptions
stated in the aforesaid note. The company’s continuing as a going concern is dependent on generation of the
expected cash flows to be able to meet its obligations as and when they arise, for which an uncertainty exists.
c) Note No. 43.03 of the Financial Statements, with respect to estimation by the management of the cost to
complete the contracts based on estimates/ assumptions which could be subject to variation, which is presently
not ascertainable
d) Note No. 43.04 to the Financial Statements, with respect to receivable from a customer, currently under insolvency
proceedings under Insolvency and Bankruptcy Code 2016, aggregating to Rs. 820.52lakhs included under trade
receivables, which the company considers good and recoverable for the reasons stated in the aforesaid note and
accordingly considers the carrying amount of the same as appropriate.
Our opinion is not qualified in respect of these matters
Other Matter
10. The Ind AS financial statements of the Company for the year ended March 31, 2017, were audited by another firm
of chartered accountants under the Companies Act, 2013 who, vide their report dated May 23, 2017, expressed an
unmodified opinion on those financial statements. Our opinion is not qualified in respect of this matter.
Report on Other Legal and Regulatory Requirements
11. As required by the Companies (Auditor’s Report) Order, 2016, issued by the Central Government of India in terms of
sub-section (11) of section 143 of the Act (“the Order”), and on the basis of such checks of the books and records of the
Company as we considered appropriate and according to the information and explanations given to us, we give in the
Annexure B a statement on the matters specified in paragraphs 3 and 4 of the Order.
12. As required by Section 143 (3) of the Act, we report that:
(a) We have sought and obtained all the information and explanations which to the best of our knowledge and belief
were necessary for the purposes of our audit.
(b) In our opinion, proper books of account as required by law have been kept by the Company so far as it appears
from our examination of those books.
(c) The Balance Sheet, the Statement of Profit and Loss (including other comprehensive income), the Cash Flow
Statement and the Statement of Changes in Equity dealt with by this Report are in agreement with the books of
account
(d) In our opinion, the aforesaid standalone Ind AS financial statements comply with the Indian Accounting Standards
specified under Section 133 of the Act.
(e) On the basis of the written representations received from the directors as on March 31, 2018 taken on record
by the Board of Directors, none of the directors is disqualified as on March 31, 2018 from being appointed as a
director in terms of Section 164 (2) of the Act.
(f ) With respect to the adequacy of the internal financial controls with reference to financial statements of the
Company and the operating effectiveness of such controls, refer to our separate Report in Annexure A.

75
(g) With respect to the other matters to be included in the Auditors’ Report in accordance with Rule 11 of the
Companies (Audit and Auditors) Rules, 2014, in our opinion and to the best of our knowledge and belief and
according to the information and explanations given to us:
i. The Company has disclosed the impact, if any, of pending litigations as at March 31, 2018 on its financial
position in its standalone Ind AS financial statements – Refer Note 42 and 43.04;
ii. The Company has made provision as atMarch31, 2018, as required under the applicable law or accounting
standards, for material foreseeable losses, if any, on long-term contracts including derivative contracts –
Refer Note 2.04 (ii), 2.17.07 & 34;
iii. There has been no delay in transferring amounts, required to be transferred, to the Investor Education and
Protection Fund by the Company during the year ended March 31, 2018;
iv. The reporting on disclosures relating to Specified Bank Notes is not applicable to the Company for the year
ended March 31, 2018
For Price Waterhouse & Co Chartered Accountants LLP
Firm Registration Number: 304056E/E 300009
Chartered Accountants
Sougata Mukherjee
Place: Jamshedpur, Partner
Date: April 24, 2018 Membership Number 057084

Fifty Fifth Annual Report 2017-18
76
Annexure A to Independent Auditors’ Report
Referred to in paragraph 12(f) of the Independent Auditors’ Report of even date to the members of TRF Limited on
the standalone financial statements for the year ended March 31,2018
Report on the Internal Financial Controls under Clause (i) of Sub-section 3 of Section 143 of the Act
1. We have audited the internal financial controls over financial reporting of TRF Limited (“the Company”) as of March 31,
2018 in conjunction with our audit of the standalone financial statements of the Company for the year ended on that
date.
Management’s Responsibility for Internal Financial Controls
2. The Company’s management is responsible for establishing and maintaining internal financial controls based on the
internal control over financial reporting criteria established by the Company considering the essential components of
internal control stated in the Guidance Note on Audit of Internal Financial Controls Over Financial Reporting issued
by the Institute of Chartered Accountants of India (ICAI). These responsibilities include the design, implementation
and maintenance of adequate internal financial controls that were operating effectively for ensuring the orderly
and efficient conduct of its business, including adherence to company’s policies, the safeguarding of its assets, the
prevention and detection of frauds and errors, the accuracy and completeness of the accounting records, and the
timely preparation ofreliable financial information, as required under the Act.
Auditors’ Responsibility
3. Our responsibility is to express an opinion on the Company’s internal financial controls over financial reporting based
on our audit. We conducted our audit in accordance with the Guidance Note on Audit of Internal Financial Controls
Over Financial Reporting (the “Guidance Note”) and the Standards on Auditing deemed to be prescribed under section
143(10) of the Act to the extent applicable to an audit of internal financial controls, both applicable to an audit of
internal financial controls and both issued by the ICAI. Those Standards and the Guidance Note require that we comply
with ethical requirements and plan and perform the audit to obtain reasonable assurance about whether adequate
internal financial controls over financial reporting was established and maintained and if such controls operated
effectively in all material respects.
4. Our audit involves performing procedures to obtain audit evidence about the adequacy of the internal financial controls
system over financial reporting and their operating effectiveness. Our audit of internal financial controls over financial
reporting included obtaining an understanding of internal financial controls over financial reporting, assessing the risk
that a material weakness exists, and testing and evaluating the design and operating effectiveness of internal control
based on the assessed risk. The procedures selected depend on the auditor’s judgement, including the assessment of
the risks of material misstatement of the financial statements, whether due to fraud or error.
5. We believe that the audit evidence we have obtained is sufficient and appropriate to provide a basis for our audit
opinion on the Company’s internal financial controls system over financial reporting.
Meaning of Internal Financial Controls Over Financial Reporting
6. A company’s internal financial control over financial reporting is a process designed to provide reasonable assurance
regarding the reliability of financial reporting and the preparation of financial statements for external purposes in
accordance with generally accepted accounting principles. A company’s internal financial control over financial

77
reporting includes those policies and procedures that (1) pertain to the maintenance of records that, in reasonable
detail, accurately and fairly reflect the transactions and dispositions of the assets of the company; (2)provide reasonable
assurance that transactions are recorded as necessary to permit preparation of financial statements in accordance with
generally accepted accounting principles, and that receipts and expenditures of the company are being made only in
accordance with authorisations of management and directors of the company; and (3) provide reasonable assurance
regarding prevention or timely detection of unauthorised acquisition, use, or disposition of the company’s assets that
could have a material effect on the financial statements.
Inherent Limitations of Internal Financial Controls Over Financial Reporting
7. Because of the inherent limitations of internal financial controls over financial reporting, including the possibility of
collusion or improper management override of controls, material misstatements due to error or fraud may occur and
not be detected. Also, projections of any evaluation of the internal financial controls over financial reporting to future
periods are subject to the risk that the internal financial control over financial reporting may become inadequate
because of changes in conditions, or that the degree of compliance with the policies or procedures may deteriorate.
Opinion
8. In our opinion, the Company has, in all material respects, an adequate internal financial controls system over financial
reporting and such internal financial controls over financial reporting were operating effectively as at March 31, 2018,
based on the internal control over financial reporting criteria established by the Company considering the essential
components of internal control stated in the Guidance Note on Audit of Internal Financial Controls Over Financial
Reporting issued by the Institute of Chartered Accountants of India.
For Price Waterhouse & Co Chartered Accountants LLP
Firm Registration Number: 304056E/E 300009
Chartered Accountants
Sougata Mukherjee
Place: Jamshedpur, Partner
Date: April 24, 2018 Membership Number 057084

Fifty Fifth Annual Report 2017-18
78
Annexure B to Independent Auditors’ ReportReferred to in paragraph 11 of the Independent Auditors’ Report of even date to the members of TRF Limited on the
standalone financial statements as of and for the year ended March 31, 2018
i. (a) The Company is maintaining proper records showing full particulars, including quantitative details and situation,
of fixed assets.
(b) The fixed assets are physically verified by the Management according to a phased programme designed to
cover all the items over a period of threeyears which, in our opinion, is reasonable having regard to the size of
the Company and the nature of its assets. Pursuant to the programme, a portion of the fixed assets has been
physically verified by the Management during the year and no material discrepancies have been noticed on such
verification.
(c) The title deeds of immovable properties, as disclosed in Note: 3on fixed assets to the financial statements, are held
in the name of the Company.
ii. The physical verification of inventory have been conducted at reasonable intervals by the Management during the
year. The discrepancies noticed on physical verification of inventory as compared to book records was not material.
iii. The Company has not grantedany loans, secured or unsecured, to companies, firms, Limited Liability Partnerships or
other parties covered in the register maintained under Section 189 of the Act. Therefore, the provisions of Clause 3(iii),
(iii)(a), (iii)(b) and (iii)(c) of the said Order are not applicable to the Company.
iv. The Company has not granted any loans or made any investments, or provided any guarantees or security to the parties
covered under Section 185 and 186 in the current year. Therefore, the provisions of Clause 3(iv) of the said Order are not
applicable to the Company.
v. The Company has not accepted any deposits from the public within the meaning of Sections 73, 74, 75 and 76 of the
Act and the Rules framed there under to the extent notified.
vi. Pursuant to the rules made by the Central Government of India, the Company is required to maintain cost records as
specified under Section 148(1) of the Act in respect of its products.
We have broadly reviewed the same, and are of the opinion that, prima facie, the prescribed accounts and records
have been made and maintained. We have not, however, made a detailed examination of the records with a view to
determine whether they are accurate or complete.
vii. (a) According to the information and explanations given to us and the records of the Company examined by us, in
our opinion, the Company is generally regular in depositing undisputed statutory dues in respect of professional
tax and tax collected at source, though there has been a slight delay in a few cases, and is regular in depositing
undisputed statutory dues, including provident fund, employees’ state insurance, sales tax, income tax, service
tax, duty of customs, duty of excise, value added tax, cess, goods and service tax with effect from July 1, 2017and
other material statutory duesas applicable, with the appropriate authorities.
(b) According to the information and explanations given to us and the records of the Company examined by us, there
are no dues of duty of customs and goods and service tax which have not been deposited on account of any
dispute. The particulars of dues of income tax, sales tax, service tax and excise duty as at March 31, 2018 which
have not been deposited on account of a dispute, are as follows:
Name of the
statute
Nature of
dues
Amount
(Rs. in lacs)
Period to which the
amount relates
Forum where the dispute is pending
Income Tax
LawsIncome Tax
2437.99 2004-07, 2011-14 Appellate Authority-Tribunal Level
2698.691990-91, 1993-94, 1998-99,
2004-06, 2008-12
Appellate Authority-Upto Commissioner’s
Level
Sales Tax Act Sales Tax
1663.12 2006-07, 2008-12, 2013-14 Appellate Authority-Tribunal Level
884.551996-99, 2006-08, 2011-15 Appellate Authority-Upto Commissioner’s
Level

79
Name of the
statute
Nature of
dues
Amount
(Rs. in lacs)
Period to which the
amount relates
Forum where the dispute is pending
Excise Duty
LawsExcise Duty
1316.63 2006-15 Appellate Authority-Tribunal Level
75.862009-12, 2015-17 Appellate Authority-Upto Commissioner’s
Level
Service Tax
LawsService Tax
2895.07 2005-06, 2007-12 Appellate Authority-Tribunal Level
207.172002-05, 2006-07, 2009-17 Appellate Authority-Upto
Commissioner’s Level
viii. According to the records of the Company examined by us and the information and explanation given to us, the
Company has not defaulted in repayment of loans or borrowings to any financial institution or bank or Government or
dues to debenture holders as at the balance sheet date.
ix The Company has not raised any moneys by way of initial public offer, further public offer (including debt instruments)
and term loans. Accordingly, the provisions of Clause 3(ix) of the Order are not applicable to the Company.
x. During the course of our examination of the books and records of the Company, carried out in accordance with the
generally accepted auditing practices in India, and according to the information and explanations given to us, we have
neither come across any instance of material fraud by the Company or on the Company by its officers or employees,
noticed or reported during the year, nor have we been informed of any such case by the Management.
xi. The Company has paid/ provided for managerial remuneration in accordance with therequisite approvals mandated by
the provisions of Section 197 read with Schedule V to the Act.
xii. As the Company is not a Nidhi Company and the Nidhi Rules, 2014 are not applicable to it, the provisions of Clause 3(xii)
of the Order are not applicable to the Company.
xiii. The Company has entered into transactions with related parties in compliance with the provisions of Sections 177 and
188 of the Act. The details of such related party transactions have been disclosed in the financial statements as required
under Accounting Standard (IndAS) 24, Related Party Disclosures specified under Section 133 of the Act.
xiv. The Company has not made any preferential allotment or private placement of shares or fully or partly convertible
debentures during the year under review. Accordingly, the provisions of Clause 3(xiv) of the Order are not applicable to
the Company.
xv. The Company has not entered into any non-cash transactions with its directors or persons connected with him.
Accordingly, the provisions of Clause 3(xv) of the Order are not applicable to the Company.
xvi. The Company is not required to be registered under Section 45-IA of the Reserve Bank of India Act, 1934. Accordingly,
the provisions of Clause 3(xvi) of the Order are not applicable to the Company.
For Price Waterhouse & Co Chartered Accountants LLP
Firm Registration Number: 304056E/E 300009
Chartered Accountants
Sougata Mukherjee
Place: Jamshedpur, Partner
Date: April 24, 2018 Membership Number 057084

Fifty Fifth Annual Report 2017-18
80
Rs. lakhs
Notes As at As at 31.03.2018 31.03.2017 (I) ASSETS(1) Non-current assets (a) Property, plant and equipment 03 2,768.62 3,068.34 (b) Intangible assets 04 22.19 43.01 2,790.81 3,111.35 (c) Financial assets (i) Investments a) Investments in joint ventures 05 – 357.00 b) Investment in subsidiaries 06 18,126.82 18,126.82 c) Other investments 07 47.28 36.05 (ii) Other financial assets 08 60.29 2,536.12 (d) Other non-current assets 09 313.16 289.49 (e) Advance Income tax assets (net) 2,696.60 2,493.27 24,034.96 26,950.10 (2) Current Assets (a) Inventories and contracts in progress 10 8,378.35 12,832.99 (b) Financial assets (i) Trade receivables 11 34,817.36 44,817.69 (ii) Cash and cash equivalents 12 618.49 639.93 (iii) Other balances with Bank 12 533.67 18.19 (iv) Other financial assets 13 1,409.96 1,669.73 (v) Derivative assets 14 96.39 270.39 (c) Other current assets 15 5,274.32 6,038.34 51,128.54 66,287.26 TOTAL ASSETS 75,163.50 93,237.36(II) EQUITY AND LIABILITIES (1) Equity (a) Equity share capital 16 1,100.44 1,100.44 (b) Other equity 17 (20,076.89) (5,494.94) (18,976.45) (4,394.50)(2) Non-current liabilities (a) Financial liabilities (i) Borrowings 18 3,399.51 6,199.23 (b) Provisions 20 1,347.45 1,065.17 (c) Other non-current liabilities 21 25.90 21.53 (d) Deferred tax liabilities (net) 22 – 1,958.15 4,772.86 9,244.08 (3) Current liabilities (a) Financial liabilities (i) Borrowings 23 26,942.37 26,719.96 (ii) Derivative liabilities 19 5.30 35.07 (iii) Trade payables 24 29,947.09 31,090.93 (iv) Other financial liabilities 25 6,917.08 5,387.98 (b) Provisions 20 4,044.86 3,451.34 (c) Other current liabilities 26 19,464.86 19,656.97 (d) Current Income tax liabilities (net) 2,045.53 2,045.53 89,367.09 88,387.78 TOTAL EQUITY AND LIABILITIES 75,163.50 93,237.36 See accompanying notes forming part of the financial statements
In terms of our report of even date For and on behalf of the Board of Directors
For Price Waterhouse & Co Chartered Accountants LLP Sandip Biswas Sanjay Rajoria Chartered Accountants Chairman Managing Director Firm Registration No. : 304026E / E-300009Sougata Mukherjee K. S. Mathai Mathew Tarun Kr. Srivastava Partner (Membership no. : 057084) Chief Financial Officer Company SecretaryJamshedpur Mumbai, 24th April, 2018 24th April, 2018
Balance Sheet as at March 31, 2018

81
Notes Year ended Year ended
31.03.2018 31.03.2017
(1) Revenue from operations 27 35,395.12 51,978.69
(2) Other income 28 535.73 996.15
(3) Total Revenue (1) + (2) 35,930.85 52,974.84
(4) Expenses
(a) Cost of materials consumed 29 20,341.58 27,533.91
(b) Payment to sub-contractors 8,376.71 8,809.44
(c) Changes in inventories of finished products,
work in progress and contracts in progress 30 2,936.75 1,223.46
(d) Employee benefits expense 31 5,499.46 4,843.60
(e) Finance costs 32 4,674.16 4,561.54
(f ) Depreciation and amortisation expense 33 366.75 417.61
(g) Excise duty on sale of goods 241.97 1,395.23
(h) Other expenses 34 12,752.27 9,123.75
Total Expenses (4) 55,189.65 57,908.54
(5) Profit /(Loss) before exceptional items and tax (3) - (4) (19,258.80) (4,933.70)
(6) Exceptional Items
(a) Profit on sale of non-current investments 2,703.00 –
Total Exceptional Items (6) 2,703.00 –
(7) Profit/(Loss) before tax (5) + (6) (16,555.80) (4,933.70)
(8) Tax Expense
(a) Current tax
(i) Current tax for current year – –
(ii) Current tax for the previous years 35 – 108.58
(b) Deferred tax
(i) Deferred tax for current year 35 (1,958.15) (2,351.18)
Total tax expense (8) (1,958.15) (2,242.60)
(9) Profit /(Loss) for the period (7) - (8) (14,597.65) (2,691.10)
(10) Other comprehensive income
(a) Items that will not be reclassified to statement of profit and loss
(i) Equity instruments through other comprehensive income 11.23 9.28
(ii) Remeasurement of the employees defined benefit plans (11.16) (240.07)
Total other comprehensive income (10) 0.07 (230.79)
(11) Total comprehensive income for the period (9) + (10) (14,597.58) (2,921.89)
(12) Earnings per equity share: (Face value of share of Rs 10 each) 37
(a) Basic (132.65) (24.45)
(b) Diluted (132.65) (24.45)
See accompanying notes forming part of the financial statements
Statement of Profit and Loss for the year ended March 31, 2018Rs. lakhs
In terms of our report of even date For and on behalf of the Board of Directors
For Price Waterhouse & Co Chartered Accountants LLP Sandip Biswas Sanjay Rajoria
Chartered Accountants Chairman Managing Director
Firm Registration No. : 304026E / E-300009
Sougata Mukherjee K. S. Mathai Mathew Tarun Kr. Srivastava
Partner (Membership no. : 057084) Chief Financial Officer Company Secretary
Jamshedpur Mumbai,
24th April, 2018 24th April, 2018

Fifty Fifth Annual Report 2017-18
82
Cash Flow Statement for the year ended March 31, 2018Rs. lakhs
Year ended Year ended
31.03.2018 31.03.2017
A. Cash Flow from Operating activities:
Profit/(loss) for the period (14,597.65) (2,691.10)
Adjustments for:
Income tax expenses recognised in the statement of profit and loss (1,958.15) (2,242.60)
Depreciation and amortisation expense 366.75 417.61
Provision for doubtful debts and advances 6,767.95 1,623.02
Interest income (0.18) (329.15)
Dividend income (0.28) (285.84)
Profit on sale of non-current investment (2,703.00) –
Interest expenses 4,337.53 4,272.92
Exchange differences on long-term monetary
items amortised from FCMITDA 12.96 221.27
Net (gain)/loss on foreign currency derivatives 200.10 324.24
(Profit)/loss on sale of property, plant & equipments (0.65) (15.62)
Unrealised exchange loss/(gain) 0.75 12.13
Realised exchange loss/(gain) in respect of borrowing (165.40) (250.43)
Operating profit before working capital changes (7,739.27) 1,056.45
Adjustments for (increase)/decrease in operating assets
Inventories and contracts in progress 4,454.64 766.35
Trade receivables 5,518.96 7,448.87
Non-current financial assets 2,475.83 (2,195.00)
Other non-current assets (20.14) (13.52)
Current financial assets (2,009.02) 581.50
Other current assets 246.00 461.70
Adjustments for increase/(decrease) in operating liabilities
Trade payables (1,143.84) (211.56)
Other current liabilities (192.11) (1,563.83)
Provisions 864.64 317.00
Other non-current liabilities 4.37 5.83
Cash generated from/(used in) operations 2,460.06 6,653.79
Direct taxes refunded (203.33) (222.46)
Net cash (used in) / generated from operating activities 2,256.73 6,431.33
B. Cash Flow from Investing activities:
Purchase of property, plant & equipment (78.78) (77.46)
Sale of property, plant & equipment 15.29 35.36
Sale of non–current investments 3,060.00 –
Dividend received 0.28 285.84
Interest received 0.19 329.15
Net cash (used in) / from investing activities 2,996.98 572.89

83
In terms of our report of even date For and on behalf of the Board of Directors
For Price Waterhouse & Co Chartered Accountants LLP Sandip Biswas Sanjay Rajoria
Chartered Accountants Chairman Managing Director
Firm Registration No. : 304026E / E-300009
Sougata Mukherjee K. S. Mathai Mathew Tarun Kr. Srivastava
Partner (Membership no. : 057084) Chief Financial Officer Company Secretary
Jamshedpur Mumbai,
24th April, 2018 24th April, 2018
Year ended Year ended
31.03.2018 31.03.2017
C. Cash Flow from Financing activities:
Proceeds from /(payments against) bills discounted (net) (705.15) (237.96)
Proceeds from long-term borrowings 4,000.00 –
Proceeds from /(repayment against) working capital borrowings (net) 1,312.29 659.36
Proceeds from buyer’s credit 104.68 668.70
Repayment of long-term borrowings (5,052.94) (4,177.94)
Repayment of buyer’s credit (512.34) (302.90)
Premium paid on FC Options for long term loans (55.87) (175.64)
Interest and other borrowing costs paid (4,365.82) (4,185.72)
Net cash (used in) / from financing activities (5,275.15) (7,752.10)
Net increase/(decrease) in cash and cash equivalents (21.44) (747.88)
Cash and cash equivalents as at 1 April 639.93 1,387.81
Cash and cash equivalents as at 31 March 618.49 639.93
See accompanying notes forming part of the financial statements
Notes:
1. Cash and cash equivalents represents cash, cheques on hand and balances with banks. (Refer Note. 12)
2. Figures in brackets represent outflows.
Cash Flow Statement for the year ended March 31, 2018 (Contd.)Rs. lakhs

Fifty Fifth Annual Report 2017-18
84 Sta
tem
en
t o
f ch
an
ge
s in
eq
uit
y f
or
the
ye
ar
en
de
d M
arc
h 3
1, 2
01
8
A.
Eq
uit
y s
ha
re c
ap
ita
l
P
arti
cula
rs
Rs.
lakh
s
B
ala
nce
as
at
31
Ma
rch
20
17
1
,10
0.4
4
C
han
ges
in e
qu
ity
shar
e ca
pit
al d
uri
ng
th
e ye
ar e
nd
ed 3
1 M
arch
, 20
18
–
B
ala
nce
as
at
31
Ma
rch
20
18
1
,10
0.4
4
B.
Oth
er
eq
uit
y
R
s. la
khs
Stat
emen
t of c
hang
es in
eq
uity
Rese
rves
and
sur
plu
s
Item
s of
oth
er
com
pre
hens
ive
inco
me
Am
alga
mat
ion
rese
rve
Fore
ign
exch
ange
fluct
uati
on
rese
rve
Gen
eral
rese
rve
Fore
ign
curr
ency
mon
etar
y ite
m
tran
slat
ion
diff
eren
ce
acco
unt
Reta
ined
earn
ings
Equi
ty in
vest
men
t
thro
ugh
OC
I
Tota
l
equi
ty
Bala
nce
as a
t Mar
ch 3
1, 2
016
61.8
144
8.20
14,4
20.7
1(2
88.0
9)(1
7,50
3.79
)26
.73
(2,8
34.4
3)
Loss
for
the
year
--
--
(2,6
91.1
0)-
(2,6
91.1
0)
Ad
dit
ions
dur
ing
the
year
--
-40
.10
--
40.1
0
Reco
gnis
ed in
the
stat
emen
t of p
rofit
& lo
ss
dur
ing
the
year
--
-22
1.28
--
221.
28
Oth
er c
omp
rehe
nsiv
e in
com
e-
--
-(2
40.0
7)9.
28(2
30.7
9)
Bala
nce
as a
t Mar
ch 3
1, 2
017
61
.81
44
8.2
01
4,4
20
.71
(26
.71
)(2
0,4
34
.96
)3
6.0
1(5
,49
4.9
4)
Loss
for t
he y
ear
--
--
(14,
597.
65)
-(1
4,59
7.65
)
Ad
dit
ions
dur
ing
the
year
--
-2.
68-
-2.
68
Rec
og
nis
ed in
th
e st
atem
ent
of
pro
fit
and
loss
du
rin
g t
he
year
--
-1
2.9
5-
-1
2.9
5
Oth
er c
om
pre
hen
sive
inco
me
--
--
(11
.16
)1
1.2
30
.07
Bal
ance
as
at M
arch
31
, 20
18
61
.81
44
8.2
01
4,4
20
.71
(11
.08
)(3
5,0
43
.77
)4
7.2
4(2
0,0
76
.89
)
C.
Se
e a
cco
mp
an
yin
g n
ote
s fo
rmin
g p
art
of
the
fin
an
cia
l st
ate
me
nts
In t
erm
s o
f o
ur
rep
ort
of
even
dat
e Fo
r an
d o
n b
ehal
f o
f th
e B
oar
d o
f D
irec
tors
For
Pri
ce W
ate
rho
use
& C
o C
ha
rte
red
Acc
ou
nta
nts
LL
P
Sa
nd
ip B
isw
as
Sa
nja
y R
ajo
ria
Ch
arte
red
Acc
ou
nta
nts
C
ha
irm
an
M
an
ag
ing
Dir
ecto
r
Firm
Reg
istr
atio
n N
o. :
30
40
26
E /
E- 3
00
00
9
So
ug
ata
Mu
kh
erj
ee
K
. S. M
ath
ai
Ma
the
w
Ta
run
Kr.
Sri
va
sta
va
Par
tner
(Mem
ber
ship
no
. : 0
57
08
4)
Ch
ief F
ina
nci
al O
ffice
r C
om
pa
ny
Secr
eta
ry
Jam
shed
pu
r, M
um
bai
,
24
th A
pri
l, 2
01
8
24
th A
pri
l, 2
01
8

85
1. General corporate information
TRF Limited, (”the Company”) incorporated in 1962 has its Registered Office at 11 Station Road, Burma Mines, Jamshedpur
831007. The Company is listed on the National Stock Exchange of India Limited, BSE Limited and The Calcutta Stock Exchange
Limited. The Company undertakes turnkey projects of material handling for the infrastructure sector such as power and ports
and industrial sector such as steel plants, cement, fertilisers and mining. The Company is also engaged in production of such
material handling equipments at its manufacturing plant at Jamshedpur.
The financial statements are presented in Indian Rupee (INR) which is also Functional Currency of the Company.
2. Summary of significant accounting policies
2.01 Statement of compliance
The financial statements for the year ended March 31, 2018 have been prepared in accordance with Indian Accounting
Standards (“Ind AS”) under Section 133 of Companies Act, 2013 and Companies (Indian Accounting Standard) Rules
2015 (the rules) issued by Ministry of Corporate Affairs (MCA).
2.02 Basis of preparation and presentation
These separate financial statements of the Company are prepared under the historical cost convention except for certain
financial instruments that are measured at fair value at the end of each reporting period. Historical cost is generally
based on fair value of the consideration given in exchange for goods and services.
Fair value is the price that would be received to sell an asset or paid to transfer a liability in an orderly transaction between
market participants at the measurement date, regardless of whether that price is directly observable or estimated using
another valuation technique. In estimating the fair value of an asset or a liability, the Company takes into account the
characteristics of the asset or liability if market participants would take those characteristics into account when pricing
the asset or liability at the measurement date. In these separate financial statements, the fair value for measurement
and/or disclosure purpose is determined on such basis except for leasing transactions that are within the scope of Ind
AS 17, and measurements that have some similarities to fair value but are not fair value, such as net realisable value in
Ind AS 2 or value in use in Ind AS 36.
In addition, for financial reporting purposes, fair value measurements are catergorised in to Level 1, 2 or 3 based on the
degree to which the inputs to the fair value measurements are observable and the significance of the inputs to the fair
value measurement in its entirety. (Refer note 39.10).
Level 1 inputs are quoted prices (unadjusted) in active markets for identical assets or liabilities that the entity can
access at the measurement date;
Level 2 inputs are inputs, other than quoted prices included in Level 1, that are observable for the asset or liability,
either directly or indirectly; and
Level 3 inputs are unobservable inputs for the asset or liability.
2.03 Use of estimates
The preparation of separate financial statements in conformity with the recognition and measurement principles of Ind
AS requires the management of the Company to make estimates and assumptions that affect the reported balances of
assets and liabilities, disclosures relating to contingent liabilities as at the date of the separate financial statements and
the reported amounts of income and expense for the periods presented.
Estimates and underlying assumptions are reviewed on an ongoing basis. Revisions to accounting estimates are
recognised in the period in which the estimates are revised and future periods are affected.
In particular, information about significant areas of estimation uncertainty and critical judgments in applying accounting
policies that have the most significant effect on the amounts recognized in the financial statements are included in the
following notes:
Revenue from construction contracts (Refer Note 2.04(ii))
Useful lives of Property, plant and equipment & intangible assets (Refer Note 2.10 and 2.11)
Notes forming part of the financial statements
for the year ended March 31, 2018

Fifty Fifth Annual Report 2017-18
86
Notes forming part of the financial statements
for the year ended March 31, 2018
2. Summary of significant accounting policies (Contd.)
Assets and obligations relating to employee benefits (Refer Note 38)
Valuation and measurement of income taxes and deferred taxes (Refer Note 2.09)
Provisions and Contingencies (Refer Note 2.14)
Retention money receivable (Refer foot note below Note 11)
Going Concern (Refer Note 43.02)
2.04 Revenue recognition
Revenue is measured at fair value of the consideration received or receivable and is reduced by rebates, allowances and
taxes and duties collected on behalf of the government. The Company has assumed that recovery of excise duty flows
to the Company on its own account, for the reason that it is a liability of the manufacturer which forms part of the cost
of production, irrespective of whether the goods are sold or not. Accordingly revenue includes excise duty.
i) Sale of goods
Revenue from the sale of goods is recognised when the goods are delivered and titles have been passed, at which
time all the following conditions are satisfied:
the Company has transferred to the buyer the significant risks and rewards of ownership of the goods;
the Company retains neither continuing managerial involvement to the degree usually associated with
ownership nor effective control over the goods sold;
the amount of revenue can be measured reliably;
it is probable that the economic benefits associated with the transaction will flow to the Company; and
the costs incurred or to be incurred in respect of the transaction can be measured reliably.
The Company provides normal warranty for general repairs for 12 to 18 months on products sold in line with
industry practice. A liability is recognised at the time the product is sold.
ii) Construction contracts
Revenue from contracts are recognised on percentage completion method specified under Indian Accounting
Standard (Ind AS) 11 – Construction contracts. Profit (contract revenue less contract cost) is recognised when the
outcome of a construction contract can be estimated reliably. Revenue and costs are recognised by reference
to the stage of completion of the contract activity at the end of the reporting period, measured based on the
proportion of contract costs incurred for work performed to date relative to the estimated total contract costs,
except where this would not be representative of the stage of completion.
The outcome of a construction contract is considered as estimated reliably when (a) all critical approvals necessary
for commencement of the project have been obtained; (b) the stage of completion of the project reaches
reasonable level of development. The stage of completion is determined as a proportion that contract costs
incurred for work performed up to the closing date bear to the estimated total costs of respective project. Profit
(contract revenue less contract cost) is recognised when the outcome of the contract can be estimated reliably
and for contracts valued up to Rs. 100 crore, profit is recognised when stage of completion is 40% or more, and for
contracts valued more than Rs. 100 crore, profit is recognised either at 25% stage of completion or an expenditure
of Rs. 40 crore whichever is higher. When it is probable that the total cost will exceed the total revenue from the
contract, the expected loss is recognised immediately. For this purpose total contract costs are ascertained on
the basis of contract costs incurred and cost to completion of contracts which is arrived at by the management
based on current technical data, forecast and estimate of net expenditure to be incurred in future including for
contingencies etc. For determining the expected cost to completion of the contracts, cost of steel, cement and
other related items are considered at current market price based on fixed cost purchase orders placed or firm
commitments received from suppliers / contractors as these purchase orders and future firm commitments are
enforceable over the period of the contracts.

87
Notes forming part of the financial statements
for the year ended March 31, 2018
2. Summary of significant accounting policies (Contd.)
When the outcome of a construction contract cannot be estimated reliably, contract revenue is recognised to the
extent of contract costs incurred that is probably recoverable. Contract costs are recognised as expenses in the
period in which they are incurred.
When contract costs incurred to date plus recognised profit less recognised losses exceed progress billing, the
surplus is shown as amount due from customers for contract work. For contracts where progress billings exceed
contract costs incurred to date plus recognised profits less recognised losses, the surplus is shown as the amounts
due to customers for contract work. Amounts received before the related work is performed are included as a
liability as advances received. Amounts billed for work performed but not yet paid by customer are included
under trade receivables.
iii) Dividend and interest income
Dividend income is recognised when the company’s right to receive payment has been established and that the
economic benefits will flow to the Company and amount of income can be measured reliably.
Interest income from a financial asset is recognised when it is probable that the economic benefits will flow to
the Company and the amount of income can be measured reliably. Interest income is accrued on a time basis, by
reference to the principal outstanding and at the effective interest rate applicable, which is the rate that exactly
discounts estimated future cash receipts through the expected life of the financial asset to the asset’s net carrying
amount on initial recognition.
2.05 Lease
The Company as lessee
Assets leased by the Company in its capacity as a lessee, where substantially all the risks and rewards of ownership vest
in the Company are classified as finance leases. Such leases are capitalised at the inception of the lease at the lower of
the fair value and the present value of the minimum lease payments and a liability is created for an equivalent amount.
Each lease rental paid is allocated between the liability and the interest cost so as to obtain a constant periodic rate of
interest on the outstanding liability for each year.
Lease arrangements where the risks and rewards incidental to ownership of an asset substantially vest with the lessor
are recognised as operating leases. The Company’s significant operating leasing arrangements are for premises (office,
residence etc.,). The leasing arrangements which normally have a tenure of eleven months to three years are cancellable
with a reasonable notice, and are renewable by mutual consent at agreed terms. The aggregate lease rent payable is
charged as rent in the statement of profit and loss.
2.06 Foreign currencies
Transactions in currencies other than entity’s functional currency (foreign currency) are recorded at the rates of
exchange prevailing on the date of the transaction. Monetary assets and liabilities denominated in foreign currencies
(other than derivative contracts and net investment in non-integral foreign operations) remaining unsettled at the end
of the each reporting period are remeasured at the rates of exchange prevailing at that date. Non-monetary items
carried at fair value that are denominated in foreign currencies are retranslated at the rate prevailing at the date when
the fair value was determined. Non-monetary items that are measured in terms of historical cost in a foreign currency
are not retranslated.
Exchange difference on monetary items are recognised in the statement of profit and loss in the period in which they
arise except for exchange differences on monetary items receivable from or payable to a foreign operation for which
settlement is neither planned nor likely to occur (therefore forming part of the net investment in the foreign operation),
which are recognised initially in other comprehensive income and reclassified from equity to the statement of profit and
loss on disposal of the net investments.
2.07 Borrowing costs
Borrowing costs directly attributable to the acquisition, construction or production of qualifying assets, which are assets

Fifty Fifth Annual Report 2017-18
88
Notes forming part of the financial statements
for the year ended March 31, 2018
2. Summary of significant accounting policies (Contd.)
that necessarily take a substantial period of time to get ready for their intended use or sale, are added to the cost of
those assets, until such time as the assets are substantially ready for their intended use.
Interest income earned on the temporary investment of specific borrowings pending their expenditure on qualifying
assets is deducted from the borrowing cost eligible for capitalisation.
All other borrowing costs are recognised in profit or loss in the period in which they are incurred.
2.08 Employee benefits
i) Short-term benefits
Short term employee benefits are recognised as an expense at the undiscounted amount in the statement of
profit and loss of the year in which the related service is rendered.
ii) Defined contribution plans
Payments to defined contribution plans are recognised as an expense when employees have rendered services
entitling them to the contributions. Defined contribution plans are those plans where the Company pays fixed
contributions to funds/schemes managed by independent trusts or authority. Contributions are paid in return
for services rendered by the employees during the year. The company has no legal or constructive obligation to
pay further contributions if the fund/scheme does not hold sufficient assets to pay/extend employee benefits.
The Company provides Provident Fund facility to all employees and Superannuation benefits to selected
employees. The contributions are expensed as they are incurred in line with the treatment of wages and salaries.
The Company’s Provident Fund is exempted under section 17 of Employees’ Provident Fund and Miscellaneous
Provision Act, 1952. Conditions for exemption stipulate that the Company shall make good deficiency, if any, in the
interest rate declared by the trust vis-s-vis interest rate declared by the Employees’ Provident Fund Organisation.
The liability as on the balance sheet date is ascertained by an independent actuarial valuation.
iii) Defined benefit plans
The cost of providing defined benefit plans are determined using the projected unit credit method, with
independent actuarial valuations being carried out at the end of each reporting period. The Company provides
gratuity to its employees and pension to retired whole-time directors. Gratuity liabilities are funded and managed
through separate trust (except in case of some of the employees of Port and Yard Equipment Division where the
funds are managed by Life Insurance Corporation of India). The liabilities towards pension to retired whole-time
directors are not funded.
Remeasurements, comprising actuarial gains and losses, return on plan assets excluding amounts included in
net interest on the net benefit liability (asset) and any change in the effect of the asset ceiling (if applicable)
are recognised in the balance sheet with a charge or credit recognised in other comprehensive income in the
period in which they occur. Remeasurement recognised in the comprehensive income are not reclassified to the
statement of profit and loss but recognised directly in the retained earnings. Past service costs are recognised in
the statement of profit and loss in the period in which the amendment to plan occurs. Net interest is calculated by
applying the discount rate to the net defined liability or asset at the beginning of the period, taking into account
of any changes in the net defined benefit liability (asset) during the period as a result of contribution and benefit
payments.
Defined benefit costs which are recognised in the statement of profit and loss are categorised as follows:
- service cost (including current service cost, past service cost, as well as gains and losses on curtailments and
settlements); and
- net interest expense or income.
The retirement benefit obligation recognised in the standalone balance sheet represents the actual deficit or
surplus in the Company’s defined benefit plans. Any surplus resulting from this calculation is limited to the present
value of any economic benefits available in the form of refunds from the plans or reduction in future contributions
to the plans.

89
Notes forming part of the financial statements
for the year ended March 31, 2018
2. Summary of significant accounting policies (Contd.)
The liability for termination benefit is recognised at the earlier of when the entity can no longer withdraw the offer
of the termination benefit and when the entity recognises any related restructuring costs.
iv) Other Long-term benefits
The Company provides annual leave which are accumulating and vesting to its employees. The annual leave
benefit is not funded. The cost of providing annual leave benefits are determined using the projected unit credit
method, with independent actuarial valuations being carried out at the end of each reporting period. All actuarial
gains or losses are recognised in the statement of profit and loss in the period in which they occur.
2.09 Taxation
i) Current tax
Current tax is payable based on taxable profit for the year. Taxable profit differs from ‘profit before tax’ as reported
in the statement of profit and loss because of items of income or expense that are taxable or deductible in other
years and items that are never taxable or deductible. The current tax is calculated using tax rates that have been
enacted or substantively enacted by the end of the reporting period.
ii) Deferred tax
Deferred tax is recognised on temporary differences between the carrying amounts of assets and liabilities in
the separate financial statements and the corresponding tax bases used in the computation of taxable profits.
Deferred tax liabilities are generally recognised for all taxable temporary differences. Deferred tax assets are
generally recognised for all deductible temporary differences to the extent that is probable that taxable profits will
be available against which those deductible temporary differences can be utilised. Such deferred tax assets and
liabilities are not recognised if the temporary difference arises from the initial recognition of assets and liabilities
in a transaction that affects neither the taxable profit nor the accounting profit.
Deferred tax assets arising from the deductible temporary differences are only recognised to the extent it is
probable that there will be sufficient taxable profits against which the benefits of the temporary difference can be
utilised and they are expected to reverse in the foreseeable future.
The carrying amount of deferred tax assets is reviewed at the end of each reporting period and reduced to the
extent that it is no longer probable that sufficient taxable profits will be available to allow all or part of the asset to
be recovered.
Deferred tax liabilities and assets are measured at the tax rates that are expected to apply in the period in which the
liability is settled or the asset is realised, based on tax rates (and tax laws) that have been enacted or substantially
enacted by the end of the reporting period.
iii) Current and deferred tax are recognised in the statement of profit and loss, except when they relate to items that
are recognised in other comprehensive income or directly in equity, in which case, the current and deferred tax are
also recognised in other comprehensive income or directly in equity respectively.
2.10 Property, Plant and Equipment
Property, Plant and Equipment held for use in the production or supply of goods or services, or for administrative
purposes are stated at cost less accumulated depreciation and accumulated impairment losses. Cost includes purchase
cost of materials, including import duties and non-refundable taxes, any directly attributable costs of bringing an asset
to the location and condition of its intended use and borrowing costs capitalised in accordance with the Company’s
accounting policy.
Properties in the course of construction for production or supply of goods or services or for administrative purposes are
carried at cost, less any recognised impairment losses.
Depreciation is recognised so as to write off the cost of assets (other than properties under construction) less their
residual values over the useful lives, using the straight-line method. Depreciation of assets commences when the assets
are ready for their intended use. The estimated useful lives and residual values are reviewed at the end of each reporting
period, with the effect of any changes is accounted as change in estimate on a prospective basis.

Fifty Fifth Annual Report 2017-18
90
Notes forming part of the financial statements
for the year ended March 31, 2018
2. Summary of significant accounting policies (Contd.)
Estimated useful lives of the assets are as follows:
Buildings and Roads : 5 to 60 years
Plant and Equipment : 3 to 15 years
Electrical Installations : 10 years
Laboratory Equipment : 10 years
Furniture and Fixtures : 10 years
Office Equipments : 3 to 5 years
Computers : 3 years
Motor Vehicles : 5 to 8 years
An item of property, plant and equipment is derecognised upon disposal or when no future economic benefits are
expected to arise from the continued use of the asset. Any gain or loss arising on the disposal or retirement of an item
of property, plant and equipment is recognised in the statement of profit and loss.
2.11 Intangible assets
Intangible assets with finite useful lives that are acquired separately are carried at cost less accumulated amortisation
and accumulated impairment (if any) losses. Amortisation is recognised at straight-line basis over their estimated useful
lives. The estimated useful life and amortisation method are reviewed at the end of each reporting period, with the
effect of any changes in estimate being accounted for on a prospective basis. Intangible assets with indefinite useful
lives that are acquired separately are carried at cost less accumulated impairment losses.
Estimated useful lives of the intangible assets are as follows:
Software : 1 to 10 years
An intangible asset is derecognised upon disposal or when no future economic benefits are expected to arise from the
continued use of the asset. Any gain or loss arising on the disposal or retirement of intangible assets is recognised in
the statement of profit and loss.
2.12 Impairment of tangible and intangible assets
At the end of each reporting period, the Company reviews the carrying amounts of its tangible and intangible assets to
determine whether there is any indication that those assets have suffered any impairment loss. If any such indication
exists, the recoverable amount of the asset is estimated in order to determine the extent of the impairment loss (if
any). When it is not possible to estimate the recoverable amount of an individual asset, the Company estimates the
recoverable amount of the cash generating unit to which the asset belongs.
Intangible assets with indefinite useful lives and intangible assets not yet available for use are tested for impairment at
least annually, and whenever there is an indication that the asset may be impaired.
Recoverable amount is the higher of fair value less costs of disposal and value in use. In assessing value in use, the
estimated future cash flows are discounted to their present value using a pre-tax discount rate that reflects current
market assessments of the time value of money and risks specific to the asset for which the estimates of future cash
flows have not been adjusted.
If the recoverable amount of an asset or cash generating unit is estimated to be less than the carrying amount, the
carrying amount of the asset or cash generating unit is reduced to its recoverable amount. An impairment loss is
recognised immediately in the statement of profit and loss.
When an impairment loss subsequently reverses, the carrying value of the asset or cash generating unit is increased to
the revised estimate of its recoverable amount, but so that the increased carrying amount does not exceed the carrying
amount that would have been determined had no impairment loss been recognised for the asset or cash generating
unit in prior years. Any reversal of an impairment loss is recognised immediately in the statement of profit and loss.

91
Notes forming part of the financial statements
for the year ended March 31, 2018
2. Summary of significant accounting policies (Contd.)
2.13 Inventories
Raw materials, work-in-progress and finished products are valued at lower of cost and net realisable value after providing
for obsolescence and other losses, where considered necessary. Cost includes purchase price, non refundable taxes and
duties and other directly attributable costs incurred in bringing the goods to the point of sale. Work-in-progress and
finished goods include appropriate proportion of overheads and where applicable, excise duty.
Stores and spares are valued at cost comprising of purchase price, non refundable taxes and duties and other directly
attributable costs after providing for obsolescence and other losses, where considered necessary.
Value of inventories are generally ascertained on the “weighted average” basis.
2.14 Provisions, Contingent liabilities and Contingent assets
2.14.01 Provisions
Provisions are recognised when the Company has a present obligation (legal or constructive) as a result of past
event, it is probable that the Company will be required to settle the obligation, and a reliable estimate can be
made of the amount of the obligation.
The amount recognised as a provision is the best estimate of the consideration required to settle the present
obligation at the end of the reporting period, taking into account the risks and uncertainties surrounding the
obligation. When a provision is measured using the cash flows estimated to settle the present obligation,
its carrying amount is the present value of those cash flows (when the effect of the time value of money is
material).
When some or all of the economic benefits required to settle a provision are expected to be recovered from a
third party, a receivable is recognised as an asset if it is virtually certain that reimbursement will be received and
the amount of the receivable can be measured reliably.
2.14.02 Warranties
Provisions for the expected cost of warranty obligations under local sale of goods legislation are recognised
at the date of sale of the relevant products, at the management’s best estimate of the expenditure required to
settle the Company’s warranty obligation.
2.14.03 Onerous contracts
An onerous contract is considered to exist where the Company has a contract under which the unavoidable
costs of meeting the obligations under the contract exceed the economic benefits expected to be received
from the contract. Present obligation arising under onerous contracts are recognised and measured as
provisions.
2.14.04 Contingent liabilities and assets
Contingent liability is a possible obligation that arises from past events and the existence of which will be
confirmed only by the occurrence or non-occurrence of one or more uncertain future events not wholly
within the control of the Company, or is a present obligation that arises from past events but is not recognised
because either it is not probable that an outflow of resources embodying economic benefits will be required
to settle the obligation, or a reliable estimate of the amount of the obligation cannot be made. Contingent
liabilities are disclosed and not recognised. In the normal course of business, contingent liabilities may arise
from litigation and other claims against the company. Guarantees are also provided in the normal course of
business. There are certain obligations which management has concluded, based on all available facts and
circumstances, are not probable of payment or are very difficult to quantify reliably, and such obligations are
treated as contingent liabilities and disclosed in the notes but are not reflected as liabilities in the separate
financial statements. Although there can be no assurance regarding the final outcome of the legal proceedings
in which the company is involved, it is not expected that such contingencies will have a material effect on its
financial position or profitability.

Fifty Fifth Annual Report 2017-18
92
Notes forming part of the financial statements
for the year ended March 31, 2018
2. Summary of significant accounting policies (Contd.)
2.15 Financial instruments
Financial assets and financial liabilities are recognised when the Company becomes a party to the contractual provisions
of the instruments.
Financial assets and financial liabilities are initially measured at fair value. Transactions cost that are directly attributable
to the acquisition or issue of financial assets and financial liabilities (other than financial assets and financial liabilities
at fair value through profit and loss) are added to or deducted from the fair value of the financial assets or financial
liabilities, as appropriate, on initial recognition. Transactions cost directly attributable to the acquisition of financial
assets or financial liabilities at fair value through profit and loss are recognised immediately in the statement of profit
and loss.
2.16 Financial assets
All regular purchases or sales of financial assets are recognised and derecognised on a transaction date basis. Regular
purchases or sales are purchases or sales of financial assets that require delivery of assets within the time frame
established by regulation or convention in the marketplace. All recognised financial assets are subsequently measured
in their entirety at either amortised cost or fair value, depending on the classification of the financial assets.
2.16.01 Effective interest method
The effective interest method is a method of calculating the amortised cost of a debt instrument and of
allocating interest income over the relevant period. The effective interest rate is the rate that exactly discounts
estimated future cash receipts (including all fees and points paid or received that form an integral part of the
effective interest rate, transaction costs and other premium or discounts) through the expected life of the debt
instrument, or, where appropriate, a shorter period to the net carrying amount on initial recognition.
Income is recognised on an effective interest basis for debt instruments other than those financial assets
classified as at FVTPL. Interest income is recognised in the statement of profit and loss and is included in the
“Other income” line item.
2.16.02 Investments in equity instruments at fair value through other comprehensive income (FVTOCI)
On initial recognition, the Company can make an irrevocable election (on an instrument-by-instrument basis)
to present the subsequent changes in fair value in other comprehensive income pertaining to investments in
equity instruments. This election is not permitted if the equity investment is held for trading. These elected
investments are initially measured at fair value plus transaction costs. Subsequently, they are measured at
fair value with gains and losses arising from changes in fair value recognised in other comprehensive income
and accumulated in the ‘Reserve for equity instruments through other comprehensive income’. The cumulative
gain or loss is not reclassified to profit or loss on disposal of the investments.
A financial asset is held for trading if:
together and has a recent actual pattern of short-term profit-taking; or
The Company has equity investments in two entities, and elected to FVTOCI irrevocable option for both of
these investments.
Dividends on these investments in equity instruments are recognised in the statement of profit and loss when
the Company’s right to receive dividends is established, it is probable that the economic benefits associated
with the dividend will flow to the entity, the dividend does not represent a recovery of part of cost of the
investment and the amount of dividend can be measured reliably. Dividends are included as part of ‘Other
income’ in the profit and loss.

93
Notes forming part of the financial statements
for the year ended March 31, 2018
2. Summary of significant accounting policies (Contd.)
2.16.03 Financial assets at fair value through profit and loss (FVTPL)
Investments in equity instruments are classified as at FVTPL, unless the Company irrevocably elects on initial
recognition to present subsequent changes in fair value in other comprehensive income for investments in
equity instruments which are not held for trading (see note 2.16.02 above).
Financial assets at FVTPL are measured at fair value at the end of each reporting period, with any gains or
losses arising on re-measurement recognised in profit or loss. The net gain or loss recognised in profit or loss is
included in the ‘Other income’ line item.
2.16.04 Investment in Subsidiaries, Joint ventures and Associates
Investments in subsidiaries, joint venture and associates are measured at cost as per Ind AS 27 – Separate
Financial Statement.
2.16.05 Impairment of financial assets
The Company applies the expected credit loss model for recognising impairment loss on trade receivables,
other contractual rights to receive cash or other financial instruments. Expected credit losses are the weighted
average of credit losses with the respective risks of default occurring as the weights. Credit loss is the difference
between all contractual cash flows that are due to the Company in accordance with the contract and all the
cash flows that the Company expects to receive, discounted at the original effective interest rate. The Company
estimates cash flows by considering all contractual terms of the financial instrument.
The Company measures the loss allowance for a financial instrument at an amount equal to the lifetime
expected credit losses if the credit risk on that financial instrument has increased significantly since initial
recognition. If the credit risk on a financial instrument has not increased significantly since initial recognition,
the Company measures the loss allowance for that financial instrument at an amount equal to 12-month
expected credit losses. 12-month expected credit losses are portion of the life-time expected credit losses and
represent the lifetime cash shortfalls that will result if default occurs within the 12 months after the reporting
date and thus, are not cash shortfalls that are predicted over the next 12 months.
If the Company measures loss allowance for a financial instrument at life time expected credit loss model
in the previous period, but determines at the end of reporting period that the credit risk has not increased
significantly since initial recognition due to improvement in credit quality as compared to the previous period,
the Company again measures the loss allowances based on 12 months expected credit loss.
When making the assessment of whether there has been a significant increase in credit risk since initial
recognition, the Company uses the change in the risk of a default occurring over the expected life of the
financial instrument instead of the change in the amount of expected credit losses. To make that assessment,
the Company compares the risk of a default occurring on the financial instrument as at the reporting date with
the risk of a default occurring on the financial instrument as at the date of initial recognition and considers
reasonable and supportable information, that is available without undue cost or effort, that is indicative of
significant increases in credit risk since initial recognition.
For the trade receivables or any contractual right to receive cash or another financial asset that result from
transactions that are within the scope of Ind AS 11 and Ind AS 18, the Company always measures the loss
allowance at an amount equal to lifetime expected credit losses.
Further, for the purpose of measuring lifetime expected credit loss allowance for trade receivables, the
Company has used a practical expedient as permitted under Ind AS 109. This expected credit loss allowance is
computed based on a provision matrix which takes into account historical credit loss experience and adjusted
for forward-looking information.
The impairment requirements for the recognition and measurement of a loss allowance are equally applied to
debt instruments at FVTOCI except that the loss allowance is recognised in other comprehensive income and
is not reduced from the carrying amount in the balance sheet.

Fifty Fifth Annual Report 2017-18
94
Notes forming part of the financial statements
for the year ended March 31, 2018
2. Summary of significant accounting policies (Contd.)
2.16.06 Derecognition of financial assets
The Company derecognises a financial asset when the contractual rights to the cash flow from the asset expire,
or when it transfers the financial asset and substantially all the risks and rewards of ownership of the asset to
another party. If the Company neither transfers nor retains substantially all the risks and rewards of ownership
and continues to control the transferred asset, the Company recognises its retained interest in the asset and
an associated liability for amounts it may have to pay. If the Company retains substantially all the risks and
rewards of ownership of a transferred financial asset, the Company continues to recognise the financial asset
and also recognises a collateralised borrowing for the proceeds received.
On derecognition of financial asset in its entirety, the difference between the asset’s carrying amounts and the
sum of the consideration received and receivable and the cumulative gain or loss that had been recognised
in other comprehensive income and accumulated in equity is recognised in the statement of profit and loss if
such gain or loss would have otherwise been recognised in the statement of profit and loss on disposal of that
financial asset.
On derecognition of a financial asset other than in its entirety (e.g. when the Company retains an option to
repurchase part of a transferred asset), the Company allocates the previous carrying amount of the financial
asset between the part it continues to recognise under continuing involvement, and the part it no longer
recognises on the basis of the relative fair values of those parts on the date of the transfer. The difference
between the carrying amount allocated to the part that is no longer recognised and the sum of the
consideration received for the part no longer recognised and any cumulative gain or loss allocated to it that
had been recognised in other comprehensive income is recognised in profit or loss if such gain or loss would
have otherwise been recognised in profit or loss on disposal of that financial asset. A cumulative gain or loss
that had been recognised in other comprehensive income is allocated between the part that continues to be
recognised and the part that is no longer recognised on the basis of the relative fair values of those parts.
2.16.07 Foreign exchange gain and losses
The fair value of financial assets denominated in a foreign currency is determined in that foreign currency and
translated at the spot rate at the end of each reporting period.
For foreign currency denominated financial assets measured at amortised cost and FVTPL, the exchange
differences are recognised in the statement of profit and loss.
Changes in the carrying amount of investments in equity instruments at FVTOCI relating to changes in foreign
currency rates are recognised in other comprehensive income.
2.17 Financial liabilities and equity instruments
2.17.01 Classification as debt or equity
Debt and equity instruments issued by the Company are classified as either financial liabilities or as equity in
accordance with the substance of the contractual arrangements and the definition of a financial liability and
an equity instrument.
2.17.02 Classification as debt or equity
An equity instrument is any contract that evidences a residual interest in the assets of an entity after deducting
all of its liabilities. Equity instruments issued by the Company are recognised at the proceeds received, net of
direct issue costs.
2.17.03 Financial liabilities
All financial liabilities are subsequently measured at amortised cost using the effective interest method
or at FVTPL. However, financial liabilities that arise when a transfer of a financial asset does not qualify for
derecognition or when the continuing involvement approach applies, financial guarantee contracts issued by

95
Notes forming part of the financial statements
for the year ended March 31, 2018
2. Summary of significant accounting policies (Contd.)
the Company, and commitments issued by the Company to provide a loan at below-market interest rate are
measured in accordance with the specific accounting policies set out below.
2.17.03 (i) Financial liabilities at FVTPL
Financial liabilities are classified as at FVTPL when the financial liability is either contingent consideration
recognised by the Company as an acquirer in a business combination to which Ind AS 103 applies or is held for
trading or it is designated as at FVTPL.
Financial liabilities at FVTPL are stated at fair value, with any gains or losses arising on remeasurement
recognised in profit or loss. The net gain or loss recognised in profit or loss incorporates any interest paid on
the financial liability and is included in the ‘Other income’ line item.
2.17.03 (ii) Financial liabilities subsequently measured at amortised cost
Financial liabilities that are not held-for-trading and are not designated as at FVTPL are measured at amortised
cost at the end of subsequent accounting periods. The carrying amounts of financial liabilities that are
subsequently measured at amortised cost are determined based on the effective interest method. Interest
expense that is not capitalised as part of costs of an asset is included in the ‘Finance costs’ line item.
2.17.04 Financial guarantee contracts
A financial guarantee contract is a contract that requires the issuer to make specified payments to reimburse
the holder for a loss it incurs because a specified debtor fails to make payments when due in accordance with
the terms of a debt instrument.
Financial guarantee contracts issued by a Company are initially measured at their fair values and, if not
designated as at FVTPL, are subsequently measured at the higher of:
the amount of loss allowance determined in accordance with impairment requirements of Ind AS 109; and
the amount initially recognised less, when appropriate, the cumulative amount of income recognised in
accordance with the principles of Ind AS 18
2.17.05Foreign exchange gains and losses
For financial liabilities that are denominated in a foreign currency and are measured at amortised cost at the
end of each reporting period, the foreign exchange gains and losses are determined based on the amortised
cost of the instruments and are recognised in ‘Other income’.
The fair value of financial liabilities denominated in a foreign currency is determined in that foreign currency
and translated at the spot rate at the end of the reporting period. For financial liabilities that are measured as at
FVTPL, the foreign exchange component forms part of the fair value gains or losses and is recognised in profit
or loss.
2.17.06 Derecognition of financial liabilities
The Company derecognises financial liabilities when, and only when, the Company’s obligations are discharged,
cancelled or have expired. An exchange between with a lender of debt instruments with substantially different
terms is accounted for as an extinguishment of the original financial liability and the recognition of a new
financial liability. Similarly, a substantial modification of the terms of an existing financial liability (whether or
not attributable to the financial difficulty of the debtor) is accounted for as an extinguishment of the original
financial liability and the recognition of a new financial liability. The difference between the carrying amount
of the financial liability derecognised and the consideration paid and payable is recognised in profit or loss.
2.17.07 Derivative financial instruments
The Company enters into a variety of derivative financial instruments to manage its exposure to interest rate
and foreign exchange rate risks, including foreign exchange forward contracts, interest rate swaps and cross
currency swaps.

Fifty Fifth Annual Report 2017-18
96
Notes forming part of the financial statements
for the year ended March 31, 2018
2. Summary of significant accounting policies (Contd.)
Derivatives are initially recognised at fair value at the date the derivative contracts are entered into and are subsequently
remeasured to their fair value at the end of each reporting period. The resulting gain or loss is recognised in profit or loss
immediately unless the derivative is designated and effective as a hedging instrument, in which event the timing of the
recognition in profit or loss depends on the nature of the hedging relationship and the nature of the hedged item.
2.18 Segment
Information reported to the Chief operating decision maker (CODM) for the purpose of resource allocation and
assessment of segment performance focuses based on products and services. Accordingly, directors of the Company
have chosen to organise the segment based on its product and services as follows:
Products & services
Project & services.
The Company’s chief operating decision maker is the Managing Director.
Revenue and expenses directly attributable to segment are reported under each reportable segment. Expenses which
are not directly identifiable to each reporting segment have been allocated on the basis of associated revenue of the
segment and manpower efforts. All other expenses which are not attributable or allocable to segments have been
disclosed as Unallocable expenses.
Assets and liabilities that are directly attributable or allocable to segments are disclosed under each reportable segment.
All other assets and liabilities are disclosed as Unallocable.
The company’s financing and income taxes are managed on a company level and are not allocated to operating
segment.
2.19 Earning per share
Basic earnings per share is computed by dividing the profit after tax before other comprehensive income by the
weighted average number of equity shares outstanding during the financial year.
Diluted earning per share is computed by dividing the profit after tax by the weighted average number of equity and
dilutive equity equivalent shares outstanding during the year, except where the results would be anti-dilutive.
2.20 Recent accounting pronouncements - Standards issued but not yet effective:
The Standards issued but not yet effective upto the date of issuance of the Company’s financial statements is disclosed
below. The Company intends to adopt this Standard when it becomes effective.
Ind AS - 115 : Revenue from contracts with customers.
Ind AS - 12 : Income taxes
Ind AS - 40 : Investment property
Ind AS - 21 : Foreign currency transaction and advance considerations
The Ministry of Corporate Affairs (MCA) has notified (Indian Accounting Standards ) (Amendment) Rules 2017 to amend
the above Ind ASs. The amendment will come into force from accounting period commencing on or after April 1, 2018.
The company is in the process of assessing the possible impact of Ind AS - 115, Ind AS - 12 and Ind AS - 21 and will adopt
the amendment on required effective date where as Ind AS - 40 is not applicable to the company.

97
No
tes
form
ing
pa
rt o
f th
e fi
na
nci
al
sta
tem
en
ts
for
the
ye
ar
en
de
d M
arc
h 3
1, 2
01
8
03
. P
rop
ert
y, p
lan
t a
nd
eq
uip
me
nt
R
s. la
khs
Build
ing
and
Road
s
Plan
t and
Mac
hine
ry
Elec
tric
al
Inst
alla
tion
Lab
orat
ory
Equi
pm
ent
Furn
itur
e an
d
fixtu
res
Offi
ce
Equi
pm
ents
Mot
or
Vehi
cles
Tota
l
Co
st o
r d
ee
me
d c
ost
Bala
nce
at M
arch
31,
201
62,
124.
961,
307.
0814
6.97
12.9
256
.56
45.1
388
.24
3,78
1.86
Ad
dit
ions
–62
.09
5.40
0.46
0.16
4.05
12.1
784
.33
Dis
pos
als
––
(6.2
1)–
(13.
48)
–(7
.01)
(26.
70)
Bala
nce
at M
arch
31,
201
72,
124.
961,
369.
1714
6.16
13.3
843
.24
49.1
893
.40
3,83
9.49
Ad
dit
ions
–10
.96
2.22
16.1
8–
9.06
21.8
860
.30
Dis
pos
als
–(5
.37)
(0.1
3)–
––
(32.
09)
(37.
59)
Ba
lan
ce a
t M
arc
h 3
1, 2
01
82
,12
4.9
61
,37
4.7
61
48
.25
29
.56
43
.24
58
.24
83
.19
3,8
62
.20
Acc
um
ula
ted
de
pre
ciat
ion
Bala
nce
at M
arch
31,
201
610
0.15
218.
9229
.06
0.94
10.6
613
.91
24.0
339
7.67
Dep
reci
atio
n ex
pen
se88
.93
217.
5429
.02
1.47
9.93
11.9
121
.64
380.
44
Dis
pos
als
––
(1.2
3)–
(2.7
8)–
(2.9
5)(6
.96)
Bala
nce
at M
arch
31,
201
718
9.08
436.
4656
.85
2.41
17.8
125
.82
42.7
277
1.15
Dep
reci
atio
n ex
pen
se82
.49
201.
1827
.48
2.08
6.89
10.4
514
.81
345.
38
Dis
pos
als
–(3
.65)
(0.1
2)–
––
(19.
18)
(22.
95)
Ba
lan
ce a
t M
arc
h 3
1, 2
01
82
71
.57
63
3.9
98
4.2
14
.49
24
.70
36
.27
38
.35
1,0
93
.58
Ca
rryi
ng
am
ou
nt
Bala
nce
at M
arch
31,
201
62,
024.
811,
088.
1611
7.91
11.9
845
.90
31.2
264
.21
3,38
4.19
Ad
dit
ions
–62
.09
5.40
0.46
0.16
4.05
12.1
784
.33
Dis
pos
als
––
(4.9
8)–
(10.
70)
–(4
.06)
(19.
74)
Dep
reci
atio
n e
xpen
se(8
8.9
3)
(21
7.5
4)
(29
.02
)(1
.47
)(9
.93
)(1
1.9
1)
(21
.64
)(3
80
.44
)
Bal
ance
at
Mar
ch 3
1, 2
01
71
,93
5.8
89
32
.71
89
.31
10
.97
25
.43
23
.36
50
.68
3,0
68
.34
Ad
dit
ion
s–
10
.96
2.2
21
6.1
8–
9.0
62
1.8
86
0.3
0
Dis
po
sals
–(1
.72
)(0
.01
)–
––
(12
.91
)(1
4.6
4)
Dep
reci
atio
n e
xpen
se(8
2.4
9)
(20
1.1
8)
(27
.48
)(2
.08
)(6
.89
)(1
0.4
5)
(14
.81
)(3
45
.38
)
Ba
lan
ce a
t M
arc
h 3
1, 2
01
81
,85
3.3
97
40
.77
64
.04
25
.07
18
.54
21
.97
44
.84
2,7
68
.62
No
te: F
or
det
ails
of
carr
yin
g a
mo
un
t o
f as
sets
ple
dg
ed a
s se
curi
ty fo
r se
cure
d b
orr
ow
ing
s re
fer
no
te 1
8.

Fifty Fifth Annual Report 2017-18
98
Notes forming part of the financial statements
for the year ended March 31, 2018
As at As at
31.03.2018 31.03.2017
Rs. lakhs Rs. lakhs
04. Intangible assets
Carrying amount of :
(a) Computer software 22.19 43.01
Total 22.19 43.01
Total
Computer
Software
Rs. lakhs
Cost or deemed cost
Balance at March 31, 2016 119.11
Additions 31.97
Disposals -
Balance at March 31, 2017 151.08
Additions 0.55
Disposals -
Balance at March 31, 2018 151.63
Accumulated amortisation
Balance at March 31, 2016 70.90
Amortisation expense 37.17
Disposals -
Balance at March 31, 2017 108.07
Amortisation expense 21.37
Disposals -
Balance at March 31, 2018 129.44
Carrying amount
Balance at March 31, 2016 48.21
Additions 31.97
Disposals -
Amortisation expense (37.17)
Balance at March 31, 2017 43.01
Additions 0.55
Disposals -
Amortisation expense (21.37)
Balance at March 31, 2018 22.19

99
Notes forming part of the financial statements
for the year ended March 31, 2018
As at 31.03.2018 As at 31.03.2017
Qty Amount Qty Amount
Nos. Rs. lakhs Nos. Rs. lakhs
Non-current investments
05. Investments in joint ventures (carried at cost)
Unquoted Investments (all fully paid)
Investments in Equity Instruments of
Adhitya Automobile Applications Private Limited
at face value of Rs. 10 each. - - 3,570,000 357.00
Total aggregate Unquoted investments - - 3,570,000 357.00
06. Investments in subsidiaries (carried at cost)
Unquoted Investments (all fully paid)
Investments in Equity Instruments of
TRF Holdings Pte Limited at face value of SGD 1 each 1 * 1 *
TRF Singapore Pte Limited at face value of SGD 1 each 50,288,324 18,126.82 50,288,324 18,126.82
Total aggregate Unquoted investments 50,288,325 18,126.82 50,288,325 18,126.82
* Represent values below Rs 1,000
07. Other non-current investments
(Carried at fair value through other comprehensive income)
a) Quoted Investments (all fully paid)
Investments in Equity Instruments of
HDFC Bank Limited 2,500 47.28 2,500 36.05
Total aggregate Quoted investments 2,500 47.28 2,500 36.05
b) Unquoted Investments (all fully paid)
Investments in Equity Instruments of
Nicco Jubilee Park Limited 30,000 3.00 30,000 3.00
Less: Provision for diminution in value - (3.00) - (3.00)
Total aggregate Unquoted investments 30,000 - 30,000 -
Total aggregate other non-current investments 32,500 47.28 32,500 36.05
Total non-current investments 18,174.10 18,519.87
Aggregate book value of quoted investment 47.28 36.05
Aggregate market value of quoted investment 47.28 36.05
Aggregate carrying value of unquoted investments 18,126.82 18,483.82

Fifty Fifth Annual Report 2017-18
100
Notes forming part of the financial statements
for the year ended March 31, 2018
As at As at
31.03.2018 31.03.2017
Rs. lakhs Rs. lakhs
8. Other non-current financial assets
(Unsecured considered good)
(a) Security deposits 58.80 20.12
(b) Others (Refer foot note under note 42) 1.49 2,516.00
60.29 2,536.12
9. Other non-current assets
(a) Capital advances
Considered good 5.75 2.22
Considered doubtful 90.58 90.58
96.33 92.80
Less: Provision for doubtful advances 90.58 90.58
5.75 2.22
(b) Advance with public bodies
i) Excise 172.58 154.71
ii) Sales tax/value added tax 132.47 118.10
305.05 272.81
(c) Other loans and advances
Prepayments 2.36 14.46
2.36 14.46
313.16 289.49
10. Inventories and contracts in progress (At lower of cost and net realisable value)
a) Inventories
i) Raw materials (At lower of cost and net realisable value) 2,109.94 3,596.88
ii) Work-in-progress (At lower of cost and net realisable value) 2,172.02 2,458.23
iii) Finished products (At lower of cost and net realisable value) 1,343.34 1,957.78
iv) Stores and spare parts (At or lower than cost) 80.66 93.04
v) Loose tools (At or lower than cost) 25.16 43.73
5,731.12 8,149.66
b) Contracts in Progress 2,647.23 4,683.33
Total inventories 8,378.35 12,832.99
Cost of inventories includes the following which are in transit
Raw materials - 28.32
1. The cost of inventories recognised as an expense during the year in respect of write downs of inventory to its net
realisable value was Rs 116.13 lakhs (for the year ended March 31, 2017 : Rs 146.00 lakhs).
2. The mode of valuation of inventories has been stated in note 2.13.
3. For details of carrying amount of inventories pledged as security for secured borrowings refer note 18.

101
Notes forming part of the financial statements
for the year ended March 31, 2018 As at As at
31.03.2018 31.03.2017
Rs. lakhs Rs. lakhs
11. Trade receivables (current)
(a) Unsecured, considered good 34,817.36 44,817.69
(b) Unsecured considered doubtful 12,584.59 8,103.22
47,401.95 52,920.91
Less :Allowances for doubtful debts (12,584.59) (8,103.22)
34,817.36 44,817.69
Notes:
1. Above includes Rs. 24,058.87 lakhs (31.03.2017 Rs 24,903.02 lakhs) retention money which are realisable on completion
of the performance guarantee test as per the terms of the relevant contract.
2. Above is net of retention money recoverable amounting to Rs 1,000.00 lakhs ( 31.03.2017 Rs 1,928.53 lakhs) which have
been collected against submission of Bank guarantee. Corresponding liability is disclosed as ‘Advance received from
customer’s under note no-26(a)
3. For details of carrying amount of trade receivables pledged as security for secured borrowings refer note 18.
4. The credit period given to customers range from 0 to 30 days. No interest is charged on the overdue amounts.
The Company has used a practical expedient by computing the expected credit loss allowance for trade receivables
based on a provision matrix. The provision matrix takes into account historical credit loss experience and adjusted for
forward-looking information. The expected credit loss allowance for trade receivable due for more than 12 months, 24
months and 36 months provision is recorded at 25%, 50% and 100% respectively. For Retention receivable due for more
than 12 months and 24 months provision is recorded at 50% and 100% respectively.
As at As at
31.03.2018 31.03.2017
Movement in Provision for doubtful debts Rs. lakhs Rs. lakhs
Opening balance 8,103.22 6,480.20
Additions during the year 4,822.44 2,306.31
Write back during the year (341.07) (683.29)
Closing balance 12,584.59 8,103.22
12. Cash and bank balances
(a) Cash and cash equivalents
(i) Cash on hand 4.57 6.56
(ii) Cheques on hand - 3.90
(iii) Remittance in transit - 133.35
(iv) Balances with banks
In current accounts 509.31 385.65
In cash credit accounts 104.61 110.47
Total cash and cash equivalents 618.49 639.93
(b) Other bank balances
In dividend accounts 8.99 18.19
Earmarked balance for Margin money 46.68 -
Earmarked balance for Interest 478.00 -
Other balances with Bank 533.67 18.19
Total cash and bank balances 1,152.16 658.12
Included above
(i) Earmarked balance for unpaid dividend 8.99 18.19

Fifty Fifth Annual Report 2017-18
102
Notes forming part of the financial statements
for the year ended March 31, 2018
As at As at
31.03.2018 31.03.2017
Rs. lakhs Rs. lakhs
13. Other financial assets
(a) Security deposits
Considered good 25.30 31.62
Considered doubtful 115.19 107.06
140.49 138.68
Less: Provision for doubtful deposits 115.19 107.06
25.30 31.62
(b) Receivable from related parties (Refer note 40.02)
i) Interest accrued on loans and advances 833.67 809.23
ii) Guarantee fees 81.77 165.05
(c) Others : Considered Good 469.22 663.83
Others : Considered doubtful 2,285.10 -
2,754.32 663.83
Less : Provision for doubtful advances 2,285.10 -
469.22 663.83
1,409.96 1,669.73
14. Derivative assets
(a) Interest rate swaps 6.87 14.43
(b) Foreign currency options 89.52 255.96
96.39 270.39
15. Other current assets
(a) Advance with public bodies
i) Service tax - 801.60
ii) Excise 1.57 219.88
iii) Sales tax/Value added tax
Considered good 3,004.97 3,053.46
Considered doubtful 23.12 29.78
3,028.09 3,083.24
Less: Provision for doubtful advances 23.12 29.78
3,004.97 3,053.46
iv) Goods and Service tax 549.26 -
(b) Advances to related parties (Refer note 40.02) 151.43 281.14
(c) Other loans and advances
i) Advance to suppliers 535.60 1,115.92
ii) Other advances and prepayments
Prepayments 210.58 298.68
Others 820.91 267.66
1,031.49 566.34
5,274.32 6,038.34

103
Notes forming part of the financial statements
for the year ended March 31, 2018
16. Share capital As at As at
31.03.2018 31.03.2017
Rs. lakhs Rs. lakhs
Authorised:
30,000,000 Equity Shares of Rs. 10 each 3,000.00 3,000.00
(as at March 31, 2017 : 30,000,000 Equity Shares of Rs. 10 each) 3,000.00 3,000.00
Issued, Subscribed and fully paid up:
11,004,412 Equity Shares of Rs. 10 each 1,100.44 1,100.44
(as at March 31, 2017 : 11,004,412 Equity Shares of Rs. 10 each) 1,100.44 1,100.44
Issued and subscribed capital excludes 635 equity share of Rs. 10 each reserved for allotment to shareholders who were not
able to subscribe to the rights issue during the earlier years for genuine reasons or where the title is temporarily in dispute.
Reconciliation of number of shares and amount outstanding at the beginning and end of the reporting period
For the year ended For the year ended
31.03.2018 31.03.2017
No. of Shares Amount No. of Shares Amount
Rs. lakhs Rs. lakhs
Equity shares
Issued, subscribed and fully paid up:
At beginning & end of the year 11,004,412 1,100.44 11,004,412 1,100.44
Details of shares held by shareholders holding more than 5% of the aggregate shares in the Company
As at 31.03.2018 As at 31.03.2017
No. of Shares % No. of Shares %
Tata Steel Limited 3,753,275 34.11% 3,753,275 34.11%
Rights, preferences and restrictions attached to shares
Equity shares
The company has one class of equity shares having a par value of Rs.10 per share. Each shareholder is entitled for one vote
per share held. The dividend proposed by the board of directors is subject to the approval of the shareholders in the ensuing
annual general meeting, except in case of interim dividend. In the event of liquidation, the equity shareholders are entitled
to receive the remaining assets of the Company after distribution of all preferential amounts, in proportion to the number of
equity shares held by the shareholders.
As at As at
31.03.2018 31.03.2017
Rs. lakhs Rs. lakhs
17. Other equity
a) Amalgamation reserve 61.81 61.81
b) Foreign exchange fluctuation reserve 448.20 448.20
c) General reserve 14,420.71 14,420.71
d) Foreign currency monetary item translation difference (11.08) (26.71)
e) Reserve for equity investment through OCI 47.24 36.01
f ) Retained earnings (35,043.77) (20,434.96)
(20,076.89) (5,494.94)

Fifty Fifth Annual Report 2017-18
104
Notes forming part of the financial statements
for the year ended March 31, 2018
As at As at
31.03.2018 31.03.2017
Rs. lakhs Rs. lakhs
Amalgamation reserve
Opening and closing balance 61.81 61.81
General reserve
Opening and closing balance 14,420.71 14,420.71
Foreign exchange fluctuation reserve
Opening and closing balance 448.20 448.20
Foreign currency monetary item translation difference account
Opening balance (26.71) (288.09)
Add: Additions during the year 2.68 40.10
Less: Recognised in the statement of profit and loss during the year 12.95 221.28
Closing balance (11.08) (26.71)
Reserve for equity investment through OCI
Opening balance 36.01 26.73
Other Comprehensive Income 11.23 9.28
Closing balance 47.24 36.01
Retained Earnings
Opening balance (20,434.96) (17,503.79)
Loss for the year (14,597.65) (2,691.10)
Other Comprehensive Income (11.16) (240.07)
Closing balance (35,043.77) (20,434.96)
(20,076.89) (5,494.94)
Note :
(a) General reserve : The general reserve is used from time to time to transfer profits from retained earnings for appropriation
purposes. As the general reserve is created by a transfer from one component of equity to another and is not an item of other
comprehensive income, items included in the general reserve will not be reclassified subsequently to profit or loss.
(b) Reserve for equity instrument through other comprehensive income (OCI) : This reserve represents the cumulative gains and
losses arising on the revaluation of equity instruments measured at fair value through OCI, net of amounts reclassified to the
retained earnings when those assets have been disposed of.
(c) Foreign currency translation reserve : Foreign operation for which settlement is neither planned nor likely to occur (therefore
forming part of the net investment in the foreign operation), which are recognised initially in other comprehensive income
and reclassified from equity to profit and loss on repayment of the monetary items or disposal of investment.
(d) Foreign currency monetary item translation difference reserve : Exchange differences arising on settlement and remeasurement
of long-term foreign currency monetary items are accumulated in “Foreign Currency Monetary Item Translation Difference
Account” and amortised over the maturity period or upto the date of settlement of such monetary items, whichever is earlier,
and charged to the Statement of profit and loss.
18. Non-current borrowings
A. Secured at amortised cost
(a) Term loans
From banks 3,399.51 6,199.23
Total non-current borrowings 3,399.51 6,199.23

105
No
tes
form
ing
pa
rt o
f th
e fi
na
nci
al
sta
tem
en
ts
for
the
ye
ar
en
de
d M
arc
h 3
1, 2
01
81
8.
Bo
rro
win
gs
at
am
ort
ise
d c
ost
(C
on
td…
)
As
at 3
1.0
3.2
01
8A
s at
31.
03.2
017
Se
curi
ty &
re
pay
me
nt
term
s
Nam
e of
the
ban
kN
on
-
curr
en
t
Cu
rre
nt
Cu
rre
nt
Mat
uri
ty o
f
lon
g t
erm
de
bts
(Re
fer
No
te 2
5)
Non
-
curr
ent
Cur
rent
Cur
rent
Mat
urit
y of
long
term
deb
ts
(Ref
er N
ote
25)
Rs.
lak
hs
Rs.
lak
hs
Rs.
lak
hs
Rs. l
akhs
Rs. l
akhs
Rs. l
akhs
Den
a Ba
nk-
-2
50
.00
250.
00-
500.
00Se
cure
d b
y p
ari p
assu
firs
t ch
arge
on
all t
he fi
xed
ass
ets
and
sec
ond
char
ge o
n al
l cu
rren
t as
sets
of
the
Com
pan
y Th
e lo
an i
s re
pay
able
qua
rter
ly in
eq
ual i
nsta
lmen
t.
Axi
s Ba
nk L
imite
d-
-1
,01
6.8
41,
004.
70-
1,33
3.13
Secu
red
by
par
i pas
su fi
rst c
harg
e on
the
fixed
ass
ets
of th
e C
omp
any,
pre
sent
an
d
futu
re
exce
pt
asse
ts
char
ged
ex
clus
ivel
y to
Sm
all
Ind
ustr
ies
Dev
elop
men
t Ba
nk o
f Ind
ia (S
IDBI
), an
d s
econ
d c
harg
e on
all c
urre
nt a
sset
s of
the
Com
pan
y. T
he lo
an is
rep
ayab
le q
uart
erly
in
equa
l ins
talm
ent i
n U
SD.
Axi
s Ba
nk L
imite
d1
,57
2.0
1-
1,8
63
.68
3,44
5.15
-1,
557.
70Se
cure
d b
y p
ari p
assu
firs
t cha
rge
on th
e fix
ed a
sset
s of
the
Com
pan
y,
pre
sent
an
d
futu
re
exce
pt
asse
ts
char
ged
ex
clus
ivel
y to
Sm
all
Ind
ustr
ies
Dev
elop
men
t Ba
nk o
f Ind
ia (S
IDBI
), an
d p
ari p
assu
sec
ond
char
ge o
n al
l cu
rren
t as
sets
of
the
Com
pan
y. T
he l
oan
is r
epay
able
qua
rter
ly in
eq
ual i
nsta
lmen
t.
Axi
s Ba
nk L
imite
d-
4,9
64
.74
--
4,97
1.65
-Se
cure
d b
y p
ari p
assu
firs
t ch
arge
on
all c
urre
nt a
sset
s of
com
pan
y
and
par
i pas
su s
econ
d c
harg
e on
all
fixed
ass
ets
of C
omp
any
exce
pt
asse
ts e
xclu
sive
ly c
harg
ed to
SID
BI.
Ind
usin
d B
ank
Lim
ited
--
--
-79
2.12
Secu
red
by
par
i pas
su fi
rst
char
ge o
n th
e m
ovea
ble
fixe
d a
sset
s an
d
par
i pas
su s
econ
d c
harg
e on
cur
rent
ass
ets
wit
h ot
her
term
lend
ers
exce
pt a
sset
s ex
clus
ivel
y ch
arge
d.
Can
ara
Bank
-2
,44
8.0
3-
-2,
351.
12-
Secu
red
by
par
i p
assu
firs
t ch
arge
on
stoc
k an
d b
ook
deb
ts o
f th
e
Com
pan
y, a
nd s
econ
d c
harg
e on
Pla
nt a
nd M
achi
nery
exc
ept
asse
ts
char
ged
exc
lusi
vely
to S
IDBI
.
Bank
of B
arod
a-
5,4
93
.95
--
5,49
9.57
-Se
cure
d b
y fir
st p
ari p
assu
cha
rge
on c
urre
nt a
sset
s of
the
Com
pan
y
and
sec
ond
cha
rge
on a
ll th
e fix
ed a
sset
s of
the
Com
pan
y ex
cep
t
asse
ts c
harg
ed e
xclu
sive
ly to
SID
BI.
Cen
tral
Ban
k of
Ind
ia-
1,9
78
.09
--
1,91
4.72
-Se
cure
d b
y p
ari
pas
su c
harg
e on
cur
rent
ass
ets
of t
he C
omp
any
in f
avou
r of
the
len
din
g b
anks
on
reci
pro
cal
bas
is u
nder
mul
tip
le
ban
king
arr
ange
men
ts.

Fifty Fifth Annual Report 2017-18
106
No
tes
form
ing
pa
rt o
f th
e fi
na
nci
al
sta
tem
en
ts
for
the
ye
ar
en
de
d M
arc
h 3
1, 2
01
8
18
. B
orr
ow
ing
s a
t a
mo
rtis
ed
co
st (
Co
ntd
…)
As
at 3
1.0
3.2
01
8A
s at
31.
03.2
017
Se
curi
ty &
re
pay
me
nt
term
s
Nam
e of
the
ban
kN
on
-
curr
en
t
Cu
rre
nt
Cu
rre
nt
Mat
uri
ty o
f
lon
g t
erm
de
bts
(Re
fer
No
te 2
5)
Non
-
curr
ent
Cur
rent
Cur
rent
Mat
urit
y of
long
term
deb
ts
(Ref
er N
ote
25)
Rs.
lak
hs
Rs.
lak
hs
Rs.
lak
hs
Rs. l
akhs
Rs. l
akhs
Rs. l
akhs
IDBI
Ban
k Li
mite
d-
2,0
41
.75
--
971.
55-
Secu
red
by
par
i p
assu
firs
t ch
arge
on
enti
re c
urre
nt a
sset
s of
the
com
pan
y. R
epay
able
qua
rter
ly in
eq
ual i
nsta
lmen
t.
HD
FC B
ank
Lim
ited
-7
,41
3.5
2-
-7,
500.
00-
Secu
red
by
par
i pas
su fi
rst
char
ge o
n cu
rren
t as
sets
of t
he C
omp
any,
bot
h p
rese
nt a
nd f
utur
e an
d p
ari
pas
su s
econ
d c
harg
e on
all
the
mov
able
pla
nt a
nd m
achi
nery
of
the
Com
pan
y, b
oth
pre
sent
and
futu
re e
xcep
t ass
ets
char
ged
exc
lusi
vely
to S
IDBI
. Rep
ayab
le q
uart
erly
in e
qua
l ins
talm
ent.
Ind
ian
Bank
-2
,49
4.1
9-
-2,
313.
38-
Secu
red
by
par
i pas
su fi
rst
char
ge o
n cu
rren
t as
sets
of t
he C
omp
any,
exce
pt
stoc
k of
raw
mat
eria
ls p
urch
ased
und
er b
ill d
isco
unti
ng
(com
pon
ents
) sc
hem
e of
SID
BI a
nd p
ari p
assu
sec
ond
cha
rge
on a
ll
fixed
ass
ets
of th
e C
omp
any.
Buye
r’s C
red
it fr
om B
anks
-1
08
.09
--
492.
82-
Secu
red
by
hyp
othe
cati
on, r
anki
ng p
ari p
assu
, of a
ll ta
ngib
le m
ovab
le
asse
ts in
clud
ing
in p
arti
cula
r sto
cks
of ra
w m
ater
ials
oth
er th
an th
ose
pur
chas
ed u
nder
bill
dis
coun
ting
(co
mp
onen
ts)
sche
me
of S
IDBI
,
finis
hed
goo
ds,
wor
k-in
-pro
gres
s, c
onsu
mab
les,
sp
ares
and
oth
er
mov
able
ass
ets
and
boo
k d
ebts
, out
stan
din
g an
d o
ther
rece
ivab
les.
Bills
Dis
coun
ted
wit
h
SID
BI
--
--
705.
15-
Secu
red
by
par
i pas
su fi
rst c
harg
e on
sp
ecifi
ed a
sset
IDBI
49
9.9
7-
99
9.4
11,
499.
38-
998.
80Se
cure
d b
y p
ari p
assu
firs
t ch
arge
on
all fi
xed
ass
ets
of t
he c
omp
any
and
par
i p
assu
sec
ond
cha
rge
over
ent
ire c
urre
nt a
sset
s of
the
com
pan
y.
Kota
k M
ahin
dra
Ban
k Lt
d1
,32
7.5
3-
2,6
33
.96
--
-Se
cure
d b
y p
ari p
assu
firs
t ch
arge
on
all fi
xed
ass
ets
of t
he c
omp
any
and
par
i p
assu
sec
ond
cha
rge
over
ent
ire c
urre
nt a
sset
s of
the
com
pan
y ex
cep
t the
ass
ets
spec
ifica
lly c
harg
ed to
SID
BI.
Tota
l sec
ure
d b
orr
ow
ing
3,3
99
.51
26
,94
2.3
66
,76
3.8
96,
199.
2326
,719
.96
5,18
1.75
N
ote
: A
ll ca
sh c
red
its
are
rep
ayab
le o
n d
eman
d.

107
As at As at 31.03.2018 31.03.2017
Rs. lakhs Rs. lakhs
19. Derivative liabilities - current
(a) Foreign currency forward contracts 5.30 35.07
5.30 35.0720. Provisions
A) Current
(a) Provision for employee benefits i) Post retirement pension 86.63 57.54 ii) Compensated absence 647.39 709.18 (b) Provision for estimated losses on onerous contracts 3,212.38 2,562.54 (c) Provision for warranty 98.46 122.08
4,044.86 3,451.34 B) Non-current
(a) Provision for employee benefits i) Post retirement pension 924.91 645.80 ii) Retirement gratuity 422.54 419.37 1,347.45 1,065.17
21. Other non-current liabilities
(a) Pension payable under employee separation scheme 10.05 13.17 (b) Deposit from employees 15.85 8.36
25.90 21.53
22. Deferred tax balances
The following is the analysis of deferred tax assets/(liabilities) presented in the balance sheet: Deferred tax assets 5,282.17 5,282.17 Deferred tax liabilities (5,282.17) (7,240.32)
- (1,958.15)
For the year ended 31.03.2018
Deferred tax (liabilities)/assets in relation to:
Opening balance
Recognised in profit and
loss
Recognised in other
comprehensive income
Recognised in equity
Closing Balance
Property, plant and equipment (301.25) 22.07 - - (279.18)
FCTR (129.56) - - - (129.56)
Deferred revenue on account of retention (6,809.51) 77.02 - - (6,732.49)
Provision for doubtful debts 557.47 5.41 - - 562.88
Provision for onerous contracts 886.84 235.69 - - 1,122.53
Provision for warranty 42.24 (7.84) - - 34.40
Provision for employee benefits 245.43 (19.21) - - 226.22
Others 60.54 0.59 - - 61.13
Effect of deferment of revenue 64.48 (64.49) - - (0.01)
Tax losses 3,425.17 1,708.91 - - 5,134.08
(1,958.15) 1,958.15 - - -
Notes forming part of the financial statements
for the year ended March 31, 2018

Fifty Fifth Annual Report 2017-18
108
For the year ended 31.03.2017
Opening balance
Recognised in profit and
loss
Recognised in other
comprehensive income
Recognised in equity
Closing Balance
Property, plant and equipment (360.42) 59.17 - - (301.25)
FCTR (200.38) 70.82 - - (129.56)
Deferred revenue on account of retention (7,470.40) 660.89 - - (6,809.51)
Provision for doubtful debts 557.47 - - - 557.47
Provision for onerous contracts 616.60 270.24 - - 886.84
Provision for warranty 37.79 4.45 - - 42.24
Provision for employee benefits 231.96 13.47 - - 245.43
Others 84.90 (24.36) - - 60.54
Effect of deferment of revenue 95.00 (30.52) - - 64.48
Tax losses 2,098.15 1,327.02 - - 3,425.17
(4,309.33) 2,351.18 - - (1,958.15)
Deferred tax assets/(liabilities) not created in relation to:
As at As at
31.03.2018 31.03.2017
Rs. lakhs Rs. lakhs
Tax losses 3,707.84 2,517.13
Unabsorbed Tax depreciation 164.34 40.48
Other Temporary differences 5,018.81 2,423.99
8,890.99 4,981.60
23. Current Borrowings
A. Secured - at amortised cost (Refer note 18)
(a) Repayable on demand
From banks
i) Working capital demand loans - 7,500.00
ii) Cash credit 26,834.28 18,021.99
(c) Other loans
i) Buyer’s credit 108.09 492.82
ii) Bills discounted. with SIDBI - 705.15
Total secured borrowings 26,942.37 26,719.96
B. Unsecured
(a) Term loan from others - -
Total unsecured borrowings - -
Total borrowings 26,942.37 26,719.96
Notes forming part of the financial statements
for the year ended March 31, 2018

109
Notes forming part of the financial statements
for the year ended March 31, 2018
As at As at
31.03.2018 31.03.2017
Rs. lakhs Rs. lakhs
24. Trade payables
(a) Total outstanding dues to micro enterprises and small enterprises. (Refer note 43.01) 437.71 260.34
(b) Total outstanding dues of creditors other than micro enterprises and small enterprises 29,170.26 30,471.30
(c) Creditors for accrued wages and salaries 339.12 359.29
29,947.09 31,090.93
25. Other current financial liabilities
(a) Current maturities of long-term debts 6,763.89 5,181.75
(b) Interest accrued but not due on borrowings 2.49 39.88
(c) Interest accrued and due on borrowings 120.80 112.85
(d) Unpaid dividends 9.40 18.60
(e) Creditors for purchase of fixed assets 20.50 34.90
6,917.08 5,387.98
26. Other current liabilities
(a) Advance received from customers 6,162.96 6,796.56
(b) Dues to customers under contracts in progress 12,177.04 11,791.30
(c) Pension payable under employee separation scheme 2.91 5.87
(d) Employee recoveries and employer’s contributions 747.58 680.72
(e) Statutory dues 347.08 350.57
(f ) Other credit balances 27.29 31.95
19,464.86 19,656.97
There are no amounts that are due to be transferred to the Investor Education and Protection Fund in accordance with the
relevant provisions of the Companies Act, 2013.
27. Revenue from operations
(a) Revenue from project business 23,006.29 35,582.51
(b) Sale of products 10,839.69 14,588.97
(c) Sale of services 1,549.14 1,807.21
Revenue from operations 35,395.12 51,978.69
28. Other income
(a) Interest income
i) On income tax refunds - 328.93
ii) Others 0.18 0.22
(b) Dividend income
i) From subsidiary / joint venture - 285.60
ii) From other non-current investments 0.28 0.24
(c) Guarantee fee from subsidiaries 29.32 60.20
(d) Net gain on sale of fixed assets 0.65 15.62
(e) Gain on foreign currency transactions (net) 112.14 -
(f ) Liabilities/provision no longer required written back 321.54 154.57
(g) Miscellaneous income 71.62 150.77
Total other income 535.73 996.15

Fifty Fifth Annual Report 2017-18
110
Notes forming part of the financial statements
for the year ended March 31, 2018
For the For the
year ended year ended
31.03.2018 31.03.2017
Rs. lakhs Rs. lakhs
29. Cost of materials consumed
Raw materials consumed
(a) Opening stock 3,596.88 3,116.84
(b) Add: Purchases 18,854.64 28,013.95
22,451.52 31,130.79
(c) Less: Closing stock 2,109.94 3,596.88
Total raw materials consumed 20,341.58 27,533.91
30. Changes in inventories of finished products, work in progress and contracts in progress
Inventories and contracts in progress at the beginning of the year
(a) Finished products 1,957.78 1,530.70
(b) Work-in-progress 2,458.23 2,258.14
(c) Contracts in progress 4,683.33 6,533.96
9,099.34 10,322.80
Inventories and contracts in progress at the end of the year
(a) Finished products 1,343.34 1,957.78
(b) Work-in-progress 2,172.02 2,458.23
(c) Contracts in progress 2,647.23 4,683.33
6,162.59 9,099.34
Net (increase)/decrease 2,936.75 1,223.46
31. Employee benefits expense
(a) Salaries and wages, including bonus
(Net of excess provision written back Rs 578 lakhs in 31 March 2017) 4,394.97 3,654.53
(b) Company’s contribution to provident and other funds 604.48 625.51
(c) Workmen and staff welfare expenses 500.01 563.56
Total employee benefits expense 5,499.46 4,843.60
32. Finance costs
(a) Interest expense 4,337.53 4,272.92
(b) Bank charges 336.63 288.62
Total finance costs 4,674.16 4,561.54
33. Depreciation and amortisation expense
(a) Depreciation and amortisation on tangible assets 345.38 380.44
(b) Depreciation and amortisation on Intangible assets 21.37 37.17
Total depreciation and amortisation expense 366.75 417.61

111
Notes forming part of the financial statements
for the year ended March 31, 2018
For the For the
year ended year ended
31.03.2018 31.03.2017
Rs. lakhs Rs. lakhs
34. Other expenses
(a) Consumption of stores, spare parts and loose tools 440.62 537.02
(b) Repairs to buildings 483.35 518.91
(c) Repairs to plant and machinery 229.14 304.00
(d) Repairs to others 23.98 67.50
(e) Power and fuel 369.97 347.56
(f ) Rent 303.23 306.84
(g) Rates, taxes and licenses 108.14 32.96
(h) Taxes and duties (net)
i) Sales tax 37.71 113.72
ii) Excise duty (273.16) 203.99
iii) Service tax 123.51 518.31
iv) GST 537.23 -
(i) Insurance charges 224.48 247.44
(j) Freight and handling charges 821.50 1,051.75
(k) Service charges (collection and order procurement) 9.44 16.86
(l) Travelling, conveyance and car running expenses 410.11 598.97
(m) Legal and professional fees 1,029.65 1,110.22
(n) Provision for doubtful debts and advances 6,767.95 1,623.02
(o) Provision for estimated losses on onerous contracts 649.84 759.17
(p) Provision for warranty expenses (23.62) 12.87
(q) Other general expenses
i) Loss on foreign currency transactions (net) - 24.89
ii) Net (gain)/loss on derivatives 200.10 324.24
iii) Directors’ fee 29.50 42.50
iv) Telephone expenses 60.60 78.89
v) Auditors remuneration and out-of-pocket expenses
As Auditors - Statutory audit 72.45 74.10
For Taxation matters 4.50 5.00
For Other Services 5.00 6.05
Auditors’ out-of-pocket expenses 5.27 10.34
vi) Others 101.78 186.63
Total other expenses 12,752.27 9,123.75

Fifty Fifth Annual Report 2017-18
112
35. Income tax recognised in profit and loss For the For the
year ended year ended
31.03.2018 31.03.2017
Rs. lakhs Rs. lakhs
Current tax
In respect of the current year – –
In respect of prior years – 108.58
– 108.58
Deferred tax
In respect of the current year (1,958.15) (2,351.18)
(1,958.15) (2,351.18)
Note : In view of losses during the year only adjustment is reversal of deferred tax liability created in previous years and hence
reconciliation statement is not given.
36. Segment information
36.01 Products and services from which reportable segment derives their revenues
Information reported to the Chief operating decision maker (CODM) for the purpose of resource allocation and assessment
of segment performance focuses based on products and services. Accordingly, directors of the Company have chosen to
organise the segment based on its product and services as follows:
The Company’s chief operating decision maker is the Managing Director.
Revenue and expenses directly attributable to segment are reported under each reportable segment. Expenses which are not
directly identifiable to each reporting segment have been allocated on the basis of associated revenue of the segment and
manpower efforts. All other expenses which are not attributable or allocable to segments have been disclosed as Unallocable
expenses.
Assets and liabilities that are directly attributable or allocable to segments are disclosed under each reportable segment. All
other assets and liabilities are disclosed as Unallocable.
The company’s financing and income taxes are managed on a company level and are not allocated to operating segment.
Notes forming part of the financial statements
for the year ended March 31, 2018

113
Notes forming part of the financial statements
for the year ended March 31, 2018
36.02 Segment revenue and results
Segment revenue Segment profit
Year ended Year ended Year ended Year ended
31.03.2018 31.03.2017 31.03.2018 31.03.2017
Rs. lakhs Rs. lakhs Rs. lakhs Rs. lakhs
Products and Services 18,785.82 27,610.10 692.26 4,201.45
Projects and Services 24,865.49 38,267.28 (15,326.24) (4,756.19)
43,651.31 65,877.38 (14,633.98) (554.74)
Inter–segment revenue 8,256.19 13,898.69 – –
Total 35,395.12 51,978.69 (14,633.98) (554.74)
Unallocated other income 164.78 796.08
Unallocated corporate costs (452.07) (902.12)
Interest costs (4,337.53) (4,272.92)
Profit on sale of non–current investments 2,703.00 –
Profit / (loss) before tax (16,555.80) (4,933.70)
Segment profit represents the profit and loss before tax earned by each segment without allocation of corporate costs, shares
of profit of joint ventures, other income, as well as interest costs. This is the measure reported to the executive management
committee for the purposes of resource allocation and assessment of segment performance.
36.03 Segment assets and liabilities
As at As at
31.03.2018 31.03.2017
Rs. lakhs Rs. lakhs
Segment assets
Products and Services 18,620.80 23,828.38
Projects and Services 31,017.22 43,407.80
Total segment assets 49,638.02 67,236.18
Unallocated 25,525.48 26,001.18
Total assets 75,163.50 93,237.36
Segment liabilities
Products and Services 11,954.56 12,563.29
Projects and Services 41,074.51 42,666.46
Total segment liabilities 53,029.07 55,229.75
Unallocated 41,110.88 42,402.11
Total liabilities 94,139.95 97,631.86

Fifty Fifth Annual Report 2017-18
114
Notes forming part of the financial statements
for the year ended March 31, 2018
36.04 Other segment information
Depreciation and amortisation Addition to fixed assets
Year ended Year ended Year ended Year ended
31.03.2018 31.03.2017 31.03.2018 31.03.2017
Rs. lakhs Rs. lakhs Rs. lakhs Rs. lakhs
Products and Services 266.77 291.17 22.96 31.14
Projects and Services 42.54 52.65 24.33 28.43
Unallocated 57.44 73.79 13.56 13.07
366.75 417.61 60.85 72.64
36.05 Revenue from major products and services
The following is an analysis of the Company’s revenue from continuing operations from its reportable segments.
Year ended Year ended
31.03.2018 31.03.2017
A) Products and services Rs. lakhs Rs. lakhs
(i) Idler rollers and components 2,262.61 3,837.04
(ii) Sectional and mine conveyors 3,678.77 3,797.51
(iii) Vibrating screens and components 1,675.14 2,216.12
(iv) Crushers and components 1,282.36 1,631.72
(v) Miscellaneous 1,630.75 2,229.01
B) Projects and services
i) Construction contracts and related services 24,865.49 38,267.29
35,395.12 51,978.69
In the Company’s operations within India there is no significant difference in the economic conditions prevailing in the
various states of India. Revenue from sales to customers outside India is less than 10% in the current and previous year. Hence
disclosures on geographical segment are not applicable.
36.06 Information about major customers
Included in revenue arising from direct sales of goods and services (excluding excise duty) of Rs 35,395.12 lakhs (March 31,
2017: Rs 50,583.46 lakhs) are revenues of approximately Rs. 22,402.61 lakhs (March 31, 2017: Rs 30,200.50 lakhs) which arose
of the sale to the company’s top three customers. No other single customer contributed 10% or more of the Company’s
revenue for both 2017–2018 and 2016–2017.
37. Earnings per share Year ended Year ended
31.03.2018 31.03.2017
Rs. lakhs Rs. lakhs
Basic & diluted earnings per share
The earnings and weighted average number of equity shares used in the calculation of
basic earnings per share are as follows:
Profit for the year attributable to owners of the Company (14,597.65) (2,691.10)
Weighted average number of equity shares for the purposes of basic earnings per share 11,004,412 11,004,412
Basic & diluted earnings per share (132.65) (24.45)
The Company is not having any potential ordinary shares which are dilutive in nature. Hence diluted earnings per share is
not calculated separately.

115
Notes forming part of the financial statements
for the year ended March 31, 2018
38. Employee Benefit plans
38.01 Defined contribution plans
The Company provide Provident Fund facility to all employees. The Company provides superannuation benefits to selected
employees. The assets of the plans are held separately from those of the Company in funds under the control of the trustees
in case of trust or of the employees provident fund organisation. The contributions are expensed as they are incurred in
line with the treatment of wages and salaries. The Company’s Provident Fund is exempted under section 17 of Employees’
Provident Fund and Miscellaneous Provision Act, 1952. Conditions for exemption stipulate that the Company shall make good
deficiency, if any, in the interest rate declared by the trust vis–a–vis interest rate declared by the Employees’ Provident Fund
Organisation. The liability as on the balance sheet date is ascertained by an independent actuarial valuation.
The Company has recognised an amount of Rs. 463.93 lakhs as expenses for the year ended March 31, 2018 (For the year
ended March 31, 2017: Rs. 507.92 lakhs) towards contribution to the following defined contribution plans.
Year ended Year ended
31.03.2018 31.03.2017
Rs. lakhs Rs. lakhs
Provident fund 182.54 201.93
Employees pension scheme 86.63 91.14
Superannuation fund 194.76 214.85
463.93 507.92
38.02 Defined benefit plans
The Company provides Gratuity benefit to all employees. The Company provides post retirement pension for retired whole–
time directors. The assets of the gratuity plans are held separately from those of the Company in funds under the control
of the trustees of the independent trusts or with the life insurance companies. The board of trustees of the gratuity fund
composed of an equal number of representatives from both employees and employers. The board of the Fund is required by
law and by the trust deed to act in the interest of the Fund and of all relevant stakeholders in the scheme. The board of trustee
of the fund and management of life insurance company is responsible for the investment policy with regard to the assets of
the Fund. Post retirement pension plan is not funded.
Under the gratuity plan, the employees with minimum five years of continuous service are entitled to lumpsum payment at
the time of separation calculated based on the last drawn salary and number of years of service rendered with the Company.
Under the post retirement pension, the Company pays monthly pension to retired whole–time directors as decided by the
board of directors.
These plans expose the Company to actuarial risks such as investment risk, interest rate risk, longevity risk and salary risk.
Investment Risk The present value of the defined benefit plan liability (denominated in Indian Rupee) is calculated using
a discount rate which is determined by reference to market yields at the end of the reporting period
on government bonds. Currently, for the plan in India, it has relatively balanced mix of investments in
government securities and other debt instruments.
Interest risk A decrease in the bond interest rate will increase the plan liability.
Longevity risk The present value of the defined benefit plan liability is calculated by reference to the best estimate of the
mortality of plan participants both during and after their employment. An increase in the life expectancy
of the plan participants will increase the plan’s liability.
Salary risk The present value of the defined benefit plan liability is calculated by reference to the future salaries of plan
participants. As such, an increase in the salary of the plan participants will increase the plan’s liability.
In respect of the plan in India, the most recent actuarial valuation of the plan assets and the present value of defined benefit
obligation were carried out as at March 31, 2018 by an independent actuary, Fellow of the Institute of Actuaries of India. The
present value of the defined benefit obligation, and the related current service cost and past service cost, were measured
using the projected unit credit method.
During the year ended March 31, 2018 and March 31, 2017 there was no amendment, curtailments and settlements in the
gratuity plan and post retirement pension plans.

Fifty Fifth Annual Report 2017-18
116
Notes forming part of the financial statements
for the year ended March 31, 2018
Gratuity Plan
Year ended Year ended
31.03.2018 31.03.2017
Rs. lakhs Rs. lakhs
Movement in the fair value of the plan assets
a) Opening fair value of plan assets 1,236.45 1,377.75
b) Acquisition adjustment – 48.55
c) Interest income on plan assets 85.40 95.06
d) Employer’s contribution 155.40 60.26
e) Return on plan assets greater / (lesser) than discount rate (1.28) 17.57
f ) Benefits paid (188.08) (362.74)
g) Closing fair value of plan assets 1,287.89 1,236.45
Movement in the present value of the defined benefit obligation
a) Opening defined benefit obligation 1,655.82 1,560.43
b) Current service cost 116.63 105.77
c) Interest cost 109.32 106.88
d) Acquisitions (credit) / cost – 48.55
e) Remeasurement (gain) / loss
i) Actuarial (gains) / loss arising from changes in financial assumptions (54.54) 99.59
ii) Actuarial (gains) / loss arising from experience adjustments 101.96 97.34
iii) Actuarial (gains) / loss arising from demographic assumptions (30.68) –
f ) Benefits paid (188.08) (362.74)
g) Closing defined benefit obligation 1,710.43 1,655.82
Components of defined benefit costs recognised:
I. Components of defined benefit costs recognised in profit and loss
a) Service Costs:
– Current service cost 116.63 105.77
– Past service cost and (gain)/loss from settlements – –
b) Net interest expenses 23.92 11.82
Subtotal 140.55 117.59
II. Components of defined benefit costs recognised in other comprehensive income
a) Remeasurement on the net defined benefit liability:
– Return on plan assets (excluding amounts included in net interest expense) 1.28 (17.57)
– Actuarial (gains)/loss arising from changes in financial assumptions (85.21) 99.59
– Actuarial (gains)/loss arising from experience adjustments 101.96 97.33
Subtotal 18.03 179.35
III. Total defined benefit cost recognised 158.58 296.94

117
Notes forming part of the financial statements
for the year ended March 31, 2018
As at As at
31.03.2018 31.03.2017
Rs. lakhs Rs. lakhs
Amount included in the standalone balance sheet arising
from defined benefit plan obligation
a) Present value of funded defined benefit obligation (1,710.43) (1,655.82)
b) Fair value of plan assets 1,287.89 1,236.44
c) Funded status (422.54) (419.38)
d) Net liability arising from defined benefit obligation (422.54) (419.38)
Fair value of plan assets
a) Cash and cash equivalents 173.84 25.98
b) Debt instruments categorised by issuer’s credit rating
– Government securities (Central and State) 275.31 337.97
– AAA 223.97 153.45
– AA – 20.29
– A 35.10 –
– AA– – 36.77
– non rated 66.56 156.30
Subtotal 600.94 704.78
c) Equity Investments
– Units of Mutual Funds – Equity Funds 87.13 79.71
Subtotal 87.13 79.71
d) Special deposit schemes 425.98 425.98
1,287.89 1,236.45
Expected employer contribution for the period ending 31 March 2019 Rs 422.54 lakhs
Weighted average duration of defined benefit obligation 9 years 9 years
Principal assumption used for the purpose of the actuarial valuation
a) Discount rate 7.50% 7.00%
b) Expected rate(s) of salary income 8.00% 8.00%
The fair value of the above equity and securities issued by government are determined based on quoted market prices in active
markets. The fair value of other debt instruments are also determined based on quoted price in active market. The fair value of
balance in special deposit scheme is determined based on its carrying value. The fair value of balance with Life Insurance Corporation
is determined based on the funds statement received from the company.
The actual return on plan assets was Rs. 1.28 lakhs (for the year ended March 31, 2017: Rs. 17.57 Lakhs).
Significant actuarial assumptions for the determination of the defined benefit obligation are discount rate, expected salary increase,
attrition and mortality. The sensitivity analysis given below have been determined based on reasonably possible changes of the
respective assumptions occurring at the end of the reporting period, while holding all other assumptions constant.
If the discount rate is 100 basis points higher (lower), the defined benefit obligation would decrease by Rs. 98.95 lakhs (increase
by Rs. 114.16 lakhs) [as at March 31, 2017: decrease by Rs. 130.13 lakhs (increase by Rs. 154.55 lakhs)]
If the expected salary increase growth increases (decreases) by 1%, the defined benefit obligation would increase by Rs. 112.83
lakhs (decrease by Rs. 99.66 lakhs) [as at March 31, 2017: increase by Rs. 151.48 lakhs (decrease by Rs. 130.15 lakhs)]
The sensitivity analysis presented above may not be representative of the actual change in the defined benefit obligation as it is
likely that the change in assumptions would occur in isolation of one another as some of the assumptions may be correlated.
In presenting the above sensitivity analysis, the present value of the defined benefit obligation has been calculated using the
projected unit credit method at the end of the reporting period, which is same as applied in calculating the defined benefit
obligation liability recognised in the balance sheet. There was no change in the method and assumptions used in preparing the
sensitivity analysis from prior years.

Fifty Fifth Annual Report 2017-18
118
Notes forming part of the financial statements
for the year ended March 31, 2018
B. Post retirement pension plan
Year ended Year ended
31.03.2018 31.03.2017
Rs. lakhs Rs. lakhs
Movement in the present value of the defined benefit obligation
a) Opening defined benefit obligation 703.34 1,193.90
b) Service cost 351.32 (578.52)
c) Interest cost 46.34 90.09
d) Remeasurement (gain)/loss
i) Actuarial (gain)/loss arising from changes in financial assumptions (27.45) 37.73
ii) Actuarial (gain)/loss arising from experience adjustments 20.58 22.99
e) Benefits paid (82.60) (62.85)
f ) Closing defined benefit obligation 1,011.53 703.34
Current 86.63 57.54
Non current 924.90 645.80
Components of defined benefit costs recognised:
I. Components of defined benefit costs recognised in profit and loss
a) Service Costs:
– Current service cost – –
– Past service cost and (gain)/loss from settlements 351.32 (578.52)
b) Net interest expenses 46.34 90.09
Subtotal 397.66 (488.43)
II. Components of defined benefit costs recognised in other comprehensive income
a) Remeasurement on the net defined benefit liability:
– Actuarial (gain)/loss arising from changes in financial assumptions (27.45) 37.73
– Actuarial (gain)/loss arising from experience adjustments 20.58 22.99
Subtotal (6.87) 60.72
III. Total defined benefit cost recognised 390.79 (427.71)
Weighted average duration of defined benefit obligation 6 years 10 years
Principal assumption used for the purpose of the actuarial valuation
a) Discount rate 7.50% 7.00%
b) Expected rate(s) Pension increase 3.00% 3.00%
Significant actuarial assumptions for the determination of the defined benefit obligation are discount rate, expected pension
increase and mortality. The sensitivity analysis given below have been determined based on reasonably possible changes of
the respective assumptions occurring at the end of the reporting period, while holding all other assumptions constant.
If the discount rate is 100 basis points higher (lower), the defined benefit obligation would decrease by Rs. 71.54 lakhs
(increase by Rs. 81.75 lakhs) [as at March 31, 2017: decrease by Rs. 49.51 lakhs (increase by Rs. 56.45 lakhs)]
If the expected pension increase growth increases (decreases) by 1%, the defined benefit obligation would increase
by Rs. 84.92 lakhs (decrease by Rs. 75.30 lakhs) [as at March 31, 2017: increase by Rs. 58.19 lakhs (decrease by Rs. 51.78
lakhs)]
The sensitivity analysis presented above may not be representative of the actual change in the defined benefit obligation
as it is likely that the change in assumptions would occur in isolation of one another as some of the assumptions may be
correlated.
In presenting the above sensitivity analysis, the present value of the defined benefit obligation has been calculated using the
projected unit credit method at the end of the reporting period, which is same as applied in calculating the defined benefit
obligation liability recognised in the balance sheet. There was no change in the method and assumptions used in preparing
the sensitivity analysis from prior years.

119
Notes forming part of the financial statements
for the year ended March 31, 2018
39. Financial instruments
39.01 Capital management
The Company manages its capital to ensure that entities will be able to continue as going concerns while maximising the
return to stakeholders through the optimisation of the debt and equity balance. The Capital structure of the Company
consists of net debt (borrowings as detailed in notes 18 and 23 offset by cash and bank balances) and the total equity of
the Company.
The Company manages its capital structure and makes adjustments in light of changes in economic conditions and
the requirements of the financial covenants. To maintain or adjust the capital structure, the Company may adjust the
dividend payment to shareholders, return capital to shareholders or issue new shares. The Company monitors capital
using a gearing ratio, which is net debt divided by total capital plus net debt. The Company includes within net debt,
long-term borrowings, short-term borrowings, less cash and short-term deposits.
Gearing Ratio
The gearing ratio at end of the reporting period was as follows :
As at As at
31.03.2018 31.03.2017
Rs. lakhs Rs. lakhs
Debt
Long-term debt (3,399.51) (6,199.23)
Current borrowings (26,942.37) (26,719.96)
Current maturity of long-term debts (6,763.89) (5,181.75)
Cash and bank balances 618.49 639.93
Net debt (36,487.28) (37,461.01)
Total equity (18,976.45) (4,394.50)
Equity share capital 1,100.44 1,100.44
Other equity (20,076.89) (5,494.94)
Net debt to equity ratio (1.92) (8.52)
39.02 Financial risk management objectives and policies
The Company’s principal financial liabilities, other than derivatives, comprise loans and borrowings and trade and other
payables. The Company’s principal financial assets include trade and other receivables, cash and short-term deposits that
derive directly from its operations. The Company also holds FVTOCI investments and enters into derivative transactions.
The Company is exposed to market risk( including currency risk, interest rate risk and other price risk), credit risk and
liquidity risk.
The Company seeks to minimise the effects of these risks by using derivative financial instruments to hedge risk
exposures. The use of financial derivatives is governed by the Company’s policies approved by the board of directors,
which provide written principles on foreign exchange risks, interest rate risk, credit risk, the use of financial derivatives
and non-derivative financial instruments. The Company does not enter into or trade financial instruments including
derivative financial instruments, for speculative purposes.
The corporate treasury management reports on quarterly basis to the board of directors that monitors risks and policies
implemented to mitigate risk exposures.
39.03 Market risk
Market risk is the risk that the fair value of future cash flows of a financial instrument will fluctuate because of changes in
market prices. The Company’s activities expose it primarily to the financial risks of changes in foreign currency exchange
rates and interest rates. The Company enters into derivative financial instruments to manage its exposure to foreign
currency risk and interest rate risk.

Fifty Fifth Annual Report 2017-18
120
Notes forming part of the financial statements
for the year ended March 31, 2018
39.04 Foreign currency risk management
The Company enter into sale and purchase transactions and borrowings denominated in foreign currencies;
consequently, exposures to exchange rate fluctuations arise. The carrying amounts of the Company’s foreign currency
denominated monetary assets and monetary liabilities at the end of the reporting period are as follows:
Monetary liabilities Monetary assets
As at As at As at As at
31.03.2018 31.03.2017 31.03.2018 31.03.2017
Rs. lakhs Rs. lakhs Rs. lakhs Rs. lakhs
US Dollar in India 1,306.31 4,084.54 480.42 584.82
Euro in India 91.60 243.91 - 11.70
GBP in India 2.36 - 8.23 2.93
SGD in India - - 440.78 412.23
Of the above foreign currency exposures,
the following exposure are not hedged
US Dollar in India 261.05 663.86 480.42 584.82
Euro in India 7.58 6.83 - 11.70
GBP in India - - 8.23 2.93
SGD in India - - 440.78 412.23
Foreign currency sensitivity analysis
The following table details the Company’s sensitivity to a 10% increase and decrease in exchange rate between the pairs
of currencies. The sensitivity analysis includes only outstanding foreign currency denominated monetary items and
adjusts their translation at the period end for 10% change in foreign currency rates. The sensitivity analysis includes trade
payables, receivables, external loans as well as loans to foreign operations within the Group where the denomination
of the monetary item is in a currency other than the functional currency of the lender or the borrower. The sensitivity
analysis has been undertaken on net unhedged exposure in foreign currency.
As at
31.03.2018
As at
31.03.2017
Rs. lakhs Rs. lakhs
USD Vs INRImpact on profit and loss for the year 21.94 (7.90)
Impact on total equity as at the end of the reporting period 14.35 (5.17)
Euro Vs INRImpact on profit and loss for the year (0.76) 0.49
Impact on total equity as at the end of the reporting period (0.50) 0.32
GBP Vs INRImpact on profit and loss for the year 0.82 0.29
Impact on total equity as at the end of the reporting period 0.54 0.19
SGD Vs INRImpact on profit and loss for the year 44.08 41.22
Impact on total equity as at the end of the reporting period 28.82 26.96

121
Notes forming part of the financial statements
for the year ended March 31, 2018
39.05 Interest rate risk management
Interest rate risk is the risk that the fair value of future cash flows of a financial instrument will fluctuate because of
change in market interest rates. The company’s exposure to the risk of changes in market interest rates relates primarily
to the company’s long -term debt obligations with floating interest rates.
39.06 Credit risk management
Credit risks refers to risk that a counterparty will default on its contractual obligations resulting in financial loss to the
Company. Credit risk encompasses both the direct risk of default and the risk of deterioration of creditworthiness
as well as concentration risks. The Company’s Board approved financial risk policies comprise liquidity, currency,
interest rate and counterparty risk. Financial instruments that are subject to concentrations of credit risk, principally
consist of trade receivables, finance receivables, loans and advances and derivative financial instruments. None of the
financial instruments of the Company result in material concentrations of credit risks. The Company does not engage
in speculative treasury activity but seeks to manage risk and optimise interest and commodity pricing through proven
financial instruments.
The credit risk on bank balances and derivative financial instruments is limited because the counterparties are banks
with high credit ratings.
Trade receivables consist of a large number of customers, spread across diverse industries and geographical areas.
Ongoing credit evaluation is performed on the financial condition of accounts receivable.
39.07 Liquidity risk management
Liquidity risk refers to the risk that the Company cannot meet its financial obligations. The objective of liquidity
risk management is to maintain sufficient liquidity and ensure that funds are available for use as per requirements.
The Company has obtained fund and non-fund based working capital lines from various banks. The Company manages
liquidity risk by maintaining adequate reserves, banking facilities and reserve borrowing facilities, by continuously
monitoring forecasts and actual cash flows, and by matching the maturity profiles of financial assets and liabilities.
Liquidity and interest risk tables
The following tables detail the maturity profile of Company’s non-derivative financial liabilities with agreed repayment
period. The tables have been drawn up based on the undiscounted cash flows of financial liabilities based on the earliest
date on which the Company can be required to pay.
Rs. lakhs
Carrying
amount
Total Less than 1
month
1 - 3
months
3 months
to 1 year
1 to 5
years
> 5 years
As at 31.03.2018
Borrowings (Refer note below) 37,105.77 38,364.19 27,360.75 1,802.38 5,577.76 3,623.30 -
Derivative liabilities 5.30 5.30 - 0.15 5.15 - -
Trade payables 29,947.09 29,947.09 20,367.08 7,104.35 118.03 2,357.63 -
Other financial liabilities 153.19 153.19 153.19 - - - -
67,211.35 68,469.77 47,881.02 8,906.88 5,700.94 5,980.93 -
As at 31.03.2017
Borrowings (Refer note below) 38,100.94 39,724.15 26,036.38 1,949.01 4,953.88 6,784.88 -
Derivative liabilities 35.07 35.07 - 2.18 32.89 - -
Trade payables 31,090.93 31,090.93 16,224.78 10,209.90 2,899.20 1,757.05 -
Other financial liabilities 206.23 206.23 206.23 - - - -
69,433.17 71,056.38 42,467.39 12,161.09 7,885.97 8,541.93 -
Note : The maturity pattern of the borrowings incorporates interest payable at the respective interest rates up to the period
of maturity of loan.

Fifty Fifth Annual Report 2017-18
122
39.08 Financing facilities
The following table details the Company’s borrowing facilities that are available for future operating activities and to
settle capital commitments:
As at As at
31.03.2018 31.03.2017
Rs. lakhs Rs. lakhs
Secured bank overdraft / working capital demand loan facility
reviewed annually and payable at call
- amount used 26,942.36 26,719.96
- amount unused 1,057.64 1,280.04
28,000.00 28,000.00
Secured bill acceptance facility from bank reviewed annually and payable at call
- amount used - 705.15
- amount unused 1,000.00 294.85
1,000.00 1,000.00
39.09 Fair value measurements
The significant accounting policies, including the criteria for recognition, the basis of measurement and the basis on which
income and expenses are recognised, in respect of each class of financial asset, financial liability and equity instrument are
disclosed in note 2.15 to 2.17.
Financial assets and liabilities
The following table summarises financial assets and liabilities measured at fair value on a recurring basis and financial assets
and financial liabilities that are not measured at fair value on a recurring basis (but fair value disclosure are required):
As at March 31, 2018
Fair value
through
profit or loss
Fair value
through
OCI
Amortised
cost
Total
carrying
value
Total fair
value
Financial assets:
Investment in subsidiaries and joint venture - - 18,126.82 18,126.82 18,126.82
Other investment in quoted equity instrument - 47.28 - 47.28 47.28
Trade receivables - - 34,817.36 34,817.36 34,817.36
Cash and cash equivalents - - 618.49 618.49 618.49
Other bank balances - - 533.67 533.67 533.67
Other financial assets - - 1,470.25 1,470.25 1,470.25
Derivative assets 96.39 - - 96.39 96.39
Total 96.39 47.28 55,566.59 55,710.26 55,710.26
Financial liabilities
Trade payable - - 29,947.09 29,947.09 29,947.09
Long term borrowings - - 3,399.51 3,399.51 3,399.51
Short Term borrowings - - 26,942.37 26,942.37 26,942.37
Derivative financial liabilities 5.30 - - 5.30 5.30
Other financial liabilities - - 6,917.08 6,917.08 6,917.08
Total 5.30 - 67,206.05 67,211.35 67,211.35
Notes forming part of the financial statements
for the year ended March 31, 2018

123
Notes forming part of the financial statements
for the year ended March 31, 2018
As at March 31, 2017
Fair value
through
profit or loss
Fair value
through
OCI
Amortised
cost
Total
carrying
value
Total fair
value
Investment in subsidiaries and joint venture - - 18,483.82 18,483.82 18,483.82
Other investment in quoted equity instrument - 36.05 - 36.05 36.05
Trade receivables - - 44,817.69 44,817.69 44,817.69
Cash and cash equivalents - - 639.93 639.93 639.93
Other bank balances - - 18.19 18.19 18.19
Other financial assets - - 4,205.85 4,205.85 4,205.85
Derivative assets 270.39 - - 270.39 270.39
Total 270.39 36.05 68,165.48 68,471.92 68,471.92
Financial liabilities
Trade payable - - 31,090.93 31,090.93 31,090.93
Long term borrowings - - 6,199.23 6,199.23 6,199.23
Short Term borrowings - - 26,719.96 26,719.96 26,719.96
Derivative financial liabilities 35.07 - - 35.07 35.07
Other financial liabilities - - 5,387.98 5,387.98 5,387.98
Total 35.07 - 69,398.10 69,433.17 69,433.17
Fair value hierarchy
The fair value hierarchy is based on inputs to valuation techniques that are used to measure fair value that are either observable or unobservable and consists of the following three levels:
directly (i.e. as prices) or indirectly (i.e. derived from prices)
in part using a valuation model based on assumptions that are neither supported by prices from observable current market transactions in the same instrument nor are they based on available market data.
The investments included in Level 2 of fair value hierarchy have been valued using quotes available for similar assets and liabilities in the active market. The investments included in Level 3 of fair value hierarchy have been valued using the cost approach to arrive at their fair value. The cost of unquoted investments approximate the fair value because there is a wide range of possible fair value measurements and the cost represents estimate of fair value within that range.
The following table summarises the financial assets and liabilities measured at fair value on a recurring basis and financial assets that are not measured at fair value on a recurring basis (but fair value disclosure are required):
Rs lakhs
As at March 31, 2018
Level 1 Level 2 Level 3 Total
Financial assets:
Derivative financial assets - 96.39 - 96.39
Other investments classified as fair value
through OCI - Non current
47.28 - - 47.28
47.28 96.39 - 143.67
Financial liabilities :
Derivative financial liabilities - 5.30 - 5.30
- 5.30 - 5.30
47.28 91.09 - 138.37

Fifty Fifth Annual Report 2017-18
124
Notes forming part of the financial statements
for the year ended March 31, 2018
Rs lakhs
As at March 31, 2017
Level 1 Level 2 Level 3 Total
Financial assets:
Derivative financial assets - 270.39 - 270.39
Other investments classified as fair value through OCI - Non
current
36.05 - - 36.05
36.05 270.39 - 306.44
Financial liabilities :
Derivative financial liabilities - 35.07 - 35.07
- 35.07 - 35.07
36.05 235.32 - 271.37
40. Related party transactions
List of related parties and relationship
Name of the related party Nature of relationship
TRF Singapore Pte Ltd. Subsidiary Companies the ownership of which is held directly
by the CompanyTRF Holdings Pte Limited
YORK Transport Equipment (Asia) Pte Ltd.
Subsidiary Companies the ownership of which is held through
subsidiary (ies)
YORK Transport Equipment Pty Ltd.
YORK Sales (Thailand) Co. Ltd
YTE Transport Equipment (SA) (Pty) Limited
Rednet Pte Ltd.
PT YORK Engineering
YTE Special Products Pte Ltd
Qingdao YTE Special Products Co. Ltd.
YORK Transport Equipment (India) Pvt. Ltd.
YORK Transport Equipment (Shanghai) Co. Ltd.
Dutch Lanka Trailer Manufacturers Limited
Dutch Lanka Engineering Pvt Ltd
Dutch Lanka Trailers LLC
Hewitt Robins International Holding Ltd.
Hewitt Robins International Ltd.
Tata Steel Limited Promoter Company holding more than 20%
Key Managerial Persons
Mr Sanjay Rajoria Managing Director w.e.f 01.02.2018
Mr P S Reddy Managing Director till 31.01.2018
Mr Sandip Biswas
Non Executive Directors
Mr Ranaveer Sinha
Mr Dipankar Chatterji
Mr Sabyasachi Hajara
Ms Neera Saggi
Mr Rajesh Ranjan Jha
Mr Dibyendu Bose

125
Notes forming part of the financial statements
for the year ended March 31, 2018
40.01 Trading transactions
Sale of Goods and Services Purchase of Goods and Services
For the
year ended
31.03.2018
For the
year ended
31.03.2017
For the
year ended
31.03.2018
For the
year ended
31.03.2017
Rs. lakhs Rs. lakhs Rs. lakhs Rs. lakhs
Goods
Promoter Company : Tata Steel Limited 5,861.17 6,380.35 1,563.78 1,349.38
Subsidiary : Hewitt Robins International Ltd. - - - 2.08
Various Services
Promoter Company : Tata Steel Limited - - 678.20 404.26
For the
year ended
31.03.2018
For the
year ended
31.03.2017
Rs. lakhs Rs. lakhs
Expenses / Overhead charged (including rent)
YORK Transport Equipment (Asia) Pte Ltd 7.15 36.19
Dutch Lanka Trailer Manufacturers Limited 6.49 11.40
Hewitt Robins International Ltd - 5.65
TRF Singapore Pte Ltd 12.38 -
Adithya Automotive Application Pvt Ltd - 2.32
Commission income on corporate guarantee given to subsidiaries
York Transport Equipment (Asia) Pte Ltd 29.32 60.20
Dividend Received
Adithya Automotive Application Pvt Ltd - 285.60
Compensation of key management personnel
Remuneration to Managing Directors
Short-term benefits 63.96 61.49
Post-employment benefits 6.49 5.53
70.45 67.02
Sitting fees to non-executive Directors
Mr Ranaveer Sinha 5.75 6.25
Mr Dipankar Chatterji 8.25 8.25
Mr Sabyasachi Hajara 7.00 6.00
Ms Neera Saggi 8.50 8.00

Fifty Fifth Annual Report 2017-18
126
Notes forming part of the financial statements
for the year ended March 31, 2018
40.02 Outstanding balances at the end of the reporting period
Amounts owed by related parties Amounts owed to related parties
As at
31.03.2018
As at
31.03.2017
As at
31.03.2018
As at
31.03.2017
Rs. lakhs Rs. lakhs Rs. lakhs Rs. lakhs
i) Guarantee given by the Company on behalf
of subsidiary companies
YORK Transport Equipment (Asia) Pte Ltd
(USD 18000000)
- 11,688.95 - -
ii) Receivables / payables
Promoter Company : Tata Steel Limited 1,430.17 1,303.74 544.97 640.48
YORK Transport Equipment (Asia) Pte Ltd 7.15 264.20 - -
Interest accrued - - - -
Guarantee fees - 88.15 - -
Others 7.15 176.05 - -
Dutch Lanka Trailer Manufacturers Limited 138.39 137.98 - -
Interest accrued - - - -
Guarantee fees 6.69 6.68 - -
Others 131.70 131.30 - -
TRF Singapore Pte Ltd 921.13 879.44 - -
Interest accrued 833.67 809.22 - -
Guarantee fees 75.08 70.22 - -
Others 12.38 - - -
Hewitt Robins International Ltd 0.20 0.10 2.08 2.08
Adithya Automotive Application Pvt Ltd - 5.54 - -
Claims against the company not
acknowledged as debt
Tata Steel Limited (Net of advances) 3,089.92 2,566.08 - -
41. Commitments
As at
31.03.2018
As at
31.03.2017
Rs. lakhs Rs. lakhs
a) Capital commitment
Estimated amount of contracts remaining to be executed on capital account and
not provided for
22.15 16.57
b) Other commitments
The Company has agreed to provide contingent support to its wholly owned direct
subsidiary (WOS), TRF Singapore Pte Limited, to meet their liabilities of USD NIL
(31.03.2017: USD 23,156,537), only in the event of the WOS being unable to generate
the required liquidity internally or externally.

127
Notes forming part of the financial statements
for the year ended March 31, 2018
42. Contingent liabilities
As at
31.03.2018
As at
31.03.2017
Rs. lakhs Rs. lakhs
a) Sales tax matters in dispute relating to issues of applicability and classification 2,607.26 2,559.00
In respect of the above sales tax matters in dispute, the Company has
deposited Rs. 124.89 lakhs (31.03.2017: Rs.110.52 lakhs) against various orders,
pending disposal of the appeals. This amount is included under Note 9 - Other
non-current assets.
b) Excise duty and service tax matters in dispute relating to applicability and
classification
4,631.97 4,058.16
In respect of the above excise and service tax matters in dispute, the Company
has deposited Rs. 172.23 lakhs (31.03.2017: Rs 154.37 lakhs) against various
orders, pending disposal of the appeals. This amount is included under Note
9 - Other non-current assets.
c) Income tax matters in dispute 4,460.86 4,226.97
d) Corporate guarantee given on behalf of subsidiary companies
i) York Transport Equipment (Asia) Pte Limited - NIL (31.03.2017: USD 18.0 m) - 11,688.95
Loan outstanding against the guarantee - 5,712.08
e) Claims against the Company not acknowledged as debt (Primarily of
liquidated damages and other claims made by customers)
6,512.34 8,599.34
f ) Others 33.42 33.42
Future cash outflows in respect of above matters are determinable only on receipt of judgments / decisions pending at
various forums / authorities.
43. Additional Information to the Financial Statements pursuant to Companies Act, 2013 requirements :
43.01 Disclosures required under Section 22 of the Micro, Small and Medium Enterprises Development Act, 2006
As at As at
31.03.2018 31.03.2017
Rs. lakhs Rs. lakhs
a) Principal amount remaining unpaid to the suppliers as at the end of the accounting year 437.71 260.34
b) Interest due thereon remaining unpaid to suppliers as at the end of the accounting year 96.77 17.49
c) Interest paid in terms of Section 16 along with the amount of payments made to
suppliers beyond the appointment day during the year - -
d) Interest due and payable for the period of delays in making payment (which have been paid
beyond the appointment date during the year but without adding interest specified under the act) 39.04 23.48
e) The amount of interest accrued and remaining unpaid at the end of the accounting year. 118.32 35.21
The above information have been disclosed to the extent such suppliers could be identified by the management on the basis
of information available with the Company and the same has been relied upon by the auditors.
43.02 The Company has incurred loss after tax of Rs 14,597.65 lakhs during the the year ended March 31, 2018, (March 31, 2017: Rs
2,691.10 lakhs) and accumulated losses as of the Balance Sheet date amounting to Rs 35,043.77, (March 31, 2017 Rs 20434.96)
has eroded the net worth of the company. The company expects to generate cash flow from improvements in operations

Fifty Fifth Annual Report 2017-18
128
Notes forming part of the financial statements
for the year ended March 31, 2018
44 44.01 Details of contract revenue and costs as per Ind AS - 11
Year ended Year ended
Particulars 31.03.2018 31.03.2017
Rs. lakhs Rs. lakhs
a) Contract revenue recognised as revenue during the year 23,006.29 35,499.32
b) Aggregate amount of contract costs incurred and recognised
profits (net of recognised losses) upto the reporting period 372,050.48 359,150.15
c) Advances received for contracts in progress (Unadjusted) 1,637.51 3,262.78
d) Retention money under contracts in progress 26,799.59 27,045.53
e) Gross amount due from customers for contract work (asset) 139.03 650.65
f ) Gross amount due to customers for contract work (liability) 12,177.04 11,791.29
44.02 Provision for Warranty
The Company extends warranty on certain products manufactured and sold by it. The Company provides for any antici-
pated warranty costs at the time of recognising the sale based on technical evaluation and estimated costs. The details
of movement of provision for warranty are given below:
(a) Opening balance at the beginning of the year 122.08 109.22
(b) Provisions recognised during the year 2.83 32.45
(c) Utilised for meeting the warranty costs 26.45 19.59
(d) Closing balance at the end of the year 98.46 122.08
44.03 Operating lease
The Company’s significant leasing arrangements are in respect of operating leases for premises (residential, office, ware-
house etc). The leasing arrangements which normally have a tenure of eleven months to three years are cancellable
with a reasonable notice, and are renewable by mutual consent at agreed terms. Lease rentals aggregating to Rs 303.23
lakhs are charged as rent to the statement of profit and loss (for the year March 31, 2017 Rs 306.84 lakhs).
resulting from favourable macroeconomic condition, increased business with the promoter entity, increased activities in
the product segment, increased efficiencies from the project activities (refer note 43.03), proceeds from restructuring of its
subsidiaries including the ones for which the company has non-binding offers and renewal of the facilities from banks as
an when they fall due etc. which will be sufficient to meet future obligation of the company. Accordingly, these financial
statements have been prepared on a going concern basis.
43.03 Revenue from contracts are recognized on percentage completion method specified under Ind AS 11 - Constructions
Contracts. The estimated cost to complete the contracts is arrived at based on technical data, forecast, assumptions and
contingencies and are based on the current market price or firm commitments, as applicable. Such estimates / assumptions
may be subject to variations but the management has implemented necessary steps and strengthened the internal controls
around estimation process which is expected to bring down the fluctuations in the estimated costs.
43.04 Trade Receivable include Rs 820.52 lakhs (net of advance/provision etc.) due from a customer, currently under insolvency
proceeding under Insolvency and Bankruptcy Code 2016. Considering the relationship with the customer/criticality of
products sold to them etc., as applicable, the management feels that the said receivables are good and recoverable and
carrying amount of the same are appropriate.

129
Notes forming part of the financial statements
for the year ended March 31, 2018
45. Details of specified Bank Notes (SBN) presuent to notification No, G.S.R.308(E) dated March 30, 2017 issued by
Ministry of Corporate Affairs:-
2017-18: There is no such cases during the year (2016-17:As detailed below)
Rs lakhs
Particulars Specified Other Total
Bank Notes denomination amount
Closing cash in hand as on 8th November, 2016 10.95 5.33 16.28
Add : Permitted receipts 0.17 32.31 32.48
Less : Permitted payments - 31.38 31.38
Less : Amount deposited in Banks 11.12 - 11.12
Closing cash in hand as on 30th December, 2016 - 6.26 6.26
46. Previous year’s figures have been regrouped / reclassified where necessary to correspond with the current year’s classification
/ disclosure.
47. Approval of financial statements
The financial statements were approved for issue by the board of directors on April 24, 2018.
In terms of our report of even date For and on behalf of the Board of Directors
For Price Waterhouse & Co Chartered Accountants LLP Sandip Biswas Sanjay Rajoria
Chartered Accountants Chairman Managing Director
Firm Registration No. : 304026E / E-300009
Sougata Mukherjee K. S. Mathai Mathew Tarun Kr. Srivastava
Partner (Membership no. : 057084) Chief Financial Officer Company Secretary
Jamshedpur Mumbai,
24th April, 2018 24th April, 2018

Fifty Fifth Annual Report 2017-18
130
Annexure-1
Statement on Impact of Audit Qualifications (for audit report with modified opinion)
submitted along-with Annual Audited Consolidated Financial Results
Statement on Impact of Audit Qualifications for the Financial Year ended March 31, 2018
[See Regulation 33 / 52 of the SEBI (LODR) (Amendment) Regulations, 2016]
I. Sl.
No.
Particulars Audited Figures (as
reported before
adjusting for
qualifications)
(Rs. in Lakhs)
Adjusted Figures
(audited figures
after adjusting for
qualifications)
1. Turnover / Total income 44,666.15 Not Determinable
2. Total Expenditure (63,907.20) --- Do ---
3. *Net Profit/(Loss) after Prior Period Items/Exceptional Items/Tax Expenses (13,411.35) --- Do ---
4. Earnings Per Share( in Rs) (121.87) --- Do ---
5. Total Assets 109,087.11 --- Do ---
6. Total Liabilities 129,124.18 --- Do ---
7. Net Worth (20,037.07) --- Do ---
8. *Any other financial item(s) (as felt appropriate by the management)
Prior Period Items Nil --- Do ---
Exceptional items Nil --- Do ---
Tax Expenses (1,802.62) --- Do ---
II. Audit Qualification:
a. Details of Audit Qualification:
We draw your attention to the following qualification to the audit opinion of the financial statements of TRF Singapore Pte Ltd, a
subsidiary of the Holding Company issued by an independent firm of Chartered Accountants vide its report dated April 24, 2018
reproduced by us as under:
As of 31 March 2018, the Company’s investment in a subsidiary, Dutch Lanka Trailer Manufacturers Limited is carried at net
book value of S$20,041,421 on the Company’s balance sheet included in the financial information. No further impairment has
been provided against this carrying amounts as the directors are of the view that the carrying amount is recoverable. Based
on the information available to us, we are unable to obtain sufficient appropriate audit evidence to satisfy ourselves as to the
appropriateness of the absence of further impairment provision and consequently, the appropriateness of the carrying amount
of the investment.
[Paragraph as described above is reproduced as note no.9 to the consolidated financial statements. The above does not have any
impact on the Consolidated Financial Statement]
However, in view of the qualification included in the above paragraph, we were unable to obtain sufficient audit evidence in respect
of the carrying value of Goodwill arising out of consolidation of TRF Singapore Pte Ltd and Dutch Lanka Trailer Manufacturers
Limited amounting to Rs.6,630 lakhs. Consequently, we are unable to determine whether any impairment provision is necessary
to the abovementioned carrying amount of the Goodwill.

131
b. Type of Audit Qualification: Qualified Opinion
c. Frequency of qualification: Repetitive (since year ending March 31, 2015)
d. For Audit Qualification(s) where the impact is quantified by the auditor, Management’s Views: Not Applicable
e. For Audit Qualification(s) where the impact is not quantified by the auditor:
(i) Management’s estimation on the impact of audit qualification: Not Applicable
(ii) If management is unable to estimate the impact, reasons for the same:
The Statutory Auditors have expressed concern over the reasonableness of the assumptions made to estimate the future
cash flow projections of a subsidiary (Dutch Lanka Trailer Manufacturers Ltd) (DLT) which manufactures and markets trailers
internationally and have accordingly expressed their inability to determine whether any adjustment is necessary to the
carrying amount of the goodwill on consolidation and have made a qualified opinion in their report on Consolidated
Financial Statement for the year ended March 31, 2018.
DLT has started generating profit from FY 2017-18. Revenue projected by DLT Group for next five years are achievable
considering improvement in market conditions. The performance of DLT Group is expected to improve in future.
Therefore, the management is of view that the sales projections are achievable and no further impairment provision is
required.
(iii) Auditors’ Comments on (i) or (ii) above:
We have been unable to obtain sufficient audit evidence to satisfy ourselves on the reasonableness of the assumptions
made to estimate the future cash flow projections and consequently, we are unable to determine whether any adjustment
is necessary to the carrying amount of the goodwill.
Refer our Audit Report dated April 24, 2018 on the consolidated financial results
For Price Waterhouse & Co Chartered Accountants LLP For TRF Limited
Chartered Accountants Sanjay Rajoria
Firm Registration No. : 304026E / E-300009 Managing Director
Sougata Mukherjee Sujith Mathai Mathew
Partner Chief Financial Officer
(Membership no. : 057084)
Jamshedpur, Dipankar Chatterji
April 24, 2018 Audit Committee Chairperson
Mumbai
April 24, 2018

Fifty Fifth Annual Report 2017-18
132
INDEPENDENT AUDITORS’ REPORT
To the Members of TRF LimitedReport on the Consolidated Indian Accounting Standards (Ind AS) Financial Statements
1. We have audited the accompanying consolidated Ind AS financial statements of TRF Limited (“hereinafter referred to
as the Holding Company”) and its subsidiaries (the Holding Company and its subsidiaries together referred to as “the
Group”), its jointly controlled entity (refer Note No. 38 to the attached consolidated financial statements), comprising
of the consolidated Balance Sheet as at March 31, 2018, the consolidated Statement of Profit and Loss (including Other
Comprehensive Income), the consolidated Cash Flow Statement for the year then ended and the Statement of Changes
in Equity for the year then ended, and a summary of significant accounting policies and other explanatory information
prepared based on the relevant records (hereinafter referred to as “the Consolidated Ind AS Financial Statements”).
Management’s Responsibility for the Consolidated Ind AS Financial Statements
2. The Holding Company’s Board of Directors is responsible for the preparation of these consolidated Ind AS financial
statements in terms of the requirements of the Companies Act, 2013 (hereinafter referred to as “the Act”) that give a
true and fair view of the consolidated financial position, consolidated financial performance, consolidated cash flows
and changes in equity of the Group including its associates and joint ventures in accordance with accounting principles
generally accepted in India including the Indian Accounting Standards specified in the Companies (Indian Accounting
Standards) Rules, 2015 (as amended) under Section 133 of the Act. The Holding Company’s Board of Directors is also
responsible for ensuring accuracy of records including financial information considered necessary for the preparation of
consolidated Ind AS financial statements. The respective Board of Directors of the companies included in the Group and
of its associates and joint ventures are responsible for maintenance of adequate accounting records in accordance with
the provisions of the Act for safeguarding the assets of the Group and its associates and joint ventures respectively and
for preventing and detecting frauds and other irregularities; the selection and application of appropriate accounting
policies; making judgements and estimates that are reasonable and prudent; and the design, implementation and
maintenance of adequate internal financial controls, [that were operating effectively for ensuring the accuracy and
completeness of the accounting records,] relevant to the preparation and presentation of the financial statements
that give a true and fair view and are free from material misstatement, whether due to fraud or error, which has been
used for the purpose of preparation of the consolidated Ind AS financial statements by the Directors of the Holding
Company, as aforesaid.
Auditors’ Responsibility
3. Our responsibility is to express an opinion on these consolidated Ind AS financial statements based on our audit. While
conducting the audit, we have taken into account the provisions of the Act and the Rules made thereunder including
the accounting standards and matters which are required to be included in the audit report.
4. We conducted our audit of the consolidated Ind AS financial statements in accordance with the Standards on Auditing
specified under Section 143(10) of the Act and other applicable authoritative pronouncements issued by the Institute
of Chartered Accountants of India. Those Standards and pronouncements require that we comply with ethical
requirements and plan and perform the audit to obtain reasonable assurance about whether the consolidated Ind AS
financial statements are free from material misstatement.
5. An audit involves performing procedures to obtain audit evidence about the amounts and disclosures in the
consolidated Ind AS financial statements. The procedures selected depend on the auditors’ judgement, including
the assessment of the risks of material misstatement of the consolidated Ind AS financial statements, whether due
to fraud or error. In making those risk assessments, the auditor considers internal financial control relevant to the
Holding Company’s preparation of the consolidated Ind AS financial statements that give a true and fair view, in order
to design audit procedures that are appropriate in the circumstances, [but not for the purpose of expressing an opinion
on the effectiveness of the Company’s internal control]. An audit also includes evaluating the appropriateness of the
accounting policies used and the reasonableness of the accounting estimates made by the Holding Company’s Board
of Directors, as well as evaluating the overall presentation of the consolidated Ind AS financial statements.

133
6. We believe that the audit evidence obtained by us and the audit evidence obtained by the other auditors in terms of
their reports referred to in paragraph 11 of the Other Matters paragraph below, other than the unaudited financial
statements as certified by the management and referred to in sub-paragraph 10 (a) of the Other Matters paragraph
below, is sufficient and appropriate to provide a basis for our audit opinion on the consolidated Ind AS financial
statements.
Basis for Qualified Opinion
7. We draw your attention to the following qualifications to the audit opinion of the financial statements of TRF Singapore
Pte Ltd, a subsidiary of the Holding Company issued by an independent firm of Chartered Accountants vide its report
dated April 24, 2018 reproduced by us as under:
As of 31 March 2018, the Company’s investment in a subsidiary, Dutch Lanka Trailer Manufacturers Limited is carried
at net book value of S$20,041,421 on the Company’s balance sheet included in the financial information. No further
impairment has been provided against this carrying amounts as the directors are of the view that the carrying amount
is recoverable. Based on the information available to us, we are unable to obtain sufficient appropriate audit evidence
to satisfy ourselves as to the appropriateness of the absence of further impairment provision and consequently, the
appropriateness of the carrying amount of the investment.
[Paragraph 7 as described above is reproduced as note no. 51 to the consolidated financial statements. The above does
not have any impact on the Consolidated Financial Statements]
However, in view of the qualification included in the above paragraph, we were unable to obtain sufficient audit
evidence in respect of the carrying value of Goodwill arising out of consolidation of TRF Singapore Pte Ltd and Dutch
Lanka Trailer Manufacturers Limited amounting to Rs. 6,630 lakhs (included in Note 4). Consequently, we are unable to
determine whether any impairment provision is necessary to the above mentioned carrying amount of the Goodwill.
Qualified Opinion
8. In our opinion and to the best of our information and according to the explanations given to us, the aforesaid
consolidated Ind AS financial statements give the information required by the Act in the manner so required and except
for the matters described in the Basis for Qualified Opinion paragraph above, give a true and fair view in conformity
with the accounting principles generally accepted in India of the consolidated state of affairs of the Group and joint
ventures as at March 31,2018 and their consolidated total comprehensive income (comprising of consolidated profit/
loss and consolidated other comprehensive income), their consolidated cash flows and consolidated changes in equity
for the year ended on that date.
Emphasis of Matter
9. We draw your attention to the following emphasis of matter paragraph included in the audit report on the consolidated
financial statements of Dutch Lanka Trailer Manufacturers Limited, a step down subsidiary of the Holding Company
issued by an independent firm of Chartered Accountants vide its report dated April 20, 2018 reproduced by us as under:
The management is committed to transfer the shares of Dutch Lanka Trailer LLC Salah Sultanate of Oman shares held
by Dutch Lanka Trailer Manufacturers Ltd to the Joint Venture Partner. Necessary approvals have been obtained from
the Board of Investment of Sri Lanka on 18 January 2018 and Exchange Control Department on 02 February 2018. The
management is finalizing the share transfer agreement to submit to the Department of Registrar of Companies along
with other deliverables required for the process. In preparing the Consolidated Financial Statement we have carried out
line by line consolidation of the liabilities (USD 28,098) and assets (USD 120,165) pertaining to Dutch Lanka Trailers LLC.
The above does not have any impact on the Consolidated Financial Statements.
[Note 9 as described above is reproduced as note no. 52 to the consolidated financial statements.]
10. We draw your attention to the following emphasis of matter paragraph included in the audit report of the Holding
Company:
a) Note No. 12(i) to the statement, with respect to retention money receivable amounting to Rs. 24,058.87 lakhs as at
March 31, 2018, included under Trade receivable, which are realizable subject to completion of the performance
guarantee tests as per the terms of the contracts.

Fifty Fifth Annual Report 2017-18
134
b) Note No. 53(a) to the statement with respect to the losses incurred by the company and erosion of its net worth
and preparation of the financial results on going concern assumption, based on the reasons stated in the aforesaid
note. The company’s continuing as a going concern is dependent on generation of the expected cash flows to be
able to meet its obligations as and when they arise, for which an uncertainty exists. Our opinion is not qualified in
respect of this matter.
c) Note No. 53(b) of the Financial Statement, with respect to estimation by the management of the cost to complete
the contracts based on estimates/ assumptions which could be subject to variation, which is presently not
ascertainable.
d) Note No. 53(c) to the statement, with respect to receivable from a customer, currently under insolvency
proceedings under Insolvency and Bankruptcy Code 2016, aggregating to Rs. 820.52 lakhs included under trade
receivables, which the company considers good and recoverable for the reasons stated in the aforesaid note and
accordingly considers the carrying amount of the same as appropriate.
Our opinion is not qualified in respect of these matters.
Other Matter
11. We did not audit the financial statements of 17 subsidiaries and 2 jointly controlled entities whose financial statements
reflect total assets of Rs.76,297.11 lakhs and net assets of Rs 24,603.81 lakhs as at March 31, 2018, total revenue of
Rs.66,122.96 lakhs, total comprehensive income (comprising of profit/ loss and other comprehensive income) of
Rs.1,113.62 lakhs and net cash flows amounting to Rs. 4,995 lakhs for the year ended on that date, as considered in the
consolidated Ind AS financial statements. The consolidated Ind AS financial statements also include the Group’s share of
total comprehensive income (comprising of profit/ loss and other comprehensive income) of Rs. 840.57 lakhs and Rs.1.49
lakhs for the year ended March 31, 2018 as considered in the consolidated Ind AS financial statements, in respect of 1
jointly controlled entity whose financial statement have not been audited by us and 1 jointly controlled entity which was
disposed off during the year whose financial statements are unaudited. These financial statements have been audited by
other auditors excepting for 1 jointly controlled entity disposed off during the year which has been subject to a review
by another auditor, whose reports have been furnished to us by the Management, and our opinion on the consolidated
Ind AS financial statements in so far as it relates to the amounts and disclosures included in respect of these subsidiaries,
jointly controlled entities and our report in terms of sub-section (3) of Section 143 of the Act in so far as it relates to the
aforesaid subsidiaries, jointly controlled entity is based solely on the reports of the other auditors.
In our opinion and according to the information and explanations given to us by the Management, the financial
statement of the jointly controlled entity disposed off during the year is not material to the Group.
Our opinion on the consolidated Ind AS financial statements and our report on Other Legal and Regulatory Requirements
below, is not modified in respect of the above matters with respect to our reliance on the work done and the reports of
the other auditors and the financial statements certified by the Management.
12. The financial statements of TRF Singapore Pte Ltd for the year ended March 31, 2018 a subsidiary of the Company, were
audited by another firm of accountants, who vide their report dated April 24, 2018 have reported as follows:
As of 31 March 2018, the balance sheet of the Company includes amounts due from a related company, TRF Holdings
Pte Ltd carried at S$3,525,375. No impairment has been provided on the amounts as the directors of the Company
are of the view that the amounts are recoverable. Based on the information available to us, we are unable to obtain
sufficient appropriate audit evidence to satisfy ourselves as to whether any allowance for impairment is required on the
amounts and consequently, the appropriateness of the carrying amount of amounts due from a related company.
The above does not have any impact on the Consolidated Financial Statements.
13. The consolidated Ind AS financial statements of the Company for the year ended March 31, 2017, were audited by
another firm of chartered accountants under the Companies Act, 2013 who, vide their report dated May 23, 2017,
expressed a modified opinion on those financial statements. Our opinion is not qualified in respect of this matter.
Report on Other Legal and Regulatory Requirements
14. As required by Section143(3) of the Act, we report, to the extent applicable, that:

135
a) We have sought and obtained all the information and explanations which to the best of our knowledge and belief
were necessary for the purposes of our audit of the aforesaid consolidated Ind AS financial statements.
b) In our opinion, proper books of account as required by law maintained by the Holding Company, its jointly
controlled entities included in the Group, incorporated in India including relevant records relating to preparation
of the aforesaid consolidated Ind AS financial statements have been kept so far as it appears from our examination
of those books and records of the Holding Company and the reports of the other auditors.
c) The Consolidated Balance Sheet, the Consolidated Statement of Profit and Loss (including other comprehensive
income), Consolidated Cash Flow Statement and the Consolidated Statement of Changes in Equity dealt with
by this Report are in agreement with the relevant books of account maintained by the Holding Company, its
subsidiaries included in the Group, associate companies and joint ventures incorporated in India including
relevant records relating to the preparation of the consolidated Ind AS financial statements.
d) In our opinion, the aforesaid consolidated Ind AS financial statements comply with the Indian Accounting
Standards specified under Section 133 of the Act.
e) On the basis of the written representations received from the directors of the Holding Company as on April
24, 2018 taken on record by the Board of Directors of the Holding Company and the reports of the statutory
auditors of jointly controlled entities incorporated in India, none of the directors of the Group company, its jointly
controlled entities incorporated in India is disqualified as on February 4, 2018 and March 31, 2018 from being
appointed as a director in terms of Section 164 (2) of the Act.
f ) With respect to the adequacy of the internal financial controls with reference to financial statements of the
Holding Company and jointly controlled entity incorporated in India and the operating effectiveness of such
controls, refer to our separate Report in Annexure A.
g) With respect to the other matters to be included in the Auditors’ Report in accordance with Rule 11 of the
Companies (Audit and Auditors) Rules, 2014, in our opinion and to the best of our information and according to
the explanations given to us:
i. The consolidated Ind AS financial statements disclose the impact, if any, of pending litigations as at March
31, 2018 on the consolidated financial position of the Group and jointly controlled entities– Refer Note No.
47 and 53(c) to the consolidated Ind AS financial statements.
ii. Provision has been made in the consolidated Ind AS financial statements, as required under the applicable
law or accounting standards, for material foreseeable losses, if any, on long-term contracts including
derivative contracts as at March 31, 2018– Refer Note No. - 50 and 36 to the consolidated Ind AS financial
statement in respect of such items as it relates to the Group and jointly controlled entities.
iii. There were no amounts which were required to be transferred to the Investor Education and Protection
Fund by the Holding Company, and its jointly controlled entities incorporated in India during the year ended
March 31, 2018.
iv. The reporting on disclosures relating to Specified Bank Notes is not applicable to the Group for the year
ended March 31, 2018
For Price Waterhouse & Co Chartered Accountants LLP
Firm Registration Number: 304056E/E-300009
Chartered Accountants
Sougata Mukherjee
Place: Jamshedpur Partner
April 24, 2018 Membership Number: 057084

Fifty Fifth Annual Report 2017-18
136
Annexure A to Independent Auditors’ ReportReferred to in paragraph 14(f ) of the Independent Auditors’ Report of even date to the members of TRF Limited on the
consolidated financial statements for the year ended March 31, 2018
Report on the Internal Financial Controls under Clause (i) of Sub-section 3 of Section 143 of the Act
1. In conjunction with our audit of the consolidated financial statements of the Company as of and for the year ended
March 31, 2018, we have audited the internal financial controls over financial reporting of TRF Limited (hereinafter
referred to as “the Holding Company”) and its jointly controlled companies, which are companies incorporated in India,
as of that date.
Management’s Responsibility for Internal Financial Controls
2. The respective Board of Directors of the Holding company and its jointly controlled companies, to whom reporting
under clause (i) of sub section 3 of Section 143 of the Act in respect of the adequacy of the internal financial controls
over financial reporting is applicable, which are companies incorporated in India, are responsible for establishing
and maintaining internal financial controls based on [for example, “internal control over financial reporting criteria
established by the Company considering the essential components of internal control stated in the Guidance Note
on Audit of Internal Financial Controls Over Financial Reporting issued by the Institute of Chartered Accountants of
India (ICAI)”. These responsibilities include the design, implementation and maintenance of adequate internal financial
controls that were operating effectively for ensuring the orderly and efficient conduct of its business, including
adherence to the respective company’s policies, the safeguarding of its assets, the prevention and detection of frauds
and errors, the accuracy and completeness of the accounting records, and the timely preparation of reliable financial
information, as required under the Act.
Auditor’s Responsibility
3. Our responsibility is to express an opinion on the Company’s internal financial controls over financial reporting based
on our audit. We conducted our audit in accordance with the Guidance Note on Audit of Internal Financial Controls
Over Financial Reporting (the “Guidance Note”) issued by the ICAI and the Standards on Auditing deemed to be
prescribed under section 143(10) of the Companies Act, 2013, to the extent applicable to an audit of internal financial
controls, both applicable to an audit of internal financial controls and both issued by the ICAI. Those Standards and the
Guidance Note require that we comply with ethical requirements and plan and perform the audit to obtain reasonable
assurance about whether adequate internal financial controls over financial reporting was established and maintained
and if such controls operated effectively in all material respects.
4. Our audit involves performing procedures to obtain audit evidence about the adequacy of the internal financial controls
system over financial reporting and their operating effectiveness. Our audit of internal financial controls over financial
reporting included obtaining an understanding of internal financial controls over financial reporting, assessing the risk
that a material weakness exists, and testing and evaluating the design and operating effectiveness of internal control
based on the assessed risk. The procedures selected depend on the auditor’s judgement, including the assessment of
the risks of material misstatement of the financial statements, whether due to fraud or error.
5. We believe that the audit evidence we have obtained and the audit evidence obtained by the other auditors in terms
of their reports referred to in the Other Matters paragraph below, is sufficient and appropriate to provide a basis for our
audit opinion on the Company’s internal financial controls system over financial reporting.
Meaning of Internal Financial Controls Over Financial Reporting
6. A company’s internal financial control over financial reporting is a process designed to provide reasonable assurance
regarding the reliability of financial reporting and the preparation of financial statements for external purposes in
accordance with generally accepted accounting principles. A company’s internal financial control over financial
reporting includes those policies and procedures that (1) pertain to the maintenance of records that, in reasonable
detail, accurately and fairly reflect the transactions and dispositions of the assets of the company; (2) provide reasonable
assurance that transactions are recorded as necessary to permit preparation of financial statements in accordance with
generally accepted accounting principles, and that receipts and expenditures of the company are being made only in
accordance with authorisations of management and directors of the company; and (3) provide reasonable assurance

137
regarding prevention or timely detection of unauthorised acquisition, use, or disposition of the company’s assets that
could have a material effect on the financial statements.
Inherent Limitations of Internal Financial Controls Over Financial Reporting
7. Because of the inherent limitations of internal financial controls over financial reporting, including the possibility of
collusion or improper management override of controls, material misstatements due to error or fraud may occur and
not be detected. Also, projections of any evaluation of the internal financial controls over financial reporting to future
periods are subject to the risk that the internal financial control over financial reporting may become inadequate
because of changes in conditions, or that the degree of compliance with the policies or procedures may deteriorate.
Opinion
8. In our opinion, the Holding Company, and jointly controlled companies, which are companies incorporated in India,
have, in all material respects, an adequate internal financial controls system over financial reporting and such internal
financial controls over financial reporting were operating effectively as at March 31, 2018, based on the internal control
over financial reporting criteria established by the Company considering the essential components of internal control
stated in the Guidance Note on Audit of Internal Financial Controls Over Financial Reporting issued by the Institute of
Chartered Accountants of India.
Other Matters
9. Our aforesaid reports under Section 143(3)(i) of the Act on the adequacy and operating effectiveness of the internal
financial controls over financial reporting in so far as it relates to 2 jointly controlled companies, which are companies
incorporated in India, is based on the corresponding reports of the auditors of such companies incorporated in India.
Our opinion is not qualified in respect of this matter.
As stated in paragraph 11 of our main audit report, the report on the internal financial controls over financial reporting,
in so far as it relates to a jointly controlled entity which was disposed off during the year, is based solely on such
unaudited financial statements. In our opinion and according to the information and explanations given to us by the
Management, these financial statements are not material to the Group.
For Price Waterhouse & Co Chartered Accountants LLP
Firm Registration Number: 304056E/E-300009
Chartered Accountants
Sougata Mukherjee
Place: Jamshedpur Partner
April 24, 2018 Membership Number: 057084

Fifty Fifth Annual Report 2017-18
138
Rs. lakhs
Notes As at As at 31.03.2018 31.03.2017 (I) ASSETS(1) Non-current assets (a) Property, plant and equipment 03 3,864.32 6,133.42 (b) Capital work in progress 78.23 75.13 (c) Goodwill 04 15,467.10 14,650.56 (d) Other intangible assets 05 35.91 121.89 19,445.56 20,981.00 (e) Financial assets (i) Investments a) Investments in joint ventures 06 1,842.86 1,735.76 b) Other non-current investments 07 47.56 36.34 (ii) Other financial assets 08 477.32 3,283.49 (f ) Other non-current assets 09 314.70 295.61 (g) Advance income tax assets (net) 2,733.67 2,526.91 (h) Deferred tax assets (net) 10 17.46 231.98 24,879.13 29,091.09 (2) Current Assets (a) Inventories and contracts in progress 11 10,029.42 22,325.29 (b) Financial assets (i) Trade receivables 12 38,021.34 55,156.82 (ii) Cash and cash equivalents 13 1,421.31 4,573.61 (iii) Other balances with bank 13 768.10 258.92 (iv) Other financial assets 14 577.81 278.09 (v) Derivative assets 15 96.39 270.39 (c) Other current assets 16 5,363.20 7,948.37 (d) Current tax assets (net) 16.59 87.23 (e) Assets held for sale 17 27,913.82 - 84,207.98 90,898.72TOTAL ASSETS 109,087.11 119,989.81(II) EQUITY AND LIABILITIES(1) Equity (a) Equity share capital 18 1,100.44 1,100.44 (b) Other equity 19 (21,182.79) (9,237.54) Equity attributable to owners of the Company (20,082.35) (8,137.10) Non-controlling interests 20 45.28 45.23 Total equity (20,037.07) (8,091.87)(2) Non-current liabilities (a) Financial liabilities (i) Borrowings 21 3,404.55 15,924.83 (b) Provisions 22 1,457.05 1,939.34 (c) Other non-current liabilities 23 25.90 21.54 (d) Deferred tax liabilities (Net) 10 20.30 1,977.36 Total Non-current liabilities 4,907.80 19,863.07(3) Current liabilities (a) Financial liabilities (i) Borrowings 24 29,623.70 31,944.37 (ii) Derivative liabilities 25 5.30 35.07 (iii) Trade payables 26 30,865.27 42,129.61 (iv) Other financial liabilities 27 7,217.85 8,536.08 (b) Provisions 22 4,327.20 3,280.26 (c) Other current liabilities 28 20,234.56 20,139.45 (d) Current Income tax liabilities (net) 2,133.80 2,153.77 (e) Liabilities held for sale 17 29,808.70 - Total current liabilities 124,216.38 108,218.61TOTAL EQUITY AND LIABILITIES 109,087.11 119,989.81
See accompanying notes forming part of the financial statements
This is the Balance Sheet referred to in our Report of even date For and on behalf of the Board of DirectorsFor Price Waterhouse & Co Chartered Accountants LLP Sandip Biswas Sanjay Rajoria Chartered Accountants Chairman Managing Director Firm Registration No: 304026E / E-300009Sougata Mukherjee K. S. Mathai Mathew Tarun Kr. Srivastava Partner (Membership no: 057084) Chief Financial Officer Company SecretaryJamshedpur Mumbai 24th April, 2018 24th April, 2018
Consolidated Balance Sheet as at March 31, 2018

139
Notes Year ended Year ended
31.03.2018 31.03.2017
(1) Revenue from operations (gross) 29 44,177.58 60,250.00
(2) Other income 30 488.57 712.13
(3) Total Revenue (1) + (2) 44,666.15 60,962.13
(4) Expenses
(a) Cost of materials consumed 31 25,146.02 32,271.12
(b) Payment to sub-contractors 8,376.71 8,809.58
(c) Purchases of finished, semi-finished and other products - -
(d) Changes in inventories of finished products,
work in progress and contracts in progress 32 2,923.98 1,207.51
(e) Excise duty on sale of goods 243.82 4,545.86
(f ) Employee benefits expense 33 6,848.19 6,140.45
(g) Finance costs 34 4,894.50 4,775.79
(h) Depreciation and amortisation expense 35 499.46 552.97
(i) Other expenses 36 14,974.52 10,736.46
Total Expenses (4) 63,907.20 69,039.74
(5) Profit /(Loss) before share of profits from joint ventures,
exceptional items and tax (3) - (4) (19,241.05) (8,077.61)
(6) Share of profit/(loss) from joint ventures 743.16 83.83
(7) Profit /(Loss) before exceptional items and tax (5) + (6) (18,497.89) (7,993.78)
(8) Exceptional Items
(a) Profit on sale of fixed assets - 418.67
Total Exceptional Items (8) - 418.67
(9) Profit/(Loss) before tax (7) + (8) (18,497.89) (7,575.11)
(10) Tax Expense
(a) Current tax 168.83 236.57
(b) Deferred tax (1,971.45) (2,348.52)
Total tax expense (10) (1,802.62) (2,111.95)
(11) Profit /(Loss) after tax from countinuing operation (9) - (10) (16,695.27) (5,463.16)
(12) Profit /(Loss) after tax from discountinued operation 37
(a) Profit/(loss) after tax from discountinued operations 958.89 3,053.02
(b) Profit/(loss) on disposal of discountinued operations 2,325.03 -
(13) Profit/(loss) for the year (13,411.35) (2,410.14)
Profit for the year attributable to:
Owners of the Company (13,411.35) (2,409.85)
Non controlling interests - (0.29)
(13,411.35) (2,410.14)
Consolidated Statement of Profit and Loss for the year ended March 31, 2018
Rs. lakhs

Fifty Fifth Annual Report 2017-18
140
Consolidated Statement of Profit and Loss for the year ended March 31, 2018 (Contd.)
Rs. lakhs
Notes Year ended Year ended
31.03.2018 31.03.2017
This is the Statement of Profit and Loss referred to in our Report of even date For and on behalf of the Board of Directors
For Price Waterhouse & Co Chartered Accountants LLP Sandip Biswas Sanjay Rajoria
Chartered Accountants Chairman Managing Director
Firm Registration No: 304026E / E-300009
Sougata Mukherjee K. S. Mathai Mathew Tarun Kr. Srivastava
Partner (Membership no: 057084) Chief Financial Officer Company Secretary
Jamshedpur Mumbai
24th April, 2018 24th April, 2018
(14) Other comprehensive income
A. Items that will not be reclassified to profit and loss account
(a) Equity instruments through other comprehensive income 11.23 9.28
(b) Remeasurement of the employees defined benefit plans (8.98) (251.69)
(c) Income tax relating to items that will not be reclassified to profit or loss 0.28 0.80
2.53 (241.61)
B. Items that will be reclassified to profit and loss account
(a) Foreign currency translation differences - foreign companies 1,447.92 (874.84)
(b) Income tax on items that will be reclassified to profit or loss - -
1,447.92 (874.84)
Total other comprehensive income (14) 1,450.45 (1,116.45)
(15) Total comprehensive income for the period (13 + 14) (11,960.90) (3,526.59)
Total comprehensive income for the period attributable to:
Owners of the Company (11,960.88) (3,526.30)
Non controlling interests (0.02) (0.29)
(11,960.90) (3,526.59)
(16) Earnings per equity share for profit from continuing operation
attributable to the owners of the Compnay :
(Face value of share of Rs 10 each) 41
Basic Earnings per share (151.71) (49.65)
Diluted earnings per share (151.71) (49.65)
Earnings per Equity Share for profit from discontinued operation
attributable to owners of the Company :
(Face value of share of Rs 10 each)
Basic Earnings per share 29.84 27.74
Diluted earnings per share 29.84 27.74
Earnings per equity share for profit from continuing operation
and discondinuted operation attributable to the owners
of the Compnay : (Face value of share of Rs 10 each)
Basic Earnings per share (121.87) (21.90)
Diluted earnings per share (121.87) (21.90)
See accompanying notes to the consolidated financial statements

141
Consolidated Cash Flow Statement for the year ended March 31, 2018Rs. lakhs
Year ended Year ended
31.03.2018 31.03.2017
A. Cash Flow from Operating activities
Profit /(Loss) for the year from
Continuing operations (16,695.27) (5,463.16)
Discountinued operations 3,283.92 3,053.02
Profit after tax including discontinued operations (13,411.35) (2,410.14)
Adjustments for:
Income tax expenses recognised in profit and loss account (792.62) (1,979.12)
Share of profits from joint ventures (743.16) (83.83)
Share of Profits from discontinued Joint Venture (96.95) (272.39)
Profit on sale of discontinued operation (2,325.03) -
Finance cost recognised in profit and loss 5,366.81 5,430.29
Interest income recognised in profit and loss (83.75) (341.12)
Dividend income recognised in profit and loss (0.29) (0.24)
Net loss/(gain) on disposal of property, plant and equipment - (447.53)
Net loss/(gain) recognised in profit and loss on
financial liabilities designated as at fair value through profit and loss 200.10 322.63
Impairment loss recognised on trade receivables 4,966.35 1,765.38
Impairment loss recognised on other financial assets 8.13 -
Impairment loss recognised on other non-financial assets (6.66) -
Depreciation and amortisation of tangible and intangible assets 890.51 939.54
Loan issue expenses recognised in profit and loss 1.15 63.76
Unrealised exchange (gain)/loss 131.03 170.06
Exchange differences on long-term monetary items amortised from FCMITDA 12.96 221.27
Exchange difference on long-term loans (165.39) (250.43)
(6,048.16) 3,128.13
Movements in working capital:
(Increase)/Decrease in inventories 2,117.62 1,506.24
(Increase)/Decrease in trade receivables 3,175.46 6,420.91
(Increase)/Decrease in other non-current financial assets 2,379.21 (2,186.56)
(Increase)/Decrease in other current financial assets (472.65) (160.33)
(Increase)/Decrease in other non-current assets (16.19) (18.21)
(Increase)/Decrease in other current assets 1,669.85 1,402.22
Increase/(decrease) in trade payables 2,429.93 2,709.17
Increase/(decrease) in other current financial liabilities 200.33 17.83
Increase/(decrease) in long-term provisions (382.60) (394.10)
Increase/(decrease) in short-term provisions 1,442.20 771.51
Increase/(decrease) in other non-current liabilities 4.37 5.84
Increase/(decrease) in other current liabilities 83.98 (1,571.76)
Cash generated from operations 6,583.36 11,630.89
Income taxes paid/(refunded) (1,060.94) (580.00)
Net cash from operations 5,522.42 11,050.89

Fifty Fifth Annual Report 2017-18
142
In terms of our report of even date For and on behalf of the Board of Directors
For Price Waterhouse & Co Chartered Accountants LLP Sandip Biswas Sanjay Rajoria
Chartered Accountants Chairman Managing Director
Firm Registration No: 304026E / E-300009
Sougata Mukherjee K. S. Mathai Mathew Tarun Kr. Srivastava
Partner (Membership no: 057084) Chief Financial Officer Company Secretary
Jamshedpur Mumbai
24th April, 2018 24th April, 2018
Year ended Year ended
31.03.2018 31.03.2017
B. Cash flows from investing activities
Payments for property plant and equipment (435.41) (522.26)
Proceeds from disposal of property, plant and equipment 115.37 755.62
Proceeds from Sale of other non-current investments 3,060.00 -
Dividend received from joint ventures - 388.08
Dividend received from other non current investments 0.29 0.24
Interest received 26.02 340.25
(Increase)/decrease in earmarked deposits (466.05) (662.00)
Net cash from investment activities 2,300.22 299.93
C. Cash flows from financing activities
Proceeds from long-term loans 10,264.29 5,471.59
Proceeds from finance lease arrangement - 3.74
Proceeds from buyers’ credit 2,858.61 3,463.64
Proceeds/(repayment) from/of working capital and other short term loans 4,140.85 (4,360.29)
Proceeds/(repayment) from/of bills discounting (135.99) 754.72
Repayment of long-term loans (15,902.74) (7,324.21)
Repayment of finance lease obligation (13.52) (14.63)
Repayment of buyers’ credit (2,785.92) (3,396.10)
Dividend paid (46.69) -
Premium paid on derivative contracts (55.88) (175.63)
Interest paid (5,324.11) (5,372.15)
Net cash used in financing activities (7,001.10) (10,949.32)
Net increase/(decrease) in cash or cash equivalents 821.53 401.50
Cash and cash equivalents as at 1 April, 2017 4,573.61 4,266.20
Effect of exchange rate on translation of foreign currency Cash and cash equivalents 218.34 (94.09)
Cash and cash equivalents as at 31 March, 2018 5,613.49 4,573.61
Reconciliation of cash and cash equivalents as per the cash flow statement Year ended Year ended
Cash and cash equivalent as per above comprise of the following : 31.03.2018 31.03.2017
Cash and cash equivalents (note 13) 1,421.31 4,573.61
Cash and cash equivalents - held for sale (note 17) 4,192.18 -
Balances as per statement of cash flows 5,613.49 4,573.61
See accompanying notes to the consolidated financial statements
Consolidated Cash Flow Statement for the year ended March 31, 2018 (Contd.)Rs. lakhs

143Co
nso
lid
ate
d S
tate
me
nt
of
cha
ng
es
in E
qu
ity
fo
r th
e y
ea
r e
nd
ed
Ma
rch
31
, 20
18
A.
Eq
uit
y sh
are
ca
pit
al
Am
ount
P
art
icu
lars
Rs
. lak
hs
B
ala
nce
as
at 3
1 M
arc
h 2
01
7
1,1
00
.44
C
hang
es in
eq
uity
sha
re c
apit
al d
urin
g th
e ye
ar e
nded
Mar
ch 3
1, 2
018
–
B
ala
nce
as
at 3
1 M
arc
h 2
01
8
1,1
00
.44
B.
Oth
er
Eq
uit
y
Rs
. lak
hs
Rese
rves
and
Sur
plus
Item
s of
Oth
er
Com
preh
ensi
ve
inco
me
Non
Cont
rolli
ng
Inte
rest
Tota
l Equ
ity
Am
alga
mat
ion
Rese
rve
Fore
ign
curr
ency
tran
slat
ion
rese
rve
Fore
ign
exch
ange
fluct
uatio
n
rese
rve
Gen
eral
rese
rve
Fore
ign
curr
ency
mon
etar
y ite
m
tran
slat
ion
diffe
renc
e
Reta
ined
Earn
ings
Inve
stm
ent
Reva
luat
ion
Rese
rve
(Equ
ity)
Bal
ance
at
Ap
ril 1
, 201
661
.81
257.
3344
8.20
14,4
58.5
9(2
88.0
9)(2
0,93
7.19
)26
.73
46.5
6(5
,926
.06)
Loss
for t
he y
ear
--
--
(2,4
09.8
5)-
(0.2
9)(2
,410
.14)
Add
ition
s du
ring
the
year
40.1
040
.10
Oth
er C
ompr
ehen
sive
Inco
me
-(8
74.8
4)-
--
(251
.69)
9.28
(1,1
17.2
5)
Tax
impa
ct o
f the
abo
ve0.
800.
80
Reco
gnis
ed in
the
stat
emen
t of p
rofit
and
loss
--
-22
1.28
--
221.
28
Exch
ange
diff
eren
ce o
n co
nsol
idat
ion
(1.0
4)(1
.04)
Bal
ance
at
Mar
ch 3
1, 2
017
61.8
1(6
17.5
1)44
8.20
14,4
58.5
9(2
6.71
)(2
3,59
7.93
)36
.01
45.2
3(9
,192
.31)
Loss
for t
he y
ear
--
--
(13,
411.
35)
--
(13,
411.
35)
Add
ition
s du
ring
the
year
2.68
2.68
Oth
er C
ompr
ehen
sive
Inco
me
-1,
447.
94-
--
(8.9
8)11
.23
(0.0
2)1,
450.
17
Tax
impa
ct o
f the
abo
ve0.
280.
28
Reco
gnis
ed in
the
stat
emen
t of p
rofit
and
loss
--
-12
.95
--
12.9
5
Exch
ange
diff
eren
ce o
n co
nsol
idat
ion
0.07
0.07
Bal
ance
at
Mar
ch 3
1, 2
018
61.8
183
0.43
448.
2014
,458
.59
(11.
08)
(37,
017.
98)
47.2
445
.28
(21,
137.
51)
In t
erm
s o
f o
ur
rep
ort
of
even
dat
e Fo
r an
d o
n b
ehal
f o
f th
e B
oar
d o
f D
irec
tors
For
Pri
ce W
ate
rho
use
& C
o C
ha
rte
red
Acc
ou
nta
nts
LL
P
Sa
nd
ip B
isw
as
Sa
nja
y R
ajo
ria
Ch
arte
red
Acc
ou
nta
nts
C
ha
irm
an
M
an
ag
ing
Dir
ecto
r
Firm
Reg
istr
atio
n N
o. :
30
40
26
E /
E-3
00
00
9
So
ug
ata
Mu
kh
erj
ee
K
. S. M
ath
ai
Ma
the
w
Ta
run
Kr.
Sri
va
sta
va
Par
tner
(Mem
ber
ship
no
. : 0
57
08
4)
Ch
ief F
ina
nci
al O
ffice
r C
om
pa
ny
Secr
eta
ry
Jam
shed
pu
r, M
um
bai
24
th A
pri
l, 2
01
8
24
th A
pri
l, 2
01
8

Fifty Fifth Annual Report 2017-18
144
1. General corporate information
TRF Limited, (“”the Company””) incorporated in 1962 has its Registered Office at 11 Station Road, Burma Mines, Jamshedpur 831007.
The Company is listed on the National Stock Exchange of India Limited, BSE Limited and The Calcutta Stock Exchange Limited. The
Company undertakes turnkey projects of material handling for the infrastructure sector such as power and ports and industrial
sector such as steel plants, cement, fertilizers and mining. The Company is also engaged in production of such material handling
equipments at its manufacturing plant at Jamshedpur.
2. Summary of significant accounting policies
2.01 Basis of preparation and presentation
These consolidated financial statements of the Group are prepared under the historical cost except for certain financial
instruments that are measured at fair value at end of each reporting period. Historical cost is generally based on fair value of
the consideration given in exchange for goods and services.
Fair value is the price that would be received to sell an asset or paid to transfer a liability in an orderly transaction between
market participants at the measurement date, regardless of whether that price is directly observable or estimated using another
valuation technique. In estimating the fair value of an asset or a liability, the Group takes into account the characteristics of the
asset or liability if market participants would take those characteristics into account when pricing the asset or liability at the
measurement date. In these consolidated financial statements, the fair value for measurement and/or disclosure purpose is
determined on such basis except for leasing transactions that are within the scope of Ind AS 17, and measurements that have
some similarities to fair value but are not fair value, such as net realisable value in Ind AS 2 or value in use in Ind AS 36.
In addition, for financial reporting purposes, fair value measurements are catergorised in to Level 1, 2 or 3 based on the
degree to which the inputs to the fair value measurements are observable and the significance of the inputs to the fair value
measurement in its entirety. (Refer note 41.10)
Level 1 inputs are quoted prices (unadjusted) in active markets for identical assets or liabilities that the entity can access
at the measurement date;
Level 2 inputs are inputs, other than quoted prices included in Level 1, that are observable for the asset or liability, either
directly or indirectly; and
Level 3 inputs are unobservable inputs for the asset or liability.
2.02 Use of Estimates
The preparation of consolidated financial statements in conformity with the recognition and measurement principles of Ind
AS requires the management of the Group to make estimates and assumptions that affect the reported balances of assets and
liabilities, disclosures relating to contingent liabilities as at the date of the consolidated financial statements and the reported
amounts of income and expense for the periods presented.
Estimates and underlying assumptions are reviewed on an ongoing basis. Revisions to accounting estimates are recognised in
the period in which the estimates are revised and future periods are affected.
In particular, information about significant areas of estimation uncertainty and critical judgments in applying accounting
policies that have the most significant effect on the amounts recognised in the financial statements are included in the
following notes:
- Revenue from Contracts [Refer Note 2.07 (ii)]
- Useful lives of Property, plant and equipment and intangible assets (Refer Note 2.14 and 2.16)
- Assets and obligations relating to employee benefits (Refer Note 43)
- Valuation and measurement of income taxes and deferred taxes (Refer Note 39)
- Provisions and Contingencies (Refer Note 2.18)
- Retention money receivable (Refer Note 14)
- Going Concern (Refer Note 51)
- Impairment of goodwill (Refer Note 55)
Notes forming part of the financial statements
for the year ended March 31, 2018

145
Notes forming part of the financial statements
for the year ended March 31, 2018
2.03 Basis of consolidation
Subsidiaries
The consolidated financial statements include TRF Limited and its subsidiaries. Subsidiaries are entities controlled by the
Company. Control exists when the Company (a) has power over the investee, (b) it is exposed, or has rights, to variable returns
from its involvement with the investee and (c) has the ability to affect those returns through its power over the investee. The
Company reassesses whether or not it controls an investee if facts and circumstances indicate that there are changes to one
or more of the three elements listed above. In assessing control, potential voting rights that currently are exercisable are taken
into account. The results of subsidiaries acquired or disposed off during the year are included in the consolidated financial
statements from the effective date of acquisition and up to the effective date of disposal, as appropriate.
Inter-company transactions and balances including unrealised profits are eliminated in full on consolidation.
Non-controlling interests in the net assets (excluding goodwill) of consolidated subsidiaries are identified separately from the
Company’s equity. The interest of non-controlling shareholders may be initially measured either at fair value or at the non-
controlling interests’ proportionate share of the fair value of the acquiree’s identifiable net assets. The choice of measurement
basis is made on an acquisition-by-acquisition basis. Subsequent to acquisition, the carrying amount of non-controlling
interests is the amount of those interests at initial recognition plus the non-controlling interests’ share of subsequent changes
in equity. Total comprehensive income is attributed to non-controlling interests even if it results in the non-controlling interest
having a deficit balance.
Changes in the Group’s ownership interest in existing subsidiaries
Changes in the Company’s interests in subsidiaries that do not result in a loss of control are accounted for as equity transactions.
The carrying amount of the Company’s interests and the non-controlling interests are adjusted to reflect the changes in their
relative interests in the subsidiaries. Any difference between the amount by which the non-controlling interests are adjusted
and the fair value of the consideration paid or received is recognised directly in equity and attributed to owners of the
Company.
When the Company loses control of a subsidiary, the profit or loss on disposal is calculated as the difference between (i)
the aggregate of the fair value of consideration received and the fair value of any retained interest and (ii) the previous
carrying amount of the assets (including goodwill), and liabilities of the subsidiary and any non-controlling interests. Amounts
previously recognized in other comprehensive income in relation to the subsidiary are accounted for (i.e., reclassified to profit
or loss) in the same manner as would be required if the relevant assets or liabilities were disposed off. The fair value of any
investment retained in the former subsidiary at the date when control is lost is regarded as the fair value on initial recognition
for subsequent accounting under Ind AS 109-Financial Instruments: Recognition and Measurement or, when applicable, the
cost on initial recognition of an investment in an associate or jointly controlled entity.
Interests in joint arrangements
A joint arrangement is an arrangement of which two or more parties have joint control. Joint control is the contractually agreed
sharing of control of an arrangement, which exists only when decisions about the relevant activities require the unanimous
consent of the parties sharing control.
Joint ventures
A joint venture is a joint arrangement whereby the parties that have joint control of the arrangement have rights to the net
assets of the arrangement. The results, assets and liabilities of a joint venture are incorporated in these financial statements
using the equity method of accounting as described below.
Associates
Associates are all entities over which the group has significant influence but not control or joint control.This is generally the
case where the group holds between 20% and 50% of the voting rights. Investments in associates are accounted for using
equity method , after initally being recognised at cost.
Equity method of accounting (equity accounted investees)
An interest in an associate or joint venture is accounted for using the equity method from the date in which the investee
becomes an associate or a joint venture and are recognised initially at cost. The Company’s investment includes goodwill
identified on acquisition, net of any accumulated impairment losses. The consolidated financial statements include the
Company’s share of profits or losses and equity movements of equity accounted investees, from the date that significant

Fifty Fifth Annual Report 2017-18
146
Notes forming part of the financial statements
for the year ended March 31, 2018
influence or joint control commences until the date that significant influence or joint control ceases. When the Company’s
share of losses exceeds its interest in an equity accounted investee, the carrying amount of that interest (including any long-
term investments in the nature of net investments) is reduced to nil and the recognition of further losses is discontinued
except to the extent that the Company has an obligation or has made payments on behalf of the investee.
When the Company transacts with an associate or joint venture of the Company, unrealised profits and losses are eliminated
to the extent of the Company’s interest in its associate or joint venture.
2.04 Business Combinations
Acquisitions of subsidiaries and businesses are accounted for using the acquisition method. Acquisition related costs are
recognised in the statement of profit or loss as incurred. The acquiree’s identifiable assets, liabilities and contingent liabilities
that meet the conditions for recognition are recognised at their fair value at the acquisition date, except certain assets and
liabilities required to be measured as per the applicable standard.
Purchase consideration in excess of the Company’s interest in the acquiree’s net fair value of identifiable assets, liabilities and
contingent liabilities is recognized as goodwill. The acquirer shall recognise the resulting gain in other comprehensive income
on the acquisition date and accumulate the same in equity as capital reserve.If there does not exist clear evidence of the
underlying reasons for classifying the business combination as a bargain purchase, the excess shall be recognised directly in
equity as capital reserve.
2.05 Goodwill
Goodwill arising on an acquisition of a business is carried at cost as established at the date of acquisition of the business less
accumulated impairment losses, if any. For the purposes of impairment testing, goodwill is allocated to each of the Group’s
cash-generating units that is expected to benefit from the synergies of the combination.
A cash-generating unit to which goodwill has been allocated is tested for impairment annually, or more frequently when there
is an indication that the unit may be impaired. If the recoverable amount of the cash-generating unit is less than its carrying
amount, the impairment loss is allocated first to reduce the carrying amount of any goodwill allocated to the unit and then
to the other assets of the unit on pro rated basis on the carrying amount of each asset in the unit. Any impairment loss for
goodwill is recognised directly in the statement of profit and loss. Any impairment loss recognised for goodwill is not reversed
in subsequent periods.
On disposal of the relevant cash-generating unit, the attributable amount of goodwill is included in the determination of the
profit or loss on disposal.
2.06 Revenue recognition
Revenue is measured at fair value of the consideration received or receivable and is reduced by rebates, allowances and taxes
and duties collected on behalf of the government. The Group has assumed that recovery of excise duty flows to the Group on
its own account, for the reason that it is a liability of the manufacturer which forms part of the cost of production, irrespective
of whether the goods are sold or not. Accordingly revenue includes excise duty.
i) Sale of goods
Revenue from the sale of goods is recognised when the goods are delivered and titles have been passed, at which time
all the following conditions are satisfied:
the Group has transferred to the buyer the significant risks and rewards of ownership of the goods;
the Group retains neither continuing managerial involvement to the degree usually associated with ownership nor
effective control over the goods sold;
the amount of revenue can be measured reliably;
it is probable that the economic benefits associated with the transaction will flow to the Group; and
the costs incurred or to be incurred in respect of the transaction can be measured reliably.
The Group provides normal warranty for general repairs for 12 to 18 months on products sold in line with industry
practice. A liability is recognised at the time the product is sold.
ii) Construction contracts
Revenue from contracts are recognised on percentage completion method specified under Indian Accounting Standard

147
Notes forming part of the financial statements
for the year ended March 31, 2018
(Ind AS) 11 - Construction contracts. Profit (contract revenue less contract cost) is recognised when the outcome of
a construction contract can be estimated reliably. Revenue and costs are recognised by reference to the stage of
completion of the contract activity at the end of the reporting period, measured based on the proportion of contract
costs incurred for work performed to date relative to the estimated total contract costs, except where this would not be
representative of the stage of completion.
The outcome of a construction contract is considered as estimated reliably when (a) all critical approvals necessary for
commencement of the project have been obtained; (b) the stage of completion of the project reaches reasonable level
of development. The stage of completion is determined as a proportion that contract costs incurred for work performed
up to the closing date bear to the estimated total costs of respective project. Profit (contract revenue less contract cost)
is recognised when the outcome of the contract can be estimated reliably and for contracts valued up to Rs. 100 crore,
profit is recognised when stage of completion is 40% or more, and for contracts valued more than Rs. 100 crore, profit is
recognised either at 25% stage of completion or an expenditure of Rs. 40 crore whichever is higher. When it is probable
that the total cost will exceed the total revenue from the contract, the expected loss is recognised immediately. For this
purpose total contract costs are ascertained on the basis of contract costs incurred and cost to completion of contracts
which is arrived at by the management based on current technical data, forecast and estimate of net expenditure to be
incurred in future including for contingencies etc. For determining the expected cost to completion of the contracts,
cost of steel, cement and other related items are considered at current market price based on fixed cost purchase orders
placed or firm commitments received from suppliers / contractors as these purchase orders and future firm commitments
are enforceable over the period of the contracts.
When the outcome of a construction contract cannot be estimated reliably, contract revenue is recognised to the extent
of contract costs incurred that is probably recoverable. Contract costs are recognised as expenses in the period in which
they are incurred.
When contract costs incurred to date plus recognised profit less recognised losses exceed progress billing, the surplus
is shown as amount due from customers for contract work. For contracts where progress billings exceed contract costs
incurred to date plus recognised profits less recognised losses, the surplus is shown as the amounts due to customers for
contract work. Amounts received before the related work is performed are included as a liability as advances received.
Amounts billed for work performed but not yet paid by customer are included under trade receivables.
iii) Dividend and Interest income
Dividend income is recognised when the Group’s right to receive payment has been established and that the economic
benefits will flow to the Group and amount of income can be measured reliably.
Interest income from a financial asset is recognised when it is probable that the economic benefits will flow to the
Group and the amount of income can be measured reliably. Interest income is accrued on a time basis, by reference
to the principal outstanding and at the effective interest rate applicable, which is the rate that exactly discounts
estimated future cash receipts through the expected life of the financial asset to the asset’s net carrying amount on
initial recognition.
2.07 Lease
The Group as lessee
Assets leased by the Group in its capacity as a lessee, where substantially all the risks and rewards of ownership vest in the
Group are classified as finance leases. Such leases are capitalised at the inception of the lease at the lower of the fair value and
the present value of the minimum lease payments and a liability is created for an equivalent amount. Each lease rental paid
is allocated between the liability and the interest cost so as to obtain a constant periodic rate of interest on the outstanding
liability for each year.
Lease arrangements where the risks and rewards incidental to ownership of an asset substantially vest with the lessor are
recognised as operating leases.
The Group significant leasing arrangements are in respect of operating leases for premises (residential, office, warehouse
etc). The leasing arrangements, which are non-cancellable, range between eleven months and three years generally, and are
usually renewable by mutual consent on agreed terms. The aggregate lease rentals payable are charged as rent.
2.08 Foreign currencies
Transactions in currencies other than entity’s functional currency (foreign currency) are recorded at the rates of exchange
prevailing on the date of the transaction. Monetary assets and liabilities denominated in foreign currencies (other than

Fifty Fifth Annual Report 2017-18
148
Notes forming part of the financial statements
for the year ended March 31, 2018
derivative contracts and net investment in non-integral foreign operations) remaining unsettled at the end of the each
reporting period are remeasured at the rates of exchange prevailing at that date. Non-monetary items carried at fair value that
are denominated in foreign currencies are retranslated at the rate prevailing at the date when the fair value was determined.
Non-monetary items that are measured in terms of historical cost in a foreign currency are not retranslated.
Exchange difference on monetary items are recognised in the statement of profit and loss in the period in which they arise
except for exchange differences on monetary items receivable from or payable to a foreign operation for which settlement
is neither planned nor likely to occur (therefore forming part of the net investment in the foreign operation), which are
recognised initially in other comprehensive income and reclassified from equity to the statement of profit and loss on disposal
of the net investment.
The Group has opted under Ind AS 101-First time adoption of Indian Accounting Standards to defer/capitalise the exchange
difference arising on reporting of long-term foreign currency monetary items recognised upto March 31, 2016, in line with the
paragraph 46A of Accounting Standard (AS) 11 - Effects of changes in foreign exchange rates. Accordingly exchange difference
arising on the settlement and remeasurement of long-term foreign currency monetary items relating to the acquisition of
depreciable capital asset are accounted by addition or deduction to the cost of the depreciable assets and depreciated over
the remaining useful life of such assets. Exchange differences arising on settlement and remeasurement of other long-term
foreign currency monetary items are accumulated in “Foreign Currency Monetary Item Translation Difference Account” and
amortised over the maturity period or upto the date of settlement of such monetary items, whichever is earlier, and charged
to the statement of profit and loss.
In presenting these consolidated financial statements, the assets and liabilities of the Group’s foreign operations are translated
in to Indian Rupees using rates of exchange prevailing at the end of the each reporting period. Income and expense are
translated at the average rates of exchange for the period. Exchange differences arising, if any are recognised in other
comprehensive income and accumulated in equity (and attributed to non-controlling interests as appropriate).
On the disposal of a foreign operation (a disposals of the Group’s entire interest in a foreign operation, a disposal involving
loss of control over a subsidiary that includes foreign operations, or a partial disposal of an interest in a joint arrangement
that includes a foreign operation of which the retained interest becomes a financial asset), all of the exchange differences
accumulated in equity in respect of that operation attributable to owners of the Group are reclassified to profit and loss. In
case of partial disposal of a subsidiary that includes foreign operation that does not result in the Group losing control over the
subsidiary, the proportionate share of accumulated exchange differences are re-attributed to non-controlling interests and are
not recognised in profit and loss.
Goodwill arising in the business combination of foreign operation on or after April 1, 2015 and fair value adjustments to
identifiable assets acquired and liabilities assumed through acquisition of foreign operation are treated as assets and liabilities
of the foreign operation and translated at the rate of exchange prevailing at the end of each reporting period. Exchange
differences are recognised in other comprehensive income.
2.09 Borrowing costs
Borrowing costs directly attributable to the acquisition, construction or production of qualifying assets, which are assets that
necessarily take a substantial period of time to get ready for their intended use or sale, are added to the cost of those assets,
until such time as the assets are substantially ready for their intended use.
Interest income earned on the temporary investment of specific borrowings pending their expenditure on qualifying assets is
deducted from the borrowing cost eligible for capitalisation.
All other borrowing costs are recognised in profit and loss in the period in which they are incurred.
2.10 Government Grants
Grants from the government are recognised at their fair value where there is a reasonable assurance that the grants will be
received and the group will comply with all attached conditions.
Government grants relating to income are deferred and recognised in the profit or loss over the period necessary to match
them with the costs that they are intended to compensate and presented within other income.
Government grants relating to the purchase of property, plant and equipment are included in non-current liabilties as deferred
income and are credited to profit or loss on a straight line basis over the expected lives of the related assets and presented
within other income.

149
Notes forming part of the financial statements
for the year ended March 31, 2018
2.11 Employee Benefits
i) Short-term benefits
Short term employee benefits are recognised as an expense at the undiscounted amount in the statement of profit and loss of the year in which the related service is rendered.
ii) Defined contribution plans
Payments to defined contribution plans are recognised as an expense when employees have rendered services entitling them to the contributions. Defined contribution plans are those plans where the Group pays fixed contributions to funds/schemes managed by independent trusts or authority. Contributions are paid in return for services rendered by the employees during the year. The Group has no legal or constructive obligation to pay further contributions if the fund/scheme does not hold sufficient assets to pay/extend employee benefits. The Group provides Provident Fund facility to all employees and Superannuation benefits to selected employees. The contributions are expensed as they are incurred in line with the treatment of wages and salaries. The Group’s Provident Fund is exempted under section 17 of Employees’ Provident Fund and Miscellaneous Provision Act, 1952. Conditions for exemption stipulate that the Group shall make good deficiency, if any, in the interest rate declared by the trust vis-s-vis interest rate declared by the Employees’ Provident Fund Organisation. The liability as on the balance sheet is ascertained by an independent actuarial valuation.
iii) Defined benefit plans
The cost of providing defined benefit plans are determined using the projected unit credit method, with independent actuarial valuations being carried out at the end of each reporting period. The Group provides gratuity to its employees and pension to retired whole-time directors. Gratuity liabilities are funded and managed through separate trust (except in case of some of the employees of Port and Yard Equipment Division where the funds are managed by Life Insurance Corporation of India). The liabilities towards pension to retired whole-time directors are not funded.
Remeasurements, comprising actuarial gains and losses, return on plan assets excluding amounts included in net interest on the net benefit liability (asset) and any change in the effect of the asset ceiling (if applicable) are recognised in the balance sheet with a charge or credit recognised in other comprehensive income in the period in which they occur. Remeasurement recognised in the comprehensive income are not reclassified to the statement of profit and loss but recognised directly in the retained earnings. Past service costs are recognised in the statement of profit and loss in the period in which the amendment to plan occurs. Net interest is calculated by applying the discount rate to the net defined liability or asset at the beginning of the period, taking into account of any changes in the net defined benefit liability (asset) during the period as a result of contribution and benefit payments.
Defined benefit costs which are recognised in profit and loss are categorised as follows
- service cost (including current service cost, past service cost, as well as gains and losses on curtailments and settlements); and
- net interest expense or income.
The retirement benefit obligation recognised in the consolidated balance sheet represents the actual deficit or surplus in the Group’s defined benefit plans. Any surplus resulting from this calculation is limited to the present value of any economic benefits available in the form of refunds from the plans or reduction in future contributions to the plans.
The liability for termination benefit is recognised at the earlier of when the entity can no longer withdraw the offer of the termination benefit and when the entity recognises any related restructuring costs.
iv) Other Long-term benefits
The Group provides annual leave which are accumulating and vesting to its employees. The annual leave benefit is not funded. The cost of providing annual leave benefits are determined using the projected unit credit method, with independent actuarial valuations being carried out at the end of each reporting period. All actuarial gains or losses are recognised in profit and loss in the period in which they occur.
2.12 Taxation
i) Current tax
Current tax is payable based on taxable profit for the year. Taxable profit differs from ‘profit before tax’ as reported in the statement of profit and loss because of items of income or expense that are taxable or deductible in other years and items that are never taxable or deductible. The current tax is calculated using tax rates that have been enacted or
substantively enacted by the end of the reporting period.

Fifty Fifth Annual Report 2017-18
150
Notes forming part of the financial statements
for the year ended March 31, 2018
ii) Deferred tax
Deferred tax is recognised on temporary differences between the carrying amounts of assets and liabilities in the
consolidated financial statements and the corresponding tax bases used in the computation of taxable profits. Deferred
tax liabilities are generally recognised for all taxable temporary differences. Deferred tax assets are generally recognised
for all deductible temporary differences to the extent that is probable that taxable profits will be available against which
those deductible temporary differences can be utilised. Such deferred tax assets and liabilities are not recognised if the
temporary difference arises from the initial recognition (other than in a business combination) of assets and liabilities in
a transaction that affects neither the taxable profit nor the accounting profit.
Deferred tax assets arising from the deductible temporary differences are only recognised to the extent it is probable
that there will be sufficient taxable profits against which the benefits of the temporary difference can be utilised and
they are expected to reverse in the foreseeable future.
The carrying amount of deferred tax assets is reviewed at the end of each reporting period and reduced to the extent
that it is no longer probable that sufficient taxable profits will be available to allow all or part of the asset to be
recovered.
Deferred tax liabilities and assets are measured at the tax rates that are expected to apply in the period in which the
liability is settled or the asset is realised, based on tax rates (and tax laws) that have been enacted or substantially
enacted by the end of the reporting period.
iii) Minimum alternate tax
Minimum Alternate Tax (MAT) paid in accordance with the tax laws, which gives future economic benefits in the form
of adjustment to future income tax liability, is recognised as an asset in the balance sheet when there is convincing
evidence that the Group will pay normal income tax during the specified period and it is probable that future economic
benefit associated with it will flow to the Group.
iv) Current and deferred tax are recognised in the statement of profit and loss, except when they relate to items that are
recognised in other comprehensive income or directly in equity, in which case, the current and deferred tax are also
recognised in other comprehensive income or directly in equity respectively.
2.13 Property, Plant and equipment (PPE)
Property, plant and equipments (PPE) held for use in the production or supply of goods or services, or for administrative
purposes are stated at cost less accumulated depreciation and accumulated impairment losses. Cost includes purchase cost of
PPE, including import duties and non-refundable taxes, any directly attributable costs of bringing an asset to the location and
condition of its intended use and borrowing costs capitalised in accordance with the Group’s accounting policy.
Properties in the course of construction for production or supply of goods or services or for administrative purposes are carried
at cost, less any recognised impairment losses.
Depreciation is recognised so as to write off the cost of assets (other than properties under construction) less their residual
values over the useful lives, using the straight-line method. Depreciation of assets commences when the assets are ready for
their intended use. The estimated useful lives and residual values are reviewed at the end of each reporting period, with the
effect of any changes is accounted as change in estimate on a prospective basis.
Assets acquired under finance leases are depreciated over their expected useful lives on the same basis as owned asset. When
there is no reasonable certainty that ownership will be obtained by the end of the lease term, assets are depreciated over the
shorter of the lease term and their useful lives.
Estimated useful lives of the assets are as follows: Years
Buildings : 05-60
Plant and equipment : 02-15
Furniture and Fixtures : 05-10
Office Equipments : 03-05
Computers : 03-05
Motor Vehicles : 05-08

151
Notes forming part of the financial statements
for the year ended March 31, 2018
An item of property, plant and equipment is derecognised upon disposal or when no future economic benefits are expected
to arise from the continued use of the asset. Any gain or loss arising on the disposal or retirement of an item of property, plant
and equipment is recognised in the statement of profit and loss.
2.14 Intangible assets
Intangible assets with finite useful lives that are acquired separately are carried at cost less accumulated amortisation and
accumulated impairment (if any) losses. Amortisation is recognised at straight-line basis over their estimated useful lives.
The estimated useful life and amortisation method are reviewed at the end of each reporting period, with the effect of any
changes in estimate being accounted for on a prospective basis. Intangible assets with indefinite useful lives that are acquired
separately are carried at cost less accumulated impairment losses.
Estimated useful lives of the intangible assets are as follows: Years
Technical know how 10
Trademark 6
Software 5-10
An intangible asset is derecognised upon disposal or when no future economic benefits are expected to arise from the
continued use of the asset. Any gain or loss arising on the disposal or retirement of intangible assets is recognised in the
statement of profit and loss.
2.15 Impairment of tangible and intangible assets other than goodwill
At the end of each reporting period, the Group reviews the carrying amounts of its tangible and intangible assets to determine
whether there is any indication that those assets have suffered any impairment loss. If any such indication exists, the recoverable
amount of the asset is estimated in order to determine the extent of the impairment loss (if any). When it is not possible to
estimate the recoverable amount of an individual asset, the Group estimates the recoverable amount of the cash generating
unit to which the asset belongs.
Intangible assets with indefinite useful lives and intangible assets not yet available for use are tested for impairment at least
annually, and whenever there is an indication that the asset may be impaired.
Recoverable amount is the higher of fair value less costs of disposal and value in use. In assessing value in use, the estimated
future cash flows are discounted to their present value using a pre-tax discount rate that reflects current market assessments
of the time value of money and risks specific to the asset for which the estimates of future cash flows have not been
adjusted.
If the recoverable amount of an asset or cash generating unit is estimated to be less than the carrying amount, the carrying
amount of the asset or cash generating unit is reduced to its recoverable amount. An impairment loss is recognised immediately
in the statement of profit and loss.
When an impairment loss subsequently reverses, the carrying value of the asset or cash generating unit is increased to the
revised estimate of its recoverable amount, but so that the increased carrying amount does not exceed the carrying amount
that would have been determined had no impairment loss been recognised for the asset or cash generating unit in prior years.
Any reversal of an impairment loss is recognised immediately in the statement of profit and loss.
2.16 Inventories
Raw materials, work-in-progress and finished products are valued at lower of cost and net realisable value after providing for
obsolescence and other losses, where considered necessary. Cost includes purchase price, non refundable taxes and duties
and other directly attributable costs incurred in bringing the goods to the point of sale. Work-in-progress and finished goods
include appropriate proportion of overheads and, where applicable, excise duty.
Stores and spares are valued at cost comprising of purchase price, non refundable taxes and duties and other directly
attributable costs after providing for obsolescence and other losses, where considered necessary.
Value of inventories are generally ascertained on the “weighted average” basis.
2.17 Provisions, Contingent liabilities and Contingent assets
2.17.01 Provisions
Provisions are recognised when the Group has a present obligation (legal or constructive) as a result of past event, it is
probable that the Group will be required to settle the obligation, and a reliable estimate can be made of the amount of
the obligation.

Fifty Fifth Annual Report 2017-18
152
Notes forming part of the financial statements
for the year ended March 31, 2018
The amount recognised as a provision is the best estimate of the consideration required to settle the present obligation
at the end of the reporting period, taking into account the risks and uncertainties surrounding the obligation. When a
provision is measured using the cash flows estimated to settle the present obligation, its carrying amount is the present
value of those cash flows (when the effect of the time value of money is material).
When some or all of the economic benefits required to settle a provision are expected to be recovered from a third party,
a receivable is recognised as an asset if it is virtually certain that reimbursement will be received and the amount of the
receivable can be measured reliably.
2.17.02 Warranties
Provisions for the expected cost of warranty obligations under local sale of goods legislation are recognised at the date
of sale of the relevant products, at the management’s best estimate of the expenditure required to settle the Group’s
warranty obligation.
2.17.03 Onerous contracts
An onerous contract is considered to exist where the Group has a contract under which the unavoidable costs of meeting
the obligations under the contract exceed the economic benefits expected to be received from the contract. Present
obligation arising under onerous contracts are recognised and measured as provisions.
2.17.04 Contingent liabilities and assets
Contingent liability is a possible obligation that arises from past events and the existence of which will be confirmed
only by the occurrence or non-occurrence of one or more uncertain future events not wholly within the control of the
Group, or is a present obligation that arises from past events but is not recognised because either it is not probable that
an outflow of resources embodying economic benefits will be required to settle the obligation, or a reliable estimate
of the amount of the obligation cannot be made. Contingent liabilities are disclosed and not recognised. In the normal
course of business, contingent liabilities may arise from litigation and other claims against the Group. Guarantees
are also provided in the normal course of business. There are certain obligations which management has concluded,
based on all available facts and circumstances, are not probable of payment or are very difficult to quantify reliably,
and such obligations are treated as contingent liabilities and disclosed in the notes but are not reflected as liabilities
in the consolidated financial statements. Although there can be no assurance regarding the final outcome of the legal
proceedings in which the Group is involved, it is not expected that such contingencies will have a material effect on its
financial position or profitability.
2.18 Financial instruments
Financial assets and financial liabilities are recognised when a group entity becomes a party to the contractual provisions of
the instruments.
Financial assets and financial liabilities are initially measured at fair value. Transaction costs that are directly attributable to
the acquisition or issue of financial assets and financial liabilities (other than financial assets and financial liabilities at fair
value through profit and loss) are added to or deducted from the fair value of the financial assets or financial liabilities, as
appropriate, on initial recognition. Transaction costs directly attributable to the acquisition of financial assets or financial
liabilities at fair value through profit and loss are recognised immediately in profit and loss.
2.19 Financial assets
All regular purchases or sales of financial assets are recognised and derecognised on a transaction date basis. Regular purchases
or sales are purchases or sales of financial assets that require delivery of assets within the time frame established by regulation
or convention in the marketplace.
All recognised financial assets are subsequently measured in their entirety at either amortised cost or fair value, depending on
the classification of the financial assets.
2.19.01 Effective interest method
The effective interest method is a method of calculating the amortised cost of a debt instrument and of allocating
interest income over the relevant period. The effective interest rate is the rate that exactly discounts estimated future cash
receipts (including all fees and points paid or received that form an integral part of the effective interest rate, transaction
costs and other premium or discounts) through the expected life of the debt instrument, or, where appropriate, a shorter
period to the net carrying amount on initial recognition.

153
Notes forming part of the financial statements
for the year ended March 31, 2018
Income is recognised on an effective interest basis for debt instruments other than those financial assets classified as at
Fair Value Through Profit & Loss. Interest income is recognised in the statement of profit and loss and is included in the
“Other income” line item.
2.19.02 Investments in equity instruments at Fair value through other Comprehensive Income ( FVTOCI)
On initial recognition, the Group can make an irrevocable election (on an instrument-by-instrument basis) to present the
subsequent changes in fair value in other comprehensive income pertaining to investments in equity instruments. This
election is not permitted if the equity investment is held for trading. These elected investments are initially measured
at fair value plus transaction costs. Subsequently, they are measured at fair value with gains and losses arising from
changes in fair value recognised in other comprehensive income and accumulated in the ‘Reserve for equity instruments
through other comprehensive income’. The cumulative gain or loss is not reclassified to profit or loss on disposal of the
investments.
A financial asset is held for trading if:
and has a recent actual pattern of short-term profit-taking; or
The Group has equity investments in two entities, and elected to FVTOCI irrevocable option for both of these investments.
Dividends on these investments in equity instruments are recognised in the statement of profit and loss when the
Group’s right to receive dividends is established, it is probable that the economic benefits associated with the dividend
will flow to the entity, the dividend does not represent a recovery of part of cost of the investment and the amount of
dividend can be measured reliably. Dividends are included as part of ‘Other income’ in the profit and loss.
2.19.03 Financial assets at Fair value through profit and loss (FVTPL)
Investments in equity instruments are classified as at FVTPL, unless the Group irrevocably elects on initial recognition to
present subsequent changes in fair value in other comprehensive income for investments in equity instruments which
are not held for trading (see note 3.20.02 above).
Financial assets at FVTPL are measured at fair value at the end of each reporting period, with any gains or losses arising
on re-measurement recognised in profit or loss. The net gain or loss recognised in profit or loss is included in the ‘Other
income’ line item.
2.19.04 Impairment of financial assets
The Group applies the expected credit loss model for recognising impairment loss on trade receivables, other contractual
rights to receive cash or other financial instruments. Expected credit losses are the weighted average of credit losses with
the respective risks of default occurring as the weights. Credit loss is the difference between all contractual cash flows
that are due to the Group in accordance with the contract and all the cash flows that the Group expects to receive,
discounted at the original effective interest rate. The Group estimates cash flows by considering all contractual terms of
the financial instrument.
The Group measures the loss allowance for a financial instrument at an amount equal to the lifetime expected credit
losses if the credit risk on that financial instrument has increased significantly since initial recognition. If the credit risk
on a financial instrument has not increased significantly since initial recognition, the Group measures the loss allowance
for that financial instrument at an amount equal to 12-month expected credit losses. 12-month expected credit losses are portion of the life-time expected credit losses and represent the lifetime cash shortfalls that will result if default occurs within the 12 months after the reporting date and thus, are not cash shortfalls that are predicted over the next 12 months.
If the Group measures loss allowance for a financial instrument at life time expected credit loss model in the previous period, but determines at the end of reporting period that the credit risk has not increased significantly since initial recognition due to improvement in credit quality as compared to the previous period, the Group again measures the loss allowances based on 12 months expected credit loss.
When making the assessment of whether there has been a significant increase in credit risk since initial recognition, the Group uses the change in the risk of a default occurring over the expected life of the financial instrument instead

Fifty Fifth Annual Report 2017-18
154
Notes forming part of the financial statements
for the year ended March 31, 2018
of the change in the amount of expected credit losses. To make that assessment, the Group compares the risk of a default occurring on the financial instrument as at the reporting date with the risk of a default occurring on the financial instrument as at the date of initial recognition and considers reasonable and supportable information, that is available without undue cost or effort, that is indicative of significant increases in credit risk since initial recognition.
For the trade receivables or any contractual right to receive cash or another financial asset that result from transactions that are within the scope of Ind AS 11 and Ind AS 18, the Group always measures the loss allowance at an amount equal to lifetime expected credit losses.
Further, for the purpose of measuring lifetime expected credit loss allowance for trade receivables, the Group has used a practical expedient as permitted under Ind AS 109. This expected credit loss allowance is computed based on a provision matrix which takes into account historical credit loss experience and adjusted for forward-looking information.
The impairment requirements for the recognition and measurement of a loss allowance are equally applied to debt instruments at FVTOCI except that the loss allowance is recognised in other comprehensive income and is not reduced from the carrying amount in the balance sheet.
2.19.05 Derecognition of financial assets
The Group derecognises a financial asset when the contractual rights to the cash flow from the asset expire, or when it transfers the financial asset and substantially all the risks and rewards of ownership of the asset to another party. If the Group neither transfers nor retains substantially all the risks and rewards of ownership and continues to control the transferred asset, the Group recognises its retained interest in the asset and an associated liability for amounts it may have to pay. If the Group retains substantially all the risks and rewards of ownership of a transferred financial asset, the Group continues to recognise the financial asset and also recognises a collateralised borrowing for the proceeds received.
On derecognition of financial asset in its entirety, the difference between the asset’s carrying amounts and the sum of the consideration received and receivable and the cumulative gain or loss that had been recognised in other comprehensive income and accumulated in equity is recognised in the statement of profit and loss if such gain or loss would have otherwise been recognised in the statement of profit and loss on disposal of that financial asset.
On derecognition of a financial asset other than in its entirety (e.g. when the Group retains an option to repurchase part of a transferred asset), the Group allocates the previous carrying amount of the financial asset between the part it continues to recognise under continuing involvement, and the part it no longer recognises on the basis of the relative fair values of those parts on the date of the transfer. The difference between the carrying amount allocated to the part that is no longer recognised and the sum of the consideration received for the part no longer recognised and any cumulative gain or loss allocated to it that had been recognised in other comprehensive income is recognised in profit or loss if such gain or loss would have otherwise been recognised in profit or loss on disposal of that financial asset. A cumulative gain or loss that had been recognised in other comprehensive income is allocated between the part that continues to be recognised and the part that is no longer recognised on the basis of the relative fair values of those parts.
2.19.06 Foreign exchange gain and losses
The fair value of financial assets denominated in a foreign currency is determined in that foreign currency and translated at the spot rate at the end of each reporting period.
differences are recognised in the statement of profit and loss.
currency rates are recognised in other comprehensive income.
assets measured at amortised costs. Thus, the exchange differences on the amortised cost are recognised in profit and loss and other changes in the fair value of FVTOCI financial assets are recogised in other comprehensive income.
2.20 Financial liabilities and equity instruments
2.20.01 Classification as debt or equity
Debt and equity instruments issued by a Group entity are classified as either financial liabilities or as equity in
accordance with the substance of the contractual arrangements and the definition of a financial liability and an equity
instrument.

155
Notes forming part of the financial statements
for the year ended March 31, 2018
2.2.02 Classification as debt or equity
An equity instrument is any contract that evidences a residual interest in the assets of an entity after deducting all of
its liabilities. Equity instruments issued by a Group entity are recognised at the proceeds received, net of direct issue
costs.
2.20.03 Financial liabilities
All financial liabilities are subsequently measured at amortised cost using the effective interest method or at FVTPL.
However, financial liabilities that arise when a transfer of a financial asset does not qualify for derecognition or when the
continuing involvement approach applies, financial guarantee contracts issued by the Group, and commitments issued
by the Group to provide a loan at below-market interest rate are measured in accordance with the specific accounting
policies set out below.
The Group’s financial liabilities include trade and other payables, loans and borrowings including bank overdrafts, and
derivative financial instruments.
2.20.03 (i) Financial liabilities at FVTPL
Financial liabilities are classified as at FVTPL when the financial liability is either contingent consideration recognised by
the Group as an acquirer in a business combination to which Ind AS 102 applies or is held for trading or it is designated
as at FVTPL.
Financial liabilities at FVTPL are stated at fair value, with any gains or losses arising on remeasurement recognised in
profit or loss. The net gain or loss recognised in profit or loss incorporates any interest paid on the financial liability and
is included in the ‘Other income’ line item.”
2.20.03 (ii) Financial liabilities subsequently measured at amortised cost
Financial liabilities that are not held-for-trading and are not designated as at FVTPL are measured at amortised cost at
the end of subsequent accounting periods. The carrying amounts of financial liabilities that are subsequently measured
at amortised cost are determined based on the effective interest method. Interest expense that is not capitalised as part
of costs of an asset is included in the ‘Finance costs’ line item.
2.20.04 Financial guarantee contracts
A financial guarantee contract is a contract that requires the issuer to make specified payments to reimburse the holder
for a loss it incurs because a specified debtor fails to make payments when due in accordance with the terms of a debt
instrument.
Financial guarantee contracts issued by a Group entity are initially measured at their fair values and, if not designated as
at FVTPL, are subsequently measured at the higher of:
with the principles of Ind AS 18
2.20.05 Foreign exchange gains and losses
For financial liabilities that are denominated in a foreign currency and are measured at amortised cost at the end of each
reporting period, the foreign exchange gains and losses are determined based on the amortised cost of the instruments
and are recognised in ‘Other income’.
The fair value of financial liabilities denominated in a foreign currency is determined in that foreign currency and
translated at the spot rate at the end of the reporting period. For financial liabilities that are measured as at FVTPL, the
foreign exchange component forms part of the fair value gains or losses and is recognised in profit or loss.
2.20.06 Derecognition of financial liabilities
The Group derecognises financial liabilities when, and only when, the Group’s obligations are discharged, cancelled or
have expired. An exchange between a lender of debt instruments with substantially different terms is accounted for as
an extinguishment of the original financial liability and the recognition of a new financial liability. Similarly, a substantial
modification of the terms of an existing financial liability (whether or not attributable to the financial difficulty of the
debtor) is accounted for as an extinguishment of the original financial liability and the recognition of a new financial

Fifty Fifth Annual Report 2017-18
156
Notes forming part of the financial statements
for the year ended March 31, 2018
liability. The difference between the carrying amount of the financial liability derecognised and the consideration paid
and payable is recognised in profit or loss.
2.20.07 Derivative financial instruments
The Group enters into a variety of derivative financial instruments to manage its exposure to interest rate and foreign
exchange rate risks, including foreign exchange forward contracts, interest rate swaps and cross currency swaps.
Derivatives are initially recognised at fair value at the date the derivative contracts are entered into and are subsequently
remeasured to their fair value at the end of each reporting period. The resulting gain or loss is recognised in profit or
loss immediately unless the derivative is designated and effective as a hedging instrument, in which event the timing
of the recognition in profit or loss depends on the nature of the hedging relationship and the nature of the hedged
item.
2.21 Segment
Information reported to the Chief operating decision maker (CODM) for the purpose of resource allocation and assessment of
segment performance focuses based on products and services. Accordingly, directors of the Group have chosen to organise
the segment based on its product and services as follows:
The Group’s chief operating decision maker is the Managing Director.
Revenue and expenses directly attributable to segment are reported under each reportable segment. Expenses which are not
directly identifiable to each reporting segment have been allocated on the basis of associated revenue of the segment and
manpower efforts. All other expenses which are not attributable or allocable to segments have been disclosed as Unallocable
expenses.
Assets and liabilities that are directly attributable or allocable to segments are disclosed under each reportable segment. All
other assets and liabilities are disclosed as Unallocable.
The Group’s financing and income taxes are managed on a Group level and are not allocated to operating segment.
2.22 Earnings per share
Basic earnings per share is computed by dividing the profit after tax before other comprehensive income by the weighted
average number of equity shares outstanding during the financial year.
Diluted earning per share is computed by dividing the profit after tax by the weighted average number of equity and dilutive
equity equivalent shares outstanding during the year, except where the results would be anti-dilutive.
2.23 Standards issued but not yet effective
The standards issued but not yet effective up to the date of the issuance of the Company’s financial statements is disclosed
below. The company intends to adopt this standard when it becomes effective:
The MCA has notified companies under Indian Accounting Standards (Amendment) Rules, 2017 to amend the above Ind ASs.
The amendment will come into force from accounting periods commencing on or after April 1, 2018. The company is in the
process of assessing the possible impact of Ind AS 115, Ind AS 12, Ind AS 21 and will adopt the amendments on the required
effective date where as Ind AS 40 is not applicable to the Company.

157
No
tes
form
ing
pa
rt o
f th
e fi
na
nci
al
sta
tem
en
ts
for
the
ye
ar
en
de
d M
arc
h 3
1, 2
01
8
03
. P
rop
ert
y, p
lan
t a
nd
eq
uip
me
nt
Rs.
lakh
s
Free
hold
Land
Free
hold
build
ings
Leas
ehol
d
build
ings
Ow
ned
Plan
t and
Mac
hine
ry
Elec
tric
al
Inst
alla
tion
Fina
nce
Leas
ed
Plan
t and
Mac
hine
ry
Labo
rato
ry
Equi
pmen
t
Furn
itur
e
and
fixtu
res
Offi
ce
Equi
pmen
ts
Mot
or
Vehi
cles
Leas
ed
Vehi
cles
Tota
l
Cost
or d
eem
ed c
ost
Bala
nce
at M
arch
31,
201
645
2.58
3,76
0.81
118.
922,
509.
7714
8.18
44.0
212
.92
153.
4730
0.01
226.
229.
997,
736.
89Ad
ditio
ns-
20.7
214
.23
284.
595.
413.
740.
4510
.52
51.7
961
.98
-45
3.43
Disp
osal
s(2
18.3
8)(8
3.75
)-
-(6
.21)
--
(13.
48)
(1.0
1)(7
.01)
-(3
29.8
4)Cl
assifi
ed a
s hel
d fo
r sal
e-
--
--
--
--
--
-Ex
chan
ge d
iffer
ence
on
cons
olid
atio
n(4
.39)
(36.
65)
(18.
90)
(79.
87)
(0.0
3)(1
.22)
-0.
13(1
0.36
)(1
0.16
)(0
.22)
(161
.67)
Bal
ance
at M
arch
31,
201
722
9.81
3,66
1.13
114.
252,
714.
4914
7.35
46.5
413
.37
150.
6434
0.43
271.
039.
777,
698.
81
Addi
tions
--
78.2
822
4.58
2.22
-16
.18
9.66
33.5
247
.56
-41
2.00
D
ispos
als
--
-(1
02.5
4)(0
.13)
--
-(1
.04)
(34.
63)
-(1
38.3
4)Cl
assifi
ed a
s hel
d fo
r sal
e-
(937
.77)
-(1
,391
.56)
--
-(8
3.97
)(3
16.1
8)(1
52.5
1)-
(2,8
81.9
9)Ex
chan
ge d
iffer
ence
on
cons
olid
atio
n0.
3736
.48
21.8
711
2.60
-(0
.02)
-3.
5724
.93
16.2
40.
0221
6.06
B
alan
ce a
t Mar
ch 3
1, 2
018
230.
182,
759.
8421
4.40
1,55
7.57
149.
4446
.52
29.5
579
.90
81.6
614
7.69
9.79
5,30
6.54
Acc
umul
ated
dep
reci
atio
nBa
lanc
e at
Mar
ch 3
1, 2
016
-18
6.70
1.95
360.
4826
.41
4.95
0.93
38.1
087
.17
51.9
32.
6276
1.24
D
epre
ciat
ion
expe
nse
-19
1.10
11.3
044
1.56
32.5
37.
151.
4729
.43
97.8
247
.08
3.38
862.
82
Disp
osal
s-
(14.
56)
--
(1.2
3)-
-(2
.78)
(0.2
3)(2
.95)
-(2
1.75
)Cl
assifi
ed a
s hel
d fo
r sal
e-
--
--
--
--
--
- Ex
chan
ge d
iffer
ence
on
cons
olid
atio
n-
(5.8
2)(1
.21)
(21.
15)
(0.0
4)(0
.36)
(0.0
1)0.
54(5
.25)
(3.4
5)(0
.17)
(36.
92)
Bal
ance
at M
arch
31,
201
7-
357.
4212
.04
780.
8957
.67
11.7
42.
3965
.29
179.
5192
.61
5.83
1,56
5.39
D
epre
ciat
ion
expe
nse
-17
4.30
15.0
347
1.26
27.4
86.
822.
0826
.56
61.3
350
.95
3.92
839.
73
Disp
osal
s-
--
(3.6
5)(0
.12)
--
-(0
.01)
(19.
18)
-(2
2.96
)Cl
assifi
ed a
s hel
d fo
r sal
e-
(168
.74)
-(5
57.6
0)-
--
(45.
02)
(212
.81)
(78.
05)
-(1
,062
.22)
Exch
ange
diff
eren
ce o
n co
nsol
idat
ion
-21
.02
2.82
66.7
90.
010.
04-
3.15
19.5
68.
860.
0412
2.29
B
alan
ce a
t Mar
ch 3
1, 2
018
-38
4.00
29.8
975
7.69
85.0
418
.60
4.47
49.9
847
.58
55.1
99.
791,
442.
23
Carr
ying
am
ount
Bala
nce
at M
arch
31,
201
645
2.58
3,57
4.11
116.
972,
149.
2912
1.77
39.0
711
.99
115.
3721
2.84
174.
297.
376,
975.
65
Addi
tions
-20
.72
14.2
328
4.59
5.41
3.74
0.45
10.5
251
.79
61.9
8-
453.
43
Disp
osal
s(2
18.3
8)(6
9.19
)-
-(4
.98)
--
(10.
70)
(0.7
8)(4
.06)
-(3
08.0
9)D
epre
ciat
ion
-(1
91.1
0)(1
1.30
)(4
41.5
6)(3
2.53
)(7
.15)
(1.4
7)(2
9.43
)(9
7.82
)(4
7.08
)(3
.38)
(862
.82)
Clas
sified
as h
eld
for s
ale
--
--
--
--
--
--
Exch
ange
diff
eren
ce o
n co
nsol
idat
ion
(4.3
9)(3
0.83
)(1
7.69
)(5
8.72
)0.
01(0
.86)
0.01
(0.4
1)(5
.11)
(6.7
1)(0
.05)
(124
.75)
Bal
ance
at M
arch
31,
201
722
9.81
3,30
3.71
102.
211,
933.
6089
.68
34.8
010
.98
85.3
516
0.92
178.
423.
946,
133.
42
Addi
tions
--
78.2
822
4.58
2.22
-16
.18
9.66
33.5
247
.56
-41
2.00
D
ispos
als
--
-(9
8.89
)(0
.01)
--
-(1
.03)
(15.
45)
-(1
15.3
8)D
epre
ciat
ion
-(1
74.3
0)(1
5.03
)(4
71.2
6)(2
7.48
)(6
.82)
(2.0
8)(2
6.56
)(6
1.33
)(5
0.95
)(3
.92)
(839
.73)
Clas
sified
as h
eld
for s
ale
-(7
69.0
3)-
(833
.96)
--
-(3
8.95
)(1
03.3
7)(7
4.46
)-
(1,8
19.7
7)Ex
chan
ge d
iffer
ence
on
cons
olid
atio
n0.
3715
.46
19.0
545
.81
(0.0
1)(0
.06)
-0.
435.
377.
38(0
.02)
93.7
8B
alan
ce a
t Mar
ch 3
1, 2
018
230.
182,
375.
8418
4.51
799.
8864
.40
27.9
225
.08
29.9
334
.08
92.5
0-
3,86
4.32
No
te: F
or d
etai
ls o
f car
ryin
g am
ount
of a
sset
s p
led
ged
as
secu
rity
for s
ecur
ed b
orro
win
gs re
fer N
ote
21.

Fifty Fifth Annual Report 2017-18
158
Notes forming part of the financial statements
for the year ended March 31, 2018
As at As at
31.03.2018 31.03.2017
Rs. lakhs Rs. lakhs
04. Goodwill
Cost or deemed cost 17,894.75 16,920.96
Accumulated impairment losses (2,427.65) (2,270.40)
15,467.10 14,650.56
Cost or deemed cost
Balance at beginning of the year 16,920.96 17,884.10
Effect of foreign exchange differences 973.79 (963.14
17,894.75 16,920.96
Accumulated impairment losses
Balance at beginning of the year (2,270.40) (2,403.57)
Charge for the period - -
Effect of foreign exchange differences (157.25) 133.17
(2,427.65) (2,270.40)
05. Intangible assets
Carrying amount of:
(a) Technical Know-how 13.60 22.34
(b) Computer Software 22.31 97.03
(c) Trade marks - 2.52
35.91 121.89
Technical Computer Trade Total
know-how Software marks
Rs. lakhs Rs. lakhs Rs. lakhs Rs. lakhs
Cost or deemed cost
Balance at March 31, 2016 46.44 186.97 50.18 283.59
Additions 2.91 32.15 - 35.06
Disposals - - - -
Classified as held for sale - - - -
Exchange difference on consolidation (7.17) (4.50) (1.13) (12.80)
Balance at March 31, 2017 42.18 214.62 49.05 305.85
Additions (0.01) 0.55 - 0.54
Disposals - - - -
Classified as held for sale - (64.65) (49.13) (113.78)
Exchange difference on consolidation 5.89 1.29 0.08 7.26
Balance at March 31, 2018 48.06 151.81 - 199.87
Accumulated amortisation
Balance at March 31, 2016 11.61 78.18 23.80 113.59
Amortisation expense 10.84 41.81 24.07 76.72
Classified as held for sale - - - -
Exchange difference on consolidation (2.61) (2.40) (1.34) (6.35)
Balance at March 31, 2017 19.84 117.59 46.53 183.96
Amortisation expense 11.03 37.24 2.50 50.77
Classified as held for sale - (25.63) (49.13) (74.76)
Exchange difference on consolidation 3.59 0.30 0.10 3.99
Balance at March 31, 2018 34.46 129.50 - 163.96

159
Notes forming part of the financial statements
for the year ended March 31, 2018
Technical Computer Trade Total
know-how Software marks
Rs. lakhs Rs. lakhs Rs. lakhs Rs. lakhs
Carrying amount
Balance at March 31, 2016 34.83 108.79 26.38 170.00
Additions 2.91 32.15 - 35.06
Amortisation expense (10.84) (41.81) (24.07) (76.72)
Classified as held for sale - - - -
Exchange difference on consolidation (4.56) (2.10) 0.21 (6.45)
Balance at March 31, 2017 22.34 97.03 2.52 121.89
Additions (0.01) 0.55 - 0.54
Amortisation expense (11.03) (37.24) (2.50) (50.77)
Classified as held for sale - (39.02) - (39.02)
Exchange difference on consolidation 2.30 0.99 (0.02) 3.27
Balance at March 31, 2018 13.60 22.31 0.00 35.91
As at 31.03.2018 As at 31.03.2017
Qty Amount Qty. Amount
Nos. Rs. lakhs Nos. Rs. lakha
06. Investments in jointly controlled entity
06.01 Break-up of Investment in jointly controlled entity
Unquoted Investments (all fully paid)
Investments in Equity Instruments of
Adithya Automotive Applications Private Limited - - 3,570,000 638.02
Tata International DLT Private Limited 8,540,000 1,842.86 8,540,000 1,097.74
Total aggregate Unquoted investments 1,842.86 1,735.76
06.02 Details and financial information of material jointly controlled entity
Details of the Group’s material joint ventures at the end of the reporting period is as follows:
Name of jointly controlled entity Principal activity Place of incorporation Proportion of
and principal place ownership interest
of business
As at As at
31.03.2018 31.03.2017
Adithya Automotive Applications Manufacture of India - 51%
Private Limited auto ancillaries
(Ceased to be a jointly controlled
entity w.e.f 4th Feb, 2018)
Tata International DLT Private Limited Manufacture of India 50% 50%
heavy duty trailers
The above joint ventures are accounted for using equity method in these consolidated financial statements.
Summarised financial information in respect of the Group’s material jointly controlled entities is set out below:
These summarised financial information given below represents amounts shown in the joint venture’s financial
statements prepared in accordance with Ind AS adjusted by the Group for equity accounting purpose.

Fifty Fifth Annual Report 2017-18
160
Notes forming part of the financial statements
for the year ended March 31, 2018
As at As at 31.03.2018 31.03.2017
Rs. lakhs Rs. lakhs
Adithya Automotive Applications Private Limited Non-current assets 1,122.04 1,227.20 Current assets 1,489.23 2,048.87 Non-current liabilities 109.29 159.18 Current liabilities 1,073.58 1,878.59
Tata International DLT Private Limited Non-current assets 3,097.18 3198.02 Current assets 8,491.86 4,246.58 Non-current liabilities 840.63 564.32 Current liabilities 7,014.36 4,645.75
Year ended Year ended 31.03.2018 31.03.2017
Rs. lakhs Rs. lakhs
Adithya Automotive Applications Private Limited Revenue 8,630.46 16,210.83 Profit or loss from continuing operations 190.99 648.09 Profit /(loss) for the year 190.99 648.09 Other comprehensive income for the year (0.89) (3.84) Total comprehensive income for the year 190.10 644.25
The above profit/(loss) for the year includes the following: Depreciation 153.51 179.44 Interest expense 21.40 36.97 Income tax expense 96.67 356.00
Tata International DLT Private Limited Revenue 34,781.01 19,369.82 Profit or loss from continuing operations 1,495.62 218.60 Profit /(loss) for the year 1,495.62 218.60 Other comprehensive income for the year 3.89 (9.31) Total comprehensive income for the year 1,499.51 209.29
The above profit/(loss) for the year includes the following: Depreciation 153.57 130.21 Interest income 0.76 0.37 Interest expense 183.49 234.40 Income tax expense 711.20 107.76
As at As at 31.03.2018 31.03.2017
Rs. lakhs Rs. lakhs Reconciliation of above summarised financial information to the carrying amount of the interest in the jointly controlled entity recognised in the consolidated financial statements Adithya Automotive Applications Private Limited Net Assets of the joint venture - 1,238.30 Proportion of the Group’s ownership in the joint venture - 631.54 Goodwill - 6.48
Carrying amount of the Group’s interest in the jointly controlled entity - 638.02
Tata International DLT Private Limited Net Assets of the joint venture 3,734.05 2,234.53 Proportion of the Group’s ownership in the joint venture 1,867.03 1,117.26 Unrealised profits on closing stock (24.17) (19.52)
Carrying amount of the Group’s interest in the jointly controlled entity 1,842.86 1,097.74

161
Notes forming part of the financial statements
for the year ended March 31, 2018
07. Other non-current investments
(Carried at fair value through other comprehensive income) As at 31.03.2018 As at 31.03.2017
Qty Amount Qty Amount
Nos. Rs. lakhs Nos. Rs. lakhs
a) Quoted Investments (all fully paid)
Investments in Equity Instruments of
HDFC Bank Limited 2,500 47.28 2,500 36.06
Total aggregate Quoted investments 47.28 36.06
b) Unquoted Investments (all fully paid)
Investments in Equity Instruments of
Lanka IOC Limited 2,800 0.28 2,800 0.28
Nicco Jubilee Park Limited 30,000 - 30,000 -
Total aggregate of Unquoted investments 0.28 0.28
Total Investments carrying value 47.56 36.34
Aggregate book value of quoted investments 47.28 36.06
Aggregate market value of quoted investments 47.28 36.06
Aggregate carrying value of unquoted investments 0.28 0.28
Aggregate amount of impairment in value of unquoted investments 3.00 3.00
As at As at
31.03.2018 31.03.2017
Rs. lakhs Rs. lakhs
8. Other non-current financial assets
(Unsecured considered good)
(a) Security deposits 58.80 339.51
(b) Earmarked non-current cash and bank balances 417.02 427.97
(c) Others 1.50 2,516.01
477.32 3,283.49
9. Other non-current assets
(a) Capital advances
Considered good 7.28 3.81
Considered doubtful 90.58 90.58
97.86 94.39
Less: Provision for doubtful advances 90.58 90.58
7.28 3.81
(b) Advance with public bodies
i) Excise 172.58 154.71
ii) Sales tax/Value added tax 132.48 118.10
305.06 272.81
(c) Post retirement benefit assets - -
(d) Other loans and advances
Prepayments 2.36 18.99
Others 2.36 18.99
314.70 295.61

Fifty Fifth Annual Report 2017-18
162
Notes forming part of the financial statements
for the year ended March 31, 2018
10. Deferred tax balances
The following is the analysis of deferred tax assets/(liabilities) presented in the consolidated balance sheet:
As at As at
31.03.2018 31.03.2017
Rs. lakhs Rs. lakhs
Deferred tax assets 17.46 231.98
Deferred tax liabilities (20.30) (1,977.36)
(2.84) (1,745.38)
For the Year ended 31.03.2018
Deferred tax (liabilities)/assets in relation to:
Opening
balance
Recognised
in profit
and loss
Recognised in
Profit and loss
of discontinued
operation
Recognised
in other
comprehensive
income
Exchange
difference on
consolidation
Other
adjustments
Classified
as held
for sale
Closing
Balance
Property, plant and equipment (303.37) 5.14 - - (2.65) - 27.67 (328.55)
Exchange difference on long term
loans
(129.56) - - - - - - (129.56)
Deferment revenue on account of
retention
(6,809.51) 77.02 - - - - - (6,732.49)
Provision for doubtful debts 557.47 5.41 - - - - - 562.88
Provision for onerous contracts 886.84 235.69 - - - - - 1,122.53
Provision for warranty 46.41 1.76 - - 0.01 - - 48.18
Provision for employee benefits 259.00 1.42 - (1.50) 0.06 - - 258.98
MAT credit recognised 106.58 - - - 0.17 - (106.75) -
Tax losses 3,515.71 1,708.91 129.23 - 2.89 - (222.71) 5,134.04
Others 125.05 (63.90) - - - - 61.15
(1,745.38) 1,971.45 129.23 (1.50) 0.48 - 357.13 (2.84)
For the Year ended 31.03.2017
Opening
balance
Recognised
in profit and
loss
Recognised in
Profit and loss
of discontinued
operation
Recognised
in other
comprehensive
income
Exchange
difference on
consolidation
Other
adjustments
Classified
as held for
sale
Closing
Balance
Property, plant and equipment (400.26) 94.20 - - 2.69 - - (303.37)
Exchange difference on long term
loans
(200.38) 70.82 - - - - - (129.56)
Deferment revenue on account of
retention
(7,470.40) 660.89 - - - - - (6,809.51)
Provision for doubtful debts 557.47 - - - - - - 557.47
Provision for onerous contracts 616.60 270.24 - - - - - 886.84
Provision for warranty 44.08 2.45 - - (0.12) - - 46.41
Provision for employee benefits 254.02 6.37 - (0.56) (0.83) - - 259.00
MAT credit recognised - 86.61 - - (2.89) 22.86 - 106.58
Tax losses 2,216.57 1,300.93 - - (1.79) - - 3,515.71
Others 179.91 (54.86) - - - - - 125.05
(4,202.39) 2,437.65 - (0.56) (2.94) 22.86 - (1,745.38)

163
Notes forming part of the financial statements
for the year ended March 31, 2018
Deferred tax (liabilities)/assets not created in relation to: As at As at
31.03.2018 31.03.2017
Rs. lakhs Rs. lakhs
Tax losses 3,707.84 2,517.13
Unabsorbed Tax depreciation 164.34 40.48
Other Temporary differences 5,018.81 2,423.99
8,890.99 4,981.60
11. Inventories and contracts in progress
(At lower of cost and net realisable value)
a) Inventories
i) Raw materials (At lower of cost and net realisable value) 3,558.46 10,079.00
ii) Work-in-progress (At lower of cost and net realisable value) 2,317.77 2,592.47
iii) Finished products (At lower of cost and net realisable value) 1,353.70 3,982.74
iv) Stock in trade ((At lower of cost and net realisable value) - 819.96
v) Spare parts and loose tools (At or lower than cost) 152.26 167.79
7,382.19 17,641.96
b) Contracts in Progress 2,647.23 4,683.33
Total inventories 10,029.42 22,325.29
Cost of inventories includes the following which are in transit
Raw materials 109.25 137.85
Stock in trade - 389.73
12. Trade receivables
Secured, considered good
(a) Unsecured, considered good 38,021.34 55,156.82
(b) Unsecured considered doubtful 12,751.87 8,273.17
Less: Allowances for doubtful debts (12,751.87) (8,273.17)
38,021.34 55,156.82
Notes:
i) Above includes Rs. 24,058.87 lakhs (31.03.2017 Rs 24,903.02 lakhs) retention money which are recoverable on
completion of the project as per the terms of the relevant contract.
ii) Above is net of retention money recoverable amounting to Rs 1,000.00 lakhs (31.03.2017 Rs 1,928.53 lakhs) which has
been collected against submission of Bank guarantee. Corresponding liability is disclosed as ‘Advance received from
customers under note 28(a).
iii) For details of carrying amount of trade receivables pledged as security for secured borrowings refer note 21.
iv) The credit period given to customers range from 0 to 30 days. No interest is charged on the overdue amounts.
The Group has used a practical expedient by computing the expected credit loss allowance for trade receivables based
on a provision matrix. The provision matrix takes into account historical credit loss experience and adjusted for forward-
looking information. The expected credit loss allowance for trade receivable due for more than 12 months, 24 months
and 36 months provision is recorded at 25%, 50% and 100% respectively. For Retention receivable due for more than
12 months and 24 months provision is recorded at 50% and 100% respectively.

Fifty Fifth Annual Report 2017-18
164
Notes forming part of the financial statements
for the year ended March 31, 2018
Year ended Year ended
31.03.2018 31.03.2017
Rs. lakhs Rs. lakhs
Movement in provision for doubtful debts
Balance at beginning of the year 8,273.17 6,824.17
Credit allowances created during the year 4,555.04 1,766.57
Reversal of Credit allowances - (30.02)
Credit allowances adjusted with bad debts - (277.00)
Reclassified to Assts held for sale (84.92) -
Exchange difference on consolidation 8.58 (10.55)
Balance at end of the year 12,751.87 8,273.17
As at As at
31.03.2018 31.03.2017
Rs. lakhs Rs. lakhs
13. Cash and bank balances
Cash and cash equivalents
(a) Cash on hand 9.52 12.45
(b) Cheques on hand - 3.90
(c) Remittance in transit - 133.35
(d) Balances with banks
In current accounts 1,411.69 4,423.82
In deposit accounts 0.10 0.09
Total cash and cash equivalents 1,421.31 4,573.61
Other bank balances
In current accounts 533.68 18.19
In deposit accounts 234.42 240.73
Total other bank balances 768.10 258.92
Total cash and bank balances 2,189.41 4,832.53
Included above
(i) Earmarked balance for unpaid dividend 533.68 18.19
(ii) Earmarked balance for guarantee 234.42 240.73
14. Other current financial assets
(a) Security deposits
Considered good 37.92 44.80
Considered doubtful 115.19 107.06
153.11 151.86
Less: Provision for doubtful deposits 115.19 107.06
37.92 44.80
(b) Interest accrued on deposits, loans and advances 60.06 1.95
(c) Others 479.83 231.34
577.81 278.09

165
Notes forming part of the financial statements
for the year ended March 31, 2018
As at As at
31.03.2018 31.03.2017
Rs. lakhs Rs. lakhs
15. Derivative assets
(a) Interest rate swaps 6.87 14.43
(b) Foreign currency options 89.52 255.96
(c) Foreign currency forward contracts - -
96.39 270.39
16. Other current assets
(a) Advance with public bodies
i) Service tax - 801.60
ii) Excise 1.57 896.37
iii) Goods and Service tax 549.26 -
iv) Sales tax/Value added tax
Considered good 3,034.97 3,452.32
Considered doubtful 23.12 29.78
3,058.09 3,482.10
Less: Provision for doubtful advances 23.12 29.78
3,034.97 3,452.32
v) Others - 19.33
(b) Advances to related parties 2.46 5.54
(c) Unbilled revenue - 650.65
(d) Other loans and advances
i) Advance to suppliers 691.17 1,312.92
ii) Other advances and prepayments 1,083.77 809.64
5,363.20 7,948.37

Fifty Fifth Annual Report 2017-18
166
Notes forming part of the financial statements
for the year ended March 31, 2018
17. Assets and liabilites held for sale
a) On the basis of the Board approval dated March 21, 2018 the Group has decided to divest its entire stake in York Equipment Transport (Asia) Pte Ltd. (a step down subsidiary). Accordingly,a share purchase agreement has been signed on March 21, 2018 with SAF Holland GMBH and the transaction will be completed by April 30, 2018.
Consequently ,the assets and liabilties of the said step down subsidiary has been classified as held for sale on the reporting date.
The major classes of assets and liabilities held for sale as on the respective reporting dates is as below:
As at As at 31.03.2018 31.03.2017
Rs. lakhs Rs. lakhs
Assets Classified as held for sale:
Property, plant and equipment 1,819.77 - Other intangible assets 39.02 - Other non-current financial assets 416.90 Deferred tax assets 357.13 Inventories and contracts in progress 10,532.77 - Trade receivables 9,392.15 - Cash and Bank balances 4,192.18 - Other financial assets 222.97 Retirement benefit assets 0.57 Other non-financial assets 931.52 Current tax assets 8.84 -
27,913.82 - Less: Write down to fair value less costs to sell - -
27,913.82 -
Liabilities classified as held for sale: Non-current Financial Liability 7,752.36 Long term Provisions 111.26 - Current Borrowings 6,863.30 - Trade payables 14,062.98 - Other financial liabilities 135.69 - Short term Provisions 422.59 - Current tax liabilities 421.40 - Other Current non financial liabilties 39.12 -
29,808.70 -
b) Cash flow Information
The cash flow information presented is for the year ended March 31, 2018 Revenue 56,667.61 - Expenses 54,689.70 - Profit before income tax 1,977.91 -
Income Tax Expenses 1,115.98 - Profit after Tax from discontinued operation 861.93 - Net Cash inflow from Operating activaties 904.81 - Net Cash outflow from Investment activaties (257.15) -
Net Cash inflow from Financing activaties 59.87 -
Net increase in cash generated from discontinued operation 707.53 - Cash & Cash equivalents at the beginning of the period 3,362.02 -
Effect of exchange rates on translation of foreign currency cash and cash equivalents 122.63 - Cash & Cash equivalents at the end of the period -held for sale 4,192.18 -

167
Notes forming part of the financial statements
for the year ended March 31, 2018
18. Share capital As at As at
31.03.2018 31.03.2017
Rs. lakhs Rs. lakhs
Authorised:
30,000,000 Equity Shares of Rs. 10 each 3,000.00 3,000.00
(As at 31.03.2017: 30,000,000)
3,000.00 3,000.00
Issued, Subscribed and fully paid up:
11,004,412 Equity Shares of Rs. 10 each 1,100.44 1,100.44
(As at 31.03.2017: 11,004,412)
1,100.44 1,100.44
Issued and subscribed capital excludes 635 equity share of Rs.10 each reserved for allotment to shareholders who were not
able to subscribe to the rights issue during the earlier years for genuine reasons or where the title is temporarily in dispute.
Reconciliation of Number of shares and amount outstanding at the beginning and end of the reporting period
For the year ended For the year ended
31.03.2018 31.03.2017
No. of Shares Amount No. of Shares Amount
Rs. lakhs Rs. lakhs
Equity shares
Issued, subscribed and fully paid up:
At beginning and end of the year 11,004,412 1,100.44 11,004,412 1,100.44
Details of shares held by shareholders holding more than 5% of the aggregate shares in the Company
As at 31.03.2018 As at 31.03.2017
No. of Shares % No. of Shares %
Tata Steel Limited 3,753,275 34.11% 3,753,275 34.11%
Rights, preferences and restrictions attached to shares
Equity shares
The Company has one class of equity shares having a par value of Rs.10 per share. Each shareholder is entitled for one vote
per share held. The dividend proposed by the Board of Directors is subject to the approval of the shareholders in the ensuing
Annual General Meeting, except in case of interim dividend. In the event of liquidation, the equity shareholders are entitled
to receive the remaining assets of the Company after distribution of all preferential amounts, in proportion to the number of
equity shares held by the shareholders.
As at As at
31.03.2018 31.03.2017
Rs. lakhs Rs. lakhs
19. Other Equity
a) Amalgamation Reserve 61.81 61.81
b) Foreign currency translation reserve 830.43 (617.51)
c) Foreign exchange fluctuation reserve 448.20 448.20
d) General reserve 14,458.59 14,458.59
e) Foreign currency monetary item translation difference (11.08) (26.71)
f ) Reserve for equity instrument through other comprehensive income (OCI) 47.24 36.01
g) Retained Earnings (37,017.98) (23,597.93)
(21,182.79) (9,237.54)

Fifty Fifth Annual Report 2017-18
168
Notes forming part of the financial statements
for the year ended March 31, 2018
19. Other Equity (Contd.)
As at As at
31.03.2018 31.03.2017
Rs. lakhs Rs. lakhs
Amalgamation Reserve
Opening and closing balance 61.81 61.81
Foreign currency translation reserve
Opening balance (617.51) 257.33
Add: Effects of foreign exchange rate variation during the year 1,447.94 (874.84)
830.43 (617.51)
Foreign exchange fluctuation reserve
Opening and closing balance 448.20 448.20
General reserve
Opening balance 14,458.59 14,458.59
Add: Transfer from retained earnings - -
14,458.59 14,458.59
Foreign currency monetary item translation difference
Opening balance (26.71) (288.09)
Add: Additions during the year 2.68 40.10
Less: Recognised in the statement of profit and loss during the year 12.95 221.28
(11.08) (26.71)
Reserve for equity instrument through other comprehensive income (OCI)
Opening balance 36.01 26.73
Add: Other comprehensive income for the year 11.23 9.28
Less: Realised gain on equity shares carried at fair value through OCI - -
47.24 36.01
Retained Earnings
Opening balance (23,597.93) (20,937.19)
Add: Profit/(Loss) for the year (13,411.35) (2,409.85)
Other comprehensive income for the year (8.70) (250.89)
Realised gain on equity shares carried at fair value through OCI - -
Tax impact of the above - -
Less: Transfer to general reserve - -
(37,017.98) (23,597.93)
(21,182.79) (9,237.54)
Notes:
(a) General reserve:
The general reserve is used from time to time to transfer profits from retained earnings for appropriation purposes.
As the general reserve is created by a transfer from one component of equity to another and is not an item of other
comprehensive income, items included in the general reserve will not be reclassified subsequently to profit or loss.
(b) Reserve for equity instrument through other comprehensive income (OCI) :
This reserve represents the cumulative gains and losses arising on the revaluation of equity instruments measured at
fair value through OCI, net of amounts reclassified to the retained earnings when those assets have been disposed of.

169
Notes forming part of the financial statements
for the year ended March 31, 2018
(c) Foreign currency translation reserve:
Foreign operation for which settlement is neither planned nor likely to occur (therefore forming part of the net
investment in the foreign operation), which are recognised initially in other comprehensive income and reclassified
from equity to profit and loss on repayment of the monetary items or disposal of investment.
(d) Foreign currency monetary item translation difference reserve :
Exchange differences arising on settlement and remeasurement of long-term foreign currency monetary items are
accumulated in “Foreign Currency Monetary Item Translation Difference Account” and amortised over the maturity
period or upto the date of settlement of such monetary items, whichever is earlier, and charged to the Statement of
Profit and Loss.
20. Non-controlling interests Year ended Year ended
31.03.2018 31.03.2017
Rs. lakhs Rs. lakhs
Balance at beginning of the year 45.23 46.56
Share of profit for the year - (0.29)
Exchange difference on consolidation 0.05 (1.04)
Balance at end of the year 45.28 45.23
21. Non-Current borrowings As at As at
31.03.2018 31.03.2017
Rs. lakhs Rs. lakhs
A. Secured - at amortised cost
(a) Term loans
From banks 3,399.51 15,908.96
(b) Finance lease obligations 5.04 15.87
Total Non-Current borrowings 3,404.55 15,924.83

Fifty Fifth Annual Report 2017-18
170
No
tes
form
ing
pa
rt o
f th
e fi
na
nci
al
sta
tem
en
ts
for
the
ye
ar
en
de
d M
arc
h 3
1, 2
01
8
21
. N
on
-Cu
rre
nt
bo
rro
win
gs
(Co
ntd
…)
As
at 3
1.0
3.2
01
8A
s at
31.
03.2
017
Se
curi
ty
Nam
e of
the
ban
kN
on
-
Cu
rre
nt
Cu
rre
nt
Cu
rre
nt
Mat
uri
ty
(Re
fer
No
te 2
8)
Non
-
Cur
rent
Cur
rent
Cur
rent
Mat
urit
y (R
efer
Not
e 28
)
Rs.
lak
hs
Rs.
lak
hs
Rs.
lak
hs
Rs. l
akhs
Rs. l
akhs
Rs. l
akhs
Den
a Ba
nk0.
00-
250.
0025
0.00
-50
0.00
Secu
red
by
par
i pas
su fi
rst
char
ge o
n al
l the
fixe
d a
sset
s an
d s
econ
d
char
ge o
n al
l cur
rent
ass
ets
of th
e C
omp
any
Axi
s Ba
nk L
imite
d0.
00-
1,01
6.84
1,00
4.70
-1,
333.
13Se
cure
d b
y p
ari p
assu
firs
t cha
rge
on th
e fix
ed a
sset
s of
the
Com
pan
y,
pre
sent
an
d
futu
re
exce
pt
asse
ts
char
ged
ex
clus
ivel
y to
Sm
all
Ind
ustr
ies
Dev
elop
men
t Ba
nk o
f Ind
ia (S
IDBI
), an
d s
econ
d c
harg
e on
all c
urre
nt a
sset
s of
the
Com
pan
y.
Axi
s Ba
nk L
imite
d1,
572.
01-
1,86
3.68
3,44
5.15
-1,
557.
70Se
cure
d b
y p
ari
pas
su fi
rst
char
ge o
n al
l cu
rren
t as
sets
of
the
Com
pan
y, p
rese
nt a
nd f
utur
e ex
cep
t as
sets
cha
rged
exc
lusi
vely
to
Smal
l In
dus
trie
s D
evel
opm
ent
Bank
of
Ind
ia (
SID
BI),
and
sec
ond
char
ge o
n al
l fixe
d a
sset
s of
the
Com
pan
y.
Ind
usin
d B
ank
Lim
ited
--
-0.
00-
792.
12Se
cure
d b
y p
ari p
assu
firs
t cha
rge
on a
ll fix
ed a
sset
s of
the
Com
pan
y,
exce
pt
asse
ts c
harg
ed e
xclu
sive
ly t
o Sm
all
Ind
ustr
ies
Dev
elop
men
t
Bank
of
Ind
ia (
SID
BI),
and
sec
ond
cha
rge
on a
ll cu
rren
t as
sets
of
the
Com
pan
y.
IDBI
Ban
k Li
mite
d49
9.97
-99
9.41
1,49
9.38
-99
8.80
Secu
red
by
par
i pas
su fi
rst
char
ge o
n al
l fixe
d a
sset
s of
the
com
pan
y
bot
h p
rese
nt a
nd f
utur
e an
d p
ari
pas
su s
econ
d c
harg
e ov
er e
ntire
curr
ent a
sset
s of
the
com
pan
y b
oth
pre
sent
and
futu
re.
Exim
Ban
k-
--
2,86
0.45
2,86
0.45
Secu
red
by
the
49%
sha
res
held
by
the
Com
pan
y in
one
of
the
sub
sid
iarie
s an
d s
upp
orte
d b
y a
guar
ante
e is
sued
by
the
Com
pan
y
on b
ehal
f of t
he s
ubsi
dia
ry.
Axi
s Ba
nk L
imite
d-
--
3,89
6.32
Secu
red
by
a fir
st l
egal
mor
tgag
e ov
er t
he l
ease
hold
lan
d a
nd
bui
ldin
gs a
nd a
cha
rge
over
the
cur
rent
ass
ets
owne
d b
y/of
one
of
the
sub
sid
iarie
s of
the
Com
pan
y.
Nat
iona
l Aus
tral
ia B
ank
--
-1,
461.
12Se
cure
d b
y a
first
mor
tgag
e ch
arge
ove
r fr
eeho
ld la
nd a
nd b
uild
ings
owne
d b
y on
e of
the
sub
sid
iarie
s

171
As
at 3
1.0
3.2
01
8A
s at
31.
03.2
017
Se
curi
ty &
re
pay
me
nt
term
s
Nam
e of
the
ban
kN
on
-
Cu
rre
nt
Cu
rre
nt
Cu
rre
nt
Mat
uri
ty
(Re
fer
No
te 2
8)
Non
-
Cur
rent
Cur
rent
Cur
rent
Mat
urit
y (R
efer
Not
e 28
)
Rs.
lak
hs
Rs.
lak
hs
Rs.
lak
hs
Rs. l
akhs
Rs. l
akhs
Rs. l
akhs
Yes
Bank
Lim
ited
--
-1,
442.
49Se
cure
d o
ver
a fir
st m
ortg
age
over
fixe
d a
nd c
urre
nt a
sset
s of
one
of
the
sub
sid
iarie
s.
Nat
iona
l D
evel
opm
ent
Bank
-34
0.63
49.4
349
.35
172.
74Se
cure
d b
y a
first
lega
l mor
tgag
e ov
er t
he fr
eeho
ld fa
ctor
y la
nd a
nd
a ch
arge
ove
r th
e st
ock
and
boo
k d
ebts
of o
ne o
f the
sub
sid
iarie
s of
the
Com
pan
y an
d s
upp
orte
d b
y a
guar
ante
e is
sued
by
the
Com
pan
y
on b
ehal
f of t
he s
ubsi
dia
ry.
Sam
pat
Ban
k-
33.4
8-
6.82
Secu
red
by
first
cha
rge
on s
tock
and
boo
k d
ebts
of
one
of t
he
sub
sid
iarie
s.
Bank
of C
eylo
n-
--
Secu
red
by
first
cha
rge
on p
lant
a an
d m
achi
nery
of
one
of t
he
sub
sid
iarie
s.
Axi
s Ba
nk L
imite
d-
4,96
4.74
--
4,97
1.65
-Se
cure
d b
y p
ari
pas
su fi
rst
char
ge o
n al
l cu
rren
t as
sets
of
the
com
pan
y, p
rese
nt a
nd f
utur
e an
d p
ari
pas
su s
econ
d c
harg
e on
all
fixed
ass
ets
of t
he c
omp
any
exce
pt
Asq
uith
, p
lano
mill
er m
achi
ne
whi
ch is
exc
lusi
vely
cha
rged
to S
IDBI
.
Can
ara
Bank
-2,
448.
03-
-2,
351.
12-
Secu
red
by
par
i p
assu
firs
t ch
arge
on
stoc
k an
d b
ook
deb
ts o
f th
e
Com
pan
y, a
nd s
econ
d c
harg
e on
Pla
nt a
nd M
achi
nery
exc
ept
asse
ts
char
ged
exc
lusi
vely
to S
mal
l Ind
ustr
ies
Dev
elop
men
t Ban
k (S
IDBI
).
Bank
of B
arod
a-
5,49
3.95
--
5,49
9.57
-Se
cure
d b
y p
ari p
assu
cha
rge
on c
urre
nt a
sset
s of
the
Com
pan
y an
d
all t
he fi
xed
ass
ets
of th
e C
omp
any
exce
pt a
sset
s ch
arge
d e
xclu
sive
ly
to S
mal
l Ind
ustr
ies
Dev
elop
men
t Ban
k (S
IDBI
).
Cen
tral
Ban
k of
Ind
ia-
1,97
8.09
--
1,91
4.72
-Se
cure
d b
y p
ari
pas
su c
harg
e on
cur
rent
ass
ets
of t
he C
omp
any
in f
avou
r of
the
len
din
g b
anks
on
reci
pro
cal
bas
is u
nder
mul
tip
le
ban
king
arr
ange
men
ts.
IDBI
Ban
k Li
mite
d-
2,04
1.75
--
971.
55-
Secu
red
by
par
i pas
su c
harg
e on
mov
able
ass
ets
and
sec
ond
cha
rge
on fi
xed
ass
ets
exce
pt
asse
ts c
harg
ed e
xclu
sive
ly t
o Sm
all I
ndus
trie
s
Dev
elop
men
t Ban
k of
Ind
ia (S
IDBI
).
No
tes
form
ing
pa
rt o
f th
e fi
na
nci
al
sta
tem
en
ts
for
the
ye
ar
en
de
d M
arc
h 3
1, 2
01
8
21
. N
on
-Cu
rre
nt
bo
rro
win
gs
(Co
ntd
…)

Fifty Fifth Annual Report 2017-18
172
No
tes
form
ing
pa
rt o
f th
e fi
na
nci
al
sta
tem
en
ts
for
the
ye
ar
en
de
d M
arc
h 3
1, 2
01
8
21
. N
on
-Cu
rre
nt
bo
rro
win
gs
(Co
ntd
…)
As
at 3
1.0
3.2
01
8A
s at
31.
03.2
017
Se
curi
ty
Nam
e of
the
ban
kN
on
-
Cu
rre
nt
Cu
rre
nt
Cu
rre
nt
Mat
uri
ty
(Re
fer
No
te 2
8)
Non
-
Cur
rent
Cur
rent
Cur
rent
Mat
urit
y (R
efer
Not
e 28
)
Rs.
lak
hs
Rs.
lak
hs
Rs.
lak
hs
Rs. l
akhs
Rs. l
akhs
Rs. l
akhs
HD
FC B
ank
Lim
ited
-7,
413.
52-
-7,
500.
00-
Secu
red
by
par
i pas
su fi
rst
char
ge o
n cu
rren
t as
sets
of t
he C
omp
any,
bot
h p
rese
nt a
nd f
utur
e an
d p
ari
pas
su s
econ
d c
harg
e on
all
the
mov
able
pla
nt a
nd m
achi
nery
of
the
Com
pan
y, b
oth
pre
sent
and
futu
re e
xcep
t as
sets
cha
rged
exc
lusi
vely
to
Smal
l Ind
ustr
ies
Bank
of
Ind
ia (S
IDBI
).
Ind
ian
Bank
-2,
494.
19-
-2,
313.
38-
Secu
red
by
par
i pas
su fi
rst
char
ge o
n cu
rren
t as
sets
of t
he C
omp
any,
exce
pt
stoc
k of
raw
mat
eria
ls p
urch
ased
und
er b
ill d
isco
unti
ng
(com
pon
ents
) sc
hem
e of
Sm
all I
ndus
trie
s Ba
nk o
f In
dia
(SI
DBI
) an
d
par
i pas
su s
econ
d c
harg
e on
all
fixed
ass
ets
of th
e C
omp
any.
HD
FC B
ank
Lim
ited
--
-1,
000.
00Se
cure
d b
y w
ay o
f firs
t p
ari p
assu
cha
rge
on e
ntire
cur
rent
and
fixe
d
asse
ts, b
oth
pre
sent
and
futu
re o
f one
of t
he s
ubsi
dia
ries.
Nat
iona
l Aus
tral
ia B
ank
1,32
7.53
2,63
3.97
Secu
red
by
a fir
st m
ortg
age
char
ge o
ver
free
hold
land
and
bui
ldin
gs
owne
d b
y on
e of
the
sub
sid
iarie
s
IDBI
Ban
k Li
mite
d-
--
415.
05Se
cure
d b
y ex
clus
ive
char
ge o
n p
rese
nt c
urre
nt a
nd fi
xed
ass
ets
of
one
of th
e su
bsi
dia
ries.
Uni
ted
O
vers
eas
Bank
Lim
ited
--
-Se
cure
d o
ver
a fir
st m
ortg
age
over
leas
ehol
d la
nd a
nd b
uild
ing
and
curr
ent a
sset
s of
one
of t
he s
ubsi
dia
ries.
ICIC
I Ban
k Li
mite
d-
--
Secu
red
ove
r a
first
mor
tgag
e ov
er le
aseh
old
land
and
bui
ldin
g an
d
curr
ent a
sset
s of
one
of t
he s
ubsi
dia
ries.
Com
mer
cial
Ba
nk
of
Cey
lon
--
-47
.37
Secu
red
by
ch
arge
on
in
vent
ory
and
b
ooks
d
ebts
of
on
e th
e
sub
sid
iarie
s.
Nat
iona
l D
evel
opm
ent
Bank
-10
6.78
-59
.64
Secu
red
by
char
ge o
n in
vent
ory,
boo
k d
ebts
and
fre
ehol
d f
acto
ry
land
of o
ne o
f the
sub
sid
iarie
s an
d s
upp
orte
d b
y gu
aran
tee
issu
ed b
y
the
Com
pan
y on
beh
alf o
f the
sub
sid
iary
.
Sam
pat
h Ba
nk-
124.
13-
48.9
1Se
cure
d
by
char
ge
on
inve
ntor
y an
d
boo
ks
deb
ts
of
one
the
sub
sid
iarie
s.

173
No
tes
form
ing
pa
rt o
f th
e fi
na
nci
al
sta
tem
en
ts
for
the
ye
ar
en
de
d M
arc
h 3
1, 2
01
8
21
. N
on
-Cu
rre
nt
bo
rro
win
gs
(Co
ntd
…)
As
at 3
1.0
3.2
01
8A
s at
31.
03.2
017
Se
curi
ty
Nam
e of
the
ban
kN
on
-
Cu
rre
nt
Cu
rre
nt
Cu
rre
nt
Mat
uri
ty
(Re
fer
No
te 2
8)
Non
-
Cur
rent
Cur
rent
Cur
rent
Mat
urit
y (R
efer
Not
e 28
)
Rs.
lak
hs
Rs.
lak
hs
Rs.
lak
hs
Rs. l
akhs
Rs. l
akhs
Rs. l
akhs
Bank
of C
eylo
n-
--
86.6
0Se
cure
d b
y fir
st c
harg
e on
fixe
d a
sset
s si
tuat
ed in
one
of t
he fa
ctor
ies
of th
e su
bsi
dia
ry.
Hat
ton
Nat
iona
l Ban
k-
101.
78-
59.5
8Se
cure
d b
y ch
arge
on
inve
ntor
y an
d fi
xed
dep
osit
s of
one
the
sub
sid
iarie
s.
Sam
pat
h Ba
nk-
20.6
1-
13.2
9Se
cure
d b
y ch
arge
on
inve
ntor
y an
d fi
xed
dep
osit
s of
one
the
sub
sid
iarie
s.
Nat
iona
l Dev
elop
men
t
Bank
-24
.66
-64
.95
Secu
red
by
char
ge o
n in
vent
ory,
boo
k d
ebts
and
fre
ehol
d f
acto
ry
land
of o
ne o
f the
sub
sid
iarie
s an
d s
upp
orte
d b
y gu
aran
tee
issu
ed b
y
the
Com
pan
y on
beh
alf o
f the
sub
sid
iary
.
Buye
r’s C
red
it fr
om
Bank
s
-1,
783.
97-
-1,
685.
41-
Secu
red
by
hyp
othe
cati
on, r
anki
ng p
ari p
assu
, of a
ll ta
ngib
le m
ovab
le
asse
ts in
clud
ing
in p
arti
cula
r sto
cks
of ra
w m
ater
ials
oth
er th
an th
ose
pur
chas
ed u
nder
bill
dis
coun
ting
(co
mp
onen
ts)
sche
me
of S
mal
l
Ind
ustr
ies
Dev
elop
men
t Ba
nk o
f In
dia
(SI
DBI
), fin
ishe
d g
ood
s, w
ork-
in-p
rogr
ess,
con
sum
able
s, s
par
es a
nd o
ther
mov
able
ass
ets
and
boo
k
deb
ts, o
utst
and
ing
and
oth
er re
ceiv
able
s.
Bills
Dis
coun
ted
wit
h
Bank
s
-25
3.38
--
2,94
1.58
-Se
cure
d b
y p
ari p
assu
firs
t cha
rge
on s
pec
ified
ass
et
3,39
9.51
29,6
23.7
06,
813.
3215
,908
.96
31,9
44.3
78,
221.
76

Fifty Fifth Annual Report 2017-18
174
As at As at 31.03.2018 31.03.2017
Rs. lakhs Rs. lakhs
22. Provisions
Current
(a) Provision for employee benefits
i) Post retirement pension 86.63 57.54
ii) Retirement gratuity 10.50 13.91
iii) Other long-term employee benefits
Compensated absence 649.00 202.94
(b) Provision for estimated losses on onerous contracts 3,212.38 2,562.54
(c) Provision for warranty*(Refer note 49 ) 368.69 443.33
4,327.20 3,280.26
* Includes other provision of Rs. 31.15 lakhs ( 31.3.17- Rs. 31.15 lakhs )
Non-current
(a) Provision for employee benefits
i) Post retirement pension 924.90 645.81
ii) Retirement gratuity 532.15 516.49
iii) Other long-term employee benefits
Compensated absence – 777.04
1,457.05 1,939.34
23. Other non-current liabilities
(a) Pension payable under employee separation scheme 10.05 13.17
(b) Deposit from employees 15.85 8.37
25.90 21.54
24. Current Borrowings
Secured - at amortised cost
(a) Repayable on demand
From banks
i) Working capital demand loans 366.17 8,572.86
ii) Cash credit 26,879.55 18,679.58
iii) Other short-term loans 340.63 64.94
(b) Other loans
i) Buyer’s credit 1,783.97 1,685.41
ii) Bills discounted. with banks 253.38 2,941.58
Total borrowings 29,623.70 31,944.37
25. Derivative Liabilities
(a) Foreign currency forward contracts 5.30 35.07
5.30 35.07
Current 5.30 35.07
5.30 35.07
Notes forming part of the financial statements
for the year ended March 31, 2018

175
As at As at
31.03.2018 31.03.2017
Rs. lakhs Rs. lakhs
26. Trade Payables
(a) Total outstanding dues to micro enterprises and small enterprises 437.71 218.75
(b) Total outstanding dues of creditors other than micro enterprises and small enterprises 29,990.31 41,210.14
(c) Creditors for accrued wages and salaries 345.90 641.90
(d) Acceptances 91.35 58.82
Total Trade Payables 30,865.27 42,129.61
27. Other current financial liabilities
(a) Current maturities of long-term debts 6,813.32 8,221.76
(b) Current maturities of finance lease obligations 10.76 13.57
(c) Interest accrued but not due on other borrowings 2.48 39.87
(d) Interest accrued and due on other borrowings 135.55 190.15
(e) Unpaid dividends 9.40 18.60
(f ) Creditors for purchase of fixed assets 20.50 34.90
(g) Other credit balances 225.84 17.23
7,217.85 8,536.08
28. Other current liabilities
(a) Advance received from customers 6,661.26 7,038.92
(b) Dues to customers under contracts in progress 12,177.04 11,791.29
(c) Pension payable under employee separation scheme 2.91 5.87
(d) Employee recoveries and employer’s contributions 759.12 693.81
(e) Statutory dues 427.29 432.19
(f ) Other credit balances 206.94 177.37
20,234.56 20,139.45
Year ended Year ended
31.03.2018 31.03.2017
Rs. lakhs Rs. lakhs
29. Revenue from operations
(a) Revenue from project business 23,006.30 35,582.50
(b) Sale of products 19,479.95 22,710.96
(c) Sale of services 1,691.33 1,956.54
Revenue from Operations 44,177.58 60,250.00
30. Other income
(a) Interest income
i) On income tax refunds – 18.56
ii) Others 81.65 322.56
(b) Dividend income
i) From other non-current investments 0.29 0.24
(c) Net gain on sale of fixed assets – 28.86
(d) Gain on foreign currency transactions (net) – 19.83
(e) Liabilities/provision no longer required written back 321.54 154.57
(f ) Miscellaneous income 85.09 167.51
Total other income 488.57 712.13
Notes forming part of the financial statements
for the year ended March 31, 2018

Fifty Fifth Annual Report 2017-18
176
Notes forming part of the financial statements
for the year ended March 31, 2018
For the For the
year ended year ended
31.03.2018 31.03.2017
31. Cost of materials consumed
Raw materials consumed
(a) Opening stock 4,801.12 4,156.63
(b) Add: Purchases 23,872.84 33,237.10
28,673.96 37,393.73
(c) Exchange difference on consolidation 30.52 (321.49)
28,704.48 37,072.24
(d) Less: Closing stock 3,558.46 4,801.12
Total raw materials consumed 25,146.02 32,271.12
32. Changes in inventories of finished products,
work in progress and contracts in progress
Inventories and contract in progress at the beginning of the year
(a) Stock in trade – –
(b) Finished products 1,968.11 1,546.84
(c) Work-in-progress 2,592.47 2,375.72
(d) Contracts in progress 4,683.33 6,533.97
9,243.91 10,456.53
(e) Exchange difference on consolidation (1.24) (5.11)
9,242.67 10,451.42
Inventories and contract in progress at the end of the year
(a) Stock in trade – –
(b) Finished products 1,353.70 1,968.11
(c) Work-in-progress 2,317.77 2,592.47
(d) Contracts in progress 2,647.23 4,683.33
6,318.70 9,243.91
Net (increase)/decrease 2,923.98 1,207.51
33. Employee benefits expense
(a) Salaries and wages, including bonus
[Net of excess provision written back Rs Nil, (Previous year : 578 lakhs)] 5,553.30 4,752.07
(b) Company’s contribution to provident and other funds 761.26 774.35
(c) Workmen and staff welfare expenses 533.63 614.03
Total employee benefits expense 6,848.19 6,140.45
34. Finance costs
(a) Interest expense 4,476.56 4,431.95
(b) Other borrowing costs 417.94 343.84
Total finance costs 4,894.50 4,775.79
35. Depreciation and amortisation expense
(a) Depreciation and amortisation on tangible assets 467.02 504.93
(b) Depreciation and amortisation on Intangible assets 32.44 48.04
Total depreciation and amortisation expense 499.46 552.97

177
Notes forming part of the financial statements
for the year ended March 31, 2018
For the For the
year ended year ended
31.03.2018 31.03.2017
Rs. lakhs Rs. lakhs
36. Other expenses
(a) Consumption of stores, spare parts and loose tools 457.63 556.99
(b) Repairs to buildings 525.36 565.67
(c) Repairs to plant and machinery 258.82 336.84
(d) Repairs to others 55.44 84.47
(e) Rent 376.11 370.73
(f ) Power and fuel 427.48 418.91
(g) Rates, taxes and licenses 118.23 39.80
(h) Taxes and duties (net)
i) Sales tax 77.52 159.84
ii) Excise duty (273.16) 203.99
iii) Service tax 123.51 518.30
iv) GST 537.23 –
v) Others 323.95 0.89
(i) Insurance charges 253.87 266.09
(j) Freight and handling charges 1,256.18 1,309.97
(k) Service charges (collection and order procurement) 46.59 146.59
(l) Travelling, conveyance and car running expenses 682.92 954.91
(m) Legal and professional fees 1,403.07 1,216.76
(n) Provision for doubtful debts and advances 6,800.23 1,577.93
(o) Bad debts written off 46.52 149.54
(p) Provision for estimated losses on onerous contracts 649.84 759.17
(q) Provision for warranty expenses 85.94 166.31
(r) Other general expenses
i) Loss on foreign currency transactions (net) 4.37 –
ii) Loss on derivatives (net) 200.10 324.24
iii) Directors’ fee 34.61 47.80
iv) Telephone expenses 85.35 114.74
v) Provision for impairment losses on fixed assets, CWIP and intangibles 29.81 –
vi) Auditors remuneration and out-of-pocket expenses
As Auditors - statutory audit 90.25 102.48
For Taxation matters 5.27 5.84
For Other Services 12.98 13.98
Auditors’ out-of-pocket expenses 5.27 10.34
vii) Others 273.23 313.34
Total other expenses 14,974.52 10,736.46

Fifty Fifth Annual Report 2017-18
178
Notes forming part of the financial statements
for the year ended March 31, 2018
37. Discountinued Operations
A discontinued operation is a component of an entity that either has been disposed of or classified as held for sale.
(i) York Transport Equipment Pte Ltd has been classified as discontinued operation during the current year following the Share
Purchase Agreement dated March 21, 2018. The Group’s share in the profit of York Transport Equipment Pte Ltd Ltd till the
reporting date has been accounted for and included in result as Profit from discontinued operation.
(ii) In terms of the Share Purchase Agreement signed on Oct 31, 2017 with JL Power Venture Pvt Ltd ( JPL), the coventurer of
Adithya Automotive Applications Pvt Ltd. The difference between consideration received and the value of the Group’s share
in the net asset is accounted for as profit on disposal from discontinued operation, the Group’s share in the profit of Adithya
Automotive Applications Pvt Ltd till Feb 4, 2018 is accounted for and included in result as Profit from discontinued operation.
The results of the discountinued operations related to York Transport Equipment Pte Ltd in each of the reporting periods are
as below:
Rs. lakhs
For the For the
year ended year ended
31.03.2018 31.03.2017
Revenue from operations (gross) 56,338.26 40,842.66
Other income 329.35 511.62
56,667.61 41,354.28
Expenses
Cost of materials consumed 39,286.12 24,974.77
Payment to sub-contractors 2.63 8.35
Purchases of finished, semi-finished and other products 3,700.35 3,055.71
Changes in inventories of finished products, work in progress and contracts in progress (175.96) 450.94
Excise duty on sale of goods 982.09 40.40
Employee benefit expense 4,212.87 3,776.29
Finance costs 1,084.60 1,152.14
Depreciation and amortisation expense 391.05 386.57
Other expenses 5,205.95 4,595.65
54,689.70 38,440.82
Profit/(Loss) before tax from discountinued operations 1,977.91 2,913.46
Tax expenses: 1,115.99 132.83
(a) Current Tax 1,139.23 221.96
(b) Deferred Tax (129.23) (2.52)
(c) MAT Credit 105.99 (86.61)
Profit/(Loss) after tax from discountinued operations of York Transport Equipment Pte Ltd 861.93 2,780.63
Profit/(Loss) after tax from discountinued operations of Adithya Automotive Applications Pvt Ltd 96.96 272.39
Total Profit/(Loss) after tax from discountinued operations 958.89 3,053.02
The difference in consideration received on disposal and value of the Group’s share in Adithya Automative Applications Pvt Ltd
amounting to Rs. 2325.03 lacs has been accounted for as profit on disposal of discontinued operation.

179
38. Subsidiaries
Details of subsidiaries at the end of the reporting period are as follows:
Name of the Subsidiary Principal activity Place of
incorporation
and operation
Proportion of ownership
interest and voting power
held by the Group
As at
31.03.2018
As at
31.03.2017
TRF Singapore Pte Ltd Investment Company Singapore 100% 100%
TRF Holding Pte Ltd Investment Company Singapore 100% 100%
YORK Transport Equipment (Asia)
Pte Ltd
Manufacture and distribution of axles, suspensions
and other automotive components
Singapore 100% 100%
YORK Transport Equipment Pty Ltd Manufacture and distribution of axles, suspensions
and other automotive components
Australia 100% 100%
YORK Sales (Thailand) Co. Ltd Distribution of axles, suspensions and other
automotive components
Thailand 100% 100%
YTE Transport Equipment (SA) (Pty)
Limited
Distribution of axles, suspensions and other
automotive components
South Africa 100% 100%
Rednet Pte Ltd. Distribution of axles, suspensions and other
automotive components
Singapore 100% 100%
PT YORK Engineering Manufacture and distribution of axles ( Dormant) Indonesia 100% 100%
YTE Special Products Pte Ltd Distribution of axles, suspensions and other
automotive components
Singapore 100% 100%
Qingdao YTE Special Products
Co. Ltd
Manufacture and distribution of axles, suspensions
and other automotive components
China 100% 100%
YORK Transport Equipment India
Pvt. Ltd
Manufacture and distribution of axles, suspensions
and other automotive components
India 100% 100%
YORK Transport Equipment
(Shanghai) Co. Ltd
Manufacture and distribution of axles, suspensions
and other automotive components
China 100% 100%
Dutch Lanka Trailer Manufacturers
Limited
Manufacture of Heavy duty trailers Sri Lanka 100% 100%
Dutch Lanka Engineering Pvt Ltd Manufacture of Heavy duty trailers Sri Lanka 100% 100%
Dutch Lanka Trailers Manufactures
LLC
Manufacture of Heavy duty trailers Oman 70% 70%
Hewitt Robins International Ltd Manufacture of screens United Kingdom 100% 100%
Hewitt Robins International
Holding Ltd
Investment Company United Kingdom 100% 100%
38.01 Composition of the Group
Information about the composition of the Group at the end of the reporting period is as follows:
Principal activity Number of wholly-owned subsidiaries
As at As at
31.03.2018 31.03.2017
Manufacture of heavy duty axles 6 6
Distribution of heavy duty axles 4 4
Manufacture of heavy duty trailers 3 3
Manufacture of screens 1 1
Investment activity 3 3
Notes forming part of the financial statements
for the year ended March 31, 2018

Fifty Fifth Annual Report 2017-18
180
Notes forming part of the financial statements
for the year ended March 31, 2018
For the For the
year ended year ended
31.03.2018 31.03.2017
Rs. lakhs Rs. lakhs
39. Income tax recognised in profit and loss
Current tax
In respect of the current year 169.29 121.90
In respect of prior years (0.46) 114.67
168.83 236.57
Deferred tax
In respect of the current year (1,971.45) (2,348.52)
In respect of prior years – –
(1,971.45) (2,348.52)
Total income tax expense recognised in the current year (1,802.62) (2,111.95)
40. Segment information
40.01 Products and services from which reportable segment derives their revenues
Information reported to the Chief operating decision maker (CODM) for the purpose of resource allocation and assessment
of segment performance focuses based on products and services. Accordingly, directors of the Company have chosen to
organise the segment based on its product and services as follows:
Products and services
Projects and services
The Company’s Chief operating decision maker is the Managing Director.
Revenue and expenses directly attributable to segment are reported under each reportable segment. Expenses which are not
directly identifiable to each reporting segment have been allocated on the basis of associated revenue of the segment and
manpower efforts. All other expenses which are not attributable or allocable to segments have been disclosed as Unallocable
expenses.
Assets and liabilities that are directly attributable or allocable to segments are disclosed under each reportable segment. All
other assets and liabilities are disclosed as Unallocable.
The company’s financing and income taxes are managed on a company level and are not allocated to operating segment.

181
Notes forming part of the financial statements
for the year ended March 31, 2018
40.02 Segment revenue and results
Segment revenue Segment profit
Year ended Year ended Year ended Year ended
31.03.2018 31.03.2017 31.03.2018 31.03.2017
Rs. lakhs Rs. lakhs Rs. lakhs Rs. lakhs
Products and Services 27,568.28 35,881.41 1,523.14 5,230.62
Projects and Services 24,865.49 38,267.28 (15,326.24) (4,756.19)
52,433.77 74,148.69
Inter-segment revenue 8,256.19 13,898.69
Total 44,177.58 60,250.00 (13,803.10) 474.43
Other income 973.58 838.14
Unallocated corporate costs (1,191.81) (4,874.40)
Interest costs (4,476.56) (4,431.95)
Exceptional items – 418.67
Loss before tax (18,497.89) (7,575.11)
Tax Expense (1,802.62) (2,111.95)
Loss after tax from countinuing operation (16,695.27) (5,463.16)
Profit after tax from discontinuing operation 3,283.92 3,053.02
Loss for the year (13,411.35) (2,410.14)
The accounting policies of the reportable segments are the same as the Group’s accounting policies described in note 02.
Segment profit represents the profit and loss before tax earned by each segment without allocation of corporate costs, share
profit of joint ventures, other income, as well as interest costs. This is the measure reported to the executive management
committee for the purposes of resource allocation and assessment of segment performance.
40.03 Segment assets and liabilities As at As at
31.03.2018 31.03.2017
Rs. lakhs Rs. lakhs
Segment assets
Products and Services 26,077.32 53,580.61
Products and Services - Held for sale ( Note -17 ) 27,913.82 0.00
Projects and Services 31,017.22 43,407.80
Total segment assets 85,008.36 96,988.41
Unallocated 24,078.75 23,001.40
Consolidated total assets 109,087.11 119,989.81
Segment liabilities
Products and Services 16,600.14 37,164.76
Products and Services - Held for sale ( Note -17 ) 29,808.70 0.00
Projects and Services 41,074.51 42,666.46
Total segment liabilities 87,483.35 79,831.22
Unallocated 41,640.83 48,250.46
Consolidated total liabilities 129,124.18 128,081.68
For the purpose of monitoring segment performance and allocating resources between segments:
all assets are allocated to reportable segments other than investments in joint ventures and other investments, loans,
financial assets and current and deferred tax assets. Goodwill is allocated to reportable segments.

Fifty Fifth Annual Report 2017-18
182
Notes forming part of the financial statements
for the year ended March 31, 2018
40.04 Other segment information
Depreciation and amortisation Addition to non-current assets
Year ended Year ended Year ended Year ended
31.03.2018 31.03.2017 31.03.2018 31.03.2017
Rs. lakhs Rs. lakhs Rs. lakhs Rs. lakhs
Products and Services 399.48 467.97 374.65 403.33
Projects and Services 42.54 70.17 24.33 28.42
Unallocated 57.44 14.83 13.56 56.74
499.46 552.97 412.54 488.49
40.05 Revenue from major products and services
Year ended Year ended
31.03.2018 31.03.2017
Rs. lakhs Rs. lakhs
a) Products and services
Idler rollers and components 2,262.61 3,837.04
Sectional and Mine Conveyors 3,678.77 3,797.51
Vibrating screens and components 1,675.14 2,216.12
Crushers and components 1,282.36 1,631.72
Miscellaneous 1,781.58 2,228.31
Heavy duty trailers 5,029.90 5,351.72
Screens 3,459.53 2,770.26
Repair income 142.20 149.33
b) Projects and services
Construction contracts and related services 24,865.49 38,267.99
44,177.58 60,250.00
40.06 Geographical information
The Group operates in two geographical areas - India and Outside India
The Group’s revenue from continuing operations from external customers by geographical areas of operation and information
about its non-current assets by location of assets are detailed below:
Revenue from external customers Non-current assets
Year ended Year ended Year ended Year ended
31.03.2018 31.03.2017 31.03.2018 31.03.2017
Rs. lakhs Rs. lakhs Rs. lakhs Rs. lakhs
India 35,395.12 52,557.45 7,751.00 9,621.19
Outside India 8,782.46 7,692.55 17,128.13 19,469.90
44,177.58 60,250.00 24,879.13 29,091.09
40.07 Information about major customers
Included in revenue arising from direct sales of goods and services (excluding excise duty) of Rs 43933.76 lakhs (Year ended
March 31, 2017: Rs 55704.14 lakhs) are revenues of approximately Rs. 22,402.61 lakhs (March 31, 2017: Rs 30,200.50 lakhs)
which arose of the sale to the Company’s top three customers. No other single customer contributed 10% or more of the
Company’s revenue for both 2017-2018 and 2016-2017.

183
Notes forming part of the financial statements
for the year ended March 31, 2018
41. Earnings per share
Year ended Year ended
31.03.2018 31.03.2017
Rs. lakhs Rs. lakhs
Basic & Diluted earnings per share
The earnings and weighted average number of equity shares
used in the calculation of basic earnings per share are as follows:
Profit/( loss ) after tax for the year attributable to owners of
the Company from continuing operation (16,695.27) (5,463.16)
Weighted average number of equity shares for the purposes of basic earnings per share 11,004,412 11,004,412
Basic earnings per share (151.71) (49.65)
Diluted earnings per share (151.71) (49.65)
Profit/( loss ) after tax for the year attributable to owners
of the Company from discontinued operation 3,283.92 3,053.02
Weighted average number of equity shares for the purposes of basic earnings per share 11,004,412 11,004,412
Basic earnings per share 29.84 27.74
Diluted earnings per share 29.84 27.74
Profit/( loss ) after tax for the year attributable to owners
of the Company from continuing and discontinued operation (13,411.35) (2,409.85)
Weighted average number of equity shares for the purposes of basic earnings per share 11,004,412 11,004,412
Basic earnings per share (121.87) (21.90)
Diluted earnings per share (121.87) (21.90)
The Group is not having any potential ordinary shares which are dilutive in nature. Hence diluted earnings per share is not calculated
separately.
42. Leasing Arrangements
Finance lease
The Group leased certain manufacturing equipments and motor vehicle under finance leases. The average lease term is three
years. The Group’s obligation under finance leases are secured by the lessor’s title to the leased assets.
Interest rates underlying all obligations under finance leases are fixed at respective contract dates ranging from 9.08% to 13.37%
per annum.
Finance lease liabilities
Minimum lease payments Present value of minimum lease payments
As at As at As at As at
31.03.2018 31.03.2017 31.03.2018 31.03.2017
Rs. lakhs Rs. lakhs Rs. lakhs Rs. lakhs
Not later than one year 11.65 16.06 10.76 13.57
Later than one year and not later than five years 5.50 17.41 5.04 15.87
17.15 33.47
Less: Future finance charges 1.35 4.03 - -
Present value of minimum lease payments 15.80 29.44 15.80 29.44
Included in the consolidated financial statements as:
- Long-term borrowings 5.04 15.87
- Current maturities of finance lease obligations 10.76 13.57
15.80 29.44
Operating lease
The Company’s significant leasing arrangements are in respect of operating leases for premises (residential, office, warehouse etc).
The leasing arrangements which normally have a tenure of eleven months to three years are cancellable with a reasonable notice
and are renewable by mutual consent at agreed terms. Lease rentals aggregating to Rs 303.23 lakhs are charged as rent to the
statement of profit and loss (for the year March 31, 2017 Rs 306.84 lakhs)

Fifty Fifth Annual Report 2017-18
184
Notes forming part of the financial statements
for the year ended March 31, 2018
43. Employee Benefit plans
43.01 Defined contribution plans
The Company, its subsidiary and joint ventures operating in India and subsidiaries operating in Sri Lanka provide Provident
Fund facility to all employees. The Company provides superannuation benefits to selected employees. The assets of the plans
are held separately from those of the Group in funds under the control of the trustees in case of trust or of the employees
provident fund organisation. The contributions are expensed as they are incurred in line with the treatment of wages and
salaries. The Company’s Provident Fund is exempted under section 17 of Employees’ Provident Fund and Miscellaneous
Provision Act, 1952. Conditions for exemption stipulate that the Company shall make good deficiency, if any, in the interest
rate declared by the trust vis-a-vis interest rate declared by the Employees’ Provident Fund Organisation. The liability as on the
balance sheet is ascertained by an independent actuarial valuation.
The Group has recognised an amount of Rs. 620.71 lakhs as expenses for the year ended March 31,2018 (For the year ended
March 31, 2017: Rs.953.95 lakhs) towards contribution to the following defined contribution plans
Year ended Year ended
31.03.2018 31.03.2017
Rs. lakhs Rs. lakhs
Provident Fund 1 235.51 541.82
Employees pension scheme 144.81 155.95
Superannuation fund 194.76 214.85
Employees state insurance scheme 45.63 41.33
620.71 953.95
1 Includes Rs. 28.54 lakhs (Year ended 31.03.2017: Rs. 37.48 lakhs) toward provision for shortfall in interest in the
exempted provident fund trust.
43.02 Defined benefit plans
The Company, its subsidiary and joint ventures operating in India and subsidiaries operating in Sri Lanka provide Gratuity
benefit to all employees. The Company provides post retirement pension for retired whole-time directors. The assets of the
gratuity plans are held separately from those of the Group in funds under the control of the trustees of the independent
trusts or with the life insurance companies. The board of trustees of the gratuity fund composed of an equal number of
representatives from both employees and employers. The board of the Fund is required by law and by the trust deed to act in
the interest of the Fund and of all relevant stakeholders in the scheme. The board of trustee of the fund and management of
life insurance company is responsible for the investment policy with regard to the assets of the Fund. Post retirement pension
plan is not funded.
Under the gratuity plan, the employees with minimum five years of continuous service are entitled to lumpsum payment at
the time of separation calculated based on the last drawn salary and number of years of service rendered with the company.
Under the post retirement pension, the Company pays monthly pension to retired whole-time directors as decided by the
board of directors.
These plans expose the Group to actuarial risks such as investment risk, interest rate risk, longevity risk and salary risk
Investment Risk The present value of the defined benefit plan liability (denominated in Indian Rupee) is calculated using
a discount rate which is determined by reference to market yields at the end of the reporting period
on government bonds. For other defined benefits plans, the discount rate is determined by reference
to bonds when there is deep market for such bonds. Currently, for the plan in India, it has relatively
balanced mix of investments in government securities and other debt instruments.
Interest risk A decrease in the bond interest rate will increase the plan liability; however, this will be partially offset by
an increase in the return on the plan’s debt investments.
Longevity risk The present value of the defined benefit plan liability is calculated by reference to the best estimate
of the mortality of plan participants both during and after their employment. An increase in the life
expectancy of the plan participants will increase the plan’s liability.
Salary risk The present value of the defined benefit plan liability is calculated by reference to the future salaries
of plan participants. As such, an increase in the salary of the plan participants will increase the plan’s
liability.

185
Notes forming part of the financial statements
for the year ended March 31, 2018
In respect of the plan in India, the most recent actuarial valuation of the plan assets and the present value of defined benefit
obligation were carried out as at March 31, 2018 by independent actuaries. The present value of the defined benefit obligation,
and the related current service cost and past service cost, were measured using the projected unit credit method.
During the year ended March 31,2018 and March 31, 2017 there was no amendment, curtailments and settlements in the
gratuity plan and post retirement pension plans.
Gratuity Plan
Year ended Year ended
31.03.2018 31.03.2017
Rs. lakhs Rs. lakhs
Movement in the fair value of the plan assets
a) Opening fair value of plan assets 1,294.58 1,421.25
b) Remeasurement (gain)/loss (1.28) 17.72
c) Return on plan assets (excluding amounts included in net interest expense) 85.41 98.83
d) Employer’s contribution 161.09 86.60
e) Benefits paid (193.77) (378.37)
f ) Assets classified as held for sale (58.13) -
g) Plan assets received on account transferred employees – 48.55
h) Closing fair value of plan assets 1,287.90 1294.58
Movement in the present value of the defined benefit obligation
a) Opening defined benefit obligation 1,824.98 1,708.05
b) Current service cost 128.30 129.25
c) Interest cost 121.39 118.84
d) Remeasurement (gain)/loss
i) Actuarial (gains)/loss arising from changes in demographic assumptions –
ii) Actuarial (gains)/loss arising from changes in financial assumptions (85.21) 102.51
iii) Actuarial (gains)/loss arising from experience adjustments 96.59 99.48
e) Benefits paid (193.77) (378.37)
f ) Obligations classified as held for sale (61.57) -
g) Liability assumed on account transferred employees – 48.55
h) Exchange difference on foreign plans (0.16) (3.33)
i) Closing defined benefit obligation 1,830.55 1,824.98
Components of defined benefit costs recognised:
I. Components of defined benefit costs recognised in profit and loss
a) Service Costs:
- Current service cost 128.30 129.25
- Past service cost and (gain)/loss from settlements
b) Net interest expenses 35.98 20.01
Subtotal 164.28 149.26
II. Components of defined benefit costs recognised in other comprehensive income
a) Remeasurement on the net defined benefit liability:
- Return on plan assets (excluding amounts included in net interest expense) 1.28 (17.72)
- Actuarial (gains)/loss arising from changes in demographic assumptions
- Actuarial (gains)/loss arising from changes in financial assumptions (85.21) 102.51
- Actuarial (gains)/loss arising from experience adjustments 96.59 99.48
b) Adjustments for restrictions on the defined benefit asset
Subtotal 12.66 184.27
III. Total defined benefit cost recognised 176.94 333.53

Fifty Fifth Annual Report 2017-18
186
Notes forming part of the financial statements
for the year ended March 31, 2018
As at As at
31.03.2018 31.03.2017
Rs. lakhs Rs. lakhs
Amount recognised in the consolidated balance sheet arising from
defined benefit plan obligation
a) Present value of funded defined benefit obligation 1,830.55 1,824.98
b) Fair value of plan assets 1,287.90 1,294.58
c) Funded status 542.65 530.40
d) Restrictions on asset recognised - -
e) Net liability arising from defined benefit obligation 542.65 530.40
Amount included in the consolidated balance sheet
(i) Retirement benefit asset - Non current - -
(ii) Provision for Retirement gratuity - Current 10.50 13.91
(iii) Provision for Retirement gratuity - Non-Current 532.15 516.49
542.65 530.40
Fair value of plan assets
a) Cash and cash equivalents 173.84 25.98
b) Debt instruments catergorised by issuer’s credit rating
- Government securities (Central and State) 275.31 337.97
- Corporate Bonds (AAA Rated) 223.97 153.45
- Corporate Bonds (AA Rated) - 20.29
- Corporate Bonds (A Rated) 35.10
- Corporate Bonds (AA- Rated) - 36.77
- Corporate Bonds (Not Rated) 66.56 156.30
Subtotal 600.94 704.78
c) Equity Investments
- Units of Mutual Funds - Equity Funds 87.14 79.70
Subtotal 87.14 79.70
d) Special deposit schemes 425.98 425.98
e) Others - 58.14
1,287.90 1,294.58
Principal assumption used for the purpose of the actuarial valuation
a) Discount rate 7.50% to 10.50% 7.00% to 12.50%
b) Expected rate(s) of salary income 8.00% to 9.00% 8.00% to 10.00%
The fair value of the debt securities issued by government and corporates are determined based on quoted market prices
in active markets. The fair value of investment in mutual funds are determined based on closing net asset value declared by
the respective asset management company. The fair value of balance in special deposit scheme is determined based on the
carrying value. The fair value of balance with insurance companies is determined based on the funds statement received from
the respective insurance companies.
The actual return on plan assets was Rs. 84.13 lakhs (for the year ended March 31, 2017: Rs. 116.55 Lakhs)
Significant actuarial assumptions for the determination of the defined benefit obligation are discount rate, expected salary
increase and mortality. The sensitivity analysis given below have been determined based on reasonably possible changes of
the respective assumptions occurring at the end of the reporting period, while holding all other assumptions constant.
If the discount rate is 100 basis points higher (lower), the defined benefit obligation would decrease by Rs.105.61 lakhs
(increase by Rs.121.66 lakhs) [as at March 31, 2017: decrease by Rs. 141.67 lakhs (increase by Rs. 167.80 lakhs)]
If the expected salary increase growth increases (decreases) by 1%, the defined benefit obligation would increase by Rs. 120.67
lakhs (decrease by Rs. 107.08 lakhs) [as at March 31, 2017: increase by Rs. 165.02 lakhs (decrease by Rs. 142.15 lakhs)]
Note : Impact on scheme liabilty not included above for the Assets and liabilties classified as held for sale

187
Notes forming part of the financial statements
for the year ended March 31, 2018
If the expected salary increase growth increases (decreases) by 1%, the defined benefit obligation would increase by Rs. 6.62
lakhs (decrease by Rs. 7.32 lakhs) [as at March 31, 2017: increase by Rs. 7.17 lakhs (decrease by Rs. 6,26 lakhs)]
The sensitivity analysis presented above may not be representative of the actual change in the defined benefit obligation as it
is likely that the change in assumptions would occur in isolation of one another as some of the assumptions may be correlated.
In presenting the above sensitivity analysis, the present value of the defined benefit obligation has been calculated using the
projected unit credit method at the end of the reporting period, which is same as applied in calculating the defined benefit
obligation liability recognised in the balance sheet. There was no change in the method and assumptions used in preparing
the sensitivity analysis from prior years.
Post retirement pension plan
Year ended Year ended
31.03.2018 31.03.2017
Rs. lakhs Rs. lakhs
Movement in the present value of the defined benefit obligation
a) Opening defined benefit obligation 703.35 1,193.90
b) Current service cost 351.32 (578.52)
c) Interest cost 46.34 90.09
d) Remeasurement (gain)/loss
i) Actuarial (gains)/loss arising from changes in demographic assumptions - -
ii) Actuarial (gains)/loss arising from changes in financial assumptions (27.45) 37.73
iii) Actuarial (gains)/loss arising from experience adjustments 20.58 22.99
e) Benefits paid (82.61) (62.84)
f ) Closing defined benefit obligation 1,011.53 703.35
Amount recognised in the consolidated balance sheet
arising from defined benefit plan obligation
a) Present value of funded defined benefit obligation 1,011.53 703.35
b) Fair value of plan assets - -
e) Net liability arising from defined benefit obligation 1,011.53 703.35
Amount included in the consolidated balance sheet
(i) Provision for Retirement gratuity - Current 86.63 57.54
(ii) Provision for Retirement gratuity - Non-Current 924.90 645.81
1,011.53 703.35
Components of defined benefit costs recognised:
I. Components of defined benefit costs recognised in profit and loss
a) Service Costs:
- Current service cost 351.32 (578.52)
b) Net interest expenses 46.34 90.09
Subtotal 397.66 (488.43)
II. Components of defined benefit costs recognised in other comprehensive income
a) Remeasurement on the net defined benefit liability:
- Return on plan assets (excluding amounts included in net interest expense)
- Actuarial (gains)/loss arising from changes in demographic assumptions (27.45) 37.73
- Actuarial (gains)/loss arising from changes in financial assumptions 20.58 22.99
- Actuarial (gains)/loss arising from experience adjustments
b) Adjustments for restrictions on the defined benefit asset
Subtotal (6.87) 60.72
III. Total defined benefit cost recognised 390.79 (427.71)

Fifty Fifth Annual Report 2017-18
188
Notes forming part of the financial statements
for the year ended March 31, 2018
Principal assumption used for the purpose of the actuarial valuation
a) Discount rate 7.50% 7.00%
b) Expected rate(s) of pension increase 3.00% 3.00%
Significant actuarial assumptions for the determination of the defined benefit obligation are discount rate, expected pension
increase and mortality. The sensitivity analysis given below have been determined based on reasonably possible changes of the
respective assumptions occurring at the end of the reporting period, while holding all other assumptions constant.
If the discount rate is 100 basis points higher (lower), the defined benefit obligation would decrease by Rs. 71.54 lakhs (increase by
Rs. 81.75 lakhs) [as at March 31, 2017: decrease by Rs.49.51 lakhs (increase by Rs.56.45 lakhs)]
If the expected pension growth increases (decreases) by 1%, the defined benefit obligation would increase by Rs. 84.92 lakhs
(decrease by Rs.75.30 lakhs) [as at March 31, 2017: increase by Rs.58.19 lakhs (decrease by Rs.51.78 lakhs)]
The sensitivity analysis presented above may not be representative of the actual change in the defined benefit obligation as it is
likely that the change in assumptions would occur in isolation of one another as some of the assumptions may be correlated.
In presenting the above sensitivity analysis, the present value of the defined benefit obligation has been calculated using the
projected unit credit method at the end of the reporting period, which is same as applied in calculating the defined benefit
obligation liability recognised in the balance sheet. There was no change in the method and assumptions used in preparing the
sensitivity analysis from prior years.
44. Financial instruments
44.01 Capital management
The Group manages its capital to ensure that entities in the Group will be able to continue as going concerns while maximising
the return to stakeholders through the optimisation of the debt and equity balance. The Capital structure of the Group consists
of net debt (borrowings as detailed in notes 21 and 24 offset by cash and bank balances) and the total equity of the Group.
The Group manages its capital structure and makes adjustments in light of changes in economic conditions and the
requirements of the financial covenants. To maintain or adjust the capital structure, the Group may adjust the dividend
payment to shareholders, return capital to shareholders or issue new shares. The Group monitors capital using a gearing ratio,
which is net debt divided by total capital plus net debt.
Gearing Ratio
The gearing ratio at end of the reporting period was as follows As at As at
31.03.2018 31.03.2017
Rs. lakhs Rs. lakhs
Debt 39,999.76 56,353.15
Cash and bank balances 2,189.41 4,832.53
Net debt 37,810.35 51,520.62
Total equity (20,037.07) (8,091.87)
Net debt to equity ratio (1.89) (6.37)
44.02 Financial risk management objectives and policies
The Group’s principal financial liabilities, other than derivatives, comprise loans and borrowings and trade and other payables.
The Group’s principal financial assets include loans, trade and other receivables, and cash and short-term deposits that derive
directly from its operations. The Group also holds FVTOCI investments and enters into derivative transactions. The Group is
exposed to market risk (including currency risk, interest rate risk and other price risk), credit risk and liquidity risk.
44.03 Market risk
Market risk is the risk that the fair value of future cash flows of a financial instrument will fluctuate because of changes in
market prices. The Group’s activities expose it primarily to the financial risks of changes in foreign currency exchange rates and
interest rates. The Group enters into a variety of deriving financial instruments to manage its exposure to foreign currency risk
and interest rate risk, including:
forward foreign exchange contracts to hedge the exchange rate risk arising on the imports in Indian operations of the
Company and exports from York Transport Equipment Asia Pte Limited, Singapore; and
interest rate swaps to mitigate the risk of rising interest rates in Indian operations of the Company.

189
Notes forming part of the financial statements
for the year ended March 31, 2018
44.04 Foreign currency risk management
The Group enter into sale and purchase transactions and borrowings denominated in foreign currencies; consequently,
exposures to exchange rate fluctuations arise.
The carrying amounts of the Group’s foreign currency denominated monetary assets and monetary liabilities at the end of the
reporting period are as follows:
Monetary liabilities Monetary assets
As at As at As at As at
31.03.2018 31.03.2017 31.03.2018 31.03.2017
Rs. lakhs Rs. lakhs Rs. lakhs Rs. lakhs
US Dollar 1,790.07 7,471.32 1,563.32 7,028.83
Euro in India 107.36 259.31 165.99 36.16
Singapore Dollar 1,492.91 1,435.99 440.79 589.90
British Pound 8.48 0.07 185.67 368.56
Srilankan Rupee 492.76 223.12 505.44 477.98
Indian Rupees 131.47 131.38 - -
Australian Dollar - 3.57 - 10.43
Chinese Yuan - 483.97 - 5.64
Other foreign currencies - 45.99 - 6.47
4,023.05 10,054.72 2,861.21 8,523.97
Foreign currency sensitivity analysis
The following table details the Group’s sensitivity to a 10% increase and decrease in exchange rate between the pairs of
currencies. The sensitivity analysis includes only outstanding foreign currency denominated monetary items and adjusted
their translation at the period end for 10% change in foreign currency rates. The sensitivity analysis includes trade payables,
receivables, external loans as well as loans within the Group where the denomination of the monetary item is in a currency
other than the functional currency of the lender or the borrower.
Year ended
31.03.2018
Rs. lakhs
Year ended
31.03.2017
Rs. lakhs
INR Vs USDImpact on profit and loss for the year (60.31) 253.61
Impact on total equity as at the end of the reporting period 37.69 170.54
INR Vs SGDImpact on profit and loss for the year 44.08 41.22
Impact on total equity as at the end of the reporting period 44.08 26.96
INR Vs EuroImpact on profit and loss for the year (9.09) 0.49
Impact on total equity as at the end of the reporting period (9.09) 0.32
INR Vs GBPImpact on profit and loss for the year (0.22) 0.29
Impact on total equity as at the end of the reporting period (0.22) 0.19
USD Vs AUDImpact on profit and loss for the year - 0.69
Impact on total equity as at the end of the reporting period - 0.57
USD Vs EuroImpact on profit and loss for the year (1.08) 0.16
Impact on total equity as at the end of the reporting period (0.78) 0.12

Fifty Fifth Annual Report 2017-18
190
Notes forming part of the financial statements
for the year ended March 31, 2018
Year ended
31.03.2018
Rs. lakhs
Year ended
31.03.2017
Rs. lakhs
USD Vs GBPImpact on profit and loss for the year (0.62) (0.01)
Impact on total equity as at the end of the reporting period (0.45) (0.01)
USD Vs LKRImpact on profit and loss for the year 1.25 26.25
Impact on total equity as at the end of the reporting period 0.90 18.90
USD Vs RMBImpact on profit and loss for the year - (47.83)
Impact on total equity as at the end of the reporting period - (39.70)
GBP Vs EuroImpact on profit and loss for the year 16.03 3.45
Impact on total equity as at the end of the reporting period 12.83 2.76
SGD Vs USDImpact on profit and loss for the year 200.08 157.45
Impact on total equity as at the end of the reporting period 200.08 157.52
SGD Vs LKRImpact on profit and loss for the year 0.02 0.02
Impact on total equity as at the end of the reporting period 0.02 0.02
SGD Vs GBPImpact on profit and loss for the year 18.57 36.56
Impact on total equity as at the end of the reporting period 18.57 36.56
44.05 Interest rate risk management
The Group is exposed to interest rate risk because entities in the Group borrow funds at both fixed and floating interest rates.
The risk is managed by the Group by maintaining an appropriate mix between fixed and floating rate borrowings and by the
use of interest rate swap contracts.
44.06 Credit risk management
Credit risks refers to risk that a counterparty will default on its contractual obligations resulting in financial loss to the Group.
The Group has adopted policy of only dealing with creditworthy counterparties and obtaining sufficient collateral, where
appropriate, as a means of mitigating the risk of financial loss from defaults. The Company mainly transacts with Government
agencies and Enterprises owned by Central and State Governments. Other entities in the Group only transact with entities
that are rated the equivalent of investment grade and above. The Group uses other publicly available financial information
and its own trading records to rate its major customers. The Group’s exposure and the credit ratings of the counterparties
are continuously monitored and the aggregate value of transactions concluded is spread amongst approved counterparties.
Credit exposure is controlled by counterparty limits that are reviewed and approved by the risk management committee
annually.
Trade receivables consist of a large number of customers, spread across diverse industries and geographical areas. On going
credit evaluation is performed on the financial condition of accounts receivable.
The credit risk on bank balances and derivative financial instruments is limited because the counterparties are banks with high
credit ratings.
44.07 Liquidity risk management
The responsibility for managing liquidity risk rests with the board of directors, which has established an appropriate liquidity
risk management framework for the management of Group’s short-term, medium and long-term funding and liquidity

191
Notes forming part of the financial statements
for the year ended March 31, 2018
management requirements. The Group manages liquidity risk by maintaining adequate reserves, banking facilities and reserve
borrowing facilities, by continuously monitoring forecast and actual cash flows, and by matching the maturity profiles of
financial assets and liabilities
i) Liquidity and interest risk tables
The following tables detail the maturity profile of Group’s non-derivative financial liabilities with agreed repayment period. The
tables have been drawn up based on the undiscounted cash flows of financial liabilities based on the earliest date on which
the Group can be required to pay.
Carrying
amount
Contracted
Cash Flows
Less than 1
month
1 - 3
months
3 months
to 1 year
1 to 5
years
> 5 years
As at 31.03.2018
Borrowings 39,836.53 41,112.90 27,772.20 4,112.67 5,599.16 3,628.87 -
Finance lease liability 15.80 17.15 - 2.75 8.83 5.57 -
Derivative liabilities 5.30 5.30 - - 5.30 - -
Trade Payables 30,865.27 30,865.27 21,425.78 6,963.82 118.03 2,357.63 -
Other financial liabilities 393.77 393.77 368.76 25.01 - - -
71,116.67 72,394.39 49,566.74 11,104.25 5,731.32 5,992.07 -
As at 31.03.2017
Borrowings 56,075.09 58,702.66 27,437.08 6,569.12 7,792.06 16,904.40 -
Finance lease liability 29.44 33.47 1.34 2.68 12.04 17.41 -
Derivative liabilities 35.07 35.07 - 2.18 32.89 - -
Trade Payables 42,129.61 42,129.61 27,263.48 10,209.90 2,899.20 1,757.05 -
Other financial liabilities 300.75 300.75 297.22 3.53 - - -
98,569.96 101,201.56 54,999.12 16,787.41 10,736.19 18,678.86 -
ii) Group’s borrowing facilities
The following table details the Group’s borrowing facilities that are available for future operating activities and to settle capital
commitments.
As at As at
31.03.2018 31.03.2017
Rs. lakhs Rs. lakhs
Secured bank overdraft/working capital demand loan facility
reviewed annually and payable at call
- amount used 28,353.81 28,014.98
- amount unused 110.42 419.36
28,464.23 28,434.34
Secured loans with various maturity dates which may be
extended by mutual consent
- amount used 2,269.88 10,228.27
- amount unused 14.02 3,772.76
2,283.90 14,001.03
Secured bill acceptance facility from bank reviewed
annually and payable at call
- amount used - 705.15
- amount unused 1,000.00 294.85
1,000.00 1,000.00

Fifty Fifth Annual Report 2017-18
192
44.08 Fair value measurements
The significant accounting policies, including the criteria for recognition, the basis of measurement and the basis on which
income and expenses are recognised, in respect of each class of financial asset, financial liability and equity instrument are
disclosed in note 2.19 to 2.21.
Financial assets and Liabilities
The following table summarises financial assets and liabilities measured at fair value on a recurring basis and financial assets
and financial liabilities that are not measured at fair value on a recurring basis (but fair value disclosure are required):
Fair Value
through
Profit and
Loss
As at March 31, 2018
Total Fair
ValueFair Value
through
OCI
Amortised
CostTotal
Carrying
Value
Financial Assets:
Investment in Joint venture - - 1,842.86 1,842.86 1,842.86
Other Investment in quoted equity instrument - 47.28 - 47.28 47.28
Other Investment in unquoted equity instrument - 0.28 - 0.28 0.28
Trade receivables - - 38,021.34 38,021.34 38,021.34
Cash and cash equivalents - - 1,421.31 1,421.31 1,421.31
Other bank balances - - 768.10 768.10 768.10
Other financial assets - - 1,055.13 1,055.13 1,055.13
Derivative assets 96.39 - - 96.39 96.39
Total 96.39 47.56 43,108.74 43,252.69 43,252.69
Financial Liabilities
Trade payable - - 30,865.27 30,865.27 30,865.27
Long term borrowings - - 3,404.55 3,404.55 3,404.55
Short Term borrowings - - 29,623.70 29,623.70 29,623.70
Derivative financial liabilities 5.30 - - 5.30 5.30
Other financial liabilities - - 7,217.85 7,217.85 7,217.85
Total 5.30 - 71,111.37 71,116.67 71,116.67
Fair Value
through
Profit and
Loss
As at March 31, 2017 Total Fair
ValueFair Value
through
OCI
Amortised
Cost
Total
Carrying
Value
Financial Assets:
Investment in Joint venture - - 1,735.76 1,735.76 1,735.76
Other Investment in quoted equity instrument - 36.06 - 36.06 36.06
Other Investment in unquoted equity instrument - 0.28 - 0.28 0.28
Trade receivables - - 55,156.82 55,156.82 55,156.82
Cash and cash equivalents - - 4,573.61 4,573.61 4,573.61
Other bank balances - - 258.92 258.92 258.92
Other financial assets - - 3,561.58 3,561.58 3,561.58
Derivative assets 270.39 - - 270.39 270.39
Total 270.39 36.34 65,286.69 65,593.42 65,593.42
Financial Liabilities
Trade payable - - 42,129.61 42,129.61 42,129.61
Long term borrowings - - 15,924.83 15,924.83 15,924.83
Short Term borrowings - - 31,944.37 31,944.37 31,944.37
Derivative financial liabilities 35.07 - - 35.07 35.07
Other financial liabilities - - 8,536.08 8,536.08 8,536.08
Total 35.07 - 98,534.89 98,569.96 98,569.96
Notes forming part of the financial statements
for the year ended March 31, 2018

193
Notes forming part of the financial statements
for the year ended March 31, 2018
Fair Value hierarchy
The fair value hierarchy is based on inputs to valuation techniques that are used to measure fair value that are either observable
or unobservable and consists of the following three levels:
or liability, either directly (i.e. as prices) or indirectly (i.e. derived from prices).
or in part using a valuation model based on assumptions that are neither supported by prices from observable current
market transactions in the same instrument nor are they based on available market data.
The investments included in Level 2 of fair value hierarchy have been valued using quotes available for similar assets and
liabilities in the active market. The investments included in Level 3 of fair value hierarchy have been valued using the cost
approach to arrive at their fair value. The cost of unquoted investments approximate the fair value because there is a wide
range of possible fair value measurements and the cost represents estimate of fair value within that range.
The following table summarises financial assets and liabilities measured at fair value on a recurring basis and financial assets
that are not measured at fair value on a recurring basis (but fair value disclosure are required):
Rs. lakhs
As at March 31, 2018Total
Level 1 Level 2 Level 3
Financial assets:
Derivative financial assets - 96.39 - 96.39
Other investments classified as fair value through OCI - Non
current
47.28 - 0.28 47.56
47.28 96.39 0.28 143.95
Financial Liabilities
Derivative financial liabilities - 5.30 - 5.30
- 5.30 - 5.30
47.28 91.09 0.28 138.65
As at March 31, 2017Total
Level 1 Level 2 Level 3
Financial assets:
Derivative financial assets - 270.39 - 270.39
Other investments classified as fair value through OCI - Non
current
36.06 - 0.28 36.34
36.06 270.39 0.28 306.73
Financial Liabilities
Derivative financial liabilities - 35.07 - 35.07
- 35.07 - 35.07
36.06 235.32 0.28 271.66

Fifty Fifth Annual Report 2017-18
194
Notes forming part of the financial statements
for the year ended March 31, 2018
45. Related party transactions
Balances and transactions between the Company and its subsidiaries, which are related parties of the Company, have been
eliminated on consolidation and hence are not disclosed. Details of transactions between the Group and other related parties are
disclosed below:
45.01 List of related parties and relationship
Name of the related party Nature of Relationship
Adithya Automotive Applications Private Limited
(Ceased to be a jointly controlled entity w.e.f 4th Feb, 2018 ) Jointly Controlled Entity
Tata International DLT Private Limited
Tata Steel Limited Promoter Company holding more than 20%
Key Managerial Person
Mr Sanjay Rajoria Managing Director ( w.e.f 01-02-2018 )
Mr P S Reddy Managing Director ( Till 31-01-2018 )
Mr Sandip Biswas
Non Executive Directors
Mr Ranaveer Sinha
Mr Dipankar Chatterjee
Mr Sabyasachi Hajara
Ms Neera Saggi
Mr Rajesh Ranjan Jha
Mr Dibyendu Bose
45.02 Trading transactions
Sale of Goods and
Services
Purchase of goods and
Services
Other transactions
For the
Year ended
31.03.2018
For the
Year ended
31.03.2017
For the
Year ended
31.03.2018
For the
Year ended
31.03.2017
For the
Year ended
31.03.2018
For the
Year ended
31.03.2017
Rs. lakhs Rs. lakhs Rs. lakhs Rs. lakhs Rs. lakhs Rs. lakhs
Goods
Tata Steel Limited 5,861.17 6,380.35 1,563.78 1,349.38 - -
Tata International DLT Private Limited 13,745.46 6,122.72 - - - -
Services
Tata Steel Limited - - 678.20 404.26 - -
Expenses charged
Adithya Automotive Applications
Private Limited
- - - - - 2.32
Dividend received
Adithya Automotive Applications
Private Limited
- 285.60
Tata International DLT Private Limited - 102.48
Compensation of key management personnel
Short-term benefits 63.96 61.49
Post-employment benefits 6.49 5.53
70.45 67.02

195
Notes forming part of the financial statements
for the year ended March 31, 2018
Sitting fees to non-executive Directors
Mr Ranaveer Sinha 5.75 6.25
Mr Dipankar Chatterjee 8.25 8.25
Mr Sabyasachi Hajara 9.76 8.65
Ms Neera Saggi 8.50 8.00
45.03 Outstanding balances at the end of the reporting period
Amounts owed by related parties Amounts owed to related parties
As at As at As at As at
31.03.2018 31.03.2017 31.03.2018 31.03.2017
Rs. lakhs Rs. lakhs Rs. lakhs Rs. lakhs
Trade receivables
Tata Steel Limited 1,430.17 1,303.74
Tata International DLT Private Limited 2,038.67 1,012.20
Other recoverable
Adithya Automotive Applications Private Limited - 5.54
Trade payables
Tata Steel Limited 544.97 640.48
Claims against the company not acknowledged as debt
Tata Steel Limited (Net of advances) 3,089.92 2566.08
As at As at
31.03.2018 31.03.2017
Rs. lakhs Rs. lakhs
46. Commitments
Capital Commitments
Estimated amount of contracts remaining to be executed on capital account and not provided for 129.92 91.70
47. Contingent liabilities
a) Sales tax matters in dispute relating to issues of applicability and classification 2,607.26 2,559.00
In respect of the above sales tax matters in dispute, the Company has deposited Rs. 124.89
lakhs (31.03.2017: Rs.110.52 lakhs,) against various orders, pending disposal of the appeals.
This amount is included under Note 9 - Other non-current assets.
b) Excise duty and service tax matters in dispute relating to applicability and classification 4,631.97 4,058.16
In respect of the above excise and service tax matters in dispute, the Company has deposited
Rs. 172.23 lakhs (31.03.2017: Rs 154.37 lakhs) against various orders, pending disposal of
the appeals. This amount is included under Note 9 - Other non-current assets.
c) Income tax matters in dispute 4,502.01 4,616.61
d) Claims against the Company not acknowledged as debt
(Primarily of liquidated damages and other claims made by customers) 6,512.34 8,599.34
e) Bank guarantee 137.76 117.36
f ) Others 33.42 38.97
Future cash outflows in respect of above matters are determinable only on receipt of
judgements / decisions pending at various forums / authorities.

Fifty Fifth Annual Report 2017-18
196
Notes forming part of the financial statements
for the year ended March 31, 2018
48. Details of contract revenue and costs as per Ind AS 11 - Construction contracts Year ended Year ended
31.03.2018 31.03.2017
Rs. lakhs Rs. lakhs
a) Contract revenue recognised as revenue during the year 23,006.29 35,499.32
b) Aggregate amount of contract costs incurred and recognised profits
(net of recognised losses) upto the reporting period 372,050.48 359,150.15
c) Advances received for contracts in progress (Unadjusted) 1,637.51 3,262.78
d) Retention money under contracts in progress 26,799.59 24,903.02
e) Gross amount due from customers for contract work (asset) 139.03 650.65
f ) Gross amount due to customers for contract work (liability) 12,177.04 11,791.29
49. Provision for warranty* Year ended Year ended
31.03.2018 31.03.2017
Rs. lakhs Rs. lakhs
a) Opening balance as at beginning of the year 443.33 411.25
b) Provision recognised during the year 85.94 356.62
c) Provision utilised for meeting warranty costs (64.02) (296.32)
d) Exchange difference on consolidation 20.38 (28.22)
e) Provision classified as held for sale ( Opening ) (148.09)
f ) Closing balance as at the end of the year 337.54 443.33
* Warranty Provision of Rs. 368.69 lakhs shown in Note 22 (c) includes other provision of Rs. 31.15 lakhs.
50. Provision has been made for material foreseeable losses, if any, on long-term contracts including derivative contracts as at
March 31, 2018. Refer Note 36.
51. As at 31st March 2018, TRF Singapore Pte Ltd’s investment in a subsidiary , Dutch Lanka Trailer Manfacturers Limited is carried at net
book value of S$ 20,041,421 on the Company’s balance sheet included in the financial information.No further impairment has been
provided against this carrying amount as the directors are of the view that the carrying amount is recoverable.
52. The management of Dutch Lanka Trailer Manufacturers Limited is commited to transfer the shares of Dutch Lanka Trailer LLC Salah
Sultanate of Oman shares held by Dutch Lanka Trailer Manufacturers Limited to the Joint Venture Partner. Necessary approvals have
been obtained from the Board of Investment of Sri Lanka on 18th January 2018 and Exchange Control Department on 02 February
2018.The management is finalizing the shares transfer agreement to submit to the Department of Registrar of Companies along
with other deliverables required fo the process. In preparing the Consolidated Financial Statement line by line consolidation of the
liabilties (USD 28,098) and assets (USD 120,165) pertaining to Dutch Lanka Trailers LLC has been done.
53. a) The Company has incurred loss after tax of Rs 14,597.65 lakhs during the the year ended March 31, 2018, (March 31, 2017:
Rs 2,691.10 lakhs) and accumulated losses as of the Balance Sheet date amounting to Rs 35,043.77 lakhs, (March 31, 2017 Rs
20,434.96 lakhs) has eroded the net worth of the company. The company expects to generate cash flow from improvements
in operations resulting from favourable macroeconomic condition, increased business with the promoter entity, increased
activities in the product segment, increased efficiencies from the project activities (refer note 53(b), proceeds from restructuring
of its subsidiaries including the ones for which the company has non-binding offers and renewal of the facilities from banks
as an when they fall due etc. which will be sufficient to meet future obligation of the company. Accordingly, these financial
statements have been prepared on a going concern basis.

197
Notes forming part of the financial statements
for the year ended March 31, 2018
b) Revenue from contracts are recognized on percentage completion method specified under Ind AS 11 - Construction Contracts.
The estimated cost to complete the contracts is arrived at based on technical data, forecast, assumptions and contingencies
and are based on the current market price or firm commitments, as applicable. Such estimates / assumptions may be subject to
variations but the management has implemented necessary steps and strengthened the internal controls around estimation
process which is expected to bring down the fluctuations in the estimated costs.
c) Trade Receivable include Rs 820.52 lakhs (net of advance/provision etc.) due from a customer of the Holding company ,who
is under stress. Considering the relationship with the customer/criticality of products sold to them etc., as applicable, the
management feels that the said receivables are good and recoverable and carrying amount of the same are appropriate.
d) No provision has been made for liquidated damages and other claims by certain customers, wherever these have been refuted
by the Holding Company and the management expects to settle them without any loss. Pending settlement of these claims,
they have been disclosed under contingent liabilities as “Claims against the Company not acknowledged as debt”. [Refer Note
42.(e)]. The related sundry debtors balances have been considered in the financial statements as fully recoverable.
54. Disclosure in terms of G.S.R.307(E) read with G.S.R.308(E) dated 30th March, 2017 issued by the Ministry of Corporate
Affairs, Government of India.
The details of the specified bank notes (SBNs) held and transacted by the Company and its subsidiaries during the period from
November 8, 2016 to December 30, 2016 are as follows:
Rs. lakhs
Particulars Specified Other Total
Bank Notes denomination amount
Closing cash in hand as on November 8, 2016 11.20 5.34 16.54
Add : Permitted receipts 0.17 32.56 32.73
Less : Permitted payments - 31.45 31.45
Less : Amount deposited in Banks 11.37 - 11.37
Closing cash in hand as on December 30, 2016 - 6.45 6.45

Fifty Fifth Annual Report 2017-18
198
55. Additional information to the financial statements
Statement of net assets, Share of profit and loss, Share of other and total comprehensive income Rs. lakhs
Net Assets, ie., total assets
minus total liabilities
Share in profit and loss Share of other
comprehensive income
Share of total
comprehensive income
As % of
consolidated net
assets
Amount As % of
consolidated
profit and loss
Amount As % of
consolidated
other
comprehensive
income
Amount As % of
consolidated
total
comprehensive
income
Amount
A. Parent
TRF Limited INR (69.8%) (18,976.45) 114.6% (14,597.65) 0.0% 0.07 124.2% (14,597.58)
B. Subsidiaries
a) Indian
1. YORK Transport Equipment India
Pvt. Ltd
INR 23.8% 6463.76 (9.8%) 1,246.71 (0.3%) (3.36) (10.6%) 1,243.35
b) Foreign
1. TRF Singapore Pte Ltd SGD 83.6% 22,719.70 2.3% (294.04) 136.2% 1,341.26 (8.9%) 1,047.22
2. TRF Holding Pte Ltd USD (15.4%) (4,177.39) 4.5% (573.97) (1.0%) (10.02) 5.0% (583.99)
3. YORK Transport Equipment (Asia)
Pte Ltd*
USD 47.2% 12,822.99 (4.1%) 519.26 (32.3%) (318.12) (1.7%) 201.14
4. YORK Transport Equipment Pty Ltd AUD (2.6%) (712.56) (0.2%) 26.31 0.0% - (0.2%) 26.31
5. YORK Sales (Thailand) Co. Ltd THB 7.2% 1,952.53 (0.5%) 58.87 0.0% - (0.5%) 58.87
6. YTE Transport Equipment (SA) (Pty)
Limited
ZAR 0.2% 65.65 (0.3%) 41.20 0.0% - (0.4%) 41.20
7. Rednet Pte Ltd. USD (2.2%) (592.08) 0.0% (3.21) 0.0% - 0.0% (3.21)
8. PT YORK Engineering IDR (0.7%) (188.21) 0.0% - 0.0% - 0.0% -
9. YTE Special Products Pte Ltd USD 2.0% 548.89 1.1% (139.27) 0.0% - 1.2% (139.27)
10. Qingdao YTE Special Products Co. Ltd RMB (8.3%) (2,249.91) 3.2% (409.07) 0.0% - 3.5% (409.07)
11. YORK Transport Equipment
(Shanghai) Co. Ltd
RMB 6.1% 1,651.89 0.7% (83.65) 0.0% - 0.7% (83.65)
12. Dutch Lanka Trailer Manufacturers
Limited
LKR 4.4% 1,203.01 (0.1%) 18.00 (15.4%) (152.16) 1.1% (134.16)
13. Dutch Lanka Engineering Pvt Ltd LKR 1.7% 473.09 (0.4%) 53.35 0.2% 1.60 (0.5%) 54.93
14. Dutch Lanka Trailers Manufactures
LLC
OMR 0.6% 151.02 0.0% - 0.0% - 0.0% -
15. Hewitt Robins International Ltd GBP 15.0% 4,085.30 (4.4%) 556.86 12.6% 124.35 (5.8%) 681.21
16. Hewitt Robins International Holding
Ltd
GBP 0.3% 68.38 0.0% - 0.0% - 0.0% -
Notes forming part of the financial statements
for the year ended March 31, 2018

199
Net Assets, ie., total assets
minus total liabilities
Share in profit and loss Share of other
comprehensive income
Share of total
comprehensive income
As % of
consolidated net
assets
Amount As % of
consolidated
profit and loss
Amount As % of
consolidated
other
comprehensive
income
Amount As % of
consolidated
total
comprehensive
income
Amount
C. Joint Venture
a) Indian
1. Tata International DLT Private Limited INR 6.9% 1,867.03 (5.8%) 743.16 0.2% 1.95 (6.3%) 745.11
2. Adithya Automotive Applications Private
Limited (discontinued and disposed of )
INR 0.0% - (0.8%) 96.96 (0.0%) (0.46) (0.8%) 96.50
Total 100.0% 27,176.64 100.0% (12,740.20) 100.0% 985.11 100.0% (11,755.09)
D. Adjustments due to Consolidation (47,258.99) (671.14) 460.89 (210.26)
E. Minority Interest
a) Foreign subsidiary
1. Dutch Lanka Trailers Manufactures LLC OMR 45.28 - - - -
F. Consolidated Net Assets/Profit/(Loss)
after tax
(20,037.07) (13,411.35) 1,446.00 (11,965.35)
*Note: In terms of the Share Purchase Agreement dated March 21, 2018, the Group has decided to divest its entire stake in York Transport
Equipment (Asia) Pte Ltd.
56. Previous year’s figures have been regrouped / reclassified where necessary to correspond with the current year’s classification /
disclosure.
57. Approval of financial statements.
The financial statements were approved for issue by the Board of Directors on April 24, 2018.
In terms of our report of even date For and on behalf of the Board of Directors
For Price Waterhouse & Co Chartered Accountants LLP Sandip Biswas Sanjay Rajoria
Chartered Accountants Chairman Managing Director
Firm Registration No: 304026E / E-300009
Sougata Mukherjee K. S. Mathai Mathew Tarun Kr. Srivastava
Partner (Membership no: 057084) Chief Financial Officer Company Secretary
Jamshedpur Mumbai
24th April, 2018 24th April, 2018
Notes forming part of the financial statements
for the year ended March 31, 2018


