trends over time in underlying causes of death in the d:a:d study from 1999 to 2011 cj smith, l...
TRANSCRIPT

Trends over time in underlying causes of death in the D:A:D
Study from 1999 to 2011
CJ Smith, L Ryom, R Weber, P Morlat, C Pradier, P Reiss, J Kowalska, N Friis-Moeller, AN Phillips,
CA Sabin, JD Lundgren
for the D:A:D Study Group

Background
• In settings with access to ART, dramatic reductions in AIDS-related mortality have led to increased survival
• HIV positive individuals may therefore experience a wider range of complications (AIDS vs. non-AIDS) than in previous years
• It is increasingly important to accurately classify both AIDS-related and non-AIDS related causes of death, and to monitor trends over time
Aim
• To investigate trends over time in the rates of all-cause and cause-specific mortality in the D:A:D Study in 1999-2011

Methods – Study participants
• Participants included from the Data collection on Adverse events of anti-HIV Drugs (D:A:D) Study: a collaboration of 11 cohorts from Europe, USA and Australia
• Prospective follow-up for individuals began from 1999 onwards
• All clinical outcomes, including deaths, are reported in real time, and are centrally validated and categorised
• From 2004 onwards, deaths were reported using the CoDe form*
*see www.cphiv.dk

Methods – Participant follow-up
• Individuals were followed from D:A:D entry to the first of:• Death• Six months after last clinic visit• 1st February 2011
• The primary (underlying) cause of death was considered
• Causes of death were grouped for analysis:A. AIDS-relatedB. Cardiovascular disease (CVD) relatedC. Liver disease related a
D. Non-AIDS Malignancies (NADM) related b
E. Other/Unknown
a Deaths related to chronic viral hepatitis / liver failure not related to viral hepatitisb non-AIDS, non-HCV, non-HBV related malignancies

Methods – Statistical analysis
• Relative rates of the association of calendar time with all cause mortality and with each specific cause of death were calculated
• Relative rates were then calculated using Poisson regression, adjusting for factors that have potentially changed over time
• Factors included:• Fixed: Age, gender, ethnicity, mode of HIV acquisition• Time-updated: HBV status, HCV status, smoking status,
diabetes, hypertension, HIV RNA, BMI, CD4 count

Baseline characteristics 1
HIV positive individuals (%)
Number 49734 (100)
Gender Male 36701 (74)
Age (years) Median (IQR) 38 (32, 45)
Mode of HIV acquisition IDU 7631 (15)
Heterosexual 16133 (32)
Other 4069 (8)
MSM 21901 (44)
HCV positivea Yes 6449 (13)
HBV positiveb Yes 5425 (11)
Smoking status Current 17109 (34)
Former 8521 (17)
Never 12294 (25)
Unknown 11810 (24)a HCV antibody positive; b HBsAg positive, HBeAg positive or HBV DNA positive/anti-Hbe positive

Baseline characteristics 2
HIV positive individuals (%)
Number 49734 (100)
BMI (kg/m2) Median (IQR) 23.0 (21.0, 25.3)
Hypertensionc Yes 7861 (16)
Diabetesd Yes 1260 (3)
Total cholesterol (mmol/l) Median (IQR) 4.7 (4.0, 5.7)
Previous AIDS diagnosis Yes 10463 (21)
CD4 (cells/mm3) Median (IQR) 400 (242, 590)
Exposure to ART Yes 30400 (61)
Exposure to PI Yes 20362 (41)
Exposure to NNRTI Yes 14447 (29)
c Systolic BP >140 mmHg; Diastolic BP>90 Hg; or receiving anti-hypertensivesd Centrally validated endpoint: see www.cphiv.dk

Overall death rate
3,802 deaths in 49,734 HIV positive individuals followed for 304,695 person-years
Rate: 12.5 per 1,000 person-years
95% CI: 12.1 to 12.9

Rel
ativ
e ra
te (9
5% C
I)
2009-2011
Association between calendar year and mortality: All causes
1999/2000
2001/2002
2003/ 2004
2005/2006
2007/2008
Calendar year
5
Unadjusted
Incidence : 17.4 17.0 15.8 12.0 10.0 8.3(per 1000 pyrs)
3
2
4
1
0.1
0.5

Rel
ativ
e ra
te (9
5% C
I)
2009-2011
Association between calendar year and mortality: All causes
1999/2000
2001/2002
2003/ 2004
2005/2006
2007/2008
Calendar year
* Adjusted for: age, gender, ethnicity, mode of HIV acquisition (fixed) and HBV, HCV, smoking, diabetes, hypertension, HIV RNA, BMI, CD4 count (time-updated)
Unadjusted Adjusted*
5
3
2
4
1
0.1
0.5

Causes of death in the D:A:D Study
N (%)
Total 3802 (100)
AIDS 1094 (29)Liver-related 499 (13)
Chronic viral hepatitis 432 (11)Liver failure 67 (2)
CVD-related 421 (11)Myocardial Infarction 218 (6)
Stroke 55 (1.4)Other CVD 55 (1.4)
Other heart disease 85 (2)Diabetes mellitus
complications 8 (0.2)Non-AIDS cancer
535 (14)
N (%)
Other/ Unknown 1253 (33)Non-AIDS infections 277 (8)
COPD 27 (0.7)Pancreatitis 20 (0.5)
Renal dysfunction/disease 50 (1.3)Suicide 151 (4)
Drug overdose 106 (3)Accident 72 (2)
Homicide 23 (0.6)Other known*
244 (4)Unknown 283 (7)
*fewer than 20 deaths per stated cause
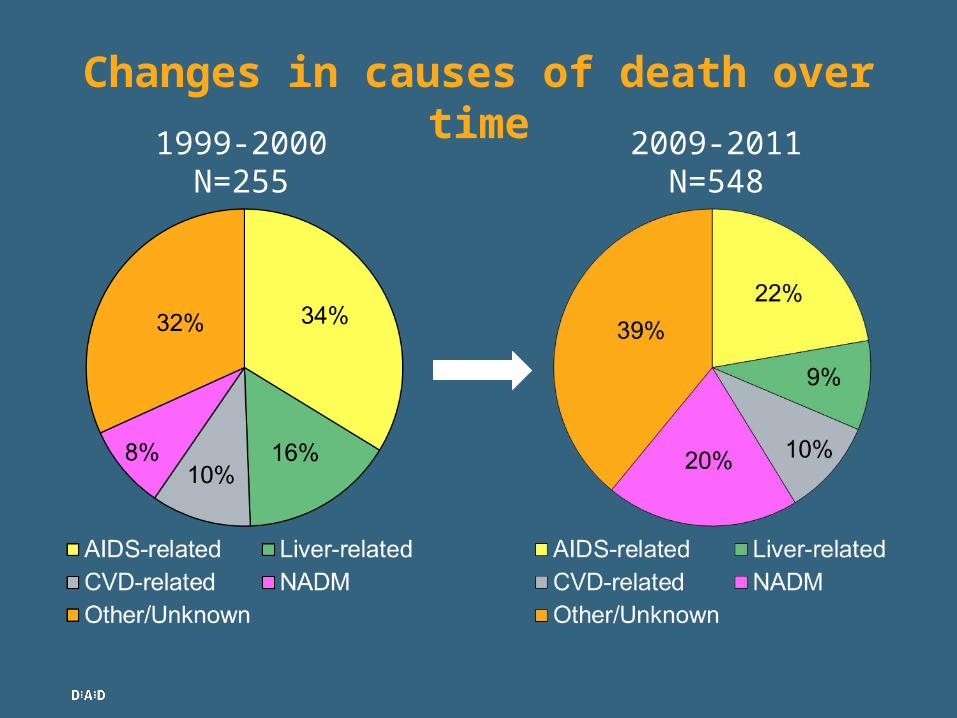
Changes in causes of death over time
1999-2000N=255
2009-2011N=548

Rel
ati
ve r
ate
(95%
CI)
2009-2011
Association between calendar year and mortality: AIDS related
1999/2000
2001/2002
2003/ 2004
2005/2006
2007/2008
Calendar year
* Adjusted for: age, gender, ethnicity, mode of HIV acquisition (fixed) and HBV, HCV, smoking, diabetes, hypertension, HIV RNA, BMI, CD4 count (time-updated)
Unadjusted
5
3
2
4
1
0.1
0.5

Rel
ativ
e ra
te (9
5% C
I)
2009-2011
Association between calendar year and mortality: AIDS related
1999/2000
2001/2002
2003/ 2004
2005/2006
2007/2008
Calendar year
* Adjusted for: age, gender, ethnicity, mode of HIV acquisition (fixed) and HBV, HCV, smoking, diabetes, hypertension, HIV RNA, BMI, CD4 count (time-updated)
Unadjusted Adjusted (all factors except CD4 count)*
Adjusted*
5
3
2
4
1
0.1
0.5

Rel
ativ
e ra
te (9
5% C
I)
2009-2011
Association between calendar year and mortality: Liver-related
1999/2000
2001/2002
2003/ 2004
2005/2006
2007/2008
Calendar year
* Adjusted for: age, gender, ethnicity, mode of HIV acquisition (fixed) and HBV, HCV, smoking, diabetes, hypertension, HIV RNA, BMI, CD4 count (time-updated)
Unadjusted
5
3
2
4
1
0.1
0.5

Rel
ativ
e ra
te (9
5% C
I)
2009-2011
Association between calendar year and mortality: Liver-related
1999/2000
2001/2002
2003/ 2004
2005/2006
2007/2008
Calendar year
* Adjusted for: age, gender, ethnicity, mode of HIV acquisition (fixed) and HBV, HCV, smoking, diabetes, hypertension, HIV RNA, BMI, CD4 count (time-updated)
UnadjustedAdjusted*
5
3
2
4
1
0.1
0.5

Rel
ativ
e ra
te (9
5% C
I)
2009-2011
Association between calendar year and mortality: Liver-related
1999/2000
2001/2002
2003/ 2004
2005/2006
2007/2008
Calendar year
* Adjusted for: age, gender, ethnicity, mode of HIV acquisition (fixed) and HBV, HCV, smoking, diabetes, hypertension, HIV RNA, BMI, CD4 count (time-updated)
Unadjusted Adjusted (all factors except HBV)*
Adjusted*
5
3
2
4
1
0.1
0.5

Rel
ativ
e ra
te (9
5% C
I)
2009-2011
Association between calendar year and mortality: Liver-related
1999/2000
2001/2002
2003/ 2004
2005/2006
2007/2008
Calendar year
* Adjusted for: age, gender, ethnicity, mode of HIV acquisition (fixed) and HBV, HCV, smoking, diabetes, hypertension, HIV RNA, BMI, CD4 count (time-updated)
UnadjustedAdjusted (all factors except HCV)*
Adjusted*
5
3
2
4
1
0.1
0.5

Rel
ativ
e ra
te (9
5% C
I)
2009-2011
Association between calendar year and mortality: CVD-related
1999/2000
2001/2002
2003/ 2004
2005/2006
2007/2008
Calendar year
Unadjusted
5
3
2
4
1
0.1
0.5

Rel
ativ
e ra
te (9
5% C
I)
2009-2011
Association between calendar year and mortality: CVD-related
1999/2000
2001/2002
2003/ 2004
2005/2006
2007/2008
Calendar year
* Adjusted for: age, gender, ethnicity, mode of HIV acquisition (fixed) and HBV, HCV, smoking, diabetes, hypertension, HIV RNA, BMI, CD4 count (time-updated)
Unadjusted Adjusted*
5
3
2
4
1
0.1
0.5

Rel
ativ
e ra
te (9
5% C
I)
2009-2011
Association between calendar year and mortality: Non-AIDS malignancy*
1999/2000
2001/2002
2003/ 2004
2005/2006
2007/2008
Calendar year
Unadjusted
* Includes lung cancers, prostate cancers, anal cancers, Hodgkin’s lymphomas, primary liver cancers, gastrointestinal cancers, breast cancers, uterus cancers, testicular cancers, bladder cancers and leukemias
5
3
2
4
1
0.1
0.5

Rel
ativ
e ra
te (9
5% C
I)
2009-2011
Association between calendar year and mortality: Non-AIDS malignancy
1999/2000
2001/2002
2003/ 2004
2005/2006
2007/2008
Calendar year
* Adjusted for: age, gender, ethnicity, mode of HIV acquisition (fixed) and HBV, HCV, smoking, diabetes, hypertension, HIV RNA, BMI, CD4 count (time-updated)
Unadjusted Adjusted*
5
3
2
4
1
0.1
0.5

Rel
ativ
e ra
te (9
5% C
I)
2009-2011
Association between calendar year and mortality: Other/Unknown
1999/2000
2001/2002
2003/ 2004
2005/2006
2007/2008
Calendar year
Unadjusted
5
3
2
4
1
0.1
0.5

Rel
ativ
e ra
te (9
5% C
I)
2009-2011
Association between calendar year and mortality: Other/Unknown
1999/2000
2001/2002
2003/ 2004
2005/2006
2007/2008
Calendar year
* Adjusted for: age, gender, ethnicity, mode of HIV acquisition (fixed) and HBV, HCV, smoking, diabetes, hypertension, HIV RNA, BMI, CD4 count (time-updated)
Unadjusted Adjusted*
5
3
2
4
1
0.1
0.5

Sensitivity analyses
• Adjustment for HIV RNA levels does not affect trends over time (once accounting for CD4 count)
• Results remain consistent when accounting for the presence of any competing risks (from the other causes of death)

Summary and discussion
• Death rates in HIV-positive people with access to care has continued to decline in the cART era
• There is no indication of any increase in risk of death from any specific cause as a potential result of long term adverse effects of ART
• This provides continued strong support for the substantial net benefits of ART
• AIDS remains the leading cause of death
• Decline in AIDS-related deaths is largely explained by improvements in CD4 count

Summary and discussion
• NADM are now the leading non-AIDS cause of death; rates have remained stable over time
• Liver and CVD-related deaths have decreased markedly, suggesting improvements in patient management
• Further work studying the impact of CVD-related interventions (e.g. statins, revascularisation) is on-going
• Continued monitoring on specific causes of death in HIV is important to allow earlier interventions in HIV case management

Steering Committee: Members indicated w/ *; ¢ chair;
Cohort PIs: W El-Sadr* (CPCRA), G Calvo* (BASS), F Dabis* (Aquitaine), O Kirk* (EuroSIDA), M Law* (AHOD), A d’Arminio Monforte* (ICONA), L Morfeldt* (HivBIVUS), C Pradier* (Nice), P Reiss* (ATHENA), R Weber* (SHCS), S De Wit* (Brussels)Cohort coordinators and data managers: S Zaheri, M Hillebreght (ATHENA), M Bruyand, S Geffard, (Aquitaine), K Petoumenos, H McManus, S Wright (AHOD), S Mateu, F Torres (BASS), M Delforge (Brussels), G Bartsch, G Thompsen (CPCRA), J Kjær (EuroSIDA), Iuri Fanti (ICONA), E Fontas, C Caissotti (Nice), A Sundström, G Thulin (HivBIVUS), M Rickenbach (SHCS)Statisticians: CA Sabin*, AN Phillips*, A Mocroft, DA Kamara, CJ SmithCommunity representative: Xavi Franquet*D:A:D coordinating office: L Ryom, R Brandt, J Tverland, JD Lundgren*¢Member of the D:A:D Oversight Committee: B Powderly*, N Shortman*, R Rode*, D Butcher*
Funding: ‘Oversight Committee for The Evaluation of Metabolic Complications of HAART’ with representatives from academia, patient community, FDA, EMEA and a consortium of ”Abbott, Boehringer Ingelheim, Bristol-Myers Squibb, Gilead Sciences, ViiV Healtcare, Merck, Pfizer, F. Hoffmann-La Roche and Janssen Pharmaceuticals
D:A:D Study Group