trends of migratory and wintering waterbirds in the wadden sea
TRANSCRIPT
1
Migratory Bird Trends until 2010/2011
Trends of Migratory and Wintering Waterbirds in the Wadden Sea 1987/1988-2010/2011
Progress Report
WADDEN SEA ECOSYSTEM No. 31 - 2013

2
Migratory Bird Trends until 2010/2011
PublishersCommon Wadden Sea Secretariat (CWSS), Wilhelmshaven, Germany;Joint Monitoring Group of Migratory Birds in the Wadden Sea (JMMB).
AuthorsJan Blew, BioConsult SH, Brinckmannstr. 31, D-25813 Husum;Klaus Günther, Schutzstation Wattenmeer, NationalparkHaus Hafen Husum, Hafenstraße 3, D - 25813 Husum;Bernd Hälterlein, Nationalparkverwaltung Schleswig-Holsteinisches Wattenmeer, Schloßgarten 1, D-25832 Tönning; Romke Kleefstra, SOVON Vogelonderzoek Nederland, Toernooiveld 1, NL-6503 GA Nijmegen;Karsten Laursen, Danmarks Miljøundersøgelser / NERI, Aarhus University, Grenåvej 12, DK 8410 Rønde;Gregor Scheiffarth, Nationalparkverwaltung Niedersächsisches Wattenmeer, Virchowstr. 1, D - 26382 Wilhelmshaven.
Title photoGundolf Reichert
DrawingsNiels Knudsen
Lay-outGerold Lüerßen
The publication should be cited as:Blew, J., Günther, K., Hälterlein, B., Kleefstra, R., Laursen,K., Scheiffarth, G. 2013. Trends of Migratory and Wintering Waterbirds in the Wadden Sea 1987/1988 - 2010/2011. Wadden Sea Ecosystem No. 31.Common Wadden Sea Secretariat, Joint Monitoring Group of Migratory Birds in the Wadden Sea,Wilhelmshaven, Germany.

3
Migratory Bird Trends until 2010/2011
Trends of Migratory and Wintering Waterbirds in the Wadden Sea
1987/1988 - 2010/2011
Joint Monitoring Group of Migratory Birds in the Wadden Sea (JMMB)
Jan BlewKlaus Günther
Bernd HälterleinRomke Kleefstra Karsten Laursen
Gregor Scheiffarth
2013Common Wadden Sea Secretariat
Trilateral Monitoring and Assessment GroupJoint Monitoring Group of Migratory Birds in the Wadden Sea
4
Migratory Bird Trends until 2010/2011
Content
Introduction 5Monitoring migratory and wintering birds, the JMMB program 5Methods and Acknowledgements 5
Trends Overview 7Proportion of Flyway Population 10Summary Trands According to indicators 11Species Accounts 15
Great Cormorant 17Eurasian Spoonbill 18Barnacle Goose 19Dark-bellied Brent Goose 20Common Shelduck 21Eurasian Wigeon 22Common Teal 23Mallard 24Northern Pintail 25Northern Shoveler 26Common Eider 27Eurasian Oystercatcher 28Pied Avocet 29Great Ringed Plover 30Kentish Plover 31European Golden Plover 32Grey Plover 33Northern Lapwing 34Red Knot 35Sanderling 36Curlew Sandpiper 37Dunlin 38Ruff 39Bar-tailed Godwit 40Whimbrel 41Eurasian Curlew 42Spotted Redshank 43Common Redshank 44Common Greenshank 45Ruddy Turnstone 46Common Black-headed Gull 47Common Gull 48Herring Gull 49Great Black-backed Gull 50
References 51Counting Units in the Wadden Sea 52Species List 54
5
Migratory Bird Trends until 2010/2011
Monitoring migratory and wintering birds, the JMMB
programThe Wadden Sea constitutes one of the world’s most important wetlands for migratory water-birds. It is the single most important staging and moulting area and an important wintering area for waterbirds on the East Atlantic Flyway from the Arctic to South Africa. The Joint Monitoring of Migratory Birds (JMMB) program is carried out in the framework of the Trilateral Monitoring and Assessment Program (TMAP), and constitutes an internationally coordinated long-term monitor-ing program. It covers a large connected eco-region stretching from Den Helder in The Neth-erlands to Esbjerg in Denmark; regular ground counts for most species and areas plus aerial counts for sea ducks involves hundreds of ob-servers and several institutes and agencies.
After the publication of trends, comprehen-sive species accounts and assessments in the most recent reports (Blew et al. 2005 and Blew et al. 2007), the JMMB group agreed, that from now on a yearly update of these trend calcula-tion shall be published on this website. Here, trends of 34 waterbird species for the interna-tional Wadden Sea and the four regions - The Netherlands, the Federal States of Germany, Niedersachsen and Schleswig-Holstein, and Den-mark will be presented.
Details of the “Joint Monitoring program of Migratory Birds in the Wadden Sea” are given in Rösner et al., (1993) and updated in Blew et al., (2005). This program, consisting of interna-tional synchronous counts, spring-tide counts and aerial counts (only Common Eider), has been carried out by all Wadden Sea countries since 1992. Some differences between the countries’ programs exist, due to different national ap-proaches and older already existing counting programs, but these do not hamper the overall goal for calculating trends. Because many usable counting data before 1992 exist as well, it has been decided to include counts back to the sea-son 1987/1988.
The area considered is the Wadden Sea Coop-eration Area. This is, in general terms, the area seaward of the main dike (or, where the main dike is absent, the spring-high-tide-water line, and in the rivers, the brackish-water limit) up to 3 nautical miles from the baseline or the offshore boundaries of the Conservation Area (Essink et al., 2005). The total area covers 14,700 km², with 4,534 km² of tidal flats.
Methods and Acknowledgements
IntroductionAs part of the JMMB program, trends of 34 waterbird species for the international Wadden Sea and the four regions - The Netherlands, the Federal States of Germany, Niedersachsen/ Ham-burg and Schleswig-Holstein, and Denmark will be presented.
Data and methodsData used in the analyses are a mixture of total counts (two internationally, up to five nation-ally) and counts of a selection of sites which are counted more frequently (12-25 times a season). At present a total of 594 counting units are de-fined in the Wadden Sea, which are included in the analyses. For this report, the original count-ing data, available at the smallest level have been used.
Trends are calculated and presented for 34 waterbird species. These are species which use the Wadden Sea during stop-over on migration or as a wintering area with large parts of their flyway population. Species which only occur in low numbers or species which cannot be counted with sufficient representativeness have been ex-cluded from the analyses (for a more detailed explanation see Rösner et al., 1994).
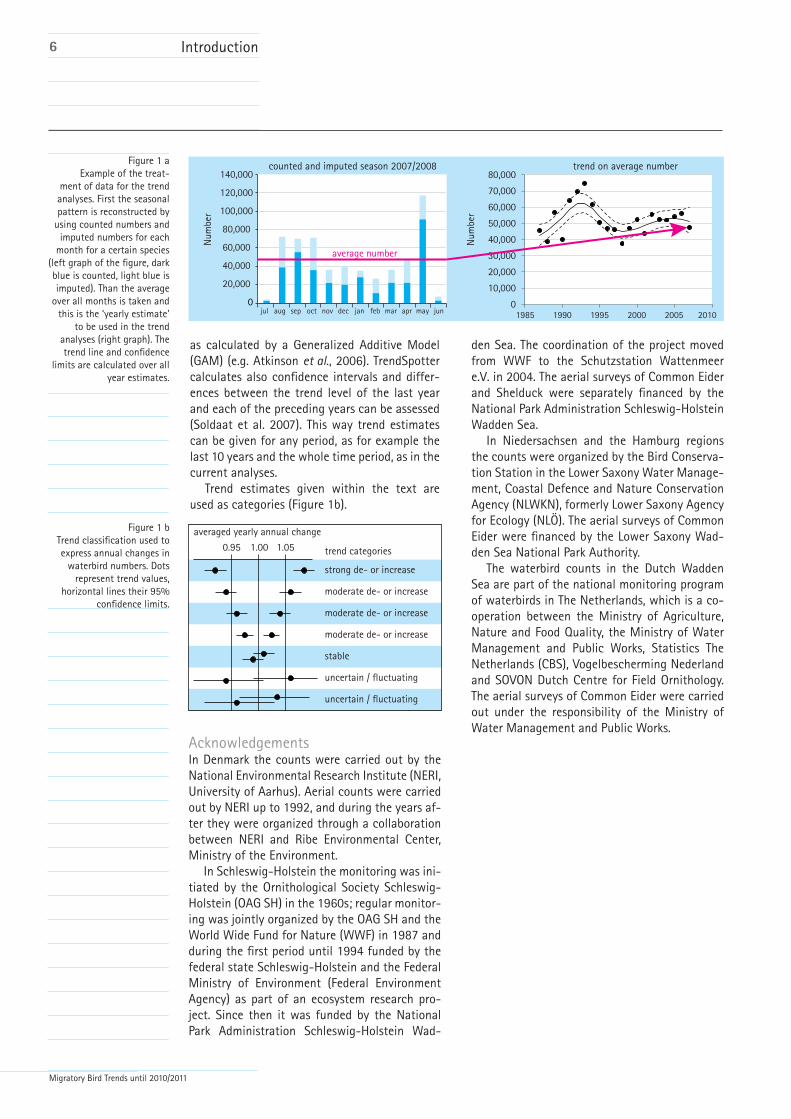
Despite a large dataset with lots of real count data available also missing counts are present. A complete dataset involves counts for all count-ing units in all months of the year. To analyse the waterbird count data, UINDEX (Bell, 1995) was used to account for missing counts in the data-set, and then TrendSpotter is applied to calcu-late trends (Visser, 2004, Soldaat et al 2007). The program UINDEX is estimating bird numbers for missing counts (imputing) taking into account site-, year- and month-factors (Underhill & Prys-Jones 1994). Sites are grouped in four regional strata representing the four different Wadden Sea “countries”. The counted and imputed values for each month are added to yearly averages for the respective “bird-years”, covering the period from July to June of the following year (Figure 1a). Af-ter that with the program TrendSpotter so-called “flexible trends” are calculated. These are par-ticularly suitable for time series data with dif-ferent periods of decreasing, stable or increasing trends (Visser 2004, Soldaat et al., 2007). A trend line calculated by TrendSpotter hardly deviates from a moving average or a smoothed trend line
Introduction
6
Migratory Bird Trends until 2010/2011
as calculated by a Generalized Additive Model (GAM) (e.g. Atkinson et al., 2006). TrendSpotter calculates also confidence intervals and differ-ences between the trend level of the last year and each of the preceding years can be assessed (Soldaat et al. 2007). This way trend estimates can be given for any period, as for example the last 10 years and the whole time period, as in the current analyses.
Trend estimates given within the text are used as categories (Figure 1b).
AcknowledgementsIn Denmark the counts were carried out by the National Environmental Research Institute (NERI, University of Aarhus). Aerial counts were carried out by NERI up to 1992, and during the years af-ter they were organized through a collaboration between NERI and Ribe Environmental Center, Ministry of the Environment.
In Schleswig-Holstein the monitoring was ini-tiated by the Ornithological Society Schleswig-Holstein (OAG SH) in the 1960s; regular monitor-ing was jointly organized by the OAG SH and the World Wide Fund for Nature (WWF) in 1987 and during the first period until 1994 funded by the federal state Schleswig-Holstein and the Federal Ministry of Environment (Federal Environment Agency) as part of an ecosystem research pro-ject. Since then it was funded by the National Park Administration Schleswig-Holstein Wad-
Figure 1 aExample of the treat-
ment of data for the trend analyses. First the seasonal pattern is reconstructed by
using counted numbers and imputed numbers for each
month for a certain species (left graph of the figure, dark blue is counted, light blue is imputed). Than the average
over all months is taken and this is the ‘yearly estimate’
to be used in the trend analyses (right graph). The trend line and confidence
limits are calculated over all year estimates.
Introduction
strong de- or increase
moderate de- or increase
moderate de- or increase
moderate de- or increase
stable
uncertain / �uctuating
uncertain / �uctuating
trend categories
averaged yearly annual change
0.95 1.00 1.05
Figure 1 bTrend classification used to express annual changes in
waterbird numbers. Dots represent trend values,
horizontal lines their 95% confidence limits.
den Sea. The coordination of the project moved from WWF to the Schutzstation Wattenmeer e.V. in 2004. The aerial surveys of Common Eider and Shelduck were separately financed by the National Park Administration Schleswig-Holstein Wadden Sea.
In Niedersachsen and the Hamburg regions the counts were organized by the Bird Conserva-tion Station in the Lower Saxony Water Manage-ment, Coastal Defence and Nature Conservation Agency (NLWKN), formerly Lower Saxony Agency for Ecology (NLÖ). The aerial surveys of Common Eider were financed by the Lower Saxony Wad-den Sea National Park Authority.
The waterbird counts in the Dutch Wadden Sea are part of the national monitoring program of waterbirds in The Netherlands, which is a co-operation between the Ministry of Agriculture, Nature and Food Quality, the Ministry of Water Management and Public Works, Statistics The Netherlands (CBS), Vogelbescherming Nederland and SOVON Dutch Centre for Field Ornithology. The aerial surveys of Common Eider were carried out under the responsibility of the Ministry of Water Management and Public Works.
trend on average number
1985 1990 1995 2000 2005 20100
10,000
20,000
30,000
40,000
50,000
60,000
70,000
80,000counted and imputed season 2007/2008
0
20,000
40,000
60,000
80,000
100,000
120,000
140,000
jul aug sep oct nov dec jan feb mar apr may jun
Num
ber
Num
ber
average number

7
Migratory Bird Trends until 2010/2011
Trends Overview
Table 1Trends until 2010/2011
- The whole 24 and last 10 years time period. The
species names in the table are sorted according to the
Euring Code.
Species
Long-term 24-years trend1987/1988 - 2010/2011
Short-term 10-year trend2000/2001 - 2010/2011
WS DK SH Nds/HH
NL WS DK SH Nds/HH
NL
Great Cormorant
Eurasian Spoonbill
Barnacle Goose
Brent Goose
Common Shelduck
Eurasian Wigeon
Common Teal
Mallard
Northern Pintail
Northern Shoveler
Common Eider no long term trend available - counts started only 1993
Eurasian Oystercatcher
Pied Avocet
Great Ringed Plover
Kentish Plover
European Golden Plover
Grey Plover
Northern Lapwing
Red Knot
Sanderling
Curlew Sandpiper
Dunlin
Ruff
Bar-tailed Godwit
Whimbrel
Eurasian Curlew
Spotted Redshank
Common Redshank
Common Greenshank
Ruddy Turnstone
Black-headed Gull
Common Gull
European Herring Gull
Great Black-backed Gull
strong increase moderate increase moderate decreasestrong decrease stable uncertain

8
Migratory Bird Trends until 2010/2011
Figure 2Trend categories for the
24-year period for the International Wadden Sea
and the four countries, calculated with TrendSpotter
on yearly estimates, ranked after trend category and
value.
Trends Overview
-100 -75 -50 -25 0 25 50 75 100 125 150
Eurasian SpoonbillGreat Cormorant
Barnacle GooseSanderling
Curlew SandpiperGreat Ringed Plover
Northern PintailRuddy Turnstone
Northern ShovelerCommon Gull
Northern LapwingBar-tailed Godwit
Eurasian CurlewCommon Greenshank
Grey PloverCommon Redshank
Eurasian WigeonDunlin
Common ShelduckBlack-headed Gull
Red KnotPied AvocetBrent Goose
WhimbrelEuropean Herring Gull
Great Black-backed GullMallard
European Golden PloverSpotted Redshank
Eurasian OystercatcherCommon Teal
Kentish PloverRuff
Changes over 24 years (1987/1988 -2010/2011) in % (without Common Eider)
stable
trend not signi�cant
strong decrease
moderate decrease
strong increase
moderate increase
1,727
448298

9
Migratory Bird Trends until 2010/2011
Figure 3Trend categories for the
10-year period for the International Wadden Sea
and the four countries, calculated with TrendSpot-
ter on yearly estimates, ranked after trend category
and value.
Trends Overview
-100 -75 -50 -25 0 25 50 75 100 125 150
Eurasian SpoonbillBarnacle Goose
SanderlingRuddy Turnstone
Great Ringed PloverCurlew Sandpiper
Eurasian CurlewNorthern Pintail
Bar-tailed GodwitNorthern Shoveler
Common GreenshankCommon RedshankNorthern LapwingCommon Shelduck
Pied AvocetBlack-headed Gull
Grey PloverRed Knot
Brent GooseDunlin
Common GullEuropean Herring Gull
Eurasian WigeonCommon Teal
Great CormorantMallard
Eurasian OystercatcherWhimbrel
European Golden PloverSpotted Redshank
Common EiderGreat Black-backed Gull
Kentish PloverRuff
Changes over recent 10 years (2001/2002-2010/2011) in %
154
stable
trend not signi�cant
strong decrease
moderate decrease
strong increase
moderate increase
10
Migratory Bird Trends until 2010/2011
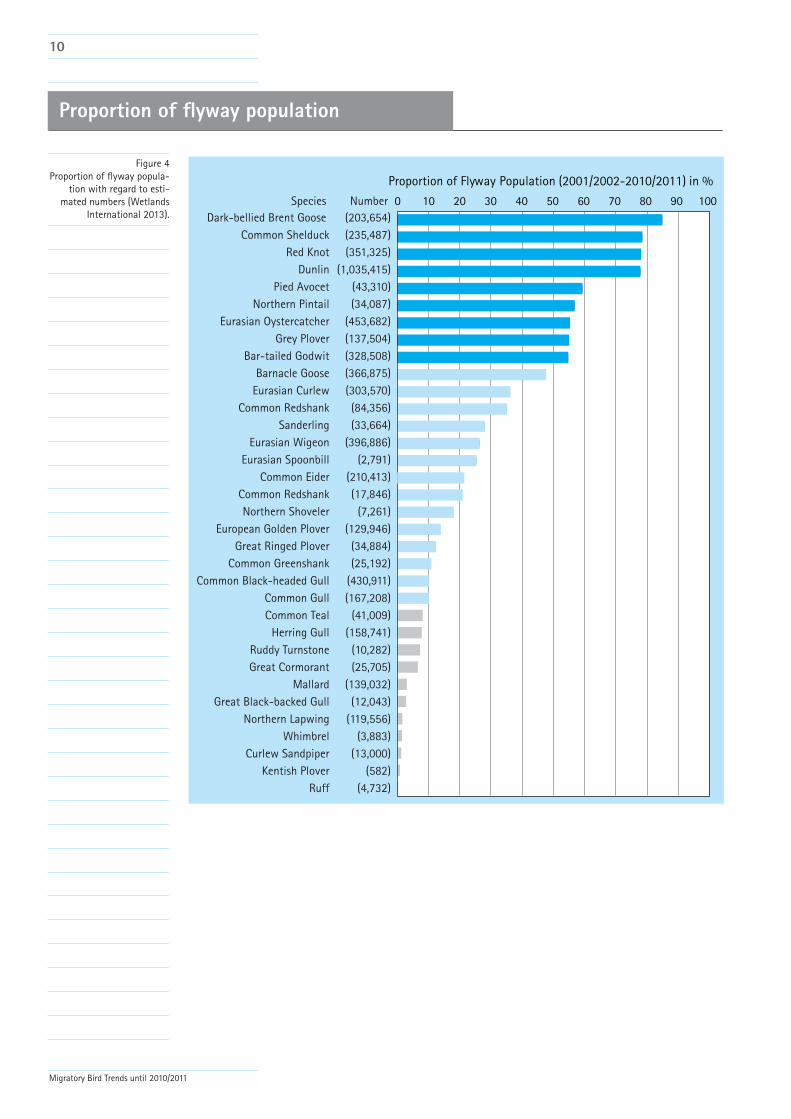
Figure 4Proportion of flyway popula-
tion with regard to esti-mated numbers (Wetlands
International 2013).
Proportion of flyway population
0 10 20 30 40 50 60 70 80 90 100
Proportion of Flyway Population (2001/2002-2010/2011) in %
Dark-bellied Brent Goose Common Shelduck
Red KnotDunlin
Pied AvocetNorthern Pintail
Eurasian OystercatcherGrey Plover
Bar-tailed GodwitBarnacle Goose
Eurasian CurlewCommon Redshank
SanderlingEurasian Wigeon
Eurasian SpoonbillCommon Eider
Common RedshankNorthern Shoveler
European Golden PloverGreat Ringed Plover
Common GreenshankCommon Black-headed Gull
Common GullCommon Teal
Herring GullRuddy TurnstoneGreat Cormorant
MallardGreat Black-backed Gull
Northern LapwingWhimbrel
Curlew SandpiperKentish Plover
Ruff
(203,654)(235,487)(351,325)
(1,035,415)(43,310)(34,087)
(453,682)(137,504)(328,508)(366,875)(303,570)(84,356)(33,664)
(396,886)(2,791)
(210,413)(17,846)
(7,261)(129,946)(34,884)(25,192)
(430,911)(167,208)
(41,009)(158,741)(10,282)(25,705)
(139,032)(12,043)
(119,556)(3,883)
(13,000)(582)
(4,732)
NumberSpecies
11
Migratory Bird Trends until 2010/2011
Summary Trends According to Indicators
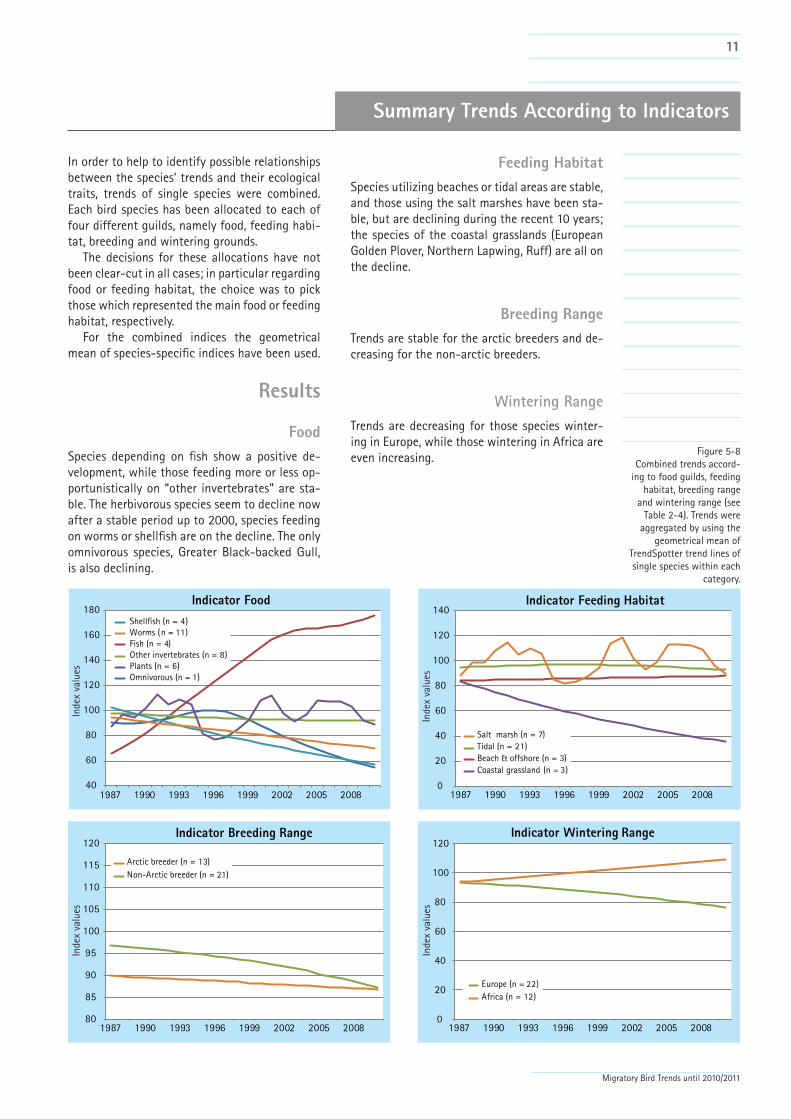
In order to help to identify possible relationships between the species’ trends and their ecological traits, trends of single species were combined. Each bird species has been allocated to each of four different guilds, namely food, feeding habi-tat, breeding and wintering grounds.
The decisions for these allocations have not been clear-cut in all cases; in particular regarding food or feeding habitat, the choice was to pick those which represented the main food or feeding habitat, respectively.
For the combined indices the geometrical mean of species-specific indices have been used.
Results
FoodSpecies depending on fish show a positive de-velopment, while those feeding more or less op-portunistically on “other invertebrates” are sta-ble. The herbivorous species seem to decline now after a stable period up to 2000, species feeding on worms or shellfish are on the decline. The only omnivorous species, Greater Black-backed Gull, is also declining.
Feeding HabitatSpecies utilizing beaches or tidal areas are stable, and those using the salt marshes have been sta-ble, but are declining during the recent 10 years; the species of the coastal grasslands (European Golden Plover, Northern Lapwing, Ruff) are all on the decline.
Breeding RangeTrends are stable for the arctic breeders and de-creasing for the non-arctic breeders.
Wintering RangeTrends are decreasing for those species winter-ing in Europe, while those wintering in Africa are even increasing.
Fish (n = 4)
Omnivorous (n = 1)
Other invertebrates (n = 8)Plants (n = 6)
Shell�sh (n = 4)Worms (n = 11)
40
60
80
100
120
140
160
180
1987 1990 1993 1996 1999 2002 2005 2008
Indicator Food
Inde
x va
lues
0
20
40
60
80
100
120
140
1987 1990 1993 1996 1999 2002 2005 2008
Indicator Feeding Habitat
Beach & offshore (n = 3)Tidal (n = 21)
Coastal grassland (n = 3)
Salt marsh (n = 7)
Inde
x va
lues
80
85
90
95
100
105
110
115
120
1987 1990 1993 1996 1999 2002 2005 2008
Indicator Breeding Range
Non-Arctic breeder (n = 21)Arctic breeder (n = 13)
Inde
x va
lues
0
20
40
60
80
100
120
1987 1990 1993 1996 1999 2002 2005 2008
Indicator Wintering Range
Europe (n = 22)Africa (n = 12)
Inde
x va
lues
Figure 5-8Combined trends accord-
ing to food guilds, feeding habitat, breeding range
and wintering range (see Table 2-4). Trends were
aggregated by using the geometrical mean of
TrendSpotter trend lines of single species within each
category.

12
Migratory Bird Trends until 2010/2011
FoodSpecies Shellfish Worms Fish Other
invertebrates Plants Omnivorous
Great Cormorant xEurasian Spoonbill xBarnacle Goose xBrent Goose xCommon Shelduck xEurasian Wigeon xCommon Teal xMallard xNorthern Pintail xNorthern Shoveler xCommon Eider xEurasian Oystercatcher xPied Avocet xGreat Ringed Plover xKentish Plover xEuropean Golden Plover xGrey Plover xNorthern Lapwing xRed Knot xSanderling xCurlew Sandpiper xDunlin xRuff xBar-tailed Godwit xWhimbrel xEurasian Curlew xSpotted Redshank xCommon Redshank xCommon Greenshank xRuddy Turnstone xBlack-headed Gull xCommon Gull xEuropean Herring Gull xGreat Black-backed Gull xTotal number of species 4 11 4 8 6 1
Summary trends according to indicators
Table 2Selection of species
according to food
Photo: Barend van Gemerden.

13
Migratory Bird Trends until 2010/2011
Feeding HabitatSpecies Salt marsh Tidal Dunes Beach &
offshoreCoastal
grasslandGreat Cormorant xEurasian Spoonbill xBarnacle Goose xBrent Goose xCommon Shelduck xEurasian Wigeon xCommon Teal xMallard xNorthern Pintail xNorthern Shoveler xCommon Eider xEurasian Oystercatcher xPied Avocet xGreat Ringed Plover xKentish Plover xEuropean Golden Plover xGrey Plover xNorthern Lapwing xRed Knot xSanderling xCurlew Sandpiper xDunlin xRuff xBar-tailed Godwit xWhimbrel xEurasian Curlew xSpotted Redshank xCommon Redshank xCommon Greenshank xRuddy Turnstone xBlack-headed Gull xCommon Gull xEuropean Herring Gull xGreat Black-backed Gull xTotal number of species 7 21 0 3 3
Summary trends according to indicators
Table 3Selection of species
according to feeding habitat.
Photo: Gundolf Reichert.
14
Migratory Bird Trends until 2010/2011
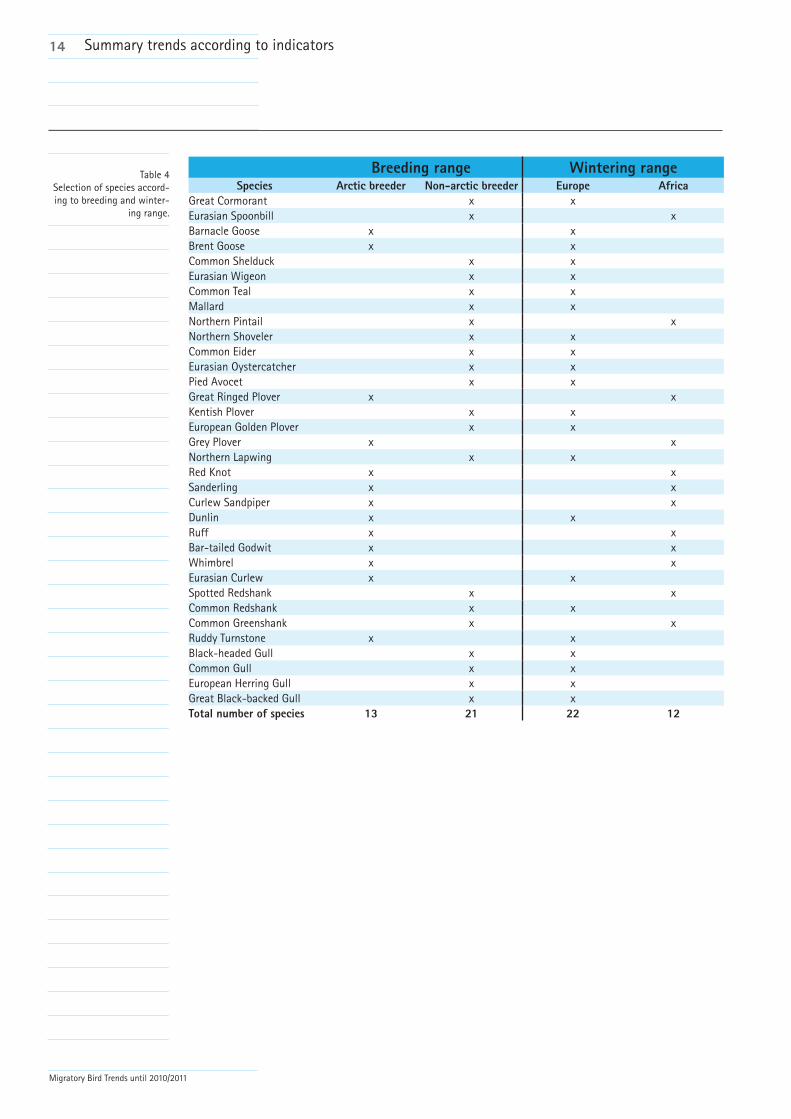
Breeding range Wintering rangeSpecies Arctic breeder Non-arctic breeder Europe Africa
Great Cormorant x xEurasian Spoonbill x xBarnacle Goose x xBrent Goose x xCommon Shelduck x xEurasian Wigeon x xCommon Teal x xMallard x xNorthern Pintail x xNorthern Shoveler x xCommon Eider x xEurasian Oystercatcher x xPied Avocet x xGreat Ringed Plover x xKentish Plover x xEuropean Golden Plover x xGrey Plover x xNorthern Lapwing x xRed Knot x xSanderling x xCurlew Sandpiper x xDunlin x xRuff x xBar-tailed Godwit x xWhimbrel x xEurasian Curlew x xSpotted Redshank x xCommon Redshank x xCommon Greenshank x xRuddy Turnstone x xBlack-headed Gull x xCommon Gull x xEuropean Herring Gull x xGreat Black-backed Gull x xTotal number of species 13 21 22 12
Table 4Selection of species accord-ing to breeding and winter-
ing range.
Summary trends according to indicators

15
Migratory Bird Trends until 2010/2011
Species Accounts
Photo:John Frikke

16
Migratory Bird Trends until 2010/2011

17
Migratory Bird Trends until 2010/2011
Species Accounts
Great Cormorant
Explanatory NoteGreat Cormorant numbers show a remarkable increase in the Wadden Sea from the 1980s up until 2003 during all seasons, reflecting the increase in the breeding populations in Northern Europe. This long-term increase has recently turned into a sustained decrease most visible in the Netherlands and Denmark; lately, these negative trends are also indicated in Schleswig-Holstein and Niedersachsen/Hamburg, while the long-term trend is still an increase.
(D) Schleswig-Holstein
(F) The Netherlands
(C) Denmark
Trends for Great Cormorant in the Wadden SeaFigures represent the trend 1987/1988 to 2010/2011, taking into account data from all months to express an overall trend for the entire year. Numbers on the y-axis represent monthly mean occurrences. Dots are the individual yearly estimates, solid lines the trend calculated by TrendSpotter, dotted lines the 95% confidence limits of the trend lines.
Figure 9-14Trends of Great Cormo-
rant in the International Wadden Sea (WS) and the
four regions 1987/1988-2010/2011; dots represent annual averages; trendline calculated by Trendspotter
(solid line) together with the ± 95 % confidence
limits (dotted line).
Phalacrocorax carboDK: Skarv D: Kormoran NL: Aalscholver
00720
(A) Overall trend in the International Wadden Sea (B) Trends in the different countries compared
0
2,000
4,000
6,000
8,000
10,000
12,000
1985 1990 1995 2000 2005 2010 2015
0
1,000
2,000
3,000
4,000
5,000
6,000
1985 1990 1995 2000 2005 2010 2015Trend DK Trend SH Trend Nds/HH Trend NL
0
500
1,000
1,500
2,000
2,500
3,000
1985 1990 1995 2000 2005 2010 20150
500
1,000
1,500
2,000
2,500
3,000
1985 1990 1995 2000 2005 2010 2015
0
500
1,000
1,500
2,000
2,500
3,000
1985 1990 1995 2000 2005 2010 20150
1,000
2,000
3,000
4,000
5,000
6,000
1985 1990 1995 2000 2005 2010 2015
(E) Niedersachsen/Hamburg
Figure 15Absolute numbers of Great Cormorant in the four re-
gions calculated by average of the 3 maximum numbers
in the period 2001/2002-2010/2011.
0
3,000
6,000
9,000
12,000
15,000
DK SH Nds/HH NL
Area Period 1987/88 - 2010/11
1998/99 - 2010/11
(A)/(B) International Wadden Sea
(C) Denmark
(D) Schleswig-Holstein
(E) Niedersachsen/Hamburg
(F) The Netherlands
strong increase moderate increasestrong decrease
moderate decrease stable uncertain

18
Migratory Bird Trends until 2010/2011
Platalea leucorodiaDK: Skestork D: Löffler NL: Lepelaar
0
300
600
900
1,200
1,500
1985 1990 1995 2000 2005 2010 2015
0
200
400
600
800
1,000
1985 1990 1995 2000 2005 2010 2015Trend DK Trend SH Trend Nds/HH Trend NL
0
50
100
150
200
1985 1990 1995 2000 2005 2010 20150
50
100
150
200
1985 1990 1995 2000 2005 2010 2015
0
50
100
150
200
1985 1990 1995 2000 2005 2010 20150
200
400
600
800
1,000
1985 1990 1995 2000 2005 2010 2015
(A) Overall trend in the International Wadden Sea (B) Trends in the different countries compared
01440
Eurasian Spoonbill
Explanatory NoteThe Wadden Sea is near the northern border of the Eurasian Spoonbill breeding range, but numbers increase up to now especially in the Netherlands, but also in Niedersachsen/Hamburg and Schleswig-Holstein. The non-breeding numbers reflect the breeding population and numbers are increasing in all parts of the Wadden Sea.
(D) Schleswig-Holstein
(E) Niedersachsen/Hamburg (F) The Netherlands
(C) Denmark
Trends for Eurasian Spoonbill in the Wadden SeaFigures represent the trend 1987/1988 to 2010/2011, taking into account data from all months to express an overall trend for the entire year. Numbers on the y-axis represent monthly mean occurrences. Dots are the individual yearly estimates, solid lines the trend calculated by TrendSpotter, dotted lines the 95% confidence limits of the trend lines.
Figure 16-21Trends of Eurasian Spoonbill in the International Wadden
Sea (WS) and the four re-gions 1987/1988-2010/2011;
dots represent annual aver-ages; trendline calculated
by Trendspotter (solid line) together with the ± 95 % confidence limits (dotted
line).
Area Period 1987/88 - 2010/11
1998/99 - 2010/11
(A)/(B) International Wadden Sea
(C) Denmark
(D) Schleswig-Holstein
(E) Niedersachsen/Hamburg
(F) The Netherlands
strong increase moderate increasestrong decrease
moderate decrease stable uncertain
0
1,000
2,000
3,000
DK SH Nds/HH NL
Figure 22Absolute numbers of Eura-
sian Spoonbill in the four re-gions calculated by average of the 3 maximum numbers
in the period 2001/2002-2010/2011.
19
Migratory Bird Trends until 2010/2011
Species Accounts
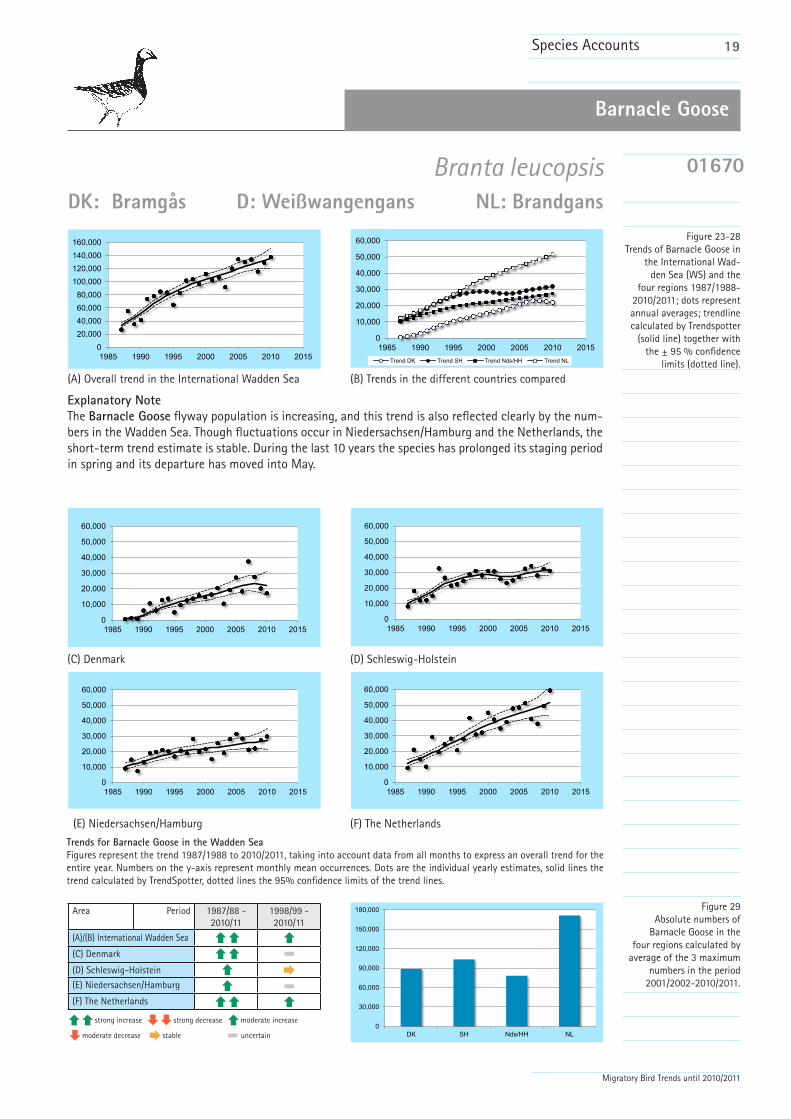
Barnacle Goose
Explanatory NoteThe Barnacle Goose flyway population is increasing, and this trend is also reflected clearly by the num-bers in the Wadden Sea. Though fluctuations occur in Niedersachsen/Hamburg and the Netherlands, the short-term trend estimate is stable. During the last 10 years the species has prolonged its staging period in spring and its departure has moved into May.
(D) Schleswig-Holstein
(F) The Netherlands
(C) Denmark
Trends for Barnacle Goose in the Wadden SeaFigures represent the trend 1987/1988 to 2010/2011, taking into account data from all months to express an overall trend for the entire year. Numbers on the y-axis represent monthly mean occurrences. Dots are the individual yearly estimates, solid lines the trend calculated by TrendSpotter, dotted lines the 95% confidence limits of the trend lines.
Figure 23-28Trends of Barnacle Goose in
the International Wad-den Sea (WS) and the
four regions 1987/1988-2010/2011; dots represent annual averages; trendline calculated by Trendspotter
(solid line) together with the ± 95 % confidence
limits (dotted line).
Branta leucopsisDK: Bramgås D: Weißwangengans NL: Brandgans
01670
(A) Overall trend in the International Wadden Sea (B) Trends in the different countries compared
(E) Niedersachsen/Hamburg
020,00040,00060,00080,000
100,000120,000140,000160,000
1985 1990 1995 2000 2005 2010 2015
0
10,000
20,000
30,000
40,000
50,000
60,000
1985 1990 1995 2000 2005 2010 2015Trend DK Trend SH Trend Nds/HH Trend NL
0
10,000
20,000
30,000
40,000
50,000
60,000
1985 1990 1995 2000 2005 2010 20150
10,000
20,000
30,000
40,000
50,000
60,000
1985 1990 1995 2000 2005 2010 2015
0
10,000
20,000
30,000
40,000
50,000
60,000
1985 1990 1995 2000 2005 2010 20150
10,000
20,000
30,000
40,000
50,000
60,000
1985 1990 1995 2000 2005 2010 2015
Area Period 1987/88 - 2010/11
1998/99 - 2010/11
(A)/(B) International Wadden Sea
(C) Denmark
(D) Schleswig-Holstein
(E) Niedersachsen/Hamburg
(F) The Netherlands
strong increase moderate increasestrong decrease
moderate decrease stable uncertain
0
30,000
60,000
90,000
120,000
150,000
180,000
DK SH Nds/HH NL
Figure 29Absolute numbers of
Barnacle Goose in the four regions calculated by
average of the 3 maximum numbers in the period
2001/2002-2010/2011.

20
Migratory Bird Trends until 2010/2011
Species Accounts
Dark-bellied Brent Goose
Explanatory NoteThe Dark-bellied Brent Goose population has increased until the mid 1990s and decreased afterwards. Due to those fluctuations, the overall trends in the Wadden Sea appear to be stable, which also ap-plies for the Netherlands and Niedersachsen/Niedersachsen. Within the fluctuations, both Denmark and Schleswig-Holstein show decreasing trends.
(D) Schleswig-Holstein
(F) The Netherlands
(C) Denmark
Trends for Dark-bellied Brent Goose in the Wadden SeaFigures represent the trend 1987/1988 to 2010/2011, taking into account data from all months to express an overall trend for the entire year. Numbers on the y-axis represent monthly mean occurrences. Dots are the individual yearly estimates, solid lines the trend calculated by TrendSpotter, dotted lines the 95% confidence limits of the trend lines.
Figure 30-35Trends of Dark-bellied Brent
Goose in the International Wadden Sea (WS) and the
four regions 1987/1988-2010/2011; dots represent annual averages; trendline calculated by Trendspotter
(solid line) together with the ± 95 % confidence limits
(dotted line).
Branta bernicla berniclaDK: Mørkbuget Knortegås D: Dunkelbäuchige Ringelgans NL: Rotgans
01680
(A) Overall trend in the International Wadden Sea (B) Trends in the different countries compared
(E) Niedersachsen/Hamburg
0
20,000
40,000
60,000
80,000
100,000
1985 1990 1995 2000 2005 2010 2015
0
10,000
20,000
30,000
40,000
1985 1990 1995 2000 2005 2010 2015Trend DK Trend SH Trend Nds/HH Trend NL
0
2,000
4,000
6,000
8,000
10,000
1985 1990 1995 2000 2005 2010 20150
10,000
20,000
30,000
40,000
1985 1990 1995 2000 2005 2010 2015
0
2,000
4,000
6,000
8,000
10,000
1985 1990 1995 2000 2005 2010 20150
10,000
20,000
30,000
40,000
1985 1990 1995 2000 2005 2010 2015
Area Period 1987/88 - 2010/11
1998/99 - 2010/11
(A)/(B) International Wadden Sea
(C) Denmark
(D) Schleswig-Holstein
(E) Niedersachsen/Hamburg
(F) The Netherlands
strong increase moderate increasestrong decrease
moderate decrease stable uncertain
0
20,000
40,000
60,000
80,000
100,000
DK SH Nds/HH NL
Figure 36Absolute numbers of Dark-bellied Brent Goose in the four regions calculated by
average of the 3 maximum numbers in the period
2001/2002-2010/2011.

21
Migratory Bird Trends until 2010/2011
Species Accounts
Common Shelduck
Explanatory NoteSome 80% of the Common Shelduck flyway population can be found in the Wadden Sea. Overall numbers – counted from the ground throughout the year - decreased up to the mid 1990´s and seemed to level off. However, due to a continuous slight decrease after 2000, the long-term Wadden Sea trend is decreasing, the 10-year trend still stable. Decreases occur both in Schleswig-Holstein and Niedersachsen/Hamburg, while trends in Denmark and the Netherlands are stable, fluctuating or slightly increasing.The Shelduck moulting population, with its main concentration in the Schleswig-Holstein Wadden Sea, has been increasing up to 2000, but is continuously decreasing thereafter. The long-term trend is now stable, but the short-term trend clearly decreasing.
(D) Schleswig-Holstein
(F) The Netherlands
(C) Denmark
Trends for Common Shelduck in the Wadden SeaFigures represent the trend 1987/1988 to 2010/2011, taking into account data from all months to express an overall trend for the entire year. Numbers on the y-axis represent monthly mean occurrences. Dots are the individual yearly estimates, solid lines the trend calculated by TrendSpotter, dotted lines the 95% confidence limits of the trend lines.
Figure 37-42Trends of CommonShel-
duck in the International Wadden Sea (WS) and the
four regions 1987/1988-2010/2011; dots represent annual averages; trendline calculated by Trendspotter
(solid line) together with the ± 95 % confidence
limits (dotted line).
Tadorna tadornaDK: Gravand D: Brandgans NL: Bergeend
01730
(A) Overall trend in the International Wadden Sea (B) Trends in the different countries compared
(E) Niedersachsen/Hamburg
0
40,000
80,000
120,000
160,000
200,000
1985 1990 1995 2000 2005 2010 2015
0
10,000
20,000
30,000
40,000
50,000
60,000
70,000
1985 1990 1995 2000 2005 2010 2015Trend DK Trend SH Trend Nds/HH Trend NL
0
10,000
20,000
30,000
40,000
50,000
1985 1990 1995 2000 2005 2010 20150
10,00020,00030,00040,00050,00060,00070,000
1985 1990 1995 2000 2005 2010 2015
010,00020,00030,00040,00050,00060,00070,000
1985 1990 1995 2000 2005 2010 20150
10,000
20,000
30,000
40,000
50,000
1985 1990 1995 2000 2005 2010 2015
Area Period 1987/88 - 2010/11
1998/99 - 2010/11
(A)/(B) International Wadden Sea
(C) Denmark
(D) Schleswig-Holstein
(E) Niedersachsen/Hamburg
(F) The Netherlands
strong increase moderate increasestrong decrease
moderate decrease stable uncertain
0
20,000
40,000
60,000
80,000
100,000
DK SH Nds/HH NL
Figure 43Absolute numbers of
Common Shelduck in the four regions calculated by
average of the 3 maximum numbers in the period
2001/2002-2010/2011.

22
Migratory Bird Trends until 2010/2011
Species Accounts
Eurasian Wigeon
Explanatory NoteThe trend of the Eurasian Wigeon has seen increasing numbers up to the mid 1990s; following two cold winters in 1996 and 1997 numbers decreased, but stabilized thereafter. Thus long and short term overall Wadden Sea trends are stable now. Decreasing trends are found in the Netherlands and now also in Schleswig-Holstein as well as a short-term decrease in Niedersachsen/Hamburg. Denmark shows stable trends.
(D) Schleswig-Holstein
(F) The Netherlands
(C) Denmark
Trends for Eurasian Wigeon in the Wadden SeaFigures represent the trend 1987/1988 to 2010/2011, taking into account data from all months to express an overall trend for the entire year. Numbers on the y-axis represent monthly mean occurrences. Dots are the individual yearly estimates, solid lines the trend calculated by TrendSpotter, dotted lines the 95% confidence limits of the trend lines.
Figure 44-49Trends of Eurasian Wigeon
in the International Wadden Sea (WS) and the four re-
gions 1987/1988-2010/2011; dots represent annual aver-
ages; trendline calculated by Trendspotter (solid line) together with the ± 95 % confidence limits (dotted
line).
Anas penelopeDK: Pibeand D: Pfeifente NL: Smient
01790
(A) Overall trend in the International Wadden Sea (B) Trends in the different countries compared
(E) Niedersachsen/Hamburg
020,00040,00060,00080,000
100,000120,000140,000160,000180,000
1985 1990 1995 2000 2005 2010 2015
0
10,000
20,000
30,000
40,000
50,000
60,000
70,000
1985 1990 1995 2000 2005 2010 2015Trend DK Trend SH Trend Nds/HH Trend NL
0
5,000
10,000
15,000
20,000
25,000
30,000
1985 1990 1995 2000 2005 2010 20150
20,000
40,000
60,000
80,000
100,000
1985 1990 1995 2000 2005 2010 2015
0
5,000
10,000
15,000
20,000
25,000
30,000
1985 1990 1995 2000 2005 2010 20150
10,000
20,000
30,000
40,000
50,000
60,000
1985 1990 1995 2000 2005 2010 2015
Area Period 1987/88 - 2010/11
1998/99 - 2010/11
(A)/(B) International Wadden Sea
(C) Denmark
(D) Schleswig-Holstein
(E) Niedersachsen/Hamburg
(F) The Netherlands
strong increase moderate increasestrong decrease
moderate decrease stable uncertain
0
50,000
100,000
150,000
200,000
250,000
DK SH Nds/HH NL
Figure 50Absolute numbers of Eura-
sian Wigeon in the four regions calculated by
average of the 3 maximum numbers in the period
2001/2002-2010/2011.
23
Migratory Bird Trends until 2010/2011
Species Accounts
Common Teal
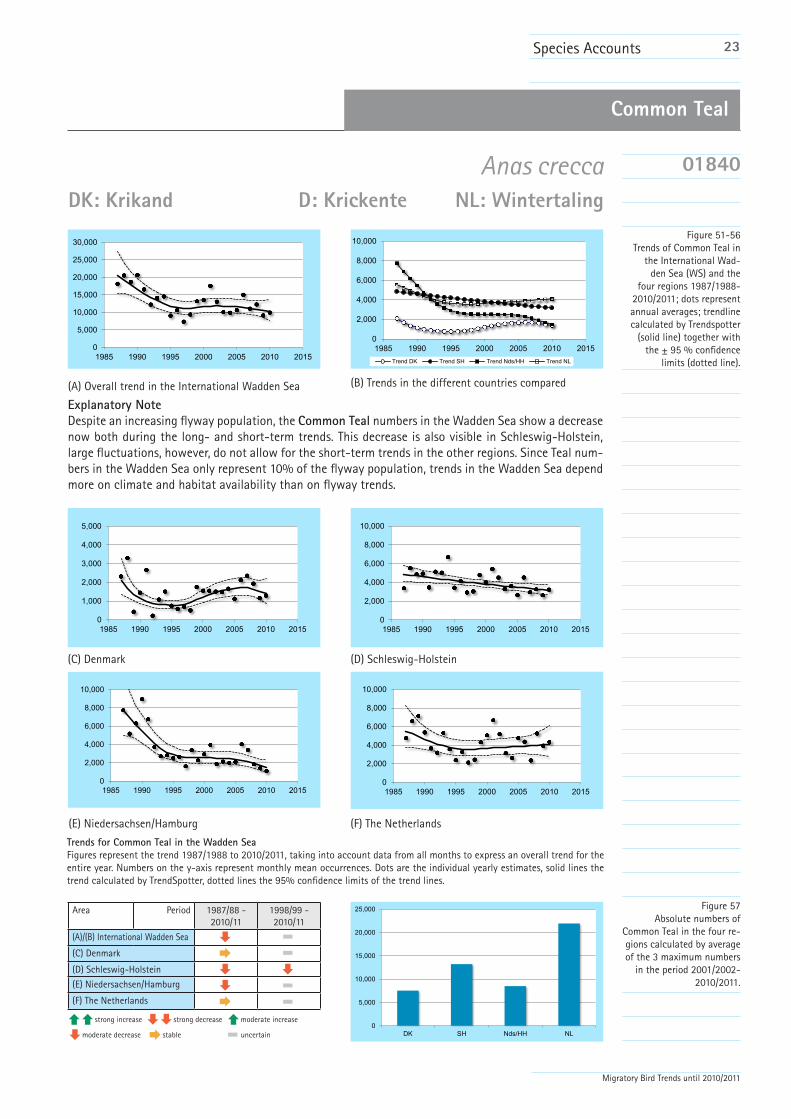
Explanatory NoteDespite an increasing flyway population, the Common Teal numbers in the Wadden Sea show a decrease now both during the long- and short-term trends. This decrease is also visible in Schleswig-Holstein, large fluctuations, however, do not allow for the short-term trends in the other regions. Since Teal num-bers in the Wadden Sea only represent 10% of the flyway population, trends in the Wadden Sea depend more on climate and habitat availability than on flyway trends.
(D) Schleswig-Holstein
(F) The Netherlands
(C) Denmark
Trends for Common Teal in the Wadden SeaFigures represent the trend 1987/1988 to 2010/2011, taking into account data from all months to express an overall trend for the entire year. Numbers on the y-axis represent monthly mean occurrences. Dots are the individual yearly estimates, solid lines the trend calculated by TrendSpotter, dotted lines the 95% confidence limits of the trend lines.
Figure 51-56Trends of Common Teal in
the International Wad-den Sea (WS) and the
four regions 1987/1988-2010/2011; dots represent annual averages; trendline calculated by Trendspotter
(solid line) together with the ± 95 % confidence
limits (dotted line).
Anas creccaDK: Krikand D: Krickente NL: Wintertaling
01840
(A) Overall trend in the International Wadden Sea (B) Trends in the different countries compared
(E) Niedersachsen/Hamburg
0
5,000
10,000
15,000
20,000
25,000
30,000
1985 1990 1995 2000 2005 2010 2015
0
2,000
4,000
6,000
8,000
10,000
1985 1990 1995 2000 2005 2010 2015Trend DK Trend SH Trend Nds/HH Trend NL
0
1,000
2,000
3,000
4,000
5,000
1985 1990 1995 2000 2005 2010 20150
2,000
4,000
6,000
8,000
10,000
1985 1990 1995 2000 2005 2010 2015
0
2,000
4,000
6,000
8,000
10,000
1985 1990 1995 2000 2005 2010 20150
2,000
4,000
6,000
8,000
10,000
1985 1990 1995 2000 2005 2010 2015
Area Period 1987/88 - 2010/11
1998/99 - 2010/11
(A)/(B) International Wadden Sea
(C) Denmark
(D) Schleswig-Holstein
(E) Niedersachsen/Hamburg
(F) The Netherlands
strong increase moderate increasestrong decrease
moderate decrease stable uncertain
0
5,000
10,000
15,000
20,000
25,000
DK SH Nds/HH NL
Figure 57Absolute numbers of
Common Teal in the four re-gions calculated by average of the 3 maximum numbers
in the period 2001/2002-2010/2011.

24
Migratory Bird Trends until 2010/2011
Species Accounts
Mallard
Explanatory NoteThe Mallard occurs in the Wadden Sea only with less than 5% of its flyway populations. The overall trends are moderate but long-lasting decreases in the entire Wadden Sea; while the northern region trends (DK, SH) stabilized, yet with large fluctuations, the southern regions show continuing decreases.
(D) Schleswig-Holstein
(F) The Netherlands
(C) Denmark
Trends for Mallard in the Wadden SeaFigures represent the trend 1987/1988 to 2010/2011, taking into account data from all months to express an overall trend for the entire year. Numbers on the y-axis represent monthly mean occurrences. Dots are the individual yearly estimates, solid lines the trend calculated by TrendSpotter, dotted lines the 95% confidence limits of the trend lines.
Figure 58-63Trends of Mallard in the
International Wadden Sea (WS) and the four regions
1987/1988-2010/2011; dots represent annual aver-
ages; trendline calculated by Trendspotter (solid line) together with the ± 95 % confidence limits (dotted
line).
Anas platyrhynchosDK: Gråand D: Stockente NL: Wilde Eend
01860
(A) Overall trend in the International Wadden Sea (B) Trends in the different countries compared
(E) Niedersachsen/Hamburg
0
20,000
40,000
60,000
80,000
100,000
1985 1990 1995 2000 2005 2010 2015
0
10,000
20,000
30,000
40,000
1985 1990 1995 2000 2005 2010 2015Trend DK Trend SH Trend Nds/HH Trend NL
0
2,000
4,000
6,000
8,000
10,000
1985 1990 1995 2000 2005 2010 20150
10,000
20,000
30,000
40,000
1985 1990 1995 2000 2005 2010 2015
0
10,000
20,000
30,000
40,000
1985 1990 1995 2000 2005 2010 20150
10,000
20,000
30,000
40,000
1985 1990 1995 2000 2005 2010 2015
Area Period 1987/88 - 2010/11
1998/99 - 2010/11
(A)/(B) International Wadden Sea
(C) Denmark
(D) Schleswig-Holstein
(E) Niedersachsen/Hamburg
(F) The Netherlands
strong increase moderate increasestrong decrease
moderate decrease stable uncertain
0
15,000
30,000
45,000
60,000
DK SH Nds/HH NL
Figure 64Absolute numbers of Mal-
lard in the four regions calculated by average of the 3 maximum numbers in the period 2001/2002-
2010/2011.

25
Migratory Bird Trends until 2010/2011
Species Accounts
Northern Pintail
Explanatory NoteWhile the Northern Pintail flyway population trend is stable, the developments in the Wadden Sea, however, holding up to 50% of the flyway population, show large fluctuations, resulting, however, in long-term and short-term increasing trends in most regions.
(D) Schleswig-Holstein
(F) The Netherlands
(C) Denmark
Trends for Northern Pintail in the Wadden SeaFigures represent the trend 1987/1988 to 2010/2011, taking into account data from all months to express an overall trend for the entire year. Numbers on the y-axis represent monthly mean occurrences. Dots are the individual yearly estimates, solid lines the trend calculated by TrendSpotter, dotted lines the 95% confidence limits of the trend lines.
Figure 65-70Trends of Northern Pintail in the International Wad-
den Sea (WS) and the four regions 1987/1988-
2010/2011; dots represent annual averages; trendline calculated by Trendspotter
(solid line) together with the ± 95 % confidence limits
(dotted line).
Anas acutaDK: Spidsand D: Spießente NL: Pijlstaart
01890
(A) Overall trend in the International Wadden Sea (B) Trends in the different countries compared
(E) Niedersachsen/Hamburg
0
5,000
10,000
15,000
20,000
25,000
1985 1990 1995 2000 2005 2010 2015
0
2,000
4,000
6,000
8,000
10,000
1985 1990 1995 2000 2005 2010 2015Trend DK Trend SH Trend Nds/HH Trend NL
0
2,000
4,000
6,000
8,000
10,000
1985 1990 1995 2000 2005 2010 20150
1,000
2,000
3,000
4,000
5,000
1985 1990 1995 2000 2005 2010 2015
0
1,000
2,000
3,000
4,000
5,000
1985 1990 1995 2000 2005 2010 20150
2,000
4,000
6,000
8,000
10,000
1985 1990 1995 2000 2005 2010 2015
Area Period 1987/88 - 2010/11
1998/99 - 2010/11
(A)/(B) International Wadden Sea
(C) Denmark
(D) Schleswig-Holstein
(E) Niedersachsen/Hamburg
(F) The Netherlands
strong increase moderate increasestrong decrease
moderate decrease stable uncertain
0
5,000
10,000
15,000
20,000
DK SH Nds/HH NL
Figure 71Absolute numbers of North-
ern Pintail in the four re-gions calculated by average of the 3 maximum numbers
in the period 2001/2002-2010/2011.

26
Migratory Bird Trends until 2010/2011
Species Accounts
Northern Shoveler
Explanatory NoteThe numbers of Northern Shoveler using the Wadden Sea represent some 20% of the flyway population. The overall Wadden Sea trend is stable, including slight increases in Denmark and Schleswig-Holstein, and an apparent stable situation in Niedersachsen/Hamburg and in the Netherlands.
(D) Schleswig-Holstein
(F) The Netherlands
(C) Denmark
Trends for Northern Shoveler in the Wadden SeaFigures represent the trend 1987/1988 to 2010/2011, taking into account data from all months to express an overall trend for the entire year. Numbers on the y-axis represent monthly mean occurrences. Dots are the individual yearly estimates, solid lines the trend calculated by TrendSpotter, dotted lines the 95% confidence limits of the trend lines.
Figure 72-77Trends of Northern Shoveler in the International Wadden
Sea (WS) and the four re-gions 1987/1988-2010/2011;
dots represent annual aver-ages; trendline calculated
by Trendspotter (solid line) together with the ± 95 % confidence limits (dotted
line).
Anas clypeataDK: Skeand D: Löffelente NL: Slobeend
01940
(A) Overall trend in the International Wadden Sea (B) Trends in the different countries compared
(E) Niedersachsen/Hamburg
0
1,000
2,000
3,000
4,000
1985 1990 1995 2000 2005 2010 2015
0
500
1,000
1,500
2,000
1985 1990 1995 2000 2005 2010 2015Trend DK Trend SH Trend Nds/HH Trend NL
0
100
200
300
400
500
1985 1990 1995 2000 2005 2010 20150
500
1,000
1,500
2,000
1985 1990 1995 2000 2005 2010 2015
0
200
400
600
800
1,000
1985 1990 1995 2000 2005 2010 20150
500
1,000
1,500
2,000
1985 1990 1995 2000 2005 2010 2015
Area Period 1987/88 - 2010/11
1998/99 - 2010/11
(A)/(B) International Wadden Sea
(C) Denmark
(D) Schleswig-Holstein
(E) Niedersachsen/Hamburg
(F) The Netherlands
strong increase moderate increasestrong decrease
moderate decrease stable uncertain
0
1,000
2,000
3,000
4,000
5,000
DK SH Nds/HH NL
Figure 78Absolute numbers of
Northern Shoveler in the four regions calculated by
average of the 3 maximum numbers in the period
2001/2002-2010/2011.
27
Migratory Bird Trends until 2010/2011
Species Accounts
Common Eider
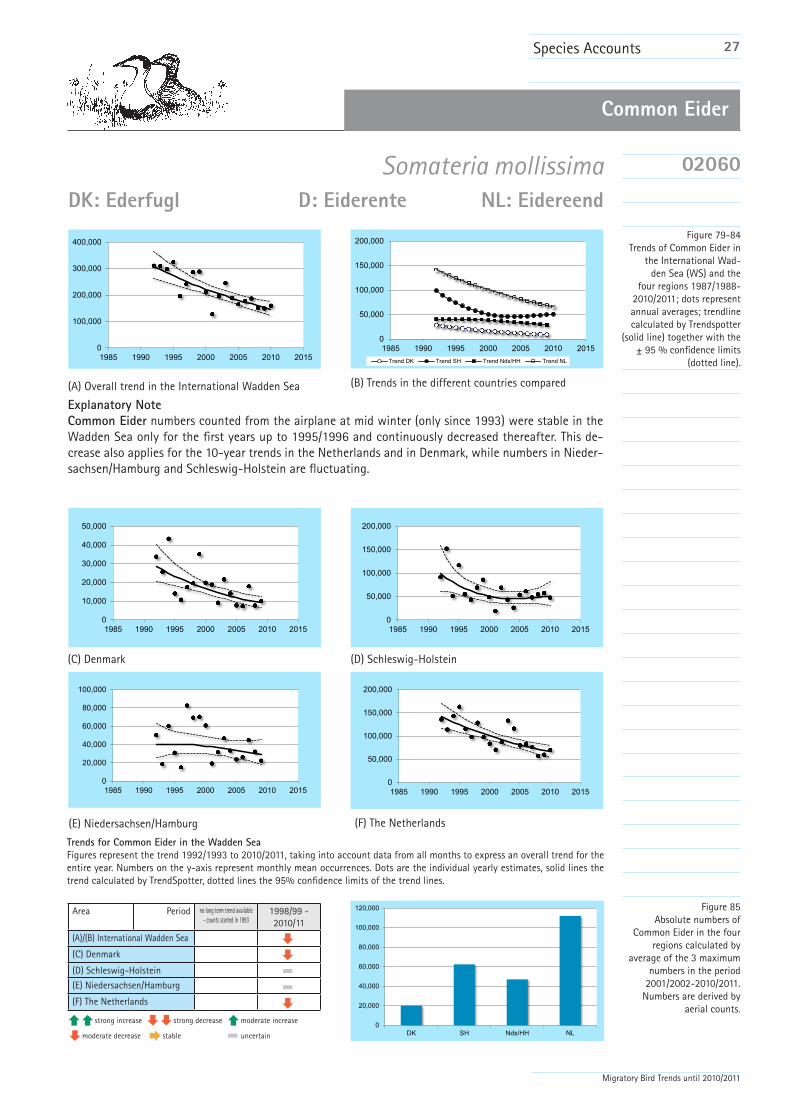
Explanatory NoteCommon Eider numbers counted from the airplane at mid winter (only since 1993) were stable in the Wadden Sea only for the first years up to 1995/1996 and continuously decreased thereafter. This de-crease also applies for the 10-year trends in the Netherlands and in Denmark, while numbers in Nieder-sachsen/Hamburg and Schleswig-Holstein are fluctuating.
(D) Schleswig-Holstein
(F) The Netherlands
(C) Denmark
Trends for Common Eider in the Wadden SeaFigures represent the trend 1992/1993 to 2010/2011, taking into account data from all months to express an overall trend for the entire year. Numbers on the y-axis represent monthly mean occurrences. Dots are the individual yearly estimates, solid lines the trend calculated by TrendSpotter, dotted lines the 95% confidence limits of the trend lines.
Figure 79-84Trends of Common Eider in
the International Wad-den Sea (WS) and the
four regions 1987/1988-2010/2011; dots represent annual averages; trendline calculated by Trendspotter
(solid line) together with the ± 95 % confidence limits
(dotted line).
Somateria mollissimaDK: Ederfugl D: Eiderente NL: Eidereend
02060
(A) Overall trend in the International Wadden Sea (B) Trends in the different countries compared
(E) Niedersachsen/Hamburg
0
100,000
200,000
300,000
400,000
1985 1990 1995 2000 2005 2010 2015
0
50,000
100,000
150,000
200,000
1985 1990 1995 2000 2005 2010 2015Trend DK Trend SH Trend Nds/HH Trend NL
0
10,000
20,000
30,000
40,000
50,000
1985 1990 1995 2000 2005 2010 20150
50,000
100,000
150,000
200,000
1985 1990 1995 2000 2005 2010 2015
0
20,000
40,000
60,000
80,000
100,000
1985 1990 1995 2000 2005 2010 20150
50,000
100,000
150,000
200,000
1985 1990 1995 2000 2005 2010 2015
Area Period no long term trend available - counts started in 1993
1998/99 - 2010/11
(A)/(B) International Wadden Sea
(C) Denmark
(D) Schleswig-Holstein
(E) Niedersachsen/Hamburg
(F) The Netherlands
strong increase moderate increasestrong decrease
moderate decrease stable uncertain
Figure 85Absolute numbers of
Common Eider in the four regions calculated by
average of the 3 maximum numbers in the period
2001/2002-2010/2011.Numbers are derived by
aerial counts.0
20,000
40,000
60,000
80,000
100,000
120,000
DK SH Nds/HH NL

28
Migratory Bird Trends until 2010/2011
Species Accounts
Eurasian Oystercatcher
Explanatory NoteUp to 50% of the Eurasian Oystercatcher flyway population can be counted in the Wadden Sea. Overall Wadden Sea numbers show a striking regular and long-lasting decrease also in all regions. The last sea-son, again, added an even lower point to all figures, now also in Denmark.
(D) Schleswig-Holstein
(F) The Netherlands
(C) Denmark
Trends for Eurasian Oystercatcher in the Wadden SeaFigures represent the trend 1987/1988 to 2010/2011, taking into account data from all months to express an overall trend for the entire year. Numbers on the y-axis represent monthly mean occurrences. Dots are the individual yearly estimates, solid lines the trend calculated by TrendSpotter, dotted lines the 95% confidence limits of the trend lines.
Figure 86-91Trends of Eurasian Oyster-
catcher in the International Wadden Sea (WS) and the
four regions 1987/1988-2010/2011; dots represent annual averages; trendline calculated by Trendspotter
(solid line) together with the ± 95 % confidence limits
(dotted line).
Haematopus ostralegusDK: Strandskade D: Austernfischer NL: Scholekster
04500
(A) Overall trend in the International Wadden Sea (B) Trends in the different countries compared
(E) Niedersachsen/Hamburg
0
100,000
200,000
300,000
400,000
500,000
600,000
1985 1990 1995 2000 2005 2010 2015
0
50,000
100,000
150,000
200,000
250,000
1985 1990 1995 2000 2005 2010 2015Trend DK Trend SH Trend Nds/HH Trend NL
0
5,000
10,000
15,000
20,000
25,000
30,000
1985 1990 1995 2000 2005 2010 20150
30,000
60,000
90,000
120,000
150,000
1985 1990 1995 2000 2005 2010 2015
0
50,000
100,000
150,000
200,000
1985 1990 1995 2000 2005 2010 20150
50,000
100,000
150,000
200,000
250,000
1985 1990 1995 2000 2005 2010 2015
Area Period 1987/88 - 2010/11
1998/99 - 2010/11
(A)/(B) International Wadden Sea
(C) Denmark
(D) Schleswig-Holstein
(E) Niedersachsen/Hamburg
(F) The Netherlands
strong increase moderate increasestrong decrease
moderate decrease stable uncertain
0
50,000
100,000
150,000
200,000
DK SH Nds/HH NL
Figure 92Absolute numbers of
Eurasian Oystercatcher in the four regions calculated by average of the 3 maxi-
mum numbers in the period 2001/2002-2010/2011.

29
Migratory Bird Trends until 2010/2011
Species Accounts
Pied Avocet
Explanatory NotePeak numbers of Pied Avocet occur during autumn, when more than 50% of its flyway population can be found in the Wadden Sea. The trend for the flyway population is stable, however, the overall trend in the Wadden Sea is a moderate but continuous decrease, even though results since 1995 seem to be rather levelled. The decrease is also visible in all regions but the Netherlands, where the trends are stable.
(D) Schleswig-Holstein
(F) The Netherlands
(C) Denmark
Trends for Pied Avocet in the Wadden SeaFigures represent the trend 1987/1988 to 2010/2011, taking into account data from all months to express an overall trend for the entire year. Numbers on the y-axis represent monthly mean occurrences. Dots are the individual yearly estimates, solid lines the trend calculated by TrendSpotter, dotted lines the 95% confidence limits of the trend lines.
Figure 93-98Trends of Pied Avocet in the
International Wadden Sea (WS) and the four regions
1987/1988-2010/2011; dots represent annual aver-
ages; trendline calculated by Trendspotter (solid line) together with the ± 95 % confidence limits (dotted
line).
Recurvirostra avosettaDK: Klyde D: Säbelschnäbler NL: Kluut
04560
(A) Overall trend in the International Wadden Sea (B) Trends in the different countries compared
(E) Niedersachsen/Hamburg
0
5,000
10,000
15,000
20,000
25,000
30,000
1985 1990 1995 2000 2005 2010 2015
0
2,000
4,000
6,000
8,000
10,000
1985 1990 1995 2000 2005 2010 2015Trend DK Trend SH Trend Nds/HH Trend NL
0
1,000
2,000
3,000
4,000
5,000
6,000
1985 1990 1995 2000 2005 2010 20150
1,000
2,000
3,000
4,000
5,000
6,000
1985 1990 1995 2000 2005 2010 2015
0
2,000
4,000
6,000
8,000
10,000
1985 1990 1995 2000 2005 2010 20150
2,000
4,000
6,000
8,000
10,000
1985 1990 1995 2000 2005 2010 2015
Area Period 1987/88 - 2010/11
1998/99 - 2010/11
(A)/(B) International Wadden Sea
(C) Denmark
(D) Schleswig-Holstein
(E) Niedersachsen/Hamburg
(F) The Netherlands
strong increase moderate increasestrong decrease
moderate decrease stable uncertain
0
5,000
10,000
15,000
20,000
25,000
30,000
DK SH Nds/HH NL
Figure 99Absolute numbers of Pied Avocet in the four regions
calculated by average of the 3 maximum numbers in the period 2001/2002-
2010/2011.

30
Migratory Bird Trends until 2010/2011
Species Accounts
Explanatory NoteThree populations of Great Ringed Plover pass the Wadden Sea during migration, C. h. hiaticula be-ing present from October to April, but large numbers of both the arctic breeding C. h. tundrae and C. h. psammodroma coming through during May. Overall results are fluctuating, but show a moderate increase for the entire Wadden Sea and even a strong long-term increase for the Netherlands. Numbers in Niedersachsen/Hamburg are decreasing overall, fluctuating in Denmark.
(D) Schleswig-Holstein
(F) The Netherlands
(C) Denmark
Trends for Great Ringed Plover in the Wadden SeaFigures represent the trend 1987/1988 to 2010/2011, taking into account data from all months to express an overall trend for the entire year. Numbers on the y-axis represent monthly mean occurrences. Dots are the individual yearly estimates, solid lines the trend calculated by TrendSpotter, dotted lines the 95% confidence limits of the trend lines.
Figure 100-105Trends of Great Ringed
Plover in the International Wadden Sea (WS) and the
four regions 1987/1988-2010/2011; dots represent annual averages; trendline calculated by Trendspotter
(solid line) together with the ± 95 % confidence limits
(dotted line).
Charadrius hiaticulaDK: Stor Præstekrave D: Sandregenpfeifer NL: Bontbekplevier
04700
(A) Overall trend in the International Wadden Sea (B) Trends in the different countries compared
(E) Niedersachsen/Hamburg
0
2,000
4,000
6,000
8,000
10,000
12,000
1985 1990 1995 2000 2005 2010 2015
0
1,000
2,000
3,000
4,000
5,000
1985 1990 1995 2000 2005 2010 2015Trend DK Trend SH Trend Nds/HH Trend NL
0
200
400
600
800
1,000
1985 1990 1995 2000 2005 2010 20150
2,000
4,000
6,000
8,000
10,000
1985 1990 1995 2000 2005 2010 2015
0
1,000
2,000
3,000
4,000
5,000
1985 1990 1995 2000 2005 2010 20150
1,000
2,000
3,000
4,000
5,000
1985 1990 1995 2000 2005 2010 2015
Great Ringed Plover
Area Period 1987/88 - 2010/11
1998/99 - 2010/11
(A)/(B) International Wadden Sea
(C) Denmark
(D) Schleswig-Holstein
(E) Niedersachsen/Hamburg
(F) The Netherlands
strong increase moderate increasestrong decrease
moderate decrease stable uncertain
0
5,000
10,000
15,000
20,000
25,000
DK SH Nds/HH NL
Figure 106Absolute numbers of Great
Ringed Plover in the four re-gions calculated by average of the 3 maximum numbers
in the period 2001/2002-2010/2011.
31
Migratory Bird Trends until 2010/2011
Species Accounts
Kentish Plover
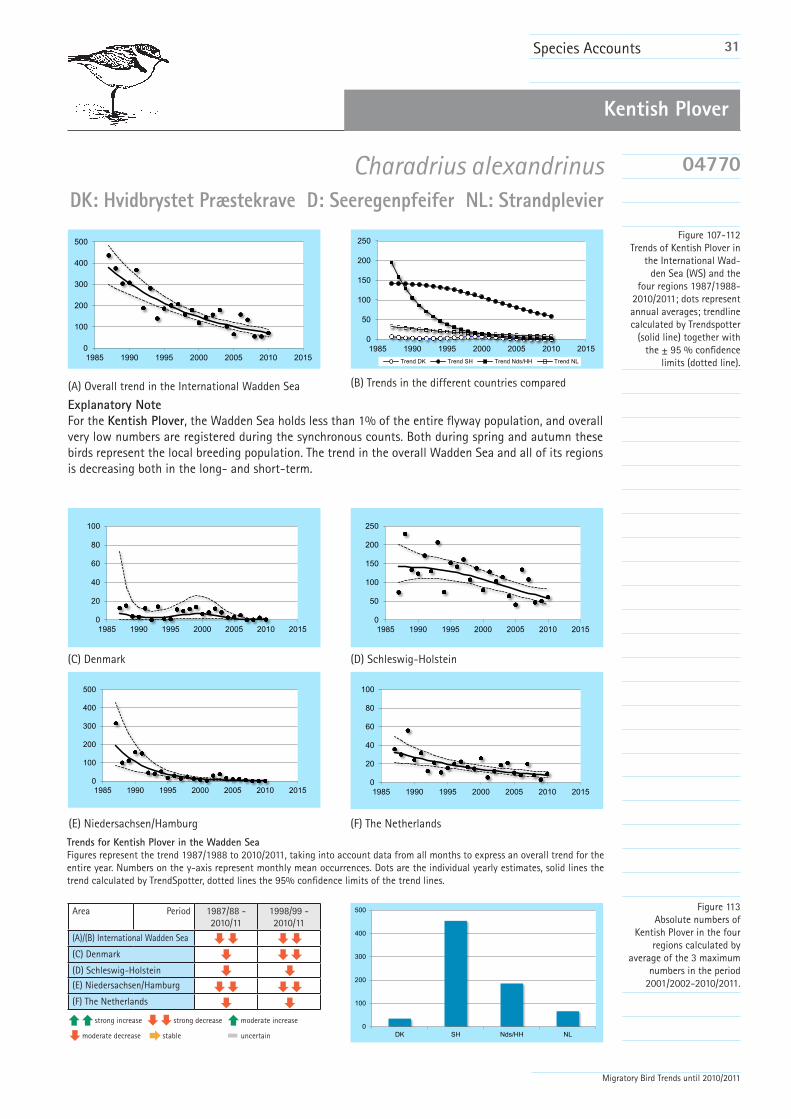
Explanatory NoteFor the Kentish Plover, the Wadden Sea holds less than 1% of the entire flyway population, and overall very low numbers are registered during the synchronous counts. Both during spring and autumn these birds represent the local breeding population. The trend in the overall Wadden Sea and all of its regions is decreasing both in the long- and short-term.
(D) Schleswig-Holstein
(F) The Netherlands
(C) Denmark
Trends for Kentish Plover in the Wadden SeaFigures represent the trend 1987/1988 to 2010/2011, taking into account data from all months to express an overall trend for the entire year. Numbers on the y-axis represent monthly mean occurrences. Dots are the individual yearly estimates, solid lines the trend calculated by TrendSpotter, dotted lines the 95% confidence limits of the trend lines.
Figure 107-112Trends of Kentish Plover in
the International Wad-den Sea (WS) and the
four regions 1987/1988-2010/2011; dots represent annual averages; trendline calculated by Trendspotter
(solid line) together with the ± 95 % confidence
limits (dotted line).
Charadrius alexandrinusDK: Hvidbrystet Præstekrave D: Seeregenpfeifer NL: Strandplevier
04770
(A) Overall trend in the International Wadden Sea (B) Trends in the different countries compared
(E) Niedersachsen/Hamburg
0
100
200
300
400
500
1985 1990 1995 2000 2005 2010 2015
0
50
100
150
200
250
1985 1990 1995 2000 2005 2010 2015Trend DK Trend SH Trend Nds/HH Trend NL
0
20
40
60
80
100
1985 1990 1995 2000 2005 2010 20150
50
100
150
200
250
1985 1990 1995 2000 2005 2010 2015
0
100
200
300
400
500
1985 1990 1995 2000 2005 2010 20150
20
40
60
80
100
1985 1990 1995 2000 2005 2010 2015
Area Period 1987/88 - 2010/11
1998/99 - 2010/11
(A)/(B) International Wadden Sea
(C) Denmark
(D) Schleswig-Holstein
(E) Niedersachsen/Hamburg
(F) The Netherlands
strong increase moderate increasestrong decrease
moderate decrease stable uncertain
0
100
200
300
400
500
DK SH Nds/HH NL
Figure 113Absolute numbers of
Kentish Plover in the four regions calculated by
average of the 3 maximum numbers in the period
2001/2002-2010/2011.

32
Migratory Bird Trends until 2010/2011
Species Accounts
European Golden Plover
Explanatory NoteOf the European Golden Plover, three sub-populations may occur in the Wadden Sea, with the largest share be-longing to the sub-population P. a. altifrons, which breeds in Northern Europe and winters in Central and Western Europe and North-West Africa. Only a small part of that population is covered by the coordinated counts in the Wadden Sea as most birds roost on fields and meadows further inland. The overall trend in the Wadden Sea and its regions is decreasing in both the long- and the short-term trends; only in the Netherlands, the long-term trend is still stable, but maybe turning into a decrease.
(D) Schleswig-Holstein
(F) The Netherlands
(C) Denmark
Trends for European Golden Plover in the Wadden SeaFigures represent the trend 1987/1988 to 2010/2011, taking into account data from all months to express an overall trend for the entire year. Numbers on the y-axis represent monthly mean occurrences. Dots are the individual yearly estimates, solid lines the trend calculated by TrendSpotter, dotted lines the 95% confidence limits of the trend lines.
Figure 114-119Trends of European Golden Plover in the International Wadden Sea (WS) and the
four regions 1987/1988-2010/2011; dots represent annual averages; trendline calculated by Trendspotter
(solid line) together with the ± 95 % confidence limits
(dotted line).
Pluvialis apricariaDK: Hjejle D: Goldregenpfeifer NL: Goudplevier
04850
(A) Overall trend in the International Wadden Sea (B) Trends in the different countries compared
(E) Niedersachsen/Hamburg
0
20,000
40,000
60,000
80,000
100,000
1985 1990 1995 2000 2005 2010 2015
0
5,000
10,000
15,000
20,000
25,000
30,000
1985 1990 1995 2000 2005 2010 2015Trend DK Trend SH Trend Nds/HH Trend NL
0
5,000
10,000
15,000
20,000
25,000
30,000
1985 1990 1995 2000 2005 2010 20150
5,000
10,000
15,000
20,000
25,000
30,000
1985 1990 1995 2000 2005 2010 2015
0
3,000
6,000
9,000
12,000
15,000
1985 1990 1995 2000 2005 2010 20150
5,000
10,000
15,000
20,000
25,000
30,000
1985 1990 1995 2000 2005 2010 2015
Area Period 1987/88 - 2010/11
1998/99 - 2010/11
(A)/(B) International Wadden Sea
(C) Denmark
(D) Schleswig-Holstein
(E) Niedersachsen/Hamburg
(F) The Netherlands
strong increase moderate increasestrong decrease
moderate decrease stable uncertain
0
15,000
30,000
45,000
60,000
DK SH Nds/HH NL
Figure 120Absolute numbers of
European Golden Plover in the four regions calculated by average of the 3 maxi-
mum numbers in the period 2001/2002-2010/2011.
33
Migratory Bird Trends until 2010/2011
Species Accounts
Grey Plover
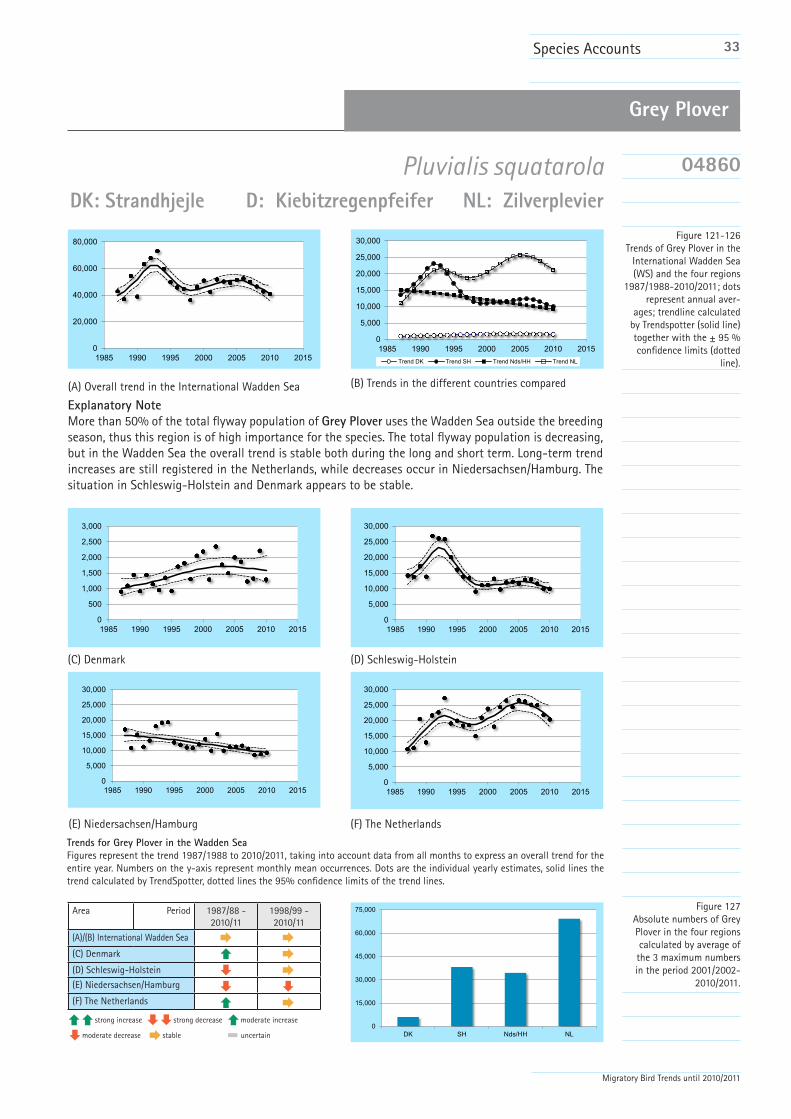
Explanatory NoteMore than 50% of the total flyway population of Grey Plover uses the Wadden Sea outside the breeding season, thus this region is of high importance for the species. The total flyway population is decreasing, but in the Wadden Sea the overall trend is stable both during the long and short term. Long-term trend increases are still registered in the Netherlands, while decreases occur in Niedersachsen/Hamburg. The situation in Schleswig-Holstein and Denmark appears to be stable.
(D) Schleswig-Holstein
(F) The Netherlands
(C) Denmark
Trends for Grey Plover in the Wadden SeaFigures represent the trend 1987/1988 to 2010/2011, taking into account data from all months to express an overall trend for the entire year. Numbers on the y-axis represent monthly mean occurrences. Dots are the individual yearly estimates, solid lines the trend calculated by TrendSpotter, dotted lines the 95% confidence limits of the trend lines.
Figure 121-126Trends of Grey Plover in the
International Wadden Sea (WS) and the four regions
1987/1988-2010/2011; dots represent annual aver-
ages; trendline calculated by Trendspotter (solid line) together with the ± 95 % confidence limits (dotted
line).
Pluvialis squatarolaDK: Strandhjejle D: Kiebitzregenpfeifer NL: Zilverplevier
04860
(A) Overall trend in the International Wadden Sea (B) Trends in the different countries compared
(E) Niedersachsen/Hamburg
0
20,000
40,000
60,000
80,000
1985 1990 1995 2000 2005 2010 2015
0
5,000
10,000
15,000
20,000
25,000
30,000
1985 1990 1995 2000 2005 2010 2015Trend DK Trend SH Trend Nds/HH Trend NL
0
500
1,000
1,500
2,000
2,500
3,000
1985 1990 1995 2000 2005 2010 20150
5,000
10,000
15,000
20,000
25,000
30,000
1985 1990 1995 2000 2005 2010 2015
0
5,000
10,000
15,000
20,000
25,000
30,000
1985 1990 1995 2000 2005 2010 20150
5,000
10,000
15,000
20,000
25,000
30,000
1985 1990 1995 2000 2005 2010 2015
Area Period 1987/88 - 2010/11
1998/99 - 2010/11
(A)/(B) International Wadden Sea
(C) Denmark
(D) Schleswig-Holstein
(E) Niedersachsen/Hamburg
(F) The Netherlands
strong increase moderate increasestrong decrease
moderate decrease stable uncertain
0
15,000
30,000
45,000
60,000
75,000
DK SH Nds/HH NL
Figure 127Absolute numbers of Grey Plover in the four regions calculated by average of the 3 maximum numbers in the period 2001/2002-
2010/2011.

34
Migratory Bird Trends until 2010/2011
Species Accounts
Northern Lapwing
Explanatory NoteOnly a small fraction of the decreasing Northern Lapwing flyway population uses the Wadden Sea. Registered numbers show considerable fluctuations, but the overall Wadden Sea trends are stable.
(D) Schleswig-Holstein
(F) The Netherlands
(C) Denmark
Trends for Northern Lapwing in the Wadden SeaFigures represent the trend 1987/1988 to 2010/2011, taking into account data from all months to express an overall trend for the entire year. Numbers on the y-axis represent monthly mean occurrences. Dots are the individual yearly estimates, solid lines the trend calculated by TrendSpotter, dotted lines the 95% confidence limits of the trend lines.
Figure 128-133Trends of Northern Lapwing in the International Wadden
Sea (WS) and the four re-gions 1987/1988-2010/2011;
dots represent annual aver-ages; trendline calculated
by Trendspotter (solid line) together with the ± 95 % confidence limits (dotted
line).
Vanellus vanellusDK: Vibe D: Kiebitz NL: Kievit
04930
(A) Overall trend in the International Wadden Sea (B) Trends in the different countries compared
(E) Niedersachsen/Hamburg
0
10,000
20,000
30,000
40,000
50,000
60,000
1985 1990 1995 2000 2005 2010 2015
0
2,000
4,000
6,000
8,000
10,000
12,000
1985 1990 1995 2000 2005 2010 2015Trend DK Trend SH Trend Nds/HH Trend NL
0
2,000
4,000
6,000
8,000
10,000
12,000
1985 1990 1995 2000 2005 2010 20150
5,000
10,000
15,000
20,000
25,000
1985 1990 1995 2000 2005 2010 2015
0
5,000
10,000
15,000
20,000
25,000
1985 1990 1995 2000 2005 2010 20150
5,000
10,000
15,000
20,000
25,000
1985 1990 1995 2000 2005 2010 2015
Area Period 1987/88 - 2010/11
1998/99 - 2010/11
(A)/(B) International Wadden Sea
(C) Denmark
(D) Schleswig-Holstein
(E) Niedersachsen/Hamburg
(F) The Netherlands
strong increase moderate increasestrong decrease
moderate decrease stable uncertain
0
10,000
20,000
30,000
40,000
50,000
DK SH Nds/HH NL
Figure 134Absolute numbers of
Northern Lapwing in the four regions calculated by
average of the 3 maximum numbers in the period
2001/2002-2010/2011.

35
Migratory Bird Trends until 2010/2011
Species Accounts
Red Knot
Explanatory NoteLarge parts of both flyway populations of the Red Knot, the C. c. canutus migrating from Africa to Siberia and the C. c. islandica wintering in the European regions and breeding in Greenland and Canada, use the Wadden Sea . Both the overall long- and short-term trends in the Wadden Sea are stable, while the data indicate a po-tential decrease. Continuous decreases occur in Schleswig-Holstein, while numbers in Denmark are increasing and in the Netherlands are stable. In Niedersachsen/Hamburg numbers are on a low level.
(D) Schleswig-Holstein
(F) The Netherlands
(C) Denmark
Trends for Red Knot in the Wadden SeaFigures represent the trend 1987/1988 to 2010/2011, taking into account data from all months to express an overall trend for the entire year. Numbers on the y-axis represent monthly mean occurrences. Dots are the individual yearly estimates, solid lines the trend calculated by TrendSpotter, dotted lines the 95% confidence limits of the trend lines.
Figure 135-140Trends of Red Knot in the
International Wadden Sea (WS) and the four regions
1987/1988-2010/2011; dots represent annual aver-
ages; trendline calculated by Trendspotter (solid line) together with the ± 95 % confidence limits (dotted
line).
Calidris canutusDK: Islandsk Ryle D: Knutt NL: Kanoetstrandloper
04960
(A) Overall trend in the International Wadden Sea (B) Trends in the different countries compared
(E) Niedersachsen/Hamburg
0
50,000
100,000
150,000
200,000
250,000
300,000
1985 1990 1995 2000 2005 2010 2015
0
25,000
50,000
75,000
100,000
125,000
150,000
1985 1990 1995 2000 2005 2010 2015Trend DK Trend SH Trend Nds/HH Trend NL
0
10,000
20,000
30,000
40,000
50,000
1985 1990 1995 2000 2005 2010 20150
30,000
60,000
90,000
120,000
150,000
1985 1990 1995 2000 2005 2010 2015
0
5,000
10,000
15,000
20,000
1985 1990 1995 2000 2005 2010 20150
20,000
40,000
60,000
80,000
100,000
1985 1990 1995 2000 2005 2010 2015
Area Period 1987/88 - 2010/11
1998/99 - 2010/11
(A)/(B) International Wadden Sea
(C) Denmark
(D) Schleswig-Holstein
(E) Niedersachsen/Hamburg
(F) The Netherlands
strong increase moderate increasestrong decrease
moderate decrease stable uncertain
0
50,000
100,000
150,000
200,000
250,000
DK SH Nds/HH NL
Figure 141Absolute numbers of Red Knot in the four regions calculated by average of the 3 maximum numbers in the period 2001/2002-
2010/2011.
36
Migratory Bird Trends until 2010/2011
Species Accounts
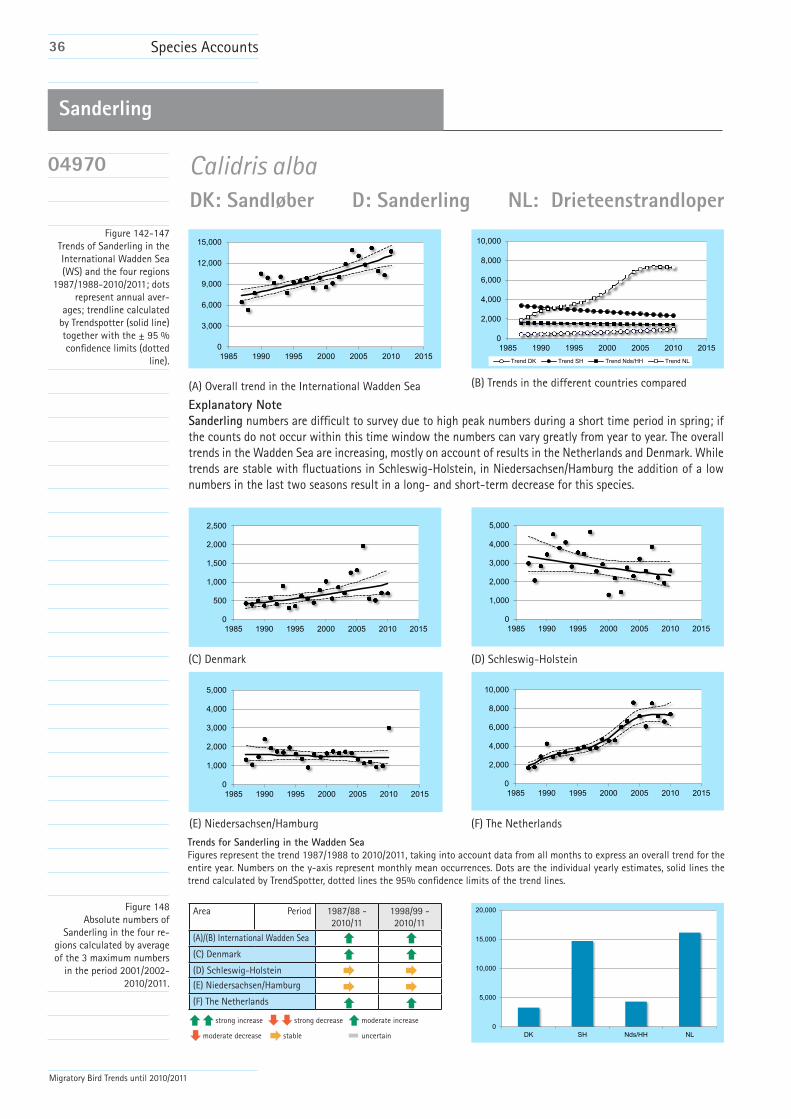
Sanderling
Explanatory NoteSanderling numbers are difficult to survey due to high peak numbers during a short time period in spring; if the counts do not occur within this time window the numbers can vary greatly from year to year. The overall trends in the Wadden Sea are increasing, mostly on account of results in the Netherlands and Denmark. While trends are stable with fluctuations in Schleswig-Holstein, in Niedersachsen/Hamburg the addition of a low numbers in the last two seasons result in a long- and short-term decrease for this species.
(D) Schleswig-Holstein
(F) The Netherlands
(C) Denmark
Trends for Sanderling in the Wadden SeaFigures represent the trend 1987/1988 to 2010/2011, taking into account data from all months to express an overall trend for the entire year. Numbers on the y-axis represent monthly mean occurrences. Dots are the individual yearly estimates, solid lines the trend calculated by TrendSpotter, dotted lines the 95% confidence limits of the trend lines.
Figure 142-147Trends of Sanderling in the International Wadden Sea (WS) and the four regions
1987/1988-2010/2011; dots represent annual aver-
ages; trendline calculated by Trendspotter (solid line) together with the ± 95 % confidence limits (dotted
line).
Calidris albaDK: Sandløber D: Sanderling NL: Drieteenstrandloper
04970
(A) Overall trend in the International Wadden Sea (B) Trends in the different countries compared
(E) Niedersachsen/Hamburg
0
3,000
6,000
9,000
12,000
15,000
1985 1990 1995 2000 2005 2010 2015
0
2,000
4,000
6,000
8,000
10,000
1985 1990 1995 2000 2005 2010 2015Trend DK Trend SH Trend Nds/HH Trend NL
0
500
1,000
1,500
2,000
2,500
1985 1990 1995 2000 2005 2010 20150
1,000
2,000
3,000
4,000
5,000
1985 1990 1995 2000 2005 2010 2015
0
1,000
2,000
3,000
4,000
5,000
1985 1990 1995 2000 2005 2010 20150
2,000
4,000
6,000
8,000
10,000
1985 1990 1995 2000 2005 2010 2015
Area Period 1987/88 - 2010/11
1998/99 - 2010/11
(A)/(B) International Wadden Sea
(C) Denmark
(D) Schleswig-Holstein
(E) Niedersachsen/Hamburg
(F) The Netherlands
strong increase moderate increasestrong decrease
moderate decrease stable uncertain
0
5,000
10,000
15,000
20,000
DK SH Nds/HH NL
Figure 148Absolute numbers of
Sanderling in the four re-gions calculated by average of the 3 maximum numbers
in the period 2001/2002-2010/2011.
37
Migratory Bird Trends until 2010/2011
Species Accounts
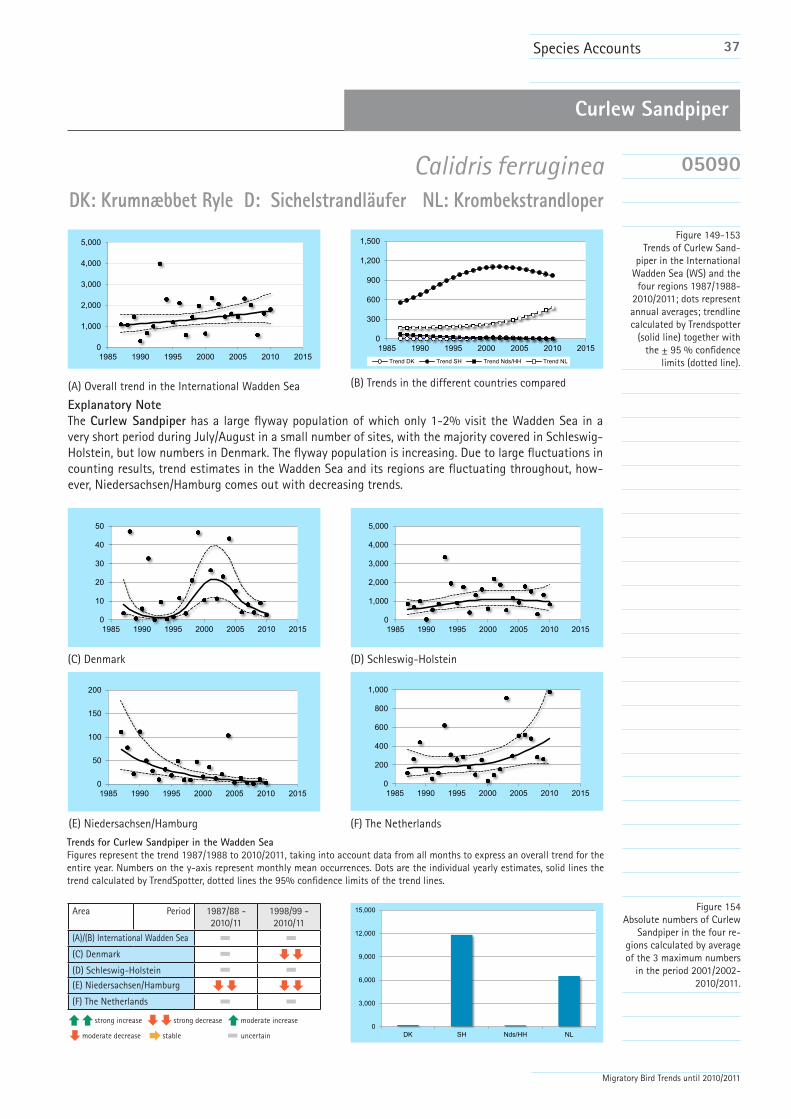
Curlew Sandpiper
Explanatory NoteThe Curlew Sandpiper has a large flyway population of which only 1-2% visit the Wadden Sea in a very short period during July/August in a small number of sites, with the majority covered in Schleswig-Holstein, but low numbers in Denmark. The flyway population is increasing. Due to large fluctuations in counting results, trend estimates in the Wadden Sea and its regions are fluctuating throughout, how-ever, Niedersachsen/Hamburg comes out with decreasing trends.
(D) Schleswig-Holstein
(F) The Netherlands
(C) Denmark
Trends for Curlew Sandpiper in the Wadden SeaFigures represent the trend 1987/1988 to 2010/2011, taking into account data from all months to express an overall trend for the entire year. Numbers on the y-axis represent monthly mean occurrences. Dots are the individual yearly estimates, solid lines the trend calculated by TrendSpotter, dotted lines the 95% confidence limits of the trend lines.
Figure 149-153Trends of Curlew Sand-
piper in the International Wadden Sea (WS) and the
four regions 1987/1988-2010/2011; dots represent annual averages; trendline calculated by Trendspotter
(solid line) together with the ± 95 % confidence
limits (dotted line).
Calidris ferrugineaDK: Krumnæbbet Ryle D: Sichelstrandläufer NL: Krombekstrandloper
05090
(A) Overall trend in the International Wadden Sea (B) Trends in the different countries compared
(E) Niedersachsen/Hamburg
0
1,000
2,000
3,000
4,000
5,000
1985 1990 1995 2000 2005 2010 2015
0
300
600
900
1,200
1,500
1985 1990 1995 2000 2005 2010 2015Trend DK Trend SH Trend Nds/HH Trend NL
0
10
20
30
40
50
1985 1990 1995 2000 2005 2010 20150
1,000
2,000
3,000
4,000
5,000
1985 1990 1995 2000 2005 2010 2015
0
50
100
150
200
1985 1990 1995 2000 2005 2010 20150
200
400
600
800
1,000
1985 1990 1995 2000 2005 2010 2015
Area Period 1987/88 - 2010/11
1998/99 - 2010/11
(A)/(B) International Wadden Sea
(C) Denmark
(D) Schleswig-Holstein
(E) Niedersachsen/Hamburg
(F) The Netherlands
strong increase moderate increasestrong decrease
moderate decrease stable uncertain
0
3,000
6,000
9,000
12,000
15,000
DK SH Nds/HH NL
Figure 154Absolute numbers of Curlew
Sandpiper in the four re-gions calculated by average of the 3 maximum numbers
in the period 2001/2002-2010/2011.

38
Migratory Bird Trends until 2010/2011
Species Accounts
Dunlin
Explanatory NoteWhile the trends for the flyway populations of the two sub-species of Dunlin (C.c. alpina and C.c. schinzii) are stable, the overall long- and short-term trends in the Wadden Sea, where large numbers and most likely large proportions of these flyway populations are present during the yearly cycle, show moderate decreases. Most notable are decreases in the Northern region (Denmark, Schleswig-Holstein), and opposite to these increases in the Netherlands; stable but fluctuating numbers seem to apply for Niedersachsen/Hamburg.
(D) Schleswig-Holstein
(F) The Netherlands
(C) Denmark
Trends for Dunlin in the Wadden SeaFigures represent the trend 1987/1988 to 2010/2011, taking into account data from all months to express an overall trend for the entire year. Numbers on the y-axis represent monthly mean occurrences. Dots are the individual yearly estimates, solid lines the trend calculated by TrendSpotter, dotted lines the 95% confidence limits of the trend lines.
Figure 155-160Trends of Dunlin in the
International Wadden Sea (WS) and the four regions
1987/1988-2010/2011; dots represent annual aver-
ages; trendline calculated by Trendspotter (solid line) together with the ± 95 % confidence limits (dotted
line).
Calidris alpinaDK: Almindelig Ryle D: Alpenstrandläufer NL: Bonte Strandloper
05120
(A) Overall trend in the International Wadden Sea (B) Trends in the different countries compared
(E) Niedersachsen/Hamburg
0
200,000
400,000
600,000
800,000
1985 1990 1995 2000 2005 2010 2015
0
50,000
100,000
150,000
200,000
250,000
1985 1990 1995 2000 2005 2010 2015Trend DK Trend SH Trend Nds/HH Trend NL
0
30,000
60,000
90,000
120,000
150,000
1985 1990 1995 2000 2005 2010 20150
50,000
100,000
150,000
200,000
250,000
300,000
1985 1990 1995 2000 2005 2010 2015
0
50,000
100,000
150,000
200,000
1985 1990 1995 2000 2005 2010 20150
50,000
100,000
150,000
200,000
250,000
300,000
1985 1990 1995 2000 2005 2010 2015
Area Period 1987/88 - 2010/11
1998/99 - 2010/11
(A)/(B) International Wadden Sea
(C) Denmark
(D) Schleswig-Holstein
(E) Niedersachsen/Hamburg
(F) The Netherlands
strong increase moderate increasestrong decrease
moderate decrease stable uncertain
0
100,000
200,000
300,000
400,000
500,000
DK SH Nds/HH NL
Figure 161Absolute numbers of
Dunlin in the four regions calculated by average of the 3 maximum numbers in the period 2001/2002-
2010/2011.
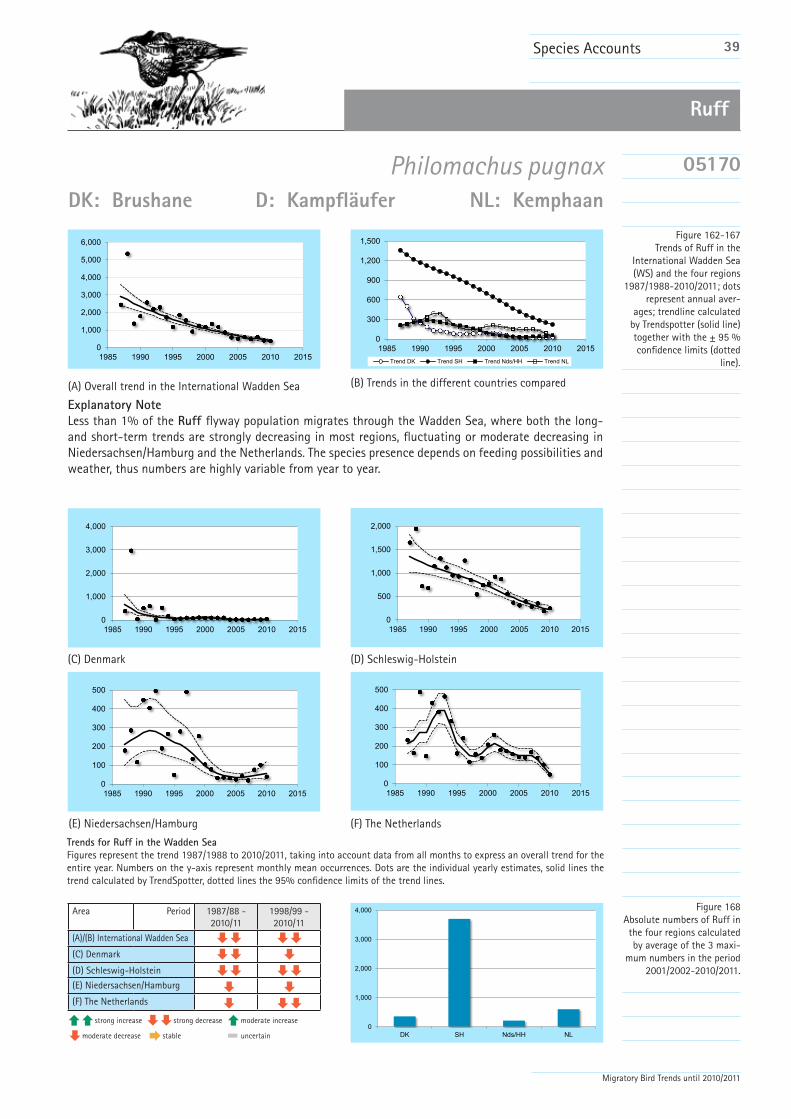
39
Migratory Bird Trends until 2010/2011
Species Accounts
Ruff
Explanatory NoteLess than 1% of the Ruff flyway population migrates through the Wadden Sea, where both the long- and short-term trends are strongly decreasing in most regions, fluctuating or moderate decreasing in Niedersachsen/Hamburg and the Netherlands. The species presence depends on feeding possibilities and weather, thus numbers are highly variable from year to year.
(D) Schleswig-Holstein
(F) The Netherlands
(C) Denmark
Trends for Ruff in the Wadden SeaFigures represent the trend 1987/1988 to 2010/2011, taking into account data from all months to express an overall trend for the entire year. Numbers on the y-axis represent monthly mean occurrences. Dots are the individual yearly estimates, solid lines the trend calculated by TrendSpotter, dotted lines the 95% confidence limits of the trend lines.
Figure 162-167Trends of Ruff in the
International Wadden Sea (WS) and the four regions
1987/1988-2010/2011; dots represent annual aver-
ages; trendline calculated by Trendspotter (solid line) together with the ± 95 % confidence limits (dotted
line).
Philomachus pugnaxDK: Brushane D: Kampfläufer NL: Kemphaan
05170
(A) Overall trend in the International Wadden Sea (B) Trends in the different countries compared
(E) Niedersachsen/Hamburg
0
1,000
2,000
3,000
4,000
5,000
6,000
1985 1990 1995 2000 2005 2010 2015
0
300
600
900
1,200
1,500
1985 1990 1995 2000 2005 2010 2015Trend DK Trend SH Trend Nds/HH Trend NL
0
1,000
2,000
3,000
4,000
1985 1990 1995 2000 2005 2010 20150
500
1,000
1,500
2,000
1985 1990 1995 2000 2005 2010 2015
0
100
200
300
400
500
1985 1990 1995 2000 2005 2010 20150
100
200
300
400
500
1985 1990 1995 2000 2005 2010 2015
Area Period 1987/88 - 2010/11
1998/99 - 2010/11
(A)/(B) International Wadden Sea
(C) Denmark
(D) Schleswig-Holstein
(E) Niedersachsen/Hamburg
(F) The Netherlands
strong increase moderate increasestrong decrease
moderate decrease stable uncertain
0
1,000
2,000
3,000
4,000
DK SH Nds/HH NL
Figure 168Absolute numbers of Ruff in the four regions calculated by average of the 3 maxi-
mum numbers in the period 2001/2002-2010/2011.

40
Migratory Bird Trends until 2010/2011
Species Accounts
Bar-tailed Godwit
Explanatory NoteTwo populations of the Bar-tailed Godwit migrate through the Wadden Sea; the nominate sub-species L. l. lapponica breeds in high arc-tic Scandinavia and Northern Russia, and winters in coastal Western Europe and North-West Africa, and thus is present in the Wadden Sea most of the year from September to April. The L. l. taymyrensis breeds in Western and Central Siberia and winters in coastal West and South-West Africa; individuals of this population will migrate through the Wadden Sea in May and returning during July and August.Overall numbers in the Wadden Sea are stable. Yet, most remarkably is the contrast of a continuous increase in the Netherlands to a continuous decrease in Schleswig-Holstein and Denmark; numbers in Niedersachsen/Hamburg are stable.
(D) Schleswig-Holstein
(F) The Netherlands
(C) Denmark
Trends for Bar-tailed Godwit in the Wadden SeaFigures represent the trend 1987/1988 to 2010/2011, taking into account data from all months to express an overall trend for the entire year. Numbers on the y-axis represent monthly mean occurrences. Dots are the individual yearly estimates, solid lines the trend calculated by TrendSpotter, dotted lines the 95% confidence limits of the trend lines.
Figure 169-174Trends of Bar-tailed Godwit in the International Wadden
Sea (WS) and the fourregions 1987/1988-
2010/2011; dots represent annual averages; trendline calculated by Trendspotter
(solid line) together with the ± 95 % confidence limits
(dotted line).
Limosa lapponicaDK: Lille Kobbersneppe D: Pfuhlschnepfe NL: Rosse Grutto
05340
(A) Overall trend in the International Wadden Sea (B) Trends in the different countries compared
(E) Niedersachsen/Hamburg
0
20,000
40,000
60,000
80,000
100,000
120,000
1985 1990 1995 2000 2005 2010 2015
0
20,000
40,000
60,000
80,000
100,000
1985 1990 1995 2000 2005 2010 2015Trend DK Trend SH Trend Nds/HH Trend NL
0
3,000
6,000
9,000
12,000
15,000
1985 1990 1995 2000 2005 2010 20150
10,000
20,000
30,000
40,000
50,000
1985 1990 1995 2000 2005 2010 2015
0
3,000
6,000
9,000
12,000
15,000
1985 1990 1995 2000 2005 2010 20150
20,000
40,000
60,000
80,000
100,000
1985 1990 1995 2000 2005 2010 2015
Area Period 1987/88 - 2010/11
1998/99 - 2010/11
(A)/(B) International Wadden Sea
(C) Denmark
(D) Schleswig-Holstein
(E) Niedersachsen/Hamburg
(F) The Netherlands
strong increase moderate increasestrong decrease
moderate decrease stable uncertain
0
50,000
100,000
150,000
200,000
DK SH Nds/HH NL
Figure 175Absolute numbers of Bar-
tailed Godwit in the four re-gions calculated by average of the 3 maximum numbers
in the period 2001/2002-2010/2011.

41
Migratory Bird Trends until 2010/2011
Species Accounts
Whimbrel
Explanatory NoteOnly 1-2% of the Whimbrel flyway population is counted in the Wadden Sea region. Long- and short-term trends are decreasing in the Wadden Sea, and also in Denmark and Niedersachsen/Hamburg. We see a stable situation in Schleswig-Holstein and fluctuations in the Netherlands. It must be noted, that overall very low numbers, large fluctuations and single exceptional counts do not allow a clear assess-ment.
(D) Schleswig-Holstein
(F) The Netherlands
(C) Denmark
Trends for Whimbrel in the Wadden SeaFigures represent the trend 1987/1988 to 2010/2011, taking into account data from all months to express an overall trend for the entire year. Numbers on the y-axis represent monthly mean occurrences. Dots are the individual yearly estimates, solid lines the trend calculated by TrendSpotter, dotted lines the 95% confidence limits of the trend lines.
Figure 176-181Trends of Whimbrel in the International Wadden Sea (WS) and the four regions
1987/1988-2010/2011; dots represent annual aver-
ages; trendline calculated by Trendspotter (solid line) together with the ± 95 % confidence limits (dotted
line).
Numenius phaeopusDK: Lille Regnspove D: Regenbrachvogel NL: Regenwulp
05380
(A) Overall trend in the International Wadden Sea (B) Trends in the different countries compared
(E) Niedersachsen/Hamburg
0
300
600
900
1,200
1,500
1985 1990 1995 2000 2005 2010 2015
0
100
200
300
400
500
1985 1990 1995 2000 2005 2010 2015Trend DK Trend SH Trend Nds/HH Trend NL
0
50
100
150
200
1985 1990 1995 2000 2005 2010 20150
50
100
150
200
1985 1990 1995 2000 2005 2010 2015
0
200
400
600
800
1,000
1985 1990 1995 2000 2005 2010 20150
200
400
600
800
1,000
1985 1990 1995 2000 2005 2010 2015
Area Period 1987/88 - 2010/11
1998/99 - 2010/11
(A)/(B) International Wadden Sea
(C) Denmark
(D) Schleswig-Holstein
(E) Niedersachsen/Hamburg
(F) The Netherlands
strong increase moderate increasestrong decrease
moderate decrease stable uncertain
0
1,000
2,000
3,000
DK SH Nds/HH NL
Figure 182Absolute numbers of
Whimbrel in the four re-gions calculated by average of the 3 maximum numbers
in the period 2001/2002-2010/2011.

42
Migratory Bird Trends until 2010/2011
Species Accounts
Eurasian Curlew
Explanatory NoteThe Eurasian Curlew flyway population is decreasing. However, the Wadden Sea population, represent-ing some 35-40% of the flyway population, is stable both in the long- and short-term trends. This includes increases in Denmark and moderate increases in the Netherlands, while Schleswig-Holstein shows long- and short-term decreases. In Niedersachsen/Hamburg the trend is fluctuating, but stable. The increase in Denmark, however of low numbers, seems to level off in recent seasons.
(D) Schleswig-Holstein
(F) The Netherlands
(C) Denmark
Trends for Eurasian Curlew in the Wadden SeaFigures represent the trend 1987/1988 to 2010/2011, taking into account data from all months to express an overall trend for the entire year. Numbers on the y-axis represent monthly mean occurrences. Dots are the individual yearly estimates, solid lines the trend calculated by TrendSpotter, dotted lines the 95% confidence limits of the trend lines.
Figure 183-188Trends of Eurasian Curlew
in the International Wadden Sea (WS) and the four re-
gions 1987/1988-2010/2011; dots represent annual aver-
ages; trendline calculated by Trendspotter (solid line) together with the ± 95 % confidence limits (dotted
line).
Numenius arquataDK: Stor Regnspove D: Großer Brachvogel NL: Wulp
05410
(A) Overall trend in the International Wadden Sea (B) Trends in the different countries compared
(E) Niedersachsen/Hamburg
0
50,000
100,000
150,000
200,000
250,000
1985 1990 1995 2000 2005 2010 2015
0
20,000
40,000
60,000
80,000
100,000
1985 1990 1995 2000 2005 2010 2015Trend DK Trend SH Trend Nds/HH Trend NL
0
2,000
4,000
6,000
8,000
10,000
1985 1990 1995 2000 2005 2010 20150
10,000
20,000
30,000
40,000
50,000
1985 1990 1995 2000 2005 2010 2015
0
20,000
40,000
60,000
80,000
100,000
1985 1990 1995 2000 2005 2010 20150
30,000
60,000
90,000
120,000
150,000
1985 1990 1995 2000 2005 2010 2015
Area Period 1987/88 - 2010/11
1998/99 - 2010/11
(A)/(B) International Wadden Sea
(C) Denmark
(D) Schleswig-Holstein
(E) Niedersachsen/Hamburg
(F) The Netherlands
strong increase moderate increasestrong decrease
moderate decrease stable uncertain
0
50,000
100,000
150,000
200,000
DK SH Nds/HH NL
Figure 189Absolute numbers of
Eurasian Curlew in the four regions calculated by
average of the 3 maximum numbers in the period
2001/2002-2010/2011.

43
Migratory Bird Trends until 2010/2011
Species Accounts
Spotted Redshank
Explanatory NoteThe Spotted Redshank is difficult to monitor due to its short passage time period, with large numbers at only a few sites; only some 20% of its flyway population occur in the Wadden Sea. The overall Wadden Sea trend is a moderate decrease in both the long and the short-term, reflected in the Netherlands and Schleswig-Holstein. Trends in Denmark are fluctuating in low numbers and in Niedersachsen/Hamburg are also fluctuating, but resulting in a stable trend.
(D) Schleswig-Holstein
(F) The Netherlands
(C) Denmark
Trends for Spotted Redshank in the Wadden SeaFigures represent the trend 1987/1988 to 2010/2011, taking into account data from all months to express an overall trend for the entire year. Numbers on the y-axis represent monthly mean occurrences. Dots are the individual yearly estimates, solid lines the trend calculated by TrendSpotter, dotted lines the 95% confidence limits of the trend lines.
Figure 190-195Trends of Spotted Redshank
in the International Wad-den Sea (WS) and the
four regions 1987/1988-2010/2011; dots represent annual averages; trendline calculated by Trendspotter
(solid line) together with the ± 95 % confidence
limits (dotted line).
Tringa erythropusDK: Sortklire D: Dunkler Wasserläufer NL: Zwarte Ruiter
05450
(A) Overall trend in the International Wadden Sea (B) Trends in the different countries compared
(E) Niedersachsen/Hamburg
0
2,000
4,000
6,000
8,000
10,000
1985 1990 1995 2000 2005 2010 2015
0
1,000
2,000
3,000
4,000
5,000
1985 1990 1995 2000 2005 2010 2015Trend DK Trend SH Trend Nds/HH Trend NL
0
200
400
600
800
1,000
1985 1990 1995 2000 2005 2010 20150
1,000
2,000
3,000
4,000
5,000
1985 1990 1995 2000 2005 2010 2015
0
500
1,000
1,500
2,000
1985 1990 1995 2000 2005 2010 20150
1,000
2,000
3,000
4,000
5,000
1985 1990 1995 2000 2005 2010 2015
Area Period 1987/88 - 2010/11
1998/99 - 2010/11
(A)/(B) International Wadden Sea
(C) Denmark
(D) Schleswig-Holstein
(E) Niedersachsen/Hamburg
(F) The Netherlands
strong increase moderate increasestrong decrease
moderate decrease stable uncertain
0
2,000
4,000
6,000
8,000
10,000
DK SH Nds/HH NL
Figure 196Absolute numbers of Spot-
ted Redshank in the four re-gions calculated by average of the 3 maximum numbers
in the period 2001/2002-2010/2011.

44
Migratory Bird Trends until 2010/2011
Species Accounts
Common Redshank
Explanatory NoteThe Common Redshank occurs in the Wadden Sea most likely with four populations, thus numbers and trends are not easy to assess in relation to the flyway populations. While the overall Wadden Sea long, as well as short term trends are stable, increasing trends exist for Demark and the Netherlands and de-creasing trend results for Niedersachsen/Hamburg. Schleswig-Holstein now shows a long-term decrease after the peak during the early 1990s, but stable short-term trends.
(D) Schleswig-Holstein
(F) The Netherlands
(C) Denmark
Trends for Common Redshank in the Wadden SeaFigures represent the trend 1987/1988 to 2010/2011, taking into account data from all months to express an overall trend for the entire year. Numbers on the y-axis represent monthly mean occurrences. Dots are the individual yearly estimates, solid lines the trend calculated by TrendSpotter, dotted lines the 95% confidence limits of the trend lines.
Figure 197-202Trends of Common Red-
shank in the International Wadden Sea (WS) and the
four regions 1987/1988-2010/2011; dots represent annual averages; trendline calculated by Trendspotter
(solid line) together with the ± 95 % confidence limits
(dotted line).
Tringa totanusDK: Rødben D: Rotschenkel NL: Tureluur
05460
(A) Overall trend in the International Wadden Sea (B) Trends in the different countries compared
(E) Niedersachsen/Hamburg
0
10,000
20,000
30,000
40,000
50,000
1985 1990 1995 2000 2005 2010 2015
0
5,000
10,000
15,000
20,000
1985 1990 1995 2000 2005 2010 2015Trend DK Trend SH Trend Nds/HH Trend NL
0
500
1,000
1,500
2,000
2,500
3,000
1985 1990 1995 2000 2005 2010 20150
3,000
6,000
9,000
12,000
15,000
1985 1990 1995 2000 2005 2010 2015
0
3,000
6,000
9,000
12,000
15,000
1985 1990 1995 2000 2005 2010 20150
5,000
10,000
15,000
20,000
25,000
1985 1990 1995 2000 2005 2010 2015
Area Period 1987/88 - 2010/11
1998/99 - 2010/11
(A)/(B) International Wadden Sea
(C) Denmark
(D) Schleswig-Holstein
(E) Niedersachsen/Hamburg
(F) The Netherlands
strong increase moderate increasestrong decrease
moderate decrease stable uncertain
0
15,000
30,000
45,000
60,000
DK SH Nds/HH NL
Figure 203Absolute numbers of
Common Redshank in the four regions calculated by
average of the 3 maximum numbers in the period
2001/2002-2010/2011.

45
Migratory Bird Trends until 2010/2011
Species Accounts
Common Greenshank
Explanatory NoteThe Wadden Sea plays a minor role for the Common Greenshanks with only some 10% of the stable flyway population staging during autumn, and fewer during spring. The overall trends in the Wadden Sea are stable, yet fluctuating largely in low numbers. This can be stated also for most regions in the Wadden Sea, only in Schleswig-Holstein both long- and short-term trends show moderate but regular decreases.
(D) Schleswig-Holstein
(F) The Netherlands
(C) Denmark
Trends for Common Greenshank in the Wadden SeaFigures represent the trend 1987/1988 to 2010/2011, taking into account data from all months to express an overall trend for the entire year. Numbers on the y-axis represent monthly mean occurrences. Dots are the individual yearly estimates, solid lines the trend calculated by TrendSpotter, dotted lines the 95% confidence limits of the trend lines.
Figure 204-209Trends of Common Green-shank in the International Wadden Sea (WS) and the
four regions 1987/1988-2010/2011; dots represent annual averages; trendline calculated by Trendspotter
(solid line) together with the ± 95 % confidence
limits (dotted line).
Tringa nebulariaDK: Hvidklire D: Grünschenkel NL: Groenpootruiter
05480
(A) Overall trend in the International Wadden Sea (B) Trends in the different countries compared
(E) Niedersachsen/Hamburg
0
1,500
3,000
4,500
6,000
7,500
1985 1990 1995 2000 2005 2010 2015
0
500
1,000
1,500
2,000
2,500
1985 1990 1995 2000 2005 2010 2015Trend DK Trend SH Trend Nds/HH Trend NL
0
300
600
900
1,200
1,500
1985 1990 1995 2000 2005 2010 20150
500
1,000
1,500
2,000
2,500
1985 1990 1995 2000 2005 2010 2015
0
500
1,000
1,500
2,000
2,500
1985 1990 1995 2000 2005 2010 20150
1,000
2,000
3,000
4,000
5,000
1985 1990 1995 2000 2005 2010 2015
Area Period 1987/88 - 2010/11
1998/99 - 2010/11
(A)/(B) International Wadden Sea
(C) Denmark
(D) Schleswig-Holstein
(E) Niedersachsen/Hamburg
(F) The Netherlands
strong increase moderate increasestrong decrease
moderate decrease stable uncertain
0
2,000
4,000
6,000
8,000
10,000
DK SH Nds/HH NL
Figure 210Absolute numbers of
Common Greenshank in the four regions calculated by
average of the 3 maximum numbers in the period
2001/2002-2010/2011.

46
Migratory Bird Trends until 2010/2011
Species Accounts
Ruddy Turnstone
Explanatory NoteTwo populations of Ruddy Turnstone pass the Wadden Sea on migration. One population, breeds in Canada and Greenland and winters in Western Europe and North-West Africa and is present in the Wadden Sea most of the year from August to April. The other population breeds in Fennoscandia and North-West Russia and winters in Africa, and passes the Wadden Sea mainly during July and May.The overall Wadden Sea trend for this species is stable during the long-term and increasing during the last 10 years. Increases, in particular during the recent years, are found mainly in the Netherlands and Niedersachsen/Hamburg. Coverage of this species by the Trilateral Monitoring Program is generally poor and low numbers, in particular in Denmark, are registered.
(D) Schleswig-Holstein
(F) The Netherlands
(C) Denmark
Trends for Ruddy Turnstone in the Wadden SeaFigures represent the trend 1987/1988 to 2010/2011, taking into account data from all months to express an overall trend for the entire year. Numbers on the y-axis represent monthly mean occurrences. Dots are the individual yearly estimates, solid lines the trend calculated by TrendSpotter, dotted lines the 95% confidence limits of the trend lines.
Figure 211-216Trends of Ruddy Turn-
stone in the International Wadden Sea (WS) and the
four regions 1987/1988-2010/2011; dots represent annual averages; trendline calculated by Trendspotter
(solid line) together with the ± 95 % confidence limits
(dotted line).
Arenaria interpresDK: Stenvender D: Steinwälzer NL: Steenloper
05610
(A) Overall trend in the International Wadden Sea (B) Trends in the different countries compared
(E) Niedersachsen/Hamburg
0
2,000
4,000
6,000
8,000
10,000
1985 1990 1995 2000 2005 2010 2015
0
1,000
2,000
3,000
4,000
5,000
1985 1990 1995 2000 2005 2010 2015Trend DK Trend SH Trend Nds/HH Trend NL
0
50
100
150
200
250
1985 1990 1995 2000 2005 2010 20150
300
600
900
1,200
1,500
1985 1990 1995 2000 2005 2010 2015
0
500
1,000
1,500
2,000
1985 1990 1995 2000 2005 2010 20150
1,000
2,000
3,000
4,000
5,000
1985 1990 1995 2000 2005 2010 2015
Area Period 1987/88 - 2010/11
1998/99 - 2010/11
(A)/(B) International Wadden Sea
(C) Denmark
(D) Schleswig-Holstein
(E) Niedersachsen/Hamburg
(F) The Netherlands
strong increase moderate increasestrong decrease
moderate decrease stable uncertain
0
1,500
3,000
4,500
6,000
7,500
DK SH Nds/HH NL
Figure 217Absolute numbers of Ruddy
Turnstone in the four regions calculated by average of the 3 maximum numbers in the period 2001/2002-
2010/2011.
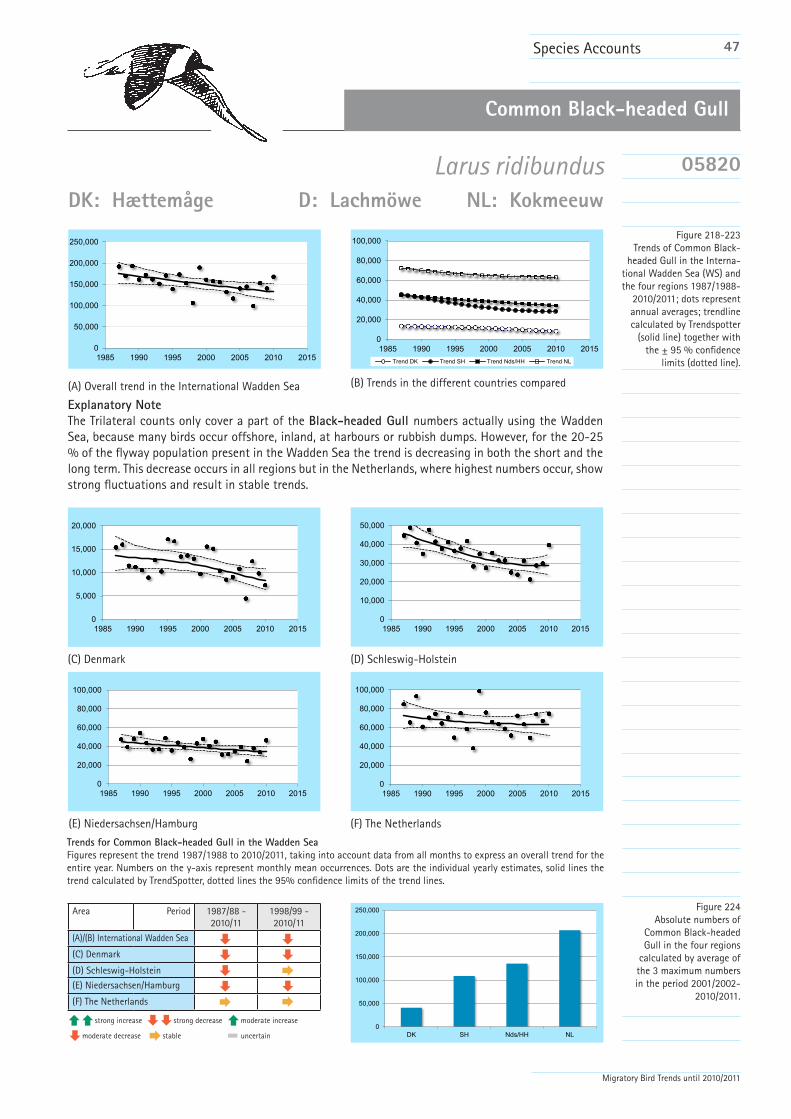
47
Migratory Bird Trends until 2010/2011
Species Accounts
Common Black-headed Gull
Explanatory NoteThe Trilateral counts only cover a part of the Black-headed Gull numbers actually using the Wadden Sea, because many birds occur offshore, inland, at harbours or rubbish dumps. However, for the 20-25 % of the flyway population present in the Wadden Sea the trend is decreasing in both the short and the long term. This decrease occurs in all regions but in the Netherlands, where highest numbers occur, show strong fluctuations and result in stable trends.
(D) Schleswig-Holstein
(F) The Netherlands
(C) Denmark
Trends for Common Black-headed Gull in the Wadden SeaFigures represent the trend 1987/1988 to 2010/2011, taking into account data from all months to express an overall trend for the entire year. Numbers on the y-axis represent monthly mean occurrences. Dots are the individual yearly estimates, solid lines the trend calculated by TrendSpotter, dotted lines the 95% confidence limits of the trend lines.
Figure 218-223Trends of Common Black-
headed Gull in the Interna-tional Wadden Sea (WS) and the four regions 1987/1988-
2010/2011; dots represent annual averages; trendline calculated by Trendspotter
(solid line) together with the ± 95 % confidence
limits (dotted line).
Larus ridibundusDK: Hættemåge D: Lachmöwe NL: Kokmeeuw
05820
(A) Overall trend in the International Wadden Sea (B) Trends in the different countries compared
(E) Niedersachsen/Hamburg
0
50,000
100,000
150,000
200,000
250,000
1985 1990 1995 2000 2005 2010 2015
0
20,000
40,000
60,000
80,000
100,000
1985 1990 1995 2000 2005 2010 2015Trend DK Trend SH Trend Nds/HH Trend NL
0
5,000
10,000
15,000
20,000
1985 1990 1995 2000 2005 2010 20150
10,000
20,000
30,000
40,000
50,000
1985 1990 1995 2000 2005 2010 2015
0
20,000
40,000
60,000
80,000
100,000
1985 1990 1995 2000 2005 2010 20150
20,000
40,000
60,000
80,000
100,000
1985 1990 1995 2000 2005 2010 2015
Area Period 1987/88 - 2010/11
1998/99 - 2010/11
(A)/(B) International Wadden Sea
(C) Denmark
(D) Schleswig-Holstein
(E) Niedersachsen/Hamburg
(F) The Netherlands
strong increase moderate increasestrong decrease
moderate decrease stable uncertain
0
50,000
100,000
150,000
200,000
250,000
DK SH Nds/HH NL
Figure 224Absolute numbers of
Common Black-headed Gull in the four regions
calculated by average of the 3 maximum numbers in the period 2001/2002-
2010/2011.

48
Migratory Bird Trends until 2010/2011
Species Accounts
Common Gull
Explanatory NoteSome 10-15% of the Common Gull flyway population use the Wadden Sea, however, many of them feed inland and only rest in the Wadden Sea during night. The overall long- and short-term trends are stable for the Wadden Sea; while numbers fluctuate in all regions, the northern regions (DK, SH) show slight decreases, fluctuations in Niedersachsen/Hamburg and an indication of a positive development in the Netherlands.
(D) Schleswig-Holstein
(F) The Netherlands
(C) Denmark
Trends for Common Gull in the Wadden SeaFigures represent the trend 1987/1988 to 2010/2011, taking into account data from all months to express an overall trend for the entire year. Numbers on the y-axis represent monthly mean occurrences. Dots are the individual yearly estimates, solid lines the trend calculated by TrendSpotter, dotted lines the 95% confidence limits of the trend lines.
Figure 225-230Trends of Common Gull in the International Wadden Sea (WS) and the four re-
gions 1987/1988-2010/2011; dots represent annual aver-
ages; trendline calculated by Trendspotter (solid line) together with the ± 95 % confidence limits (dotted
line).
Larus canusDK: Stormmåge D: Sturmmöwe NL: Stormmeeuw
05900
(A) Overall trend in the International Wadden Sea (B) Trends in the different countries compared
(E) Niedersachsen/Hamburg
0
20,000
40,000
60,000
80,000
100,000
1985 1990 1995 2000 2005 2010 2015
0
10,000
20,000
30,000
40,000
50,000
1985 1990 1995 2000 2005 2010 2015Trend DK Trend SH Trend Nds/HH Trend NL
0
3,000
6,000
9,000
12,000
15,000
1985 1990 1995 2000 2005 2010 20150
5,000
10,000
15,000
20,000
25,000
1985 1990 1995 2000 2005 2010 2015
0
5,000
10,000
15,000
20,000
25,000
30,000
1985 1990 1995 2000 2005 2010 20150
10,000
20,000
30,000
40,000
50,000
60,000
1985 1990 1995 2000 2005 2010 2015
Area Period 1987/88 - 2010/11
1998/99 - 2010/11
(A)/(B) International Wadden Sea
(C) Denmark
(D) Schleswig-Holstein
(E) Niedersachsen/Hamburg
(F) The Netherlands
strong increase moderate increasestrong decrease
moderate decrease stable uncertain
0
25,000
50,000
75,000
100,000
125,000
DK SH Nds/HH NL
Figure 231Absolute numbers of
Common Gull in the four re-gions calculated by average of the 3 maximum numbers
in the period 2001/2002-2010/2011.
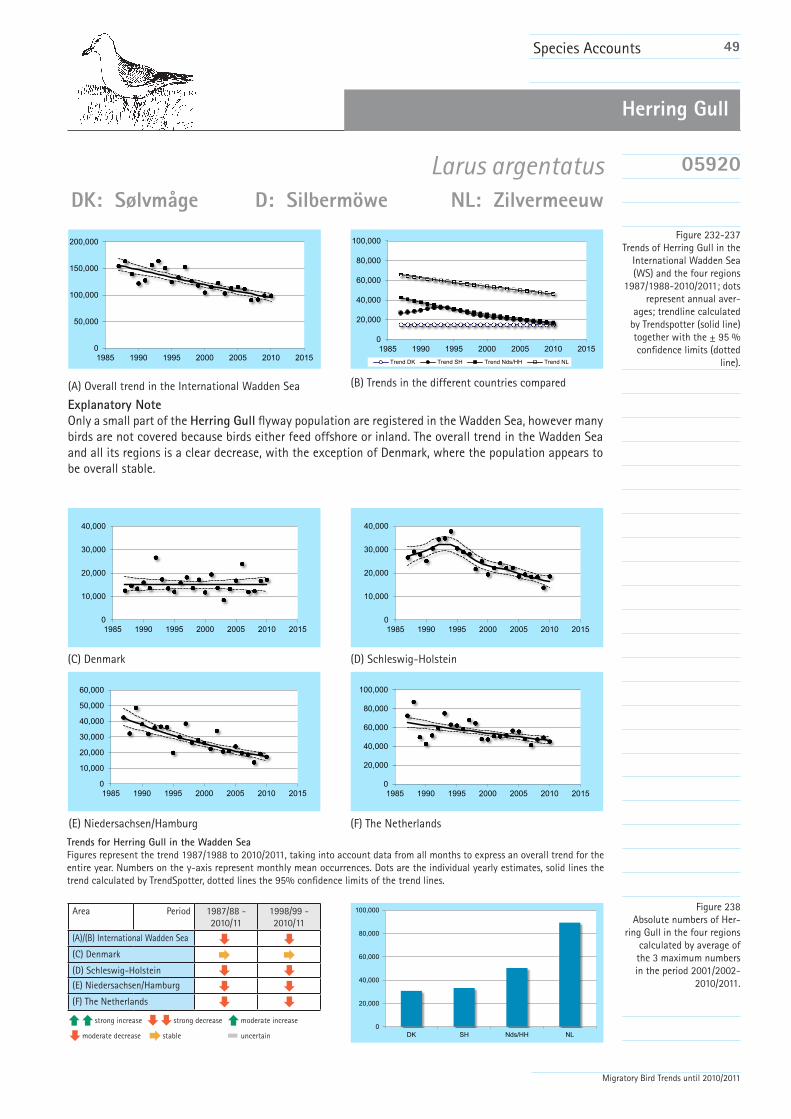
49
Migratory Bird Trends until 2010/2011
Species Accounts
Herring Gull
Explanatory NoteOnly a small part of the Herring Gull flyway population are registered in the Wadden Sea, however many birds are not covered because birds either feed offshore or inland. The overall trend in the Wadden Sea and all its regions is a clear decrease, with the exception of Denmark, where the population appears to be overall stable.
(D) Schleswig-Holstein
(F) The Netherlands
(C) Denmark
Trends for Herring Gull in the Wadden SeaFigures represent the trend 1987/1988 to 2010/2011, taking into account data from all months to express an overall trend for the entire year. Numbers on the y-axis represent monthly mean occurrences. Dots are the individual yearly estimates, solid lines the trend calculated by TrendSpotter, dotted lines the 95% confidence limits of the trend lines.
Figure 232-237Trends of Herring Gull in the
International Wadden Sea (WS) and the four regions
1987/1988-2010/2011; dots represent annual aver-
ages; trendline calculated by Trendspotter (solid line) together with the ± 95 % confidence limits (dotted
line).
Larus argentatusDK: Sølvmåge D: Silbermöwe NL: Zilvermeeuw
05920
(A) Overall trend in the International Wadden Sea (B) Trends in the different countries compared
(E) Niedersachsen/Hamburg
0
50,000
100,000
150,000
200,000
1985 1990 1995 2000 2005 2010 2015
0
20,000
40,000
60,000
80,000
100,000
1985 1990 1995 2000 2005 2010 2015Trend DK Trend SH Trend Nds/HH Trend NL
0
10,000
20,000
30,000
40,000
1985 1990 1995 2000 2005 2010 20150
10,000
20,000
30,000
40,000
1985 1990 1995 2000 2005 2010 2015
0
10,000
20,000
30,000
40,000
50,000
60,000
1985 1990 1995 2000 2005 2010 20150
20,000
40,000
60,000
80,000
100,000
1985 1990 1995 2000 2005 2010 2015
Area Period 1987/88 - 2010/11
1998/99 - 2010/11
(A)/(B) International Wadden Sea
(C) Denmark
(D) Schleswig-Holstein
(E) Niedersachsen/Hamburg
(F) The Netherlands
strong increase moderate increasestrong decrease
moderate decrease stable uncertain
0
20,000
40,000
60,000
80,000
100,000
DK SH Nds/HH NL
Figure 238Absolute numbers of Her-
ring Gull in the four regions calculated by average of the 3 maximum numbers in the period 2001/2002-
2010/2011.
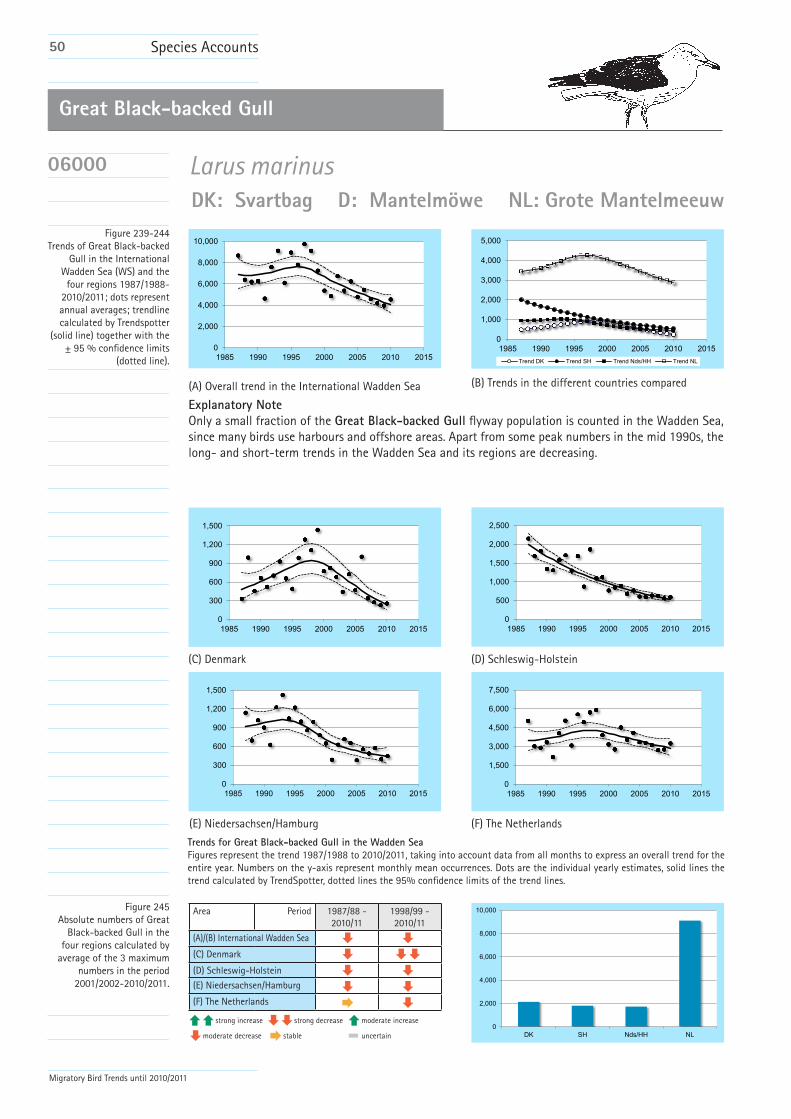
50
Migratory Bird Trends until 2010/2011
Species Accounts
Great Black-backed Gull
Explanatory NoteOnly a small fraction of the Great Black-backed Gull flyway population is counted in the Wadden Sea, since many birds use harbours and offshore areas. Apart from some peak numbers in the mid 1990s, the long- and short-term trends in the Wadden Sea and its regions are decreasing.
(D) Schleswig-Holstein
(F) The Netherlands
(C) Denmark
Trends for Great Black-backed Gull in the Wadden SeaFigures represent the trend 1987/1988 to 2010/2011, taking into account data from all months to express an overall trend for the entire year. Numbers on the y-axis represent monthly mean occurrences. Dots are the individual yearly estimates, solid lines the trend calculated by TrendSpotter, dotted lines the 95% confidence limits of the trend lines.
Figure 239-244Trends of Great Black-backed
Gull in the International Wadden Sea (WS) and the
four regions 1987/1988-2010/2011; dots represent annual averages; trendline calculated by Trendspotter
(solid line) together with the ± 95 % confidence limits
(dotted line).
Larus marinusDK: Svartbag D: Mantelmöwe NL: Grote Mantelmeeuw
06000
(A) Overall trend in the International Wadden Sea (B) Trends in the different countries compared
(E) Niedersachsen/Hamburg
0
2,000
4,000
6,000
8,000
10,000
1985 1990 1995 2000 2005 2010 2015
0
1,000
2,000
3,000
4,000
5,000
1985 1990 1995 2000 2005 2010 2015Trend DK Trend SH Trend Nds/HH Trend NL
0
300
600
900
1,200
1,500
1985 1990 1995 2000 2005 2010 20150
500
1,000
1,500
2,000
2,500
1985 1990 1995 2000 2005 2010 2015
0
300
600
900
1,200
1,500
1985 1990 1995 2000 2005 2010 20150
1,500
3,000
4,500
6,000
7,500
1985 1990 1995 2000 2005 2010 2015
Area Period 1987/88 - 2010/11
1998/99 - 2010/11
(A)/(B) International Wadden Sea
(C) Denmark
(D) Schleswig-Holstein
(E) Niedersachsen/Hamburg
(F) The Netherlands
strong increase moderate increasestrong decrease
moderate decrease stable uncertain
0
2,000
4,000
6,000
8,000
10,000
DK SH Nds/HH NL
Figure 245Absolute numbers of Great
Black-backed Gull in the four regions calculated by
average of the 3 maximum numbers in the period
2001/2002-2010/2011.

51
Migratory Bird Trends until 2010/2011
Bell, M. C. (1995): UINDEX4. A computer pro-gramme for estimating population index num-bers by the Underhill method. The Wildfowl & Wetlands Trust, Slimbridge, UK. 9 p.
Blew, J., Günther, K., Laursen, K., van Roomen, M., Südbeck, P., Eskildsen, K., and Potel, P., (2007): Trends of waterbird populations in the Interna-tional Wadden Sea 1987-2004 - an update. P. 9-31 in Reineking & Südbeck, 2007. Seriously Declining Trends in Migratory Waterbirds: Caus-es-Concerns-Consequences. Proceedings of the International Workshop on 31 August 2006 in Wilhelmshaven, Germany. Wadden Sea Ecosys-tem No. 23. Common Wadden Sea Secretariat, Wadden Sea National Park of Lower Saxony, In-stitue of Avian Research, Joint Monitoring Group of Breeding Birds in the Wadden Sea, Wilhelms-haven, Germany.
Blew, J. & Südbeck, P. (2005): Migratory Water-birds in the Wadden Sea 1980-2000. Wadden Sea Ecosystem No. 20. Common Wadden Sea Secretariat, Trilateral Monitoring and Assess-ment Group, Joint Monitoring Group of Migra-tory Birds in the Wadden Sea, Wilhelmshaven, Germany.
Essink, K., C. Dettmann, H. Farke, K. Laursen, G. Lüerßen, H. Marencic, W. Wiersinga (Eds.) (2005): Wadden Sea Quality Status Report 2004. Wad-den Sea Ecosystems No. 19, Trilateral Monitor-ing and Assessment Group, CommonWadden Sea Secretariat, Wilhelmshaven, Germany. 360 p.
JMMB 2007. Trends of Migratory and winter-ing waterbirds in the Wadden Sea 1987/88 – 2005/06. www.waddensea-secretariat.org. Wil-helmshaven, Germany.
JMMB 2008. Trends of Migratory and wintering waterbirds in the Wadden Sea 1987/88 – 2006/07. www.waddensea-secretariat.org. Wilhelmshav-en, Germany.
JMMB 2009. Trends of Migratory and wintering waterbirds in the Wadden Sea 1987/88 – 2007/08. www.waddensea-secretariat.org. Wilhelmshav-en, Germany.
JMMB 2010. Trends of Migratory and wintering waterbirds in the Wadden Sea 1987/88 – 2008/09. www.waddensea-secretariat.org. Wilhelmshav-en, Germany.
JMMB 2011. Trends of Migratory and wintering waterbirds in the Wadden Sea 1987/88 – 2009/10. www.waddensea-secretariat.org. Wilhelmshav-en, Germany.
Laursen, K., Blew, J., Eskildsen, K., Gunther, K., Halterlein, B., Kleefstra, R., Luersen, G., Potel, P., Schrader, S. (2010): Migratory Waterbirds in the Wadden Sea 1987- 2008. Wadden Sea Ecosys-tem No.30. Common Wadden Sea Secretariat, Joint Monitoring Group of Migratory Birds in the Wadden Sea, Wilhelmshaven, Germany.
Meltofte, H., J. Blew, J. Frikke, H.-U. Rösner, C. J. Smit (1994): Numbers and distribution of water-birds in the Wadden Sea. Results and evaluation of 36 simultaneous counts in the Dutch-German-Danish Wadden Sea 1980-1991. IWRB Publ. 34 / Wader Study Group Bull. 49, Special Issue 192 p.
Poot, M., L. M. Rasmussen, M. van Roomen, H.-U. Rösner, P. Südbeck (1996): Migratory Waterbirds in the Wadden Sea 1993/94. Wadden Sea Eco-system No. 5. Common Wadden Sea Secretariat and Trilateral Monitoring and Assessment Group, Wilhelmshaven, Germany. 79 p.
Rösner, H.-U., M. v. Roomen, P. Südbeck, L. M. Rasmussen (1994): Migratory Waterbirds in the Wadden Sea 1992/93. Wadden Sea Ecosystem No. 2. Common Wadden Sea Secretariat and Tri-lateral Monitoring and Assessment Group, Wil-helmshaven, Germany. 72 p.
Rösner, H.-U. (1993): The joint monitoring pro-ject for migratory birds in the Wadden Sea. Com-mon Wadden Sea Secretariat, Wilhelmshaven, Germany. 16 p.
Soldaat, L., H. Visser, M. van Roomen, A. van Strien (2007): Smoothing and trend detection in waterbird monitoring data using structual time-series analysis and the Kalman filter. Journal of Ornithology, 148: 351-357.
Underhill, L. G., R. P. Prýs-Jones (1994): Index numbers for waterbird populations. I. Review and methodology. Journal of Applied Ecology, 31: 463-480.
Visser, H. (2004): Estimation and detection of flexible trends. Atmospheric Environment, 38: 4135-4145.
Wetlands International (2013). “Waterbird Popula-tion Estimates” . Retrieved from wpe.wetlands.org
References

52
Migratory Bird Trends until 2010/2011
Counting Units in the Wadden Sea

53
Migratory Bird Trends until 2010/2011
Figure 246The Wadden Sea Area
(Cooperation Area), includ-ing delimitations of all
counting units and spring tide counting sites
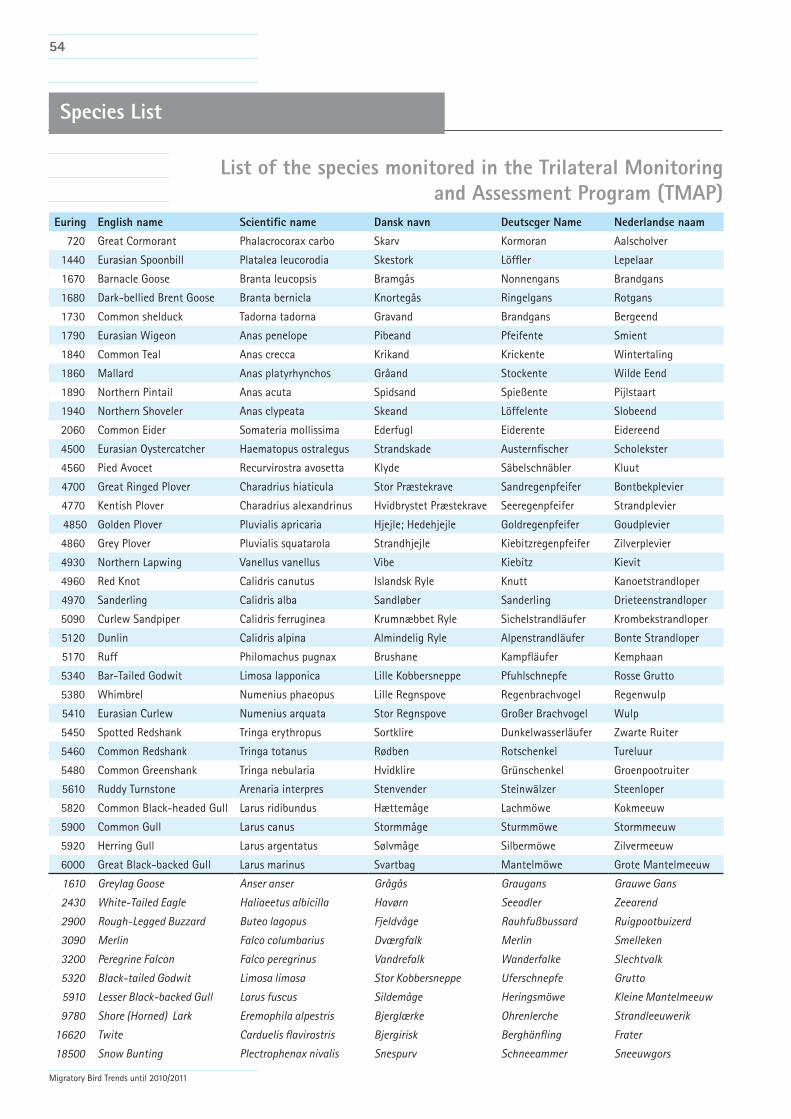
54
Migratory Bird Trends until 2010/2011
Species List
List of the species monitored in the Trilateral Monitoring and Assessment Program (TMAP)
Euring English name Scientific name Dansk navn Deutscger Name Nederlandse naam
720 Great Cormorant Phalacrocorax carbo Skarv Kormoran Aalscholver
1440 Eurasian Spoonbill Platalea leucorodia Skestork Löffler Lepelaar
1670 Barnacle Goose Branta leucopsis Bramgås Nonnengans Brandgans
1680 Dark-bellied Brent Goose Branta bernicla Knortegås Ringelgans Rotgans
1730 Common shelduck Tadorna tadorna Gravand Brandgans Bergeend
1790 Eurasian Wigeon Anas penelope Pibeand Pfeifente Smient
1840 Common Teal Anas crecca Krikand Krickente Wintertaling
1860 Mallard Anas platyrhynchos Gråand Stockente Wilde Eend
1890 Northern Pintail Anas acuta Spidsand Spießente Pijlstaart
1940 Northern Shoveler Anas clypeata Skeand Löffelente Slobeend
2060 Common Eider Somateria mollissima Ederfugl Eiderente Eidereend
4500 Eurasian Oystercatcher Haematopus ostralegus Strandskade Austernfischer Scholekster
4560 Pied Avocet Recurvirostra avosetta Klyde Säbelschnäbler Kluut
4700 Great Ringed Plover Charadrius hiaticula Stor Præstekrave Sandregenpfeifer Bontbekplevier
4770 Kentish Plover Charadrius alexandrinus Hvidbrystet Præstekrave Seeregenpfeifer Strandplevier
4850 Golden Plover Pluvialis apricaria Hjejle; Hedehjejle Goldregenpfeifer Goudplevier
4860 Grey Plover Pluvialis squatarola Strandhjejle Kiebitzregenpfeifer Zilverplevier
4930 Northern Lapwing Vanellus vanellus Vibe Kiebitz Kievit
4960 Red Knot Calidris canutus Islandsk Ryle Knutt Kanoetstrandloper
4970 Sanderling Calidris alba Sandløber Sanderling Drieteenstrandloper
5090 Curlew Sandpiper Calidris ferruginea Krumnæbbet Ryle Sichelstrandläufer Krombekstrandloper
5120 Dunlin Calidris alpina Almindelig Ryle Alpenstrandläufer Bonte Strandloper
5170 Ruff Philomachus pugnax Brushane Kampfläufer Kemphaan
5340 Bar-Tailed Godwit Limosa lapponica Lille Kobbersneppe Pfuhlschnepfe Rosse Grutto
5380 Whimbrel Numenius phaeopus Lille Regnspove Regenbrachvogel Regenwulp
5410 Eurasian Curlew Numenius arquata Stor Regnspove Großer Brachvogel Wulp
5450 Spotted Redshank Tringa erythropus Sortklire Dunkelwasserläufer Zwarte Ruiter
5460 Common Redshank Tringa totanus Rødben Rotschenkel Tureluur
5480 Common Greenshank Tringa nebularia Hvidklire Grünschenkel Groenpootruiter
5610 Ruddy Turnstone Arenaria interpres Stenvender Steinwälzer Steenloper
5820 Common Black-headed Gull Larus ridibundus Hættemåge Lachmöwe Kokmeeuw
5900 Common Gull Larus canus Stormmåge Sturmmöwe Stormmeeuw
5920 Herring Gull Larus argentatus Sølvmåge Silbermöwe Zilvermeeuw
6000 Great Black-backed Gull Larus marinus Svartbag Mantelmöwe Grote Mantelmeeuw
1610 Greylag Goose Anser anser Grågås Graugans Grauwe Gans
2430 White-Tailed Eagle Haliaeetus albicilla Havørn Seeadler Zeearend
2900 Rough-Legged Buzzard Buteo lagopus Fjeldvåge Rauhfußbussard Ruigpootbuizerd
3090 Merlin Falco columbarius Dværgfalk Merlin Smelleken
3200 Peregrine Falcon Falco peregrinus Vandrefalk Wanderfalke Slechtvalk
5320 Black-tailed Godwit Limosa limosa Stor Kobbersneppe Uferschnepfe Grutto
5910 Lesser Black-backed Gull Larus fuscus Sildemåge Heringsmöwe Kleine Mantelmeeuw
9780 Shore (Horned) Lark Eremophila alpestris Bjerglærke Ohrenlerche Strandleeuwerik
16620 Twite Carduelis flavirostris Bjergirisk Berghänfling Frater
18500 Snow Bunting Plectrophenax nivalis Snespurv Schneeammer Sneeuwgors

55
Migratory Bird Trends until 2010/2011
Issues of the Publication Series „Wadden Sea Ecosystem“
No. 1: Breeding Birds in the Wadden Sea 1991. 1994.No. 2: Migratory Waterbirds in the Wadden Sea1992/93. 1994.No. 3: Guidelines for Monitoring of Breeding Birds in the Wadden Sea (in Dutch, German, Danish). 1995.No. 4: Breeding Birds on Census Arteas 1990 until 1994. Status of Shorelark, Twite and Snow Bunting
in the Wadden Sea. 1997.No. 5: Migratory Waterbirds in the Wadden Sea 1993/94. 1996.No. 6: Trilateral Monitoring and Assessment Program. TMAP Expert Workshops 1995/96. 1996.No. 7: Assessment of the Wadden Sea Ecosystem. 1997.No. 8: Monitoring Breeding Success of Coastal Birds. Monitoring Pollutants in Coastal Bird Eggs in the
Wadden Sea. 1998.No. 9: Wadden Sea Quality Status Report 1999. 1999.No. 10: Breeding Birds in the Wadden Sea in 1996. 2000.No. 11: Contaminants in Bird Eggs in the Wadden Sea. Spatial and Temporal Trends 1999 - 2000. 2001. No. 12: Lancewad. Landscape and Cultural Heritage in the Wadden Sea Region. 2001.No. 13: Final Report of the Trilateral Working Group on Coastal Protection and Sea Level Rise. 2001.No. 14: Wadden Sea Specific Eutrophication Criteria. 2001.No. 15: Common and Grey Seals in the Wadden Sea. TSEG-plus Report March/June 2001.2002.No. 16: High Tide Roosts in the Wadden Sea. A Review of Bird Distribution, Protection Regimes and
Potential Sources of Anthropogenic Discturbance. 2003.No. 17: Management of North Sea Harbour and Grey Seal Populations. Proceedings of the International
Symposium at EcoMare, Texel, The Netherlands November 29 - 30, 2002. 2003.No. 18: Contaminants in Bird Eggs in the Wadden Sea. Recent Spatial and Temporal Trends. Seabirds at
Risk? Effects of Environmental Chemicals on Reproductive Success and Mass Growth of Seabirds at the Wadden Sea in the Mid 1990s. 2004.
No. 19: Wadden Sea Quality Status Report 2004. 2005.No. 20: Migratory Waterbirds in the Wadden Sea 1980 - 2000. 2005.No. 21: Coastal Protection and Sea Level Rise - Solutions for Sustainable Coastal Protection. 2005 No. 22: Breeding Birds in the Wadden Sea in 2001. 2006.No. 23: Seriously Declining Trends in Migratory Waterbirds: Causes-Concerns-Consequences. Proceedings
of the International Workshop on 31 August 2005 in Wilhelmshaven, Germany. 2007.No. 24: Nomination of the Dutch-German Wadden Sea as World Heritage Site. 2008.No. 25: Wadden Sea Quality Status Report 2009. 2009.No. 26: Science for Nature Conservation and Managment: The Wadden Sea Ecosystem and EU Direc-
tives. Proceedings of the 12th International Scientific Wadden Sea Symposium in Wilhelmshaven, Germany, 30 March - 3 April 2009. 2010.
No. 27: Exploring contrasting trends of migratory waterbirds in the international Wadden Sea. 2010.No. 28: CPSL Third Report. The role of spatial planning and sediment in coastal risk management. 2010.No. 29: The Wadden Sea - A Universally Outstanding Tidal Wetland. The Wadden Sea Quality Status
Report. Synthesis Report 2010.No. 30: Migratory Waterbirds in the Wadden Sea 1987-2008. 2010.No. 31: Trends of Migratory and Wintering Waterbirds in the Wadden Sea 1987/1988-2010/2011. 2013.
56
Migratory Bird Trends until 2010/2011
The Trilateral Monitoring andAssessment Program (TMAP)
YEARSCommon
Wadden SeaSecretariat
COMMON WADDEN SEA SECRETARIATVirchowstrasse 1D-26382 WilhelmshavenFederal Republic of Germanywww.waddensea-secretariat.org
ISSN 0946-896X