trends in venture capital, angel investments, and annual ... … · st. paul, oklahoma city, and...
TRANSCRIPT

Trends in Venture Capital, Angel Investments, and
Crowdfunding across the Fifty Largest U.S.
Metropolitan Areas
Annual Survey of Entrepreneurs Data Briefing Series
by Dane Stangler, Inara S. Tareque,
and Arnobio Morelix
December 2016

According to data from the Annual Survey of Entrepreneurs, the primary
sources of initial financing for new businesses in the United States are:
personal and family savings, bank business loans, and personal credit
cards. Entrepreneurs also tap other sources of funding along their journeys.
These other sources—including venture capital, angel investments, and,
more recently, crowdfunding—may not be as prevalent, but they can be
disproportionately important for business growth.
Using new data from the 2014 Annual Survey of Entrepreneurs (ASE),1 this data briefing looks across the largest fifty metropolitan
statistical areas (MSAs) to see how entrepreneurs have fared in their quests to secure money from venture capitalists, angel
investors, and online crowds.
While venture capital and angel investments are important for growth, the attention they receive from media, researchers,
entrepreneurs, and support organizations can obscure their relative size. For context, while 10.3 percent of entrepreneurs report
using personal credit cards when starting their business, only 0.6 percent initially received venture capital. The distribution of
those firms receiving venture capital is uneven, although thirty-seven of the fifty largest MSAs have higher VC rates than the
national average of 0.6 percent.
1. The ASE, conducted by the U.S. Census Bureau, is the largest annual survey of American entrepreneurs ever done, and exists thanks to a public-private partnership between the Census Bureau, the Kauffman Foundation, and the Minority Business Development Agency. The ASE samples approximately 290,000 employer businesses across all U.S. geographies and demographics, and tells the story of the American entrepreneur.
— 1 —

Figure 1: Firms receiving venture capital investment when starting
The biggest outliers, not surprisingly, are the two principal metros of Silicon Valley. In the San Jose metro area, 2.4 percent of
employer firms received venture capital as initial startup capital—this is four times the national average. In the San Francisco
metro area, 1.5 percent of firms received VC funds when first starting out, two-and-a-half times the national average.
Venture capital also is disproportionately relevant for startup capital elsewhere. Other metro areas that are about twice as high as
the national average include: Salt Lake City, Austin, Baltimore, and Birmingham. Metros below average include: Columbus, Hartford,
Louisville/Jefferson, Sacramento, Tampa, Chicago, Detroit, Jacksonville, New Orleans, Orlando, Washington, Virginia Beach, and Cleveland.
Figure 2: Percentage of firms that received venture capital investment when starting
To see where specific metropolitan areas fall in Figure 2, please visit: http://tabsoft.co/2fVgjOK.
— 2 —
Source: Kauffman Foundation calculations from Annual Survey of Entrepreneurs, U.S. Census Bureau, 2014, and Kauffman Index of Startup Activity
2.5
2.0
1.5
1.0
0.5
0.0
-6 -5 -4 -3 -2 -1 0 1 2 3 4 5
KAUFFMAN INDEX OF STARTUP ACTIVITY
Source: Kauffman Foundation calculations from the U.S. Census Bureau, Annual Survey of Entrepreneurs (2014)
Percent of firms (less —> more)
Number of firms (less —> more)

In fact, as shown by Figure 2, the rate of firms acquiring venture capital investment is positively correlated to the 2016 Kauffman
Index of Startup Activity. This shows that MSAs that have higher success rates of firms receiving venture capital as initial startup
capital also tend to have higher rates of startup activity.
Figure 3: Years in business
It’s important to emphasize that the foregoing data, though collected in 2014, refer to whether or not firms received venture capital
when they started. Approximately 40 percent of the firms in the ASE sample are eleven to fifteen years old, while 34 percent are less than
five years old, 20 percent are six to ten years old, and the remaining 7 percent of firms are more than fifteen years old. The following data
on venture capital, angel investing, and crowdfunding refer to the receipt of such funding only during 2014. And, for the analysis of these
2014 financing data, we do a binary comparison of whether or not firms received the total amount of funding they requested.
Venture Capital, Angel, and Crowdfunding Investment Trends Across MSAsIn 2014, roughly $68 billion was invested in venture capital deals in the United States and, according to the ASE data, 7,878
employer businesses reported receiving VC funds that year. Thirty percent of those recipients were located in just four metro areas:
New York, Los Angeles, San Francisco, and Boston.
Figure 4: Venture capital investments in 2014
— 3 —
less than 2
2–3
4–5
6–10
11–15
more than 15
9.09
COMPOSITION (%)
13.51
9.59
20.29
6.85
40.67
Source: Kauffman Foundation calculations from the U.S. Census Bureau, Annual Survey of Entrepreneurs (2014)
Source: Kauffman Foundation calculations from the U.S. Census Bureau, Annual Survey of Entrepreneurs (2014)
Percent of firms (less —> more)
Number of firms (less —> more)

Yet there is considerable variation in the rates at which firms succeeded in receiving the total amount of funding they requested
from venture capitalists. In San Francisco, for example, 0.8 percent of firms sought VC funds and received the total amount sought.
That is the highest percentage in the country among the fifty largest MSAs. By contrast, in New York, which had the highest
number of firms receiving all the VC money they sought, the share was only 0.3 percent. Nationally, 0.2 percent of firms sought
venture capital and received the total amount they requested.
Some perhaps unlikely metro areas rank highly in terms of those venture funding success rates: Hartford, Memphis, Richmond,
and Buffalo. This doesn’t necessarily mean that there are higher quality firms there, and, of course, the volume of firms seeking VC
is smaller. Only fifty-one firms in Memphis, for example, sought venture capital in 2014. And, these data don’t mean that all the
funding came from local sources: venture capital firms in New York could be investing in Hartford businesses.
But these numbers lend credence to arguments like Steve Case’s “Rise of the Rest,” that high-quality deals can be found
everywhere, and that firms in these regions can succeed in raising equity capital.
We see similar unevenness—and similar surprises—when we look at businesses that received the total amount of angel
investments they sought. Nationally, according to the ASE data, 8,900 firms received angel investments in 2014.
Figure 5: Angel investments in 2014
Just as with venture capital, angel investing is geographically concentrated. Among firms that received the full amount they sought
from angel investors, 30 percent were in just four MSAs: New York, Los Angeles, San Francisco, and Boston. Likewise, success rates
vary across the country, though perhaps not as much with venture capital funding.
In metropolitan areas with the highest success rates of firms receiving the full amount of angel investments they sought, three
of the top six are the largest markets for it: San Francisco, Boston, and Los Angeles. The top MSA is San Jose, where 1 percent of
firms sought angel investment and received the full amount requested, five times higher than the national average. Other metros
in the top ten in terms of success rates include Austin, Charlotte, Atlanta, Buffalo, Denver, and Indianapolis. Metros at the bottom
— 4 —
Source: Kauffman Foundation calculations from the U.S. Census Bureau, Annual Survey of Entrepreneurs (2014)
Percent of firms (less —> more)
Number of firms (less —> more)
include Detroit, Cleveland, and Chicago—in these areas, only 0.1 percent of firms sought angel investment and received the full
amount requested.
The newest source of money on the entrepreneurial finance landscape is crowdfunding. Until earlier this year, only three types of
crowdfunding were allowed in the United States: donations, rewards-based, and equity by accredited investors. Thus, the ASE data
on crowdfunding include these, and not any equity crowdfunding by non-accredited investors.2 In 2014, according to ASE data,
5,361 firms received money through crowdfunding, less than from venture capital firms and angel investors.
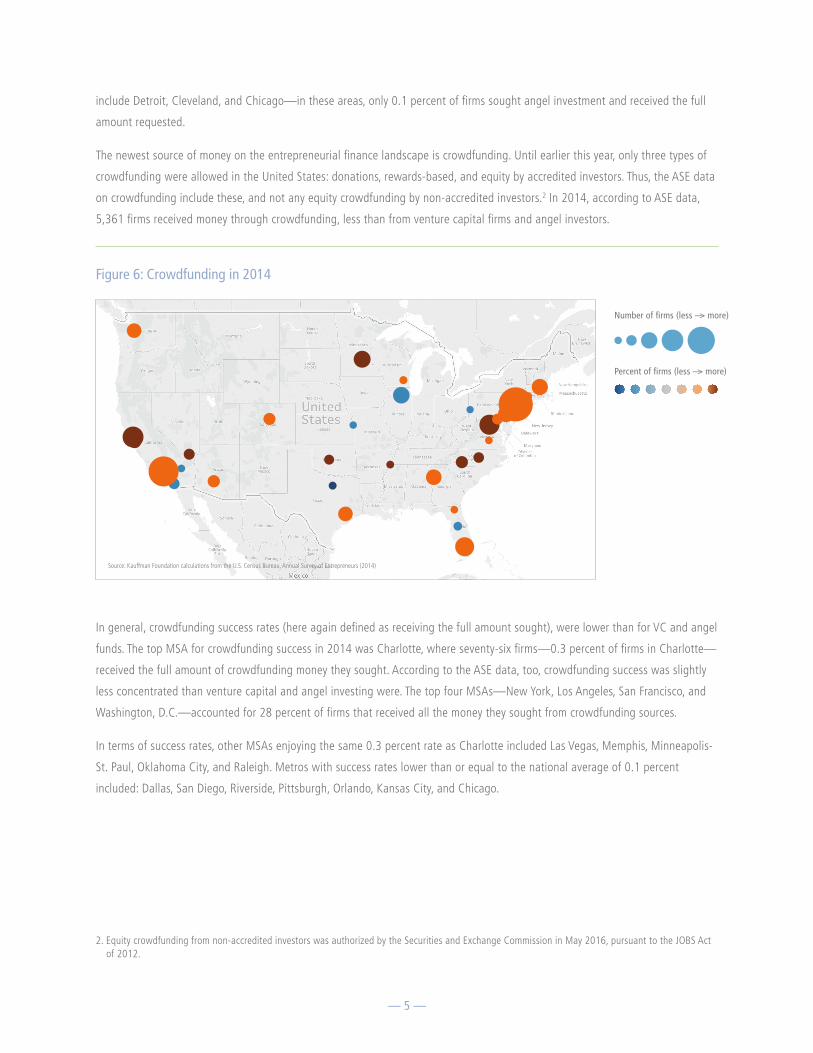
Figure 6: Crowdfunding in 2014
In general, crowdfunding success rates (here again defined as receiving the full amount sought), were lower than for VC and angel
funds. The top MSA for crowdfunding success in 2014 was Charlotte, where seventy-six firms—0.3 percent of firms in Charlotte—
received the full amount of crowdfunding money they sought. According to the ASE data, too, crowdfunding success was slightly
less concentrated than venture capital and angel investing were. The top four MSAs—New York, Los Angeles, San Francisco, and
Washington, D.C.—accounted for 28 percent of firms that received all the money they sought from crowdfunding sources.
In terms of success rates, other MSAs enjoying the same 0.3 percent rate as Charlotte included Las Vegas, Memphis, Minneapolis-
St. Paul, Oklahoma City, and Raleigh. Metros with success rates lower than or equal to the national average of 0.1 percent
included: Dallas, San Diego, Riverside, Pittsburgh, Orlando, Kansas City, and Chicago.
2. Equity crowdfunding from non-accredited investors was authorized by the Securities and Exchange Commission in May 2016, pursuant to the JOBS Act of 2012.
— 5 —
Source: Kauffman Foundation calculations from the U.S. Census Bureau, Annual Survey of Entrepreneurs (2014)
Percent of firms (less —> more)
Number of firms (less —> more)

ConclusionWe don’t know, with these ASE data at least, the geographic source of this funding. The concentration of venture capital firms
in California, Massachusetts, and New York, of course, is well-correlated with the relative concentration of firms that receive VC
investments. But with crowdfunding, for example, the success of crowdfunding campaigns in Minneapolis and Oklahoma City may
not be entirely due to local funders.
But, the ASE data add quantitative confirmation to what we know from other sources: high-quality entrepreneurs can be found—
and can get funding—in nearly every corner of the United States.
Finally, for an interactive profile of amount of funding received by firms across these MSAs in 2014, please see:
http://tabsoft.co/2gdIXvN
About the DataThe Annual Survey of Entrepreneurs is the largest annual survey of entrepreneurs ever done in the United States. It documents the
story of American entrepreneurs, providing more frequent and extensive data than previously available. The survey, conducted by
the Census Bureau, exists thanks to a major public-private partnership among the U.S. Census Bureau, the Kauffman Foundation,
and the Minority Business Development Agency. The Annual Survey of Entrepreneurs will supplement the Survey of Business
Owners (SBO), conducted every five years.
The Annual Survey of Entrepreneurs provides a timely, more frequent socio-economic portrait of the nation’s employer businesses
by gender, ethnicity, race, and veteran status. It includes a relevant topic not found in the SBO: the number of years a firm has
been in business. It also includes extensive geographical coverage, with data at the national level, all fifty states, and the fifty
largest metropolitan areas in the country.
This survey collected data from a sample of approximately 290,000 employer businesses that were in operation anytime during
the survey year. The collected data in a sample survey are subject to sampling variability, as well as nonsampling errors. Sources
of nonsampling errors include errors of response, nonreporting, and coverage. For more information about the survey, including
design, methodology, and data limitations, see www.census.gov/programs-surveys/ase.html.
— 6 —
