trends in the use of payment instruments in the united … in the use of payment instruments in the...
TRANSCRIPT

Trends in the Use of Payment Instruments in the United States
Geoffrey R. Gerdes and Jack K. Walton II, of the Board's Division of Reserve Bank Operations and Payment Systems, and May X. Liu and Darrel W. Parke, of the Board's Division of Research and Sta-tistics, prepared this article. Namirembe Mukasa, of the Board's Division of Reserve Bank Operations and Payment Systems, provided research assistance.
An efficient payments system is important for the smooth functioning of the large and complex U.S. economy. As the availability and use of technology evolves, the payments system adapts to the chang-ing needs and expectations of individuals, busi-nesses, and governments. In the United States, many payments traditionally made with paper instruments—checks and cash—are now being made electronically—with debit or credit cards or via the automated clearinghouse (ACH).
Until recently, paper checks accounted for the majority of noncash payments.
[footnote] 1. Because some checks are converted to electronic payments at the point of sale or during the process of collection, the number of checks paid differs from the number of checks written. This point is discussed in the box ''Changes in the Processing of Payments.'' Unless otherwise noted, statements in this article about the number of checks refer to the number of paid checks. [end of footnote.]
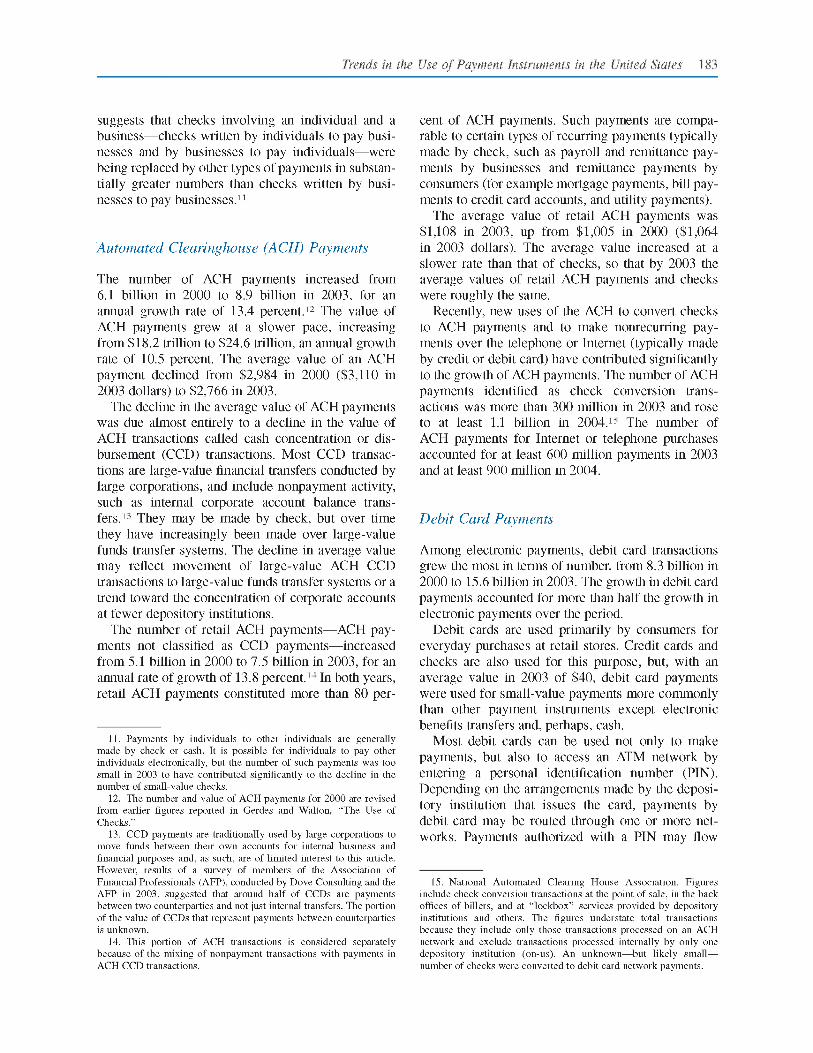
A Board of Gov-ernors study published in 2002 concluded that the number of checks paid annually in the United States likely began to decline during the mid-1990s (chart 1).
[footnote] 2. Geoffrey R. Gerdes and Jack K. Walton II (2002), ''The Use of Checks and Other Noncash Payment Instruments in the United States,'' Federal Reserve Bulletin, vol. 88 (August), pp. 360-74, www.federalreserve.gov/pubs/bulletin/2002/0802 2nd.pdf. [end of footnote.]
Chart 1. Annual number of noncash payments in the United States, selected years
[bar graph showing Electronic payments and checks. In 1979 checks is about 35 billion of payments, electronic payments is about 5 billion. In 1995 Checks is about 50 billion of payments, electronic payments about 15 billion. In 2000 checks is about 42 billion of payments, electronic payments about 29 billion. In 2003 checks is about 38 billion of payments, electronic payments about 43 billion.]
SOURCE. Federal Reserve Board.
A more recent study conducted by the Federal Reserve System, which estimated and com-pared the number of checks paid in 2000 with the number paid in 2003, showed that the decline in the number of checks paid may have accelerated over the past few years.
[footnote] 3. Federal Reserve System (2004), The 2004 Federal Reserve Payments Study: Analysis of Noncash Payments Trends in the United States: 2000-2003, Federal Reserve System Study, December 15, www.frbservices.org/Retail/pdf/2004PaymentResearchReport.pdf. Some figures reported in this article are revised from that earlier study because of improvements to the statistical imputation procedure, described in the appendix. [end of footnote.]
The average annual rate of decline in the number of checks paid is estimated to have been 3.3 percent between 1995 and 2000 and 4.3 percent
between 2000 and 2003.
[footnote] 4. Rates of change (for example, rates of decline and rates of growth) reported in this article are computed as the average com-pounded annual rate of change, that is, the constant rate that if compounded annually would yield the observed change for the indi-cated time period. [end of footnote.]
Although growth rates for electronic payments have been high for decades, the cumulative effect of this growth has only recently become large enough to substantially affect the num-ber of checks paid. By 2003, led by rapid growth in debit card payments, the number of electronic pay-ments exceeded the number of check payments for the first time in U.S. history (chart 1, table 1).
The large number of electronic payments generally indicates growing efficiency of the payments system. The processing of paper payments typically requires extensive physical handling. Automation has created opportunities for depository institutions and other payments processors not only to introduce new pay-ment instruments, but also to reduce their costs in processing paper and electronic payments. Future innovations are expected to continue to help decrease costs and add value and functionality. (See box ''Changes in the Processing of Payments.'')
This article analyzes the results of two payments surveys conducted in 2004, one of depository insti-tutions (the 2004 depository institution survey) and

one of electronic payments networks, processors, and credit card issuers (the 2004 electronic payment survey). It also draws on the results of two similar surveys conducted in 2001. The primary purposes of the 2004 surveys were to estimate the number and value of payments made by means of several types of noncash payment instruments in 2003 and to estimate rates of change from 2000 to 2003. (See the appendix for details on the surveys.)
The 2004 depository institution survey allowed for comparisons among different types and sizes. It also made possible an analysis of regional differences in the number and value of check, ACH, and debit card payments and automated teller machine (ATM) withdrawals. The 2004 electronic payment survey provided additional information on the use of ACH, cash back from debit cards, and different types of credit cards.
The surveys have focused on the amount of and trends in noncash payments. Indirect evidence dis-cussed later, however, suggests that the use of cash has declined as a share of all payments in recent decades.
[footnote] 5. Although the 2004 depository institution survey collected data on the number and value of ATM withdrawals, the surveys generally did not collect data that could be used to estimate the number or value of cash payments. [end of footnote.]
Whether the total number of cash trans-actions has begun to decline, as has the number of checks, is less clear.
TRENDS IN PAYMENT INSTRUMENT USE
Checks
The total number of checks paid annually in the United States is estimated to have declined from 41.9 billion in 2000 to 36.6 billion in 2003 (table 1).
[footnote] 6. The number and value of checks for 2000 are revised downward from figures reported in Gerdes and Walton, ''The Use of Checks,'' based on revisions to earlier data by several large commercial banks. [end of footnote.]
1. Number and value of noncash payments, 2000 and 2003
Type of payment
N u m b e r
Billions of
payments
Number
Percent of
total
Value
Trillions
of dollars
Value
Percent of
total
Value
Average, in dollars
2000 Check [ s ee foo tno t e ]1 41.9 57.8 39.8 66.7 951 2000 Electronic 30.5 42.2 19.9 33.3 651
2000 Electronic Debit card 8.3 11.4 .3 .6 42 2000 Electronic Debit card Signature 5.3 7.3 .2 .4 40 2000 Electronic Debit card PIN 3.0 4.2 .1 .2 46
2000 Electronic Credit card 15.6 21.6 1.3 2.1 82 2000 Electronic Credit card General-purpose [ see footnote]2 12.3 17.0 1.1 1.8 87 2000 Electronic Credit card Private-label[see footnote]2 3.3 4.6 .2 .3 62
2000 Electronic ACH[see footnote]4 6.1 8.4 18.2 30.6 2,984 2000 Electronic ACH[see footnote]4 CCD 1.0 1.4 13.1 22.0 12,585 2000 Electronic ACH[see footnote]4 Retail 5.1 7.0 5.1 8.5 1,005
2000 Electronic EBT[see footnote]5 .5 .7 .0 .0 26
2000 Total noncash payments 72.4 100.0 59.7 100.0 824
2003 Check [ s ee foo tno t e ]1 36.6 45.3 39.0 59.1 1,065 2003 Electronic 44.3 54.7 27.0 40.9 609
2003 Electronic Debit card 15.6 19.3 .6 1.0 40 2003 Electronic Debit card Signature 10.3 12.7 .4 .6 42 2003 Electronic Debit card PIN 5.3 6.6 .2 .3 38
2003 Electronic Credit card 19.0 23.4 1.7 2.6 89 2003 Electronic Credit card General-purpose [ see footnote]2 15.2 18.8 1.4 2.1 93 2003 Electronic Credit card Private-label[see footnote]3 3.8 4.6 .3 .4 76
2003 Electronic ACH[see footnote]4 8.9 11.0 24.6 37.3 2,766 2003 Electronic ACH[see footnote]4 CCD 1.4 1.8 16.4 24.8 11,424 2003 Electronic ACH[see footnote]4 Retail 7.5 9.2 8.3 12.6 1,108
2003 Electronic EBT[see footnote]5 .8 1.0 .0 .0 26
2003 Total noncash payments 80.9 100.0 66.0 100.0 815
Type of Payment N u m b e r
Change over
period (billions of payments)
Number
Annual rate of change
(percent)[see footnote]6
Value
Change over
period (trillions of
dollars)
Value
Annual rate of change
(percent)[see footnote]6
Change, 2000-2003 Check -5 .2 - 4 . 3 - . 8 - . 7
Change, 2000-2003 Electronic 13.8 13.2 7.1 10.7 Change, 2000-2003 Electronic Debit card 7.3 23.5 0.3 21.9 Change, 2000-2003 Electronic Debit card Signature 5.0 24.9 .2 26.7 Change, 2000-2003 Electronic Debit card PIN 2.3 21.0 .1 13.9 Change, 2000-2003 Electronic Credit card 3.4 6.7 .4 9.9 Change, 2000-2003 Electronic Credit card General-purpose 2.9 7.3 .3 9.5 Change, 2000-2003 Electronic Credit card Private-label .5 4.4 .1 11.5 Change, 2000-2003 Electronic ACH 2.8 13.4 6.4 10.5 Change, 2000-2003 Electronic ACH CCD .4 11.1 3.2 7.5 Change, 2000-2003 Electronic ACH Retail 2.4 13.8 3.2 17.6 Change, 2000-2003 Electronic EBT .3 15.4 .0 16.2
Change, 2000-2003 Total noncash payments 8.6 3.8 6.3 3.4
NOTE. The number and value of checks and ACH payments for 2000 are revised downward from figures reported in Gerdes and Walton, ' 'The Use of Checks,' ' because of revisions to data and improvements in estimation. The number and value of checks and ACH payments for 2003 are revised from figures reported in Federal Reserve System, 2004 Federal Reserve Payments Study because of improvements to the imputation procedure. See the appendix for details. [footnote] 1. Includes checks paid by depository institutions, U.S. Treasury checks, and
postal money orders. [end of footnote.] [footnote] 2. Includes the four widely accepted general-purpose credit and charge cards. [end of footnote.] [footnote] 3. Includes private-label credit cards issued by oil companies and many large
retailers and specialized charge cards for travel and entertainment. [end of footnote.] [footnote] 4. CCDs are cash concentration or disbursement transactions, about half of
which are internal corporate transfers. Retail includes all other payments. [end of footnote.] [footnote] 5. Electronic benefit transfer. [end of footnote.] [footnote] 6. Compound annual growth rate. [end of footnote.]
As noted earlier, the annual rate of decline was 4.3 percent, compared with an estimated 3.3 percent between 1995 and 2000.
[footnote] 7. T h e e s t i m a t e d n u m b e r of c h e c k s p a i d in 1 9 9 5 w a s 4 9 . 5 b i l l ion . [end of footnote.]
Although the use of checks declined, checks remained the most commonly used type of noncash payment in 2003.
Checks also continued to be the largest noncash payment type by value.
[footnote] 8. The value of payments made via large-value funds transfer systems was $763 trillion in 2003, much greater than the value of payments made by other types of instruments, but those payments are outside the scope of this article. The overall number of these transfers, however, was 188 million in 2003, negligible compared with the number of payments described in this study. The check collection system is no longer used extensively for large-value funds transfers
because most such transfers are uniquely suited to the large-value systems. [end of footnote.]
In fact, the value of checks exceeded the combined value of all the other noncash

payment types. The value of checks was an estimated $39.0 trillion in 2003, compared with $39.8 trillion in 2000, indicating an annual decline of 0.8 percent. In constant (2003) dollars the value of checks declined almost 3 percent annually.
[footnote] 9. Over the period 2000 to 2003, inflation, as measured broadly by the implicit price deflator for gross domestic product, averaged 2 per-cent per year. [end of footnote.]
[beginning of box] Changes in the Processing of Payments
Automation of ACH, Credit Card, and Check Processing
Twenty-five years ago, all the major payment instruments in use today—cash, checks, credit cards, automated clearing-house (ACH), and debit cards—were being used in com-mercial activity for some segments of the U.S. economy. Improvements in the processing of payments by cash, check, credit cards, and ACH over the past several decades have decreased the amount of physical processing and increased the amount of electronic processing. Because processing of payments has become more electronic gener-ally, the rise in the share of noncash payments made with so-called electronic instruments understates the extent of the transition of the payments industry f rom physical to electronic processing.
Debit card networks were originally based on automated electronic systems that linked ATMs together, and the pro-cessing of these payments did not include a significant physical processing component. However, the processing of the other two types of electronic payments—ACH and credit cards—which once included considerable physical activity, now is wholly electronic.
The ACH system has evolved from the physical exchange of computer tapes within and among regional associations of depository institutions to an integrated electronic net-work for clearing and settlement that connects depository institutions around the country. Similarly, credit card pro-cessing has evolved from a largely physical activity—one in which accumulated paper transaction slips were depos-ited into a merchant 's bank and then cleared and settled in a process similar to the process for paper checks—to an activity in which the availability of funds is almost always verified in real time over an electronic network and clearing and settlement occur electronically.
Changes that increase automated, electronic processing within the check collection system have come relatively slowly. Over the past twenty-five years, technology has evolved to allow the exchange by mutual agreement of electronic information on checks between depository insti-
tutions. Despite this capability, the collection of most checks, in the absence of an agreement between depository institutions, has involved extensive physical processing, transportation, and delivery because state laws require that the original check be presented to the paying depository institution for settlement. However, the Check Clearing for the 21st Century Act, Public Law 108-100 (Check 21), is expected to facilitate use of electronics in the processing of checks, because the original paper check is no longer neces-sary for settlement. Instead, when a paper check is required, a depository institution may satisfy that requirement by providing a special paper copy of the original check known as a substitute check. A substitute check that meets speci-fied standards is the legal equivalent of the original. Thus, it is possible for depository institutions to truncate checks and collect them electronically, but also to present paper checks when necessary. As this article is written, seven months after the effective date of Check 21, the use of new elec-tronic processing methods provided for in the act is growing only slowly. However, depository institutions are expected to increase their use of electronic check-clearing methods over time to further automate the check collection and settlement process by exchanging check images. These and other efforts will make check processing increasingly simi-lar to the processing of other noncash payments.
Conversion of Checks
Recently, technological innovations have occurred that allow the use of information from a check to initiate an electronic payment. This process, known as check conver-sion, was typically initiated by merchants at point-of-sale registers and by back-office transaction processors for large billers, into payments that are processed by ACH or the debit card networks and has contributed significantly to the recent acceleration in the growth of electronic pay-ments. The conversion of checks began to take hold in the late 1990s, eventually resulting in changes to ACH network rules and in payments regulations that govern the practice. [end of box.]
The average value of checks increased slightly, reaching $1,065 in 2003, up from $951 in 2000
($1,009 in 2003 dollars). This small change in aver-age value suggests that the use of smaller-value checks (for amounts less than $1,000) declined more rapidly than the use of larger-value checks. Indeed, calculations show that at least 87 percent of the decline in checks paid, by number, resulted from a decline in the number of checks for less than $1,000.
[footnote] 10. According to a 2001 survey of checks collected, about 87 percent of checks in 2000 were for amounts less than $1,000. See Gerdes and Walton, ''The Use of Checks.'' [end of footnote.]
The greater decline of smaller-value checks
suggests that checks involving an individual and a business—checks written by individuals to pay busi-nesses and by businesses to pay individuals—were being replaced by other types of payments in substan-tially greater numbers than checks written by busi-nesses to pay businesses.
[footnote] 11. Payments by individuals to other individuals are generally made by check or cash. It is possible for individuals to pay other individuals electronically, but the number of such payments was too small in 2003 to have contributed significantly to the decline in the number of small-value checks. [end of footnote.]
Automated Clearinghouse (ACH) Payments
The number of ACH payments increased from 6.1 billion in 2000 to 8.9 billion in 2003, for an annual growth rate of 13.4 percent.
[footnote] 12. The number and value of ACH payments for 2000 are revised from earlier figures reported in Gerdes and Walton, ''The Use of Checks.'' [end of footnote.]
The value of ACH payments grew at a slower pace, increasing from $18.2 trillion to $24.6 trillion, an annual growth rate of 10.5 percent. The average value of an ACH payment declined from $2,984 in 2000 ($3,110 in 2003 dollars) to $2,766 in 2003.
The decline in the average value of ACH payments was due almost entirely to a decline in the value of ACH transactions called cash concentration or dis-bursement (CCD) transactions. Most CCD transac-tions are large-value financial transfers conducted by large corporations, and include nonpayment activity, such as internal corporate account balance trans-fers.
[footnote] 13. CCD payments are traditionally used by large corporations to move funds between their own accounts for internal business and financial purposes and, as such, are of limited interest to this article. However, results of a survey of members of the Association of Financial Professionals (AFP), conducted by Dove Consulting and the AFP in 2003, suggested that around half of CCDs are payments between two counterparties and not just internal transfers. The portion of the value of CCDs that represent payments between counterparties is unknown. [end of footnote.]
They may be made by check, but over time they have increasingly been made over large-value funds transfer systems. The decline in average value may reflect movement of large-value ACH CCD transactions to large-value funds transfer systems or a trend toward the concentration of corporate accounts at fewer depository institutions.
The number of retail ACH payments—ACH pay-ments not classified as CCD payments—increased from 5.1 billion in 2000 to 7.5 billion in 2003, for an annual rate of growth of 13.8 percent.
[footnote] 14. This portion of ACH transactions is considered separately because of the mixing of nonpayment transactions with payments in ACH CCD transactions. [end of footnote.]
In both years, retail ACH payments constituted more than 80 per-
cent of ACH payments. Such payments are compa-rable to certain types of recurring payments typically made by check, such as payroll and remittance pay-ments by businesses and remittance payments by consumers (for example mortgage payments, bill pay-ments to credit card accounts, and utility payments).
The average value of retail ACH payments was $1,108 in 2003, up from $1,005 in 2000 ($1,064 in 2003 dollars). The average value increased at a slower rate than that of checks, so that by 2003 the average values of retail ACH payments and checks were roughly the same.
Recently, new uses of the ACH to convert checks to ACH payments and to make nonrecurring pay-ments over the telephone or Internet (typically made by credit or debit card) have contributed significantly to the growth of ACH payments. The number of ACH payments identified as check conversion trans-actions was more than 300 million in 2003 and rose to at least 1.1 billion in 2004.
[footnote] 15. National Automated Clearing House Association. Figures include check conversion transactions at the point of sale, in the back offices of billers, and at ' 'lockbox'' services provided by depository institutions and others. The figures understate total transactions because they include only those transactions processed on an ACH network and exclude transactions processed internally by only one depository institution (on-us). An unknown—but likely small— number of checks were converted to debit card network payments. [end of footnote.]
The number of ACH payments for Internet or telephone purchases accounted for at least 600 million payments in 2003 and at least 900 million in 2004.
Debit Card Payments
Among electronic payments, debit card transactions grew the most in terms of number, from 8.3 billion in 2000 to 15.6 billion in 2003. The growth in debit card payments accounted for more than half the growth in electronic payments over the period.
Debit cards are used primarily by consumers for everyday purchases at retail stores. Credit cards and checks are also used for this purpose, but, with an average value in 2003 of $40, debit card payments were used for small-value payments more commonly than other payment instruments except electronic benefits transfers and, perhaps, cash.
Most debit cards can be used not only to make payments, but also to access an ATM network by entering a personal identification number (PIN). Depending on the arrangements made by the deposi-tory institution that issues the card, payments by debit card may be routed through one or more net-works. Payments authorized with a PIN may flow

through regional or national debit card networks. Some debit cards may also be used to make signature-based payments (including remote pay-ments that the cardholder authorizes over the Internet or telephone). Almost all such payments are routed through networks operated by VISA or MasterCard. Such cards, therefore, may be used in the same way as credit cards. They have different financial char-acteristics, however, as they are linked to a transac-tion (deposit) account rather than a credit account. The number of signature-based debit card pay-ments almost doubled between 2000 and 2003, from 5.3 billion to 10.3 billion for an annual growth rate of almost 25 percent. This growth accounted for most of the increase in debit card payments. The average value of a signature-based debit payment increased from $40 in 2000 to $42 in 2003.
The number of debit card payments authorized by a PIN increased from 3.0 billion in 2000 to 5.3 billion in 2003, an annual growth rate of 21 per-cent. Although PIN-based debit card payments had a higher growth rate than both ACH and credit card payments, they started from a smaller base. PIN-based payments grew more slowly than signature-based payments, accounting for less than one-third of the growth in debit card payments from 2000 to 2003. The average value of PIN-based debit card payments declined from $46 in 2000 ($49 in 2003 dollars) to $38 in 2003.
When a debit card is used to make a purchase and the card user authorizes payment with a PIN, some merchants may, on request, return part of the pay-ment in cash, sometimes called cash back. In such cases, the value of the payment includes both the value of the purchase and the value of the cash returned. Most debit card networks could not report the value of cash back, nor could they report the number of PIN debit payments that involved the return of cash. The data provided by a few networks suggest that in 2003, about 11 percent of PIN-based debit payments involved the return of some cash to the card user and that about 7 percent of the total value of PIN-based debit payments was returned to card users as cash (a corresponding 93 percent of PIN debit value was used for purchases). For PIN-based debit payments that included some cash back, the value of the cash returned averaged about $30.
[footnote] 16. Because cash back was reported as a separate aggregate, it was not possible from the survey data to compare the average value of PIN-based debit card payments that included cash back with the average value of ones that did not. [end of footnote.]
From 2000 to 2003, the increase in the average value of signature-based debit card payments was small ($2), indicating little change. The decline in the
average value of PIN-based debit card payments was larger ($8), however, indicating an increasing pro-portion of small-value payments. How much of the decline for PIN-based payments should be attributed to declines in the cash-back or purchase portion of the payments is unclear.
Changes in fees charged to card users and mer-chants may help to explain the greater use and faster rise in signature-based compared with PIN-based debit card payments. Most depository institutions do not charge account holders for using a debit card— among those that do, fees are much more common for PIN-based purchases than for signature-based purchases. The trend in fees charged to card users is unknown. Fees charged to merchants for accepting signature-based payments declined between 2000 and 2003, while fees for accepting PIN-based payments increased.
[footnote] 17. Board of Governors of the Federal Reserve System (2004), Report to the Congress on the Disclosure of Point-of-Sale Debit Fees (Washington: Board of Governors, November), www.federalreserve.gov/boarddocs/rptcongress/posdebit2004.pdf. [end of footnote.]
Credit Card Payments
The number of credit card payments increased from 15.6 billion in 2000 to 19.0 billion in 2003, an annual growth rate of 6.7 percent. Among electronic pay-ment instruments, payments by credit card grew at the slowest rate over the period. Credit card pay-ments have shown high rates of growth in the past, and credit cards have been an important payment type for decades. Growth rates are no longer influ-enced by the high rates of adoption that occurred in earlier decades, however, and the overall slowdown in growth is likely a result, in part, of the maturity of the credit card as a payment instrument.
The tapering off of the growth in credit card pay-ments also corresponds to the rapid rise in the use of signature-based debit cards. Just as debit card pay-ments may have replaced many check and cash pay-ments, they may have replaced some credit card payments as well.
Of the 19.0 billion credit card transactions in 2003, 3.8 billion were private-label card transactions, up from 3.3 billion in 2000, for an annual growth rate of 4.4 percent. Private-label credit cards, which were in common use before general-purpose credit cards were introduced, are the most mature type of credit card. During the 1990s, the use of private-label credit cards declined, in part because card users increas-ingly began to use general-purpose credit cards and debit cards in their place. The recent resurgence of

private-label credit card payments may have been influenced by programs that give discounts or rewards for purchases made with the cards or by relatively liberal credit provided by merchants to otherwise-credit-constrained consumers.
Electronic Benefits Transfers
The average (nominal) value of an electronic benefits transfer (EBT) was $26 in both 2000 and 2003, implying that the average value in 2003 dollars declined. EBTs are used to disburse federal and state government benefits, such as food stamp benefits. The number of EBTs rose from 0.5 billion in 2000 to 0.8 billion in 2003, for an annual growth rate of about 15 percent. Much of the growth was due to replace-ment of paper food stamps. As most states have completed conversion to EBTs, future growth is not likely to be influenced by high rates of adoption and, barring substantial growth in the food stamp pro-gram, is likely to taper off in the future.
Payments in Other Countries
A look at noncash payments in other countries pro-vides some perspective on the use of checks and electronic payments in the United States. Compared with other industrialized economies—Japan, the European Monetary Union (EMU), the United King-dom, and Canada—the number of checks per capita is considerably higher in the United States (chart 2).
chart 2. Number of noncash payments per capita, selected economies , 2003
[bar graph showing number per capita of checks and electronic payments. Japan has about 30 electronic payments and about 1 check. European Monetary Union (Includes Austria, Belgium, Finland, France, Germany, Greece, Ireland, Italy, Luxemburg, The Netherlands, Portugal, and Spain.) has about 120 electronic payments and 32 checks. United Kingdom has about 160 electronic payments and 40 checks. Canada has about 175 electronic payments and 40 checks. United states has about 150 electronic payments and 130 checks.]
SOURCES. European Central Bank, Payment and Securities Settlement Sys-tems in the European Union, June 2004; Bank for International Settlement, Statistics on Payment Systems in the Group of Ten Countries; and Federal Reserve Board.
The number of electronic payments per capita is higher in the United States than in Japan and the EMU, but lower than in the United Kingdom and Canada. Detailed data (not shown) indicate that the number of electronic payments per capita in some countries of the EMU, such as Finland, Germany, and the Netherlands, is higher than in the United States. Similarly, the use of electronic payments may be higher in some regions of the United States than in others, as is discussed later.
Between 2000 and 2003, the number of electronic payments per capita in all these economies increased, whereas the number of checks per capita declined. Without reliable measures of cash use, however, a comprehensive comparison across countries of the extent to which electronic payments have replaced all forms of paper-based payments (mostly cash and checks) is not possible.
PAYMENTS AND WITHDRAWALS FROM ACCOUNTS AT DEPOSITORY INSTITUTIONS
The 2004 depository institution survey provided enough information to estimate the number and value of check payments (including money orders, cash-iers, certified, official, travelers, rebate, and credit card checks), ACH payments (credit and debit trans-actions), debit card payments (signature and PIN), and ATM withdrawals by type and size of depository institution (table 2).
[footnote] 18. ACH payments may be credit transfers originated by a payer or debit transfers originated by a payee. ACH payments that result in account debits at a responding depository institution are credits origi-nated on instructions of an account holder (payee) or debits received, possibly from another depository institution, on instructions of a payee. [end of footnote.]
In the following discussion, all these means of debiting accounts are referred to collectively as account debits. The survey collected information on account debits for March and April 2004, and the estimates are expressed as annual rates by multiplying the two-month totals by six. The data reported here should be viewed as annualized figures for March and April 2004, and they may not well represent either calendar year 2003 or calendar year 2004, particularly in the case of ACH and debit card payments which had high rates of growth in both years.
[footnote] 19. The average number of checks processed by the Federal Reserve Banks in March and April is roughly equal to the average processed in other months of the year, so the sum of March and April is representative of other months for these checks. [end of footnote.]
Depository institution survey estimates of the total value of ACH payments reported in this section, however, are much greater than estimates reported for

2003 and much greater than growth rates would imply (table 1). Some of the large commercial banks that responded to the 2004 depository institution survey had difficulty distinguishing ACH payments from other (large-value) funds transfers called offset entries.
[footnote] 20. The difficulty in separating offset entries from ACH payments is due to use of a shared platform to process both, a common practice of some of the largest depository institutions. The difficulty, which involves a small number of very large-value entries, did not substan-tially affect the estimates of the number of ACH payments. See the appendix for more information. [end of footnote.]
The 2003 estimates of ACH value are
believed to be more accurate because they are based, in large part, on aggregate values reported by the ACH operators.
Table 2. A n n u a l n u m b e r and v a l u e of debi ts to t ransact ion accounts held at depos i to ry inst i tut ions
Type and size of institution
(transaction deposits in millions of dollars)
Number of institutions
Checks paid Number (billions)
Checks paid
Value (trillions of
dollars)
Checks paid Average
value (dollars)
ACH payments Number (billions)
ACH payments
Value (trillions of
dollars)
ACH payments
Average value
(dollars)
Debit card payments
Number (billions)
Debit card payments
Value (trillions of
dollars)
Debit card payments
Average value
(dollars)
Commercial banks 6,580 29.06 36.253 1,248 9.07 84.175 9,277 12.42 .497 40
Commercial banks 600 and above 99 19.89 29.070 1,461 7.54 79.988 10,607 10.33 .418 40 Commercial banks 200-599 173 2.19 2.119 967 .49 2.545 5,149 .79 .030 39 Commercial banks 100-199 389 1.83 1.491 816 .38 .590 1,561 .49 .019 38 Commercial banks 0 -99 5,919 5.15 3.573 694 .66 1.053 1,594 .82 .030 37
Savings institutions 1,129 2.95 1.510 511 .51 2.161 4,230 2.14 .087 40
Savings institutions 600 and above 15 1.37 .627 457 .21 1.774 8,591 1.49 .061 41 Savings institutions 200-599 39 .46 .253 545 .07 .129 1,741 .21 .009 41 Savings institutions 100-199 52 .25 .140 570 .04 .060 1,492 .10 .004 41 Savings institutions 0 -99 1,023 .87 .489 562 .19 .199 1,044 .33 .013 39
Credit unions 6,411 4.17 .915 219 .88 .316 358 3.45 .131 38
Credit unions 600 and above 3 .19 .050 256 .05 .021 416 .25 .010 38 Credit unions 200-599 31 .43 .108 253 .10 .040 383 .49 .019 39 Credit unions 100-199 80 .54 .136 252 .13 .049 375 .60 .023 39 Credit unions 0 -99 6,297 3.01 .621 207 .60 .206 346 2.11 .079 38
All institutions 14,120 36.18 38.677 1,069 10.47 86.653 8,279 18.01 .715 40
Type and size of institution (transaction deposits in millions of dollars)
Number of institutions
ATM withdrawals
Number (billions)
ATM withdrawals
Value (trillions of
dollars)
ATM withdrawals
Average value
(dollars)
Total debits to transaction accounts
Number (billions)
Total debits to transaction accounts
Value (trillions of
dollars)
Total debits to transaction accounts
Average value
(dollars)
Memo Transaction
deposits (billions of
dollars)
Memo
Total deposits
(billions of dollars)
Memo Total assets
(billions of dollars)
Commercial banks 6,580 3.87 .345 89 54.43 121.270 2,228 680 4,866 8,031
Commercial banks 600 and above 99 3.11 .291 93 40.87 109.766 2,686 409 3,155 5,445 Commercial banks 200-599 173 .25 .019 75 3.72 4.713 1,268 55 409 709 Commercial banks 100-199 389 .17 .013 73 2.87 2.112 736 53 289 403 Commercial banks 0 -99 5,919 .34 .023 69 6.97 4.679 671 163 1,013 1,474
Savings institutions 1,129 .71 .058 81 6.32 3.815 604 135 800 1,332
Savings institutions 600 and above 15 .40 .038 93 3.48 2.499 719 89 325 608 Savings institutions 200-599 39 .10 .007 73 .85 .397 469 13 122 207 Savings institutions 100-199 52 .06 .004 63 .45 .208 467 7 63 101 Savings institutions 0 -99 1,023 .15 .010 63 1.55 .711 460 25 289 416
Credit unions 6,411 1.29 .094 72 9.79 1.455 149 69 540 623
Credit unions 600 and above 3 .10 .008 79 .60 .089 148 5 32 38 Credit unions 200-599 31 .17 .013 79 1.19 .180 152 9 65 75 Credit unions 100-199 80 .20 .015 78 1.47 .224 152 11 80 93 Credit unions 0 -99 6,297 .83 .057 69 6.54 .963 147 45 363 417
All institutions 14,120 5.87 .497 85 70.53 126.541 1,794 885 6,205 9,985
NOTE. Annualized figures based on survey data for March 2004 and April 2004. Excludes institutions that had no transaction deposits. The number and value of debits are revised from figures reported in Federal Reserve System,
2004 Federal Reserve Payments Study because of improvements to the imputa-tion procedure. See the appendix for details.
Shares of Account Debits among Depository Institutions, by Type and Size of Institution
Depository institutions are grouped into three types (commercial banks, savings institutions, and credit unions) and, within each type, into four categories according to size: largest, large, medium, and small. The largest depository institutions (those with trans-

action deposits of $600 million or above) accounted for the majority of account debits (table 3). This group of 117 institutions (99 commercial banks, 15 savings institutions, and 3 credit unions) repre-sents fewer than 1 percent of the 14,120 depository institutions that had transaction deposits during the survey period, yet these institutions held 57 percent of transaction deposits, and accounted for 64 per-cent of account debits by number and 89 percent by value. Moreover, the largest depository institu-tions accounted for most of the debits of each type (check, ACH, debit card, or ATM withdrawal), by both number and value. The debit type for which this group had the largest share by number was ACH payments (a little less than 75 percent), and the small-est share by number was checks (almost 60 percent).
Table 3. Distribution of debits to transaction accounts among depository institutions, by number and value Percent
Type and size of institution (transaction
deposits in millions of dollars)
Distri-bution
of insti-
tutions, by
number
Checks paid
Number
Checks paid
Value
ACH payments
Number
ACH payments
Value
Debit card payments
Number
tDebit card payments
Value
ATM withdrawals
Number
ATM withdrawals
Value
Total debits to transaction
accounts
Number
Total debits to transaction
accounts
Value
Memo Transaction
deposits Memo
Total deposits
Memo Total assets
Commercial banks 46.6 80.3 93.7 86.7 97.1 69.0 69.6 65.9 69.5 77.2 95.8 76.9 78.4 80.4
Commercial banks 600 and above .7 55.0 75.2 72.0 92.3 57.3 58.4 53.0 58.5 57.9 86.7 46.2 50.8 54.5 Commercial banks 200-599 1.2 6.1 5.5 4.7 2.9 4.4 4.3 4.2 3.7 5.3 3.7 6.2 6.6 7.1 Commercial banks 100-199 2.8 5.0 3.9 3.6 .7 2.7 2.6 3.0 2.6 4.1 1.7 6.0 4.7 4.0 Commercial banks 0-99 41.9 14.2 9.2 6.3 1.2 4.5 4.2 5.8 4.7 9.9 3.7 18.5 16.3 14.8
Savings institutions 8.0 8.2 3.9 4.9 2.5 11.9 12.1 12.1 11.6 9.0 3.0 15.3 12.9 13.3
Savings institutions 600 and above .1 3.8 1.6 2.0 2.0 8.3 8.5 6.9 7.6 4.9 2.0 10.1 5.2 6.1 Savings institutions 200-599 .3 1.3 .7 .7 .1 1.2 1.2 1.6 1.4 1.2 .3 1.5 2.0 2.1 Savings institutions 100-199 .4 .7 .4 .4 .1 .6 .6 1.0 .7 .6 .2 .8 1.0 1.0 Savings institutions 0-99 7.2 2.4 1.3 1.8 .2 1.8 1.8 2.6 2.0 2.2 .6 2.8 4.7 4.2
Credit unions 45.4 11.5 2.4 8.4 .4 19.1 18.3 22.0 18.8 13.9 1.2 7.8 8.7 6.2
Credit unions 600 and above .0 .5 .1 .5 .0 1.4 1.4 1.7 1.6 .8 .1 .5 .5 .4 Credit unions 200-599 .2 1.2 .3 1.0 .0 2.7 2.6 2.8 2.6 1.7 .1 1.0 1.0 .7 Credit unions 100-199 .6 1.5 .4 1.2 .1 3.3 3.3 3.3 3.1 2.1 .2 1.2 1.3 .9 Credit unions 0-99 44.6 8.3 1.6 5.7 .2 11.7 11.1 14.2 11.6 9.3 .8 5.1 5.9 4.2
All institutions 100.0 100.0 100.0 100.0 100.0 100.0 100.0 100.0 100.0 100.0 100.0 100.0 100.0 100.0
NOTE. See general note to table 2.
The average value of account debits varied with depository institution size. For ACH payments in particular, a substantial amount of value was concen-trated at the largest commercial banks (table 2). The greater average value of ACH payments at the largest banks was due, in part, to the exceptionally high values reported by some banks, as noted above, but the average value of checks was also considerably greater at these largest banks. Generally, the increase in the average value of ACH payments and checks with increasing size of commercial banks appears to have been driven by the greater presence of large
business customers at larger commercial banks.
[footnote] 21. We estimate that in 2000 the average value of checks written by individuals was about $350 and by businesses, $1,700. These are the authors' estimates based on a study in which indi-vidual checks that could be classified were sorted by payer. See Federal Reserve System (2002), Retail Payment Research Project: A Snapshot of the U.S. Retail Payment Landscape, Federal Reserve System Study, pp. 12-14, www.frbservices.org/Retail/pdf/ RetailPaymentsResearchProject.pdf. [end of footnote.]
Larger commercial banks are more likely to have large corporations as customers, and these customers are more likely to make larger-value payments by check or ACH.
Savings institutions appear to have lower propor-tions of business customers than commercial banks, shown by the lower average values of their check and ACH payments. The average value of ACH payments was substantially greater at the largest savings insti-tutions, compared with the large savings institutions while the average value of checks was smaller.
Credit unions, which generally do not handle trans-action accounts for businesses, had the lowest aver-age values of check and ACH payments. They did not show material increases in the average value of check payments with increasing institution size. However, they did show increases in the average value of ACH payments with increasing size.

Distribution of Depository Institutions' Account Debits, by Type and Size of Institution
Overall, about 51 percent of account debits were made by check, 15 percent were ACH payments, 26 percent were debit card payments, and 8 percent were cash withdrawals from ATMs (table 4).
[footnote] 22. These figures do not represent percentages in total noncash payments primarily because debits to deposit accounts include ATM withdrawals and do not include credit card payments. [end of footnote.]
Table 4. Distribution of debits to transaction accounts at depository institutions, by number and value Percent
Type and size of institution
(transaction deposits in millions of dollars)
Checks paid
Number
Checks paid
Value
ACH payments
Number
ACH payments
Value
Debit card payments
Number
Debit card payments
Value
ATM withdrawals
Number
ATM withdrawals
Value
Total debits to transaction accounts
Number
Total debits to transaction accounts
Value
Commercial banks 53.4 29.9 16.7 69.4 22.8 .4 7.1 .3 100.0 100.0
600 and above 48.7 26.5 18.5 72.9 25.3 .4 7.6 .3 100.0 100.0 200-599 58.9 45.0 13.3 54.0 21.1 .6 6.6 .4 100.0 100.0 100-199 63.6 70.6 13.2 27.9 17.1 .9 6.1 .6 100.0 100.0 0-99 73.9 76.4 9.5 22.5 11.8 .6 4.8 .5 100.0 100.0
Savings institutions 46.8 39.6 8.1 56.6 33.9 2.3 11.2 1.5 100.0 100.0
600 and above 39.5 25.1 5.9 71.0 42.9 2.4 11.6 1.5 100.0 100.0 200-599 54.9 63.7 8.7 32.4 25.2 2.2 11.2 1.7 100.0 100.0 100-199 55.2 67.4 9.1 28.9 23.2 2.0 12.6 1.7 100.0 100.0 0-99 56.3 68.9 12.3 27.9 21.5 1.8 10.0 1.4 100.0 100.0
Credit unions 42.6 62.8 9.0 21.7 35.2 9.0 13.2 6.4 100.0 100.0
600 and above 32.6 56.2 8.6 24.0 42.3 10.9 16.5 8.8 100.0 100.0 200-599 36.0 60.0 8.8 22.3 41.2 10.5 14.0 7.3 100.0 100.0 100-199 36.9 60.9 8.9 21.8 40.9 10.4 13.4 6.9 100.0 100.0 0-99 45.9 64.4 9.1 21.4 32.2 8.2 12.7 6.0 100.0 100.0
All institutions 51.3 30.6 14.8 68.5 25.5 .6 8.3 .4 100.0 100.0
NOTE. See general note to table 2.
The distribution of account debits, by number, at commer-cial banks differed markedly from the distributions at savings institutions and credit unions.
The proportion of checks at commercial banks was about 53 percent, compared with 47 percent at sav-ings institutions and 43 percent at credit unions. For commercial banks, the proportion of checks declined noticeably with increasing size. The proportion at small banks (those with less than $100 million in deposits) was about 74 percent, and at the largest banks, 49 percent. The proportion of checks also declined with increasing size at savings institutions and credit unions. The proportion of checks may be smaller at larger depository institutions because they provide (and perhaps encourage) greater use of ACH and debit cards. Larger depository institutions may also serve more sophisticated customers, including large businesses, that may be more willing or able to take advantage of cost savings or other benefits afforded by other types of payment.
For commercial banks, the proportion of ACH payments by number increased with increasing size,
the reverse of the relationship for checks, and pay-ments at larger banks were more likely to be made via ACH. The greater proportion of ACH payments at the largest banks may have had much to do with greater use of ACH by large corporate account hold-ers. The proportion of ACH payments, by number, did not increase with increasing size at savings insti-tutions and credit unions; it was generally flat across size categories for credit unions, and it declined with increasing size for savings institutions.
Debit card payments and ATM withdrawals are made primarily by individuals—and as a proportion of debits, are more prevalent at credit unions, because generally these institutions do not have large business customers. About 35 percent of payments at credit unions and 34 percent of payments at savings institu-tions were made by debit card. In contrast, the pro-portion of debit card payments for commercial banks, which as a category have more business customers, was smaller, at 23 percent. Similarly, the proportion of ATM withdrawals was greater for savings institu-tions and credit unions—11 percent and 13 percent, respectively, compared with 7 percent for commer-cial banks.
Overall, as estimated from the 2004 depository institution survey, signature-based debit card pay-ments, at 11.7 billion, were almost twice as common as PIN-based debit card payments, at 6.3 billion. The ratio of signature-based to PIN-based debit card payments was roughly similar across institutions of different types and sizes, indicating that use of signa-ture and PIN authorization for debit card purchases

does not vary with the size or type of institution. Although the ratio of signature to PIN debits did not vary with size or type, there was substantial variation among responding institutions. (Figures referred to in this paragraph are not shown in the tables.)
Variation in the use of signature-based and PIN-based debit card payments from institution to insti-tution reflects card user preferences but can be influenced by incentives to use one or the other authorization method offered by either merchants or depository institutions. Merchants, for example, may or may not accept both authorization methods, or may limit acceptance of cards to certain purchase values or to certain products. Card associations or depository institutions may offer more benefits to users that authorize debit card payments with a signa-ture. In 2003, per-transaction fees charged to mer-chants generally increased with the value of the pay-ment for signature-based debit card payments but were generally fixed for PIN-based payments. Some depository institutions charge their customers fees for their debit card purchases authorized with a PIN
[footnote] 23. Board of Governors of the Federal Reserve System, Point-of-Sale Debit Fees. [end of footnote.]
Depository institutions and card associations also offer benefits to customers who authorize with a signature.
"On Us" Payments
The proportions of account debits that are on-us— that is, those that involve only one depository institution—are interesting because clearing and settlement of such payments occur internally at the depository institution and, therefore many of the costs associated with coordinating payments with other depository institutions are not incurred.
[footnote] 24. For checks and ACH payments, ''on us' ' means that the payer and the payee use the same depository institution. For ATMs, the term means that the withdrawal occurred at a proprietary ATM (owned by the account holder's depository institution). Data on on-us debit card payments were not collected. On-us account debits plus interbank account debits sum to total account debits. [end of footnote.]
For exam-ple, when a check needs to be collected from another depository institution, float cost and risk-reduction incentives lead depository institutions to use fast and costly transportation channels to expedite check pre-sentment and collection. Float costs and some risks are absent when a check is on-us, allowing deposi-tory institutions to avoid expensive transportation channels.
Commercial banks as a group generally had the highest proportion of on-us account debits, by num-ber and value, while credit unions had the lowest
proportion (table 5). Banks with both businesses and consumers as customers are more likely to have on-us payments. About 13 percent of checks col-lected in 2000 were from one individual to another.
[footnote] 25 . F e d e r a l R e s e r v e S y s t e m , Retail Payment Research Project. [end of footnote.]
Thus, 87 percent involved a business or government. The relatively high proportions of on-us check and ACH payments at commercial banks were influ-enced by these institutions' larger share of business customers.
Overall, 23 percent of checks paid were on-us, about 4 percentage points lower than the estimate from the 2001 depository institution survey. The on-us proportion declined for all types of institution, but the proportion reported by credit unions declined considerably—from an estimated 6 percent in 2000 to 2 percent in 2003. The decline in the proportion of on-us checks could be one consequence of a possible decline in the cashing of personal checks as a means of obtaining cash at a teller window in an individual' s own depository institution (discussed later). How-ever, some evidence suggests that respondents reported more accurate on-us figures in the 2004 survey, implying that estimates of the proportion of on-us payments from the 2001 survey may have been too large.
[footnote] 26. The survey definition of ' 'on-us'' focuses on both the payer and the payee. It appears that some depository institutions interpreted the term to mean any check the depository institution is responsible for paying. Respondents may have become more familiar with the survey definition of on-us over time. [end of footnote.]
The proportion of on-us ACH payments in terms of value was notably larger for the largest commer-cial banks and savings institutions than for their smaller counterparts. The larger proportions appear to have resulted from data reported by some very large depository institutions that apparently generate a significantly larger share of large-value on-us ACH payments than other similarly sized institutions. As noted earlier, some of the reported ACH payments also included large-dollar account entries, called off-set entries, conducted for internal account-balancing and settlement purposes. Institutions that had prob-lems distinguishing offset entries appear to have over-estimated the value of both on-us and interbank ACH payments.
The largest proportions of on-us account debits, both by number and value, were for ATM withdraw-als except by value for large savings institutions. Most of the other types of account debits involve payments to other parties, who choose the depository institution in which to deposit funds. In the case of ATM withdrawals, the account holder plays the role of payee and payer, choosing the depository institu-

tion in both cases. Not surprisingly, therefore, these payments are more likely to be on-us. For commer-cial banks, 68 percent of ATM withdrawals are on-us (69 percent by value), much higher than their on-us shares for other types of account debits. Commercial banks also generally have the largest networks of ATMs. Even credit unions, which own relatively few ATMs and for which the on-us shares for check and ACH payments were negligible, as a group had an on-us share for ATM withdrawals of 37 percent (39 percent by value). The larger on-us shares for ATM withdrawals also appear to reflect account holder avoidance of the fees commonly charged for using an ATM owned by another depository institu-tion or other company (nonproprietary ATM).
Table 5. Proportion of selected debits to transaction accounts at depository institutions that were on-us, by number and value Percent
Type and size of institution
(transaction deposits in millions of dollars)
Checks paid
Number
Checks paid
Value
ACH payments
Number
ACH payments
Value
ATM withdrawals
Number
ATM withdrawals
Value
Total debits to transaction accounts
Number
Total debits to transaction accounts
Value
Commercial banks 26.9 32.4 21.9 42.1 67.9 69.4 29.6 39.3
Commercial banks 600 and above 28.7 32.8 24.8 42.9 70.4 71.7 32.0 40.3 Commercial banks 200-599 20.7 27.5 13.0 33.9 63.2 60.8 23.0 31.1 Commercial banks 100-199 21.5 32.6 5.2 16.8 60.7 62.1 21.8 28.3 Commercial banks 0 -99 24.5 31.5 5.3 17.4 52.6 51.3 23.9 28.4
Savings institutions 10.9 19.1 6.7 68.1 54.1 57.5 17.8 48.4
Savings institutions 600 and above 11.4 21.8 10.8 79.2 57.4 57.7 20.7 64.4 Savings institutions 200-599 9.4 16.0 4.8 22.9 53.7 59.3 15.6 19.1 Savings institutions 100-199 11.6 18.8 4.8 19.8 49.9 59.6 17.3 19.8 Savings institutions 0 -99 10.6 17.4 3.5 12.2 47.2 54.9 14.2 16.4
Credit unions 2.4 4.4 1.7 4.3 37.0 38.6 9.4 6.8
Credit unions 600 and above .6 1.6 .3 2.0 52.9 41.7 15.5 5.7 Credit unions 200-599 2.3 3.8 2.3 6.5 46.3 44.0 12.8 7.7 Credit unions 100-199 2.7 4.3 2.8 7.7 44.2 44.7 12.1 8.2 Credit unions 0 -99 2.5 4.7 1.6 3.4 31.6 35.4 7.8 6.4
All institutions 22.8 31.2 19.5 42.7 59.5 62.2 26.2 39.2
NOTE. See general note to table 2.
Regional Variation
Estimates of the number and value of account debits by region are useful because they may help identify the ways in which differences in regional characteris-tics may influence the use of payment instruments. The 2004 depository institution survey yielded enough information to estimate the number and value of debits to accounts located in the four geographic divisions of the United States defined by the U.S. Census Bureau: Northeast, South, Midwest, and West (table 6). Estimation of debits from accounts in urban and rural locations was also possible (table 7). The 2004 survey gives a much clearer picture of the ways payment use differs by region than earlier surveys,
which collected data sufficient to study regional variation in the use of checks but not in the use of other types of account debits.
Variation by Geographic Division
Estimates of account debits were constructed for each region after allocating depository institution data to regions according to the location of their branches.
[footnote] 27. As no region-specific data were collected from multiregion depository institutions, it was necessary to make an assumption about the way payments were allocated within responding multiregion depository institutions. For commercial banks and savings institu-tions, data on the regional distribution of deposits were available, so account debits at these institutions were allocated to regions in proportion to their deposits. For credit unions, account debits were allocated to regions according to the distribution of their branches. See the appendix for a discussion of the method used and assumptions required to allocate the figures for multiregion depository institutions to regions. [end of footnote.]
These regional estimates, along with other regional data, provided the basis for comparing the use of payments in different regions of the country.
The estimate for checks as a proportion of total account debits at depository institutions ranged from a low of 46 percent in the West to a high of 55 per-cent in the Midwest.
[footnote] 28. A preliminary multivariate statistical analysis that controlled for other factors correlated with depository institutions' share of checks in total reported account debits, by number, including deposi-tory institution size and type, showed that the greater share of checks for institutions in the Midwest is significantly different (in the statisti-cal sense) from the shares in other regions. [end of footnote.]
By value, the shares of checks

appear to cluster into two groups: The West and Midwest had the lowest proportions, at 20 percent and 25 percent, respectively, and the South and Northeast had the highest proportions, at 41 per-cent and 40 percent respectively.
[footnote] 29. One important caveat to the comparison of check shares by value is that the two institutions that reported the highest ACH values, much higher than other institutions of similar size, operated in the West and Midwest and likely contributed substantially to the low share of value for checks. Thus, the comparison of shares by value is sensitive to errors in reporting ACH payments, whereas the share by number and other results reported in this section are not. [end of footnote.]
The average value of checks was lowest in the West ($923) and highest in the Northeast ($1,355). One explanation for the high value of checks in the Northeast may be that use of a special type of corporate checking account—the controlled-disbursement account—is concentrated in this region.
The regions are not equal in population. One way to put them on a comparable basis is to express the figures in terms of number or value per capita.
[footnote] 30. Note that per capita figures are based on the entire population and include all payments, not just those made by individuals. Thus, figures do not represent averages of adult individuals or heads of household. [end of footnote.]
The annual number of account debits per capita ranged from a low of 231 in the South to a high of 262 in the Midwest. The annual number of checks per capita was lowest in the West, at 110, and highest in the Midwest, at 144. The value of checks per capita was also lowest in the West, but it was highest in the Northeast.
The regions also vary by amount of economic output (defined as the sum of gross state output for the states in each region) and can be put on a com-parable basis by expressing the figures in terms of number or value of account debits per $1,000 of economic output. The annual number of account deb-its per $1,000 of regional output ranged from 5.9 in the Northeast to 7.2 in the Midwest. The number of checks per $1,000 of economic output was lowest in the West, at 2.8 and highest in the Midwest, at 3.9. The value of checks per $1,000 of economic output was also lowest in the West, at $2,618, but was highest the Northeast, at $4,042.
Debit card payments accounted for 33 percent of account debits by number in the West, compared with a range of 21 percent to 25 percent in the other regions. The proportion of debit card payments by value in the West was driven down by the extremely high value for ACH payments. The annual number and value of debit card payments per capita in the West, however, highlights the more prevalent use of debit cards in that region. The West had about 79 debit card payments per capita; the South and Mid-
west were well behind at 59.
[footnote] 31. While estimates for subregions are too unreliable to report in detail, they show that the Pacific region (Alaska, California, Hawaii, Oregon, and Washington) had the highest use of debit cards per capita in the United States and the Middle Atlantic region (New York, New Jersey, and Pennsylvania) had the lowest. [end of footnote.]
The Northeast, at 51 debit card payments per capita, showed the lowest use, only 65 percent of the per capita figure in the West. Depository institutions in the West began offer-ing debit card payments earlier than those in other regions, providing one explanation for the high debit card use in the West compared with other regions. Evidence from a different study also suggests that fees charged to cardholders for PIN debit use are least prevalent in the West and most prevalent in the Northeast.
[footnote] 32. Board of Governors, Point-of-Sale Debit Fees, p. 16 and p. 17, table 3. [end of footnote.]
The average value of a debit card payment was $45 in the Northeast, compared with $39 in the other regions. The reason for the difference is unknown, but it could be that there were more cash-back trans-actions or a larger proportion of higher-value debit payments in the Northeast.
The annual number of ATM withdrawals per capita was highest in the Northeast, at 24, and lowest in the South, at 18. The average value of ATM withdrawals was highest in the Northeast, at $93, and lowest in the Midwest and South, at $78 and $79 respectively. The ATM data suggest that cash is used relatively more frequently in the Northeast, but individuals in other regions may obtain cash through other means, such as by writing checks, making debit card pur-chases with a PIN for cash back, or obtaining cash directly from a teller at a local depository institution branch.
Although data on ATM withdrawals provide indi-rect evidence of cash use, data on frequency and value of cash payments would better contribute to our understanding of which payment types are preferred in the different regions. The other important payment type missing from the regional analysis, of course, is credit card payments. Although the data presented here provide the most comprehensive and detailed information to date on the regional distribution of payments, evidence on payment use across regions remains incomplete because of the lack of cash pay-ment and credit card payment data by region.
Urban and Rural Variation
The total number and value of payments were much smaller for rural areas than for urban areas, reflecting

the smaller population and lower economic output in rural areas (table 7).
[footnote] 33. Note that rural areas include some areas surrounding cities. [end of footnote.]
The relative use of checks was lower and the relative use of electronic debits was higher in urban areas. The proportion of checks, by number, was 60 percent in rural areas and 49 percent in urban areas. The proportions of ACH and debit card payments and ATM withdrawals, by number, were all higher in urban areas, with debit card pay-ments having the largest difference in share—27 per-cent in urban areas, compared with 21 percent in rural areas.
Generally, the number and value of payments per capita were higher in urban areas, reflecting the greater amount of wealth and business activity in those areas.
Comparison with Earlier Findings
The annual number of check payments declined in all divisions between the 2001 and 2004 depository institution surveys. The most pronounced changes occurred in the South and West, with declines of 32 and 29 checks per capita, respectively, compared with 25 checks per capita in the Midwest. The decline was by far the smallest in the Northeast, at only 7 checks per capita.
Table 6. Annual number and value of debits to transaction accounts at depository institutions, by geographic region
Item
Northeast Multi-region
Northeast
Single region
Northeast All
institutions South Multi-
region
South
Single region
South All institutions
Midwest Multi-region
Midwest
Single region
Midwest All institutions
West Multi-region
West
Single region
West All institutions
Number (billions) 8.7 4.8 13.4 11.1 13.1 24.2 8.6 8.6 17.2 7.6 8.1 15.8
Number (billions) Checks 4.3 2.5 6.8 5.2 7.5 12.7 4.0 5.4 9.4 3.3 3.9 7.3 Number (billions) ACH 1.9 .6 2.5 2.0 1.5 3.5 1.7 .9 2.6 1.2 .7 1.8 Number (billions) Debit card 1.7 1.1 2.8 3.0 3.1 6.1 2.2 1.6 3.9 2.5 2.8 5.3 Number (billions) ATM .8 .6 1.3 .9 1.0 1.9 .6 .6 1.3 .7 .7 1.4
Value (trillions of dollars) 18.87 4.27 23.15 21.89 10.75 32.64 31.68 5.79 37.47 25.29 7.99 33.29
Value (trillions of dollars) Checks 7.18 2.07 9.25 7.30 5.94 13.23 6.07 3.40 9.47 3.92 2.8 6.72 Value (trillions of dollars) ACH 11.54 2.10 13.64 14.39 4.63 19.02 25.48 2.28 27.75 21.21 5.02 26.23 Value (trillions of dollars) Debit card .08 .05 .13 .12 .11 .24 .09 .06 .15 .10 .11 .20 Value (trillions of dollars) ATM .08 .05 .12 .08 .07 .15 .05 .05 .10 .06 .06 .12
Distribution by number (percent) 100.0 100.0 100.0 100.0 100.0 100.0 100.0 100.0 100.0 100.0 100.0 100.0
Distribution by number (percent) Checks
50.0 52.3 50.8 46.8 57.2 52.4 46.8 62.7 54.8 43.8 48.5 46.2 Distribution by
number (percent) ACH
22.1 12.4 18.6 18.0 11.7 14.6 19.8 10.7 15.3 15.2 8.2 11.6 Distribution by
number (percent) Debit card
19.1 23.6 20.7 27.5 23.5 25.3 25.9 19.1 22.5 32.3 34.4 33.4 Distribution by
number (percent) ATM
8.9 11.7 9.9 7.8 7.7 7.7 7.5 7.5 7.5 8.7 9.0 8.9
Distribution by value (percent) 100.0 100.0 100.0 100.0 100.0 100.0 100.0 100.0 100.0 100.0 100.0 100.0
Distribution by value (percent) Checks
38.0 48.5 40.0 33.3 55.2 40.5 19.2 58.7 25.3 15.5 35.0 20.2 Distribution by value (percent) ACH
61.1 49.3 58.9 65.8 43.1 58.3 80.4 39.4 74.1 83.9 62.8 78.8 Distribution by value (percent) Debit card
.4 1.2 .5 .6 1.1 .7 .3 1.1 .4 .4 1.4 .6 Distribution by value (percent) ATM
.4 1.1 .5 .4 .6 .5 .2 .8 .3 .2 .8 .4
Number per capita 159 88 247 106 125 231 131 131 262 115 122 237
Number per capita Checks 80 46 126 50 72 121 61 82 144 50 59 110 Number per capita ACH 35 11 46 19 15 34 26 14 40 17 10 27 Number per capita Debit card 30 21 51 29 29 59 34 25 59 37 42 79 Number per capita ATM 14 10 24 8 10 18 10 10 20 10 11 21
Number per capita Value per capita (dollars) 346,779 78,487 425,266 209,466 102,828 312,294 484,242 88,438 572,681 380,660 120,306 500,965 Number per capita Value per capita
(dollars) Checks 131,933 38,085 170,018 69,831 56,796 126,626 92,752 51,923 144,675 59,018 42,164 101,182 Number per capita Value per capita
(dollars) ACH 212,018 38,656 250,675 137,725 44,272 181,997 389,360 34,827 424,187 319,260 75,571 394,830 Number per capita Value per capita
(dollars) Debit card 1,382 916 2,298 1,160 1,095 2,256 1,319 961 2,280 1,449 1,634 3,082 Number per capita Value per capita
(dollars) ATM 1,445 830 2,275 750 665 1,415 812 727 1,539 933 937 1,870
Average (dollars) 2,178 894 1,722 1,974 821 1,349 3,693 675 2,185 3,309 985 2,113
Average (dollars) Checks 1,658 829 1,355 1,407 792 1,044 1,511 632 1,008 1,171 713 923 Average (dollars) ACH 6,031 3,565 5,450 7,211 3,028 5,397 14,972 2,486 10,601 18,319 7,578 14,410 Average (dollars) Debit card 46 44 45 40 37 39 39 38 39 39 39 39 Average (dollars) ATM 102 81 93 91 69 79 83 74 78 93 85 89

Table 6.—Continued
Item
Northeast Multi-region
Northeast
Single region
Northeast All institutions
South Multi-region
South
Single region
South All institutions
Midwest Multi-region
Midwest
Single region
Midwest All institutions
West Multi-region
West
Single region
West All institutions
Number per $1,000 of output 3.8 2.1 5.9 3.0 3.6 6.6 3.6 3.6 7.2 3.0 3.2 6.1
Number per $1,000 of output Checks 1.9 1.1 3.0 1.4 2.0 3.5 1.7 2.2 3.9 1.3 1.5 2.8
Number per $1,000 of output ACH .8 .3 1.1 .5 .4 1.0 .7 .4 1.1 .5 .3 .7
Number per $1,000 of output Debit card .7 .5 1.2 .8 .8 1.7 .9 .7 1.6 1.0 1.1 2.0
Number per $1,000 of output ATM .3 .2 .6 .2 .3 .5 .3 .3 .5 .3 .3 .5
Value per $1,000 of output (dollars) 8,245 1,866 10,111 5,987 2,939 8,925 13,216 2,414 15,629 9,850 3,113 12,963
Value per $1,000 of output (dollars) Checks
3,137 906 4,042 1,996 1,623 3,619 2,531 1,417 3,948 1,527 1,091 2,618 Value per $1,000
of output (dollars) ACH
5,041 919 5,960 3,936 1,265 5,201 10,626 950 11,577 8,261 1,956 10,217 Value per $1,000
of output (dollars) Debit card
33 22 55 33 31 64 36 26 62 37 42 80 Value per $1,000
of output (dollars) ATM
34 20 54 21 19 40 22 20 42 24 24 48
Number-to-deposits ratio[see footnote]1 78.1 62.0 71.5 109.8 71.2 84.9 126.2 68.0 88.4 125.3 54.8 75.4
Number-to-deposits ratio[see footnote]1 Checks
39.0 32.5 36.3 51.3 40.7 44.5 59.1 42.7 48.4 54.9 26.6 34.8 Number-to-
deposits ratio[see footnote]1 ACH
17.2 7.7 13.3 19.8 8.3 12.4 25.0 7.3 13.5 19.0 4.5 8.7 Number-to-
deposits ratio[see footnote]1 Debit card
14.9 14.6 14.8 30.2 16.7 21.5 32.6 13.0 19.9 40.5 18.8 25.2 Number-to-
deposits ratio[see footnote]1 ATM
6.9 7.3 7.1 8.5 5.5 6.5 9.4 5.1 6.6 10.9 4.9 6.7
Value-to-deposits ratio[see footnote]2 170,035 55,477 123,115 216,762 58,409 114,527 465,933 45,924 193,144 414,622 54,009 159,260
Value-to-deposits ratio[see footnote]2 Checks 64,690 26,920 49,220 72,263 32,262 46,437 89,245 26,963 48,793 64,283 18,929 32,166
Value-to-deposits ratio[see footnote]2 ACH 103,958 27,324 72,571 142,522 25,148 66,744 374,638 18,085 143,062 347,744 33,926 125,519
Value-to-deposits ratio[see footnote]2 Debit card 678 647 665 1,201 622 827 1,269 499 769 1,578 733 980
Value-to-deposits ratio[see footnote]2 ATM 709 587 659 776 378 519 781 378 519 1,017 421 595
Number of institutions 133 2,096 2,229 248 4,540 4,788 186 5,007 5,193 155 1,960 2,115
Population (millions)
. . . . . . 54.4
. . . . . . 104.5
. . . . . . 65.4
. . . . . . 66.4
Output (billions of dollars)[see footnote]3
. . . . . . 2,289
. . . . . . 3,657
. . . . . . 2,397
. . . . . . 2,568
Transaction deposits (billions of dollars) 111 77 188 101 184 285 68 126 194 61 148 209
NOTE. Annualized figures based on survey data for March 2004 and April 2004. Multiregion institutions are those that have deposits in more than one region; single-region institutions have deposits in only one region. The North-east region includes Connecticut, Maine, Massachusetts, New Hampshire, New Jersey, New York, Pennsylvania, Rhode Island, and Vermont. The South region includes Alabama, Arkansas, Delaware, the District of Columbia, Florida, Georgia, Kentucky, Louisiana, Maryland, Mississippi, North Carolina, Okla-homa, South Carolina, Tennessee, Texas, Virginia, and West Virginia. The Midwest region includes Illinois, Indiana, Iowa, Kansas, Michigan, Minnesota,
Missouri, Nebraska, North Dakota, Ohio, South Dakota, and Wisconsin. The West region includes Alaska, Arizona, California, Colorado, Hawaii, Idaho, Montana, Nevada, New Mexico, Oregon, Utah, Washington, and Wyoming. [footnote] 1. Annual number of debits per $1,000 of transaction deposits. [end of footnote.] [footnote] 2. Annual value of debits per $1,000 of transaction deposits. [end of footnote.] [footnote] 3. Output is measured as the sum of the gross state products in the region. [end of footnote.]
SOURCES. Federal Reserve; and Department of Commerce, Bureau of Economic Analysis and Bureau of the Census.
Recall that in the 2004 survey, the number of debit card payments per capita was considerably lower in the Northeast than in other regions and that ATM withdrawals were higher. These findings suggest that the Northeast has lagged other regions in the replace-ment of checks (and cash) with debit card payments and that the declines in checks in the other regions were being led by a replacement of checks written by individuals rather than businesses. The number of checks per capita also declined more in rural areas than in urban areas, 34 checks per capita compared with 23, suggesting that the replacement of checks with other payment types happened with greater fre-quency in rural areas.
Returned Check and ACH Payments
Some checks that are presented for payment are returned unpaid because of insufficient funds, closed accounts, fraud, or other reasons. The same is true for ACH payments.
[footnote] 34. Credit card and debit card payments also may fail because of credit limits or insufficient funds, closed accounts, disputes, or fraud. Because most of these types of payments are approved in real time and are not returned in the same sense as checks and ACH payments, they are outside the scope of this discussion. [end of footnote.]

Table 7. Annual number and value of debits to transaction accounts at depository institutions, in urban and rural areas
Item Urban Rural Total
Number (billions) 58.4 12.2 70.5
Number (billions) Checks 28.9 7.3 36.2 Number (billions) ACH 9.0 1.5 10.5 Number (billions) Debit card 15.5 2.5 18.0 Number (billions) ATM 5.0 .8 5.9
Value (trillions of dollars) 111.7 14.9 126.5
Value (trillions of dollars) Checks 33.3 5.4 38.7 Value (trillions of dollars) ACH 77.3 9.3 86.7 Value (trillions of dollars) Debit card .6 .1 .7 Value (trillions of dollars) ATM .4 .1 .5
Distribution by number (percent) 100.0 100.0 100.0
Distribution by number (percent) Checks 49.4 60.2 51.3 Distribution by number (percent) ACH 15.4 12.2 14.8 Distribution by number (percent) Debit card 26.5 20.7 25.5 Distribution by number (percent) ATM 8.6 6.9 8.3
Distribution by value (percent) 100.0 100.0 100.0
Distribution by value (percent) Checks 29.8 36.1 30.6 Distribution by value (percent) ACH 69.2 62.9 68.5 Distribution by value (percent) Debit card .6 .6 .6 Distribution by value (percent) ATM .4 .4 .4
Number per capita 248 221 243
Number per capita Checks 122 133 124 Number per capita ACH 38 27 36 Number per capita Debit card 66 46 62 Number per capita ATM 21 15 20
Value per capita (dollars) 473,857 269,636 435,165
Value per capita (dollars) Checks 141,369 97,229 133,006 Value per capita (dollars) ACH 328,016 169,547 297,992 Value per capita (dollars) Debit card 2,628 1,732 2,458 Value per capita (dollars) ATM 1,844 1,128 1,708
Average value (dollars) 1,913 1,221 1,794
Average value (dollars) Checks 1,155 731 1,069 Average value (dollars) ACH 8,609 6,287 8,279 Average value (dollars) Debit card 40 38 40 Average value (dollars) ATM 86 74 85
Number-to-deposits ratio [see footnote]1 82.1 74.2 80.6
Number-to-deposits ratio[see footnote]1 Checks 40.6 44.7 41.3 Number-to-deposits ratio[see footnote]1 ACH 12.6 9.1 12.0 Number-to-deposits ratio[see footnote]1 Debit card 21.8 15.3 20.6 Number-to-deposits ratio[see footnote]1 ATM 7.1 5.1 6.7
Value-to-deposits ratio[see footnote]2 157,083 203,172 144,618
Value-to-deposits ratio[see footnote]2 Checks 46,864 32,663 44,202 Value-to-deposits ratio[see footnote]2 ACH 108,737 56,957 99,032 Value-to-deposits ratio[see footnote]2 Debit card 871 582 817 Value-to-deposits ratio[see footnote]2 ATM 611 379 568
Number of institutions 9,745 6,206 15,951 Population (millions) 235.7 55.1 290.8 Transaction deposits (billions
of dollars) 711 164 875
NOTE. Annualized figures based on survey data collected March 2004 and April 2004. Urban areas are those defined as metropolitan statistical areas or New England county metropolitan statistical areas; rural areas are defined as those outside urban areas. [footnote] 1. See table 6, note 1. [end of footnote.] [footnote] 2. See table 6, note 2. [end of footnote.]
SOURCES. Federal Reserve; and Department of Commerce, Bureau of Eco-nomic Analysis and Bureau of the Census.
Returned Checks
Checks were returned an estimated 187 million times in 2003 down from about 240 million times in 2000. Some checks returned for insufficient funds are pre-sented again (re-presented) and returned again if funds are still unavailable. Because some checks are returned more than once, and therefore would have been counted more than once in the depository insti-tution survey, the ratio of the number of times checks are returned to total checks is an upper bound on the probability that a check will be returned. It is esti-mated that check returns constituted, at most, 0.52 percent of estimated total checks in 2003 (or about 5.2 returns for every 1,000 checks presented), compared with 0.58 percent of estimated total checks in 2000 (or about 5.8 returns for every 1,000 checks presented).
[footnote] 35. The 2004 depository institution survey also collected data on the portion of returned checks that were on-us. Such checks would be returned directly to the depositing customer rather than another depository institution. An estimated 21 million returned checks, or about 11 percent of all returned checks, were on-us. Data on on-us returned checks were not collected in the 2001 depository institution survey. In Gerdes and Walton, ''The Use of Checks,'' reports discuss-ing returned checks for 2000 assumed that the estimates of returns reported by depository institutions did not include on-us returns, and the proportion of returned checks was computed as a percentage of interbank checks, resulting in a larger percentage than reported here. On the basis of the 2004 survey results and a reexamination of the 2001 survey, we believe that depository institutions did include on-us checks in the returned checks reported. [end of footnote.]
Thus, the number of returned checks processed through the check collection system declined faster than the total number of checks presented.
One reason for the decline in the proportion of checks returned through the check collection system is that some checks are now being re-presented through the ACH system. When such ACH payments are returned, they are returned through the ACH network and are no longer identified as check returns. In 2003, just less than 23 million checks were re-presented through the ACH.
[footnote] 36. National Automated Clearing House Association. [end of footnote.]
More than half of these ACH check re-presentments (about 12 million) were returned.
[footnote] 37. It is not known how many of these returned check re-presentments were themselves re-presented. [end of footnote.]
Thus, the returned checks processed through the check collection system (187 million) and ACH systems totaled close to 200 million, or 5.5 returns for every 1,000 checks presented. The num-

ber of checks re-presented (and possibly returned) through the ACH system was negligible in 2000.
Returned ACH Payments
About 1.05 percent of retail ACH payments were returned in 2003 (estimated from the electronic pay-ments survey), or 10.5 returns for every 1,000 pay-ments, about twice the rate that checks were returned. Only about 0.06 percent of ACH CCD transactions were returned, a considerably smaller return rate than for checks or for retail ACH payments. Most ACH returns were debit transactions.
[footnote] 38. Precise allocations of returns by debits and credits were not available. [end of footnote.]
When comparing return rates for check and ACH payments, it is important to recognize that differences in technological and industry practice are partly responsible for any differences in observed return rates. The total number of ACH returns is under-stated because the number of on-us ACH returns is unknown. But ACH returns include certain returns that have no counterpart in the check collection system.
By industry rule, paying depository institutions and their customers have sixty days to return unau-thorized retail ACH debits received (debits to an account on the instruction of the payee) but must return checks by midnight of the next business day following presentment.
[footnote] 39. If the account does not contain sufficient funds for payment, ACH debits must be returned the day after the transaction was received. [end of footnote.]
The extra time for ACH returns may allow for the detection and return of erroneous or fraudulent ACH payments—payments that if made by check would have to be pursued through other means and therefore would not be identified as returned checks. Business associations commonly voice more concern about check fraud than ACH fraud because businesses often use accounts that block ACH debits from being received, avoiding any type of fraud or error. Depository institutions typically do not offer accounts that block all ACH debit receipts to individuals but instead require that a specific payment be identified and block ACH payments only on a case-by-case basis.
In contrast to the decline in the rate of returned checks, the rate of returned retail ACH payments
increased from 0.79 percent in 2000 to 1.05 in 2003. The increase appears to have been due primarily to higher return rates for new categories of payments. A number of new rules and technological innovations in the ACH system have begun to provide explicitly for and separately identify one-time, nonrecurring ACH debit transactions originated remotely either over the Internet or by telephone or by converting a check to an ACH payment. Such payments may be more likely than recurring payments (which are typically either payroll or mortgage or other bill payments) to be disputed, or to involve erroneous or fraudulent pay-ments, and therefore to be returned.
[footnote] 40. Certain types of recurring check payments, such as payroll or mortgage payments, are also less likely to be returned unpaid. Selected data on checks sent to billers that were converted to ACH payments showed a return rate slightly lower than the estimated return rate for checks in 2003. [end of footnote.]
The rate of returned ACH CCDs, which as noted earlier are either internal transfers or business payments, declined slightly from 2000 to 2003.
USE OF CASH
About 5.9 billion ATM withdrawals were made in 2003. About two-thirds of these withdrawals were on-us (that is, made from proprietary ATMs belong-ing to the account holder's depository institution). Therefore, about one-third were from ATMs owned by another depository institution or other company (nonproprietary) and likely involved a withdrawal fee, charged either by the account holder's depository institution or the owner of the ATM, or both
[footnote] 41. There are exceptions to the practice of charging fees for non-proprietary ATM withdrawals. Some Internet banks, for example, reimburse a portion of withdrawal fees charged by nonproprietary ATM owners, and some ATM owners may waive fees for withdrawals from accounts at certain classes of institution. A Federal Reserve study showed that fees for on-us ATM withdrawals are negligible. See Board of Governors of the Federal Reserve System (2003), Annual Report to the Congress on Retail Fees and Services of Depository Institutions (June), www.federalreserve.gov/boarddocs/ rptcongress/2003fees.pdf. [end of footnote.]
The overall average ATM withdrawal was $85, and the average on-us withdrawal was about $89.
ATM cash withdrawals provide funding for an unknown number of cash transactions. If the average value of payments by cash were known, the number of cash payments that would be funded by the ATM withdrawals could be estimated. For example, if the average cash payment in 2003 was $85, equal to the

average value of ATM withdrawals, the total number of cash payments supported by ATM withdrawals in 2003 would have been 5.9 billion. If the aver-age value of payments from these ATM withdrawals was equal to the average value of PIN-based debit card payments ($38), then the number of cash pay-ments would have been just over two cash payments for each ATM withdrawal, or more than 12 billion. But cash transactions are commonly used for low-value payments. If the average value of cash trans-actions supported by ATM withdrawals was around $5—about seventeen payments for each ATM withdrawal—then the resulting cash transactions would have totaled more than 100 billion in 2003, compared with an estimated 81 billion noncash trans-actions in that year.
As the calculations show, a reasonable guess for the average value of a cash transaction could imply a large number of transactions funded by ATM with-drawals. Without supporting data, however, guesses about the average value and implied number of cash transactions are highly speculative and should be viewed as such.
ATM withdrawals do not fund all cash transac-tions. But, as shown earlier, only a small amount of cash is obtained via PIN-based debit payments com-pared with the amount obtained from ATMs. Fewer than 600 million PIN-based debit card payments involved cash returned to the card holder. The cash returned to card holders averaged $30. Besides ATM withdrawals and cash back from debit card pur-chases, the most common means of obtaining cash appears to be cashing payroll checks or personal checks at depository institutions or merchants. According to one study, the means of obtaining cash used most often by individuals in 1984 was cashing a personal or payroll check (77 percent), followed by ATM withdrawals (11 percent).
[footnote] 42. See Robert B. Avery and others (1986), ' 'The Use of Cash and Transaction Accounts by American Families,'' Federal Reserve Bulle-tin, vol. 72 (February), p. 97, table 9.
The authors of this article estimate, on the basis of a survey on individual checks, that in 2000 fewer than 2 percent of checks written had ' 'Cash' ' as the payee. Writing "Cash" on the payee line is common when obtaining cash via check at a depository institution teller but may not be done when obtaining cash via check at other venues. Thus, checks made out to ' 'Cash' ' represent only a portion of all checks written for cash in 2000. [end of footnote.]
Industry data show increases throughout the 1990s and early 2000s in the number of ATMs and ATM transactions (which are made for other purposes besides withdrawals), suggesting that the use of ATMs to obtain cash has likely also increased.
[footnote] 43. ATM and Debit News, EFT Data Book, 2005 Edition, Thom-son Media, www.cardforum.com. [end of footnote.]
The
use of ATM withdrawals as a means of obtaining cash relative to other means has likely increased since the early 2000s, although how much it has increased is unknown.
Increases in the number and use of ATMs shown by industry data may be an indication that ATMs are replacing checks as a means of obtaining cash. The cashing of personal checks at the teller window of an individual's depository institution results in an on-us check. Recall that the share of on-us checks declined from 2000 to 2003, especially at credit unions (from 6 percent to 2 percent), as the use of ATMs was growing. Therefore, the increases in the number of ATMs and ATM transactions do not necessarily indi-cate that the use of cash is increasing.
SUMMARY OF FINDINGS
Confirming the results of earlier studies, recent sur-vey data show that the number of checks paid in the United States has been declining, although the num-ber of electronic payments has been increasing. Led by growth in debit card payments, the number of electronic payments exceeded the number of check payments in 2003. However, the value of check pay-ments continued to exceed the combined value of the electronic payment instruments studied—debit and credit cards, ACH, and electronic benefits transfers. Some payments that were made by check in the past are now being made with these electronic instru-ments. Although the surveys discussed in this article provided no direct evidence on cash use, some cash payments likely have been replaced as well.
The 2004 depository institution survey allowed for more detailed study of payments and withdrawals from transaction accounts. For each type of account debit studied—checks, debit card payments, ACH payments, and ATM withdrawals—most were made from accounts at the largest 1 percent of depository institutions (as ranked by value of transaction depos-its). Commercial banks showed decreasing shares of checks paid and increasing shares of electronic pay-ments with increasing size. Other differences existed between depository institutions of different types. For example, credit unions, which are generally used by individuals and not by businesses, had the smallest shares of checks and greater shares of debit card and ATM use than commercial banks and savings institutions.
On-us account debits, for which the payer and payee use the same depository institution, were gen-erally more common at the largest depository institu-tions. Credit unions had very small shares of on-us

account debits compared with the other types of institutions, likely reflecting the relatively small num-ber of person-to-person payments made by check and ACH. The on-us share of ATM withdrawals was high for all types and sizes of depository institutions, reflecting the existence of fees for withdrawals from nonproprietary ATMs.
The use of different types of payment instruments varies across regions of the country, suggesting dif-ferences in the cost, availability, willingness to use, or willingness to accept various payment instruments. The 2004 depository institution survey showed that the use of debit cards was significantly more com-mon, per capita, in the West than in other regions. In this region and others, some debit card payments were likely being made in lieu of payments by check, but debit cards may also have been used instead of cash or credit cards. The Northeast showed signifi-cantly less use of debit cards than other regions and, compared with estimates from the 2001 depository institution survey, a significantly slower decline in the use of checks. Individuals in the Northeast obtained more cash from ATMs, and the average value of their debit card payments was higher.
While check and ACH returns are not entirely comparable, it is interesting to note that the propor-tion of ACH payments that were returned was almost twice the proportion of checks that were returned. The proportion of returned checks declined from 2000 to 2003, but the proportion of returned ACH payments increased. The increase in the propor-tion of returned ACH payments was related not to an increase for traditional types of ACH payments, but rather for new types of ACH transactions, such as the conversion of checks to ACH payments and one-time payments over the Internet and telephone.
Data on the use of the payments system such as those presented in this article are important to policy-makers, the public, and the payments industry for a variety of reasons. The information may aid in under-standing the purposes for which different payment types are used, helping financial institutions, pay-ments networks, service providers, and other pay-ments organizations better understand and serve the public. Depository institutions can use the informa-tion to compare the relative use of payments with the relative use of payments at groups of similar deposi-tory institutions. Historical trends in the use of pay-ments and information on patterns of substitution and replacement among payment types may aid in fore-casting trends. Forecasts based on the information may help in planning payments system infrastructure and in the timing and appropriateness of new invest-ments in determining infrastructure. Finally, the data
may help policymakers and the public better under-stand and monitor the significant changes occurring in the U.S. payments system.
APPENDIX: SOURCES OF DATA AND METHODS OF ESTIMATION
Both the 2003 and 2000 data used to estimate the number and value of noncash payments came from two separate surveys. The estimates for 2003 came from two surveys conducted in 2004—one of deposi-tory institutions (the 2004 depository institution sur-vey) and the other of electronic payments networks, card issuers, and card processors (the 2004 electronic payment survey).
[footnote] 44. Global Concepts, Inc., and International Communications Research (ICR) assisted the Federal Reserve System with the 2004 depository institution survey. See Federal Reserve System (2004), The Depository Institutions Payments Study: A Survey of Depository Institutions for 2004 Federal Reserve Payments Study, Global Con-cepts and Federal Reserve System, www.frbservices.org/Retail/pdf/ 2004DIPaymentStudy.pdf. Dove Consulting assisted with the 2004 electronic payment survey. See Federal Reserve Bank of Atlanta (2004), 2004 Electronic Payments Study for Retail Payments Office at the Federal Reserve Bank of Atlanta: Study Methods and Results Summary Report, Federal Reserve Bank of Atlanta Study (Decem-ber 14), www.frbservices.org/Retail/pdf/2004EPStudy.pdf. [end of footnote.]
The estimates for 2000 came from 2001 surveys, one of depository institutions (the 2001 depository institution survey) and the other of electronic payments networks, card issuers, and card processors (the 2001 electronic payment survey).
[footnote] 45. Global Concepts, Inc., and Westat assisted the Federal Reserve System with the 2001 depository institution survey, and Dove Consult-ing assisted with the 2001 electronic payment survey. [end of footnote.]
The 2001 and 2004 depository institution surveys were similar in most respects. However, the 2001 survey collected information only about checks, whereas the 2004 survey also collected information about other debits to transaction accounts. The 2001 and 2004 electronic payment surveys were also similar. Except as noted, the descriptions of the 2004 surveys presented below also apply to the 2001 surveys.
[footnote] 46. See Gerdes and Walton, ''The Use of Checks,'' for a discussion of the 2001 surveys. Also see Federal Reserve System, Retail Pay-ment Research Project. [end of footnote.]
2004 Depository Institution Survey
Survey Design
The 2004 depository institution survey collected information from three types of institutions: commer-cial banks (including agencies and branches of for-eign banks); savings institutions (savings banks and
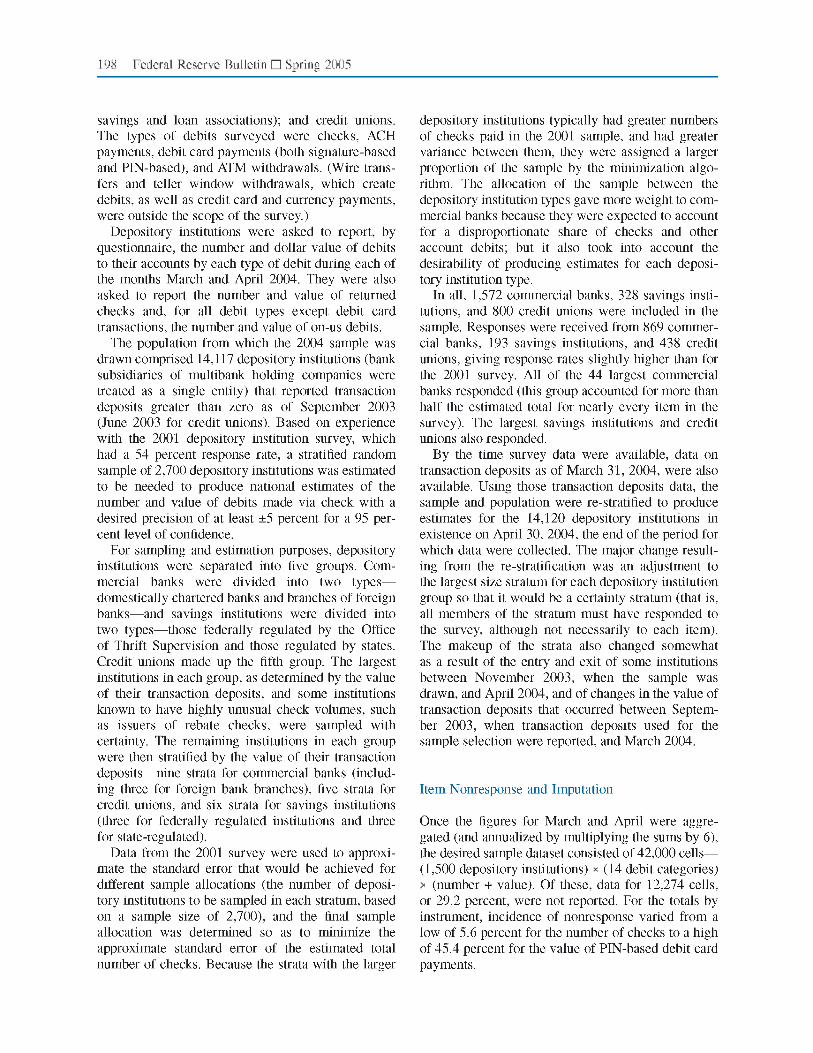
savings and loan associations); and credit unions. The types of debits surveyed were checks, ACH payments, debit card payments (both signature-based and PIN-based), and ATM withdrawals. (Wire trans-fers and teller window withdrawals, which create debits, as well as credit card and currency payments, were outside the scope of the survey.)
Depository institutions were asked to report, by questionnaire, the number and dollar value of debits to their accounts by each type of debit during each of the months March and April 2004. They were also asked to report the number and value of returned checks and, for all debit types except debit card transactions, the number and value of on-us debits.
The population from which the 2004 sample was drawn comprised 14,117 depository institutions (bank subsidiaries of multibank holding companies were treated as a single entity) that reported transaction deposits greater than zero as of September 2003 (June 2003 for credit unions). Based on experience with the 2001 depository institution survey, which had a 54 percent response rate, a stratified random sample of 2,700 depository institutions was estimated to be needed to produce national estimates of the number and value of debits made via check with a desired precision of at least ±5 percent for a 95 per-cent level of confidence.
For sampling and estimation purposes, depository institutions were separated into five groups. Com-mercial banks were divided into two types— domestically chartered banks and branches of foreign banks—and savings institutions were divided into two types—those federally regulated by the Office of Thrift Supervision and those regulated by states. Credit unions made up the fifth group. The largest institutions in each group, as determined by the value of their transaction deposits, and some institutions known to have highly unusual check volumes, such as issuers of rebate checks, were sampled with certainty. The remaining institutions in each group were then stratified by the value of their transaction deposits—nine strata for commercial banks (includ-ing three for foreign bank branches), five strata for credit unions, and six strata for savings institutions (three for federally regulated institutions and three for state-regulated).
Data from the 2001 survey were used to approxi-mate the standard error that would be achieved for different sample allocations (the number of deposi-tory institutions to be sampled in each stratum, based on a sample size of 2,700), and the final sample allocation was determined so as to minimize the approximate standard error of the estimated total number of checks. Because the strata with the larger
depository institutions typically had greater numbers of checks paid in the 2001 sample, and had greater variance between them, they were assigned a larger proportion of the sample by the minimization algo-rithm. The allocation of the sample between the depository institution types gave more weight to com-mercial banks because they were expected to account for a disproportionate share of checks and other account debits; but it also took into account the desirability of producing estimates for each deposi-tory institution type.
In all, 1,572 commercial banks, 328 savings insti-tutions, and 800 credit unions were included in the sample. Responses were received from 869 commer-cial banks, 193 savings institutions, and 438 credit unions, giving response rates slightly higher than for the 2001 survey. All of the 44 largest commercial banks responded (this group accounted for more than half the estimated total for nearly every item in the survey). The largest savings institutions and credit unions also responded.
By the time survey data were available, data on transaction deposits as of March 31, 2004, were also available. Using those transaction deposits data, the sample and population were re-stratified to produce estimates for the 14,120 depository institutions in existence on April 30, 2004, the end of the period for which data were collected. The major change result-ing from the re-stratification was an adjustment to the largest size stratum for each depository institution group so that it would be a certainty stratum (that is, all members of the stratum must have responded to the survey, although not necessarily to each item). The makeup of the strata also changed somewhat as a result of the entry and exit of some institutions between November 2003, when the sample was drawn, and April 2004, and of changes in the value of transaction deposits that occurred between Septem-ber 2003, when transaction deposits used for the sample selection were reported, and March 2004.
Item Nonresponse and Imputation
Once the figures for March and April were aggre-gated (and annualized by multiplying the sums by 6), the desired sample dataset consisted of 42,000 cells— (1,500 depository institutions) times (14 debit categories) times (number + value). Of these, data for 12,274 cells, or 29.2 percent, were not reported. For the totals by instrument, incidence of nonresponse varied from a low of 5.6 percent for the number of checks to a high of 45.4 percent for the value of PIN-based debit card payments.

The nonresponse rates suggest that for checks, and to a lesser extent for debit cards and ATM trans-actions, numbers are easier to report than values, whereas for ACH transactions, values are slightly easier to report than numbers.
But, as noted in the text, some depository insti-tutions could not accurately report ACH payments. Discussions with respondents indicated that at least some of them had difficulty distinguishing between true ACH payments and some very large-value internal funds transfers, called offset entries (which are not considered payments) that were processed in-house (on-us) on a shared platform. These offset entries were large in value but small in number, resulting in elevated average values for both on-us and total ACH transactions for some institutions.
Not all depository institutions have an automated capability to report the number and value of pay-ments by instrument as requested by the survey. Some respondents could not report the requested items at all. Of those that could, many needed to request the information from a payments processing service provider or a correspondent depository insti-tution or had to set up systems to collect the informa-tion specifically to respond to the survey.
To create a rectangular dataset suitable for a variety of analyses, each of the missing items was imputed using a multiple imputation procedure.
[footnote] 47. For an overview of multiple imputation techniques, see Donald B. Rubin (1987), Multiple Imputation for Nonresponse in Surveys, John Wiley and Sons (New York). [end of footnote.]
For each missing item, the imputation procedure used information from the other depository institutions in the same stratum that reported the missing item and from any related items that were reported by the institution with the missing item. The imputation procedure fit a linear regression model of the loga-rithm of the missing item (the dependent variable) to the logarithms of related items (the independent vari-ables) and a constant term.
[footnote] 48. Using the logarithms of the data is a common approach in the regression analysis of models that posit a constant linear relationship between the percent change of the dependent variable and the percent changes of the independent variables and in which all variables are limited to nonzero values. [end of footnote.]
(At least one indepen-dent variable—transaction deposits—was always available.) The fitted regression yielded a predicted value and an associated standard deviation for the missing item. To arrive at an imputed value, a ran-dom deviate, drawn from a normal distribution with a mean of zero and the standard deviation from the fitted regression, was added to the predicted value. Occasionally the regressions yielded inconsistent imputations for items known to be subsets of totals (for example, for some institutions the imputations
of on-us checks exceeded their total checks). In this relatively small number of cases, a different impu-tation was used—the one for which the ratio of the imputed subset to the total was equal to the mean of the same ratio for other depository institutions in the stratum.
This imputation procedure was repeated five times, each time using a newly drawn deviate in the calcula-tion, to obtain five datasets containing both actual responses and imputations. All the summary statis-tics based on this 2004 depository institution survey are averages of estimates calculated from the five datasets. The variation among the five estimates pro-vides information about the uncertainty in the overall estimate arising from the imputations.
Estimation
The actual and imputed data for respondents were converted to estimates for the population using a separate ratio estimator, with the value of transaction deposits being the covariate for each item. That is, for a given item and within a depository institution type-size stratum, the sum of the respondents' data was multiplied by the ratio of the transaction deposits in the population to the transaction deposits at the responding institutions. The associated sampling standard error was based on a classical statistical formula that accounts for the uncertainty arising from the use of a sample rather than a census, and on the variation among imputed figures that accounts for the uncertainty arising from the fact that some items needed to be imputed.
In terms of sampling error, the estimates turned out to be more precise than expected at the time the sample size was set. The 95 percent confidence intervals for the national estimate of checks were ±1.8 percent of the number of checks paid and ±2.2 percent of the value. This better-than-expected performance appears to be a result of a larger-than-expected number of respondents (20 percent more than for the 2001 survey), greater-than-expected response rates for the largest institutions, and less within-sample variation than for the 2001 depository institution survey. The confidence intervals for the national estimates of other debit activity were nar-rower than ±5 percent with four exceptions: number and value of on-us ACH credit and debit transactions that were cleared through the ACH network rather than in-house.
[footnote] 49. ACH credit and debit transactions were estimated separately but were aggregated in the tables in this article. [end of footnote.]
These survey items were much less

correlated with the level of transaction deposits than were the other items.
Estimates by Geographic Region and Urban or Rural Location of Deposits
Although the survey was not explicitly designed to facilitate geographic analysis of account debit pat-terns, the responses were sufficient, when combined with external data on each depository institution's total deposits distributed by region, to make broad comparisons possible. For each of the four regions— Northeast, South, Midwest, and West—separate esti-mates were calculated for single-region depository institutions (those having deposits in only one region) and multiregion depository institutions (the 322 insti-tutions having deposits in more than one region).
The survey did not directly collect regional data from multiregion depository institutions. The geo-graphic distribution of depository institutions' total deposits (including both transaction and savings deposits) were available, so each type of account debit for each multiregion depository institution in the population was assumed to be distributed across regions in proportion to the location of its deposits, and were allocated to regions accordingly.
[footnote] 50. For credit unions, the geographic distribution of an institution's branches served as a proxy for the geographic distribution of its total deposits. [end of footnote.]
(No such assumption was necessary to allocate data for single-region depository institutions.)
To produce the regional estimates, depository insti-tutions' regionally allocated data were restratified by region, type, and size and by multiregion or single-region status. For each region, separate estimates were produced for single-region depository institu-tions and the allocated portion of multiregion deposi-tory institutions' data. New, separate ratio estimators were produced using these strata following the proce-dure described in the preceding section. It turned out that national estimates obtained from aggregating these regional estimates were about the same as those obtained from the original analysis and were adjusted to make the aggregates match without affecting the proportions allocated.
The assumption that the payments and transaction deposits of depository institutions are regionally dis-tributed in proportion to the distribution of their deposits is consistent with the hypothesis that cus-tomers of multiregion depository institutions who are located in different regions exhibit payments behav-ior more similar to each other than do customers
of different depository institutions who are located in different regions. The assumption used to construct these regional aggregates—namely, that each regional fraction of a depository institution' s customers exhibit similar payments behavior—may be overly restrictive and could affect the accuracy of regional estimates. That is because the assumed allocation of transaction deposits or account debits would be too large (too small) for a region if the true allocations for the institution were lower (higher) in that region.
The uncertainties that arise from allocation of data to regions described above cause difficulties for the statistical analysis of the estimated differences among regions. If large differences actually exist between the proportions of payments a depository institution processes for a pair of regions, the assumption mutes the estimated differences between that pair of regions. It makes the two regions appear more similar than they really are. The same assumption may also create the appearance of a difference with a third region that may not exist in reality. This potential problem can be illustrated by the following hypotheti-cal example: Suppose that check activity is higher in the Northeast than in the South and that there is no difference (in fact) between the South and the Mid-west. Then our procedure for allocating the data of a depository institution with a presence in the North-east and South may mask the difference between the Northeast and South while creating an apparent dif-ference between the South and the Midwest.
Sampling standard errors were not calculated for the regional estimates because of uncertainty about the effects of the allocation of data for multiregion depository institutions. However, the results of cross-sectional regressions, one of which is mentioned in the body of this article, together with the similarity between the patterns of multiregion and single-region estimates as well as the regional patterns for checks identified in both the 2004 and 2001 surveys, demon-strate that regional differences do exist.
Estimates of urban and rural account debit activity were constructed using a method similar to that used to construct estimates by region. Urban areas were defined as metropolitan statistical areas, and rural areas as all other areas. Thus, some urbanized areas, such as certain outlying suburbs that surround metro-politan statistical areas, were included in the rural regions.
The 2004 Electronic Payment Survey
The 2004 electronic payments survey sent question-naires to all electronic payments networks, card issu-

ers, and card processors to estimate the number and value of electronic payments originated in the United States in 2003 with commonly used pay-ment instruments—general-purpose and private-label credit cards, signature-based and PIN-based debit cards, ACH payments, and electronic benefits transfers.
The collection of these data was straightforward because the processing of electronic payments is largely centralized and the respondents can generally supply accurate data on the number and value of these payments from business records. Payments for issuers that did not respond to the survey were esti-mated from available information, but they repre-sented a small share of the estimated totals.
For estimates of total ACH payments, data from the 2004 depository institution survey were used to estimate the fractions of ACH transactions, by num-ber, that were on-us and cleared in-house (separately for debit and credit transactions). The estimated frac-tions were combined with electronic payment survey data to estimate on-us ACH payments for 2003, and these data were added to the network ACH payments in 2003 to yield estimates for all ACH. The same fractions were used to estimate on-us ACH payments for 2000; the resulting estimates of the total number and value of ACH payments for that year are a revision from estimates provided in earlier reports.