trends in the hydrology - food and agriculture ... · i . trends in the hydrology of small...
TRANSCRIPT
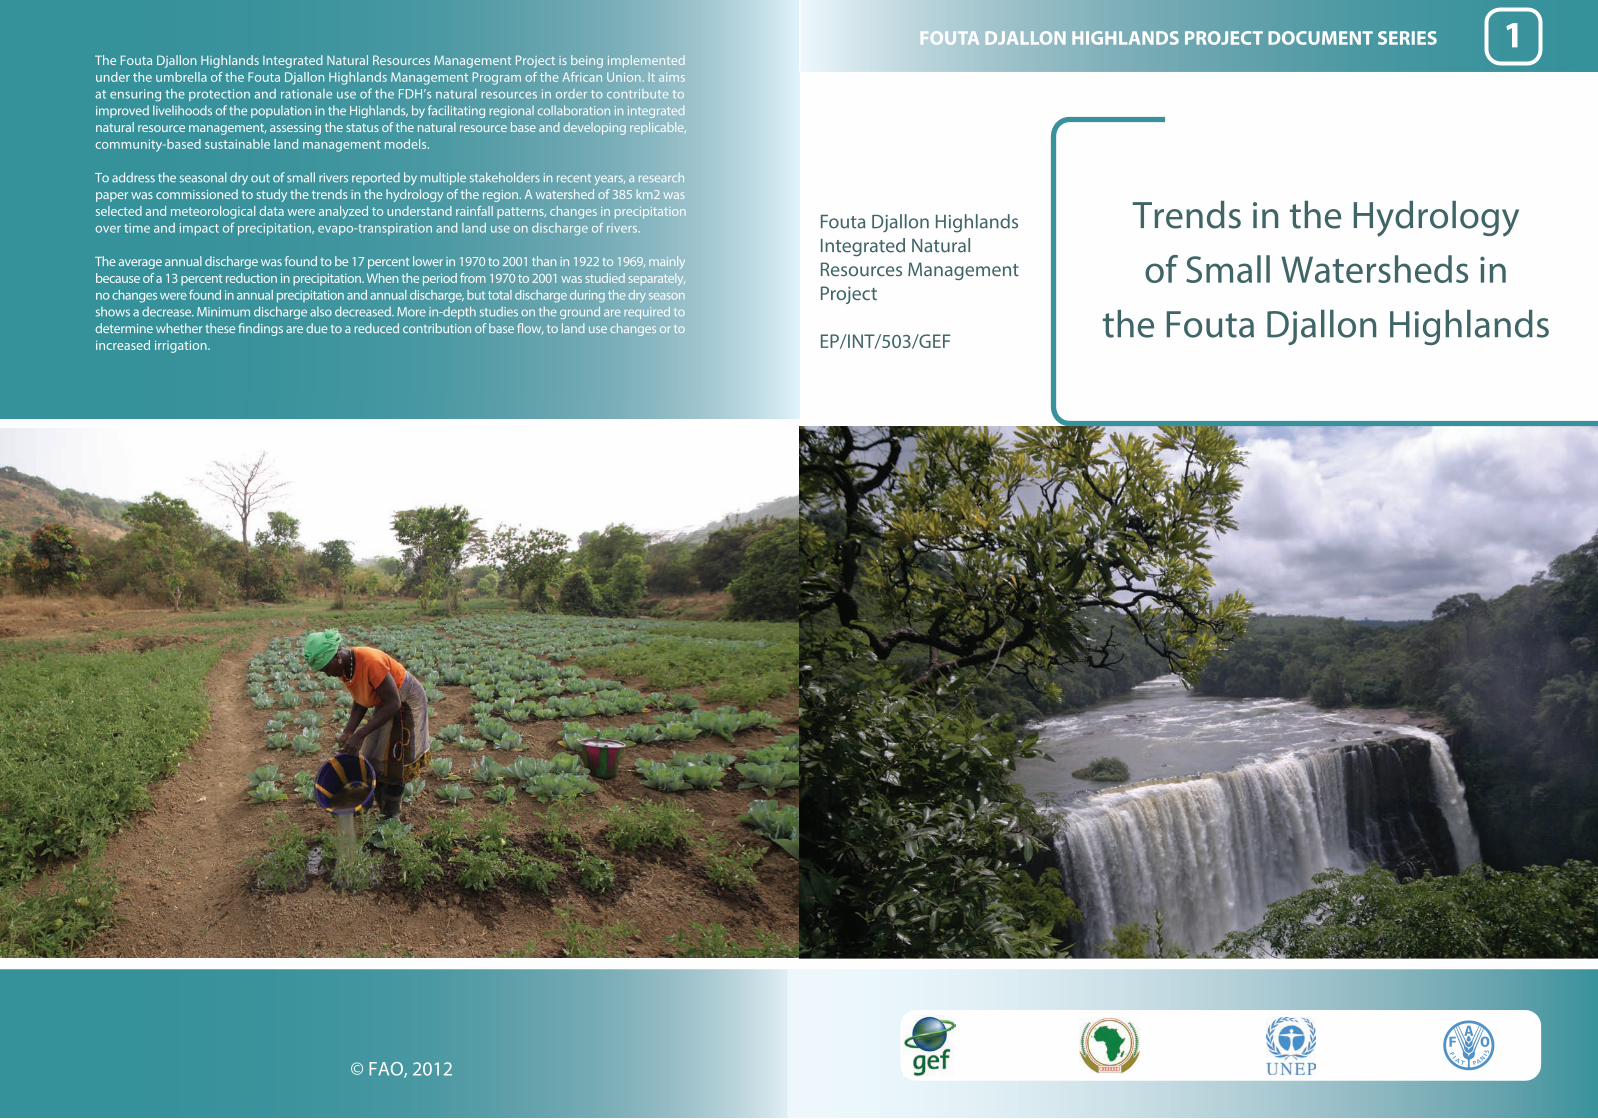
The Fouta Djallon Highlands Integrated Natural Resources Management Project is being implemented under the umbrella of the Fouta Djallon Highlands Management Program of the African Union. It aims at ensuring the protection and rationale use of the FDH’s natural resources in order to contribute to improved livelihoods of the population in the Highlands, by facilitating regional collaboration in integrated natural resource management, assessing the status of the natural resource base and developing replicable, community-based sustainable land management models.
To address the seasonal dry out of small rivers reported by multiple stakeholders in recent years, a research paper was commissioned to study the trends in the hydrology of the region. A watershed of 385 km2 was selected and meteorological data were analyzed to understand rainfall patterns, changes in precipitation over time and impact of precipitation, evapo-transpiration and land use on discharge of rivers.
The average annual discharge was found to be 17 percent lower in 1970 to 2001 than in 1922 to 1969, mainly because of a 13 percent reduction in precipitation. When the period from 1970 to 2001 was studied separately, no changes were found in annual precipitation and annual discharge, but total discharge during the dry season shows a decrease. Minimum discharge also decreased. More in-depth studies on the ground are required to determine whether these �ndings are due to a reduced contribution of base �ow, to land use changes or to increased irrigation.
Trends in the Hydrology of Small Watersheds in
the Fouta Djallon Highlands
Arid Zone Forests and Forestry Working Paper 1FOUTA DJALLON HIGHLANDS PROJECT DOCUMENT SERIES
Fouta Djallon Highlands Integrated Natural Resources ManagementProject EP/INT/503/GEF
© FAO, 2012
1

i
Trends in the hydrology of small watersheds in the Fouta Djallon Highlands
By Veerle Verschoren
FOOD AND AGRICULTURE ORGANIZATION OF THE UNITED NATIONS
ROME, 2012

ii
The designations employed and the presentation of material in this information product do not imply the expression of any opinion whatsoever on the part of the Food and Agriculture Organization of the United Nations (FAO) concerning the legal or development status of any country, territory, city or area or of its authorities, or concerning the delimitation of its frontiers or boundaries. The mention of specific companies or products of manufacturers, whether or not these have been patented, does not imply that these have been endorsed or recommended by FAO in preference to others of a similar nature that are not mentioned. The views expressed in this information product are those of the author(s) and do not necessarily reflect the views of FAO. All rights reserved. FAO encourages reproduction and dissemination of material in this information product. Non-commercial uses will be authorized free of charge, upon request. Reproduction for resale or other commercial purposes, including educational purposes, may incur fees. Applications for permission to reproduce or disseminate FAO copyright materials, and all queries concerning rights and licences, should be addressed by e-mail to [email protected] or to the Chief, Publishing Policy and Support Branch, Office of Knowledge Exchange, Research and Extension, FAO, Viale delle Terme di Caracalla, 00153 Rome, Italy. The Fouta Djallon Highlands Project Document Series reports on issues and activities that are of special interest to the project and the participating countries. These publications do not reflect any official position of FAO. Their purpose is to provide information on project activities and to stimulate discussion and collaboration. For further information and comments, please contact: Thomas Hofer Team Leader Watershed Management and Mountains Forest Assessment, Management and Conservation Division Forestry Department FAO Viale delle Terme di Caracalla 00153 Rome, Italy E-mail: [email protected] © FAO 2012

iii
Acknowledgements The author acknowledges the governmental Meteorological Service of Guinea for providing discharge and meteorological data; the National Environmental Satellite Data and Information Service (NESDIS) for allowing use of public precipitation databases; and the project for allowing use of all the data it has collected and analyzed. The author thanks the project and FAO for giving her the possibility of conducting this study. It involved successful collaboration among the project members in the field and at Headquarters, the Forestry Department and the Natural Resources Department. The author is grateful to all the people who contributed to the research by providing useful inputs and data, especially her supervisors Jean-Marc Faures and Thomas Hofer.
iv
Contents
Acknowledgements...............................................................................................................iii
Acronyms .............................................................................................................................. v
Summary................................................................................................................................ v
Chapter 1: Introduction.......................................................................................................... 1
Chapter 2: Research framework ............................................................................................ 2 Study area: the Fouta Djallon Highlands 2 Methodologies for time-series analysis of flows in small watersheds 4 Overview of the available data 5 Data quality 5 Selection of watersheds 5
Chapter 3: Land use ............................................................................................................... 8
Chapter 4: Precipitation ....................................................................................................... 11 Annual precipitation 11 Monthly precipitation 16 Intermediate conclusions 17
Chapter 5: Evapotranspiration ............................................................................................. 18
Chapter 6: Discharge ........................................................................................................... 20 Model description 20 Annual discharge 23 Recent period 26 Intermediate conclusions 32
Chapter 7: Conclusions........................................................................................................ 33 Land use 33 Precipitation 33 Evapotranspiration 34 Discharge 34
Chapter 8: Recommendations.............................................................................................. 35
Acknowledgements .............................................................................................................. iii
References ........................................................................................................................... 36

v
Acronyms ESA European Space Agency ET evapotranspiration ETo reference evapotranspiration FDH Fouta Djallon Highlands FDH-INRM Fouta Djallon Highland Integrated Natural Resources Management Project FRA Global Forest Resources Assessment GDRC Global Runoff Data Centre GIS Geographic Information System NESDIS National Environmental Satellite Data and Information Service Peff effective precipitation R2 correlation coefficient RPI regional precipitation index SWAT Soil Water Assessment Tool WHC water holding capacity

vi
Summary
This research is part of the Fouta Djallon Highland Integrated Natural Resources Management Project, which started in 2009. The hydrology of the Fouta Djallon Highlands was studied through an investigation of trends in one small watershed of 385 km2. The highlands are a mountain chain in West Africa that contributes to the water supply of much of the region and contains the sources of the Niger and Senegal rivers. The area is characterized by a strong precipitation gradient, ranging from 2 400 to 650 mm per year. Most precipitation falls during the rainy season from June to October. The temperature is always high, averaging 25 ºC in the south and 28 ºC in the north.
Only limited data on this region are available, so the hydrology is investigated at a small scale. A watershed near Pont de Linsan was selected, and the results from this watershed can be applied to other watersheds of similar size and characteristics throughout the highlands. Three factors – land use, evaportranspiration and precipitation – are studied in detail to identify how they have changed over the long term and what impacts they have on discharge.
Land-use data are scarce, and no land-use changes are quantified. The prevailing agriculture is based on shifting cultivation, and a detailed study is needed to quantify and locate changes in the watershed and to study agriculture’s impact on the hydrology. Evapotranspiration – the sum of transpiration and evaporation – probably has a minor influence on the hydrology of this watershed.
The discharge of the rivers is composed of surface runoff and base flow. From November to April, discharge is mainly due to base flow, while during the rainy season both surface runoff and base flow are involved. The average annual discharge of the Konkoure River at Pont de Linsan is 17 percent lower in 1970 to 2001 than in 1922 to 1969, mainly because of a 13 percent reduction in precipitation for the same periods. When the period 1970 to 2001 is studied separately, no changes are found in annual precipitation and annual discharge, but the total discharge during the dry season (January to May) shows a decrease. Minimum discharge also decreases, and in some years the river dries up completely in the dry season, which never occurred before 1970. These last two findings could be due to a reduced contribution of base flow, to land-use changes or to increased irrigation.
To improve understanding of the watershed hydrology, these results should be linked to land-use changes and groundwater data. The project supports the regional observatory in measuring, collecting, storing and distributing hydrological and meteorological data; selecting representative watersheds; analyzing land use and land cover; monitoring the groundwater table and springs; and continuing with hydrological and meteorological measurements.

Chapter 1: Introduction
This research is part of the Fouta Djallon Highland Integrated Natural Resources Management Project (FDH-INRM), which started in 2009 with the aim of studying the hydrology of the highlands in detail. From field visits undertaken in recent years, it seems that small rivers in the highlands are increasingly subject to drying up seasonally. While several rivers had high discharge rates in the 1980s, flows have since diminished drastically, and some rivers have even disappeared. Another trend is for faster draining in the mountains during the rainy season, causing severe floods in the lowlands.
Hydrological trends are investigated on a small scale because both human-induced and natural changes can have an increasing or decreasing effect on discharge, making the total effect difficult to interpret. The limited available data on the area do not allow the study of larger basins.
First, based on the available data and in consultation with project members, one watershed is selected for detailed investigation. Stream flow is a function of soil/subsoil characteristics, precipitation and evapotranspiration, each of which is investigated separately using weather and land-use data in the second part of the research (Wei and Zang, 2010). Forest disturbances, including fires, urbanization and increased agricultural activities such as slash and burn have a direct influence on land use (Wei and Zang, 2010).
Next the discharge data are analyzed; the discharge dataset is incomplete, so a simple monthly rainfall-runoff model is developed to estimate missing values for monthly discharge. There are two periods of interest concerning discharge data: an important change occurring around 1970; and the period from 1970 to 2001. The land-use, precipitation and evapotranspiration results are discussed and linked to the discharge. This is followed by some recommendations for a better understanding of the area’s hydrology and of how the project can support it. Areas for further study are also suggested. Annexes provide an overview of the data used for conducting this research.
2
Chapter 2: Research framework This chapter provides information on the location and climate of the study area and a brief overview of methodologies for analyzing hydrological data. Weather, land-use and discharge data are described, and one watershed is selected for detailed study.
Study area: the Fouta Djallon Highlands
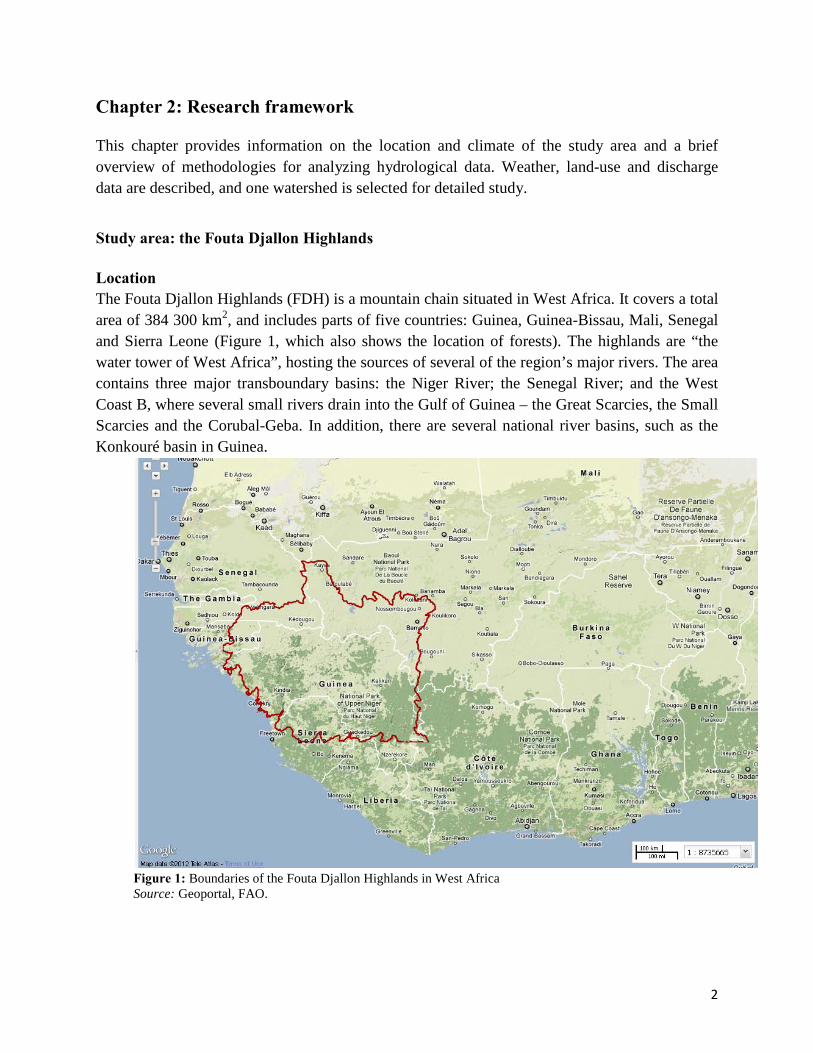
Location The Fouta Djallon Highlands (FDH) is a mountain chain situated in West Africa. It covers a total area of 384 300 km2, and includes parts of five countries: Guinea, Guinea-Bissau, Mali, Senegal and Sierra Leone (Figure 1, which also shows the location of forests). The highlands are “the water tower of West Africa”, hosting the sources of several of the region’s major rivers. The area contains three major transboundary basins: the Niger River; the Senegal River; and the West Coast B, where several small rivers drain into the Gulf of Guinea – the Great Scarcies, the Small Scarcies and the Corubal-Geba. In addition, there are several national river basins, such as the Konkouré basin in Guinea.
Figure 1: Boundaries of the Fouta Djallon Highlands in West Africa Source: Geoportal, FAO.
3
Climate
Climate data based on 30-year averages are available from FAOClim-Net, and can be used to identify long-term mean climates and any recent shifts. Both annual and seasonal cycles are investigated.
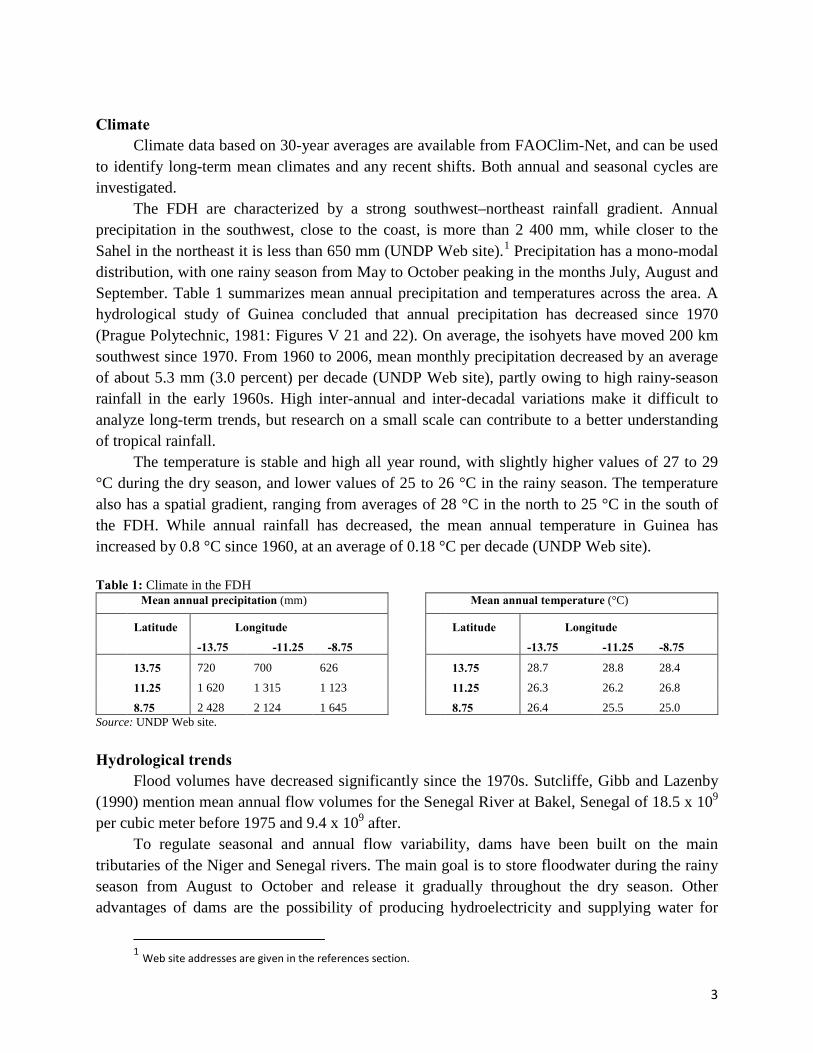
The FDH are characterized by a strong southwest–northeast rainfall gradient. Annual precipitation in the southwest, close to the coast, is more than 2 400 mm, while closer to the Sahel in the northeast it is less than 650 mm (UNDP Web site).1 Precipitation has a mono-modal distribution, with one rainy season from May to October peaking in the months July, August and September. Table 1 summarizes mean annual precipitation and temperatures across the area. A hydrological study of Guinea concluded that annual precipitation has decreased since 1970 (Prague Polytechnic, 1981: Figures V 21 and 22). On average, the isohyets have moved 200 km southwest since 1970. From 1960 to 2006, mean monthly precipitation decreased by an average of about 5.3 mm (3.0 percent) per decade (UNDP Web site), partly owing to high rainy-season rainfall in the early 1960s. High inter-annual and inter-decadal variations make it difficult to analyze long-term trends, but research on a small scale can contribute to a better understanding of tropical rainfall.
The temperature is stable and high all year round, with slightly higher values of 27 to 29 °C during the dry season, and lower values of 25 to 26 °C in the rainy season. The temperature also has a spatial gradient, ranging from averages of 28 °C in the north to 25 °C in the south of the FDH. While annual rainfall has decreased, the mean annual temperature in Guinea has increased by 0.8 °C since 1960, at an average of 0.18 °C per decade (UNDP Web site).
Table 1: Climate in the FDH
Mean annual precipitation (mm)
Latitude Longitude -13.75 -11.25 -8.75
13.75 720 700 626
11.25 1 620 1 315 1 123
8.75 2 428 2 124 1 645
Mean annual temperature (°C)
Latitude Longitude -13.75 -11.25 -8.75
13.75 28.7 28.8 28.4
11.25 26.3 26.2 26.8
8.75 26.4 25.5 25.0
Source: UNDP Web site. Hydrological trends
Flood volumes have decreased significantly since the 1970s. Sutcliffe, Gibb and Lazenby (1990) mention mean annual flow volumes for the Senegal River at Bakel, Senegal of 18.5 x 10⁹ per cubic meter before 1975 and 9.4 x 10⁹ after.
To regulate seasonal and annual flow variability, dams have been built on the main tributaries of the Niger and Senegal rivers. The main goal is to store floodwater during the rainy season from August to October and release it gradually throughout the dry season. Other advantages of dams are the possibility of producing hydroelectricity and supplying water for
1 Web site addresses are given in the references section.
4
irrigation and navigation (Sutcliffe et al, 1990). However detailed studies should be undertaken to examine the influence of dams on local ecosystems.
Methodologies for time-series analysis of flows in small watersheds
In general, long-term hydrological trends such as stream flow variations are caused by climate change, land-use change or both. During research it is important to be aware of these factors and to try and distinguish their respective net effects (Wei and Zang, 2010).
There are two approaches to analyzing long-term trends in hydrology. The first makes use of physically based models and experimental paired forest watershed models. This approach requires a reference watershed that has similar hydrology and climate to the investigated watershed, but is not subject to disturbances such as land-use change. The second approach is based on advanced statistical and graphical models (Wei and Zang, 2010). The current study applies the second approach, as there are no reference watersheds and only limited information on local land uses.
Several tools, models and programmes are available for studying weather and discharge data and visualizing them on a map.
OCTAVE is a high-level computer programming language, similar to MATLAB, which can be used to analyze (statistically) and visualize discharge and weather data.
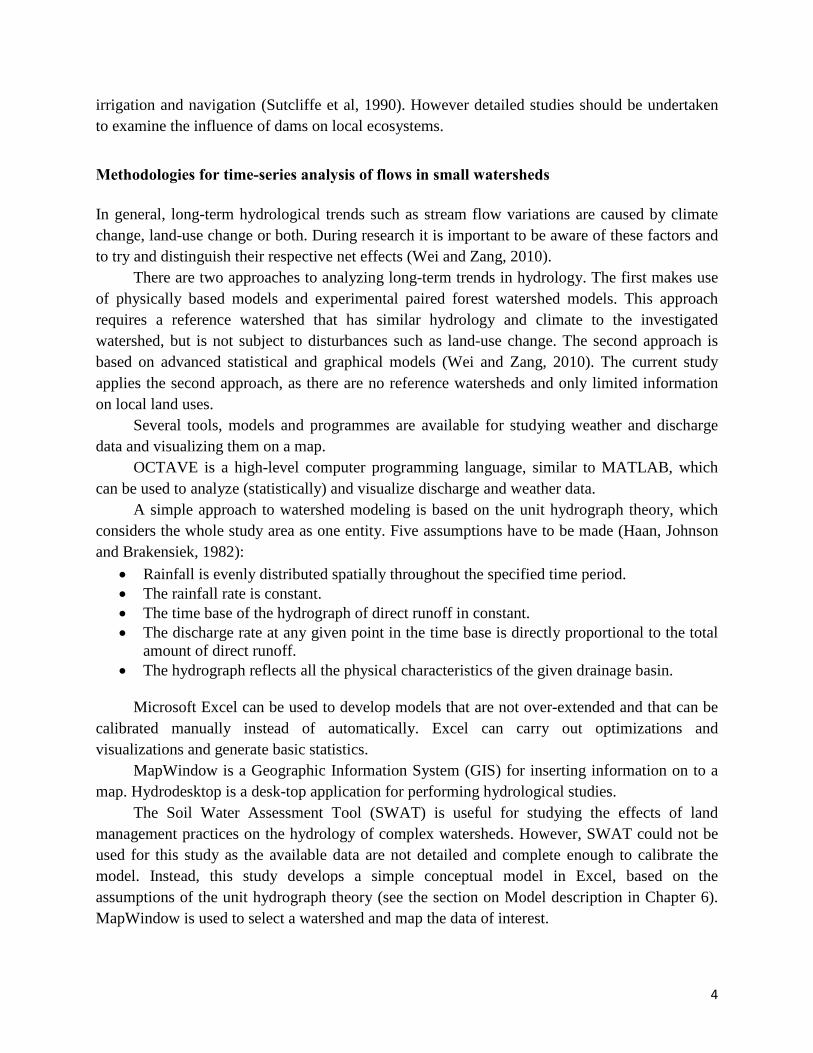
A simple approach to watershed modeling is based on the unit hydrograph theory, which considers the whole study area as one entity. Five assumptions have to be made (Haan, Johnson and Brakensiek, 1982):
• Rainfall is evenly distributed spatially throughout the specified time period. • The rainfall rate is constant. • The time base of the hydrograph of direct runoff in constant. • The discharge rate at any given point in the time base is directly proportional to the total
amount of direct runoff. • The hydrograph reflects all the physical characteristics of the given drainage basin.
Microsoft Excel can be used to develop models that are not over-extended and that can be
calibrated manually instead of automatically. Excel can carry out optimizations and visualizations and generate basic statistics.
MapWindow is a Geographic Information System (GIS) for inserting information on to a map. Hydrodesktop is a desk-top application for performing hydrological studies.
The Soil Water Assessment Tool (SWAT) is useful for studying the effects of land management practices on the hydrology of complex watersheds. However, SWAT could not be used for this study as the available data are not detailed and complete enough to calibrate the model. Instead, this study develops a simple conceptual model in Excel, based on the assumptions of the unit hydrograph theory (see the section on Model description in Chapter 6). MapWindow is used to select a watershed and map the data of interest.
5
Overview of the available data
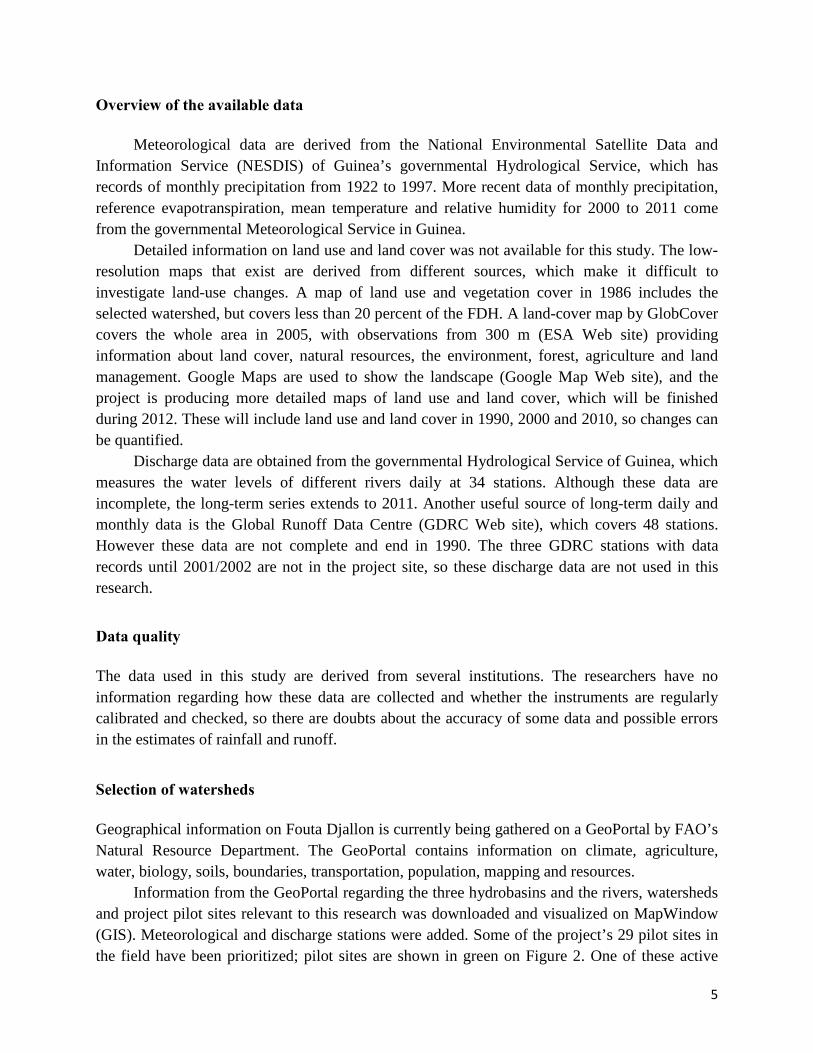
Meteorological data are derived from the National Environmental Satellite Data and Information Service (NESDIS) of Guinea’s governmental Hydrological Service, which has records of monthly precipitation from 1922 to 1997. More recent data of monthly precipitation, reference evapotranspiration, mean temperature and relative humidity for 2000 to 2011 come from the governmental Meteorological Service in Guinea.
Detailed information on land use and land cover was not available for this study. The low-resolution maps that exist are derived from different sources, which make it difficult to investigate land-use changes. A map of land use and vegetation cover in 1986 includes the selected watershed, but covers less than 20 percent of the FDH. A land-cover map by GlobCover covers the whole area in 2005, with observations from 300 m (ESA Web site) providing information about land cover, natural resources, the environment, forest, agriculture and land management. Google Maps are used to show the landscape (Google Map Web site), and the project is producing more detailed maps of land use and land cover, which will be finished during 2012. These will include land use and land cover in 1990, 2000 and 2010, so changes can be quantified.
Discharge data are obtained from the governmental Hydrological Service of Guinea, which measures the water levels of different rivers daily at 34 stations. Although these data are incomplete, the long-term series extends to 2011. Another useful source of long-term daily and monthly data is the Global Runoff Data Centre (GDRC Web site), which covers 48 stations. However these data are not complete and end in 1990. The three GDRC stations with data records until 2001/2002 are not in the project site, so these discharge data are not used in this research.
Data quality
The data used in this study are derived from several institutions. The researchers have no information regarding how these data are collected and whether the instruments are regularly calibrated and checked, so there are doubts about the accuracy of some data and possible errors in the estimates of rainfall and runoff.
Selection of watersheds
Geographical information on Fouta Djallon is currently being gathered on a GeoPortal by FAO’s Natural Resource Department. The GeoPortal contains information on climate, agriculture, water, biology, soils, boundaries, transportation, population, mapping and resources.
Information from the GeoPortal regarding the three hydrobasins and the rivers, watersheds and project pilot sites relevant to this research was downloaded and visualized on MapWindow (GIS). Meteorological and discharge stations were added. Some of the project’s 29 pilot sites in the field have been prioritized; pilot sites are shown in green on Figure 2. One of these active

6
sites is at Guetoya, which is in the region of Pita, close to Labé. Although it would be interesting to investigate the hydrology of the Guetoya watershed, no discharge data are available for this area, so another watershed of similar size was chosen, where discharge is measured (Table 2 and Figure 3). This watershed is at Pont de Linsan; the discharge of the river is measured at Linsan bridge, indicated by an arrow in Figure 2 and Figure Figure 3. The seasonal and long-term hydrology trends linked to land use, precipitation and evapotranspiration at Pont de Linsan watershed are investigated, and the findings can be applied to other watersheds of similar size and characteristics, including the one at Guetoya.
Figure 2: Project watersheds in the FDH
(fdh h1k flow.shp = rivers)
Table 2: Details of the selected watersheds Name Size (km2) River Hydrobasin Daily discharge data Pont de Linsan 385.30 Konkouré Konkoure (West Coast) 1955–2007 Guetoya 384.43 Kokoulu Konkoure (West Coast) –
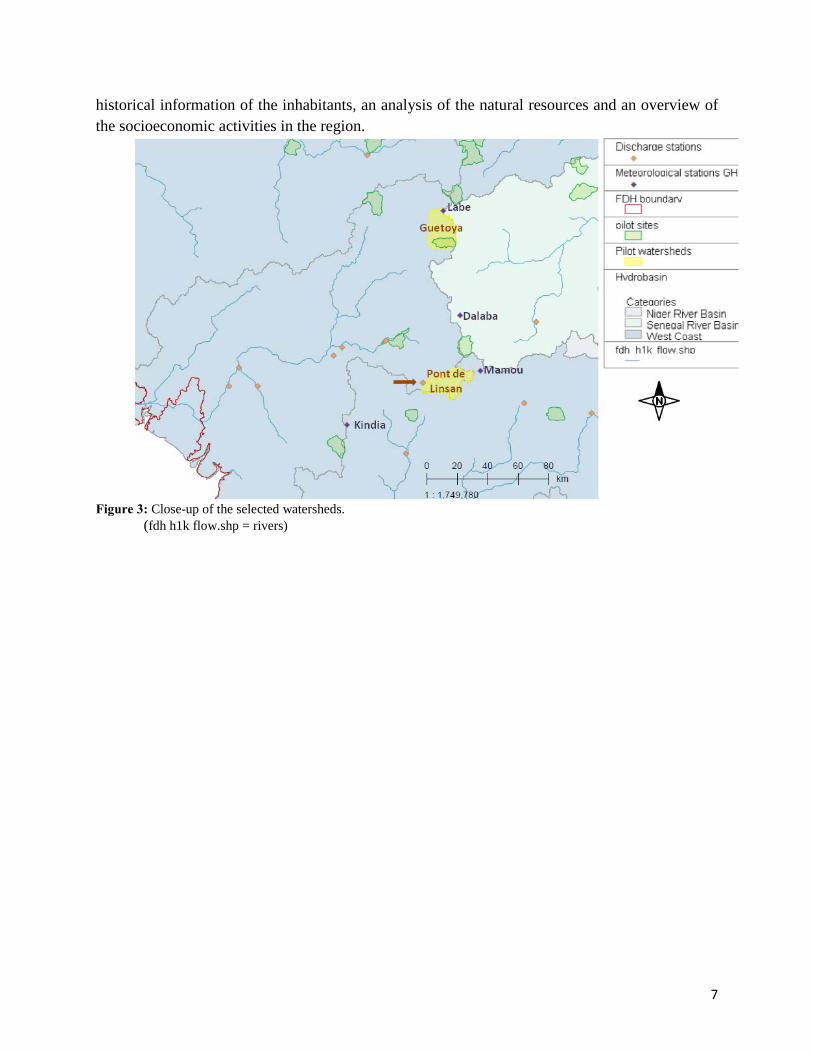
Figure 3 is a detailed map of the area of these two watersheds, which are part of a larger
watershed and are located in the West Coast Basin, draining into the Gulf of Guinea. Hydrological stations where discharge is measured are indicated in orange on the map. Shown in purple are the four meteorological stations in the area of the selected watersheds: Labé, Dalaba, Kindia and Mamou.
Detailed information of the pilot site in Guetoya can be found in the pilot site report of the project. This report contains information of the general characteristics of the catchment,
7
historical information of the inhabitants, an analysis of the natural resources and an overview of the socioeconomic activities in the region.
Figure 3: Close-up of the selected watersheds.
(fdh h1k flow.shp = rivers)
8
Chapter 3: Land use Land use is the first factor influencing discharge to be investigated. Only limited information on land use and land-use change was available when this study was conducted. The soil properties most affected by land-use change are infiltration rate and water holding capacity (WHC) (Grimay, Bal Ram and Oystein, 2010), which have an important impact on the hydrology of the watershed.
Land use in the area is fragmented, and several factors make it very complex. First, the main land use is shifting cultivation, resulting in a dynamic system that is explained in more detail in the following paragraph. Next there are high external pressures on the land, to increase land productivity and the use of local resources, such as through mining and charcoal. A third impact is landownership, which involves different stakeholders: landowners, farmers and pastoralists. There is therefore a great need to reorganize land use in the region, and this is one of the project’s objectives. An import feature of land use is the protection of small areas of natural vegetation around springs, although sometimes only a few trees are conserved while most other natural vegetation is removed. This small-scale protection is probably due to the sacred properties attributed to springs.
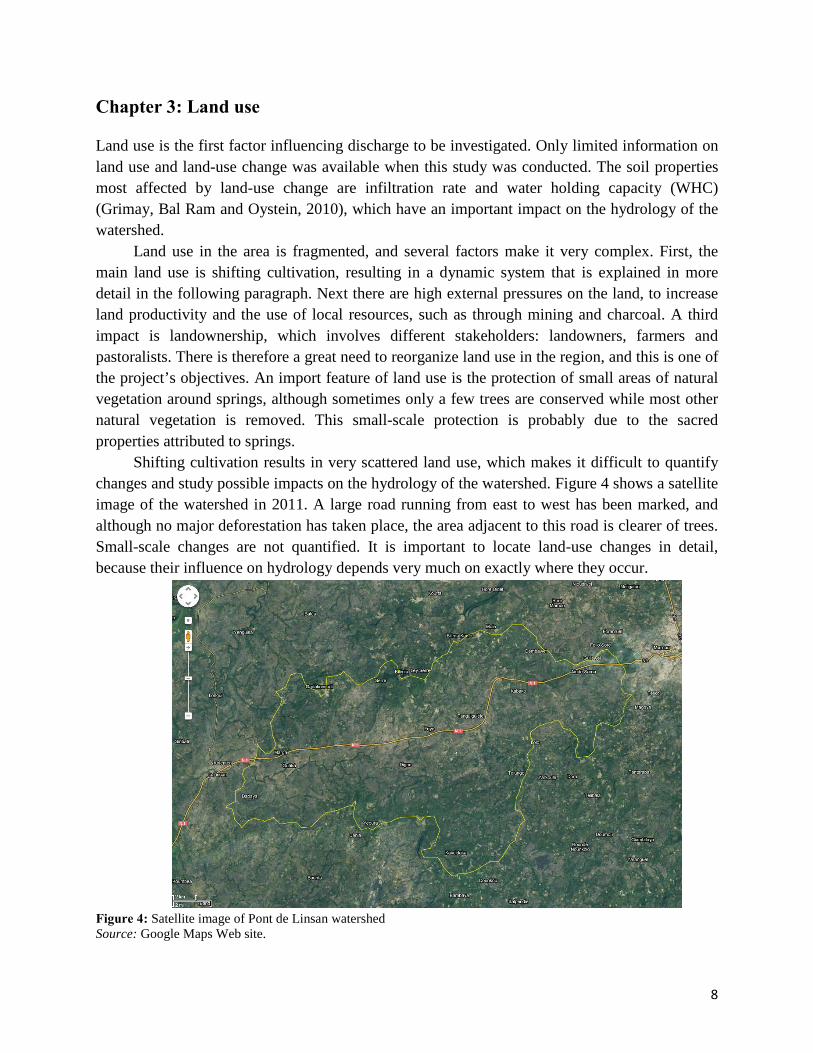
Shifting cultivation results in very scattered land use, which makes it difficult to quantify changes and study possible impacts on the hydrology of the watershed. Figure 4 shows a satellite image of the watershed in 2011. A large road running from east to west has been marked, and although no major deforestation has taken place, the area adjacent to this road is clearer of trees. Small-scale changes are not quantified. It is important to locate land-use changes in detail, because their influence on hydrology depends very much on exactly where they occur.
Figure 4: Satellite image of Pont de Linsan watershed Source: Google Maps Web site.

9
The different land uses in 2005 are shown in Table 3. The main land use in the area of Pont de Linsan watershed is shifting cultivation, in which part of the forest is burned (arrow 1, Figure 5), and the land is then cultivated under extensive agriculture with low productivity (arrow 2, Figure 5). After several seasons, the plot is abandoned and shrub land starts to grow back naturally (arrow 3, Figure 5), eventually evolving back into forest (arrow 4, Figure 5).
Table 3: Main land uses at Pont de Linsan watershed, 2005
Land use Closed (> 40%) broad-leaved deciduous forest Mosaic cropland vegetation Closed and open broad-leaved evergreen or semi-deciduous forest Closed and open shrub land
Source: ESA Web site.
Figure 5: Close-up of Pont de Linsan watershed 1 = burned forest. 2 = cultivation. 3 = shrub land. 4 = forest. Source: Google Maps Web site.
Regardless of the current shortage of information, it is clearly very important to protect the
area’s remaining forest, because when deforestation exceeds a certain point runoff can increase drastically and cause problems such as increased erosion, reduced surface infiltration and increased evapotranspiration (FAO and SDC, 2011). It would be interesting to investigate land use in the dry and rainy seasons separately, because it varies according to the season: most agricultural activities take place in the rainy season, while irrigation is greater during the dry season. A study of the rate at which natural vegetation regrows in the area would also be useful in quantifying the recovery period.

10
Other information on deforestation and land-use changes can be found in the Guinea country report of FAO’s Global Forest Resources Assessment (FRA) (FAO, 2012), and the correlation between population increase and land-use changes could be used to quantify the deforestation rate (Mahé, 2006). Population data for this area are limited (Annex 4).
11
Chapter 4: Precipitation The second factor influencing discharge is precipitation. Long-term annual changes and seasonal changes are investigated using monthly precipitation data from four meteorological stations in the area around the two selected watersheds. As Mamou meteorological station is the closest to Pont de Linsan’s discharge point, and has the longest time series for precipitation, its data are examined separately. Changes in the mean annual precipitation and the monthly distribution of precipitation are investigated and qualified in this chapter.
Annual precipitation
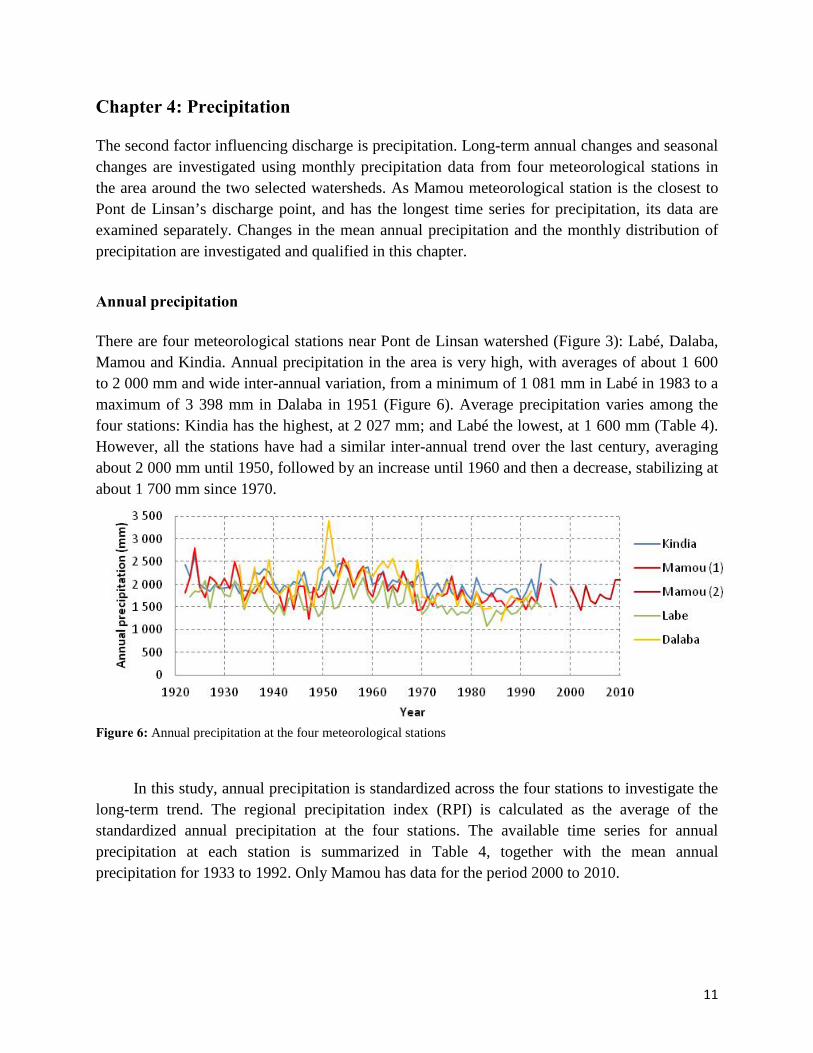
There are four meteorological stations near Pont de Linsan watershed (Figure 3): Labé, Dalaba, Mamou and Kindia. Annual precipitation in the area is very high, with averages of about 1 600 to 2 000 mm and wide inter-annual variation, from a minimum of 1 081 mm in Labé in 1983 to a maximum of 3 398 mm in Dalaba in 1951 (Figure 6). Average precipitation varies among the four stations: Kindia has the highest, at 2 027 mm; and Labé the lowest, at 1 600 mm (Table 4). However, all the stations have had a similar inter-annual trend over the last century, averaging about 2 000 mm until 1950, followed by an increase until 1960 and then a decrease, stabilizing at about 1 700 mm since 1970.
Figure 6: Annual precipitation at the four meteorological stations
In this study, annual precipitation is standardized across the four stations to investigate the
long-term trend. The regional precipitation index (RPI) is calculated as the average of the standardized annual precipitation at the four stations. The available time series for annual precipitation at each station is summarized in Table 4, together with the mean annual precipitation for 1933 to 1992. Only Mamou has data for the period 2000 to 2010.
12
Table 4: Time series available for the four stations, and time period used to calculate RPI Station Start End Start End Mean annual
precipitation 1933-1992 (mm)
Kindia 1922 1996 2 027
Mamou 1922 1997 2000 2010 1 837
Labé 1923 1996 1 600
Dalaba 1933 1992 1 967
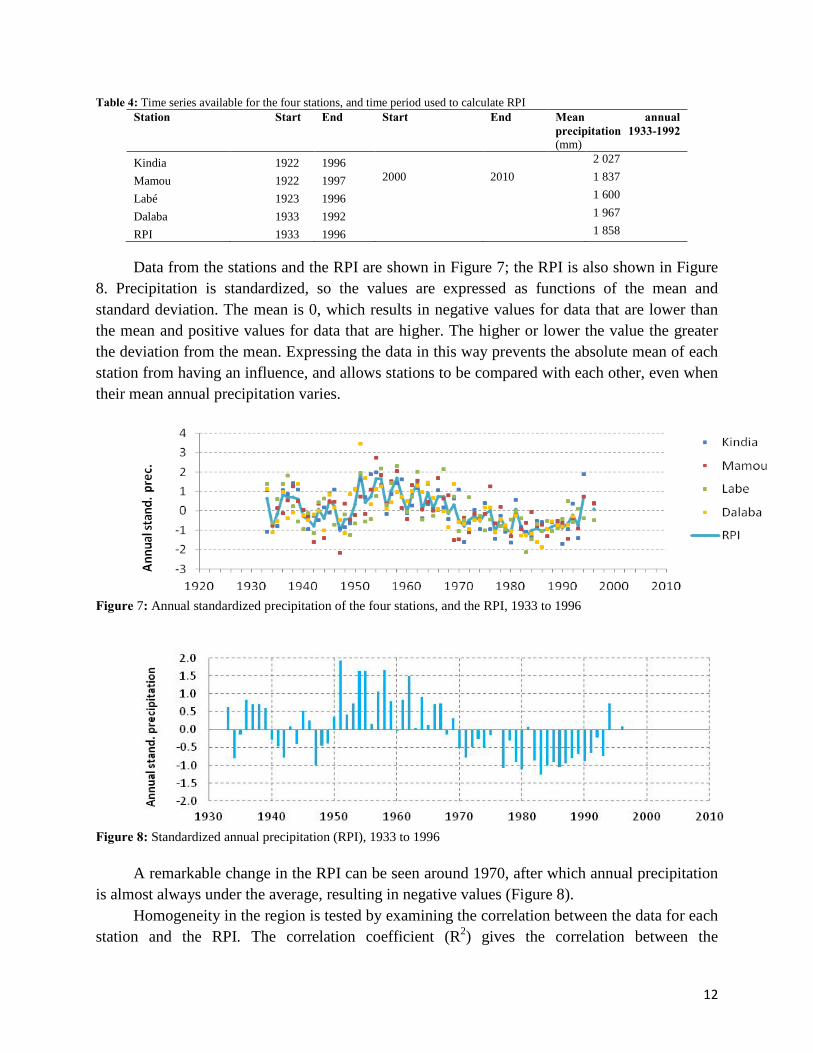
RPI 1933 1996 1 858 Data from the stations and the RPI are shown in Figure 7; the RPI is also shown in Figure
8. Precipitation is standardized, so the values are expressed as functions of the mean and standard deviation. The mean is 0, which results in negative values for data that are lower than the mean and positive values for data that are higher. The higher or lower the value the greater the deviation from the mean. Expressing the data in this way prevents the absolute mean of each station from having an influence, and allows stations to be compared with each other, even when their mean annual precipitation varies.
Figure 7: Annual standardized precipitation of the four stations, and the RPI, 1933 to 1996
Figure 8: Standardized annual precipitation (RPI), 1933 to 1996
A remarkable change in the RPI can be seen around 1970, after which annual precipitation is almost always under the average, resulting in negative values (Figure 8).
Homogeneity in the region is tested by examining the correlation between the data for each station and the RPI. The correlation coefficient (R2) gives the correlation between the

13
precipitation at each station and the mean precipitation. R2 is a value between 0 and 1, with 0 meaning no correlation, and a high R2 value meaning a high correlation. Labé’s R2 is the lowest, so its annual precipitation differs the most from the RPI. The three other stations have R2s of between 0.65 and 69 (Table 5).
Table 5: R2 between annual precipitation at the stations and RPI
Station R2 Station R2 Kindia 0.67 Dalaba 0.69 Mamou 0.65 Labé 0.59
RPI calculated as average of the four stations. This study focuses on Mamou as it is the only station with precipitation data beyond 1997
and is the closest to the Pont de Linsan discharge point. Annual precipitation with five- and 11-year moving averages is given in Figure 9 and Figure Figure 10.
Figure 9: Annual precipitation at Mamou, with five-year moving average (green), 1922 to 2010
Figure 10: Annual precipitation at Mamou, with 11-year moving average (green), 1922 to 2010
14
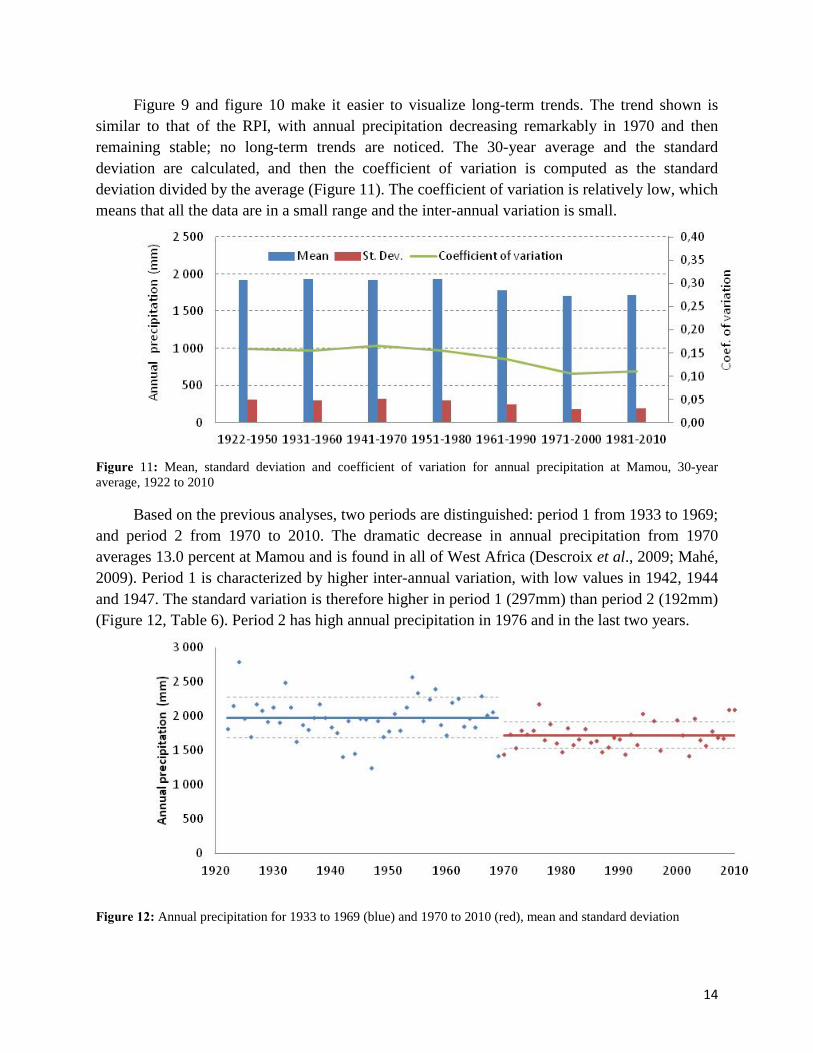
Figure 9 and figure 10 make it easier to visualize long-term trends. The trend shown is similar to that of the RPI, with annual precipitation decreasing remarkably in 1970 and then remaining stable; no long-term trends are noticed. The 30-year average and the standard deviation are calculated, and then the coefficient of variation is computed as the standard deviation divided by the average (Figure 11). The coefficient of variation is relatively low, which means that all the data are in a small range and the inter-annual variation is small.
Figure 11: Mean, standard deviation and coefficient of variation for annual precipitation at Mamou, 30-year average, 1922 to 2010
Based on the previous analyses, two periods are distinguished: period 1 from 1933 to 1969;
and period 2 from 1970 to 2010. The dramatic decrease in annual precipitation from 1970 averages 13.0 percent at Mamou and is found in all of West Africa (Descroix et al., 2009; Mahé, 2009). Period 1 is characterized by higher inter-annual variation, with low values in 1942, 1944 and 1947. The standard variation is therefore higher in period 1 (297mm) than period 2 (192mm) (Figure 12, Table 6). Period 2 has high annual precipitation in 1976 and in the last two years.
Figure 12: Annual precipitation for 1933 to 1969 (blue) and 1970 to 2010 (red), mean and standard deviation
15
Table 6: Means of periods 1 and 2, with standard deviation, absolute difference (period 1 – period 2) and relative difference (period 1 – period 2)/period 1
Next, changes in the distribution of mean annual precipitation are examined. The annual
precipitation in 1922 to 2010 is ranked, with the lowest 33 percent being labeled dry years, the next 33 percent normal years, and the highest 33 percent wet years (Table 7). When the precipitation is similar in the two periods, the number of dry, normal and wet years is equal and the same for both periods.
Table 7: Numbers of dry, normal, wet and total years in periods 1 and 2
Period Dry Normal Wet Total 1 (1922–1969) 8 17% 16 34% 24 50% 48
2 (1970–2010) 21 52% 12 32% 5 13% 38
Total 29 30 29 Annual precipitation is not recorded for 1995, 1997 and 1998.
The numbers of normal years in both periods are similar, while 21 of the 29 dry years
occurred in period 2, and 24 of the 29 wet years in period 1. Period 2 is characterized by a high number of dry years and a low number of wet years.
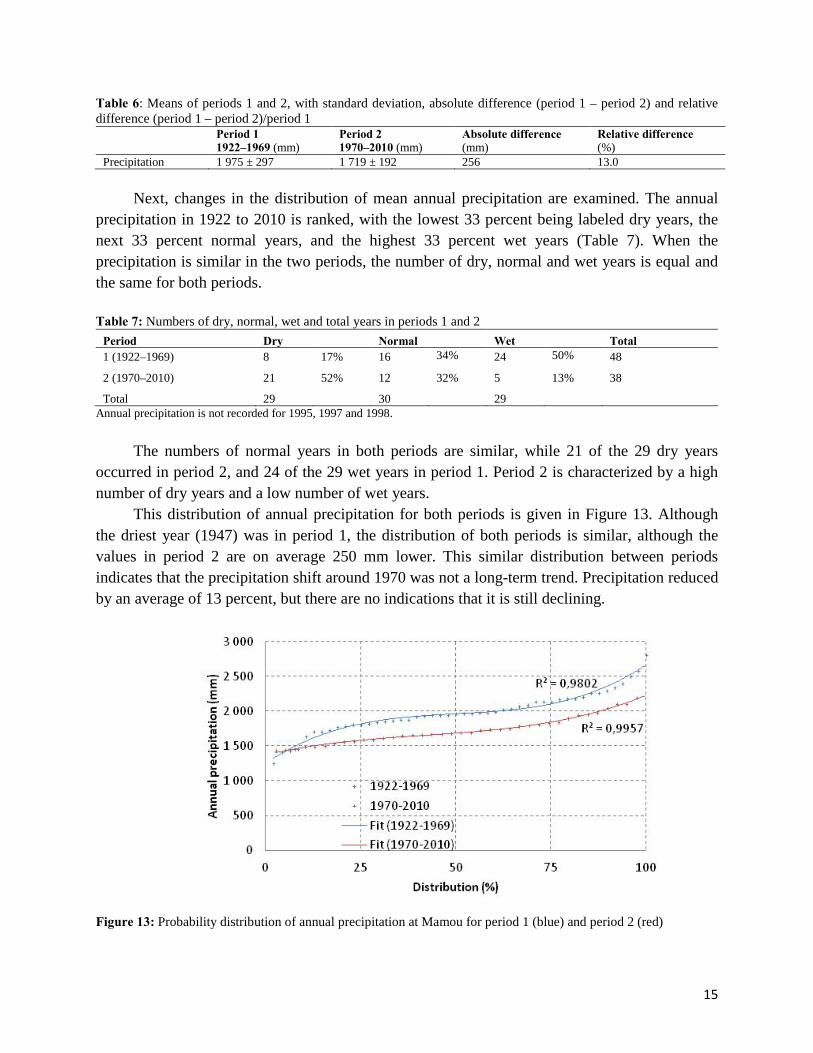
This distribution of annual precipitation for both periods is given in Figure 13. Although the driest year (1947) was in period 1, the distribution of both periods is similar, although the values in period 2 are on average 250 mm lower. This similar distribution between periods indicates that the precipitation shift around 1970 was not a long-term trend. Precipitation reduced by an average of 13 percent, but there are no indications that it is still declining.
Figure 13: Probability distribution of annual precipitation at Mamou for period 1 (blue) and period 2 (red)
Period 1 1922–1969 (mm)
Period 2 1970–2010 (mm)
Absolute difference (mm)
Relative difference (%)
Precipitation 1 975 ± 297 1 719 ± 192 256 13.0

16
Monthly precipitation
Average monthly precipitation is calculated for the four meteorological stations. The data show a typical mono-modal distribution of precipitation with a dry and a rainy season. Less than 5 percent of total precipitation falls from December to April, and the highest precipitation is from May to October, with peak values in July, August and September. The distribution over months is similar at the four stations (Figure 14).
Figure 14: Mean average monthly precipitation at the four stations, 1933 to 1996
The coefficient of variation is calculated for all months and all stations. High values in the
dry season are due to individual intense storms in some years, while average precipitation is very low. These few storms greatly increase the coefficient of variation. During the rainy season, the variation is low and ia similar in all stations, indicating that the distribution of precipitation during the rainy season is similar throughout the period and among the different stations.
Figure 15: Coefficient of variation of monthly precipitation at the four stations, 1933 to 1996
The average difference between periods 1 and 2 is 256 mm, but this reduction is not spread
equally over the year (Figure 16, left). The highest absolute reductions between periods 1 and 2 are in August, September and October, while in July monthly precipitation increases. These two changes make the rainy season shorter and earlier, while the total amount of precipitation is reduced. In relative values, the highest reduction occurs during the dry season (Figure 16, right).

17
Figure 16: Mean monthly precipitation for period 1 (blue) and period 2 (red) and the difference between them (green), Mamou
Intermediate conclusions
Mean annual precipitation in the period 1970 to 2010 was 13 percent lower than in 1922 to 1969. The distribution of annual precipitation is similar in both periods, with a reduction of 256 mm after 1970 resulting in significantly more dry years and fewer wet years.
Despite the absolute increase in July, the total precipitation for the rainy season (July to October) decreased by 154 mm. The highest absolute reduction is in September, from 389 to 317 mm, and peak precipitation decreased the most in August – from 436 to 389 mm. The reduction during the rainy season is important because precipitation during these months makes a large contribution to discharge. In general, the rainy season is earlier and shorter, as was also found by Boulain et al. (2009). The highest relative reduction is during the dry season.

18
Chapter 5: Evapotranspiration The third factor influencing the discharge is evapotranspiration (ET), which is the sum of evaporation (E, through the soil) and transpiration (T, through vegetation). It is determined by the temperature, wind speed, vegetation, land use, altitude and relative humidity. Data on ET are limited, and this parameter is measured monthly only for 2000 to 2010. This chapter starts with a short theoretical explanation of the impact of ET on the hydrology of the FDH.
In a study of the Niger and Lake Chad Basin Li et al. (2007) investigated the impact of land-use change on the hydrology of two watersheds. The impact of land-cover change on total ET is non-linear, and as long as total deforestation remains under a certain threshold, the net effect on ET is a reduction of less than 3 percent, because the decrease in transpiration is counterbalanced by an increase in evaporation. When deforestation exceeds the threshold, transpiration drops quickly to zero, while evaporation increases only partially, resulting in a decline in total ET. Li et al. (2007) found a threshold of 50 percent deforestation for tropical evergreen forest. This implies a remarkable increase in runoff when more than 50 percent of the forest is cleared, resulting in higher discharges. Similar effects occur for savannah and grassland, which have higher thresholds, of 70 and 80 percent respectively.
For the mono-modal distribution of precipitation shown in the data (Figure 17), the reference evapotranspiration (ETo) from November to April is higher than the precipitation, so most precipitation evapotranspirates. This results in low surface runoff, and the discharge is mainly base flow. Precipitation is much higher during the rainy season, when part of the precipitation evapotranspirates; the remainder is referred to as effective precipitation (Peff). The Peff is positive from May to October, when part of it becomes surface runoff, while the remainder infiltrates the soil and is released later as base flow.
During the dry season Peff is zero and the discharge in rivers is mainly due to base flow, while during the rainy season Peff is positive and the discharge is composed of both surface runoff and base flow.
Figure 17: Average precipitation and ETo, 1970 to 2001

19
As already mentioned, ET is influenced by several factors. There is little available information on changes in these factors over time, but the temperature in Guinea has increased by an average of 0.18 °C per decade (UNDP Web site). The ETo used in this study was measured in the field rather than being calculated from a formula, so the influences of the different factors are not known. To investigate the impact of a temperature change over time, ET is expressed as a function of only temperature for the decade 2000 to 2010. The temperature in 1970 is calculated as the temperature in 2000 minus 0.54 °C (0.18 °C times three); the ET in 1970 is calculated from the same formula but using the 1970 temperature.
No changes in precipitation occurred in the period 1970 to 2001, so the average for this period is used. Figure 18 shows the average precipitation (1970 to 2001) and the ETo for 1970 and 2000. Overall, the ETo increased by 14 percent between 1970 and 2000, mainly during the dry season, so the effect on Peff was only 4.8 percent.
Figure 18: Average precipitation for 1970 to 2001, and ETo for 1970 and 2000

20
Chapter 6: Discharge There are many missing values in the available discharge data, so a model is used to calculate missing monthly discharges. This chapter starts by explaining the model and then completes the dataset with calculated discharges. Next it analyses annual and seasonal discharges for the periods before and after 1970. It then studies the later period, examining discharge in the dry and rainy seasons separately.
Model description
A simple month-based model was developed to represent the relation between rainfall and discharge. The soil and the subsoil aquifer are represented as two layers; the upper layer is the topsoil, where ET, surface runoff (Qs), storage in the topsoil and deep infiltration to the aquifer take place. The second layer represents the aquifer, from which a constant percentage – or ratio (R) – of the water content flows. R multiplied by the soil water content of the aquifer (S2) gives the base flow (Qb). The total calculated discharge (Qc) in the river is the sum of Qs and Qb (Figure 19).
The input data for the model are monthly precipitation (P) and monthly reference evapotranspiration (ETo). Precipitation is taken from data for the Mamou meteorological station (1922 to 2010). The ETo was measured for only 2000 to 2010. A constant ETo over time is assumed and the average for 2000 to 2010 is used for the period 1922 to 1999.
Figure 19: Flows in the model
QC = QS + QB QS = P − ET − deep in�il.− storage QB = S2 ∗ R With:
QC total calculated discharge (mm) P precipitation (mm) QS surface runoff (mm) ET evapotranspiration (mm) QB base flow (mm) R ratio (-) S1 soil water content, topsoil (mm) Storage storage in S1 (-) S2 soil water content, aquifer (mm) Deep infil. deep infiltration from
topsoil to aquifer (mm)
21
The discharge of the River Konkoure is measured daily at Pont de Linsan. Dividing the
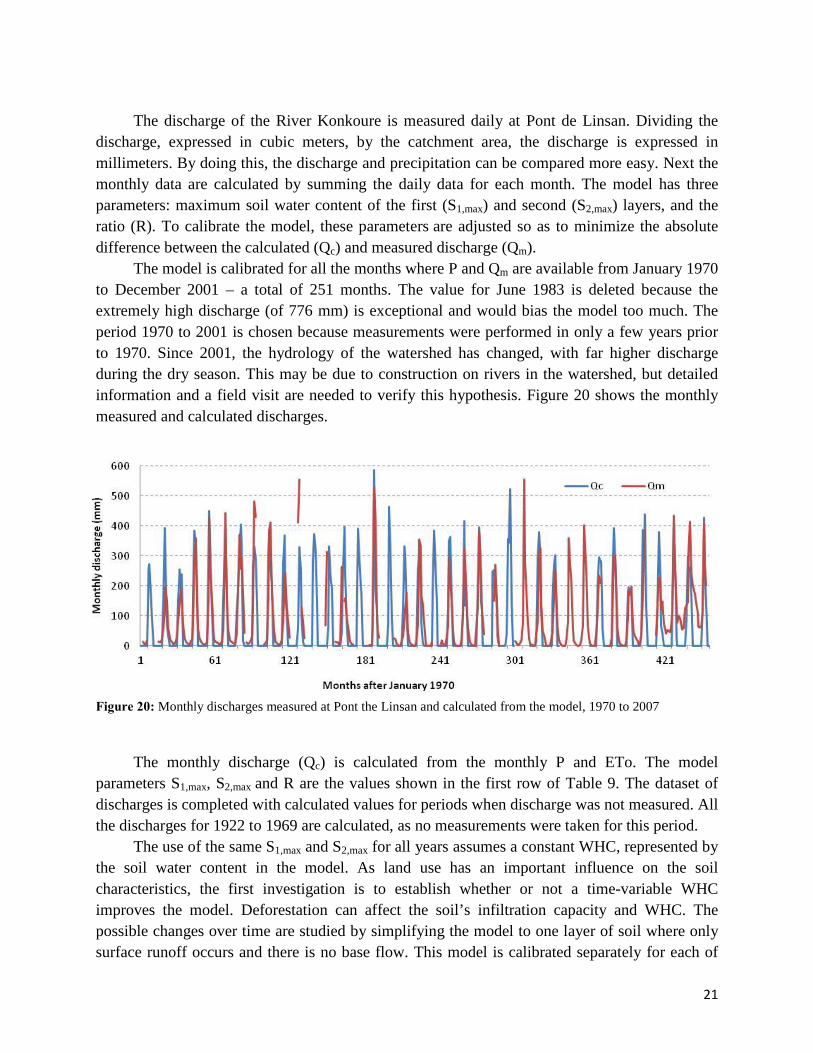
discharge, expressed in cubic meters, by the catchment area, the discharge is expressed in millimeters. By doing this, the discharge and precipitation can be compared more easy. Next the monthly data are calculated by summing the daily data for each month. The model has three parameters: maximum soil water content of the first (S1,max) and second (S2,max) layers, and the ratio (R). To calibrate the model, these parameters are adjusted so as to minimize the absolute difference between the calculated (Qc) and measured discharge (Qm).
The model is calibrated for all the months where P and Qm are available from January 1970 to December 2001 – a total of 251 months. The value for June 1983 is deleted because the extremely high discharge (of 776 mm) is exceptional and would bias the model too much. The period 1970 to 2001 is chosen because measurements were performed in only a few years prior to 1970. Since 2001, the hydrology of the watershed has changed, with far higher discharge during the dry season. This may be due to construction on rivers in the watershed, but detailed information and a field visit are needed to verify this hypothesis. Figure 20 shows the monthly measured and calculated discharges.
Figure 20: Monthly discharges measured at Pont the Linsan and calculated from the model, 1970 to 2007
The monthly discharge (Qc) is calculated from the monthly P and ETo. The model
parameters S1,max, S2,max and R are the values shown in the first row of Table 9. The dataset of discharges is completed with calculated values for periods when discharge was not measured. All the discharges for 1922 to 1969 are calculated, as no measurements were taken for this period.
The use of the same S1,max and S2,max for all years assumes a constant WHC, represented by the soil water content in the model. As land use has an important influence on the soil characteristics, the first investigation is to establish whether or not a time-variable WHC improves the model. Deforestation can affect the soil’s infiltration capacity and WHC. The possible changes over time are studied by simplifying the model to one layer of soil where only surface runoff occurs and there is no base flow. This model is calibrated separately for each of
22
the last three decades (time-variable Smax) and for the whole period (constant Smax) (Table 8). For the period 1970 to 2001, the model improves by only 1.3 percent if a time-variable WHC is used. So a constant WHC is used to calculate monthly discharge. This model explains 71 percent of the variability of monthly discharges.
The discharge calculated with the single-layer model is composed of surface runoff only. There is no significant change in WHC over the decades, so this model performs well in calculating monthly discharges.
Table 8: Differences between constant and time-variable Smax for the single-layer model
Period Smax
│Qc-Qm│ (mm)
R2
Constant Smax 1970–2001 417 9 777 0.71
Time-variable Smax 1970–1979 418 9 652 3 443
1980–1989 222 3 574
1990–2001 397 2 635
The single-layer model is extended with an additional layer representing the aquifer. The
calculated discharge is composed of: i) surface runoff, which is precipitation that does not evapotranspirate and that remains in the topsoil or infiltrates into the aquifer; and ii) base flow, which is the constant drain from the aquifer. The two-layer model is used to calculate monthly discharges, including for months without precipitation, when water stored in the aquifer drains out as base flow.
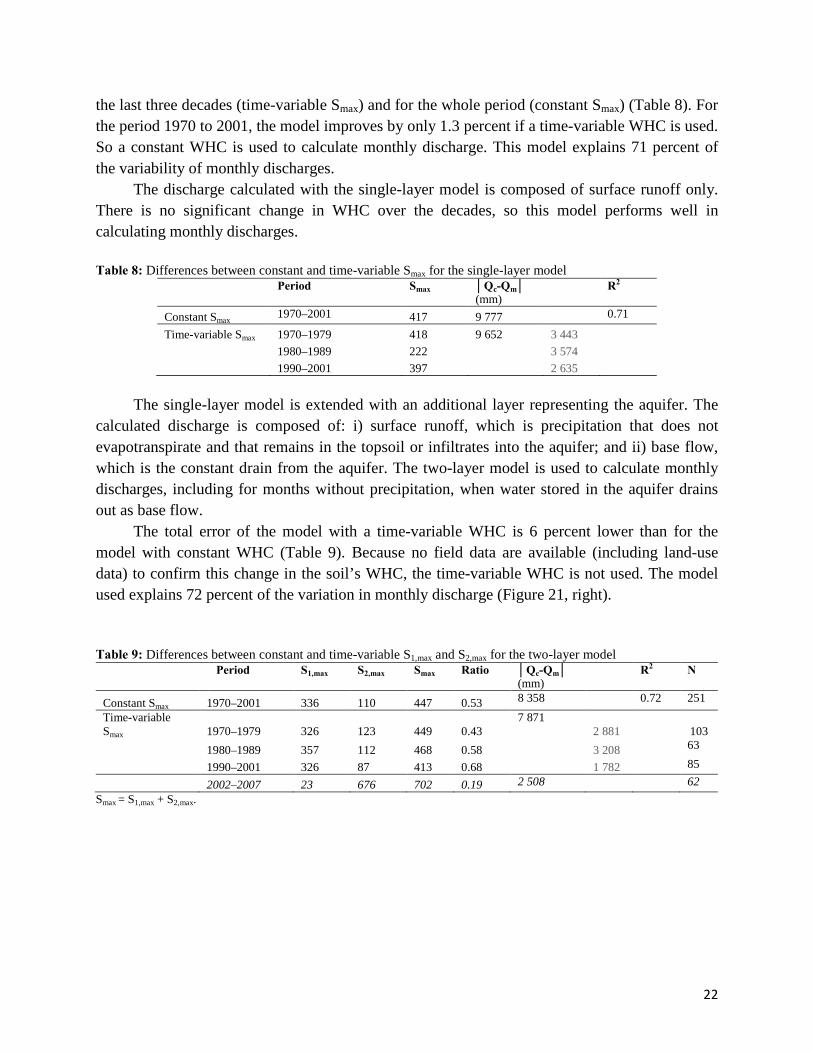
The total error of the model with a time-variable WHC is 6 percent lower than for the model with constant WHC (Table 9). Because no field data are available (including land-use data) to confirm this change in the soil’s WHC, the time-variable WHC is not used. The model used explains 72 percent of the variation in monthly discharge (Figure 21, right).
Table 9: Differences between constant and time-variable S1,max and S2,max for the two-layer model
Period
S1,max
S2,max
Smax
Ratio
│Qc-Qm│ (mm)
R2 N
Constant Smax 1970–2001 336 110 447 0.53 8 358
0.72 251 Time-variable Smax 1970–1979 326 123 449 0.43
7 871 2 881
103
1980–1989 357 112 468 0.58 3 208 63
1990–2001 326 87 413 0.68 1 782 85
2002–2007 23 676 702 0.19 2 508
62
Smax = S1,max + S2,max.
23
Figure 21: WHC (S1,max + S2,max) of the soil separately calculated for the last three decades (blue), and one calculation over the same period (red) (left), and fit of the two-layer model, excluding June 1983, 1970 to 2001 (right)
The time-variable Smax has decreased smoothly over recent years. This could indicate
reduced WHC due to land-use changes such as deforestation (Figure 21, left).
Annual discharge
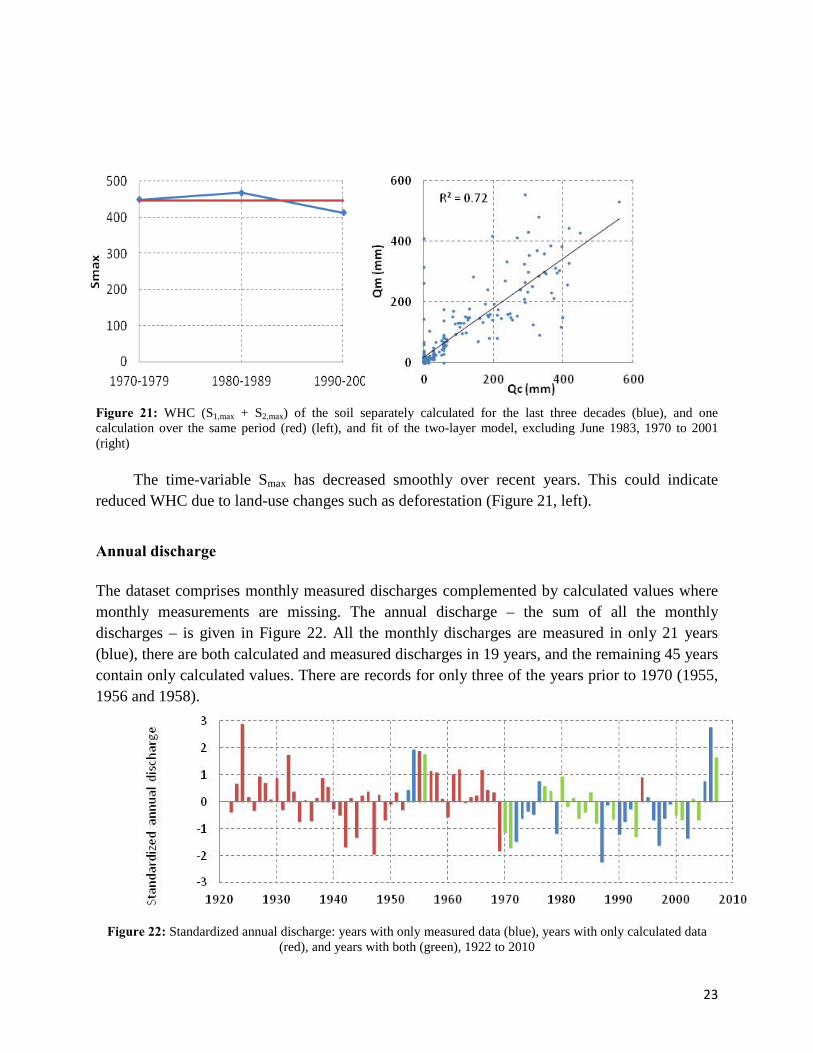
The dataset comprises monthly measured discharges complemented by calculated values where monthly measurements are missing. The annual discharge – the sum of all the monthly discharges – is given in Figure 22. All the monthly discharges are measured in only 21 years (blue), there are both calculated and measured discharges in 19 years, and the remaining 45 years contain only calculated values. There are records for only three of the years prior to 1970 (1955, 1956 and 1958).
Figure 22: Standardized annual discharge: years with only measured data (blue), years with only calculated data (red), and years with both (green), 1922 to 2010

24
Annual discharge follows a similar trend to that for annual precipitation. After 1970, most
discharges are under average (negative values), but the data should be interpreted with caution, because most of those for the period prior to 1970 are modeled rather than measured. Most of the reduction in discharge is due to the reduction in precipitation after 1970.
The lowest annual discharge of Konkoure River is in 1987, which is similar to the findings for Mahé (2009), where the minimum level of Bani River, a tributary of Niger River, is in the mid-1980s. The discharge in period 2 is 17 percent lower than that in period 1. The standard variations in both periods are similar. The highest discharge before 1970 is 2 071 mm in 1924, and the lowest 625 mm in 1947. The period 2002 to 2007 (period 3) is studied separately, as the discharge data for this period show a different trend.
Table 10: Mean annual precipitation and standard deviation for three periods, absolute and relative values
Annual discharges with five- and 11-year moving averages are given in Figure 23 and Figure
Figure 24.
Figure 23: Annual discharge at Pont de Linsan with five-year moving average (green), 1922 to 2010
Discharge Period 1 1922–1969
Period 2 1970–2001
Period 3 2002–2007
Absolute 1 287 ± 288 mm 1 065 ± 231 mm 1 370 ± 455 mm Relative 100% 83% 106%
25
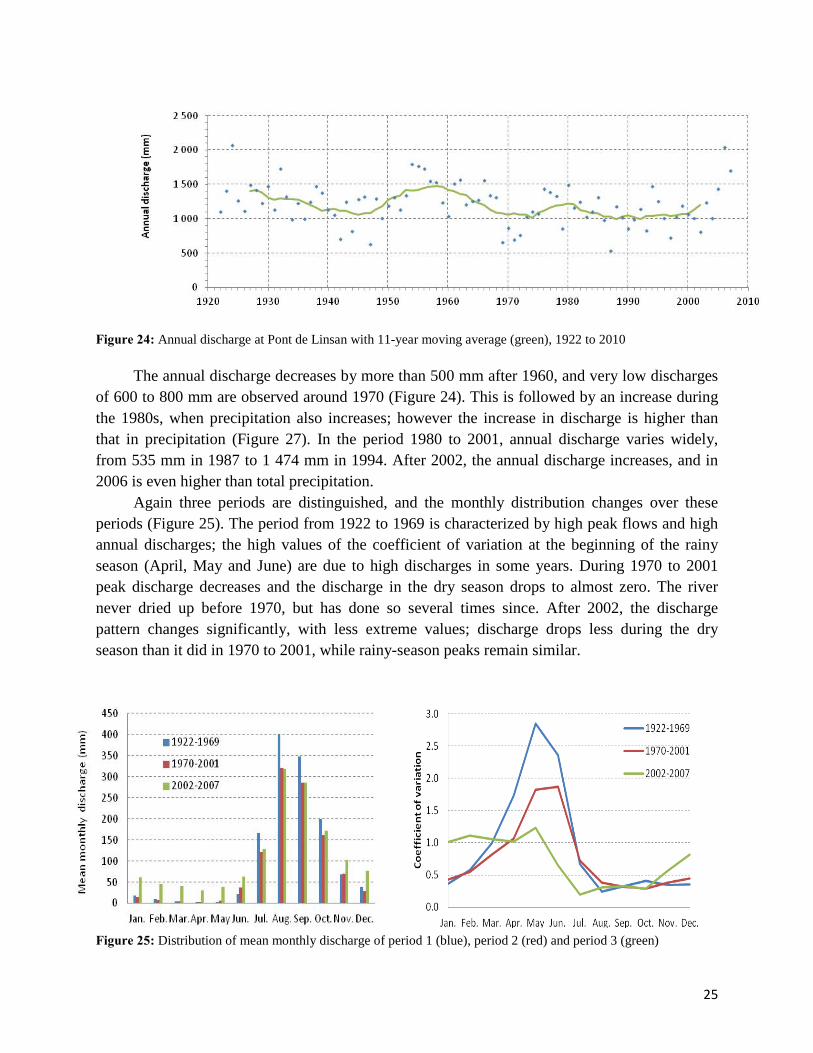
Figure 24: Annual discharge at Pont de Linsan with 11-year moving average (green), 1922 to 2010 The annual discharge decreases by more than 500 mm after 1960, and very low discharges
of 600 to 800 mm are observed around 1970 (Figure 24). This is followed by an increase during the 1980s, when precipitation also increases; however the increase in discharge is higher than that in precipitation (Figure 27). In the period 1980 to 2001, annual discharge varies widely, from 535 mm in 1987 to 1 474 mm in 1994. After 2002, the annual discharge increases, and in 2006 is even higher than total precipitation.
Again three periods are distinguished, and the monthly distribution changes over these periods (Figure 25). The period from 1922 to 1969 is characterized by high peak flows and high annual discharges; the high values of the coefficient of variation at the beginning of the rainy season (April, May and June) are due to high discharges in some years. During 1970 to 2001 peak discharge decreases and the discharge in the dry season drops to almost zero. The river never dried up before 1970, but has done so several times since. After 2002, the discharge pattern changes significantly, with less extreme values; discharge drops less during the dry season than it did in 1970 to 2001, while rainy-season peaks remain similar.
Figure 25: Distribution of mean monthly discharge of period 1 (blue), period 2 (red) and period 3 (green)
26
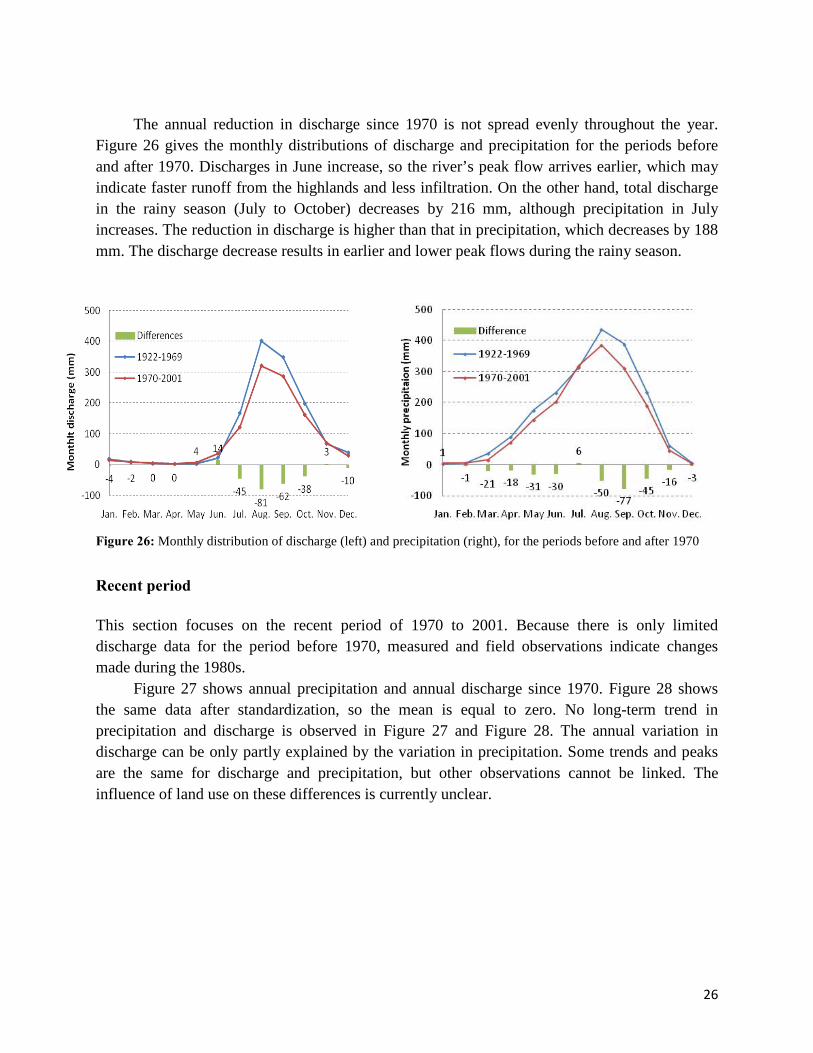
The annual reduction in discharge since 1970 is not spread evenly throughout the year.
Figure 26 gives the monthly distributions of discharge and precipitation for the periods before and after 1970. Discharges in June increase, so the river’s peak flow arrives earlier, which may indicate faster runoff from the highlands and less infiltration. On the other hand, total discharge in the rainy season (July to October) decreases by 216 mm, although precipitation in July increases. The reduction in discharge is higher than that in precipitation, which decreases by 188 mm. The discharge decrease results in earlier and lower peak flows during the rainy season.
Figure 26: Monthly distribution of discharge (left) and precipitation (right), for the periods before and after 1970
Recent period
This section focuses on the recent period of 1970 to 2001. Because there is only limited discharge data for the period before 1970, measured and field observations indicate changes made during the 1980s.
Figure 27 shows annual precipitation and annual discharge since 1970. Figure 28 shows the same data after standardization, so the mean is equal to zero. No long-term trend in precipitation and discharge is observed in Figure 27 and Figure 28. The annual variation in discharge can be only partly explained by the variation in precipitation. Some trends and peaks are the same for discharge and precipitation, but other observations cannot be linked. The influence of land use on these differences is currently unclear.

27
Figure 27: Total annual discharge (blue) and precipitation (red), 1970 to 2010
Figure 28: Standardized annual precipitation (red) and discharge (blue), 1970 to 2001
To investigate further the link between annual precipitation and annual discharge, a
double-mass curve is given in Figure 29. The slope of the trend line is the runoff coefficient, which is defined as the percentage of the precipitation that runs off. During 1970 to 2001 no remarkable changes occur, although the runoff coefficient is slightly higher in the first ten years. The approximately constant slope indicates no major changes in the relationship between runoff and precipitation; on average 61 percent of precipitation runs off. Discharge is much higher after 2002. As already mentioned, a detailed study and field visit are needed to investigate the causes of these high discharge rates and the link between discharge and precipitation.

28
Figure 29: Double-mass curve for the period 1970 to 2007 The correlation between annual discharge and precipitation is plotted in Figure 30. Data for
1970 to 2001 are used to investigate this relation. A linear regression is fitted through the points, but the correlation coefficient (R2) is low, at 0.21. The linear link between monthly discharge and monthly precipitation is too weak to allow precipitation to be used to calculate discharge. This weak relation is probably due to the influence of other that play important roles in discharge generation. The model used at the beginning of this chapter had a correlation coefficient of 0.72, meaning that 72 percent of the variability in discharge is explained by the model.
Table 11: Precipitation and discharge for periods 1 and 2
a Calculated from the regression equation. b Calculated from the model. Table 11 gives the precipitation of periods 1 and 2 with calculated discharges. All the
months between 1970 and 2001 are plotted on a graph, and the average discharge and precipitation for 1970 to 2001 are indicated with blue lines in Figure 30. Using this linear relation between discharge and precipitation, the average discharge of 1922 to 1969 is calculated from the average precipitation for this period. This results in a reduction of annual discharge of 14.8 percent. As calculated previously, discharge decreases by 17 percent when calculated from the model.
Period 1 1922–1969 (mm)
Period 2 1970–2001 (mm)
Absolute difference (mm)
Relative difference (%)
Precipitation 1 975 1 702 256 13.6 Dischargea 1 211 1 034 273 14.8 Dischargeb 1 287 1 065 222 17.2

29
Figure 30: Relation between annual precipitation in Mamou and discharge at Pont de Linsan, with linear regression: average values for period 1 (blue) and period 2 (red)
Next, dry- and wet-season discharges are examined separately, as different processes occur
in the two seasons. Precipitation is low in January to May (15 percent of annual precipitation) when most of it evapotranspirates, so discharge is determined mainly by base flow (Mahé, 2006). Total dry-season discharge decreases in 1970 (Figure 31, left). The high value in 1982 can be explained by a high discharge in May of that year, of 69 mm. The minimum daily discharge measured in the river also declines and is always less than 0.11 m3/second after 1984 (Figure 31, right). It should be noted that the small discharges measured during the dry season are sensitive to measurement errors.
Figure 31: Total dry-season discharge (January to May) (left), and minimum dry-season discharge (right), 1970 to 2001

30
The link between the decrease in dry-season discharge and precipitation is shown in Figure
32. Although it could be expected that dry-season discharge is related to the precipitation of the previous year, the discharge decreases over time, while annual precipitation does not change. The long-term decrease of dry-season discharge is therefore not directly affected by the precipitation of the previous year. As annual precipitation remains stable after 1970, the decrease in discharge is due to the precipitation of several previous years. The reduction could be due to a long-term reduced contribution from groundwater, resulting from the slow drying out of large aquifers. Another explanation could be increased use of water during the dry season for irrigation; this hypothesis should be verified in the field.
Figure 32: Dry-season discharge (January to May) and annual precipitation of the previous year The model is now calibrated for the months January to May to investigate the influence of
the WHC (Smax) during the dry season. The 103 months with calculated and measured discharge are used to calibrate the model. As seen in Table 12, the WHC of the upper part of the soil (S1,max) does not change. However, the WHC of the aquifer (S2,max) decreases, which may indicate that the groundwater contribution is decreasing. Figure 33 plots S2,max, which represents the size of the aquifer.

31
Table 12: Differences between constant and time-variable S1,max and S2,max for the dry season (January to May) Period
S1,max
S2,max
Smax (S1,max+ S2,max)
Ratio
│Qc-Qm│ (mm)
N
Constant Smax 1971–2001 336 76 412 0.27 462
103 Time-variable Smax
1970–1979 336 109 445 0.21 346 118 41 1980–1989 336 63 399 0.38
141 28
1990–2001 336 83 419 0.67
87 34
Figure 33: S2,max calculated for the dry season (January to May) for three decades, 1970 to 2001
A closer look at the rainy-season (June to October) discharge shows that variations are
determined by precipitation, but the discharge fluctuates more widely than the corresponding precipitation (Figure 34).
Some of the findings regarding discharge – annual variations, reductions during the dry season, and variations during the rainy season – cannot be explained by changes in precipitation or ET, so another explanation is needed. The extent to which these changes could be related to land-use changes remains unclear.
Figure 34: Rainy-season discharge and precipitation, 1970 to 2001
32
Intermediate conclusions
As for annual precipitation, when examining discharge, a distinction is made between the periods before and after 1970. Annual discharge decreases by 17 percent after 1970, mainly owing to the 13 percent reduction in precipitation for the same period. The reduction in discharge since 1970 is greatest in July, August, September and October, so peak flow during the rainy season is lower. The June discharge has an absolute increase, while the precipitation during this month decreases. This could indicate faster runoff and less infiltration in the highlands.
When wet- and dry-season changes are investigated separately, annual precipitation and discharge do not show a long-term trend between 1970 and 2001. The total dry-season (January to May) discharge decreases over this period. In addition, the minimum dry-season discharge decreases, and in some years the river dries up completely, which never occurred before 1970. These two findings could be due to a reduced contribution from base flow, to land-use changes or to increased irrigation. Rainy-season discharge has high inter-annual variability, but no significant long-term trend is observed.

33
Chapter 7: Conclusions The results discussed in previous chapters are derived from discharge data for Pont de Linsan watershed and precipitation data for Mamou. It would be interesting to study the watershed at the pilot site in Guetoya, but no discharge data are available. The results from Pont de Linsan can be applied to most of the watersheds in FDH that are of similar size and characteristics, including the watershed at Guetoya.
Discharge is influenced by several factors. Three main influences are investigated in this study: land use and land cover; precipitation; and evapotranspiration. The impacts that changes in these factors have on the discharge are studied.
Land use
Land-use data are limited and no land-use changes are quantified. The prevailing agricultural activity is based on shifting cultivation, which results in a dynamic system where small plots of trees are burned to free the land for cultivation for a few seasons, after which the plot is abandoned and natural vegetation starts to grow back. A detailed study is needed to quantify and locate these changes and to study their impact on the hydrology of the watershed.
Some findings from discharge data indicate land-use changes: i) the discharge model shows decreased WHC during the dry season; and ii) the rainy-season discharge starts earlier, which may be owing to faster runoff and less infiltration. These findings have to be verified with land-use data and field visits.
Precipitation
As found in the whole of West Africa, annual precipitation decreases dramatically from 1970, by an average of 13 percent. Precipitation declines for every month except July, where a small increase occurs after 1970. The highest reductions are in the rainy season, especially August and September. This decrease is important as precipitation during the rainy season has a large influence on discharge.
The study focused on the period after 1970, because more discharge data are available for this period and field observations indicate that changes started in the 1980s. No remarkable change or trend is observed for the period 1970 to 2001, but a peak discharge is recorded for 1976. Precipitation averages 1 702 mm/year, but the reduction since 1970 may have long-term effects on the hydrology of the watershed, such as changes to the water table and the supply of aquifers.

34
Evapotranspiration
Precipitation has a mono-modal distribution. During the rainy season (May to October), effective precipitation (precipitation minus evapotranspiration) is positive and the discharge is composed of surface runoff and base flow. From November to April, effective precipitation is zero and the discharge comes mainly from base flow.
Evapotranspiration is the sum of transpiration and evaporation. A study by Li et al. (2007) concluded that if deforestation remains less than 50 percent, evapotranspiration changes only very slightly. When deforestation exceeds this threshold, evapotranspiration decreases, less water evaporates and more runs off. This could result in higher discharges.
Evapotranspiration is influenced by several parameters, but information on changes over time is available for temperature only. Temperature increases by 0.54 ºC between 1970 and 2000. Taking this temperature increase into account, evapotranspiration increases by 14 percent between 1970 and 2000. The main reduction occurs during the dry season, and effective precipitation is reduced by only 4.8 percent, which has a relatively minor influence on evapotranspiration.
Discharge
The annual discharge of the Konkoure River at Pont de Linsan is an average of 17 percent lower in 1970 to 2001 than in 1922 to 1969; this is mostly due to the 13 percent reduction in precipitation over the same period. The main reduction in discharge is from July to October, and the peak flow during the rainy season is lower after 1970. The June discharge has an absolute increase, while precipitation during this month decreases. This could indicate faster runoff and less infiltration in the highlands.
When dry- and rainy-season changes for the period 1970 to 2001 are investigated separately, annual precipitation and discharge do not show a long-term trend: total discharge over the dry season (January to May) decreases over; minimum dry-season discharge decreases; and the river dries up completely during the dry season in some years, which never occurred before 1970. These two findings could be due to a reduced contribution from base flow, to land-use changes or to increased irrigation. Rainy-season discharge has high inter-annual variability, but no significant long-term trend is observed.
35
Chapter 8: Recommendations This study carried out detailed research on the hydrology of the FDH at a small scale. The research was conducted with a limited amount of data, but interesting trends are observed concerning discharge. To improve understanding of the hydrology of the watershed, these results should be linked to land-use changes and groundwater data.
Implementing the following recommendations would improve understanding of the hydrology of small watersheds in the FDH and of how management of the region influences hydrology: The regional observatory will have an important role in following up on all data for the
FDH. It should ensure that the necessary measurements are made, and that the data are collected at a central location, carefully stored and made readily available.
A few representative watersheds should be selected, including Pont de Linsan watershed, which was studied for this report. The other watersheds selected should be in active project pilot sites, and should be fully equipped with climate and hydrological instruments. The watersheds studied should cover the three main basins: the Niger, the Senegal and the West Coast.
A detailed analysis of the whole area’s land use and land cover, and quantification of land-use changes are needed. The area of the selected watershed should be analyzed at a resolution of 15 m and, if possible, changes should be recorded from 1970. Separate studies of land use during the dry and the rainy seasons would be useful for understanding agricultural activities during the two seasons.
Several stations of Guinea’s governmental Meteorological Service already have long-term discharge data; these measurements should be continued and supported by the project to ensure long-term time series of quality data. For example, discharge data for Pont de Linsan were measured until 2007, but more recent data are not available.
The groundwater table and springs should be monitored to understand the contribution of base flow to discharge, especially during the dry season. Water data for springs can be used to identify when the drying out occurs and how long it lasts.
Several meteorological stations are situated in the area; the project should support and strengthen the collection of long-term time-series data, and check their quality.
Collaboration with local universities and students is necessary for ensuring that measurements and analyses of the data are carried out. It also strengthens partnerships between the project and universities.
36
References
Boulain, N., Cappelaere, B., Seguis., L., Favreau, G. & Gignoux, J. 2009. Water balance and vegetation change in the Sahel: A case study at the watershed scale with an eco-hydrological model. Journal of Arid Environments, 73: 1125–1135.
Briquet, J.P., Mahe, G. & Bamba, F. 1995. Changement climatiques recents et modification du regime hydrologique du fleuve Niger á Koulikoro (Mali). L`hydrologie tropicale: geosciences et outil pour le développement, 238: 157–166.
Descroix, L., Mahé, G., Diedhiuo, A., Le Breton, S., Mamadou, I., Olivry, J.-C., Albergel, J. & Amogu, O. 2009. Spatio-temporal variability of hydrological regimes around the boundaries between Sahelian and Sudanian areas of West Africa: A synthesis. Journal of Hydrology, 375: 90–102.
Diallo, I.A., Yansane, M. & Keita, K. 2011. Étude diagnostique du site pilote de Guetoya, Guinée. Internal project report PGIRN-MFD, FAO/AU.
FAO. 2012. Global Forest Resources Assessment 2010. Rome. FAO & SDC. 2011. Mountain forests in a changing world. Rome. Favreau, G., Cappelaere, B., Massuel, S., Leblanc, M., Boucher, M., Boulain, M. & Leduc,
C. 2009. Land clearing, climate variability and water resources increase in semiarid southwest Niger: A review. Water Resources Research, 45: W00A16.
Ghaffari, G., Keesstra, S., Ghodousi, J. & Ahmadi, H. 2010. SWAT-simulated hydrological impact of land-use change in the Zanjanrood Basin, Northwest Iran. Hydrological processes, 24: 892–903.
Giertz, S. & Diekkruger, B. 2003. Analysis of the hydrological processes in a small headwater catchment in Benin (West Africa). Physics and Chemistry of the Earth, 28: 1333–1341.
Grimay, G., Bal Ram, S. & Oystein, D. 2010. Land-use changes and their impacts on soil degradation and surface runoff of two catchments of Northern Ethiopia. Acta Agriculturae Scandinavia Section B-Soil and Plant science, 60: 211–226.
Haan, C.T., Johnson, H.P. & Brakensiek, D.L. 1982. Hydrologic modeling of small watersheds. ASAE Monograph No. 5. St. Joseph, Michigan, USA, American Society of Agricultural Engineers.
Li, K.Y., Coe, M.T., Ramankutty, N. & De Jong, R. 2007. Modeling the hydrological impact of land-use change in West-Africa. Journal of Hydrology, 337: 258-268.
Mahé, G. 2006. The impacts of land-use/land-cover change and climate variability on the hydrology of the Sahel. Climate Variability and Change – Hydrological Impacts, 308: 679–684.
Mahé, G. 2009. Surface/groundwater interactions in the Bani and Nakambe rivers, tributaries of the Niger and Volta basins, West Africa. Hydrological Sciences, 54(4): 704–712.
Mahé, G., Olivry, J.-C., Dessouassi, R., Orange, D., Bamba, F. & Servat, E. 2000. Relations eaux de surface-eaux souterraines d’une riviere tropicale au Mali. Earth and Planetary Sciences, 330: 689–692.
McSweeney, C., New, M. & Lizcano, G. 2011. UNDP Climate Change Country Profiles, Guinea. http://country-profiles.geog.ox.ac.uk.
Prague Polytechnic. 1981. Plan général d’aménagement hydraulique de la moyenne Guinée. Projet OMM-PNUD-GUI-74-014. Dossier final, volume 2, hydrologie et météorologie. Prague.

37
Sutcliffe, J.V., Gibb, A. & Lazenby, J.B.C. 1990. Hydrology and river control on the Niger and Senegal. The state-of-the-art of hydrology and hydrogeology in the arid and semi-arid areas of Africa, 846–856.
Wei, X. & Zang, M. 2010. Quantifying stream flow change caused by forest disturbance at a large spatial scale: A single watershed study. Water Resources Research, 46: W12525.
Websites European Space Agency (ESA), Ionia GlobCover: http://ionia1.esrin.esa.int. (accessed 06
January 2012) FAOClim-Net: http://geonetwork3.fao.org/climpag/agroclimdb_en.php. (accessed 27 October
2011) Global Runoff Data Centre (GRDC), Koblenz, Germany: http://www.bafg.de/grdc. (accessed 25
October Online 2011) Google Maps: http://maps.google.com/. (accessed 3 February 2012) UNDP Climate Change Country Profiles 2011, Guinea: http://country-profiles.geog.ox.ac.uk.
(accessed November 2011)