trends in spatio-temporal distribution of peruvian anchovy ... · changes in the latitudinal...
TRANSCRIPT
Latin American Journal of Aquatic Research
633Lat. Am. J. Aquat. Res., 40(3): 633-648, 2012 International Conference: “Environment and Resources of the South Pacific” P.M. Arana (Guest Editor) DOI: 103856/vol40-issue3-fulltext-12
Research Article
Trends in spatio-temporal distribution of Peruvian anchovy and other small pelagic fish biomass from 1966-2009
Mariano Gutiérrez1, Ramiro Castillo2, Marceliano Segura2 Salvador Peraltilla2 & Miguel Flores2
1Facultad de Oceanografía y Pesquería, Universidad Nacional Federico Villareal, Lima, Perú 2Instituto del Mar del Perú, Callao, Perú
ABSTRACT. Changes in abundance and distribution of anchovy and other species of pelagic fish of the Northern Humboldt Current System (NHCS) are driven by environmental forcing variations in different time and spatial scales between the coastal ‘cold’ ecosystem and the ‘warm’ oceanic one. Data to study these fluctuations have come mostly from the fishery to show how anchovy (Engraulis ringens) increases when sardine (Sardinops sagax) declines and vice versa. However, using acoustic data on latitudinal biomass we show that other species as mackerel (Scomber japonicus) and jack mackerel (Trachurus murphyi) also follow the same opposed trend, then the fishery data hides the true dimension of the balance of abundance among species. Based on Hovmoller diagrams we scrutinized the changes in interannual latitudinal acoustic biomass, landings and influence of El Niño events from 1966 to 2009 in order to describe: 1) how the anchovy decadal distribution pattern moved from south to north since the 1960’s; 2) how there have been produced concomitant changes in the latitudinal abundance and distribution of other species such as sardine, jack mackerel and mackerel before, during and after El Niño events; and 3) what was the overall effect of the succession of El Niño events on all these pelagic species. We concluded that: a) every El Niño event has had an effect on the expansion or contraction of pelagic species distribution and abundance, with different latitudinal effects; and b) the El Niño 1997-98 did not trigger but accelerated a decline phase on the abundance of sardine, jack mackerel and mackerel by a reduction of their ideal habitat due to an expansion of the coastal ecosystem caused by a shallower location of the upper limit of the Oxygen Minimum Zone (OMZ) These findings observed using past data might be taken into consideration for fishery management purposes when considering future scenarios. Keywords: acoustics, small pelagic fish, landings, biomass, latitudinal distribution, El Niño, Perú.
Tendencias espacio-temporales en la distribución de la biomasa de anchoveta peruana y de otros peces pelágicos pequeños entre 1966 y 2009
RESUMEN. Los cambios en la abundancia y distribución de anchoveta y de otras especies de pequeños peces pelágicos de la región norte del Sistema de la Corriente de Humboldt (NHCS) son el producto de la variación de forzantes ambientales en diferentes escalas de tiempo y espacio que influyen entre el ecosistema ‘frío’ costero y el oceánico ‘cálido’. La información para estudiar estas fluctuaciones provienen mayormente de las pesquerías, y muestran que la anchoveta (Engraulis ringens) incrementa su abundancia cuando la de sardina (Sardinops sagax) declina y viceversa. Sin embargo, utilizando datos acústicos de biomasa latitudinal se muestra que otras especies como la caballa (Scomber japonicus) y el jurel (Trachurus murphyi) también siguen la misma tendencia opuesta a anchoveta, lo que en principio indica que los datos pesqueros disponibles no indican la verdadera dimensión del balance de abundancia entre especies. Utilizando diagramas de Hovmoller se analizan los cambios en la biomasa acústica latitudinal, capturas e influencia de eventos El Niño ocurridos entre 1966 y 2009 con el objetivo de describir: 1) cómo el patrón de distribución decadal de anchoveta se movió de sur a norte desde la década de 1960, 2) cómo se han producido cambios concomitantes en la abundancia latitudinal de otras especies tales como sardina, caballa y jurel antes, durante y después de eventos El Niño, y 3) cuál fue el efecto general de la sucesión de eventos El Niño sobre todas estas especies. Se concluye que: a) cada evento El Niño ha tenido un efecto en la expansión o contracción de la distribución de especies pelágicas, con diferente gradiente latitudinal, y b) El Niño 1997-98 no disparó sino aceleró la fase declinante de la abundancia de sardina, caballa y jurel al reducirse el tamaño de su hábitat ideal debido a una expansión del hábitat costero que presentó además un acercamiento a la superficie del límite superior de la
Distribution of small pelagic fish off Peru from 1966-2009
634
Zona Mínima de Oxígeno (MOZ). Las observaciones logradas con datos acústicos podrían ser tomadas en consideración para el manejo pesquero al considerar escenarios futuros. Palabras clave: acústica, peces pelágicos, capturas, biomasa, distribución latitudinal, El Niño, Perú.
___________________ Corresponding author: [email protected]
INTRODUCTION
The Northern Humboldt Current System (NHCS) off Peru is characterised by the presence of high abundance of several species of small pelagic fish, in particular anchovy (Engraulis ringens), the world’s most caught fish since the 1950’s (Pauly & Tsukayama, 1987; Arntz & Fahrbach, 1996; Bakun & Broad, 2003; Chávez et al., 2003; Bakun & Weeks, 2008). Approximately 260 million ton of anchovy were caught off Peru between 1959 and 2009 at an average rate of 6.35 million ton per year (IMARPE, unpublished data). However, during the last decades anchovy population has shown a dramatic rise and fall in its population due to three main factors: interdecadal climatic regimes (Chávez et al., 2003; Alheit & Ñiquen, 2004; Gutiérrez et al., 2007; Swartzman et al., 2008), changes in biological diversity of plankton communities driven, in particular, by the El Niño Southern Oscillation (Ayón et al., 2008; Ayón et al., 2011), and fishing pressure (Csirke et al., 1996; Alheit & Ñiquen, 2004; Bertrand et al., 2004); Gutiérrez et al., 2007).
The Eureka Program After the collapses of the anchovy population during the early 1970s and 1980s, more precautionary management approaches were implemented to provide sustainability to the fishery (Csirke et al., 1996; Ñiquen et al., 2000; Chávez et al., 2008). Nevertheless since the beginning of the commercial fishery (1950’s), FAO and the local fishing industry had cooperated with the Peruvian government in the establishment of methods allowing the collection of useful information for fishing managers (Villanueva, 1971; Valdivia, 1978). The central method was the use of quick synoptic surveys to collect biological and qualitative acoustic information aboard fishing vessels through a survey system called The Eureka Program, which was founded during 1966 after two years of trials (Villanueva, 1971; Fernandes et al., 2001; Gutiérrez, 2001a; ICES, 2007). Black and white echograms printed in paper aboard fishing vessels (FV) were used to extract data and produce analysis based on visual scrutiny of echotrace classification of detected fish schools according to their shapes and relative abundance scores (e.g. from 0 to 5) for every
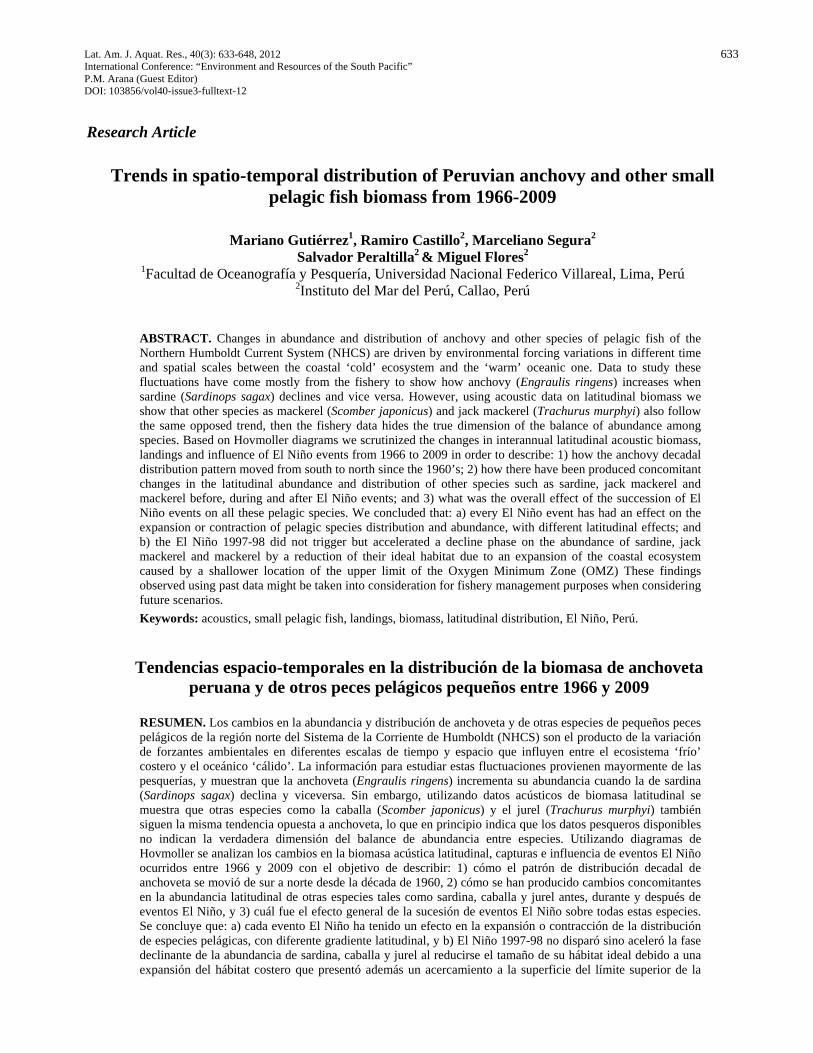
surveyed distance (e.g. 1 to 4 nm) (Fig. 1). These 'eye-based' data were used to construct maps of fish distribution and relative abundance (Villanueva, 1971). After 16 years (1966-1982) the use of FV to produce regular monitoring on anchovy was replaced by the operation of research vessels (RV) with higher autonomy than FV and better acoustic equipment, to make possible to perform calibrated biomass assessment of anchovy and other fish species (Gutiérrez et al., 2001).
The Acoustic Surveys Program Since the 1960s, acoustic tools and methods quickly improved (Fernandes et al., 2001). First echosounders were analogue and only used for limited qualitative purposes due to the lack of consistent methods and devices to convert the backscattered acoustic energy into fish biomass (Simmonds & MacLennan, 2005). The use of echointegrators (Dragesund & Olsen, 1965; Scherbino & Truskanov, 1966) was introduced in Peru during the following decade (1970s). In 1983, the Instituto del Mar del Perú (IMARPE) founded a quantitative acoustic surveys program aboard research vessels operating analogue echosounders and echointegration devices and using methods developed by a FAO-NORAD-IMARPE Project (1975-1981) (Johannesson & Robles, 1977; Burczynski, 1982; Johannesson & Vilchez, 1981a, 1981b; Venema, 1992). The intense use of catch data obtained by the RVs during surveys (Foote 1994, 1995) to support acoustic identification of fish became an essential aspect of the methods developed to replace the Eureka Program whose surveys were evenly applied after 1982. In 1997 IMARPE replaced the analogue acoustic devices by digital multifrequency and post-processing systems (MacLennan, 1997, 1998, 1999).
Other species of pelagic fish The other species that started to be acoustically assessed during 1983 to support their fishery management were: sardine (Sardinops sagax) with a total landing of 39.1 million ton at an average rate of 1.6 million per year between 1970-2004; mackerel (Scomber japonicus) with a total landing of 2.32 million ton at an average rate of 0.15 million per year between 1985-2009; and jack mackerel (Trachurus murphyi) with a total catch of 7.5 million ton at an
Latin American Journal of Aquatic Research
635
Figure 1. Comparison between the first and current acoustic echograms being used for acoustic fish stock assessment. a) Paper-recorded black and white echogram collected during the 1960’s, in which most of the ancillary information had to be written by hand, b) digital echogram in which acoustic thresholds, scale colours, ESDU limits etc can be edited without modifying the hidden data (backscattered volume of targets). All the correlated information (e.g. latitude, longitude, date, time, depth, is intrinsic to every acoustic ping), c) Sudy area and a sample of density distribution map for anchovy based on the analysis of echograms and their echointegration (in NASC values). Figura 1. Comparación entre los primeros y actuales ecogramas. a) Ecogramas impresos en papel en blanco y negro durante la década de 1960, cuando la mayor parte de información auxiliar tenía que ser escrita a mano, b) ecograma digital actual, en el cual el umbral acústico, límites de unidad de muestreo y otros parámetros pueden ser editados sin alterar la data básica (energía retrodispersada por los peces). Toda la información relacionada (por ejemplo, latitud, longitud, fecha, hora, profundidad) es intrínseca a cada pulso acústico, c) área de estudio y una muestra del mapa de densidad de distribución de anchoveta basado en análisis por ecointegración (valores NASC).
average rate of 0.22 million ton per year between 1966-2009 (IMARPE, unpublished data). Some serious concerns emerged about the sustainability of these fisheries after the El Niño 1997-98 when the abundance of these species reduced and dramatically declined since El Niño 2002 although yet not officially declared as collapsed. At the same time the anchovy biomass increased following the amplification of its coastal habitat (Bertrand et al., 2004; Gutiérrez et al., 2007).
Uncertainty The different quality of data collected since 1966 makes it hard to compare and analyze the changes in abundance and distribution of fish occurred in the NHCS. However, in this paper we reconstructed the
spatiotemporal distribution of anchovy, sardine, mackerel and jack mackerel biomass in order to discuss their variability according to the fishing pressure and the environmental signals provided by El Niño events (e.g. change in gravity centre and abundance variations). Then the aim of this paper is to synoptically describe the past changes and effects of El Niño events in order to help the managers of the Peruvian government and the private sector to deal with future uncertainty regarding varying population levels of pelagic fish stocks.
MATERIALS AND METHODS
Different methods and acoustic devices have been used by IMARPE since the 1960’s, then the type of
Distribution of small pelagic fish off Peru from 1966-2009
636
acoustic data used in this paper also varied according to what it is described in the following sections:
1966-1982: Fishing vessels as observational platforms of anchovy population This kind of survey is still performed as a complement to regular monitoring of pelagic stocks. A quick and synoptic Eureka Survey on anchovy involves 25 to 50 fishing vessels contracted by IMARPE. This kind of survey is useful for monitoring spawning and recruitment areas, establishing fishing grounds, measuring the relative abundance or availability of target species, and determining local or regional oceanographic and environmental conditions. Each participating vessel is assigned to cover two or three parallel or triangular transects, and conduct associated oceanographic and fish sampling following a survey design similar to that employed during conventional acoustic surveys. With multiple vessels, the area can be completely surveyed in 2-3 days. The crew aboard every vessel includes three scientific observers from IMARPE: an acoustician, a biologist, and an oceanographer. The acoustician uses the acoustic equipment available on board, and the biologist and oceanographer carry standard sampling equipment (ICES, 2007). The Eureka Program was the only source of data for fish stock assessment on anchovy from 1966 to 1982 producing 32 surveys in the meantime. Most of Eureka surveys only covered 60 nm offshore as an average, which did not permit the assessment of fish species with a more oceanic distribution (Gutiérrez et al., 2001).
1983-1991: Acoustic assessment throughout con-version factors obtained from calibrations using live fish in cages A FAO-NORAD-IMARPE project established the first Regional Center of Electroacoustics in Latin America (CREA, Johannesson & Robles, 1977) which permitted the training of the first generation of acoustic researchers of the region. In Peru CREA performed 10 experimental acoustic surveys aboard RV Tareq II and SNP-1 (1975-1981, Johannesson & Vilchez, 1981). The main goal was to develop assessment methods based on acoustic analogue detection to calculate mean backscattered energy by contouring the samples obtained in surveyed areas targeting fish like anchovy, sardine, hake (Merluccius gayi), mackerel and jack mackerel. Details of those surveys can be found in Johannesson & Robles (1977), Johannesson & Vilchez (1981a, 1981b) and Muck & Sánchez (1987). Echo sounders were calibrated before each survey using hydrophones (and eventually metal spheres) prior to the calculation of
factors to convert averaged Nautical Acoustic Scattering Coefficients (NASC, formerly named “M”, then ‘sA’) in absolute biomass estimations (Burczinsky, 1982). The specific method for calculating the conversion factors by species (‘Cx’) to transform the echointegrator NASC readings into biomass consisted in measuring the mean acoustic response of live fish while individuals were progressively aggregated to the submerged cage (e.g. in groups of 50 individual fish every time) until the saturation of the echointegrator. Details of the method can be found in Johannesson & Vilchez (1981a, 1981b).
NASC values were averaged and contoured under an arbitrary classification of four levels in order to measure the surface and acoustic density of every strata (1 to 10; 10 to 100; 100 to 1,000; and >1,000 m2 nm-2). The biomass was calculated by degree of latitude, being the corresponding abundance the sum of the partial biomass of the four strata (details can be found in Burczinsky, 1982 and Vilchez et al., 1988). Thirteen surveys of this kind were performed from 1983 to 1991 using a sampling distance of 2 nm. Since 1983 surveys were not limited to the known distribution areas of anchovy and ranged further offshore to monitor the abundance of other species as well. The research vessels (RV) deploying analogue Simrad EK and EKS systems (Kongsberg, Norway) employed during this period was: Humboldt (76 m), SNP-1 (36 m) and Nansen (VNIRO, URSS, 71 m). Used main frequency was 120 kHz though 12, 38 and 50 kHz were also used. First digital split beam system (38 and 120 kHz) were installed aboard RV Humboldt in 1987 (Simrad EK400 and QD integrator).
1992-1996: Acoustic assessment applying TS-Length relationship for herring In 1992 there were no specific Target Strength-Length (TS-L) relationships for any of the four targeted species (anchovy, sardine, mackerel and jack mackerel), then the TS-L relationship for herring (Clupea harengus) was used under the assumption that it had similar acoustic reflectivity than other small pelagic fish (Foote, 1994; MacLennan, 1996). Echosounder calibration was also improved using metal spheres (Foote, 1994, 1995, Foote et al., 1987a, 1987b). Finally, the length of ESDU was reduced from 2 to 1 nm to increase the spatial resolution of acoustic data (Foote, 1994). From 1992 to 1996 six surveys were performed using the R/V SNP-1 equipped with an analogue 38 kHz echo-sounder. The biomass was calculated by averaging NASC inside ‘isoparalitoral areas’ i.e. sections parallel to the coastline every 10 min of longitude by 30 min of latitude (Gutiérrez & Peraltilla, 2000; Simmonds et al., 2009).

Latin American Journal of Aquatic Research
637
Since 1997: Target Strength-Length relationships for native species and post processing calculations In 1997, the RV Humboldt was equipped with a bi-frequency split-beam digital scientific echosounder (Simrad EK500). From 1997 to 1999 IMARPE’s two new research vessels were built (RV Olaya, 41 m; RV SNP-2, 21 m) and equipped with similar devices (MacLennan, 1998, 1999), enabling the possibility of performing joint surveys and in situ and ex situ TS-L measurements (MacLennan, 1998; Gutiérrez & MacLennan, 1998). Since 1997 the biomass calculations for anchovy was made using specific TS-L relationships (MacLennan, 1998; Simmonds et al., 2009). Some other specific relationships were used for the other species which are described in the IMARPE’s reports (e.g. Castillo et al., 2009). The data gathered by digital sounders was then logged and recorded using softwares BI-60 (Simrad, Norway, from 1998 to 2000) and Echolog (Myriax Pty, Australia, since 2000). Digital data analysis was performed since 2000 using algorithms developed in Echoview (Myriax Pty, Australia). Nevertheless the method for geographical calculation of biomass by isoparalitoral areas remained similar though NASC values were exported directly from Echoview without ‘handmade’ work. Again, the biomass was the sum of fish density by corresponding areas by degree of latitude. Since 1997 to 2009, 39 surveys were performed aboard RVs Humboldt, Olaya and SNP-2.
Hovmöller diagrams and summary tables A common result of all available acoustic data from 1966 to 2009 is the latitudinal biomass. From this information we produced Hovmöller diagrams to illustrate the changes in fish biomass according to latitudes (by degree) and time (by year). Fish biomass was interpolated by triangulation to produce a coloured grid of nodes representing the relative abundance of fish using Surfer software (Golden Software, Colorado, USA). The annual catch by species was calculated from monthly landings registered by IMARPE (www.imarpe.pe) and fitted to the time scale of the grid. For each survey and each species the latitudinal component of the gravity centre of fish biomass was calculated (Bez, 1997) and superposed to the Hovmöller diagram. Finally we indicated the period when El Niño events occurred from 1966 to 2009. Every El Niño event was classified -as cited in the literature- as very strong, strong, moderated or weak according to the thermal anomalies registered during the events (e.g. Zuta & Guillén, 1970; Arntz & Fahrbach, 1996; Moron., 2000; Chávez et al., 2003, 2008; Bertrand et al., 2004; Gutiérrez et al., 2007).
For each species, we produced a table scoring the observed trends in fish distribution up to two years before, during, and two years after each El Niño event. The aspects we assessed using relative expressions (e.g. high, medium, low, northern, central, southern) were: (1) the relative biomass, (2) the overall latitu-dinal distribution, (3) the latitude of the gravity centre, (4) the overall trend of distribution and, (5) the catches. Finally, another table summarizes the above described criteria for the four species using El Niño events as reference checkpoints.
RESULTS
In total 90 acoustics surveys performed along the Peruvian coast between 1966 and 2009 were used in this analysis. Before 1983 acoustic information was available for anchovy only (34 surveys) while all the other included sardine, mackerel and jack mackerel (56 surveys).
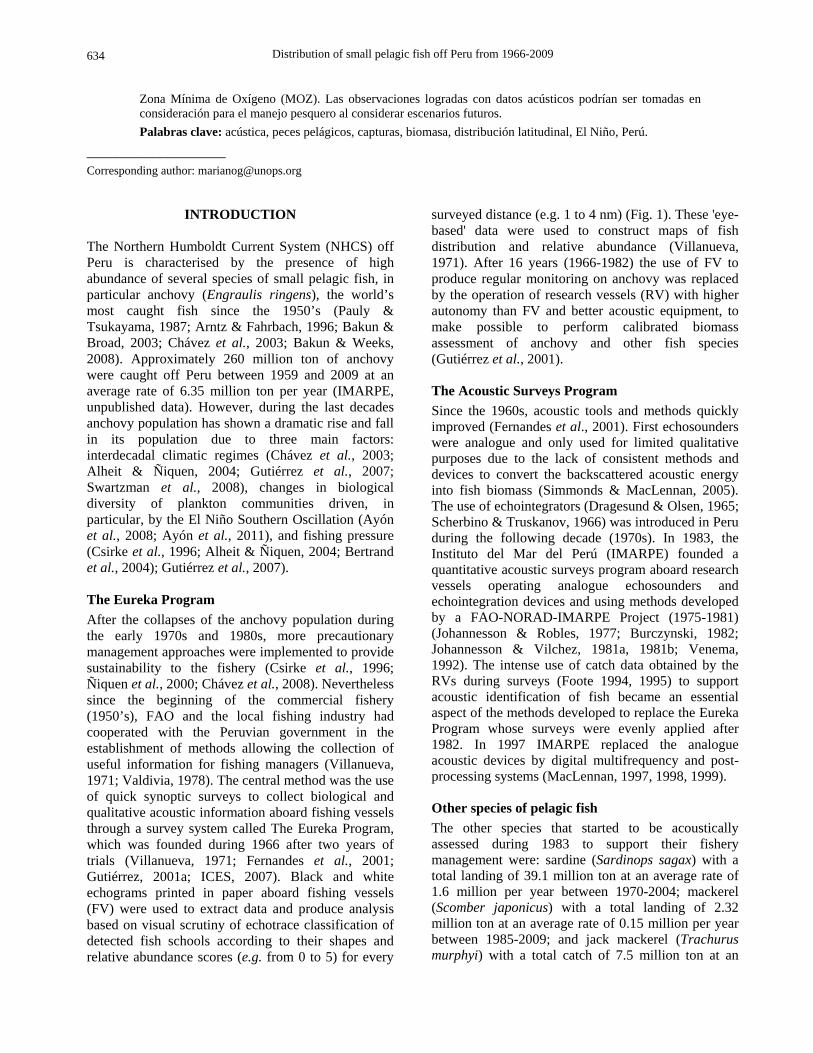
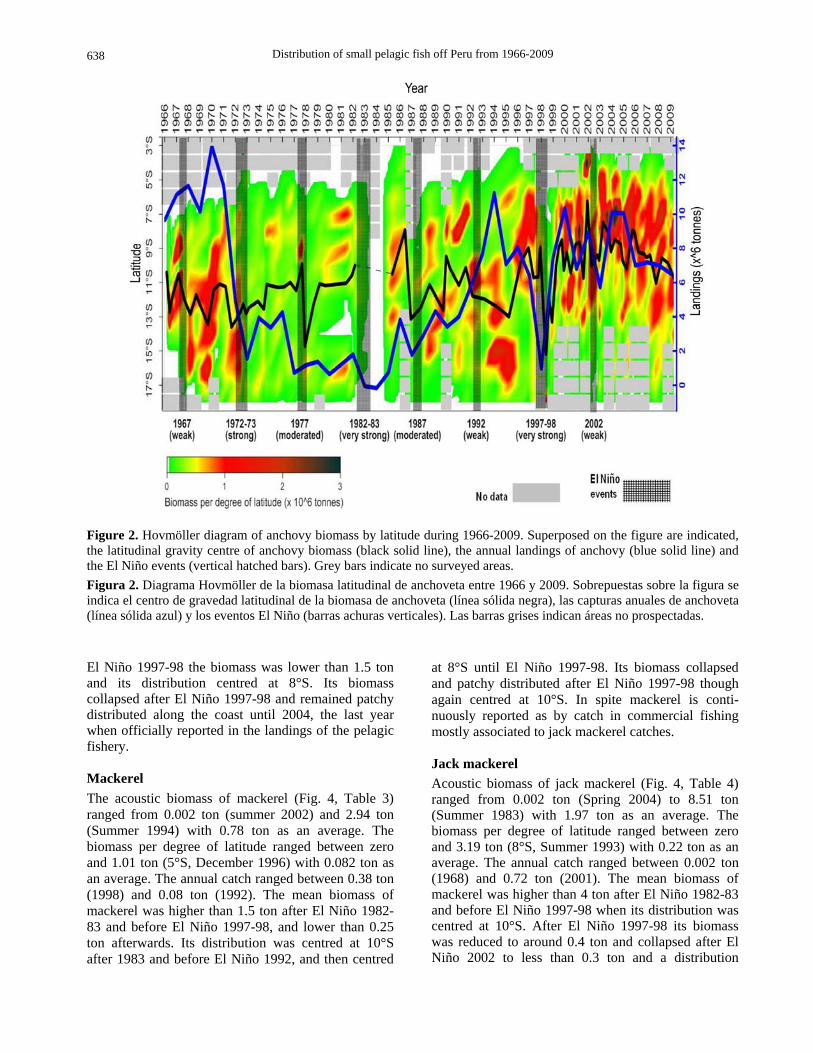
Anchovy Acoustic estimation of anchovy biomass (Fig. 2, Table 1) ranged from 0 (summer 1983) to 12.71 million ton (summer 2005) with 5.13 ton as an average. The biomass in per degree of latitude ranged between zero and 3.96 ton (7°S, summer 2004), with 0.44 ton as an average. The annual catch ranged between 0.024 (1984) and 12.27 ton (1970), with an average of 6.35 ton. Before El Niño 1972-73, anchovy biomass was higher than 5 ton and centred at 12ºS of latitude, then the biomass dramatically decreased to reach 3 ton as an average until El Niño 1982-83 when the population collapsed. Its biomass remained low during the 1980s reaching its lowest values during 1983-84 to progressively recover by the late 1980s and during the 1990s. After the El Niño event 1997-98, anchovy biomass reached the maximum values of the analyzed time series. This increasing trend in biomass was accompanied by a change in latitudinal distribution toward the north: 11°S during the 1990’s, and 9°S during the 2000’s.
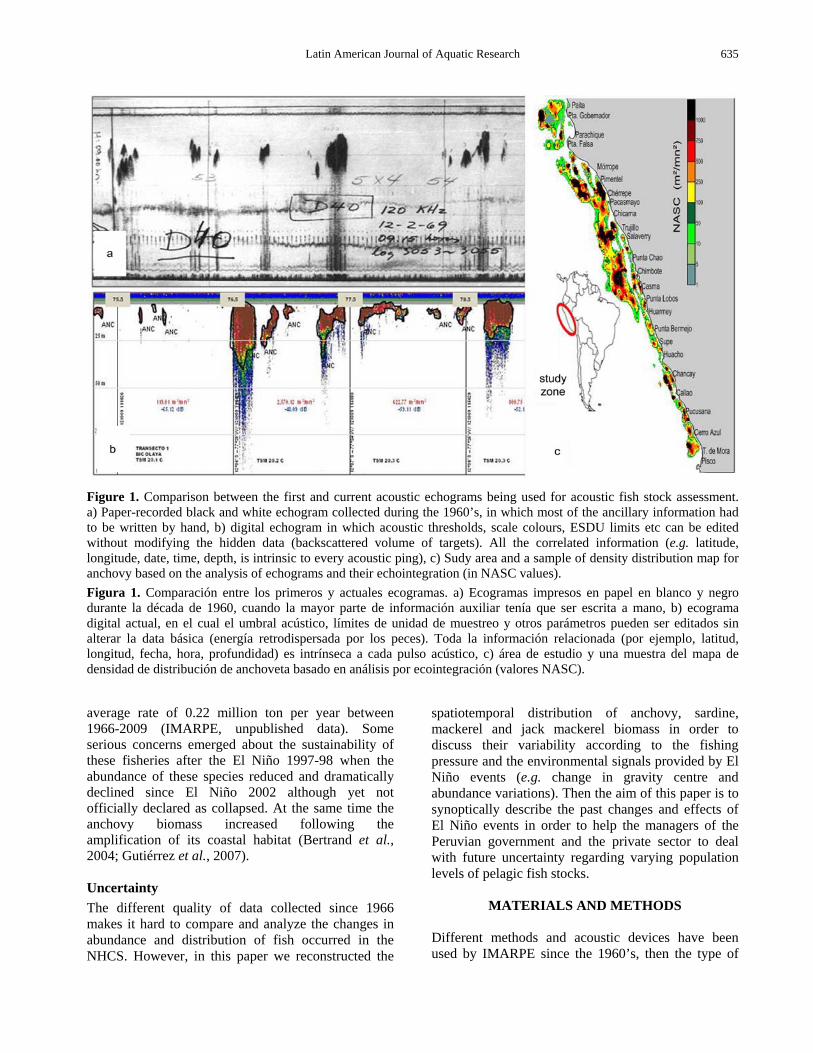
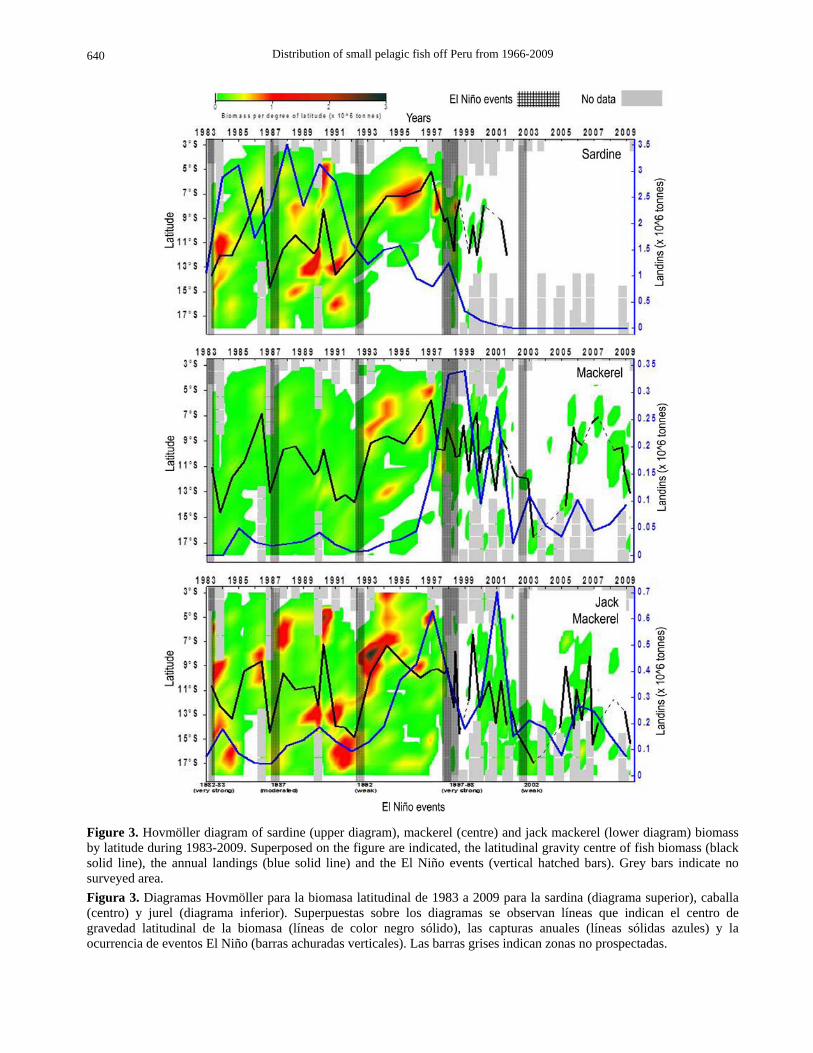
Sardine Acoustic biomass of sardine (Fig. 3, Table 2) ranged from 0 (after 2001) to 5.74 ton (summer 1990) with 1.91 ton as an average until 2001. The biomass per degree of latitude ranged between zero and 1.81 ton (13°S, August 1989) with 0.22 ton as an average from 1983 to 2001. The annual catch ranged between 3.46 ton during 1988 and zero after 2004. The mean biomass of sardine was higher than 3.5 ton after El Niño 1982-83 and before 1992 with a distribution centred at 11°S. Before El Niño 1992 and before
Distribution of small pelagic fish off Peru from 1966-2009
638
Figure 2. Hovmöller diagram of anchovy biomass by latitude during 1966-2009. Superposed on the figure are indicated, the latitudinal gravity centre of anchovy biomass (black solid line), the annual landings of anchovy (blue solid line) and the El Niño events (vertical hatched bars). Grey bars indicate no surveyed areas. Figura 2. Diagrama Hovmöller de la biomasa latitudinal de anchoveta entre 1966 y 2009. Sobrepuestas sobre la figura se indica el centro de gravedad latitudinal de la biomasa de anchoveta (línea sólida negra), las capturas anuales de anchoveta (línea sólida azul) y los eventos El Niño (barras achuras verticales). Las barras grises indican áreas no prospectadas.
El Niño 1997-98 the biomass was lower than 1.5 ton and its distribution centred at 8°S. Its biomass collapsed after El Niño 1997-98 and remained patchy distributed along the coast until 2004, the last year when officially reported in the landings of the pelagic fishery.
Mackerel The acoustic biomass of mackerel (Fig. 4, Table 3) ranged from 0.002 ton (summer 2002) and 2.94 ton (Summer 1994) with 0.78 ton as an average. The biomass per degree of latitude ranged between zero and 1.01 ton (5°S, December 1996) with 0.082 ton as an average. The annual catch ranged between 0.38 ton (1998) and 0.08 ton (1992). The mean biomass of mackerel was higher than 1.5 ton after El Niño 1982-83 and before El Niño 1997-98, and lower than 0.25 ton afterwards. Its distribution was centred at 10°S after 1983 and before El Niño 1992, and then centred
at 8°S until El Niño 1997-98. Its biomass collapsed and patchy distributed after El Niño 1997-98 though again centred at 10°S. In spite mackerel is conti-nuously reported as by catch in commercial fishing mostly associated to jack mackerel catches.
Jack mackerel Acoustic biomass of jack mackerel (Fig. 4, Table 4) ranged from 0.002 ton (Spring 2004) to 8.51 ton (Summer 1983) with 1.97 ton as an average. The biomass per degree of latitude ranged between zero and 3.19 ton (8°S, Summer 1993) with 0.22 ton as an average. The annual catch ranged between 0.002 ton (1968) and 0.72 ton (2001). The mean biomass of mackerel was higher than 4 ton after El Niño 1982-83 and before El Niño 1997-98 when its distribution was centred at 10°S. After El Niño 1997-98 its biomass was reduced to around 0.4 ton and collapsed after El Niño 2002 to less than 0.3 ton and a distribution

T
able
1. T
rend
s of d
istri
butio
n, a
bund
ance
and
cat
ches
of a
ncho
vy b
efor
e, d
urin
g an
d af
ter E
l Niñ
o ev
ents
sinc
e 19
66 to
200
9.
Tab
la 1
. Ten
denc
ias d
e la
dis
tribu
ción
, abu
ndan
cia
y ca
ptur
as d
e an
chov
eta
ante
s, du
rant
e y
desp
ués d
e ev
ento
s El N
iño
de 1
966
a 20
09.
Anc
hovy
Niñ
o 19
67
1972
-197
3 19
77
1982
-198
3 19
87
1992
19
97-1
998
2002
In
dexe
s Le
vel
wea
k st
rong
m
oder
ated
ve
ry st
rong
m
oder
ated
w
eak
very
stro
ng
wea
k O
vera
ll sc
ore
befo
re
high
hi
gh
low
m
ediu
m
med
ium
m
ediu
m
high
hi
gh
durin
g hi
gh
high
m
ediu
m
low
lo
w
med
ium
m
ediu
m
high
R
elat
ive
biom
ass
afte
r hi
gh
low
lo
w
very
low
m
ediu
m
high
hi
gh
high
high
er b
efor
e 19
72
and
afte
r 199
2
befo
re
cent
ral
sout
hern
al
l coa
st
north
ern
cent
ral
north
ern
north
ern
north
ern
varia
ble
thou
gh
north
ern
afte
r 199
2 du
ring
cent
ral
sout
hern
ce
ntra
l ce
ntra
l ce
ntra
l ce
ntra
l ce
ntra
l ce
ntra
l ce
ntra
l O
vera
ll la
titud
inal
di
strib
utio
n af
ter
sout
hern
al
l coa
st
sout
hern
-
cent
ral
sout
hern
no
rther
n no
rther
n va
riabl
e th
ough
mos
tly
sout
hern
bef
ore
1992
be
fore
13
°S
14°S
11
°S
11°S
8°
S 11
°S
9°S
9°
durin
g 11
°S
12°S
10
°S
10°S
13
°S
12°S
10
°S
11°
Gra
vity
cen
ter
afte
r 13
°S
11°S
15
°S
? 11
° 13
°S
8°S
8°
very
var
iabl
e
befo
re
north
ernw
ard
sout
hern
war
d -
north
ernw
ard
north
ernw
ard
north
ernw
ard
north
ernw
ard
north
ernw
ard
mos
tly n
orth
ernw
ard
durin
g -
north
ernw
ard
north
ernw
ard
- so
uthe
rnw
ard
- so
uthe
rnw
ard
sout
hern
war
d m
ostly
sout
hern
war
d
afte
r 198
2-83
O
vera
l tre
nd o
f di
strib
utio
n
afte
r so
uthe
rnw
ard
- so
uthe
rnw
ard
? no
rther
nwar
d so
uthe
rnw
ard
north
ernw
ard
north
ernw
ard
varia
ble
thou
gh m
ostrl
y
north
ernw
ard
afte
r 199
2 be
fore
10
6
2 3
4 5
6 8
durin
g 11
4
2 1
2 6
1 9
Cat
ches
(x 1
0^6
to
n)
afte
r 10
2
2 0
5 7
8 7
high
er b
efor
e 19
72 a
nd a
fter 1
992
Not
e: 2
yea
rs b
efor
e an
d af
ter e
very
El N
iño
even
t.
Latin American Journal of Aquatic Research 639
Distribution of small pelagic fish off Peru from 1966-2009
640
Figure 3. Hovmöller diagram of sardine (upper diagram), mackerel (centre) and jack mackerel (lower diagram) biomass by latitude during 1983-2009. Superposed on the figure are indicated, the latitudinal gravity centre of fish biomass (black solid line), the annual landings (blue solid line) and the El Niño events (vertical hatched bars). Grey bars indicate no surveyed area. Figura 3. Diagramas Hovmöller para la biomasa latitudinal de 1983 a 2009 para la sardina (diagrama superior), caballa (centro) y jurel (diagrama inferior). Superpuestas sobre los diagramas se observan líneas que indican el centro de gravedad latitudinal de la biomasa (líneas de color negro sólido), las capturas anuales (líneas sólidas azules) y la ocurrencia de eventos El Niño (barras achuradas verticales). Las barras grises indican zonas no prospectadas.

Latin American Journal of Aquatic Research
641
Table 2. Trends of distribution, abundance and catches of sardine before, during and after El Niño events since 1983 to 2009. Tabla 2. Tendencias de la distribución, abundancia y capturas de sardina antes, durante y después de eventos El Niño de 1983 a 2009.
Sardine
Niño 1982-1983 1987 1992 1997-1998 2002 Indexes
Level very strong moderated weak very strong weak Overall score
before high medium high medium very low during high medium medium medium - Relative biomass after high mediun high low -
lower after 1992
before central all coast central northern ? northern after 1992 during central all coast all coast central ? Overall latitudinal distribution after central all coast northernward central ? mostly central
before 14°S 7°S 13°S 5°S ? very variable during 13°S 15°S 12°S 11°S ? Gravity center after 12°S 12°S 9°S 8°S ? variable
before central northernward central northernward ? mostly northernward during central southrenward all coast central ? mostly central Overal trend of distribution after central northernward northernward all coast ? mostly northernward
before 1,5 2 2 0,8 0,01 during 1,5 2,5 1,2 1,2 0 Catches (x 10^6 ton) after 3 3,5 1,5 0,5 0
lower after 1992
Note: 2 years before and after ever El Niño event.
centred at 12°S. Jack mackerel was distributed along the entire coast until El Niño 1997-98 to later on being southward and patchy distributed.
DISCUSSION
The results of this study show that in the NHCS the succession of El Niño events can cause sudden and dynamic changes in distribution of pelagic fish stocks though variation of populations abundance are rather slow both when increasing or decreasing depending on the balance among coastal and oceanic habitats. In this regard we updated the acoustic biomass time series on several pelagic stocks to provide information to foresee future scenarios from observing past effects and trends.
The known history The reconstruction we made on the IMARPE’s acoustic historical data (>40 years, since 1966 in the case of anchovy) allowed producing a heuristic vision of pelagic fish population spatiotemporal dynamics of the NHCS (Figs. 2 and 3; Table 5). However there were no extensive surveys on other pelagic fish species to compare with anchovy before 1983 then we
used catches as a proxy of relative abundance between anchovy and SMJ.
The most simple aspect we can see in our data is what has been described many times regarding higher anchovy biomass before 1973, then low to very low biomass after 1982-83, then a recovery and a consolidation process (1992-2001) until a new cycle totally favorable for anchovy since 2002 (Chávez et al., 2003; Alheit & Ñiquen, 2004; Gutiérrez et al., 2007). This includes the observation of SMJ biomass which inversely varied with the one for anchovy. Nevertheless we added new findings regarding South-North trends in changes of the gravity centre of anchovy and SMJ distributions during the studied period to relate them -at an interannual scale- to El Niño events which mostly led to a more southward distribution of all species, although the magnitude of the migration varied according to each event.
In the case of anchovy -although at interdecadal scales it tends to be distributed from south to north since the 1960’s- temporarily migrated toward the central and southern areas during El Niño events in 1967 (weak), 1977 (moderated), 1987 (moderated), and 1997-98 (very strong). However the changes in distribution do not seem to be related to El Niño
Distribution of small pelagic fish off Peru from 1966-2009
642
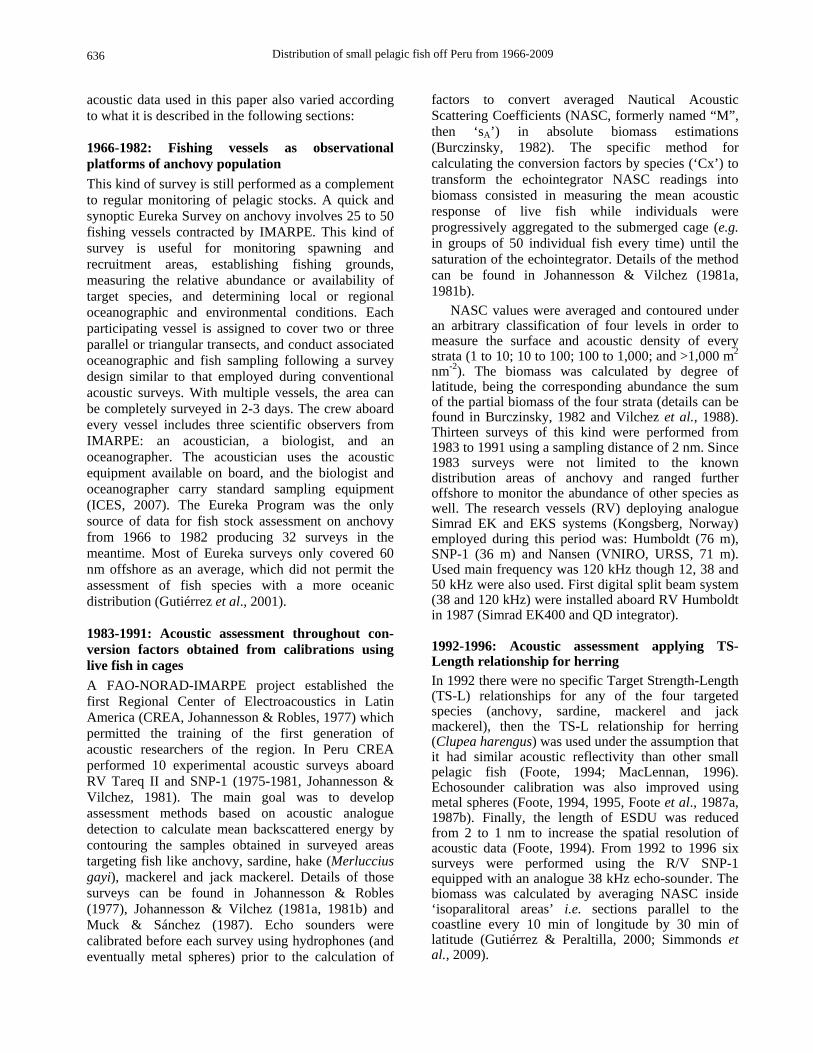
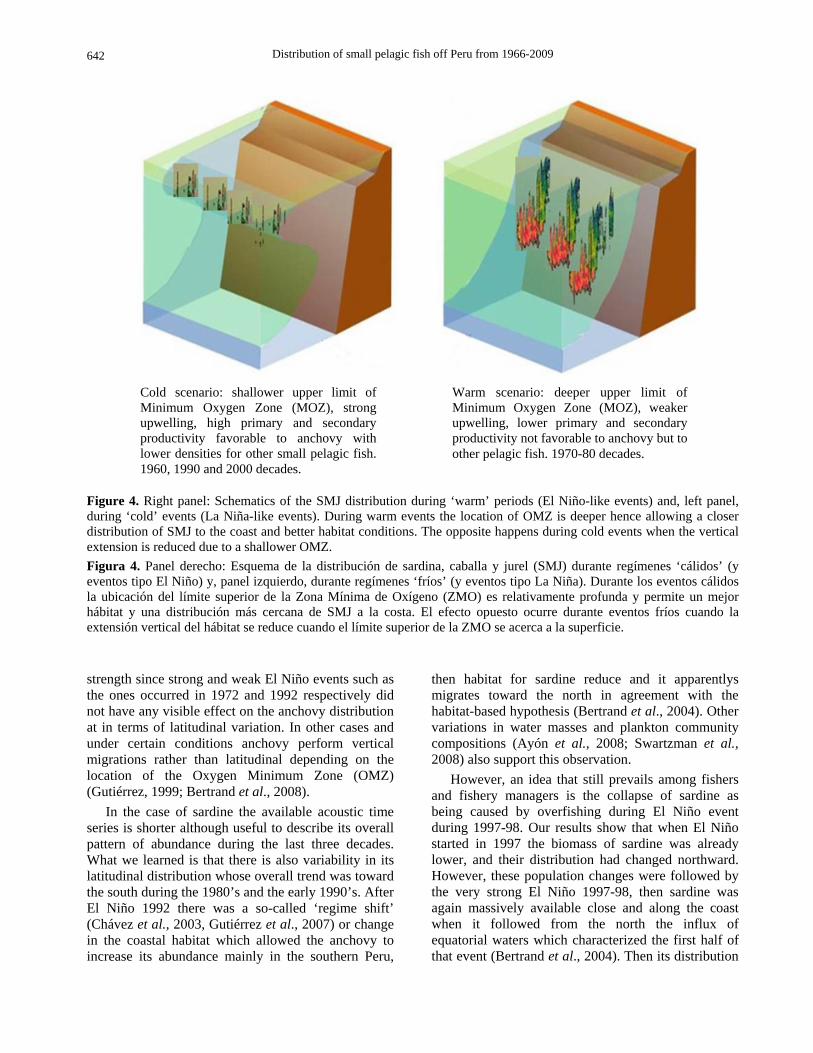
Figure 4. Right panel: Schematics of the SMJ distribution during ‘warm’ periods (El Niño-like events) and, left panel, during ‘cold’ events (La Niña-like events). During warm events the location of OMZ is deeper hence allowing a closer distribution of SMJ to the coast and better habitat conditions. The opposite happens during cold events when the vertical extension is reduced due to a shallower OMZ. Figura 4. Panel derecho: Esquema de la distribución de sardina, caballa y jurel (SMJ) durante regímenes ‘cálidos’ (y eventos tipo El Niño) y, panel izquierdo, durante regímenes ‘fríos’ (y eventos tipo La Niña). Durante los eventos cálidos la ubicación del límite superior de la Zona Mínima de Oxígeno (ZMO) es relativamente profunda y permite un mejor hábitat y una distribución más cercana de SMJ a la costa. El efecto opuesto ocurre durante eventos fríos cuando la extensión vertical del hábitat se reduce cuando el límite superior de la ZMO se acerca a la superficie.
strength since strong and weak El Niño events such as the ones occurred in 1972 and 1992 respectively did not have any visible effect on the anchovy distribution at in terms of latitudinal variation. In other cases and under certain conditions anchovy perform vertical migrations rather than latitudinal depending on the location of the Oxygen Minimum Zone (OMZ) (Gutiérrez, 1999; Bertrand et al., 2008).
In the case of sardine the available acoustic time series is shorter although useful to describe its overall pattern of abundance during the last three decades. What we learned is that there is also variability in its latitudinal distribution whose overall trend was toward the south during the 1980’s and the early 1990’s. After El Niño 1992 there was a so-called ‘regime shift’ (Chávez et al., 2003, Gutiérrez et al., 2007) or change in the coastal habitat which allowed the anchovy to increase its abundance mainly in the southern Peru,
then habitat for sardine reduce and it apparentlys migrates toward the north in agreement with the habitat-based hypothesis (Bertrand et al., 2004). Other variations in water masses and plankton community compositions (Ayón et al., 2008; Swartzman et al., 2008) also support this observation.
However, an idea that still prevails among fishers and fishery managers is the collapse of sardine as being caused by overfishing during El Niño event during 1997-98. Our results show that when El Niño started in 1997 the biomass of sardine was already lower, and their distribution had changed northward. However, these population changes were followed by the very strong El Niño 1997-98, then sardine was again massively available close and along the coast when it followed from the north the influx of equatorial waters which characterized the first half of that event (Bertrand et al., 2004). Then its distribution
Cold scenario: shallower upper limit of Minimum Oxygen Zone (MOZ), strong upwelling, high primary and secondary productivity favorable to anchovy with lower densities for other small pelagic fish. 1960, 1990 and 2000 decades.
Warm scenario: deeper upper limit of Minimum Oxygen Zone (MOZ), weaker upwelling, lower primary and secondary productivity not favorable to anchovy but to other pelagic fish. 1970-80 decades.

Latin American Journal of Aquatic Research
643
Table 3. Trends of distribution, abundance and catches of mackerel before, during and after El Niño events since 1983 to 2009. Tabla 3. Tendencias de la distribución, abundancia y capturas de caballa antes, durante y después de eventos El Niño de 1983 a 2009.
Mackerel
Niño 1982-1983 1987 1992 1997-1998 2002 Indexes
Level very strong moderated weak very strong weak Overall score
before medium medium medium high low during medium medium medium medium low Relative biomass after medium medium high low low
lower after 1992
before all coast all coast all coast northern norhtern northern after 1997 during all coast all coast all coast central central central after 1997 Overall latitudinal
distribution after all coast all coast northern central southern variable
before - 7°S 14°S 6°S 9°S very variable during 11°S 13°S 13°S 10°S 12°S Gravity center after 14°S 10°S 9°S 11°S 16°S variable
before all coast all coast - northernward northernward during all coast all coast - central central Overal trend of
distribution after all coast all coast northernward northernward northernward
northernward after 1992
before 0 0,025 0,015 0,04 0,2 during 0 0,02 0,015 0,32 0,07 Catches (x 10^6
ton) after 0 0,02 0,01 0,25 0,1
mostly low but during 1997-98
Note: 2 years before and after every El Niño event.
Table 4. Trends of distribution, abundance and catches of jack mackerel before, during and after El Niño events since 1983 to 2009. Tabla 4. Tendencias de la distribución, abundancia y capturas de jurel, durante y después de eventos El Niño de 1983 a 2009.
Jack Mackerel
Niño 1982-1983 1987 1992 1997-1998 2002 Indexes
Level very strong moderated weak very strong weak Overall score
before high high high medium medium during high medium high low low Relative
biomass after high high high low low
lower after 1992
before - central southern northern central during central all coast all coast central southern Overall latitudinal
distribution after southern northern northern central southern
variable though tending to south after 1992
before - 9°S 14°S 9°S 11° during 11°S 14°S 13°S 9°S 15°S Gravity center after 13°S 10°S 10°S 12°S 16°S
variable
before - central southernward northernward all coast during central all coast central central southernward Overal trend of
distribution after southernward northernward northernward southernward southernward
variable though tending to south after 1992
before 0,1 0,05 0,12 0,4 0,7 during 0,08 0,05 0,13 0,6 0,15 Catches (x 10^6
ton) after 0,12 0,07 0,15 0,3 0,06
mostly low but before 2002
Note: 2 years before and after every el Niño event.
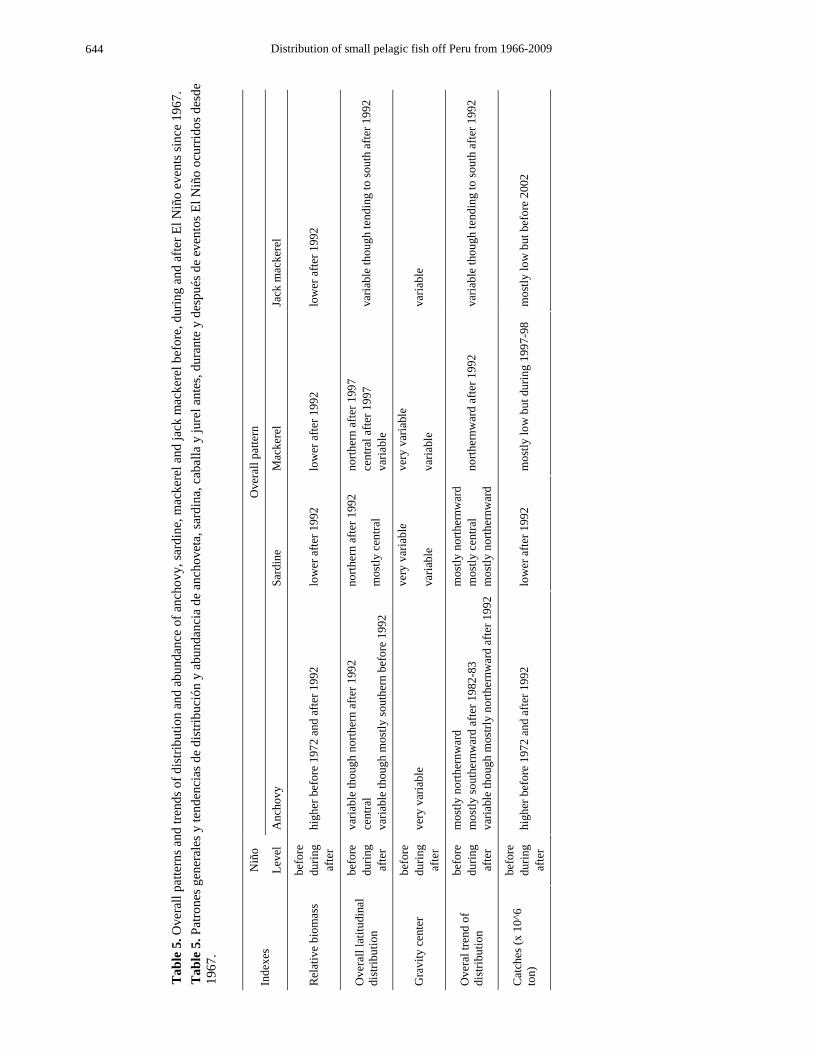
Tab
le 5
. Ove
rall
patte
rns a
nd tr
ends
of d
istri
butio
n an
d ab
unda
nce
of a
ncho
vy, s
ardi
ne, m
acke
rel a
nd ja
ck m
acke
rel b
efor
e, d
urin
g an
d af
ter E
l Niñ
o ev
ents
sinc
e 19
67.
Tab
le 5
. Pat
rone
s gen
eral
es y
tend
enci
as d
e di
strib
ució
n y
abun
danc
ia d
e an
chov
eta,
sard
ina,
cab
alla
y ju
rel a
ntes
, dur
ante
y d
espu
és d
e ev
ento
s El N
iño
ocur
ridos
des
de
1967
.
Niñ
o O
vera
ll pa
ttern
In
dexe
s Le
vel
Anc
hovy
Sa
rdin
e M
acke
rel
Jack
mac
kere
l
befo
re
durin
g R
elat
ive
biom
ass
afte
r hi
gher
bef
ore
1972
and
afte
r 199
2 lo
wer
afte
r 199
2 lo
wer
afte
r 199
2 lo
wer
afte
r 199
2
befo
re
varia
ble
thou
gh n
orth
ern
afte
r 199
2 no
rther
n af
ter 1
992
north
ern
afte
r 199
7 du
ring
cent
ral
cent
ral a
fter 1
997
Ove
rall
latit
udin
al
dist
ribut
ion
afte
r va
riabl
e th
ough
mos
tly so
uthe
rn b
efor
e 19
92
mos
tly c
entra
l va
riabl
e va
riabl
e th
ough
tend
ing
to so
uth
afte
r 199
2
befo
re
very
var
iabl
e ve
ry v
aria
ble
durin
g G
ravi
ty c
ente
r af
ter
very
var
iabl
e va
riabl
e va
riabl
e va
riabl
e
befo
re
mos
tly n
orth
ernw
ard
mos
tly n
orth
ernw
ard
durin
g m
ostly
sout
hern
war
d af
ter 1
982-
83
mos
tly c
entra
l O
vera
l tre
nd o
f di
strib
utio
n af
ter
varia
ble
thou
gh m
ostrl
y no
rther
nwar
d af
ter 1
992
mos
tly n
orth
ernw
ard
north
ernw
ard
afte
r 199
2 va
riabl
e th
ough
tend
ing
to so
uth
afte
r 199
2
befo
re
durin
g C
atch
es (x
10^
6
ton)
af
ter
high
er b
efor
e 19
72 a
nd a
fter 1
992
low
er a
fter 1
992
mos
tly lo
w b
ut d
urin
g 19
97-9
8 m
ostly
low
but
bef
ore
2002
Distribution of small pelagic fish off Peru from 1966-2009
644

Latin American Journal of Aquatic Research
645
overlapped with anchovy and consequently was caught by fishing vessels. Catches amounted to 0.784 and 1,202 ton during 1997 and 1998 respectively though exclusively juveniles of ages 1, 2 and 3 (12, 19 and 21 cm) (IMARPE, 1999). Then we wonder about the adult stock of sardine which was not observed during and after El Niño 1997-98. We sustain that (as in Bertrand et al., 2004) that acoustic surveys were unable to assess the bigger part of the area of distribution of sardine, which was apparently underestimated by a displacement westward before El Niño 1997-98, then out of reach of research vessels. In addition we hypothesize that the collapse of sardine is due to a massive die-off of the adult stock during that El Niño, and just in third place by the overfishing of the juvenile stock during the event. That collapse is also observed -though to a lesser extent- in relation to mackerel and jack mackerel.
The hidden history However the case of mackerel and jack mackerel (MJ) has a different fishery forcing. Their catches are absolutely not related with actual biomass: much higher biomass before 1997-98 but very low catches because of no dedicated fishery, which were by then almost exclusively focused on anchovy and sardine. The reason for this is due to the fact that the MJ fishery had just developed since mid the 1990’s when the abundance of these species was decreasing according to what we see in our data. Then in this case catch data is not a good proxy of fish biomass even for the large scale patterns. Another aspect we found is that the distribution patterns of MJ are mainly oceanic and very similar with the one of sardine. Therefore SMJ were all probably affected by the same environmental forcing, so their ability to cope with new environmental conditions and amplified coastal habitat were not as effective as the ones of anchovy regarding a shallower Minimum Oxygen Zone (MOZ) since the late 1990’s which also reduced the vertical extent of the pelagic habitat range (Bertrand, et al., 2011). On the other hand, after 1992 (when a slow recovery of anchovy was evident), acoustic surveys on pelagic fish stocks were mostly planned to favor the assessment of the area where anchovy population distributed, then variable portions of the SMJ populations were often left out of the surveyed area (Bertrand et al., 2004), biasing at some extent the acoustic assessment of those stocks. Besides, during the last decade it has increased the fishery exploitation on jack mackerel which is still unregulated in the high seas. The effects of this international fishing fleet can also account for the apparent collapse of jack mackerel (SPRFMO, 2009).
Environmental changes: a synthesis During the second half of the 1970’s and during the 1980’s weaker upwelling was noticed which reduced the volume of the Coastal Cold Waters (CCW) habitat whilst Subtropical Surface Water (SSW) distributed closer to the coast (Swartzman et al., 2008). SMJ biomass would have increased as a consequence of wider habitat while anchovy abundance reduced as the volume of its habitat and availability of prey did (Bertrand et al., 2004; Ayón et al., 2008).
Ayón et al. (2008) showed the reduced biovolume of zooplankton during the 1970’s and 1980’s to propose the theory of a bottom up forcing on the population dynamics and abundance of anchovy. Then anchovy progressively recovered since the early 1990’s though just after the El Niño 1997-98 there was also an expansion of CCW toward the north which was explained by stronger trade winds and upwelling (as well as colder temperatures as during the 1960’s when anchovy fishery boomed). Consequently anchovy biomass increased following its northward habitat amplification (Chávez et al., 2008). After El Niño 2002 the anchovy population entered into an ideal environmental regime (Chávez et al., 2008) with habitat conditions characterized by reduced vertical habitat due to a shallower OMZ (Bertrand et al., 2011).
Then the environmental conditions prevailing since El Niño 1997-98 (though very especially after El Niño 2002) conduced to a “full anchovy era” (Gutiérrez et al., 2007) characterized by a collapse of sardine and a reduced abundance of MJ in the NHCS. As shown in this paper it is always expected to observe temporal variations in the coastal habitat range due to El Niño-like events which might produce good SMJ fishing seasons every now and then but, for a sustained distribution of SMJ within Peruvian EEZ, long term physical conditions would have to change as described by Bakun & Weeks (2008) by weakening the coastal upwelling (which in turn would be negative for anchovy). Figure 4 is a schematic view to two scenarios or conditions to be fulfilled on the vertical structure of the water column to be consistently and continuously observed to conduce to the dominance of anchovy (left) or SMJ (right) in the ecosystem.
CONCLUSIONS
The variations we observed in the NHCS regarding latitudinal acoustic biomass and abundance of anchovy (A) and sardine, mackerel and jack mackerel (SMJ) are related to the succession of El Niño events. In most of the cases during 1966 to 2009 the
Distribution of small pelagic fish off Peru from 1966-2009
646
distribution of all species was different before and after an El Niño, though there is no categorical relationship between El Niño strength and the magnitude of the changes it produced. When anchovy biomass increased the SMJ populations appear with a patchy distribution and lower densities as an effect of the expansion of the upwelling and shallower location of the OMZ which reduces the vertical habitat for SMJ, hence affecting their population levels.
Therefore we concluded that: a) every El Niño event has had an effect on the expansion or contraction of pelagic species distribution and abundance, with different latitudinal effects; and b) the El Niño 1997-98 did not trigger but accelerated a decline phase on the abundance of sardine, jack mackerel and mackerel by a reduction of their ideal habitat due to an expansion of the coastal ecosystem caused by a shallower location of the upper limit of the Oxygen Minimum Zone (OMZ). These findings observed using past data might be taken into consideration for fishery management purposes when considering future scenarios.
ACKNOWLEDGEMENTS
We cordially thank Dr. Arnaud Bertrand from IRD-IMARPE for his valuable comments and positive criticism of the manuscript. We also thank the Executive Staff of IMARPE and The GEF-Humbolt Project for the facilities provided to the first author to direct the study we present here as a contribution to pelagic fish research in the frame of the development of his doctoral thesis.
REFERENCES
Alheit, J. & M. Ñiquen. 2004. Regime shifts in the Humboldt Current ecosystem. Prog. Oceanogr., 60: 201-222.
Arntz, W.E. & E. Fahrbach. 1996. El Niño: experimento climático de la naturaleza. Fondo de Cultura Económica, Mexico City, 312 pp.
Ayón, P., G. Swartzman, A. Bertrand, M. Gutiérrez & S. Bertrand. 2008. Zooplankton and forage fish species off Peru: large-scale bottom-up forcing and local-scale depletion. Progr. Oceanogr., 79: 208-214.
Ayón, P., G. Swartzman, P. Espinoza & A. Bertrand. 2011. Long term changes in zooplankton size distribution in the Peruvian Humbolt Current System: conditions favouring sardine or anchovy. Ma. Ecol. Progr. Ser., 422: 211-222.
Bakun, A. & K. Broad. 2003. Environmental loopholes and fish population dynamics: comparative pattern
recognition with particular focus on El Niño effects in the Pacific. Fish. Oceanogr., 12: 458-473.
Bakun, A. & S. Weeks. 2008. The marine ecosystem off Peru: What are the secrets of its fishery productivity and what might its future hold? Progr. Oceanogr., 79: 290-299.
Bertrand, A., A. Chaigneau, S. Peraltillo, J. Ledesma, M. Graco, F. Monetti & F.P. Chávez. 2011. Oxygen, a fundamental property regulating pelagic ecosystem structure in the coastal southeastern tropical Pacific. Plos One, 6(12): e29558.
Bertrand, A., M. Segura, M. Gutiérrez & L. Vásquez. 2004. From small-scale habitat loopholes to decadal cycles: a habitat-based hypothesis explaining fluctuation in pelagic fish populations off Peru. Fish Fish., 5: 296-316.
Bertrand, A., F. Gerlotto, S. Bertrand, M. Gutiérrez, L. Alza, A. Chipollini, E. Díaz, P. Espinoza, J. Ledesma, R. Quesquén, S. Peraltilla & F. Chávez. 2008. Schooling behaviour and environmental forcing in relation to anchoveta distribution: an analysis across multiple spatial scales. Progr. Oceanogr., 79: 264-277.
Bez, N. 1997. Statistiques individuelles et géostatistique transitive en écologie halieutique. Thése, Ecole Nationale Spérieure des Mines de Paris, 303 pp.
Burczynski, J. 1982. Introduction to the use of sonar systems for estimating fish biomass. FAO Fish. Tech. Pap., 191(Rev. 1): 89 pp.
Castillo, P., S. Peraltilla & M. Gutiérrez. 2009. Biomasa de anchoveta y otros recursos pelágicos estimados por el método hidroacústico a finales del invierno 2005. Inf. Inst Mar Perú, 35(2): 145-152.
Chávez, F., A. Bertrand, R. Guevara-Carrasco, P. Soler & J. Csirke. 2008. The northern Humboldt Current System: brief history, present status and a view towards the future. Progr. Oceanogr., 79: 95-105.
Chávez, F.P., J. Ryan, S.E. Lluch-Cota & M. Ñiquen. 2003. From anchovies to sardines and back: multidecadal change in the Pacific Ocean. Science, 299: 217-221.
Csirke, J., R. Guevara, G. Cardenas, M. Ñiquen & A. Chipollini. 1996. Situación de los recursos anchoveta (Engraulis ringens) y sardina (Sardinops sagax) a principios de 1994 y perspectivas para la pesca en el Perú, con especial referencia a la región norte-centro de la costa peruana. Bol. Inst. Mar Perú, 15: 1-23.
Dragesund, O. & S. Olsen. 1965. On the possibility of estimating year-class strength by measuring echo-abundance of 0-group fish. FiskDir. Skr. Ser. Havunders, 13: 47-75.

Latin American Journal of Aquatic Research
647
Fernandes, P., F. Gerlotto, D.V. Holliday, O. Nakken & J. Simmonds. 2001. Acoustic applications in fisheries science: the ICES contribution. ICES J. Mar. Sci., 215: 483-492.
Foote, K.G. 1987a. Fish target strength for use in echointegrator surveys. J. Acoust. Soc. Am., 82: 981-987.
Foote, K.G. 1994. Technical memorandum: tasks for the IMARPE acoustics group, May-October 1994. Proyecto FAO-IMARPE TCP/PER/4451 “Ordena-ción de la Pesquería”. Mimeo, 5 pp.
Foote, K.G. 1995. Informe técnico: examen de los métodos de evaluación acústica y de los resultados de los últimos cruceros de evaluación acústica de especies pelágicas realizados en el Perú. Proyecto FAO-IMARPE TCP/PER/4451 “Ordenación de la Pesquería”. Mimeo, 21 pp.
Foote, K.G., H.P. Knudsen, G. Vestnes, D.N. MacLennan & E.J. Simmonds. 1987b. Calibration of acoustic instruments for fish density estimation: a practical guide. Coop. Res. Rep., Int. Council Explor. Sea, 144: 57 pp.
Gutiérrez, M. 2001b. Estimados de biomasa hidroa-cústica de los cuatro principales recursos pelágicos en el Mar Peruano durante 1983-2001. Bol. Inst. Mar Perú, 19(1-2): 139-158.
Gutiérrez, M. 2001c. Efectos del evento El Niño 1997-98 sobre la distribución y abundancia de anchoveta (Engraulis ringens). In: J. Tarazona, W.E. Arnts & E. Castillo de Maruenda (eds.). El Niño en América Latina: impactos biológicos y sociales. Consejo Nacional de Ciencia y Tecnología, Lima, Perú, pp. 55-72.
Gutiérrez, M. & D. MacLennan. 1998. Resultados preliminares de las mediciones de fuerza de blanco in situ de las principales especies pelágicas. Crucero 9803-05. Inf. Inst. Mar Perú, 135: 16-20.
Gutiérrez, M. & S. Peraltilla. 2000. Aplicación de un Sistema de Información Geográfica y de la carta electrónica isoparalitoral en las evaluaciones hidroacústicas de la biomasa de recursos pesqueros en el mar peruano. Inf. Inst. Mar Perú, 146: 25-29.
Gutiérrez, M., N. Herrera & D. Marín. 1999. Distribución y abundancia de anchoveta y otras especies pelágicas entre los eventos El Niño de 1982-83 y 1997-98. Bol. IMARPE, 18(1-2): 77-88.
Gutiérrez, M., S. Peraltilla & N. Herrera. 2001a. Las Operaciones Eureka: una aproximación a la abundancia de anchoveta en el período 1966-1982. Bol. Inst. Mar Perú, 19(1-2): 83-102.
Gutiérrez, M., G. Swartzman, A. Bertrand & S. Bertrand. 2007. Anchovy and sardine spatial dynamics and
aggregation patterns in the Humboldt Current ecosystem, Peru, from 1983 to 2003. Fish. Oceanogr., 16: 155-168.
International Council for the Exploration of the Sea (ICES). 2007. Collection of acoustic data from fishing vessels. ICES Coop. Res. Rep., 287: 83 pp.
Instituto del Mar del Perú (IMARPE). 1999. Memoria Anual 1998, Callao-Perú, 90 pp.
Johannesson, K. & A. Robles. 1977. Echo surveys of Peruvian anchoveta. Rapp. P.-V. Réun. Cons. Int. Explor. Mer., 170: 237-244.
Johannesson, K. & R. Vilchez. 1981a. Application and some results of echo-integration methods of monitoring Peruvian anchovy resources. In: J. Suomala (ed.). Meeting on hydroacoustical methods for the estimation of marine fish populations, 25-19 June, 1979. Charles Stark Draper Laboratory Inc. Cambridge, MA. Vol. 2b: pp. 756-816.
Johannesson, K. & R. Vilchez. 1981b. Note on hydroacoustic observations of changes in duistribution and abundance of some common pelagic fish species in the coastal waters of Peru, with emphasis on anchoveta. IOC Workshop Rep., 28: 287-323.
MacLennan, D.N. 1997. Informe sobre la visita al Instituto del Mar del Perú (IMARPE). Programa de Cooperación Técnica para la Pesca CEE-VECEP ALA 92/43. Mimeo, 22 pp.
MacLennan, D.N. 1998. Revisión de los resultados obtenidos durante el Crucero 9803-05 de evaluación hidroacústica de recursos pelágicos. Inf. Inst. Mar Perú, 135: 191-201.
MacLennan, D.N. 1999. Review of the acoustic surveys conducted by the Instituto del Mar del Perú (IMARPE) in Peruvian coastal waters during 1998 and 1999. Programa de Cooperación Técnica para la Pesca CEE-VECEP ALA 92/43. Mimeo, 24 pp.
MacLennan, D.N. & A. Menz. 1996. Interpretation of in situ target strength data. ICES J. Mar. Sci., 53: 267-271.
Moron, A. 2000. Características del ambiente marino frente a la costa peruana. Bol. Inst. Mar Perú, 19(1-2): 179-204.
Muck, P. & G. Sánchez. 1987. The importance of mackerel and horse mackerel predation for the peruvian anchoveta stock (a population feeding model). In: D. Pauly & I. Tsukayama (eds.). The Peruvian anchoveta and its upwelling ecosystem: 3 decades of change. ICLARM Studies and Reviews N°15. IMARPE-GTZ-ICLARM: 276-293.
Ñiquen, M., M. Espino & M. Bouchon. 2000. Análisis de la población de anchoveta durante el periodo 1961-1999. Bol. Inst. Mar Perú, 19(1-2): 103-108.
Distribution of small pelagic fish off Peru from 1966-2009
648
Pauly, D. & I. Tsukayama (eds.) 1987. The Peruvian anchoveta and its upwelling ecosystem: three decades of change. ICLARM Studies and Reviews, 15: 351 pp.
Scherbino, M. & M.D. Truskanov. 1966. Determination of fish concentration by means of acoustic apparatus. ICES CM 1966/F3: 6 pp.
Simmonds, E.J. & D.N. MacLennan. 2005. Fisheries acoustics, theory and practice. Blackwell Science, 472 pp.
Simmonds, J., M. Gutiérrez, A. Chipollini, F. Gerlotto, M. Woillezand & A. Bertrand. 2009. Optimizing the design of acoustic surveys of Peruvian anchoveta. ICES J. Mar. Sci., 66(6): 1341-1348.
South Pacific Regional Fisheries Management Organi-zation (SPRFMO). 2009. Report of the Science Working Group, Auckland, New Zealand, 2-6 November 2009: http://www.southpacificrfmo.org Revised 10/dec/2010.
Received: 20 January 2011; Accepted: 11 May 2012
Swartzman, G., A. Bertrand, M. Gutiérrez, S. Bertrand & L. Vásquez. 2008. The relationship of anchovy and sardine to water masses in the Peruvian Humboldt Current System from 1983-2005. Progr. Oceanogr., 79: 228-237.
Valdivia, J.E. 1978. The anchoveta and El Niño. Rapp. P.-V. Réun. Cons. Int. Explor. Mer, 173: 196-202.
Venema, S. 1992. Successes and failures of fisheries acoustics in developing countries. Fish. Res., 14(2-3): 143-158.
Vílchez, R., P. Muck & A. Gonzales. 1988. Variaciones en la biomasa y en la distribución de los principales recursos pelágicos del Perú entre 1983 y 1987. In: H. Salzwedel & A. Landa (eds.). Recursos y dinámica del ecosistema de afloramiento peruano. Bol. Inst. Mar Perú, Volumen Extraordinario, pp. 255-264.
Villanueva, R. 1971. The Peruvian Eureka Programme of rapid acoustic survey. Modern fishing gear of the world. H. Kristjonsson, London, Fishing News Books, 3: 20-24.
Zuta, S. & O.G. Guillén. 1970. Oceanografía de las aguas costeras del Perú. Bol. Inst. Mar Perú, 2: 157-324.