trends in reproductive behavior in rwanda · trends in reproductive behavior in rwanda further...
TRANSCRIPT

Trends in Reproductive Behavior in Rwanda
Further Analysis of the 2014-15 Rwanda Demographic and Health Survey
DHS Further Analysis Reports No. 107

Republic of Rwanda
Trends in Reproductive Behavior in Rwanda:
Further Analysis of the 2014-15 Demographic and Health Survey
DHS Further Analysis Reports No. 107
Charles F. Westoff1
ICF Rockville, Maryland, USA
January 2018
1Office of Population Research, Princeton University

This report presents findings from a further analysis undertaken as part of the follow-up to the 2014-15 Rwanda Demographic and Health Survey (RDHS). ICF provided technical assistance for the project. This report is a publication of The DHS Program, which is designed to collect, analyze, and disseminate data on fertility, family planning, maternal and child health, nutrition, and HIV/AIDS. Funding was provided by the U.S. Agency for International Development (USAID) through the DHS Program (#AID-OAA-C-13-00095). The opinions expressed here are those of the authors and do not necessarily reflect the views of USAID and other cooperating agencies.
The Rwanda Demographic and Health Survey 2014-15 (2014-15 RDHS) was implemented by the National Institute of Statistics of Rwanda (NISR) from November 9, 2014, to April 8, 2015. The funding for the RDHS was provided by the government of Rwanda, the United States Agency for International Development (USAID), the One United Nations (One UN), the Global Fund to Fight AIDS, Tuberculosis and Malaria (Global Fund), World Vision International, the Swiss Agency for Development and Cooperation (SDC), and the Partners in Health (PIH). ICF provided technical assistance through The DHS Program, a USAID-funded project providing support and technical assistance in the implementation of population and health surveys in countries worldwide.
Additional information about the 2014-15 RDHS may be obtained from the National Institute of Statistics of Rwanda, 6139 Kigali, Rwanda; Telephone: +250 252 571035; Fax: +250 252 570705; Email: [email protected]; Internet: www.statistics.gov.rw.
Additional information about The DHS Program can be obtained from ICF, 530 Gaither Road, Suite 500, Rockville, MD 20850 USA; Telephone: 301-572-0200, Fax: 301-572-0999, E-mail: [email protected], Internet: www.DHSprogram.com.
Suggested citation:
Westoff, Charles F. 2017. Trends in Reproductive Behavior in Rwanda: Further Analysis of the 2014-15 Demographic and Health Survey. DHS Further Analysis Reports No. 107. Rockville, Maryland, USA: ICF.

iii
CONTENTS
TABLES .......................................................................................................................................... v
FIGURES ........................................................................................................................................ v
MAPS ............................................................................................................................................ vi
ABSTRACT ................................................................................................................................. vii
INTRODUCTION .......................................................................................................................... 1
TRENDS .......................................................................................................................................... 3
MARRIAGE ........................................................................................................................ 3 FERTILITY ......................................................................................................................... 5 COVARIATES .................................................................................................................... 7 TEENAGE FERTILITY ..................................................................................................... 8 REPRODUCTIVE PREFERENCES .................................................................................. 8 CHILD MORTALITY ...................................................................................................... 14 BIRTH INTERVALS ........................................................................................................ 16 FERTILITY SIMULATIONS ........................................................................................... 16 FAMILY PLANNING ...................................................................................................... 19 UNMET NEED ................................................................................................................. 20 RELIGION ........................................................................................................................ 22
SUMMARY AND CONCLUSIONS ........................................................................................... 23
REFERENCES ............................................................................................................................. 25

v
TABLES
Table 1 Trends in the percentage of women in union (married or living together), Rwanda DHS 2014-15 ..................................................................................................3
Table 2 Mean number of children desired by men, by current number of children, Rwanda DHS 2014-15 ..................................................................................................9
Table 3 Trends in the percentage of currently married women and men who want no more children, by number of living children, Rwanda DHS 2014-15 ........................10
Table 4 Covariates of reproductive preferences, among currently married women and men, Rwanda DHS 2014-15 .......................................................................................11
Table 5 Covariates of the number of children desired (standardized partial regression coefficients), Rwanda DHS 2014-15 ..........................................................................12
Table 6 Odds ratios of married women and married men wanting no more children, Rwanda DHS 2014-15 ................................................................................................13
Table 7 Total wanted fertility and unwanted fertility rates for the 3 years before the survey, Rwanda DHS 2014-15 ...................................................................................14
Table 8 Trends in family planning, Rwanda DHS 2014-15.....................................................21 FIGURES
Figure 1 Association between age at marriage and percentage of women with no schooling, by district, Rwanda DHS 2014-15 ..............................................................4
Figure 2 Association between age at marriage and the number of children ever born for districts, Rwanda DHS 2014-15 ...................................................................................5
Figure 3 Trends in total fertility rates: Countries in East and Southern Africa, Rwanda DHS 2014-15 ................................................................................................................6
Figure 4 The relationship between the total fertility rates in 2015 and 2010, Rwanda DHS 2014-15 ................................................................................................................7
Figure 5 Trends in the mean number of children desired between 2000 and 2015, by age of women, Rwanda DHS 2014-15 .........................................................................9
Figure 6 Association of schooling with child mortality, Rwanda DHS 2014-15 ......................15 Figure 7 Estimated reductions in the number of children ever born to ever-married
women age 15-49, with an assumed increase in age at marriage and with more than 4 years of schooling, and with decreases in child mortality, Rwanda DHS 2014-15 ................................................................................................17
Figure 8 Estimated number of children ever born to ever-married women age 40-49, with assumed increases in age at marriage and in years of schooling and with decreases in child mortality, Rwanda DHS 2014-15 ..................................................18
Figure 9 Estimated number of children ever born to ever-married men 15-59 and 45-59, with assumed increases in age at marriage and increases in schooling and decreases in child mortality, Rwanda DHS 2014-15 ..................................................19

vi
MAPS
Map 1 District variation in age at marriage, Rwanda DHS 2014-15 .......................................4 Map 2 Number of children desired, Rwanda DHS 2014-15 ....................................................8 Map 3 Changes in child mortality, Rwanda DHS 2014-15 ....................................................15 Map 4 Changes in contraceptive use, Rwanda DHS 2014-15 ...............................................20 Map 5 Unmet need for family planning, Rwanda DHS 2014-15 ...........................................21

vii
ABSTRACT
This report, based largely on the 2014-15 national survey in Rwanda, focuses on changes and trends in reproductive behavior since 2010. In the 4-5 years after the 2010 survey, fertility continued its decline to 4.2 births per woman as contraceptive prevalence increased slightly. However, the earlier downward trend in number of children desired appears stalled. This is clearly evident from an increase in the proportions of married women and men who say they want more children. Child mortality has significantly declined and remains strongly related to fertility; while age at marriage has continued to increase. The demographic goals specified in the 1998-99 plan for development, Rwanda Vision 2020, appear on track, but the annual rate of population growth remains high, currently 2.5%, because fertility is high. Furthermore, large numbers of young people are now entering their child-bearing years. Although most trends seem encouraging, especially compared with other countries in sub-Saharan Africa, significant population growth is expected in Rwanda, from 12 to 16 million people by 2030, and to 22 million people by mid-century, even with assumed reductions of fertility.


1
INTRODUCTION
This is a continued analysis of the national demographic and health survey conducted in Rwanda in 2014-15 (National Institute of Statistics 2015). The focus is reproductive behavior, and more specifically, marriage, fertility, preferences about the number of children, family planning, their covariates, and recent trends. The analysis emphasizes changes since the earlier surveys in 2010 and 2005. A similar analysis was undertaken after the 2010 survey (Westoff et al. 2013; Westoff 2012).
In 2015, the population of Rwanda was almost 12 million with a 2.5% annual rate of natural increase. This high rate of growth with its negative implications for socioeconomic development came to the attention of the parliament and the president in 2005 and resulted in a strong program of family planning (Solo 2008; Madsen 2011). The use of modern contraception by married couples increased dramatically from 10% in 2005 to 48% by 2015, while the fertility rate fell from 6.1 births per woman to 4.2 over the same 10-year period. Child mortality rates have dropped by two-thirds since 2005. These trends reflect Rwanda’s extensive health care system that covers over 90% of the population and which prompted a complimentary review in the New York Times that suggested Rwanda’s system was a model for the United States. In a review of Rwanda’s economic and demographic situation for the World Bank, May and Kamurase concluded that the “Government of Rwanda has understood the demographic challenge to an extent that has seldom been seen in other sub-Saharan countries” (2009).
The recognition of family planning efforts in Rwanda contributed to the selection of Rwanda as the site for the November 2018, 5th International Conference on Family Planning. Experience in Rwanda supports the view that “a strong family planning program can remove persistent socioeconomic and cultural barriers and enable a massive, popular contraceptive uptake” (Muhanga et al. 2016).
Despite these developments, the prospect of further population growth in Rwanda remains a challenge. Recent projections by the United Nations (World Population Prospects 2017) project the population to grow from 12 to 16 million by 2030 and to 22 million by 2050. These projections reflect the “medium variant” of the projected total fertility rate (TFR), which is assumed to decline from 4.2 in 2015 to 3.1 in 2025-2030 and to 2.4 by 2045-2050. The amount of growth is determined by the birth rate and death rate as well as by population momentum, which reflects past high fertility and increases in the future number of potential parents.

3
TRENDS
MARRIAGE
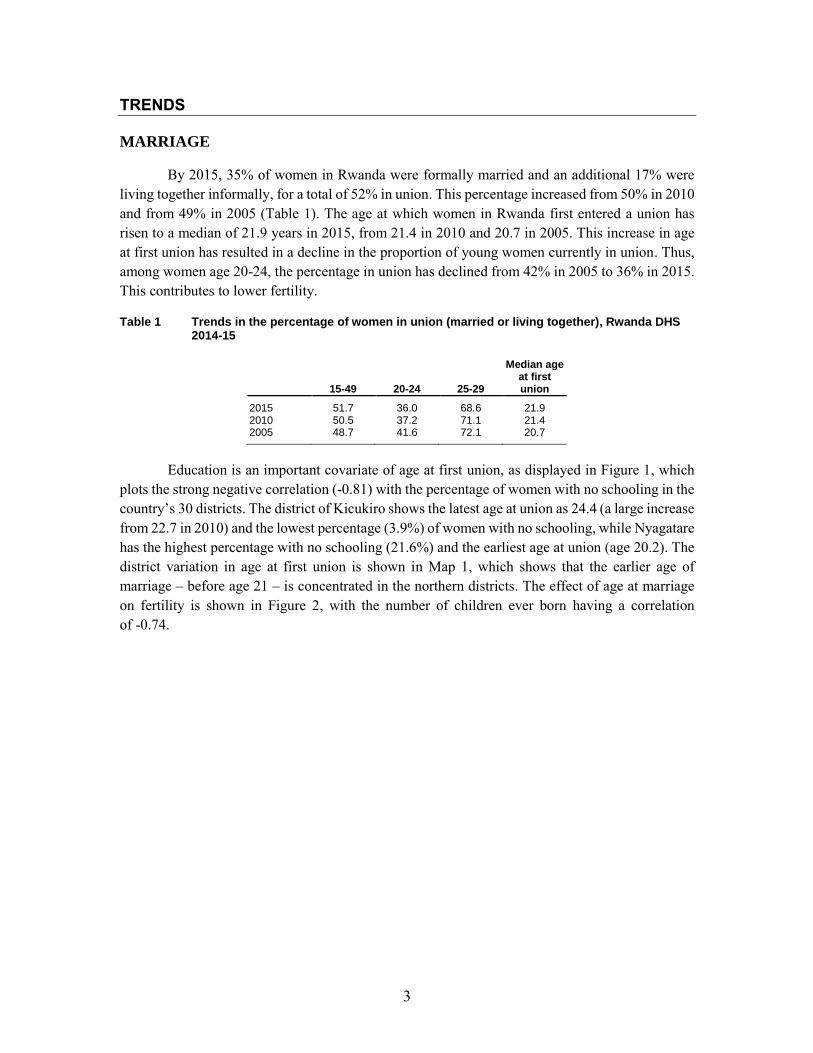
By 2015, 35% of women in Rwanda were formally married and an additional 17% were living together informally, for a total of 52% in union. This percentage increased from 50% in 2010 and from 49% in 2005 (Table 1). The age at which women in Rwanda first entered a union has risen to a median of 21.9 years in 2015, from 21.4 in 2010 and 20.7 in 2005. This increase in age at first union has resulted in a decline in the proportion of young women currently in union. Thus, among women age 20-24, the percentage in union has declined from 42% in 2005 to 36% in 2015. This contributes to lower fertility.
Table 1 Trends in the percentage of women in union (married or living together), Rwanda DHS 2014-15
15-49 20-24 25-29
Median age at first union
2015 51.7 36.0 68.6 21.9 2010 50.5 37.2 71.1 21.4 2005 48.7 41.6 72.1 20.7
Education is an important covariate of age at first union, as displayed in Figure 1, which
plots the strong negative correlation (-0.81) with the percentage of women with no schooling in the country’s 30 districts. The district of Kicukiro shows the latest age at union as 24.4 (a large increase from 22.7 in 2010) and the lowest percentage (3.9%) of women with no schooling, while Nyagatare has the highest percentage with no schooling (21.6%) and the earliest age at union (age 20.2). The district variation in age at first union is shown in Map 1, which shows that the earlier age of marriage – before age 21 – is concentrated in the northern districts. The effect of age at marriage on fertility is shown in Figure 2, with the number of children ever born having a correlation of -0.74.

4
Figure 1 Association between age at marriage and percentage of women with no schooling, by district, Rwanda DHS 2014-15
Map 1 District variation in age at marriage, Rwanda DHS 2014-15

5
Figure 2 Association between age at marriage and the number of children ever born for districts, Rwanda DHS 2014-15
FERTILITY
The total fertility rate (TFR) in Rwanda has continued to decline from 6.1 births per woman in the 3 years before 2005 to 4.2 births per woman in 2014-15. A comparison with 10 other countries in Eastern and Southern Africa shows similar patterns of decline (Figure 3), although only Kenya has a TFR that is substantially lower (3.7) than Rwanda (4.2). Five of these countries still show rates above 5.0 births per woman. A new study that estimated recent fertility from adjusted current pregnancy data (Westoff 2017) places Rwanda and Kenya at the lowest level among the 11 countries shown in Figure 3.
The age pattern of the fertility decline in Rwanda shows a similar picture at each age group except 15-19, which has changed little in recent years. The median age at first birth for women increased from 22.0 in 2005 to 22.7 in 2014-15. The mean number of children ever born to women by the end of their childbearing years (age 45-49) in 2014-15 was 5.8, although this number is expected to drop considerably in coming years. The mean was 7.0 in 2005 and 6.4 in 2010.
The relationship between the TFRs in 2010 and 2015 is shown by district in Figure 4, with a correlation of 0.69. A parallel picture of mean number of children ever born to women age 15-49 (not shown) has a correlation of 0.76.

6
Fig
ure
3
Tre
nd
s in
to
tal fe
rtilit
y r
ate
s:
Co
un
trie
s in
East
an
d S
ou
thern
Afr
ica
, R
wan
da D
HS
201
4-1
5
6.1
6.0
5.2
4.8
4.1
Mad
agas
car
6.9
6.4
6.1
2.0
2.4
2.8
3.2
3.6
4.0
4.4
4.8
5.2
5.6
6.0
6.4
6.8
7.2
7.6
8.0
Bu
run
di
6.7
5.4
4.7
4.9
4.6
3.7
Ke
nya
6.7
6.3
6.0
5.7
4.4
Mal
awi
5.2
5.5
5.9
Mo
zam
biq
ue
5.5
5.4
4.8
4.6
Eth
iop
ia
5.8
6.1
5.5
4.6
4.2
2.0
2.4
2.8
3.2
3.6
4.0
4.4
4.8
5.2
5.6
6.0
6.4
6.8
7.2
7.6
8.0
Rw
and
a
6.2
5.8
5.6
5.7
5.4
5.2
Tan
zan
ia
7.4
6.9
6.9
6.7
5.7
Uga
nd
a
6.5
6.1
5.9
6.2
5.3
Zam
bia
5.4
4.3
4.0
3.8
4.1
4.0
Zim
bab
we

7
Figure 4 The relationship between the total fertility rates in 2015 and 2010, Rwanda DHS 2014-15
COVARIATES
The objective of the analysis is to evaluate the relative importance of different determinants of fertility that are subjected to similar examination. For example, age at marriage is related to the number of children ever born, the covariates of which can be studied. The main determinant of age at marriage is education, as described previously. The following analysis identified five measures, based on multiple regression analysis of the number of children ever born to currently married women age 15 to 49. This analysis utilized the sample of individual women. The results show the comparative statistical importance of each variable in the form of standardized partial regression coefficients:
Covariates 2015 2010 2005
Total number of children desired .126 .124 .092 Percent want no more children .199 .220 .173 Mean age at marriage -.260 -.240 -.238 Number of child deaths .260 .265 .278 Ever used contraception .083 .062 .059 Age of woman .509 .504 .586 R2 .774 .779 .771 Number of married women 6,800 6,583 5,285
All coefficients are significant beyond the .001 level. In 2015, these collectively explain
77% of the variance of the number of children ever born to currently married women. The age of women is included as a control. Without the age variable, 64% of the total variance is explained.
8
The results indicate the roughly equal predictive importance for fertility of the “want no more children” measure, age at marriage, and child mortality. When the equation is reduced to these three predictors and age, little is lost because the proportion of the variance of fertility that is explained declines only slightly, to 75%. The same equations, shown for the 2010 and 2005 surveys, give similar results.
TEENAGE FERTILITY
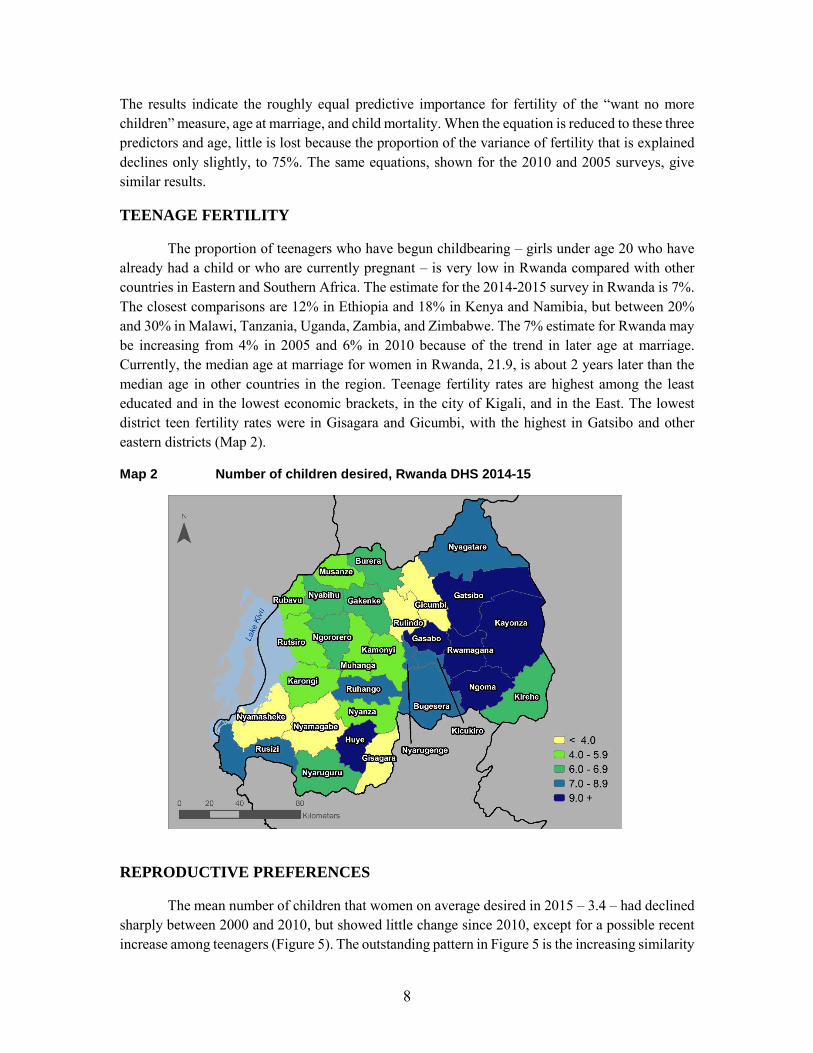
The proportion of teenagers who have begun childbearing – girls under age 20 who have already had a child or who are currently pregnant – is very low in Rwanda compared with other countries in Eastern and Southern Africa. The estimate for the 2014-2015 survey in Rwanda is 7%. The closest comparisons are 12% in Ethiopia and 18% in Kenya and Namibia, but between 20% and 30% in Malawi, Tanzania, Uganda, Zambia, and Zimbabwe. The 7% estimate for Rwanda may be increasing from 4% in 2005 and 6% in 2010 because of the trend in later age at marriage. Currently, the median age at marriage for women in Rwanda, 21.9, is about 2 years later than the median age in other countries in the region. Teenage fertility rates are highest among the least educated and in the lowest economic brackets, in the city of Kigali, and in the East. The lowest district teen fertility rates were in Gisagara and Gicumbi, with the highest in Gatsibo and other eastern districts (Map 2).
Map 2 Number of children desired, Rwanda DHS 2014-15
REPRODUCTIVE PREFERENCES
The mean number of children that women on average desired in 2015 – 3.4 – had declined sharply between 2000 and 2010, but showed little change since 2010, except for a possible recent increase among teenagers (Figure 5). The outstanding pattern in Figure 5 is the increasing similarity

9
of the desired number of children at each age between 2010 and 2015. Among men (Table 2), the average number of children desired, which had declined from 4.8 in 2000 to 2.8 by 2010, increased slightly to 3.0 by 2015.
Figure 5 Trends in the mean number of children desired between 2000 and 2015, by age of women, Rwanda DHS 2014-15
Table 2 Mean number of children desired by men, by current number of children, Rwanda DHS 2014-15
0 1 2 3 4 5 6+ Total
2015 2.8 2.8 3.0 3.2 3.3 3.1 3.5 3.0 2010 2.7 2.7 2.9 3.0 3.1 3.2 3.2 2.8 2005 3.8 3.8 3.9 4.2 4.3 4.5 4.4 4.0 2000 4.8 4.5 4.5 4.7 5.1 5.3 5.2 4.8
A similar picture is evident in the trends that show the proportion of currently married
women who want no more children dropping from 54 to 49 % between 2010 and 2015 (Table 3). The same trend is apparent among married men, with a decline from 54% to 50% who want no more children. This recent interruption of the increase in the desire to cease further childbearing appears consistently for both married women and men among those with 2, 3, 4 and more children. The interruption appears at each age group, in each region, in both rural and urban areas, and at each major level of schooling (not shown here). The largest decline since 2010 in the proportion of women who want no more children is from 52% to 34% among women with more than primary schooling.
5.1
4.74.5
4.7
5.1 5.1
5.5
4.9
4.34.1 4.1
4.3 4.4 4.5 4.54.3
2.7 2.83.2
3.6
3.8 4.0
4.3
3.33.0 2.9 3.2
3.5
3.8 4.04.2
3.4
0.0
1.0
2.0
3.0
4.0
5.0
6.0
15-19 20-24 25-29 30-34 35-39 40-44 45-49 Total
2000
2005
2010
2015

10
Table 3 Trends in the percentage of currently married women and men who want no more children, by number of living children, Rwanda DHS 2014-15
Total
Women
Total
Men
2 3 4 2 3 4
2015 49 23 54 75 50 30 56 76 2010 54 27 57 77 54 32 64 83 2005 43 22 35 57 44 21 34 51 2000 33 12 24 50 32 8 22 38
These changes may be a temporary pause in the downward trend of the number of children
desired. It seems likely that the future will see an increased tendency to prefer fewer than three children. Most of the neighboring countries show little recent change in the proportion of women who want no more children or a continuation of the upward trend in that proportion. The main exception is Kenya where the increase has been reversed as in Rwanda. In the most recent survey in Kenya in 2014 50% of women wanted no more children, down from 54% in 2009, a picture almost identical to the recent change in Rwanda. The corresponding change for men in Kenya was a decline from 45% to 42%.
The two measures of reproductive preferences are distributed by the main covariates in Table 4. The mean desired number of children declines with increasing education, although the proportions that want no more children also declines with education. Wealth is unrelated to both measures of reproductive preference. Rural areas show a higher proportion who want no more children than urban areas. Catholic women and men prefer slightly fewer children and want no more children compared with Protestants. Finally, parents who have experienced a child’s death want more children on average, but are also much more likely to want to cease further childbearing. At the district level, the strongest associations with the mean number of desired children, other than the number of children ever born, are in districts with low child mortality rates and higher proportions of women with no schooling. Religion also appears to play a role with women in largely Protestant districts wanting more children, as compared with women in the mainly Catholic districts.

11
Table 4 Covariates of reproductive preferences, among currently married women and men, Rwanda DHS 2014-15
Mean number desired Percent want no more children
Women Men Women Men
Region Kigali City 3.2 2.9 44 54 Southern Province 3.2 2.8 53 63 Western Province 3.5 3.1 47 54 Northern Province 3.5 2.9 51 55 Eastern Province 3.4 3.0 47 55
Education
None 3.9 3.1 64 69 Primary 3.4 3.0 48 56 Secondary or higher 3.0 2.8 34 42
Wealth
Lowest 3.4 2.9 50 55 Fourth 3.4 3.0 47 53 Middle 3.4 3.0 49 59 Second 3.4 2.9 51 61 Highest 3.3 3.0 46 54
Residence
Urban 3.3 3.0 44 48 Rural 3.4 3.0 49 58
Religion
Catholic 3.2 2.9 52 60 Protestant 3.5 3.1 45 52 Adventist 3.2 2.9 51 53
Child Deaths
No 3.2 2.9 41 47 Yes 4.0 3.1 72 78
Total 3.4 3.0 49 56
Multivariate analyses of factors that affect both measures of reproductive preferences are
shown in Tables 5 and 6. The strongest association with the number of children that both women and men desire (Table 5), other than the actual number of children, is among Protestants, while being Catholic shows no statistically significant relationship. The number of child deaths is positively related to the number of children that women desire. Education is negatively associated, while wealth is positively associated, with the desired number of children, although urban-rural residence is not relevant. Use of contraception declines with the number of children desired. The same set of covariates of the number of children desired is apparent for men, except that the relationship with the number of child deaths is not statistically significant.

12
Table 5 Covariates of the number of children desired (standardized partial regression coefficients), Rwanda DHS 2014-15
Women Men
Years of schooling -0.047 -0.029 Wealth 0.033 (0.025) Urban-rural residence (0.004) (-0.010) Catholic (0.019) (-0.016) Protestant 0.098 0.073 Number of child deaths 0.072 (-0.021) Using contraception -0.041 -0.051 Number of children 0.296 0.184 Age 0.051 (-0.035) Number 13,362 6,208 R2 0.144 0.032
( ) not significant at the .05 level
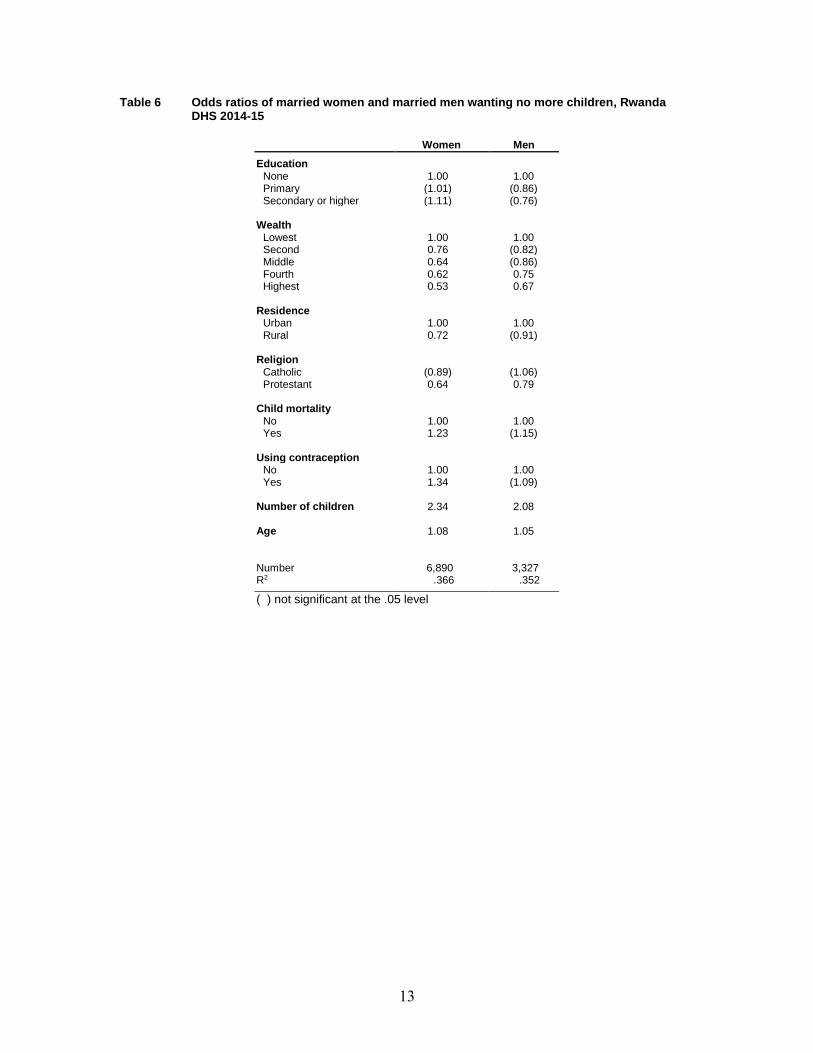
The same set of covariates is shown in Table 6 for whether additional children are wanted.
The variation in family size is controlled by the inclusion of that variable in the analysis. In Table 6, education is not related to the proportion who want no more children, while wealth is directly associated with wanting more children. Protestant women and men want more children, and being Catholic shows no relationship. Both the experience of child mortality and the use of contraception are associated with wanting to stop further childbearing while women in rural areas are more likely to want more children.
Wives and husbands in Rwanda strongly agree on whether or not to have more children: 39% of currently married couples both want more and 41% want no more children. Among the 20% who do not agree, 13% are couples with the wife wanting more than the husband and 7% with the husband wanting more children. Spouse differences in the ideal number of children show 35% in agreement, 44% of couples with the wife desiring more than the husband, and 21% with the husband desiring more children than the wife.
Another perspective on reproductive preferences is the total wanted fertility rate (TWFR) that estimates what the TFR would be if only wanted births prevailed. For the 3 years before the 2014-15 survey, the TWFR was 3.1 in contrast to the TFR of 4.2. This implies that unwanted births, the difference of 1.1 births, are still a significant consideration. The comparable difference between the two rates in the earlier survey in 2010 was 1.4, with a TWFR of 3.2 and a TFR of 4.6. The decline of fertility over time was concentrated primarily in the reduction of unwanted births.
Among the 30 districts of the country, the TWFR decreased in 16 districts between 2010 and 2015, while 4 remained unchanged and 10 increased (Table 7). In 2015, the TWFR ranged from 2.2 in Gakenke to 4.2 in Nyagatare. The unwanted fertility rate ranged from a low of 0.5 in Kicukiro to a high of 2.1 in Rutsiro, with 18% and 40% respectively for their overall TFRs. Unwanted fertility is greatest in the poorest and least educated districts.
13
Table 6 Odds ratios of married women and married men wanting no more children, Rwanda DHS 2014-15
Women Men
Education None 1.00 1.00 Primary (1.01) (0.86) Secondary or higher (1.11) (0.76)
Wealth
Lowest 1.00 1.00 Second 0.76 (0.82) Middle 0.64 (0.86) Fourth 0.62 0.75 Highest 0.53 0.67
Residence
Urban 1.00 1.00 Rural 0.72 (0.91)
Religion
Catholic (0.89) (1.06) Protestant 0.64 0.79
Child mortality
No 1.00 1.00 Yes 1.23 (1.15)
Using contraception
No 1.00 1.00 Yes 1.34 (1.09)
Number of children 2.34 2.08 Age 1.08 1.05 Number 6,890 3,327 R2 .366 .352
( ) not significant at the .05 level

14
Table 7 Total wanted fertility and unwanted fertility rates for the 3 years before the survey, Rwanda DHS 2014-15
2015 2010
Total wanted fertility rates
Total unwanted fertility rates
Total wanted fertility rates
Total unwanted fertility rates District
Nyarugenge 2.7 1.0 2.3 0.6 Gasabo 3.0 1.0 2.6 1.2 Kicukiro 2.3 0.5 2.6 0.8 Nyanza 3.1 1.1 3.4 1.4 Gisagara 3.1 1.3 3.5 1.3 Nyaruguru 3.2 1.4 3.8 1.6 Huye 3.0 1.0 3.6 1.1 Nyamagabe 2.7 0.9 3.3 1.8 Ruhango 2.9 1.2 2.7 1.4 Muhanga 2.8 0.7 2.8 1.0 Kamonyi 3.1 0.8 3.1 1.0 Karongi 2.8 1.1 3.3 1.3 Rutsiro 3.1 2.1 3.5 1.7 Rubavu 3.1 1.8 3.6 1.7 Nyabihu 2.7 1.2 3.4 1.5 Ngororero 3.0 1.2 3.2 1.4 Rusizi 2.8 1.9 3.5 1.6 Nyamasheke 3.9 1.1 3.5 1.5 Rulindo 3.3 0.9 2.5 0.8 Gakenke 2.2 0.9 2.9 1.8 Musanze 2.8 0.7 2.8 1.8 Burera 2.9 1.1 2.7 0.9 Gicumbi 2.9 0.9 2.5 1.6 Rwamagana 3.3 1.1 3.3 1.3 Nyagatare 4.2 0.7 3.9 1.2 Gatsibo 3.5 1.3 3.0 1.9 Kayonza 3.4 1.1 3.5 1.6 Kirehe 3.3 0.9 3.2 1.5 Ngoma 3.1 1.5 3.9 1.1 Bugesera 3.4 1.4 3.2 1.8 Total 3.1 1.1 3.2 1.4
Note: Rates are based on births to women age 15-49 in the period 1-36 months before the survey.
CHILD MORTALITY
As noted above, child mortality (deaths under age 5) is directly associated with fertility and reproductive preferences. There has been a substantial decline in child mortality – 67% since the 2005 DHS, and by another 34% since the 2010 estimate. This recent decline is mapped by district in Map 3. Child mortality rates declined in most districts. The largest declines since 2010 were in Musanze (from 107 to 31) and Ngoma (from 107 to 52). In Nyamsheke, the rate declined from 50 to 7 over the 5-year interval. Increases in child mortality of roughly 20% occurred in Ruhango, Rutsiro, and Ngororero. Lower child mortality rates are clearly associated with urban residence, schooling (Figure 6), and greater wealth.

15
Map 3 Changes in child mortality, Rwanda DHS 2014-15
Figure 6 Association of schooling with child mortality, Rwanda DHS 2014-15
Among women who have experienced the death of a child (25% of all currently married
women), 72% say they want no more children compared with 41% of those without a child death. This effect of child mortality on attitude toward additional childbearing persists, although lessened with other covariates simultaneously controlled that include education, wealth, residence, number of children, and age. The association of child deaths with fertility itself is strong, with 5.7 children

16
ever born to married women with a child death compared with 2.7 for married women with no child death. The importance of child mortality for fertility remains with age and other covariates controlled.
Rwanda has also experienced significant declines in maternal mortality that has dropped by half in the 5-year periods before the latest two surveys. Maternal mortality is now the lowest of the 11 countries in the region.
BIRTH INTERVALS
The length of time between births is of interest because of the implications for the fertility rate and the negative health significance for both mother and child of short intervals since the preceding birth. A total of 14% of birth intervals in the 5 years before the 2014-15 survey occurred less than 24 months after the earlier birth. This is an important reduction from 20% in the 5 years earlier and 23% before the 2005 survey. Overall, the median length of birth intervals has increased to 39 months from the average of 33 months in 2010 and 31 months in 2005. This has undoubtedly contributed to the reduction of maternal mortality. Increases in the length of birth intervals have been observed in numerous other sub-Saharan African countries as well (Moultrie et al. 2012).
The districts in Rwanda with the largest increases in the length of birth intervals between 2010 and 2015 (around 20%) are Kicukiro, Kamonyi, and Musange. The increase in the length of birth intervals is correlated directly with an increase in the proportion of women who want no more children.
Among women who have had at least one birth, the median length of the interval since the last birth was 35 months. This is an increase from 31 months in 2010 and 24 months in 2005. By district in 2015, the longest interval was 42 months in Kicukiro and Gakenke, and the shortest was 27 months in Rubavu and in Nyamashe.
FERTILITY SIMULATIONS
The following analysis seeks to quantify the importance for fertility of future changes in age at marriage, child mortality, and amount of education, which are related to reproductive preferences and contraceptive use. Fertility is measured here by the number of children ever born to ever-married women age 15 to 49, which is currently an average of 3.5 births. Age at marriage is assumed to increase to a minimum age at 18. Currently, 16% of women marry below age 18. Child mortality, which now affects 27% of ever-married women, is assumed to decline either to zero, an obvious unrealistic extreme, or to a level of 17% that would exclude women with the experience of more than one child death. The amount of schooling is assumed to rise to a minimum of at least 4 years that currently includes 48%.
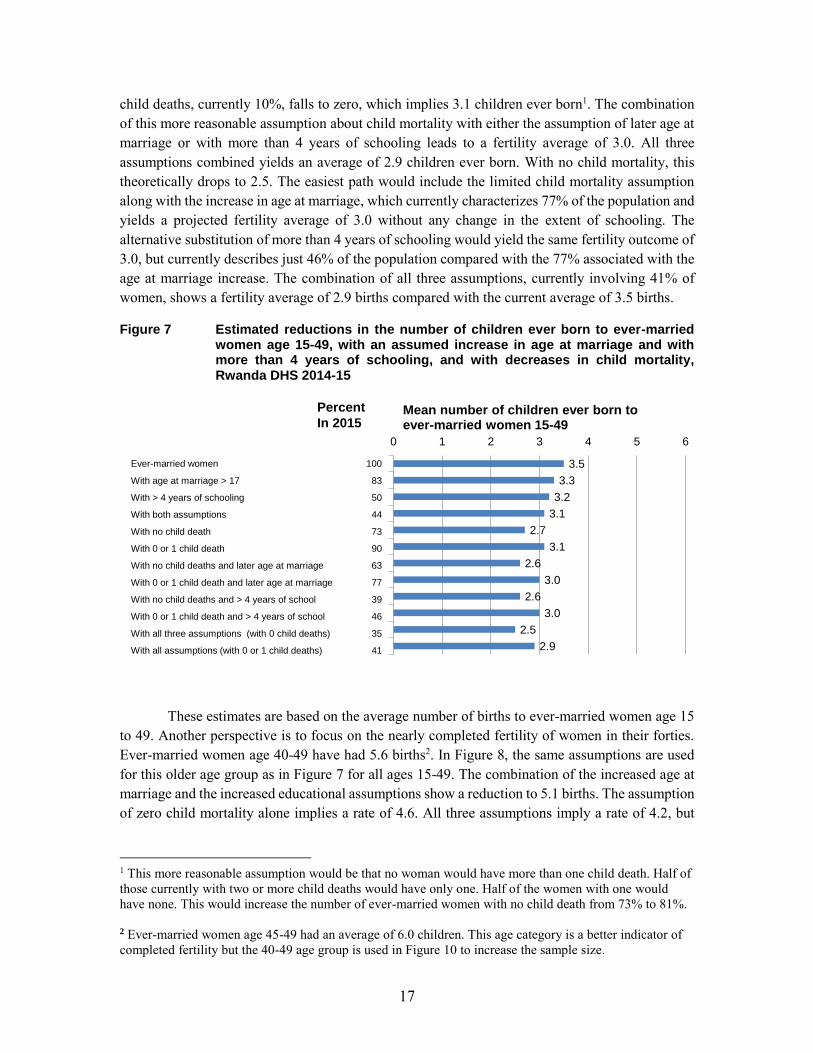
The fertility rates associated with these different assumptions are shown in Figure 7. The assumed increase in age at marriage alone and the increase in women’s schooling reduce fertility from 3.5 to 3.3, to 3.2 respectively, and to 3.1 together. The influence of child mortality on fertility is stronger. In the extreme case of zero child deaths, the average number of children ever born drops from 3.5 to 2.7. A more reasonable assumption is that the percentage of women with two or more
17
child deaths, currently 10%, falls to zero, which implies 3.1 children ever born1. The combination of this more reasonable assumption about child mortality with either the assumption of later age at marriage or with more than 4 years of schooling leads to a fertility average of 3.0. All three assumptions combined yields an average of 2.9 children ever born. With no child mortality, this theoretically drops to 2.5. The easiest path would include the limited child mortality assumption along with the increase in age at marriage, which currently characterizes 77% of the population and yields a projected fertility average of 3.0 without any change in the extent of schooling. The alternative substitution of more than 4 years of schooling would yield the same fertility outcome of 3.0, but currently describes just 46% of the population compared with the 77% associated with the age at marriage increase. The combination of all three assumptions, currently involving 41% of women, shows a fertility average of 2.9 births compared with the current average of 3.5 births.
Figure 7 Estimated reductions in the number of children ever born to ever-married women age 15-49, with an assumed increase in age at marriage and with more than 4 years of schooling, and with decreases in child mortality, Rwanda DHS 2014-15
These estimates are based on the average number of births to ever-married women age 15
to 49. Another perspective is to focus on the nearly completed fertility of women in their forties. Ever-married women age 40-49 have had 5.6 births2. In Figure 8, the same assumptions are used for this older age group as in Figure 7 for all ages 15-49. The combination of the increased age at marriage and the increased educational assumptions show a reduction to 5.1 births. The assumption of zero child mortality alone implies a rate of 4.6. All three assumptions imply a rate of 4.2, but
1 This more reasonable assumption would be that no woman would have more than one child death. Half of those currently with two or more child deaths would have only one. Half of the women with one would have none. This would increase the number of ever-married women with no child death from 73% to 81%. 2 Ever-married women age 45-49 had an average of 6.0 children. This age category is a better indicator of completed fertility but the 40-49 age group is used in Figure 10 to increase the sample size.
3.5
3.3
3.2
3.1
2.7
3.1
2.6
3.0
2.6
3.0
2.5
2.9
0 1 2 3 4 5 6
Mean number of children ever born to ever-married women 15-49
100
83
50
44
73
90
63
77
39
46
35
41
Percent
In 2015
Ever-married women
With age at marriage > 17
With > 4 years of schooling
With both assumptions
With no child death
With 0 or 1 child death
With no child deaths and later age at marriage
With 0 or 1 child death and later age at marriage
With no child deaths and > 4 years of school
With 0 or 1 child death and > 4 years of school
With all three assumptions (with 0 child deaths)
With all assumptions (with 0 or 1 child deaths)

18
with a level of child mortality that just excludes two or more child deaths, the rate for the three assumptions would be 4.6.
Figure 8 Estimated number of children ever born to ever-married women age 40-49, with assumed increases in age at marriage and in years of schooling and with decreases in child mortality, Rwanda DHS 2014-15
The same analysis is shown for ever-married men in Figure 9 for two age groups: 15 to 59
and 45 to 59. The average number of children ever born for the entire age span of 15-59 currently is 4.1. In the absence of child mortality, this would be 3.0, and with the more realistic assumption of limiting child deaths to a maximum of one, a mean of 3.5 children ever born. By itself, an increase in age at marriage to age above 24, currently including 44% of ever-married men, would reduce fertility from 4.1 to 3.5. Increases in the amount of schooling imply less of an effect. The assumption of more than 6 years of schooling, which now characterizes only 19% of men, would imply a decline only to 4.0 children ever born. The increase in education would have to reach more than 8 years to imply a decline to 3.0, although this amount of schooling is currently experienced by only 10% of men. The most effective, efficient combination would be an age at marriage above 24 and the more realistic assumption of fewer than two child deaths. This combination would imply fertility of 3.1 and already involves 40% of men.
5.6
5.4
5.2
5.1
4.6
5.0
4.4
4.9
4.4
4.8
4.2
4.6
0.0 1.0 2.0 3.0 4.0 5.0 6.0
Mean number of children ever born to ever-married women 40-49
100
84
48
42
46
73
40
63
25
38
23
34
PercentIn 2015
Ever-married women 40-49
With age at marriage >17
With more than 4 years of schooling
With both assumptions
With no child deaths
With 0 or 1 child death
With no child death and later age at marriage
With 0 or 1 child death and later age at marriage
With no child deaths and more than 4 years of school
With 0 or 1 child death and less than 4 years of school
With all three assumptions (with 0 child deaths)
With all three assumption (with 0 or 1 child deaths)

19
Figure 9 Estimated number of children ever born to ever-married men 15-59 and 45-59, with assumed increases in age at marriage and increases in schooling and decreases in child mortality, Rwanda DHS 2014-15
A similar picture appears with men ages 45-59 with a completed fertility currently at 6.9
children ever born. A significant component is child mortality. With no child deaths, this rate would be 5.3, and with the exclusion of men with more than one child death, the rate would be 6.0. Confining marriage to men over age 24 would imply 5.7 children ever born and, in combination with the conservative child mortality assumption, would theoretically reduce completed fertility to 5.1 and involve changes already in the experience of 41% of the men. Similar to the weak effect of the amount of schooling on fertility for all men age 15 to 59, the increase of education would have to involve an assumption of at least 8 years of schooling, a level that currently includes only 10% of the men age 45-49.
FAMILY PLANNING
The use of contraception by married women in Rwanda reached 53% by the 2014-15 survey, which was up slightly from 51% in 2010. With strong government support, a sharp increase in use occurred between 2005 and 2010 when contraceptive prevalence initially had been only 17%. The main contraceptive methods currently used by married women are injectables, the pill, and implants. Regional variations in the use of any method range from 47% in the West to 61% in the North. In 18 of the 30 districts, there has been an increase in the use of contraception since 2010 and a decline in use in 12 districts (Map 4). The largest increase was in Rubavu and the greatest decreases in Nyaruguru and Kamonyi. The main district covariates of current contraceptive use are the percentage of married women who want no more children, poverty (the lowest two quintiles of wealth), and the decline of the TFR over the past 5 years. The same covariates are observed for individual married women.

20
Map 4 Changes in contraceptive use, Rwanda DHS 2014-15
Among married men in Rwanda, 59% are currently using a method. The main methods in
use are their wives’ injections, implants, and the pill.
The contraceptive prevalence rate for women of 53% is higher in Rwanda than the average rate of 40% for the 14 major countries of Eastern Africa. Rates are higher in Kenya (66), Malawi (59), and Zimbabwe (66). In 2012, a comparison of three countries in the region with strong family planning programs (Ethiopia, Malawi, and Rwanda) concluded that political commitment has been an important component of the increase in family planning (USAID/African Bureau, et al. 2012).
Despite the increase in contraceptive use over the last 10 years in Rwanda, close to half (47%) of married women in Rwanda are still not currently using any method. Of these current non-users, 72% intend to use. The desire to have no more children is the principal determinant of intent to use. The main reasons for non-use and for not intending to use are not being exposed to risk (infrequent sex, menopause) and fear of side effects. The main reason for discontinuing a method such as side effects or health concerns was 34%, which was unchanged since 2010.
Exposure to radio messages that promote family planning increased sharply between 2005 and 2010, from 41% to 66%, but declined to 51% by 2010. Exposure to television messages shows increases over the entire period, although this remains below 10%. The picture for men is similar. Exposure is positively associated with greater education, wealth, and urban residence.
UNMET NEED
Married women who are not using contraception but who are fecund and wish to postpone having another child or to avoid any further childbearing are classified as having an unmet need for
21
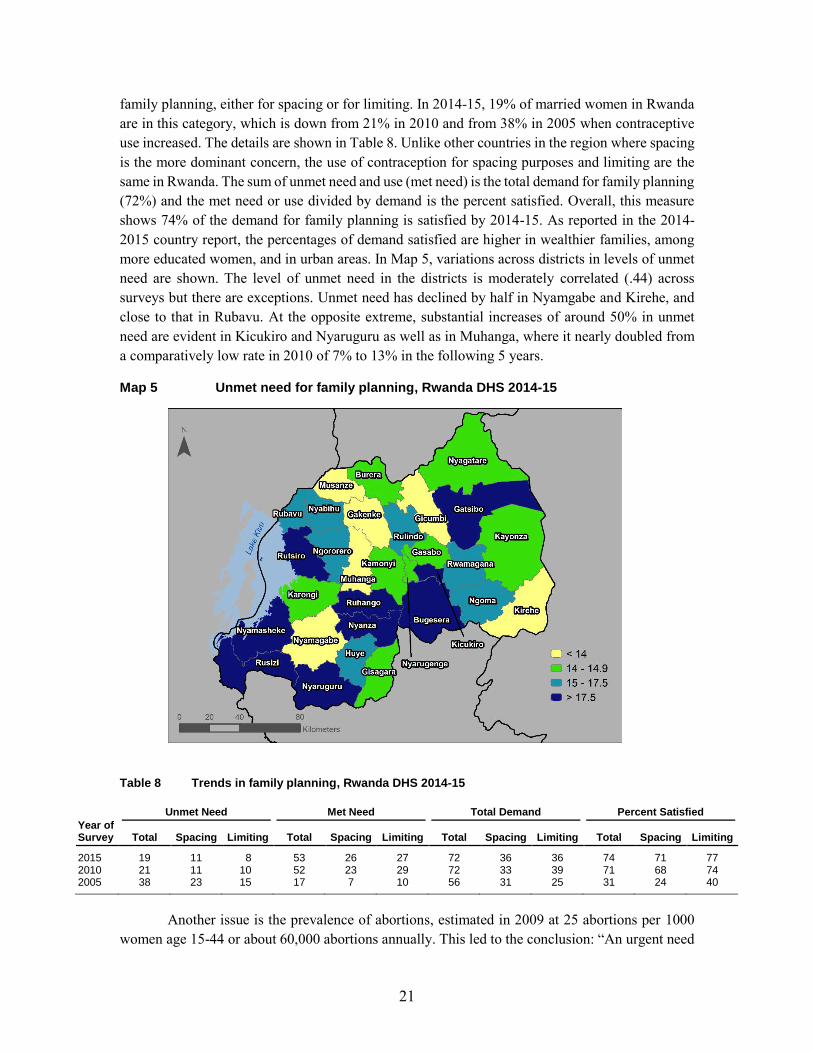
family planning, either for spacing or for limiting. In 2014-15, 19% of married women in Rwanda are in this category, which is down from 21% in 2010 and from 38% in 2005 when contraceptive use increased. The details are shown in Table 8. Unlike other countries in the region where spacing is the more dominant concern, the use of contraception for spacing purposes and limiting are the same in Rwanda. The sum of unmet need and use (met need) is the total demand for family planning (72%) and the met need or use divided by demand is the percent satisfied. Overall, this measure shows 74% of the demand for family planning is satisfied by 2014-15. As reported in the 2014-2015 country report, the percentages of demand satisfied are higher in wealthier families, among more educated women, and in urban areas. In Map 5, variations across districts in levels of unmet need are shown. The level of unmet need in the districts is moderately correlated (.44) across surveys but there are exceptions. Unmet need has declined by half in Nyamgabe and Kirehe, and close to that in Rubavu. At the opposite extreme, substantial increases of around 50% in unmet need are evident in Kicukiro and Nyaruguru as well as in Muhanga, where it nearly doubled from a comparatively low rate in 2010 of 7% to 13% in the following 5 years.
Map 5 Unmet need for family planning, Rwanda DHS 2014-15
Table 8 Trends in family planning, Rwanda DHS 2014-15
Year of Survey
Unmet Need Met Need Total Demand Percent Satisfied
Total Spacing Limiting Total Spacing Limiting Total Spacing Limiting Total Spacing Limiting
2015 19 11 8 53 26 27 72 36 36 74 71 77 2010 21 11 10 52 23 29 72 33 39 71 68 74 2005 38 23 15 17 7 10 56 31 25 31 24 40
Another issue is the prevalence of abortions, estimated in 2009 at 25 abortions per 1000
women age 15-44 or about 60,000 abortions annually. This led to the conclusion: “An urgent need

22
exists in Rwanda to address unmet need for contraception, and to improve postabortion care” (Basinga 2012).
RELIGION
In many parts of the world, religion has played an important role in reproductive behavior because of doctrinal or cultural reasons. For example, Muslim and Roman Catholic belief systems have long been associated with higher fertility and low contraceptive practice. In Rwanda, there are three main religions: Protestant, Catholic, and Adventist. Rwandan women currently identify primarily with Protestant and Catholic religions (45% and 40% respectively) and 12% as Adventists. The only information available about religion in the DHS is the response to the question: “What is your religion?” There is no information about practices or the personal importance of religion in the survey. Simple comparisons of Catholic and Protestant women show no real difference in the number of children ever born, although surprisingly they do show a higher proportion of Catholics currently using contraception – 57%, than Protestants – 48%. This is consistent with a higher proportion of Catholics who want no more children – 52% – than Protestants at 45%, and with fewer total children desired by Catholics (3.2 compared with 3.5). Similar differences are observed for men.
The greater use of contraception by Catholics and their preferences for smaller families compared with Protestants was not expected, although the differences are not large. However, the influence of Catholicism on reproductive behavior may still be relevant with the clergy’s influence on contraceptive availability. An earlier observation about the Church’s refusal to provide birth control methods in Catholic hospitals showed that they will inform women where they can obtain such methods (Wadhams 2010; Muhosa et al. 2016).

23
SUMMARY AND CONCLUSIONS
Recent data on reproductive behavior in Rwanda mostly confirm a continuation of the changes initiated earlier in the century. Between 2010 and 2015, the age at marriage has continued to rise, child mortality has declined, contraceptive use has increased, the unmet need for family planning is slightly lower, and fertility has continued to fall with the possible exception of births among teenagers. The main exception to this general pattern is the recent trend in reproductive preferences. There has been no further decline in the number of children desired by both men and women. The proportion of married women and men who want no more children is also lower than in 2010 after an uninterrupted increase since 2000.
The main covariates of these measures of reproductive behavior include religion, which shows that Protestants have higher proportions married and wanting more children than Catholics and that they are are less likely to be using contraception. Simulations of fertility show lower rates of childbearing with further reductions of child mortality and, to a lesser degree, with future increases in age at marriage and women’s education.
Although Rwanda has made significant advances in lowering fertility, its rate of population growth remains high with a current fertility rate at 4.2 combined with the effect of the population momentum caused by the youthful age composition.
In 1998-99, a broad plan of social and economic development entitled Rwanda Vision 2020 included several demographic targets. In general, these goals appear to be on track. The total population target of 13 million inhabitants by 2020 is likely. The targeted annual rate of population growth of 2.2% by 2020 is consistent with the current rate of 2.5%. Declines in mortality rates have already exceeded expectations with infant mortality in 2015 at a rate of 32 deaths per 1,000 live births compared with the targeted rate of 50 for 2020. The United Nations estimate of life expectancy at birth in 2015 at 68 is considerably greater than the 2020 target of 55 years. The continuing reduction in maternal mortality is on target. The total fertility rate of 4.2 births per woman in 2014-15 is already lower than the targeted rate of 4.5 for 2020.
The Rwanda Vision 2020 report did not specify a contraceptive prevalence target, but explicitly identified family planning “as a crucial intervention to the long-term economic goals of the nation” (USAID/African Bureau, et al. 2012). At the London Summit on Family Planning in 2012, the Government of Rwanda committed “to ensuring the availability of family planning services in each of the 14,841 Rwanda administrative villages” and “will expand existing information and dissemination programs about family planning to the general public and will increase awareness of the various choices available” (2016 FP2020 Annual Commitment Update).


25
REFERENCES
Basinga, P., A. N. Moore, S. A. Singh, E. E. Carlin, F. Birungi, and F. Ngabo. 2012. “Abortion Incidence and Postabortion Care in Rwanda.” Studies in Family Planning 43:11-20.
FP 2020. 2016. Annual Commitment Update Questionnaire Response. http:www.familyplanning2020.org/Rwanda.
Madsen, E. L. 2011. “Rwanda: Dramatic Uptake in Contraceptive Use Spurs Unprecedented Fertility Decline.” NewSecurityBeat, the blog of the Wilson Center’s Environmental Change and Security Program.
May, John F. 2009. “Demographic Growth and Development Prospects in Rwanda: Implications for the World Bank.” http://www.ministerial-leadership.org/sites/default/files/events/event_files/Demographic%20Growth%20and%20Development%20Prospects%20in%20Rwanda.pdf.
Moultrie, T. A., T. S. Sayi, and I. M. Timaeus. 2012. “Birth Intervals, Postponement, and Fertility Decline in Africa: A New Type of Transition.” Population Studies: A Journal of Demography 66(3):1-11.
Muhoza, D. N., A. Broekhuis, and P. Hooimeijer. 2014. “Variations in Desired Family Size and Excess Fertility in East Africa.” International Journal of Population Research, 10(1155):1-18.
Muhoza, D. N., P. C. Rutaysire, and A. Umubyeyi. 2016. “Measuring the Success of Family Planning Initiatives in Rwanda: A Multivariate Decomposition Analysis.” Journal of Population Research, 33:361-377. doi: 10.1007/s12546-016-9177-9.
National Institute of Statistics of Rwanda, Ministry of Health, and ICF International. 2015. Rwanda Demographic and Health Survey 2014-15. Rockville, Maryland, USA: NISR, MOH, and ICF International.
The New York Times. 2017. “Rwanda’s Lessons (Really) on Health Care.” New York Times, July 19, 2017.
Republic of Rwanda. 2012. Rwanda Vision 2020.
Solo, J. 2008. Family Planning in Rwanda: How a Taboo Topic Became Priority One. Chapel Hill, North Carolina, USA: IntraHealth International.
United Nations, Department of Economic and Social Affairs, Population Division. 2017. World Population Prospects: The 2017 Revision. https://www.un.org/development/desa/publications/world-population-prospects-the-2017-revision.html.

26
Wadhams, Nick. 2010. “Progress in Rwanda’s Drive to Slow Population Growth” The Lancet 376(9735):81-82. doi: http://dx.doi.org/10.1016/S0140-6736(10)61063-X.
Westoff, C. F. 2012. “The Recent Fertility Transition in Rwanda.” In Population and Public Policy: Essays in Honor of Paul Demeny, edited by G. McNicoll, J. Bongaarts, and E. Churchill. New York, USA: Population Council.
Westoff, C. F., F. Ngabo, C. Munyanshongore, M. A. Umubyeyi, and E. Kagame. 2013. Rwanda 2010: A Dramatic Change in Reproductive Behavior. DHS Further Analysis Reports No. 90. Calverton, Maryland, USA: ICF International.
Westoff, C. F. 2017. Current Pregnancy and Fertility. DHS Working Papers, No. 128. Rockville, MD: ICF.
USAID/Africa Bureau, USAID/Population and Reproductive Health, Ethiopia Federal Ministry of Health, Malawi Ministry of Health, and Rwanda Ministry of Health. 2012. Three Successful Sub-Saharan Africa Family Planning Programs.