trends in marketing and export of onion in india
TRANSCRIPT

Trends in Marketing and Export
of Onion in India
Research Report
2012-13
National
Institute of
Agricultural
Marketing
(NIAM)
Jaipur
Rajasthan
Prepared by Dr. K. C. Gummagolmath
Assistant Director
2
Preface
Onion is one of the important vegetable crops grown in India. In terms of area, India ranks first
with an area of 5.54 lakh hectares (2008-09) accounting for around 22.40 per cent of the world
onion area. In terms of production, the country occupies second position after China
constituting 19 per cent of the global onion production. It is produced for both domestic
consumption as well as exports. In the wake of galloping price rise in onion, it is imperative to
understand the nature and causes of price rise and effect on consumer. Hence, an attempt has
been made through this study to bring out the reasons for such high rise in the price of onion.
Findings of the study revealed that, the astronomical increase in the prices of onion was
a result of hoarding of the stocks in anticipation of rise in the price and higher retailers mark-
up. Moreover, the crop situations were not predicted timely and thus, the information on loss in
production was not anticipated by market intelligence. Proper staggered planting of onions
with suitable varieties can address supply gap during the slack period, there by stabilizing the
prices across the year uniformly. As part of market reforms, implementing market intelligence
systems can help in discovering the right prices for producers as well as consumers. It is
expected that, findings of the study would help policy makers in giving directions for
appropriate and timely action to protect interest of both consumers and producers.
Dr. K. C. Gummagolmath, Assistant Director, NIAM was associated with this study.
(Dr. R.P. Meena)
Director General,
NIAM, Jaipur
3
ACKNOWLEDGEMENT
The study on ‘Trends in Marketing and Export of Onion in India’ was funded
internally by the National Institute of Agricultural Marketing. The author is highly
thankful to the Director General for providing the inspiration and support to take up the
study on such a contemporary issue of agricultural marketing.
I would also like to express my special thanks to Dr. Purushottam Sharma and
Dr. Shalendra, faculty, NIAM for helping me in analysis and draft preparation of the
report. I would also like to thank the respondents i.e. Traders, Farmers, Retailers and
Consumers of Rajasthan, Maharashtra and Karnataka for their timely help and
furnishing valuable information for successful completion of the report.
I would also like to take this opportunity to acknowledge the valuable
suggestions made by my fellow faculty members in improving the value of this report.
(Dr. K. C. Gummagolmath)

4
Contents
SN Particulars Page
Chapter-I Introduction 7-13
Chapter-II Profile of Onion 14-24
Chapter-III Agricultural Marketing Status In Maharashtra and Karnataka 25-34
Chapter-IV Data and Methodology 35-36
Chapter-V Results and Discussion 37-75
Chapter-VI Conclusion and Suggestions 74-75
Chapter-VII References 76
Chapter-VIII Annexure 77-80

5
List of Tables
Table. No. Particulars Page
Table-1.1 Area, Production and Productivity of Onion across the World 7
Table-1.2 State-wise Area under Onion in India (1000 ha) 9
Table-1.3 State-wise Production of Onion in India (000’ tones) 10
Table-1.4 State-wise Yield of Onion in India (Tones/ha) 11
Table-1.5 CAGR of Area, Production and Productivity of Onion in Major Onion
Producing States in India (1974-75 to 2011-2012)
11
Table-2.1 Criteria and Description of Grades 17-19
Table-2.2 According to AGMARK standards Onions are classified into
following classes
19
Table-3.1 Status of Regulated Markets in Karnataka 26
Table3. 2 Status of Karnataka in Agricultural Marketing 31
Table-4.1 Sampling Method 36
Table-5.1 Details of Arrival Pattern of Onion in Leading States
37
Table-5.2 Concentrated Pockets 37
Table-5.3 Gross Arrivals of Onion in Major Markets in India 38-39
Table-5.4 Seasonal Indices of Prices of Onion in Major Consuming Markets in
India (2002-2012)
40
Table-5.5 Seasonal Indices of Prices of Onion in Markets Located at Production
Hinterland
41
Table-5.6 Seasonal Indices of Arrivals of Onion in Major Consuming Markets in
India
45
Table-5.7 Seasonal Indices of Arrivals of Onion in Markets located at production
hinterland
46
Table-5.8 Onion Price Rise and Consumption Pattern in Jaipur City 59 Table-5.9 Volatility of Prices and Arrivals of Onion in Jaipur Market 60
Table-.10 Trends in Export of Onion from India 62
Table-.11 Export Destinations of Onion from India (2010-11) 63
Table-.12 Cultivation Pattern, Yield and Consumption Pattern of Onion in
Karnataka and Maharashtra
70
Table-.13 Post Harvest Losses of Onion during Marketing in the Study Area 71
Table-.14 Marketing Cost, Margin and Price Spread of Onion in the Study Area 72

6
List of Figures
Figure. No. Particulars Page
Figure-1.1 Share of Different Countries in Area under Onion in the World 8
Figure-1.2 Share of Different Countries in Production Onion in the World 8
Figure-1.3 Yield of Onion in Different Countries 8
Figure-3.1 Status of Karnataka in terms of Number of Regulated Marketing
operating in the State
30
Figure-5.1 Seasonal Trends in Prices of Onion in Important Consuming Markets
of India (2002-2012)
40
Figure-5.2 Seasonal Trends in Arrivals of Onion in Important Consuming Markets
of India (2002-2012)
41
Figure-5.3 Seasonal Trends in Arrivals and Prices of Onion in Important
Consuming Markets of India (2002-2012)
44
Figure-5.4 Seasonal Indices of Prices of Onion in Markets Located at Production
Hinterland
45
Figure-5.5 Seasonal Indices of Prices of Onion in Markets Located at Production
Hinterland
46
Figure-5.6 Seasonal Indices of Prices of Onion in Markets Located at Production
Hinterland
47
Figure-5.7 Modal Prices of Onion during 1998 50
Figure-5.8 Daily Arrivals and Prices of Onion during November to December,
2010
52-53
Figure-5.9 Daily Prices in Different Markets of Maharashtra during Nov-Dec-2010 54
Figure-5.10 Daily Prices in Different Markets of Karnataka during Nov-Dec-2010 54

7
Chapter-I:
Introduction
Onion is an important vegetable crop grown and consumed widely across the world. As
a culinary ingredient it adds to the taste and flavour in a wide range of food preparations and it
is also used as a salad. Thus there is a steady increase in the demand for onion across the
world. China is the leading producer of onion constituting about 27 per cent of the world total
production (Table-1.1). India is the second largest producer in the world with an area of 10.64
Lakh hectares and production of 151.18 Lakh tonnes (2010-11). Top ten countries including
China and India, (mostly Asian countries) constitute more than 60 per cent of the total world
production. Yields of onion were higher in the case of Turkey (30.3 MT/ha) followed by Brazil
(23.1 MT/ha) and China (22 MT/ha). Due to lower yields, though India has the highest area
under onion, it stands second in the production of onion in the world. Hence, there is a lot of
potential for increasing the production of onion by improving the yields. India is also the
largest exporter of onion and hence, it is crucial to improve the yields for enhancing the export
level, so that it helps in earning foreign exchange for the exchequer of the country.
Table-1.1: Area, Production and Productivity of Onion across the World
County Area
(000ha)
Production
(000MT)
PRODUCTIVITY
( MT/HA)
% SHARE IN
PRODUCTION
China 930.21 20507.76 22.0 26.99
India 1064.00 15118.00 14.2 19.90
Pakistan 124.70 1701.10 13.6 2.24
Bangladesh 117.56 872.08 7.4 1.15
Indonesia 109.47 1048.23 9.6 1.38
Viet 101.70 355.30 3.5 0.47
Russian 88.00 1536.30 17.5 2.02
Myanmar 78.90 1137.90 14.4 1.50
Brazil 67.25 1556.00 23.1 2.05
Turkey 62.69 1900.00 30.3 2.50
Other Countries 1227.02 30244.54 24.6 39.81
World 3971.51 75977.21 19.1 100.0
Source: Indian Horticulture Database, 2011

8
Figure-1.1: Share of Different Countries in Area under Onion in the World
Figure-1.2: Share of Different Countries in Production Onion in the World
Figure-1.3: Yield of Onion in Different Countries
23%
27%
3%
3% 3% 2%
2% 2%
2%
2%
31%
China
India
Pakistan
Bangladesh
Indonesia
Viet
Russian
Myanmar
Brazil
Turkey
Other Countries
27%
20%
2% 1% 1% 0% 2% 2% 2%
3%
40%
Production (000MT)
China
India
Pakistan
Bangladesh
Indonesia
Viet
Russian
Myanmar
Brazil
Turkey
Other Countries
0 5
10 15 20 25 30 35
Productivity of Onion (MT/ha)
9
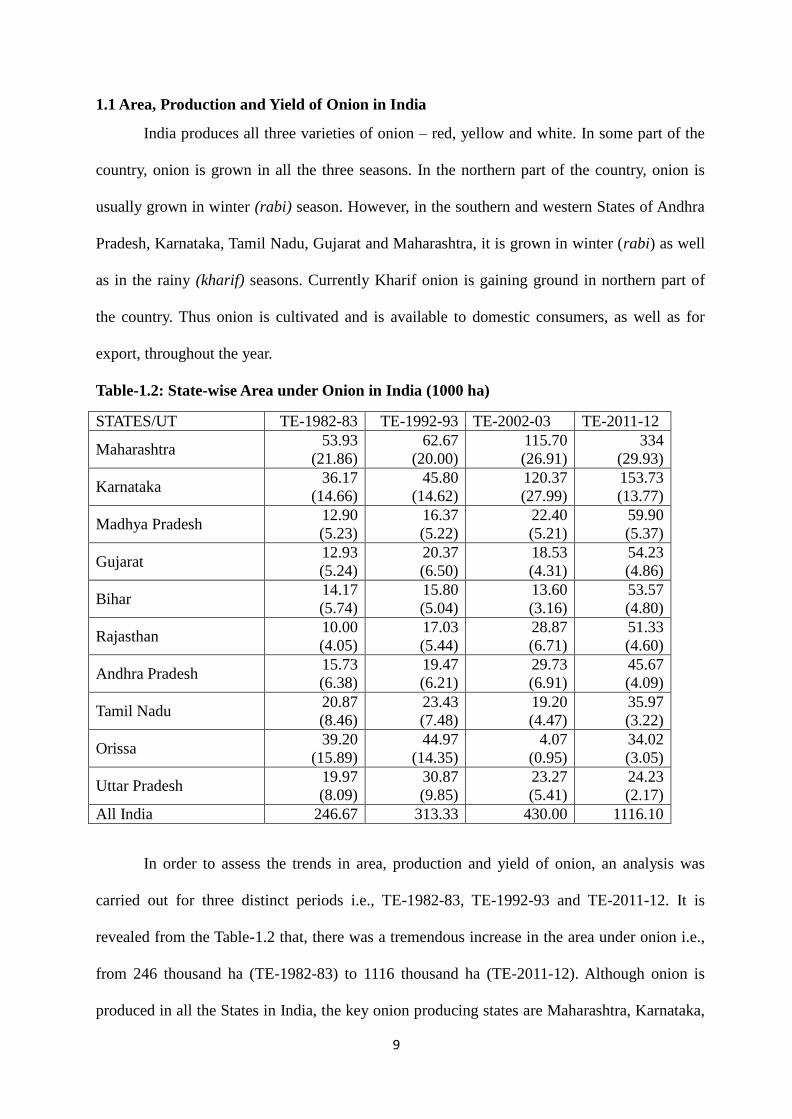
1.1 Area, Production and Yield of Onion in India
India produces all three varieties of onion – red, yellow and white. In some part of the
country, onion is grown in all the three seasons. In the northern part of the country, onion is
usually grown in winter (rabi) season. However, in the southern and western States of Andhra
Pradesh, Karnataka, Tamil Nadu, Gujarat and Maharashtra, it is grown in winter (rabi) as well
as in the rainy (kharif) seasons. Currently Kharif onion is gaining ground in northern part of
the country. Thus onion is cultivated and is available to domestic consumers, as well as for
export, throughout the year.
Table-1.2: State-wise Area under Onion in India (1000 ha)
STATES/UT TE-1982-83 TE-1992-93 TE-2002-03 TE-2011-12
Maharashtra 53.93
(21.86)
62.67
(20.00)
115.70
(26.91)
334
(29.93)
Karnataka 36.17
(14.66)
45.80
(14.62)
120.37
(27.99)
153.73
(13.77)
Madhya Pradesh 12.90
(5.23)
16.37
(5.22)
22.40
(5.21)
59.90
(5.37)
Gujarat 12.93
(5.24)
20.37
(6.50)
18.53
(4.31)
54.23
(4.86)
Bihar 14.17
(5.74)
15.80
(5.04)
13.60
(3.16)
53.57
(4.80)
Rajasthan 10.00
(4.05)
17.03
(5.44)
28.87
(6.71)
51.33
(4.60)
Andhra Pradesh 15.73
(6.38)
19.47
(6.21)
29.73
(6.91)
45.67
(4.09)
Tamil Nadu 20.87
(8.46)
23.43
(7.48)
19.20
(4.47)
35.97
(3.22)
Orissa 39.20
(15.89)
44.97
(14.35)
4.07
(0.95)
34.02
(3.05)
Uttar Pradesh 19.97
(8.09)
30.87
(9.85)
23.27
(5.41)
24.23
(2.17)
All India 246.67 313.33 430.00 1116.10
In order to assess the trends in area, production and yield of onion, an analysis was
carried out for three distinct periods i.e., TE-1982-83, TE-1992-93 and TE-2011-12. It is
revealed from the Table-1.2 that, there was a tremendous increase in the area under onion i.e.,
from 246 thousand ha (TE-1982-83) to 1116 thousand ha (TE-2011-12). Although onion is
produced in all the States in India, the key onion producing states are Maharashtra, Karnataka,

10
Madhya Pradesh, Rajasthan, Gujarat, Andhra Pradesh and Bihar which together constitute
around 70 percent of the area under onion in the country. During recent years, Rajasthan,
Madhya Pradesh and Bihar have emerged as an important onion growing States. On the
contrary, Orissa, Uttar Pradesh and Tamil Nadu have lost their proportion in the total area
under onion in the country.
Table-1.3: State-wise Production of Onion in India (000’ tones)
STATES/UT TE-1982-83 TE-1992-93 TE-2002-03 TE-2011-12
Maharashtra 739.70
(29.28)
825.23
(24.04)
1473.83
(27.14)
4624.50
(32.94)
Karnataka 234.90
(9.30)
352.43
(10.27)
640.73
(11.80)
2205.03
(15.71)
Gujarat 286.17
(11.33)
497.77
(14.50)
496.27
(9.14)
1312.40
(9.35)
Bihar 99.77
(3.95)
136.20
(3.97)
116.80
(2.15)
1064.17
(7.58)
Madhya Pradesh 144.77
(5.73)
196.50
(5.72)
314.10
(5.78)
986.30
(7.03)
Rajasthan 32.87
(1.30)
122.67
(3.57)
175.70
(3.23)
729.00
(5.19)
Andhra Pradesh 116.10
(4.59)
164.00
(4.78)
538.63
(9.83)
661.20
(4.71)
Tamil Nadu 251.40
(9.95)
217.40
(6.33)
173.27
(3.16)
470.43
(3.35)
Orissa 264.60
(10.47)
318.97
(9.29)
24.37
(0.44)
367.90
(2.62)
Uttar Pradesh 312.07
(12.35)
424.80
(12.37)
283.17
(5.21)
349.53
(2.49)
All India 2526.68 3433 5481.90 14039.00
Table-1.4: State-wise Yield of Onion in India (Tones/ha)
STATES/UT TE-1982-83 TE-1992-93 TE-2002-03 TE-2011-12
Maharashtra 13.71 13.21 12.73 14.20
Karnataka 6.49 7.56 5.31 14.40
Gujarat 22.18 24.58 25.22 24.27
Bihar 7.07 8.61 8.59 19.86
Madhya Pradesh 11.24 11.99 14.03 16.50
Rajasthan 3.25 7.24 6.62 14.28
Andhra Pradesh 7.41 8.42 16.84 14.66
Tamil Nadu 12.24 9.27 7.78 13.04
Orissa 6.76 7.09 5.97 10.77
Uttar Pradesh 15.55 13.85 12.15 14.44
All India 11.41 12.47 12.63 16.05
11
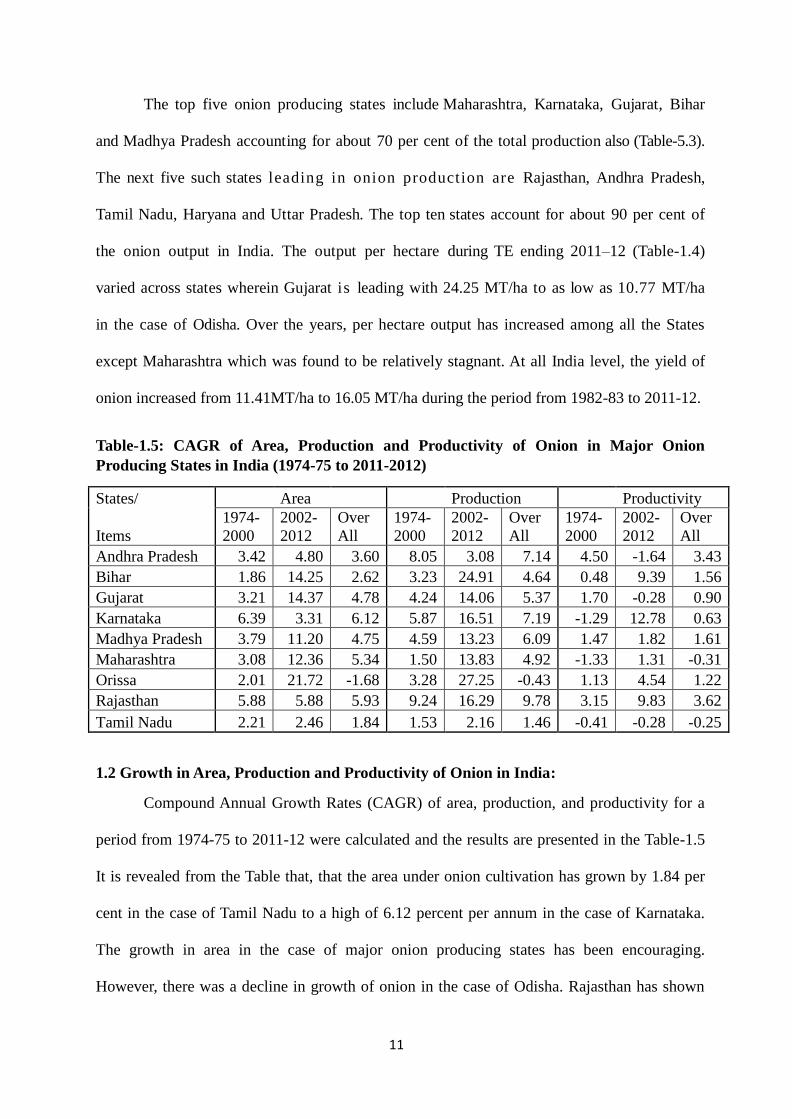
The top five onion producing states include Maharashtra, Karnataka, Gujarat, Bihar
and Madhya Pradesh accounting for about 70 per cent of the total production also (Table-5.3).
The next five such states leading in onion production are Rajasthan, Andhra Pradesh,
Tamil Nadu, Haryana and Uttar Pradesh. The top ten states account for about 90 per cent of
the onion output in India. The output per hectare during TE ending 2011–12 (Table-1.4)
varied across states wherein Gujarat is leading with 24.25 MT/ha to as low as 10.77 MT/ha
in the case of Odisha. Over the years, per hectare output has increased among all the States
except Maharashtra which was found to be relatively stagnant. At all India level, the yield of
onion increased from 11.41MT/ha to 16.05 MT/ha during the period from 1982-83 to 2011-12.
Table-1.5: CAGR of Area, Production and Productivity of Onion in Major Onion
Producing States in India (1974-75 to 2011-2012)
States/ Area Production Productivity
Items
1974-
2000
2002-
2012
Over
All
1974-
2000
2002-
2012
Over
All
1974-
2000
2002-
2012
Over
All
Andhra Pradesh 3.42 4.80 3.60 8.05 3.08 7.14 4.50 -1.64 3.43
Bihar 1.86 14.25 2.62 3.23 24.91 4.64 0.48 9.39 1.56
Gujarat 3.21 14.37 4.78 4.24 14.06 5.37 1.70 -0.28 0.90
Karnataka 6.39 3.31 6.12 5.87 16.51 7.19 -1.29 12.78 0.63
Madhya Pradesh 3.79 11.20 4.75 4.59 13.23 6.09 1.47 1.82 1.61
Maharashtra 3.08 12.36 5.34 1.50 13.83 4.92 -1.33 1.31 -0.31
Orissa 2.01 21.72 -1.68 3.28 27.25 -0.43 1.13 4.54 1.22
Rajasthan 5.88 5.88 5.93 9.24 16.29 9.78 3.15 9.83 3.62
Tamil Nadu 2.21 2.46 1.84 1.53 2.16 1.46 -0.41 -0.28 -0.25
1.2 Growth in Area, Production and Productivity of Onion in India:
Compound Annual Growth Rates (CAGR) of area, production, and productivity for a
period from 1974-75 to 2011-12 were calculated and the results are presented in the Table-1.5
It is revealed from the Table that, that the area under onion cultivation has grown by 1.84 per
cent in the case of Tamil Nadu to a high of 6.12 percent per annum in the case of Karnataka.
The growth in area in the case of major onion producing states has been encouraging.
However, there was a decline in growth of onion in the case of Odisha. Rajasthan has shown

12
impressive growth in onion production over the years (9.78%) due to higher growth in yield
during the same period (3.62%) Similar trend was observed in the case of Andhra Pradesh
wherein production of onion increased despite decline in yield during recent decade. However,
in the case of Karnataka, the growth in yield was moderate for the period considered under the
study.
The foregoing analysis with respect to area, production and productivity of onion
revealed that, apart from local demand, the exports of onion from India have grown to a
considerable extent in the recent decade. Increase in local demand coupled with increase in
exports and good price, there is a many fold increase in both area and production of onion.
Though there is increase in the yield of onion over the years, still there exists lot of potential to
reach to the global level yields. But the onion crop has suffered from fluctuations in the price
due to intermittent production failures and lack of proper market intelligence. Hence, a detailed
analysis of factor responsible for the price behaviour of onion becomes imperative.
As per the opinion of think tank in political arena, onion has got capacity to bringing
down governments and scarring political careers. Political experts believe that, due to 1998
price crisis, the then government in Delhi was voted out. Similarly, during the second and third
week of December, 2010, reports of rising onion prices have made headline news both in
media and dailies and absorbed the attention of the government. The onion is an invariable
item of cooking of all classes and most vital ingredient in Indian diet. No dishes are prepared
without onion and normally use to be available at relatively cheaper price. But in recent days,
the onion has become luxury item for India's poor due to unaffordable price during slack
period of its production.
In the wake of galloping price rise in onion, it is imperative to understand the nature
and causes of price rise and effect on consumer. Hence, an attempt has been made through this

13
report to bring out the reasons for such high rise in the price of onion. In order to give holistic
approach, analysis of past policies to promote production of onion, trend in production and
arrivals, prices and consumer behaviour also have been discussed with the following specific
objectives:
1. To estimate the growth rates and trends in the area, production and yield of onion in
India
2. To analyze the time series data relating to market arrivals and prices of onion in
selected markets across the country
3. To ascertain the market intelligence status for onion in India
4. To analyze the trends in export of onion from India
5. To analyze the institutional arrangement for domestic as well as export marketing of
onion in India
6. To suggest policies and strategies based on the findings of the study

14
Chapter-II:
Profile of Onion
2.1: Harvesting Season Of Onion Crop in Leading States
- Lean season
- Peak season
State JAN FEB MAR APR MAY JUN JUL AUG SEP OCT NOV DEC
Maharashtra
Gujarat
Bihar
Karnataka
Andhra
Pradesh
Madhya
Pradesh
Rajasthan
Haryana
Uttar Pradesh
Source: APEDA Exchange
2.2: Description of varietal Characteristics of Onion grown in India
Agrifound Dark Red
Developed by National Horticultural Research and Development
Foundation, Nasik
Colour of bulbs Dark red
Shape Globular
Measure 4–6 cm with tight skin
Description Notified in 1988 by Government of India
Characteristics Moderately pungent, keeping quality average
Average yield 300–400 quintal per hectare.
Season Recommended for kharif season all over the country
Agrifound Light Red
Developed by NHRDF Colour of bulbs Light red
Shape Globular with tight skin
15
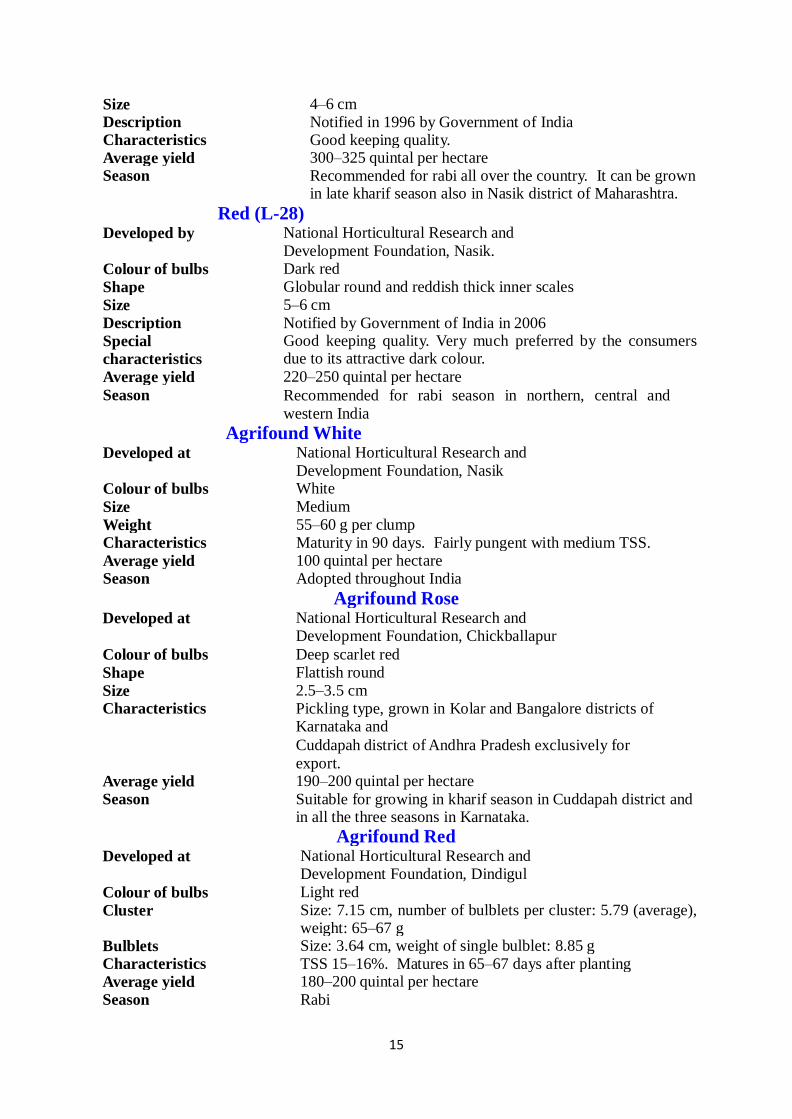
Size 4–6 cm Description Notified in 1996 by Government of India Characteristics Good keeping quality. Average yield 300–325 quintal per hectare Season Recommended for rabi all over the country. It can be grown
in late kharif season also in Nasik district of Maharashtra.
Red (L-28) Developed by National Horticultural Research and
Development Foundation, Nasik.
Colour of bulbs Dark red
Shape Globular round and reddish thick inner scales
Size 5–6 cm
Description Notified by Government of India in 2006 Special
characteristics
Good keeping quality. Very much preferred by the consumers due to its attractive dark colour.
Average yield 220–250 quintal per hectare
Season Recommended for rabi season in northern, central and
western India
Agrifound White
Developed at National Horticultural Research and
Development Foundation, Nasik Colour of bulbs White
Size Medium
Weight 55–60 g per clump Characteristics Maturity in 90 days. Fairly pungent with medium TSS.
Average yield 100 quintal per hectare Season Adopted throughout India
Agrifound Rose
Developed at National Horticultural Research and Development Foundation, Chickballapur
Colour of bulbs Deep scarlet red
Shape Flattish round
Size 2.5–3.5 cm Characteristics Pickling type, grown in Kolar and Bangalore districts of
Karnataka and
Cuddapah district of Andhra Pradesh exclusively for
export. Average yield 190–200 quintal per hectare
Season Suitable for growing in kharif season in Cuddapah district and in all the three seasons in Karnataka.
Agrifound Red
Developed at National Horticultural Research and Development Foundation, Dindigul
Colour of bulbs Light red
Cluster Size: 7.15 cm, number of bulblets per cluster: 5.79 (average), weight: 65–67 g
Bulblets Size: 3.64 cm, weight of single bulblet: 8.85 g Characteristics TSS 15–16%. Matures in 65–67 days after planting Average yield 180–200 quintal per hectare
Season Rabi
16
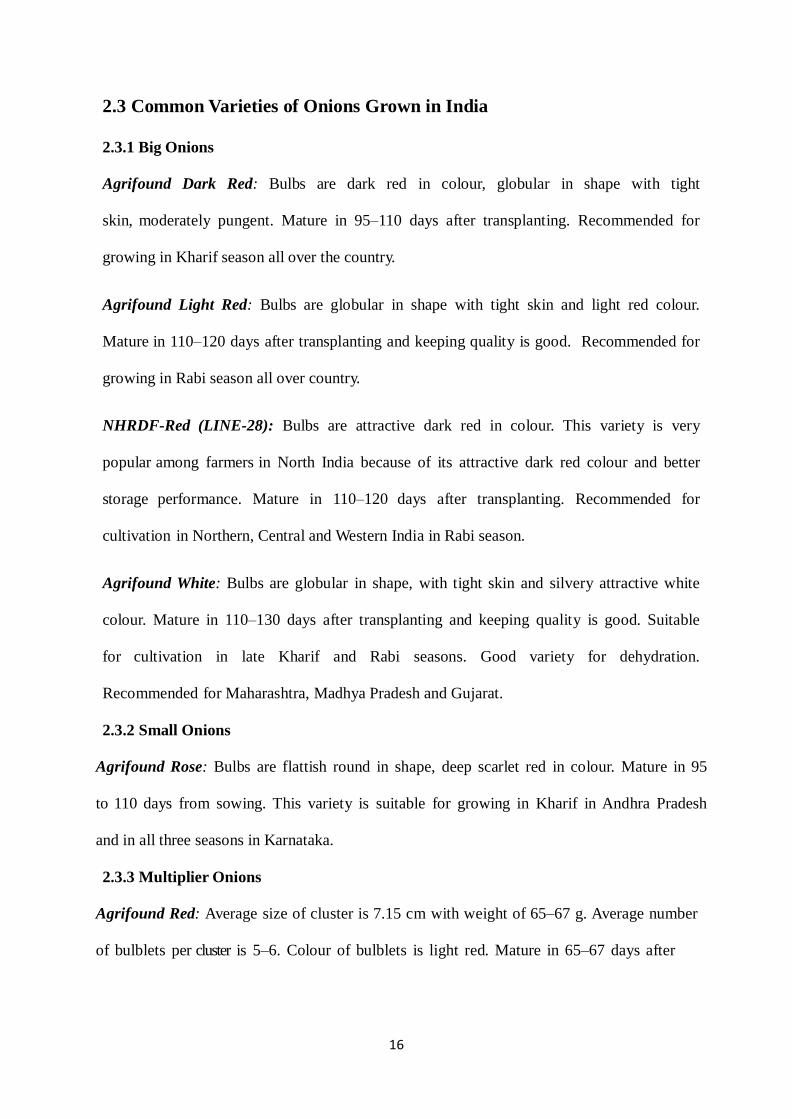
2.3 Common Varieties of Onions Grown in India
2.3.1 Big Onions
Agrifound Dark Red: Bulbs are dark red in colour, globular in shape with tight
skin, moderately pungent. Mature in 95–110 days after transplanting. Recommended for
growing in Kharif season all over the country.
Agrifound Light Red: Bulbs are globular in shape with tight skin and light red colour.
Mature in 110–120 days after transplanting and keeping quality is good. Recommended for
growing in Rabi season all over country.
NHRDF-Red (LINE-28): Bulbs are attractive dark red in colour. This variety is very
popular among farmers in North India because of its attractive dark red colour and better
storage performance. Mature in 110–120 days after transplanting. Recommended for
cultivation in Northern, Central and Western India in Rabi season.
Agrifound White: Bulbs are globular in shape, with tight skin and silvery attractive white
colour. Mature in 110–130 days after transplanting and keeping quality is good. Suitable
for cultivation in late Kharif and Rabi seasons. Good variety for dehydration.
Recommended for Maharashtra, Madhya Pradesh and Gujarat.
2.3.2 Small Onions
Agrifound Rose: Bulbs are flattish round in shape, deep scarlet red in colour. Mature in 95
to 110 days from sowing. This variety is suitable for growing in Kharif in Andhra Pradesh
and in all three seasons in Karnataka.
2.3.3 Multiplier Onions
Agrifound Red: Average size of cluster is 7.15 cm with weight of 65–67 g. Average number
of bulblets per cluster is 5–6. Colour of bulblets is light red. Mature in 65–67 days after
17
planting. Recommended for cultivation in Kharif and Rabi seasons in Tamil Nadu, Karnataka
and Kerala.
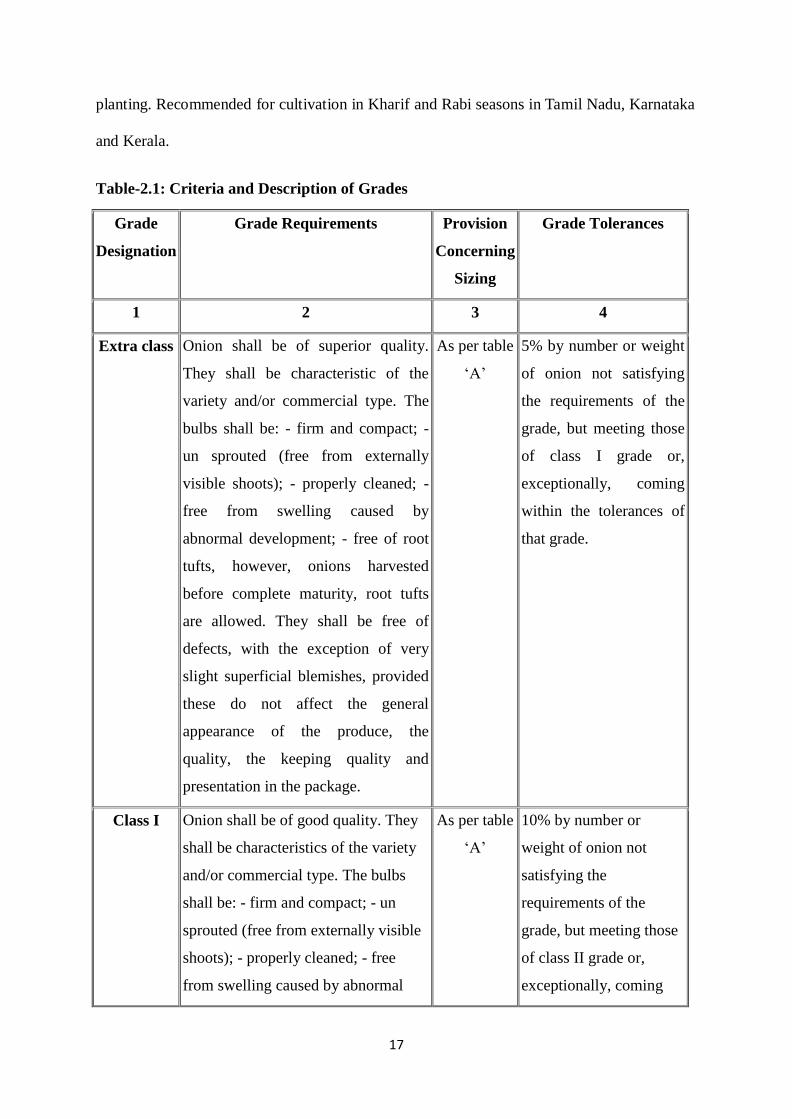
Table-2.1: Criteria and Description of Grades
Grade
Designation
Grade Requirements Provision
Concerning
Sizing
Grade Tolerances
1 2 3 4
Extra class Onion shall be of superior quality.
They shall be characteristic of the
variety and/or commercial type. The
bulbs shall be: - firm and compact; -
un sprouted (free from externally
visible shoots); - properly cleaned; -
free from swelling caused by
abnormal development; - free of root
tufts, however, onions harvested
before complete maturity, root tufts
are allowed. They shall be free of
defects, with the exception of very
slight superficial blemishes, provided
these do not affect the general
appearance of the produce, the
quality, the keeping quality and
presentation in the package.
As per table
‘A’
5% by number or weight
of onion not satisfying
the requirements of the
grade, but meeting those
of class I grade or,
exceptionally, coming
within the tolerances of
that grade.
Class I Onion shall be of good quality. They
shall be characteristics of the variety
and/or commercial type. The bulbs
shall be: - firm and compact; - un
sprouted (free from externally visible
shoots); - properly cleaned; - free
from swelling caused by abnormal
As per table
‘A’
10% by number or
weight of onion not
satisfying the
requirements of the
grade, but meeting those
of class II grade or,
exceptionally, coming
18
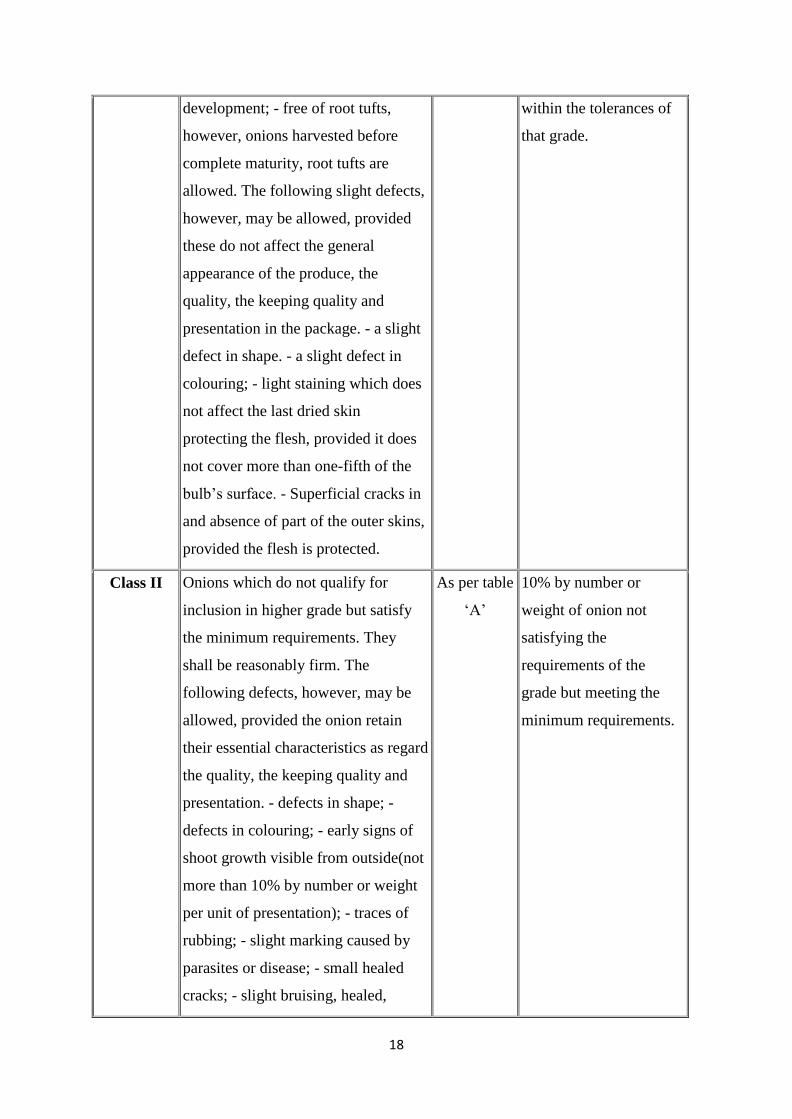
development; - free of root tufts,
however, onions harvested before
complete maturity, root tufts are
allowed. The following slight defects,
however, may be allowed, provided
these do not affect the general
appearance of the produce, the
quality, the keeping quality and
presentation in the package. - a slight
defect in shape. - a slight defect in
colouring; - light staining which does
not affect the last dried skin
protecting the flesh, provided it does
not cover more than one-fifth of the
bulb’s surface. - Superficial cracks in
and absence of part of the outer skins,
provided the flesh is protected.
within the tolerances of
that grade.
Class II Onions which do not qualify for
inclusion in higher grade but satisfy
the minimum requirements. They
shall be reasonably firm. The
following defects, however, may be
allowed, provided the onion retain
their essential characteristics as regard
the quality, the keeping quality and
presentation. - defects in shape; -
defects in colouring; - early signs of
shoot growth visible from outside(not
more than 10% by number or weight
per unit of presentation); - traces of
rubbing; - slight marking caused by
parasites or disease; - small healed
cracks; - slight bruising, healed,
As per table
‘A’
10% by number or
weight of onion not
satisfying the
requirements of the
grade but meeting the
minimum requirements.

19
unlikely to impair keeping qualities; -
root tufts; - stains which do not affect
the last dried skin
protecting the flesh provided they do
not cover more than half the bulb’s
surface; - Cracks in the outer skins
and the absence of a part of the outer
skins from not more than one third of
the bulb’s surface, provided the flesh
is not damaged.
Source: APEDA EXCANGE
Table-2.2: According to AGMARK standards Onions are classified into following classes:
Size Code
Diameter (in
mm.)
Difference between the diameter of the smallest and the
largest onion in the same package (in mm.)
A 10-20 5
B 21-40 15
C 41-70 20
2.4 POST-HARVEST MANAGEMENT OF BULBS (Source: NHRDF, Nasik)
Adequate information was not available on post-harvest technology of onion
particularly under Indian conditions till NHRDF initiated the work on this aspect at their own
and in Collaboration with other agencies as well as under All India Coordinated Research
Project on Post-Harvest Technology of ICAR. The trials on various aspects were carried out to
assess the performance and the recommendations are now available for adoption by onion
growers.
The impact of post-harvest technology is found better when it is combined with pre-
harvest factors determining shelf-life and thus integrated approach is absolutely essential as no

20
single factor can show required impact as also the response of various factors depend on
prevailing weather conditions.
Shed curing
Among pre-harvest factors, use of good store varieties such as Agrifound Light Red
and Arka Niketan has proved much beneficial. Restriction on use of excessive and delayed
nitrogen application (not exceeding 100 kg/ha under normal fertility condition and application
of N in 2-3 splits within 60 days of transplanting), use of ammonium sulphate instead of urea
for topdressing, more use of organic manures to fulfil nutritional requirement, use of
vermicompost, neem cake etc. have also showed encouraging results. Many new formulations
of organic manures are now available and these can be tried by onion growers.
A good storage variety

21
Over-watering of onion crop is always harmful. Irrigation at 1.25 ID/CPE with reduced
N and irrigation frequency depending on weather conditions as well as more gaps between 2
irrigations till 60 days after transplanting is beneficial. Similarly last irrigation given 10-15
days before harvesting reduces microbial losses in stored onions compared to withholding of
irrigation before 5 days.
Major response was, however, recorded with pre-harvest pesticides sprays on decay in
storage giving better results for 0.02% streptomycin and 0.1% carbendazim 10 days before
harvesting. Application of thiophanate methyl @ 0.1% + streptocyclin or klorocin @ 0.2% +
ekalux @ 0.25% immediately after neck cut and combined with field and shade curing is
promising under North Indian conditions while use of maleic hydrazide @ 2000-3000 ppm 75
days after planting for kharif onions and @ 2500 ppm combined with 0.1% carbendazim spray
10 days before harvesting in rabi onions give promising results.
Stage of harvesting plays a major role in determining the shelf-life of onions as it is
linked with physiological maturity of bulbs. Harvesting one week after 50% neck fall and field
curing by windrow method for 3-5 days till foliage turn yellow is recommended. Curing
of kharif onions in sun or solar dryer with foliage and storage with dried foliage is better while
curing in perforated crates with forced air circulation is recommended for rabi onions.
Stage of curing is another important step of post-harvest
handling to reduce losses and maintain quality of bulbs in
storage. Shade curing after field curing and neck cut to remove
excess moisture from surface of bulbs and to remove the field
heat before packing, transportation or storage is essential
operation. Shade curing for 10 days is optimum as extended
Windrow curing

22
shade curing has no any detrimental effects. It also helps the
detachment of soil attached to roots, shedding of dried roots and
thereby eliminating the chances of microbial infection in
storage. Removal of foliage leaving 2.5 -3cm neck is beneficial.
Sorting and grading should be done at field level to minimize post-harvest losses at
subsequent stages. Use of consumer packing for graded bulbs, avoid drop of bulbs from more
than 30 cm height, avoid sunscald by eliminating over-drying of outer scales directly in sun
etc. improve shelf-life of onions.
Perforated hessian bags and plastic-woven bags are used for onion packing to permit
proper ventilation. Tier system of transportation on poor roads, restriction of loading height in
trucks and wagons, providing ventilation in railway wagons and quick movement of onion
wagons or truck loads are other factors which can help in minimizing the post-harvest losses of
onions.
2.5 Use of irradiation improves shelf-life of onions
Exposure of onion bulbs after harvesting when bulbs are in dormant stage with 60-90
Gy inhibit their sprouting regardless of crop season, environmental condition and type of
storage. However, to reduce the microbial and other losses, combined use of irradiation with
improved storage and providing the irradiation facilities at production level are to be
considered.
Onions when spoiled if not disposed off immediately cause nuisance and
environmental pollution. Such spoiled bulbs, scales, peels and rejected portion of onion bulbs
from processing units form a large quantity and thus conversion of this into compost or manure
or vermicompost is suitable alternative. Such manures after complete decomposition, since has

23
manurial value comparable with farmyard manure, can be used for various crops.
2.6 Storage of onions
In Maharashtra, Gujarat, Haryana and Western Uttar Pradesh large-scale storage of
onions is taken in conventionally-designed structures. In other states, the storage is taken only
on small scale but now showing increasing trend after the post-harvest technology and
improved storage structures have been popularized by NHRDF.
Traditional storage practices result in substantial losses in stored onions; hence use of
improved storage structures as well as use of good store varieties, judicious use of fertilizers,
timely irrigation and post-harvest technology is essential to reduce the losses in stored onions.
Manglore tiled storage
Storage temperature and humidity affect loss in weight, respiration rate, sprouting,
rotting and quality of bulbs in storage. The dormancy in onion bulbs is the main factor to
determine as how long the bulbs can be stored. Inherent characters of dormancy based on
equilibrium of inhibitors in onion bulbs also gets affected by temperature where lower (00C)
and higher (300C) temperature increase the dormant state of onion bulbs and moderate (10-
150C) temperature enhance the sprouting losses by breaking dormancy. Higher temperature,
however, increases the rottage if accompanied with high humidity and desiccation/water loss is
reduced at higher humidity but it increases the rooting and rotting. Hence equilibrium of
temperature and relative humidity by providing sufficient aeration/ventilation is needed in
improved onion store houses. The improved storage godown designed by NHRDF is based on
the above factors.

24
.
Improved ventilated storage structure
Salient features of improved storage structures
Construction of structure on raised platform to prevent moisture contact and dampness.
Use of Mangalore tiled roof or other suitable material to prevent build-up, high temperature
inside. Providing bottom ventilation for free and faster air circulation to avoid formation of
hot and humid pockets between the onion layers.
Avoid direct sunlight on onion bulbs to reduce sunscald, fading of colour and quality
deterioration.
Restriction on width of each stack to 60-75 cm for hot and humid weather, 75 - 90 cm for
mild and humid weather and 90-120 cm for mild and dry weather conditions.
Maintenance of stacking height to 100 cm for small and multiplier onions and hot weather
and 120 cm for mild weather and for big onions to avoid pressure bruising.
Providing cubicles instead of continuous stack and sufficient space for ventilation from all
sides.
One cubic meter area of store accommodates about 750 kg onions. Accordingly
construction of godown for required capacity and construction of more units instead of
single big structure and in zigzag manner when constructed in more rows to have better
aeration.
Providing 2-tier if space available is insufficient.
Periodical disinfection of structures and premises to check rottage. The cost-efficient of
structures is based on locally - available materials and labour.

25
Chapter-III:
3. AGRICULTURAL MARKETING IN KARNATAKA AND MAHARASHTRA
3.1 AGRICULTURAL MARKETING IN KARNATAKA
The state of Karnataka has highly diversified cropping patter varying from high value
export oriented spices to completely home market focused foodgrains. Agricultural produce at
the primary level in the state is routed mainly through four channels i.e. direct to consumers;
through private wholesalers and retailers; through public agencies and through processors.
Marketing structure of the agricultural produce and the share of different channels in total
marketed surplus vary from commodity to commodity and across regions. However, regulated
markets are an important link in the movement of agricultural produce as a large quantity of
produce is transacted through them mainly the foodgrains.
The institutional arrangement in place for marketing of various commodities consists
mainly of various commodity specific boards and market cooperatives. These Boards usually
covered plantation crops like coffee, tea, cardamom, spices, etc. Other commercial crops like
cotton and tobacco are also controlled by commodity boards. The functioning of the boards
involves procuring, marketing, price fixation, export, dissemination of technical knowledge
and other support to the farmers. The other important institutional arrangement is the network
of regulated markets spread throughout the state. A total of 152 principle market yards with
352 sub-yards were operational in the state during 2010-11 (Table 3.1). In addition, there are
730 rural primary markets to facilitate the movement of agricultural commodities from farm
gate to the consumer.
The agricultural marketing in the state is practiced under the Karnataka Agricultural
Produce Marketing (Regulation) Act 1966. The Act has been enacted to provide a uniform law
relating to the better regulation of buying and selling of Agricultural Produce and the
establishment of Markets for Agricultural Produce throughout the State. The Act has been

26
enacted & given effect to from 1st May 1968 by repealing and replacing the following Acts
which were in force in the several areas in the state.
Table-3.1. Status of Regulated Markets in Karnataka
Year Main Markets Sub Markets Total Markets
2000-01 141 343 484
2001-02 141 342 483
2002-03 144 343 487
2003-04 145 350 495
2004-05 145 347 492
2005-06 145 350 495
2006-07 146 352 498
2007-08 146 352 498
2009-10 146 355 501
2010-11 152 352 504
1. The Bombay Agricultural Produce Markets Act, 1939 (Bombay Act, 22 of 1939 as in
force in Bombay area)
2. The Madras Commercial Crops Markets Act, 1933 (Madras Act, 20 of 1933) as in
force in the Madras area and as in force in Bellary District
3. The Coorg Agricultural Produce Markets Act, 1956 (Coorg Act, 7 of 1956) as in force
in Coorg District
4. The Hyderabad Agricultural Produce Markets Act, 1339 F(Hyderabad Act, 2 of 1339
F) as in force in Hyderabad area
5. The Mysore Agricultural Produce Markets Act, 1939 (Mysore Act, 16 of 1939) as in
force in Mysore area
6. A Market at Bailahongal was established under the Bombay Agricultural Produce
Markets Act, during 1936 and at Tiptur under The Mysore Agricultural Produce
Marketing Act, during 1948 in the State. Department of Agricultural Marketing which
was earlier a unit of the Co-operation Department started functioning as an
independent department during the year 1972.
Agricultural marketing structure in the state is a two pronged integrated vertical
administrative organization consisting of Department of Agricultural Marketing and Karnataka
State Agricultural Marketing Board (KSAMB). The main task of the Department of
Agricultural Marketing is the establishment of Market Yards, submarket yards and developing
27
and maintaining the market yards and sub market yards through Agricultural Produce Market
Committees (APMCs). Enforcing the regulatory measures in respect of sale and purchase of
Agricultural produce brought by the Agriculturist to the market yards, providing a platform to
ensure competitive prices, correct Weighment, payment and creating an exploitation free
atmosphere by preventing illegal activities in the marketing of agricultural produce. In
addition, the Department has also to regulate the activities of warehouses by enforcing the
licensing conditions and establishment and maintenance of laboratories for the purpose of
grading of agricultural produce in the State.
The Karnataka State Agricultural Marketing Board (KSAMB) takes care of the
development aspects of the agricultural marketing in the state. The Board, established on 1st
September 1972 as per section 100 of the Karnataka Agricultural Produce Marketing
(Regulation and Development) Act, 1966 and Rules 1968, acts as a link between the Market
Committees and the Government of Karnataka for all round development of agricultural
marketing in the State. The Board is the policy and decision making body. The executive Head
of the Board is the Managing Director. These are four divisional offices at Bangalore, Mysore,
Belgaum and Gulbarga. In addition, there are the Karnataka Institute of Agricultural Marketing
at Mysore and Agricultural Marketing Training College at Hubli.
The Karnataka State Agricultural Marketing Board (KSAMB) has implemented
numerous welfare schemes such as Raitha Sanjeevini Scheme, Hamals Housing, Janashree
Vima Yojana for weighmen, cartmen and Hamals, Insurance Scheme for the benefit of farmers
and market functionaries.
3.1.1 Pledge loan scheme
The State of Karnataka has implemented the pledge loan scheme under which the loan
is distributed to the farmers through market committees against the pledge of agricultural

28
commodities. This scheme was initiated on 01-04-1994 and commenced its operation on 15-
08-1995. During the time of fall in price, agriculturists can store their produce in the APMC
godowns or warehouses and avail short-term loan up to 60 percent of the value of the
agricultural produce to a maximum of Rs 50,000/-, whichever is lower against the pledge of
their agricultural produce for a period of 90 days. No interest is being charged for the first 30
days, interest at the rate of 8 per cent and 12.5 per cent is being charged for the next two
successive 30 days period, respectively. The market committee is empowered to dispose off the
produce after 90 days in case the farmer fails to repay the loan.
3.1.2 Revolving fund scheme/floor price scheme
In order to ensure price stability in the agriculture sector, it is necessary to ensure
remunerative prices for the farmers’ produce. It is, with this objective that floor price scheme
for agricultural commodities in Karnataka has been implemented and it was later known as
revolving fund scheme. The aim is to protect the interests of the farmers against severe price
fall of agricultural commodities by assuring a floor price. The scheme shall be applicable to all
the notified agricultural and horticultural commodities grown in the entire state. The scheme
has come into effect from November 1999. A Revolving Fund of Rs.100 crores has been
mobilized by equal contributions from the state government and market committees. The
money available in the Revolving Fund is not only utilized to supplement the Minimum
Support Price (MSP) operations of the Government of India but also to procure commodities
that are not covered under the MSP Scheme. Under this scheme, floor price for onion was
fixed and purchases were made at a cost of Rs. 1.06 crores during 1999-2000. Government
extended the scheme for other commodities such as maize, jowar etc., as well by increasing the
quantum of revolving fund by time to time. The state Government enhanced the Revolving
Fund to about Rs.400 crores during the year 2003-04. In this connection the rate of market fee
of one per cent was enhanced to 1.5 per cent. This additional market fee helped in mobilizing

29
addition collection to the tune of 50 crores annually which is exclusively ear marked for the
Revolving Fund. It would ensure that no farmer in the state is forced to make distress sale.
Each market committee contributes 5 per cent of its income by way of market fee to Karnataka
State Agricultural Marketing Board (KSAMB). The annual income of the Board from the
source of market fee was Rs. 88.29 crores during 2002- 03.
3.1.3 Raitha Sanjeevini Scheme
This is an accident benefit scheme implemented by KSAMB since 1996. All the
farmers and their family members of the state in the age group of 18 to 75 are eligible for the
benefits available under the scheme. Under the scheme, there is provision for a compensation
of Rs 25,000/-, if a farmer dies due to the accident while performing any agricultural
production or marketing operation. The incentive ranges from Rs.1, 500 to Rs.15, 000 for other
kinds of disability. The beneficiaries may apply to the APMCs and the KSAMB, Bangalore
will sanction the money. There is an annual budget of Rs. 50 lakhs for this scheme. The Board
has so far settled 5,967 claims with a budget of Rs.14.76 crores.
3.1.4 Janashree Vima Yojana for Weighmen, Hamals and Cartmen
The Board has implemented an insurance scheme with the help of LIC for the benefit
of 16,000 licensed Weighmen, Hamals and Cartmen working in different APMCs of State. The
benefit available under the scheme is Rs 30,000/- in case of natural death and Rs 75,000 in
case of accidental death. The total amount released as compensation since 1996 is Rs.3.55
crores benefiting 1,338 persons.
The introduction of regulated markets and creation of infrastructure in the state have
been responsible for bringing favorable changes in the marketing of agricultural produce in the
state. Increase in the proportion of total production reaching markets, control on unscrupulous
activities lead to improvement in the efficiency of markets, better dissemination of market
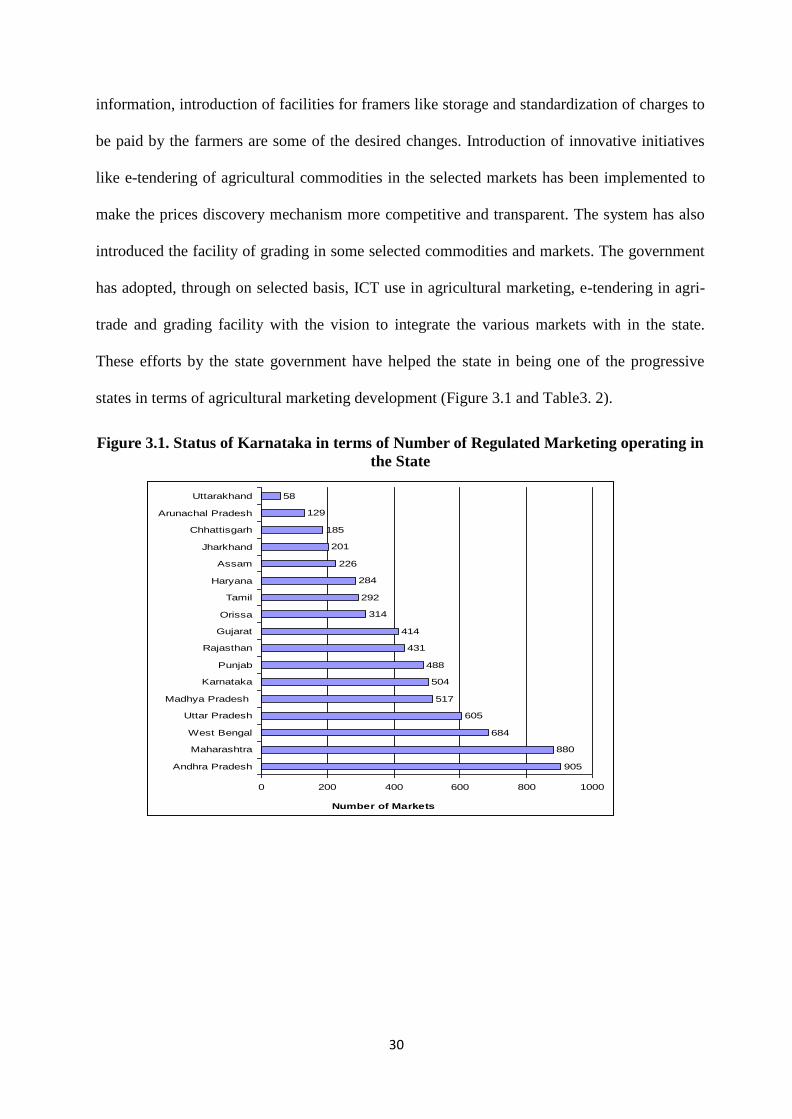
30
information, introduction of facilities for framers like storage and standardization of charges to
be paid by the farmers are some of the desired changes. Introduction of innovative initiatives
like e-tendering of agricultural commodities in the selected markets has been implemented to
make the prices discovery mechanism more competitive and transparent. The system has also
introduced the facility of grading in some selected commodities and markets. The government
has adopted, through on selected basis, ICT use in agricultural marketing, e-tendering in agri-
trade and grading facility with the vision to integrate the various markets with in the state.
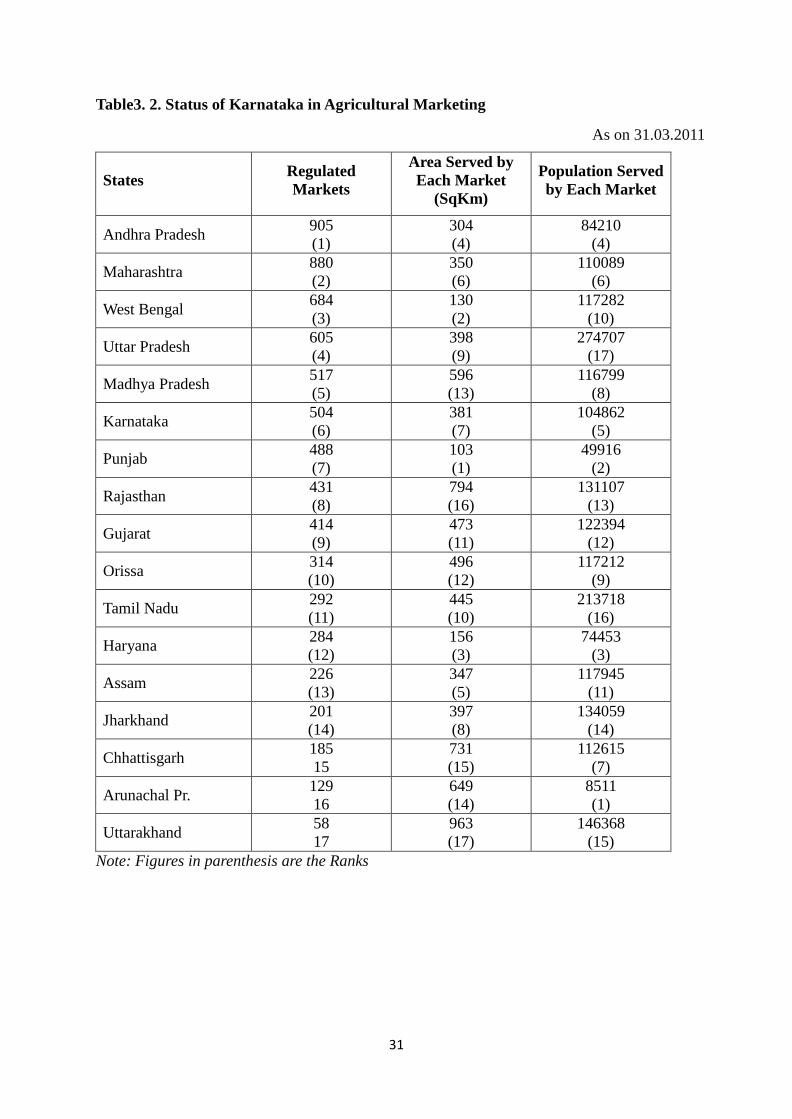
These efforts by the state government have helped the state in being one of the progressive
states in terms of agricultural marketing development (Figure 3.1 and Table3. 2).
Figure 3.1. Status of Karnataka in terms of Number of Regulated Marketing operating in
the State
905
880
684
605
517
504
488
431
414
314
292
284
226
201
185
129
58
0 200 400 600 800 1000
Andhra Pradesh
Maharashtra
West Bengal
Uttar Pradesh
Madhya Pradesh
Karnataka
Punjab
Rajasthan
Gujarat
Orissa
Tamil
Haryana
Assam
Jharkhand
Chhattisgarh
Arunachal Pradesh
Uttarakhand
Number of Markets
31
Table3. 2. Status of Karnataka in Agricultural Marketing
As on 31.03.2011
States Regulated
Markets
Area Served by
Each Market
(SqKm)
Population Served
by Each Market
Andhra Pradesh 905
(1)
304
(4)
84210
(4)
Maharashtra 880
(2)
350
(6)
110089
(6)
West Bengal 684
(3)
130
(2)
117282
(10)
Uttar Pradesh 605
(4)
398
(9)
274707
(17)
Madhya Pradesh 517
(5)
596
(13)
116799
(8)
Karnataka 504
(6)
381
(7)
104862
(5)
Punjab 488
(7)
103
(1)
49916
(2)
Rajasthan 431
(8)
794
(16)
131107
(13)
Gujarat 414
(9)
473
(11)
122394
(12)
Orissa 314
(10)
496
(12)
117212
(9)
Tamil Nadu 292
(11)
445
(10)
213718
(16)
Haryana 284
(12)
156
(3)
74453
(3)
Assam 226
(13)
347
(5)
117945
(11)
Jharkhand 201
(14)
397
(8)
134059
(14)
Chhattisgarh 185
15
731
(15)
112615
(7)
Arunachal Pr. 129
16
649
(14)
8511
(1)
Uttarakhand 58
17
963
(17)
146368
(15)
Note: Figures in parenthesis are the Ranks

32
The regulated markets, as suggested by various studies, have achieved limited success
and their relevance have declined in the time of liberalization, globalization, better purchasing
power on account of economic growth and demand for safe and healthy food. Accordingly, the
Government of India on the recommendation of the Expert Committee for Agricultural
Marketing and the Inter-Ministerial Task Force has prepared a Model Act for bringing about
the desired changes in the APMR Act. Karnataka is one of early states who recognized the
importance of these reforms for strengthening and development of agricultural marketing in
the state and have amended their APMR Act on the lines suggested in Model Act circulated by
the Government. The amended act have introduced provisions mainly for direct marketing;
contract farming and development of markets in private/ cooperative sectors. The Act also
speaks in favour of setting up of special markets and special commodity market, public
private partnership (PPP) in market extension activities of market committee, Single point levy
of market fee, promote and encourage e-trading to bring efficiency and transparency in price
discovery, etc.
3.2 Status of Agricultural Marketing in Maharashtra
Agricultural Marketing and Market Infrastructure in Maharashtra Amended Maharashtra
Agricultural Produce Marketing (Regulation) Act, 1963 as per the Model Act circulated by
GoI, Maharashtra has made suitable amendments in its Maharashtra Agricultural Produce
Marketing (Regulation) Act, 1963. The State amended the Act in June 2006 and framed rules
in June 2007. In the amended Act, the concept of development was introduced along with
regulation. The amended Act is entitled as “Maharashtra Agricultural Produce Marketing
(Development and Regulation) (Amendment) Act, 2006. The following are the important
amendments made in the Act: 1) Introduction of greater competition: Most of the agricultural
markets in the state have always suffered due to dominance of certain market functionaries.
Some of the provisions of Maharashtra APMC 1963 Act prohibited the farmers to enter into

33
direct contact with the processors/manufacturers located outside the market area. The
commodity sell was channelized through regulated markets and it led to inefficient market
outcomes. However, as per the amended Act 2007, rules have been framed to allow greater
freedom to farmers to sale their produce directly to consumers, processors or manufacturers.
For this, the Act has made provision for establishment of private markets, farmer- consumer
markets and direct marketing. In this, farmers can deal with any licensed person, partnership
firm, co-operative society, NGO or companies who have established a private market as per
stipulated conditions of DMI.
Apart from this, provisions are also made to declare certain markets as special
commodity markets on the basis of arrivals, turnover, and geographical area. This is to
encourage development of specialized markets having modern infrastructure and storage
facilities with private sector participations. This is a great step particularly for promoting
efficiency in onion markets. The Maharashtra APMC Act, 1963, has been amended so as to
promote competitive marketing. After the amendment, the State has issued 72 licenses under
direct marketing, gave approval to 7 private markets, identified 33 locations for Farmer-
Consumer Markets, facilitated contract farming under 1 Lakh hectares, organized 20 festivals
for promoting special commodity markets and given licenses to 09 private players under
Single License System. State has also made some efforts to promote Public Private Partnership
and has proposed to set up terminal market for fruits and vegetables at Mumbai, Nasik and
Nagpur. The project will be implemented by competitive bidding process. The key objective of
terminal market is to ensure a more transparent, efficient and modern marketing system for
perishable fruits and vegetables with few or no middlemen so that farmers/growers/producers
can receive more remunerative prices for their produce. The terminal markets provide multiple
options to farmers for disposal of produce. Such markets are expected to reduce post harvest
losses and increase farmer’s realization. Marketing infrastructure in the state has also

34
undergoing major changes. Under MARKNET project, computerization of 291 APMCs and 54
submarkets is completed. Agri-Export Zones (AEZ) has been set up in the state and six facility
centres for export have been created. The concept of AEZs aims at strengthening the entire
value chain in a comprehensive manner for an identified crop coming from a geographically
contiguous manner. Rural godowns, and onion storage structures are being constructed and
grading and standardization of produce is encouraged. Television to disseminate arrival and
price information of agricultural commodities has made inroads to strengthen infrastructure. A
Memorandum of Understanding (MoU) between Reuters and MSAMB was signed in May
2007 to provide information about market arrivals, prices, weather forecast, and market
guidelines to farmers through mobile telephones. More than 10,000 farmers have subscribed to
this facility. It can be observed that under amended APMC Act, there exists scope for private
investment in agricultural markets and also direct buying of produce from farmers by traders
and processors. Thus the monopoly of APMC controlled markets has been restricted and the
scenario related to agricultural marketing has begun to change. In view of the changes made in
APMC Act, direct marketing, contract farming, corporate entry into agricultural markets etc.
have begun to make inroads into agricultural marketing. The Act of 1963 led to the supply
chain in India becoming inefficient because of the presence of a large number of intermediaries
in agricultural marketing. The presence of intermediaries in India is a substitute for
infrastructure. These intermediaries perform the distribution function as produce is normally
consolidated at the village markets and reconsolidated again by intermediaries at least two to
three times before it reaches the final consumer. The supply chain is dominated by traders who
operate on high margins for no value addition. In such a process there is wastage and huge
losses besides both the farmer and consumer lose in terms of price. A more integrated market
structure where the farmer is provided by both backward and forward linkage as incorporated
in the amended Act will therefore help to minimize on inefficiencies in the marketing system.
35
Chapter-IV
Data and Methodology
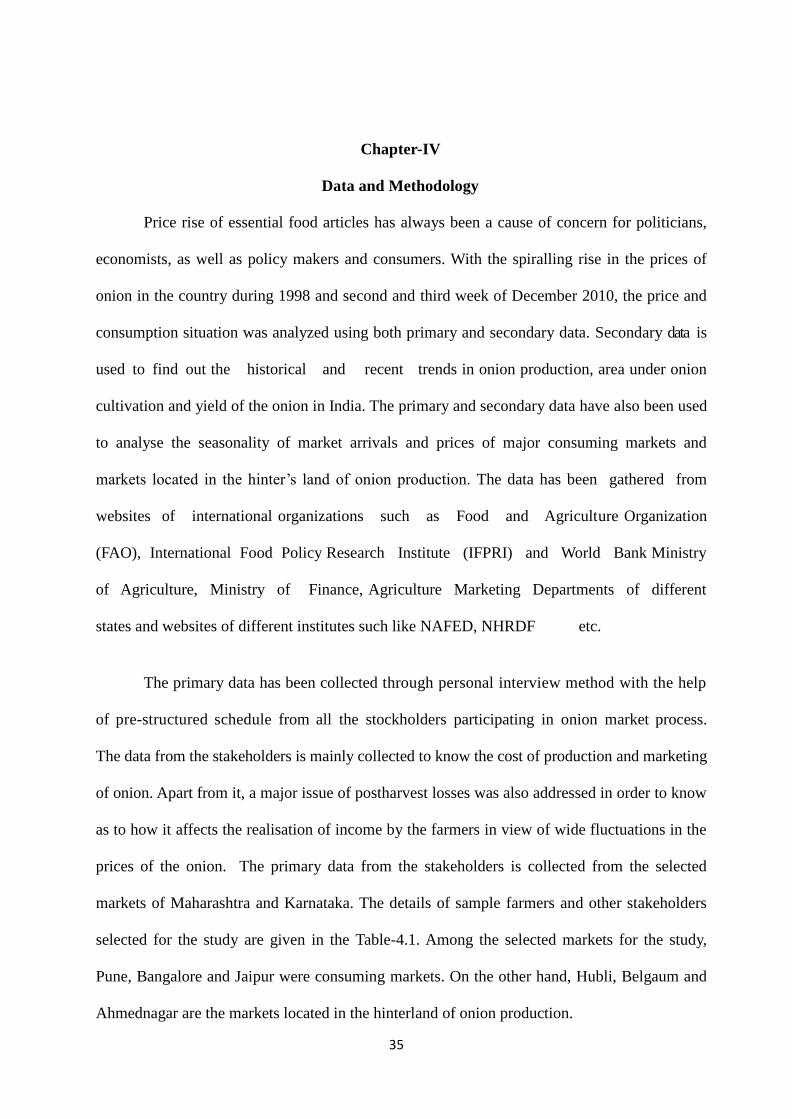
Price rise of essential food articles has always been a cause of concern for politicians,
economists, as well as policy makers and consumers. With the spiralling rise in the prices of
onion in the country during 1998 and second and third week of December 2010, the price and
consumption situation was analyzed using both primary and secondary data. Secondary data is
used to find out the historical and recent trends in onion production, area under onion
cultivation and yield of the onion in India. The primary and secondary data have also been used
to analyse the seasonality of market arrivals and prices of major consuming markets and
markets located in the hinter’s land of onion production. The data has been gathered from
websites of international organizations such as Food and Agriculture Organization
(FAO), International Food Policy Research Institute (IFPRI) and World Bank Ministry
of Agriculture, Ministry of Finance, Agriculture Marketing Departments of different
states and websites of different institutes such like NAFED, NHRDF etc.
The primary data has been collected through personal interview method with the help
of pre-structured schedule from all the stockholders participating in onion market process.
The data from the stakeholders is mainly collected to know the cost of production and marketing
of onion. Apart from it, a major issue of postharvest losses was also addressed in order to know
as to how it affects the realisation of income by the farmers in view of wide fluctuations in the
prices of the onion. The primary data from the stakeholders is collected from the selected
markets of Maharashtra and Karnataka. The details of sample farmers and other stakeholders
selected for the study are given in the Table-4.1. Among the selected markets for the study,
Pune, Bangalore and Jaipur were consuming markets. On the other hand, Hubli, Belgaum and
Ahmednagar are the markets located in the hinterland of onion production.

36
The survey for Jaipur market was conducted during January 2011 to study the reasons
for skyrocketing of prices of onion.
Table-4.1: Sampling Method
Place APMC Farmers Commission Agents (CA) and
Wholesalers (WS)
Retailers Consumers
CA WS Total I. Maharashtra
1) Ahmednagar 1 20 05 05 10 10 2) Pune 1 20 05 05 10 10 Sub-Total 2 40 10 10 20 20
II. Karnataka 1) Hubli 1 25 10 10 20 10 2) Bangalore 1 25 10 10 20 10 3) Belgaum 1 25 10 10 20 10 Sub-Total 3 75 30 30 60 30
III. Rajasthan* Jaipur 1 - 5 5 10 25 96 Grand Total (I+II) 12 115 45 45 90 75 96
* Survey in Rajasthan was conducted during 2010-11
4.1 Analytical tools used
Seasonal Variation Index for each month is calculated with the following formula. For
example for the month of January,
Average of monthly averagesX100
Monthly average for January
Apart from this, to examine the price stability between markets the variability in prices of
Onion in these markets is determined by co-efficient of variation and this is used to assess the
market-wise extent of variation in jasmine price across the month. In order to study, the
variability in Onion prices, the following formula is used.
Mean ÷Standard deviationX100
Apart from these techniques, the Cob-Douglas form of Production function was used to
calculate the growth rates in area, production and yield of onion.

37
Chapter-V: Results and Discussion
Table-5.1: Details of Arrival Pattern of Onion in Leading States
S.No. States Cropping
season
Availability
1. Maharashtra and Gujarat Kharif crop Late
Kharif Rabi
October – December
January – March April –
June
2. Tamil Nadu, Karnataka and Andhra
Pradesh
Early Kharif
Rabi
August October –
November
March – April
3. Rajasthan,Bihar,Uttar Pradesh,
Haryana,Punjab,West Bengal and
Orissa
Kharif Rabi November – December
May – June
Source: APEDA, AGRI-EXCHANGE
Table-5.2: Concentrated Pockets
State Districts
Maharashtra Nasik, Ahmednagar ,Pune, Sholapur, Yeola, Pimpalgaon, Malegaon
Karnataka Dharwad ,Belgaum Chitradurg, Gadag, Haveri, Bagalkot, Davengere
Andhra Pradesh Kurnool, Medak, Rangareddy, Cuddapah, Mehboobnagar.
Uttar Pradesh Varanasi, Patan, Kanpur ,Lucknow, Allahabad, Faizabad
Tamil Nadu Coimbatore, Perambadur, Namakkal ,Dindigul Anna, Thirichirapalli,
Periyar
Gujarat Bhavnagar, Surendranagar, Mahua
Punjab Ropar and Ludhiana
5.3 Spatial Distribution of Total Market Arrivals of Onion
Spatial Distribution of Total Market Arrivals of Onion
The National Horticulture Research and Development Foundation (NHRDF) are
reporting arrivals of onion for more than 100 markets. The researcher tried to document the
arrivals during 2011-12. But the reporting in some markets was not complete. Hence, the
arrivals during 2010-11 as reported by NCAER are discussed here. The market arrival
patterns of onion in 107 agricultural markets for the years 2008–09 to 2010–11 is given
in Table 1.4. The total arrivals increased from 4,617 thousand MT in 2008–09 to 6,040
thousand MT in 2009–10 and then declined to 5,897 thousand MT in 2010–11. Thus,

38
while the reported arrivals increased by 30.4 per cent in 2009–10 over 2008–09, the
same declined by 2.4 per cent in 2010–11.
Table-5.3: Gross Arrivals of Onion in Major Markets in India
SN Market
2009
2010
2011
Share (%)
2011
1 Bangalore
(Karnataka)
5167641 5072436 5710423 9.7
2 Kolkata (West
Bengal)
3798885 3854982 3495320 5.9
3 Solapur
(Maharashtra)
780514 2330162 3310419 5.6
4 Delhi 3073828 3870179 3307363 5.6
5 Pune
(Maharashtra)
3081095 3784469 3268482 5.5
6 Mumbai
(Maharashtra)
2351960 2633820 2921005 5.0
7 Pimpalgaon
(Maharashtra)
3849672 3159210 2796128 4.7
8 Lasalgaon
(Maharashtra)
3830136 3398807 2506441 4.3
9 Mahuva (Gujarat) 886214 1906796 2021964 3.4
10 Yeola
(Maharashtra)
1502238 1926720 1756394 3.0
11 Malegaon
(Maharashtra)
1769195 2585137 1685027 2.9
12 Indore (Madhya
Pradesh)
393439 748296 1671166 2.8
13 Ahmednagar
(Maharashtra)
398375 1447910 1505243 2.6
14 Chennai (Tamil
Nadu)
1262000 1228020 1393800 2.4
15 Hubli (Karnataka) 312748 1118793 1295883 2.2
16 Bhavnagar
(Gujarat)
152288 1220596 1268348 2.2
17 Manmad
(Maharashtra)
1765438 1848978 1150378 2.0
18 Ahmedabad
(Gujarat)
752166 737716 1135418 1.9
19 Nagpur
(Maharashtra)
315087 868836 901114 1.5
20 Rahuri
(Maharashtra)
55817 389891 892120 1.5
21 Chandvad
(Maharashtra)
251833 832500 858746 1.5
22 Sangamner
(Maharashtra)
432280 584835 833946 1.4
23 Agra (Uttar
Pradesh)
588871 635229 756755 1.3
24 Gondal (Gujarat) 70368 272086 711048 1.2
25 Devala
(Maharashtra)
590490 770736 647555 1.1
26 Kolhapur
(Maharashtra)
724659 642922 621405 1.1
27 Satana
(Maharashtra)
114232 753063 567588 1.0
28 Alwar (Rajasthan) 635323 514523 0.9
29 Surat (Gujarat) 337930 405800 504890 0.9
30 Jaipur (Rajasthan) 236604 266928 495760 0.8
31 Sinnar
(Maharashtra)
116048 266853 495219 0.8
32 Rahata
(Maharashtra)
100114 734779 455982 0.8
33 Kurnool (Andhra
Pradesh)
258267 311022 431820 0.7
34 Niphad
(Maharashtra)
390218 484801 420755 0.7
35 Kalvan
(Maharashtra)
107830 421710 411900 0.7
36 Bhubneswer
(Orissa)
511050 394750 396100 0.7
37 Guwahati
(Assam)
338375 371414 389280 0.7
38 Bampada (Orissa) 7810 650 368644 0.6
39 Dhavangere
(Karnataka)
142377 260144 351421 0.6
40 Deoria (Uttar
Pradesh)
696 331950 0.6
39
41 Hyderabad
(Andhra Pradesh)
650377 625719 327030 0.6
42 Dhulia
(Maharashtra)
238558 434065 321726 0.5
43 Jodhpur
(Rajasthan)
158777 165698 314257 0.5
44 Belgaum
(Karnataka)
300268 305958 311066 0.5
45 Kanpur (Uttar
Pradesh)
582925 401877 300365 0.5
46 Newasa
(Maharashtra)
428557 634812 268813 0.5
47 Nasik
(Maharashtra)
189362 238446 253112 0.4
48 Rajkot (Gujarat) 12424 203368 250628 0.4
49 Vani
(Maharashtra)
66932 449154 213864 0.4
50 Jammu (Jammu
& Kashmir)
90800 110970 190765 0.3
Total 43537072 56748062 57309349 97.2
Share of Top 50 94.3 93.9 97.2
Grand Total (107
)markets)
46167636 60402945 58972963
Source: NCAER Report
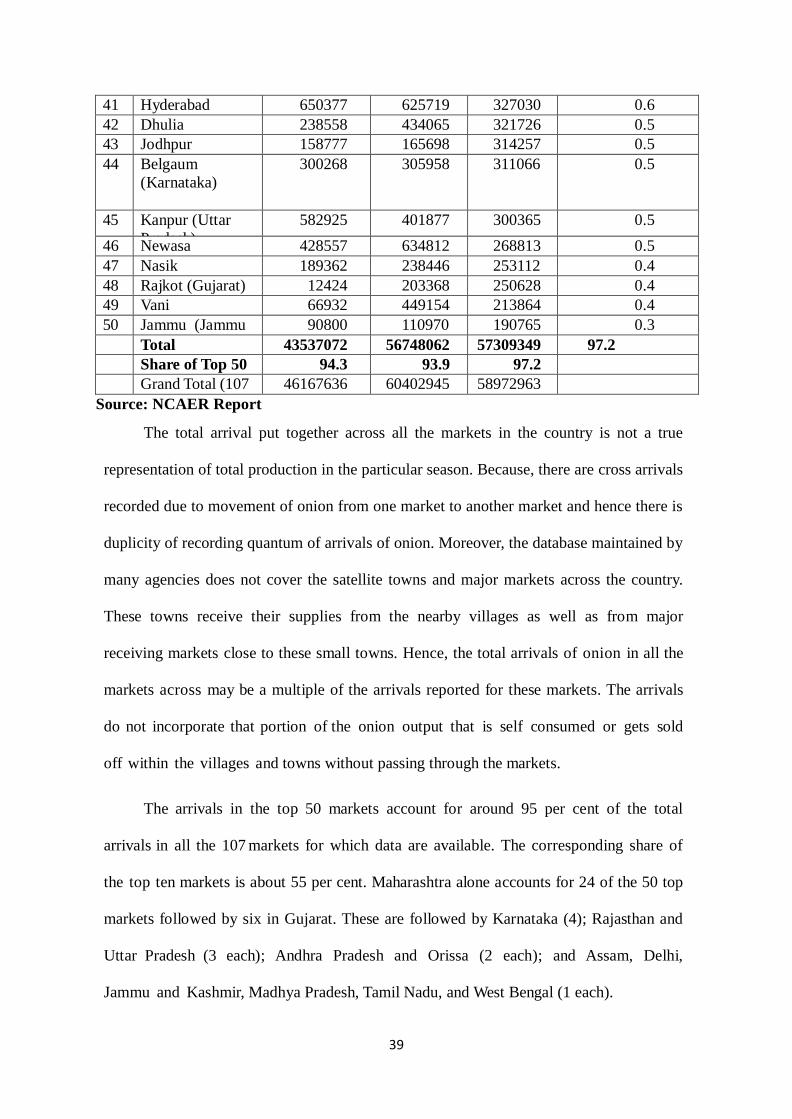
The total arrival put together across all the markets in the country is not a true
representation of total production in the particular season. Because, there are cross arrivals
recorded due to movement of onion from one market to another market and hence there is
duplicity of recording quantum of arrivals of onion. Moreover, the database maintained by
many agencies does not cover the satellite towns and major markets across the country.
These towns receive their supplies from the nearby villages as well as from major
receiving markets close to these small towns. Hence, the total arrivals of onion in all the
markets across may be a multiple of the arrivals reported for these markets. The arrivals
do not incorporate that portion of the onion output that is self consumed or gets sold
off within the villages and towns without passing through the markets.
The arrivals in the top 50 markets account for around 95 per cent of the total
arrivals in all the 107 markets for which data are available. The corresponding share of
the top ten markets is about 55 per cent. Maharashtra alone accounts for 24 of the 50 top
markets followed by six in Gujarat. These are followed by Karnataka (4); Rajasthan and
Uttar Pradesh (3 each); Andhra Pradesh and Orissa (2 each); and Assam, Delhi,
Jammu and Kashmir, Madhya Pradesh, Tamil Nadu, and West Bengal (1 each).

40
The top ten markets with the highest onion arrivals include Bangalore, Kolkata,
Solapur, Delhi, Pune, Mumbai, Pimpalagon, Lasalgaon, Mahuva, and Yeola. Six of the top
ten arrival markets are in Maharashtra with one each in Karnataka, Gujarat, Delhi and
Gujarat. These ten markets account for about 55 per cent of the total reported arrivals.
Table-5.4: Seasonal Indices of Prices of Onion in Major Consuming Markets in India
(2002-2012)
Month
Markets
Ahmedabad Bangalore Chennai Delhi Jaipur Kolkata Mumbai Pune
January 123.19 122.09 130.47 123.12 129.32 118.70 117.71 120.77
February 89.48 94.87 94.47 97.54 102.02 90.46 83.18 79.80
March 70.87 69.33 73.45 76.87 80.08 62.75 67.27 61.16
April 58.83 63.24 69.82 68.43 67.74 59.84 60.22 55.18
May 57.66 65.54 65.97 62.58 57.27 63.21 61.84 58.47
June 73.09 79.43 78.81 69.25 60.74 74.84 75.56 78.33
July 85.45 91.85 86.49 85.66 75.33 86.86 86.87 89.64
August 102.58 106.04 96.01 104.76 94.05 101.67 99.22 103.11
September 114.31 104.03 98.60 119.74 124.29 115.10 115.09 114.32
October 127.40 120.37 120.44 140.77 148.55 135.40 135.00 132.16
November 144.26 142.49 140.56 126.49 132.91 143.05 150.81 150.04
December 152.89 140.72 144.91 124.81 127.70 148.13 147.23 157.02
Figure-5.1 Seasonal Trends in Prices of Onion in Important Consuming Markets of
India (2002-2012)
0.00 50.00 100.00 150.00 200.00
January
February
March
April
May
June
July
August
September
October
November
December
Pune
Mumbai
Kolkata
Jaipur
Delhi
Chennai
Bangalore
Ahmedabad

41
Table-5.5: Seasonal Indices of Arrivals of Onion in Major Consuming Markets in India
Month
Markets
Ahmedabad Bangalore Chennai Delhi Jaipur Kolkata Mumbai Pune
January 108.85 79.44 105.15 83.07 84.61 98.31 114.05 123.46
February 103.56 61.10 100.97 81.43 75.89 122.95 108.79 163.38
March 109.00 65.91 105.10 109.76 89.83 94.70 120.93 158.99
April 127.59 67.30 88.05 100.33 103.95 70.45 102.23 113.53
May 80.63 71.72 101.21 103.45 130.55 106.35 88.79 105.49
June 89.24 64.55 104.41 113.29 154.23 99.32 94.56 86.49
July 93.16 64.44 109.57 103.63 128.90 118.75 97.08 79.99
August 86.58 78.37 88.33 89.04 115.08 109.58 81.89 72.89
September 83.34 126.29 103.54 83.00 97.65 97.74 90.20 65.96
October 88.07 221.61 88.94 88.54 79.84 95.87 90.68 69.79
November 111.01 176.69 102.96 131.69 75.49 84.85 100.35 74.26
December 118.98 122.57 101.78 112.77 63.97 101.15 110.43 85.76
Figure-5.2 Seasonal Trends in Arrivals of Onion in Important Consuming Markets of
India (2002-2012)
0.00 50.00 100.00 150.00 200.00 250.00
January
February
March
April
May
June
July
August
September
October
November
December
Pune
Mumbai
Kolkata
Jaipur
Delhi
Chennai
Bangalore
Ahmedabad
42
5.4 Seasonality in Arrivals and Prices of Onion in Major Consuming Markets in India
Depending on the production of onion, the seasonality in arrivals and prices occurs
regularly every year. The changes in arrivals may occur due to rise or fall in production, poor
storage, early harvesting, lack of retention power by growers and export. Keeping in view of
recent spurt in the price of onion, the seasonality of arrivals and prices were analyzed for
different markets for a period from 2002 to 2012, and discussed in the following paragraphs.
The analysis emphasized more to the year 2010 as the situation of 1998 was almost repeated
and hence, there is an effort to elicit the reason for occurrence of such things (Table-5.4 & 5.5).
5.4.1 Jaipur Market
The seasonal behaviour of the arrivals and prices of onion in major markets of the
country were calculated and are depicted in the Table-5.4 and 5.5 and Figure 5.1 to 5.3. Onion
is grown in both rabi and kharif season and it can be stored for longer period compared to
other vegetables except potato. Hence, the arrivals of onion are persisting throughout the year
across country. The highest arrivals were found during April-July in Jaipur market and the
prices were lowest for the corresponding months. The value of arrivals started declining from
September onwards and the trend continued up to the Month of February. Similarly the prices
started increasing from the same month and were maximum during October-January, This
trend indicates that, with the increase in the arrivals, the prices declined and is in conformity
with the law of supply and demand. It is also interesting to note that, since onion is grown in
rabi season in Rajasthan, the values of arrivals were maximum during March-July. Most of the
requirement for rest of the period in a year in Jaipur market is met by western part of the
country. Major arrivals to this market are from Nasik, Lasalgaon and Pimpalgaon.
5.4.2 Delhi Market
The arrivals started increasing from March and were found to be highest during June-
July and November-December in Delhi market. Surprisingly the market prices were highest
during higher arrivals (November – December). The values of arrivals started declining

43
marginally from August until October and were low during January and February. However,
the prices were higher during August to January, despite increase in the values of arrivals in the
corresponding period except for January month. This phenomenon reveals that, with the
increase the prices, arrival from other markets of the country started flowing into Delhi market
as there is huge demand for onion due to large mass of consumption. Moreover, Delhi market
is also a largest centre for dispatch of produce to other parts of country, mainly to northern
States. Most of the requirement for Delhi market is met by all parts of the country including
southern States. Interestingly, Delhi Market is also a Terminal market, as substantial quantity
of produce from Delhi flows back to many parts of the country.
5.4.3 Bangalore and Other Markets
A peculiar situation could be observed from the trend in arrivals and prices of onion in
Bangalore market and continued to increase during November-December. The values of
arrivals started increasing from September and touched peak during October. Similarly, prices
started increasing during the August month and the trend continued up to January. From
February onwards, both prices and arrivals started declining. This situation was noticed mainly
due to entry of more number of traders for purchase during higher arrivals from different part
of country and subsequently they supplied the onion to other markets across the country. At the
same time, the exporters also became active during this period as they could get best quality
produce during harvesting season. Another probable reason might be the increasing trends in
the prices attracted farmers to bring more and more produce into the market. More arrivals
coupled with large scale purchases led to rise in the price contrary to law of demand. However,
the onion from Bangalore do not flow to Delhi market as it feeds markets in West Bengal,
Orissa and some parts of Andhra Pradesh. Large quantities of onion are also exported to
Srilanka and gulf countries. Similar trends were noticed for Mumbai and Ahmedabad markets.

44
While in the case of Pune, Chennai and Kolkata markets, the trends in arrivals and prices
behaved as per law of demand and supply.
Figure-5.3 Seasonal Trends in Arrivals and Prices of Onion in Important Consuming
Markets of India (2002-2012)
0
50
100
150
200
250
Bangalore Arrivals
Bangalore Prices
0
20
40
60
80
100
120
140
160
Chennai Arrivals
Chennai Prices
0
50
100
150
200
Jaipur Arrivals
Jaipur Prices
0
50
100
150
200
Kolkata Arrivals
Kolkata Prices
0
50
100
150
200
Pune Arrivals
Pune Prices

45
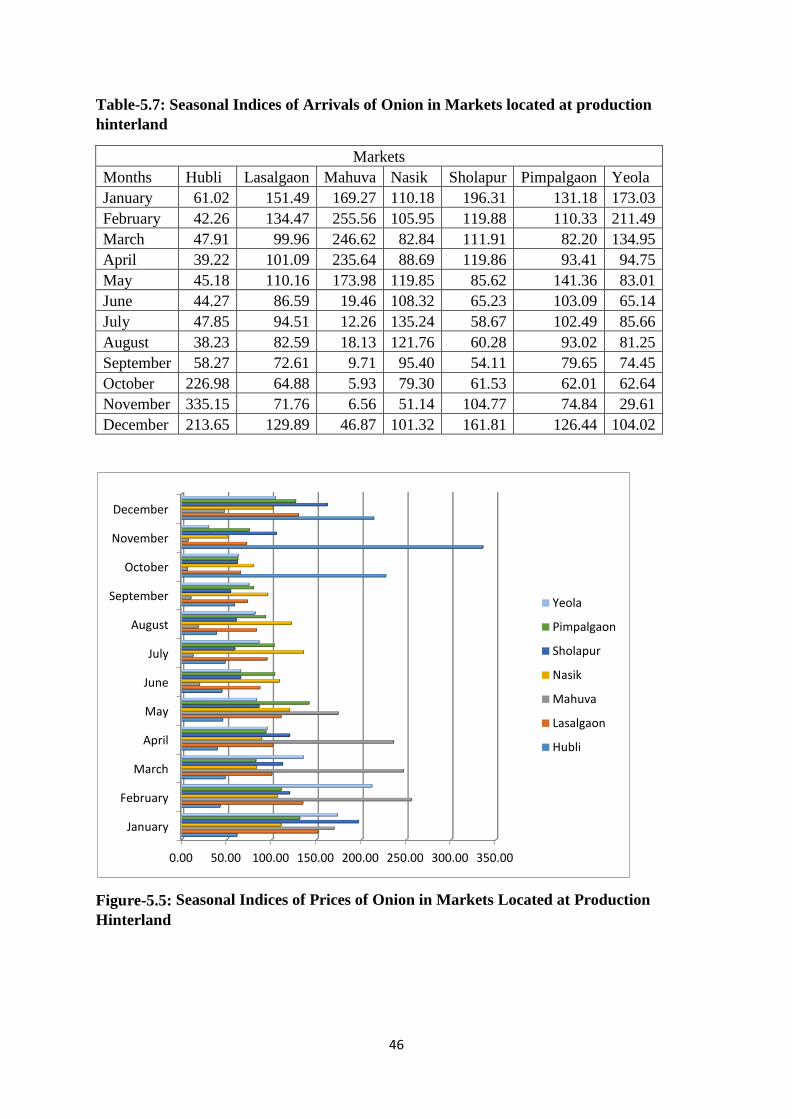
Table-5.6 Seasonal Indices of Prices of Onion in Markets Located at Production
Hinterland
Markets
Months Hubli Lasalgaon Mahuva Nasik Sholapur Pimpalgaon Yeola
January 108.19 120.14 124.99 122.74 121.55 118.17 125.64
February 86.74 87.66 94.83 93.16 96.22 87.97 95.01
March 73.81 61.84 72.99 67.35 71.28 61.22 60.39
April 68.02 57.55 61.23 60.35 56.20 58.20 51.55
May 72.35 56.76 60.87 57.80 61.59 59.64 51.06
June 88.24 77.50 63.71 74.70 80.04 77.97 74.99
July 101.16 88.54 84.95 84.39 98.13 88.83 87.90
August 115.80 109.20 96.61 101.37 111.99 108.78 112.19
September 117.44 122.61 108.20 117.04 105.93 123.93 121.47
October 118.55 141.39 145.39 140.25 114.38 142.49 143.60
November 125.78 136.81 157.53 143.57 132.07 137.98 148.61
December 123.92 140.00 128.70 137.29 150.61 134.82 127.60
Figure-5.4: Seasonal Indices of Prices of Onion in Markets Located at Production
Hinterland
0.00 20.00 40.00 60.00 80.00 100.00 120.00 140.00 160.00
January
February
March
April
May
June
July
August
September
October
November
December
Yeola
Pimpalgaon
Sholapur
Nasik
Mahuva
Lasalgaon
Hubli
46
Table-5.7: Seasonal Indices of Arrivals of Onion in Markets located at production
hinterland
Markets
Months Hubli Lasalgaon Mahuva Nasik Sholapur Pimpalgaon Yeola
January 61.02 151.49 169.27 110.18 196.31 131.18 173.03
February 42.26 134.47 255.56 105.95 119.88 110.33 211.49
March 47.91 99.96 246.62 82.84 111.91 82.20 134.95
April 39.22 101.09 235.64 88.69 119.86 93.41 94.75
May 45.18 110.16 173.98 119.85 85.62 141.36 83.01
June 44.27 86.59 19.46 108.32 65.23 103.09 65.14
July 47.85 94.51 12.26 135.24 58.67 102.49 85.66
August 38.23 82.59 18.13 121.76 60.28 93.02 81.25
September 58.27 72.61 9.71 95.40 54.11 79.65 74.45
October 226.98 64.88 5.93 79.30 61.53 62.01 62.64
November 335.15 71.76 6.56 51.14 104.77 74.84 29.61
December 213.65 129.89 46.87 101.32 161.81 126.44 104.02
Figure-5.5: Seasonal Indices of Prices of Onion in Markets Located at Production
Hinterland
0.00 50.00 100.00 150.00 200.00 250.00 300.00 350.00
January
February
March
April
May
June
July
August
September
October
November
December
Yeola
Pimpalgaon
Sholapur
Nasik
Mahuva
Lasalgaon
Hubli

47
Figure-5.6: Seasonal Indices of Prices of Onion in Markets Located at Production
Hinterland
0 50
100 150 200 250 300 350 400
Jan
uar
y
Mar
ch
May
July
Sep
tem
ber
No
vem
ber
HubliPrices
HubliArrivals
0
20
40
60
80
100
120
140
160
Lasalgaon Prices
Lasalgaon Arrivals
0 50
100 150 200 250 300
Mahua Prices
Mahua Arrivals
0
50
100
150
200
Nasik Prices
Nasik Arrivals
0
50
100
150
200
250
Solapur Prices
Solapur Arrivals
0
50
100
150
Pimpalgaon Prices
Pimpalgaon Arrivals
0
50
100
150
200
250
Jan
uar
y
Mar
ch
May
July
Sep
tem
ber
No
vem
ber
Yeola Prices
Yeola Arrivals
48
5.5 Seasonality in Arrivals and Prices of Onion in Markets located in Production
hinterland:
After analysing the seasonality of prices and arrivals in major consuming markets, it
becomes imperative to know the same with respect to the markets located in production
hinterland. Because these are the areas from where the bulk of output arrives in to nearby
market and flows towards consuming markets. The price discovery in consuming markets
largely depends on the seasonality and availability of onion in these markets.
5.5.1 Hubli Market
It is interesting to know from the results presented in the Table-5.6and 5.7 and Figures-
5.4 to 5.6 that, there is an exceptional behaviour of prices and arrivals in Hubli market. Except
for January month, there is a positive correlation between arrivals and prices of onion in this
market. Especially during August to December, there is a tremendous increase in both prices
and arrivals of onion in contrast to law of demand. Traders in the region opined that, the reason
for such behaviour is that, during this period more number of traders operate and buy onion in
large quantities for supplies to the other markets in eastern India and also they procure good
quality of onion for export purpose. Around 10 per cent of the total arrival in this market is
exported to gulf countries and Sri Lanka. When arrivals start declining, only traders operating
in the APMC would buy onions and also during low arrivals, the quality of onion is poor and
thus commands low price. Similar trend is noticed in the case of other markets only during
December or January month where both the arrivals and prices are high. During rest of the
period, there is an inverse relation between the arrivals and prices of onion. Generally in all the
markets, except Hubli, the price starts declining from March and reaches a lower level in the
month of May-June. This is mainly due to higher arrivals during these months as in most of the
States; the onion is harvested during this period.

49
5.5.2 Lasalgaon and other Market:
The trends in arrivals and prices of Lasalgaon market revealed that, arrivals were
higher during December-February and then during April-May. The higher arrival during these
months is mainly due to harvesting of crop during rabi and late kharif season respectively. The
prices in Lasalgaon market started increasing from August and continued up to January with a
maximum price prevalent during October and December. Similar trends were noticed for the
markets like Sholapur, Pimpalgaon and Yeola in Maharashtra. In these markets, the increase in
the arrivals of onion led to decline in the price and thus situation was in conformity with the
law of demand.
5.5.3 Mahua Market in Gujarat
There was a distinct trend observed with respect to arrivals and prices of Mahua market
in Gujarat. Mahua is an important production centre for onion. The arrivals during January to
May were almost two times higher than the lean season. While, the prices started showing
increasing from September and continued up to the month of January. Hence, we can infer that,
there is no set pattern in behaviour of arrivals and prices. The prices, except for the period from
September to December, were lower during higher arrivals. During September-December, both
arrivals and prices were on higher side.
5.5.4 The 1998 Situation
The modal prices in Lassalgaon market and Pimpalgaon market ranged from Rs.186 to
Rs.492 per quintal in 1996, and Rs.168 to Rs.837 per quintal in 1997 and Rs. 258 to 2632 in
1998 indicating sky rocketing of prices (figure-5.7). The same trend was noticed in Hubli
market also. In the case of other markets considered for the study, the price of onion remained
around Rs.2000/Qtl. During the year 1998, prices of August-September and up to December
were on pretty higher side in almost all the markets across the country, compared to other

50
months. This trend was observed mainly due to low production of onion and low volume of
stored produce coupled with delayed and reduced arrivals of fresh kharif harvest due to
excessive rains. Prices in 1998 however, remained higher and reached a record level of
Rs.26.32 per kg in October in Lasalgaon market. Similar trend was noticed in different markets
across country during this period. Though the prices of onion started declining, from
November 1998, they were still comparatively higher to the corresponding period during other
years. From January 1999 onward, situation, however, improved when production increased
and due to different interventions from various agencies during late kharif season.
Figure-5.7: Modal Prices of Onion during 1998
Since the episode of 1998, the government of India has made it a practice of observing
the situation and intervening in the market whenever necessary to ensure availability of
essential commodities to consumers to protect them from exploitation by traders. This was
done by procurement operations at domestic level and by regulating Export/Import in
international Market. Some of the States like Karnataka and Andhra Pradesh government have
gone in for market intervention since 1998. Market intervention involves stabilisation of prices
0
500
1000
1500
2000
2500
3000
Hubli Price Modal
Lasalgaon Price Modal
Mahua Price Modal
Nasik Price Modal
Pimpalgaon Price Modal

51
through procurement of onion when/where the prices are low and distribution to consumers at
reasonable prices when the ruling retail market prices are high. For the purpose of price
stabilization, government of Karnataka has created revolving funds for the same. It has also set
up its own export promotion agency called KAPPEC (Karnataka state agricultural produce
processing export corporation) which along with onion is involved in promotion of exports of
other crops from Karnataka.
5.5.5 The 2005 situation
The sky rocketing of onion prices was observed during 2005 also. The rise in prices of
onion during October, 2005 was mainly due to delayed sowing of kharif onion in major
producing States (As per report on impact of excess rainfall on onion by ICAR). However, the
policy decision to import onion again led to steep fall in the prices of onion. The prices of
onion during October and November, 2005 were in the range of Rs.1000-1500 in major
markets considered for the present study and declined to Rs.300-500 during January and
February, 2006. In the process, it was learnt from the various research studies that, farmers
suffered about 10-20 per cent losses during the kharif 2005 season. Very few farmers could
take advantage of the higher prices that prevailed during October and November, 2005 as the
kharif sowings were delayed. The fact that, high prices the consumers are paying are not
translating into higher incomes for the farmers as revealed by the wholesale and retail price
mark up analysis in the subsequent section of this paper. The inefficiencies in the marketing
channels account for such a situation where in both consumers and producers do not gain.
5.6 Daily Arrivals and Prices during Crisis Period of 2010
Trend in arrivals and prices of onion in different markets for November and December
months during current years of the country are presented in Figure-5.8 to 5.9. It is evident
from the figures that during the third week of December, prices of onion have skyrocketed
and the arrivals have reduced drastically. The selected markets are mainly consuming
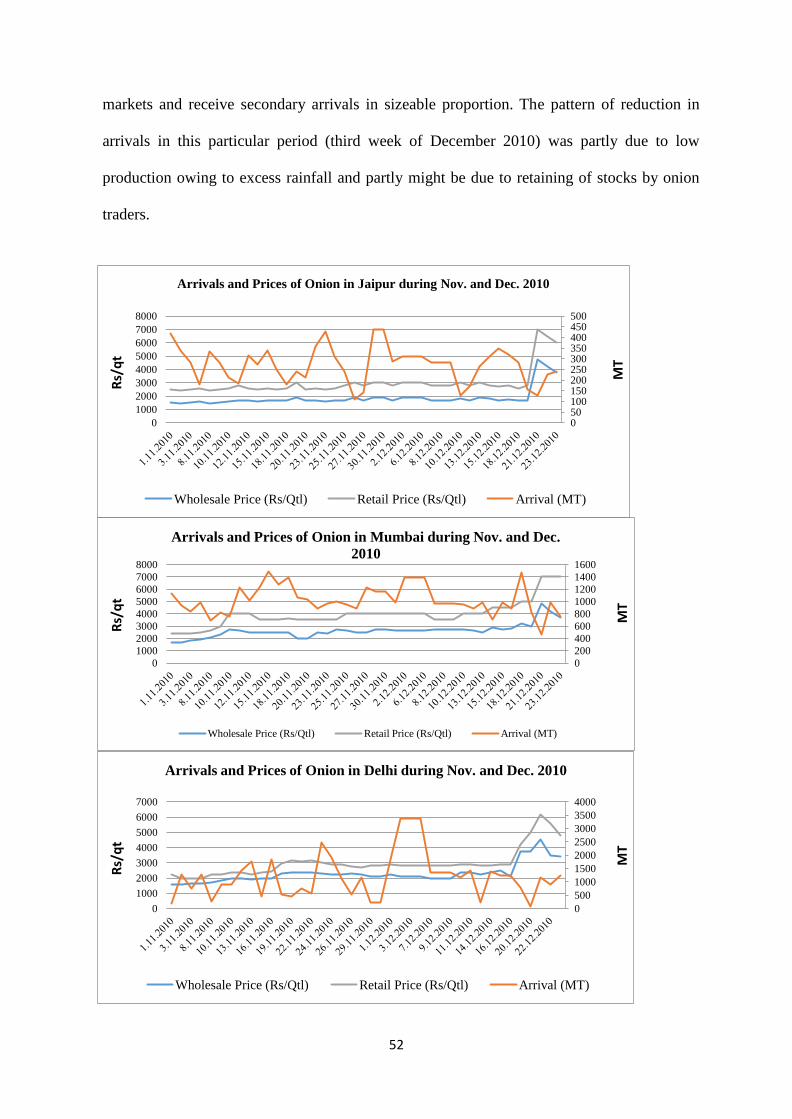
52
markets and receive secondary arrivals in sizeable proportion. The pattern of reduction in
arrivals in this particular period (third week of December 2010) was partly due to low
production owing to excess rainfall and partly might be due to retaining of stocks by onion
traders.
0 50 100 150 200 250 300 350 400 450 500
0
1000
2000
3000
4000
5000
6000
7000
8000
Arrivals and Prices of Onion in Jaipur during Nov. and Dec. 2010
Wholesale Price (Rs/Qtl) Retail Price (Rs/Qtl) Arrival (MT)
Rs/
qt
MT
0
200
400
600
800
1000
1200
1400
1600
0
1000
2000
3000
4000
5000
6000
7000
8000
Arrivals and Prices of Onion in Mumbai during Nov. and Dec.
2010
Wholesale Price (Rs/Qtl) Retail Price (Rs/Qtl) Arrival (MT)
Rs/
qt
MT
0
500
1000
1500
2000
2500
3000
3500
4000
0
1000
2000
3000
4000
5000
6000
7000
Arrivals and Prices of Onion in Delhi during Nov. and Dec. 2010
Wholesale Price (Rs/Qtl) Retail Price (Rs/Qtl) Arrival (MT)
Rs/
qt
MT
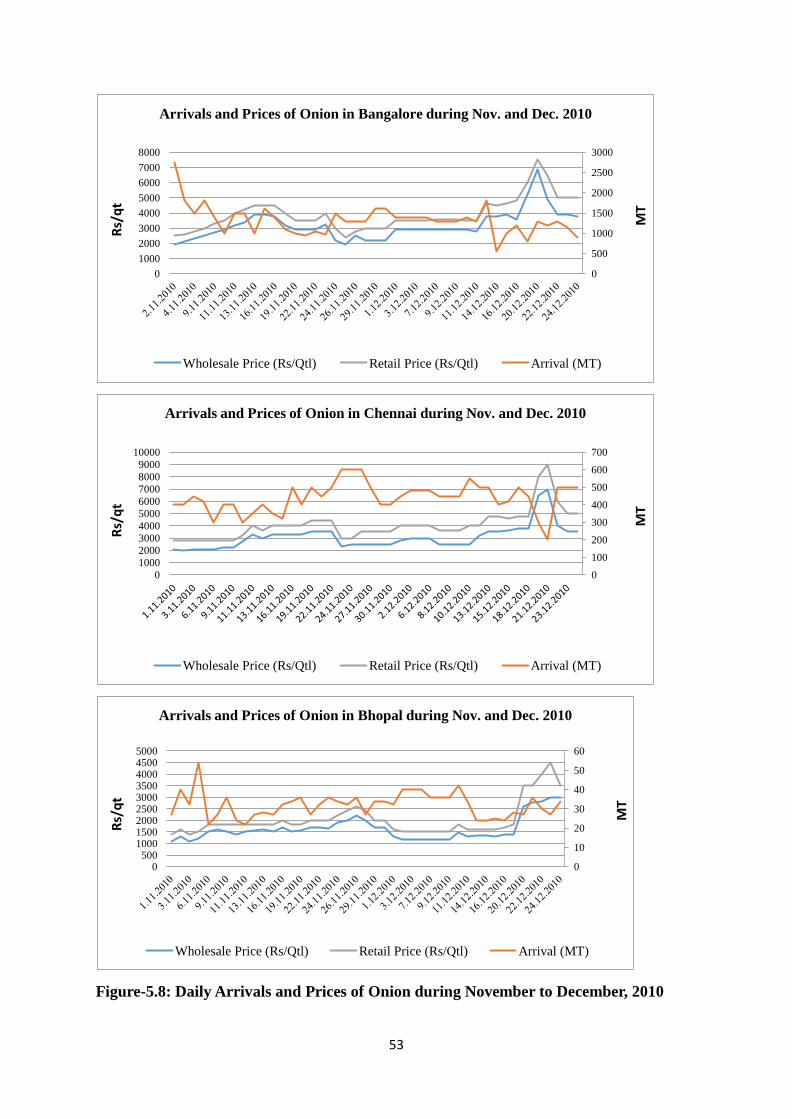
53
Figure-5.8: Daily Arrivals and Prices of Onion during November to December, 2010
0
500
1000
1500
2000
2500
3000
0
1000
2000
3000
4000
5000
6000
7000
8000
Arrivals and Prices of Onion in Bangalore during Nov. and Dec. 2010
Wholesale Price (Rs/Qtl) Retail Price (Rs/Qtl) Arrival (MT)
Rs/
qt
MT
0
100
200
300
400
500
600
700
0
1000
2000
3000
4000
5000
6000
7000
8000
9000
10000
Arrivals and Prices of Onion in Chennai during Nov. and Dec. 2010
Wholesale Price (Rs/Qtl) Retail Price (Rs/Qtl) Arrival (MT)
Rs/
qt
MT
0
10
20
30
40
50
60
0 500
1000 1500 2000 2500 3000 3500 4000 4500 5000
Arrivals and Prices of Onion in Bhopal during Nov. and Dec. 2010
Wholesale Price (Rs/Qtl) Retail Price (Rs/Qtl) Arrival (MT)
Rs/
qt
MT
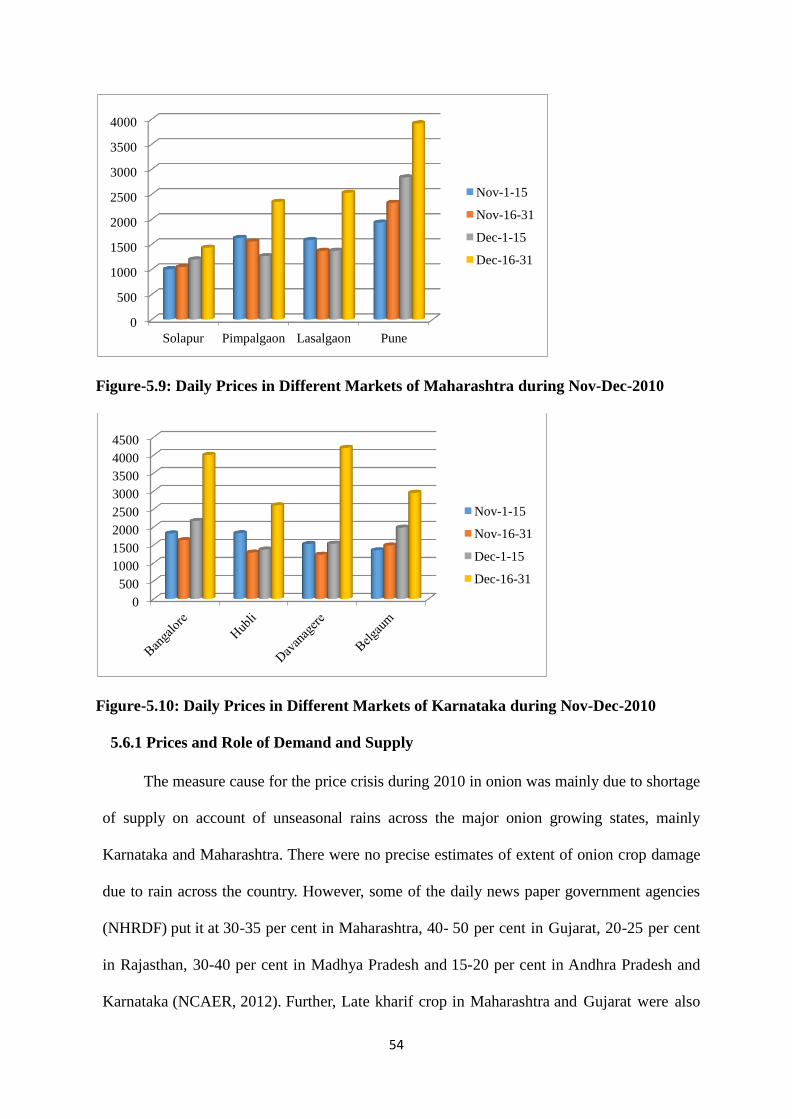
54
Figure-5.9: Daily Prices in Different Markets of Maharashtra during Nov-Dec-2010
Figure-5.10: Daily Prices in Different Markets of Karnataka during Nov-Dec-2010
5.6.1 Prices and Role of Demand and Supply
The measure cause for the price crisis during 2010 in onion was mainly due to shortage
of supply on account of unseasonal rains across the major onion growing states, mainly
Karnataka and Maharashtra. There were no precise estimates of extent of onion crop damage
due to rain across the country. However, some of the daily news paper government agencies
(NHRDF) put it at 30-35 per cent in Maharashtra, 40- 50 per cent in Gujarat, 20-25 per cent
in Rajasthan, 30-40 per cent in Madhya Pradesh and 15-20 per cent in Andhra Pradesh and
Karnataka (NCAER, 2012). Further, Late kharif crop in Maharashtra and Gujarat were also
0
500
1000
1500
2000
2500
3000
3500
4000
Solapur Pimpalgaon Lasalgaon Pune
Nov-1-15
Nov-16-31
Dec-1-15
Dec-16-31
0
500
1000
1500
2000
2500
3000
3500
4000
4500
Nov-1-15
Nov-16-31
Dec-1-15
Dec-16-31

55
reported to be damaged to the extent of around 15-20 per cent by continuous heavy rains.
The onion crop was affected in Andhra Pradesh and Karnataka due to cyclonic rains at the
end of October. In other States such as Maharashtra, Gujarat, Madhya Pradesh and
Rajasthan, the crop was affected due to untimely and erratic rains in November.
The damage caused to the onion crops increased the woes of consumers, especially
during the last week of December, 2010. The price fluctuations were pretty high in
consuming markets like Delhi, Kolkata, Mumbai, Pune and Chennai than the markets located
in onion producing areas. The level of prices was also high among major consuming markets.
In order to know the extent of fluctuations in the price during this crisis period, daily arrivals
and prices were studied for both consuming markets and markets located in onion producing
areas. The results are depicted in Figure-5.9. The markets in the State of Maharashtra and
Karnataka were analysed as they rank first and second in production of onion respectively.
Delhi was also included as it acts as a transit market for Northern States and Karnataka act as
a transit point for Eastern States. They supply onion during the months of November and
December.
A perusal of figures on arrivals and prices of onion during December, 2010 revealed
that, the price touched a high of more than Rs.6000 in the case of Delhi, Bangalore and
Chennai. It is also clear from the figures that, the arrivals for corresponding days fell sharply,
indicating the shortage of supply. Thus this trend observed for Delhi market supports fact
that the sudden spurt in the price towards end December may be attributed to a substantial
fall in arrivals due to crop damage. Other factors might have had a very minute influence on
the rise in the price. It is also speculated by some of the players in the market that, the
shortage in supply of onion during this period was partly due to hoarding by some of the
traders as per the feedback received by the researcher during field survey at Jaipur (Sharma
etal.2011). Subsequently, some of the traders also incurred loss during this process due to

56
speculation of rise in the price which did not happen after December, 2010.
Though similar trends were observed in markets located at production centres, the
magnitude of the price was not as high as in Delhi and other metro cities. Skyrocketing of
prices during the second half of December 2010 in major producing belts of
Maharashtra as well as in the major transit market of Pune was pertinent due to their
supplies to consuming markets like Delhi, Jaipur and other places. However prices in
Sholapur market showed a gradual increase in the modal prices over the reference period
while, in the case of other markets like Pimpalgaon and Lasalgaon, modal price showed a
drastic increase during December 16th to 31st.
As per the findings of the NCAER, contrary to the trends observed in Delhi market,
where a sharp increase in the average modal price (62%) during last fortnight of December
may be attributed to a substantial fall in arrivals (41%) during the same period. In the case
of Maharashtra factors such as overall demand scenario, market information etc. seem to be
holding a higher influence on the modal price. In fact, though there was only a 10% fall in
total arrivals in top 10 markets of Maharashtra during the second fortnight vis-à-vis the first
fortnight, the prices shot up on average by around 70% across these markets are
(NCAER). The possible reason for sudden spurt in the modal prices of onion may be
(Box.I) due to rise in the MEP for onion.
Box.I Notification Date MEP notified for the month of USD (PMT C&F)
31st August 2010 September 2010 280
13th September 2010
Revised for remaining period of
September 2010
355
1st October 2010 October 2010 430
29th October 2010 November 2010 380
15th November 2010
Revised for remaining period of
November 2010
530
30th November 2010 December 2010 530
Source: NAFED

57
As per the discussion with the officials of the NHRDF, it is learnt that, Maharashtra,
apart from being the largest producer of onion, it hosts maximum number of exporters also.
It is estimated that Maharashtra state accounts for about 80-85% of total onion exports from
the country. Hence, it is also termed that, the export demand coupled with the hike in
MEP for onion (see table- recent policy announcement) during the crisis period
(November-December 2010) may have also exerted an upward influence on the prices
given the constrained supply. The increase in Minimum Export Price coupled with low
arrivals and partly hoarding by some of the traders led to sudden spurt in the prices of onion
during 2010 across the country. A perusal of Table given below reveals that, another reason
for skyrocketing of prices during December, 2010 was hike in MEP. The MEP of onion
during 2010 was consistently raised from USD 280 at the beginning of September 2010 to
USD 430 till end October.
Similar to the trends observed in case of Karnataka, a sudden jump in the prices
of onion was observed during the latter half of December 2010. Thus the trend observed
for important markets of Karnataka supports our hypothesis that the sudden spike towards
end December may be attributed to a substantial fall in arrivals due to crop damage.
However, since the onion crop was affected in Karnataka due to cyclonic rains at the end
of October and the reported losses were in the range of 15-20% (much lower than other
major producing regions) such a sudden fall in arrivals during last fortnight of December
may recur in future and hence, needs attention.
A proper weather and market information in place by NAFED and timely intervention
of other agencies could have been provided to avert the crisis. However, the e trend in
skyrocketing of prices was not seen during 2011-12 and 2012-13. During October to January,
as usual, the prices remained higher compared to other months. But to some extent there was
a partial restriction on export and increase in rabi supplies averted one more crisis.

58
5.6.2 Policy Announcement During 2010
Month Policy decision Impact
1.10. 2010 Raised the minimum export price of onions by $75 to $425 a
tonne for October, the third straight month in a row, to
discourage overseas shipments and tame domestic prices
2.11.2010 Reduced MEP by $50 a tonne from $425 for November to
encourage exports as domestic prices are expected to soften
in the near future on arrival of new kharif crop by middle of
this month. This is the first reduction in onion MEP since
August
Price
Increase
15.11. 2010 NAFED had last increased the minimum export price (MEP)
of the onion from $375 a tonne to $525 a tonne for this
month
24.11.2010 Fix the limit to a maximum of 500 tonnes daily
Dec. 2010 Decision to import of Onion from Pakistan
20.12.2010 Ban on Export of Onion until Jan 15, 2011 in light of
skyrocketing prices of the commodity. and raise Minimum
Export Price (MEP) to $1,200 per tone
21.12.2010 DGFT prohibited export of all varieties of Onion with
immediate effect and until further orders
Price
decrease
21.12.2010 Reduce the basic customs duty to ‘zero' per cent from 5 per
cent. Import of onions has been made duty-free against the
earlier 5 per cent basic Customs duty and 4 per cent special
countervailing duty applicable on the product.
Price
decrease
5.7 Onion Price Rise and Consumer Behaviour in Jaipur
Onion prices have risen up to Rs 70-80 per kg in retail markets across the country from
just Rs. 35-40 during November, 2010. Other key vegetables like tomato and garlic, which are
commonly used by households, are also witnessing a sharp rise.
An attempt was made to find out the trends in consumption of onion with the change in
the prices of onion in Jaipur city. It is apparent from the results presented in the Table-5.7 that,
the extent of price paid by the consumer was as high as 148 per cent ending December third
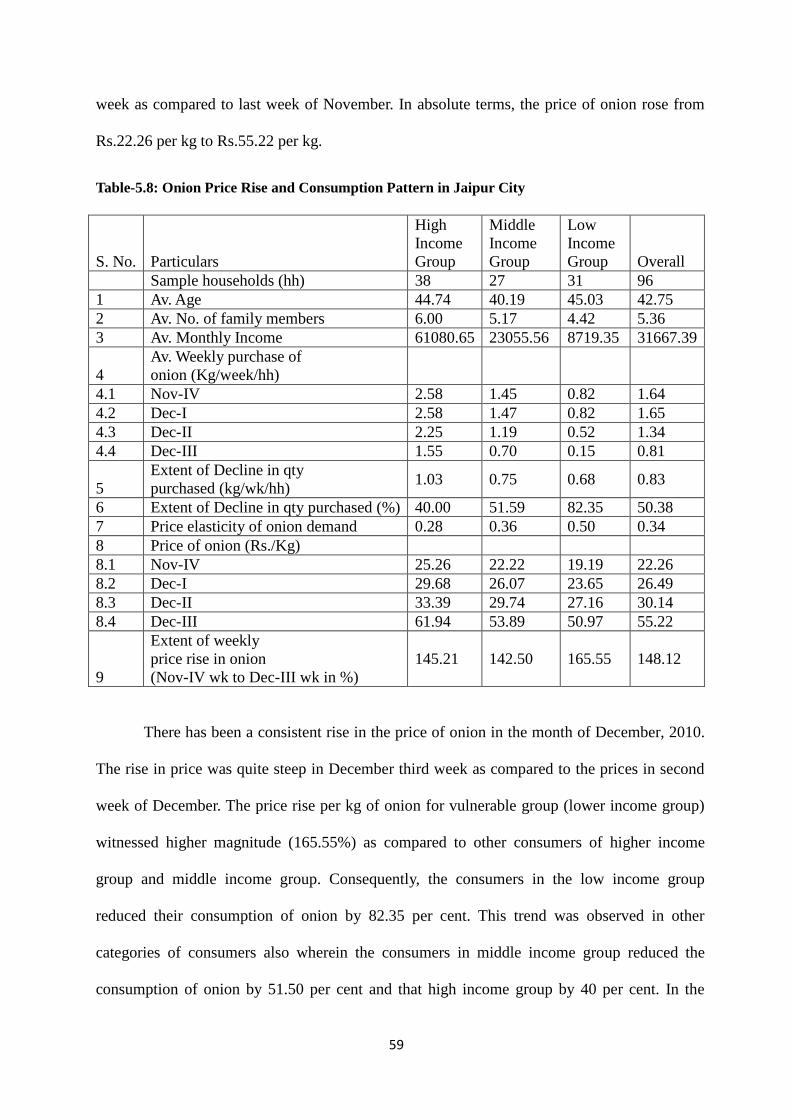
59
week as compared to last week of November. In absolute terms, the price of onion rose from
Rs.22.26 per kg to Rs.55.22 per kg.
Table-5.8: Onion Price Rise and Consumption Pattern in Jaipur City
S. No. Particulars
High
Income
Group
Middle
Income
Group
Low
Income
Group Overall
Sample households (hh) 38 27 31 96
1 Av. Age 44.74 40.19 45.03 42.75
2 Av. No. of family members 6.00 5.17 4.42 5.36
3 Av. Monthly Income 61080.65 23055.56 8719.35 31667.39
4
Av. Weekly purchase of
onion (Kg/week/hh)
4.1 Nov-IV 2.58 1.45 0.82 1.64
4.2 Dec-I 2.58 1.47 0.82 1.65
4.3 Dec-II 2.25 1.19 0.52 1.34
4.4 Dec-III 1.55 0.70 0.15 0.81
5
Extent of Decline in qty
purchased (kg/wk/hh) 1.03 0.75 0.68 0.83
6 Extent of Decline in qty purchased (%) 40.00 51.59 82.35 50.38
7 Price elasticity of onion demand 0.28 0.36 0.50 0.34
8 Price of onion (Rs./Kg)
8.1 Nov-IV 25.26 22.22 19.19 22.26
8.2 Dec-I 29.68 26.07 23.65 26.49
8.3 Dec-II 33.39 29.74 27.16 30.14
8.4 Dec-III 61.94 53.89 50.97 55.22
9
Extent of weekly
price rise in onion
(Nov-IV wk to Dec-III wk in %)
145.21 142.50 165.55 148.12
There has been a consistent rise in the price of onion in the month of December, 2010.
The rise in price was quite steep in December third week as compared to the prices in second
week of December. The price rise per kg of onion for vulnerable group (lower income group)
witnessed higher magnitude (165.55%) as compared to other consumers of higher income
group and middle income group. Consequently, the consumers in the low income group
reduced their consumption of onion by 82.35 per cent. This trend was observed in other
categories of consumers also wherein the consumers in middle income group reduced the
consumption of onion by 51.50 per cent and that high income group by 40 per cent. In the
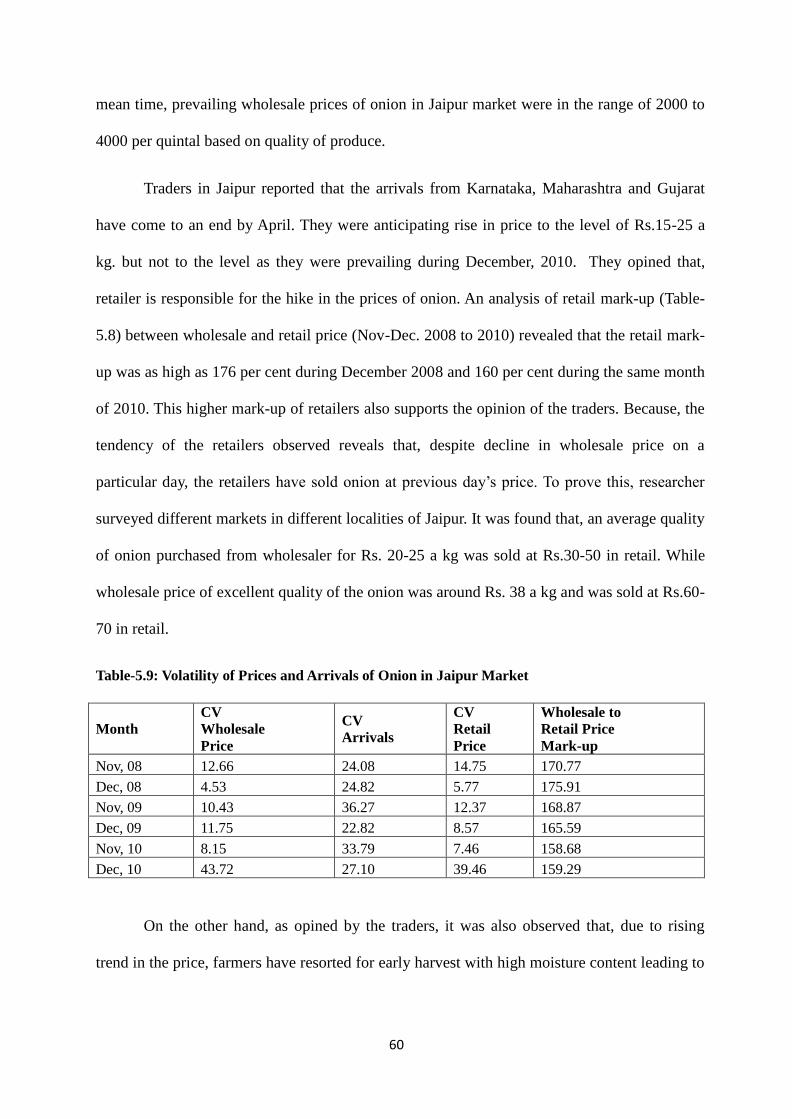
60
mean time, prevailing wholesale prices of onion in Jaipur market were in the range of 2000 to
4000 per quintal based on quality of produce.
Traders in Jaipur reported that the arrivals from Karnataka, Maharashtra and Gujarat
have come to an end by April. They were anticipating rise in price to the level of Rs.15-25 a
kg. but not to the level as they were prevailing during December, 2010. They opined that,
retailer is responsible for the hike in the prices of onion. An analysis of retail mark-up (Table-
5.8) between wholesale and retail price (Nov-Dec. 2008 to 2010) revealed that the retail mark-
up was as high as 176 per cent during December 2008 and 160 per cent during the same month
of 2010. This higher mark-up of retailers also supports the opinion of the traders. Because, the
tendency of the retailers observed reveals that, despite decline in wholesale price on a
particular day, the retailers have sold onion at previous day’s price. To prove this, researcher
surveyed different markets in different localities of Jaipur. It was found that, an average quality
of onion purchased from wholesaler for Rs. 20-25 a kg was sold at Rs.30-50 in retail. While
wholesale price of excellent quality of the onion was around Rs. 38 a kg and was sold at Rs.60-
70 in retail.
Table-5.9: Volatility of Prices and Arrivals of Onion in Jaipur Market
Month
CV
Wholesale
Price
CV
Arrivals
CV
Retail
Price
Wholesale to
Retail Price
Mark-up
Nov, 08 12.66 24.08 14.75 170.77
Dec, 08 4.53 24.82 5.77 175.91
Nov, 09 10.43 36.27 12.37 168.87
Dec, 09 11.75 22.82 8.57 165.59
Nov, 10 8.15 33.79 7.46 158.68
Dec, 10 43.72 27.10 39.46 159.29
On the other hand, as opined by the traders, it was also observed that, due to rising
trend in the price, farmers have resorted for early harvest with high moisture content leading to

61
weight loss for further sale. To makeup this loss, wholesalers and semi wholesalers have
resorted for sale of onion at higher price.
5.8 Volatility of Prices and Arrivals of Onion in Jaipur Market
The volatility index is an index which measures expectations of volatility or
fluctuations in price of commodities. Higher values for the volatility index indicate higher the
fluctuations. To measure volatility, Co-efficient of variation was calculated for arrivals and
prices of onion in Jaipur market. It is revealed from the Table-5.8 that, the variability in daily
arrivals ranged between 22.82 in December, 2009 and 36.27 in November, 2009 depicting no
definite pattern in variability. While the magnitude of variability in daily wholesale and retail
prices were low until December, 2010. The magnitude increased to 43.72 and 39.46,
respectively indicating high volatility within a shot span of time. It is interesting to note that,
the retail mark up was more than 150 per cent indicating that; retailer sold the onion at double
the wholesale price. In other words, retailers are on earning 40% margin over wholesale prices
after meeting about 10% Mandi and other charges borne by them. This is also evident from the
observation of the researcher from the field. A good quality of onion was sold at Rs.3800/qtl.
While on the same day, the retail price of such quality onion was around Rs. 60-70 a kg in
Jaipur city.
5.9 Trends in Exports of Onion from India
India is a traditional exporter of onion in the world. Onion exports increased in recent
years after onion was removed from the official list of essential commodities and onion
exports were progressively deregulated. Prior to this, exports were periodically banned or
restricted, which prevented the growth in export of onion. In India, no onion production is
undertaken specifically for export; however, there is a greater demand for onion grown in India.
It is apparent from the Table-5.9 that, during TE ending 1953-54 the India was
exporting 39848 MT of onion valued at Rs 1.06 crores. The spurt in export of onion was
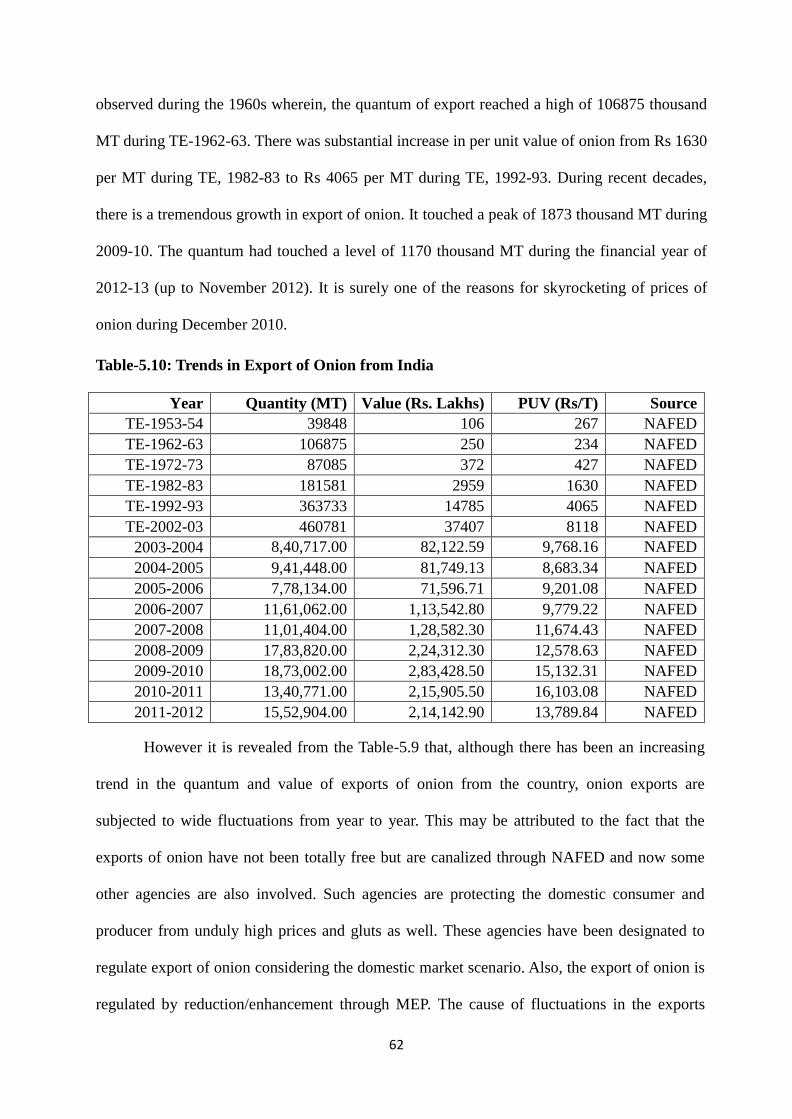
62
observed during the 1960s wherein, the quantum of export reached a high of 106875 thousand
MT during TE-1962-63. There was substantial increase in per unit value of onion from Rs 1630
per MT during TE, 1982-83 to Rs 4065 per MT during TE, 1992-93. During recent decades,
there is a tremendous growth in export of onion. It touched a peak of 1873 thousand MT during
2009-10. The quantum had touched a level of 1170 thousand MT during the financial year of
2012-13 (up to November 2012). It is surely one of the reasons for skyrocketing of prices of
onion during December 2010.
Table-5.10: Trends in Export of Onion from India
Year Quantity (MT) Value (Rs. Lakhs) PUV (Rs/T) Source
TE-1953-54 39848 106 267 NAFED
TE-1962-63 106875 250 234 NAFED
TE-1972-73 87085 372 427 NAFED
TE-1982-83 181581 2959 1630 NAFED
TE-1992-93 363733 14785 4065 NAFED
TE-2002-03 460781 37407 8118 NAFED
2003-2004 8,40,717.00 82,122.59 9,768.16 NAFED
2004-2005 9,41,448.00 81,749.13 8,683.34 NAFED
2005-2006 7,78,134.00 71,596.71 9,201.08 NAFED
2006-2007 11,61,062.00 1,13,542.80 9,779.22 NAFED
2007-2008 11,01,404.00 1,28,582.30 11,674.43 NAFED
2008-2009 17,83,820.00 2,24,312.30 12,578.63 NAFED
2009-2010 18,73,002.00 2,83,428.50 15,132.31 NAFED
2010-2011 13,40,771.00 2,15,905.50 16,103.08 NAFED
2011-2012 15,52,904.00 2,14,142.90 13,789.84 NAFED
However it is revealed from the Table-5.9 that, although there has been an increasing
trend in the quantum and value of exports of onion from the country, onion exports are
subjected to wide fluctuations from year to year. This may be attributed to the fact that the
exports of onion have not been totally free but are canalized through NAFED and now some
other agencies are also involved. Such agencies are protecting the domestic consumer and
producer from unduly high prices and gluts as well. These agencies have been designated to
regulate export of onion considering the domestic market scenario. Also, the export of onion is
regulated by reduction/enhancement through MEP. The cause of fluctuations in the exports
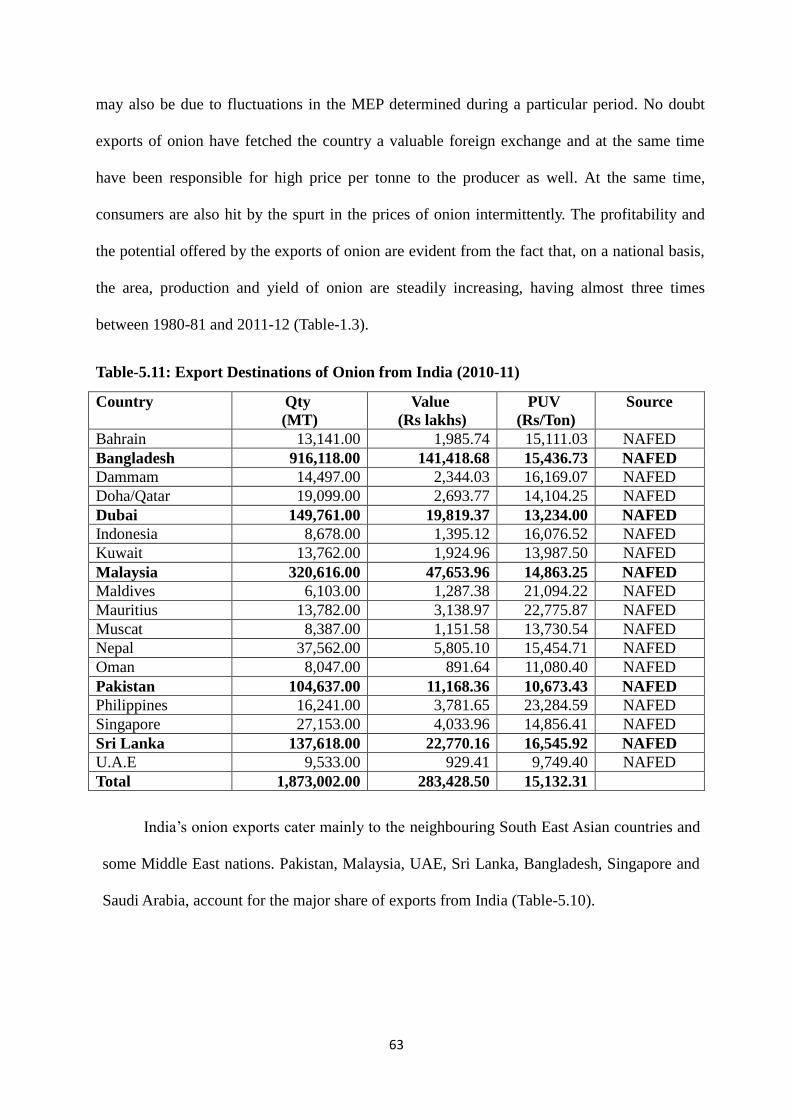
63
may also be due to fluctuations in the MEP determined during a particular period. No doubt
exports of onion have fetched the country a valuable foreign exchange and at the same time
have been responsible for high price per tonne to the producer as well. At the same time,
consumers are also hit by the spurt in the prices of onion intermittently. The profitability and
the potential offered by the exports of onion are evident from the fact that, on a national basis,
the area, production and yield of onion are steadily increasing, having almost three times
between 1980-81 and 2011-12 (Table-1.3).
Table-5.11: Export Destinations of Onion from India (2010-11)
Country Qty
(MT)
Value
(Rs lakhs)
PUV
(Rs/Ton)
Source
Bahrain 13,141.00 1,985.74 15,111.03 NAFED
Bangladesh 916,118.00 141,418.68 15,436.73 NAFED
Dammam 14,497.00 2,344.03 16,169.07 NAFED
Doha/Qatar 19,099.00 2,693.77 14,104.25 NAFED
Dubai 149,761.00 19,819.37 13,234.00 NAFED
Indonesia 8,678.00 1,395.12 16,076.52 NAFED
Kuwait 13,762.00 1,924.96 13,987.50 NAFED
Malaysia 320,616.00 47,653.96 14,863.25 NAFED
Maldives 6,103.00 1,287.38 21,094.22 NAFED
Mauritius 13,782.00 3,138.97 22,775.87 NAFED
Muscat 8,387.00 1,151.58 13,730.54 NAFED
Nepal 37,562.00 5,805.10 15,454.71 NAFED
Oman 8,047.00 891.64 11,080.40 NAFED
Pakistan 104,637.00 11,168.36 10,673.43 NAFED
Philippines 16,241.00 3,781.65 23,284.59 NAFED
Singapore 27,153.00 4,033.96 14,856.41 NAFED
Sri Lanka 137,618.00 22,770.16 16,545.92 NAFED
U.A.E 9,533.00 929.41 9,749.40 NAFED
Total 1,873,002.00 283,428.50 15,132.31
India’s onion exports cater mainly to the neighbouring South East Asian countries and
some Middle East nations. Pakistan, Malaysia, UAE, Sri Lanka, Bangladesh, Singapore and
Saudi Arabia, account for the major share of exports from India (Table-5.10).
64
5.10 Institutional Arrangement for Export Marketing of Onion
Exports of onions from India are regulated and permitted only through certain
designated canalizing agencies. One of the prime agencies is the National Agricultural
Cooperative Marketing Federation of India, Limited (NAFED), which is operating from
1974-75 till date, the sole agency meant for exports of onion from India. NAFED, was setup
in 1958 with its head office in New Delhi, provide market support to various agricultural
products. This market support to producers is provided by NAFED through various state
level Marketing Federations, Primary Agricultural Cooperative Marketing societies and the
National Cooperative Development Corporation.
This market support to producers is provided by NAFED through various state level
Marketing Federations, Primary Agricultural Cooperative Marketing societies and the
National Cooperative Development Corporation. During 1999, the new export–import policy
of the Government of India introduced certain changes in the system of onion trade by
including additional canalizing agencies for onion trade. These were the Maharashtra
Agricultural Marketing Board and the Gujarat Agro Industries Corporation. In December
1999, the list was further expanded with the inclusion of Karnataka State
Cooperative Marketing Federation, Andhra Pradesh Marketing Federation, Spices Trading
Corporation Limited, National Consumers’ Cooperative Federation, and Andhra Pradesh
State Trading Corporation as canalizing agencies for onion exports.
As reported in a report prepared by NCAER, India is presently exporting onion mainly to
Gulf countries, Far East countries, Bangladesh, and Sri Lanka where there is not much scope to
increase the quantity as some countries have also started their own production. The scope,
however, exists for diversifying the market to European countries and Japan. These
countries do not prefer strong and pungent onions. In these countries, yellow onions
having mild pungency, bigger bulb size with thick fleshy layers are preferred. The
65
possibility of growing yellow onions in Maharashtra, Orissa, Madhya Pradesh and other
parts was explored by NHRDF by taking trials on farmers' fields where bulbs of new
varieties could be successfully produced during late Kharif season. Evaluation of various
exotic varieties has been carried out in the past and continues to be taken up by NHRDF
where good bulbs with required size and quality could be produced during late Kharif
season and thus their exports from February to May in electrically- ventilated
containers could be explored. For this, however, contract production is preferred as there
may not be much local demand for these onions. Similarly, there is scope for exporting
dehydrated onions as many processing units under export-oriented unit schemes have been
installed in India. These are not presently running to their installed capacity mainly for want
of raw material. Thus, there is scope for development of varieties suitable for dehydration.
Onion Agrifound White developed by NHRDF holds promise in this regard. This variety
has already been given for evaluation under ICAR coordinated trials. The various export
markets have slightly different grading requirements. The Gulf market demands slightly
larger onions and pays a higher price, while Bangladesh takes smaller and cheaper ones.
After grading, onions are loaded into containers for shipping to various markets.
Sometimes they will be loaded on to smaller "country craft," a cheaper but more erratic
form of transport than containers on cargo ships. Bangladesh regularly receives material
through trucks.
The government allowed other agencies to enter into the canalized exports of onion
because it did not want any agency to monopolise the sector and also to facilitate easy
procurement, distribution, and exports of the commodity from the widely distributed
producing centres of the country. However, NAFED continues to be a monitoring agency.
Each canalizing agency is allocated a quota for exports. An inter-ministerial group
comprising representatives of the ministries of Commerce, Consumer Affairs, and
66
Agriculture, and NAFED decide the quotas for exports to be allocated to each canalizing
agency. These quotas are decided for varying periods of, say, 15 days to one month and
generally not for a long period.
The share of NAFED in the total quantity exported is around 50 per cent, with the
remaining being shared among the other canalizing agencies. Having been responsible for
exports of onions since its inception, NAFED has been able to establish markets for
Indian onion abroad, which is evident from the increasing volume of onion exports.
5.10.1 Price Support Programmes of NAFED
NAFED acts on behalf of government to provide market support to the producers
and ensure that they receive a remunerative price for their product. It also undertakes
support price purchases of various commodities (mainly onion) for the government. It is
the key agency for implementing the price support policy programme in respect of oilseeds
and coarse grains. For onion, NAFED intervenes in the domestic marketing whenever there
is glut in the market and prices becomes uneconomical. Prices prevailing in major markets all
over the country are reviewed every day in this process. Based on the cost of production
during the current season, the procurement prices of onion are decided by NAFED.
Procurement is initiated in event of crash in the price in the markets across country
and from the farmers directly as well. This benefits producers, particularly the small
producers, who have low storage capacity and are constrained to sell immediately after
harvesting on account of financial constraints.
In case of external trade, NAFED is responsible for fixing the minimum export price
(MEP) of onions, which is done on a monthly basis. The Price Fixation Committee of
NAFED decides this price. Factors such as market trends, world prices, domestic prices,
and margins are considered for arriving at the MEP of onion. After last year's onion price
67
spike, this role has been delegated to the Directorate General of Foreign Trade (DGFT)
with NAFED in the advisory role of providing pricing inputs.
5.10.2 Technological and Extension Support
NHRDF (National Horticultural Research Development Foundation) was set up by
NAFED to undertake research on development of varieties of onion suitable for cultivation
in different agro-climatic regions of the country as well as the development of suitable
production practices. NAFED has also set up units for the production of bio-fertilizers and
rhizobium culture. Besides NAFED, other public research agencies like National Research
Centre for Onion and Garlic, Pune are also involved in technology development and up-
gradation of all aspects of onion production.
The technologies and package of practices developed are passed on to the producers
through an extensive system of extension. Seed and other critical inputs are provided to
farmers by NAFED. Plant protection operations have also been undertaken to provide
protection against pest and disease infestations. Technical know-how i s extended to
farmers to improve production and productivity. Seed production is undertaken by
NHRDF and sold by NAFED. NAFED has set up modern state-of-the-art storage facilities
in Maharashtra, Gujarat and Tamil Nadu near its major procurement centres. Onions
require storage facilities that require sufficient inflow of fresh air.
5.10.3 Canalization
Export of onion was restricted by Government of India till 1998 and was controlled
through a single canalizing agency, NAFED. In 1998 the government appointed 12 other
canalizing agencies for onion export as follows:
1. Maharashtra State Agricultural Marketing Board, Pune (MSAMB)
2. Gujarat Agro Industries Corporation, Ahmedabad (GAIC)
3. Karnataka State Co-operative Marketing Federation Ltd, Bangalore (KSCMF)
4. Andhra Pradesh State Trading Corporation Ltd, Hyderabad (APSTCL)
68
5. National Co-operative Consumers Federation of India Ltd, New Delhi (NCCF)
6. Spices Trading Corporation Ltd, Bangalore (STCL)
7. North Karnataka Onion Growers’ Co-operative Society Ltd, Hubli (NKOGCS)
8. Madhya Pradesh Agro Industries Development Corporation Ltd, Bhopal
(MPAIDC)
9. Andhra Pradesh State Co-operative Marketing Federation Ltd, Hyderabad (APFed)
10. Madhya Pradesh State Co-operative Oilseed Growers’ Federation Ltd, Bhopal
(MPOGF)
11. Karnataka Agricultural Produce Processing and Export Corporation Ltd, Bangalore
12. West Bengal State Essential Commodities Supplies Corporation Ltd, Kolkata
(WBSECS)
5.11 SUPPLY CHAIN ANALYIS OF ONION
Supply chain considered in this study mainly focuses the flow of commodities from
farmer to the consumer involving producers, traders and retailers. Producer is a vital link in
such a model. The strengthening of producer is also crucial so as to make him competitive with
other players of supply chain during transition state i.e. from unorganized to organized supply
chain. Otherwise the better placed players in the commercially organized supply chain tend to
take undue advantage at the cost of farmers. The real challenge will be to integrate large
number of small-holder horticulture producers into the exiting supply chain and place them at
par with other players. The supply-chain for horticultural products in India is highly
fragmented, characterized by heavy post harvest losses, cost inefficiency and thus resulting in
low producers’ share in consumers’ price. The supply chain seems to be skewed away from
producers for its inherent features like small land holding, illiteracy, poor access to organized
finance, markets and information (World Bank, 2008b).
A number of supply chains are operating in India for movement of commodity from
farm gate to the ultimate consumer. Predominantly, it is still the traditional supply chain where
horticultural products are routed to the unorganized retailers through the wholesale markets.
69
These wholesale markets are set up by the state government under Agricultural Produce
Market Regulation Act wherein it is mandatory for buyers to purchase from these markets.
However, these aspects including several others have been addressed in some of the leading
states by introducing reforms in agricultural marketing. One such pro-active state in reforming
agricultural marketing is Madhya Pradesh. The amended Act, 2005 allows direct marketing
and product to flow through alternate routes. However, these channels are still in primitive
stage as all the state governments have not enacted the reforms in the right spirit of the Model
Act. The above observations reveal that still there exist fragmented supply chain and is
characterized by lack of connection between different players. The same has been observed in
the study area where supply chain consists mainly of three players, the poorly placed farmers
against better placed traders and retailers.
5.12 Cultivation Pattern, Yield and Consumption Pattern of Onion in Karnataka and
Maharashtra:
The study tried to elicit the information from the farmers with respect to various
parameters such as, extent of area allocation, yield and utilization of onion by the farmers both
in Karnataka and Maharashtra. The results of the same are presented in the Table-5.11: It is
apparent from the table that, the onion cultivation is found in both the season in Maharashtra
with an allocation of 38.28 percent and 23.32 percent of total cropped area respectively. On the
other hand, it is cultivated only in Kharif season in Karnataka where the proportion of area put
under onion is 29.58 per cent of cropped area. The kharif yields were slightly higher in
Karnataka (281.60q/ha) than in Maharashtra (218.4q/ha). However, the yield of onion was
much higher in the rabi season in Maharashtra (310.20q/ha) as it is grown under irrigated
conditions. The concerning point with respect to both the States is that, the postharvest losses
at farmer level are high (14%). Better handling, grading, harvesting at appropriate time can

70
lead to savings of at least 10% of these losses. Thus realisation of 10 per cent higher income is
possible without any hike in the price also.
Table-5.12: Cultivation Pattern, Yield and Consumption Pattern of Onion in Karnataka
and Maharashtra
S. No. Crops Karnataka Maharashtra
Average Area allotted for Onion crop
(% of total cropped area) (Kharif) 29.58 38.28
Rabi 0.00 23.32
Yield of Kharif Onion (Qntls./ha) 281.60 218.4
Yield of Rabi Onion -- 341.5
Average yield of Onion 281.6 310.2
Used for home consumption (Quintals/HH)
1.28
(0.45)
1.83
(0.59)
Used to gift relatives/ friends (Kgs.)
39
(0.14)
56
(0.18)
Post-harvest losses (%) at farmers level
39.34
(14.01)
38.09
(12.28)
Total use and losses (%)
41.01
(14..56)
40.48
(13.05)
Total marketable surplus
240.19
(85.41)
269.52
(86.93)
As depicted in the Table-5.12, the postharvest losses among intermediaries are high at
Traders and Commission agent’s level. The total postharvest losses put together accounts for
28.16 per cent in the case of Karnataka and 25.65 per cent in the case of Maharashtra. The
postharvest losses are relatively higher in the case of Karnataka mainly due to poor keeping
quality and lack of proper handling by the farmers. Moreover, the modified modern storage
structures developed by NHRDF and ICAR are predominantly used by the farmers in
Maharashtra and as per the feedback of the farmers the postharvest losses will be still
minimized in future.

71
Table- 5.13: Post Harvest Losses of Onion during Marketing in the Study Area
(Per cent of total transaction)
Karnataka Maharashtra
S.
N. Particulars of Losses Retailer Trader
Wholesaler
Retailer Trader
Wholesaler
1 Loss during transportation
0.64 0.9 0.28 0.52 1.1 0.1
2 Loss during loading unloading
1.06 0.32 0 0.8 0.2 0
3 Loss during marketing
2.7 3.5 4.2 1.7 4.58 3.6
4 Total loss at marketing level
4.4 4.72 4.48 3.02 5.88 3.7
S.
N.
Level Losses (%)
Karnataka Maharashtra
1 Farm/ Aggregation 14.56 13.05
2 Trader 4.72 5.88
3 Wholesale 4.48 3.7
4 Retail 4.4 3.02
5 Total 28.16 25.65
5.13 Marketing Cost, Margin and Price Spread of Onion in the Study Area:
An attempt has been made to workout marketing cost, margin and price spread in the
value chain of onion in the State of Maharashtra and Karnataka and the results of the same are
presented in the Table-5.13. There were four marketing channels found during the survey.
However, only two channels were considered for value chain analysis.
1. Producer Wholesaler (Commission agent) Retailer Consumer
2. Producer Local Trader Wholesaler (Commission agent) Retailer Consumer
3. Producers Consumers
4. Producer Retailer Consumer

72
Table-5.14: Marketing Cost, Margin and Price Spread of Onion in the Study Area
Karnataka Maharashtra
Channel-I Channel-II Channel-I Channel-II
Rs % Rs % Rs % Rs %
1
Price received
by the producer 754.00 49.96 887.79 58.83 805.00 51.90 974.00 64.54
2
Marketing cost
of producer 0.00 92.96 6.16 0.00 0.00 115.00
Postharvest loss 110.01 146.23 105.05 127.11
3
Net price received
by producer 643.99 42.67 701.87 46.51 805.00 51.90 744.00 49.30
3 Marketing cost of
a. Village trader 48.92 3.24 - - 38.25 2.47 - -
Postharvest loss 35.44 35.86
b. Wholesaler/CA 65.26 4.32 65.26 4.32 70.25 4.53 70.25 4.65
Postharvest loss 36.19 44.26 27.71 31.35
c. Retailer 38.25 38.25 2.53 42.25 2.72 42.25
Postharvest loss 33.18 40.57 24.61 27.84
5
Village trader
purchase price 754.00 49.96 - - 805.00 51.90 - -
6
Profit of Village
Trader 57.90 3.84 - - 64.79 4.18 - -
7
Wholesaler /
CA purchase price 896.26 59.39 887.79 58.83 908.04 58.54 974.00 64.54
8 Profit of WS/CA 64.25 4.26 96.36 6.38 78.51 5.06 67.33 4.46
11
Purchase price of
Retailer 1061.96 70.37 1049.41 69.53 1056.80 68.13 1111.58 73.65
Profit of Retailer 302.00 20.01 307.16 20.35 286.54 18.47 228.53 15.14
Consumer Price 1509.20 100.00 1509.20 100.00 1551.12 100.00 1551.12
12
Total postharvest
Losses 214.81 231.05 193.24 186.30
13
Producer’s Share in
consumer price 49.96 58.83 51.90 62.79
It is apparent from the results presented in the Table-5.13 that, the producer share in
consumer rupee was least in the case of marketing channel-I involving local traders. It was
49.96 percent for Karnataka and 51.90 percent in the case of Maharashtra. In this study an
attempt was made to include the postharvest losses at different stages treating it as a marketing
cost (Table-5.13). A Major proportion of cost was added in the value chain at different levels of
market players. The total loss per quintal was around Rs.200 per quintal accounting for around
13 percent of the consumer’s price. This amount would eventually reduce with decline in the

73
price and increase with the rise in price, ultimately putting burden on consumers. Due to
fragmented supply chain and lack of storage and perishable nature of onion, the marketing
margin in the value chain is significant and needs measures to reduce it. The reduction of loss
in the value chain will lead to supply of commodities at a reasonable price to consumer and
will enhance realisation of income by the farmers also.
Conclusions and Recommendations
A time series analysis of trends in area and production of onion revealed that there is
significant increase in onion production resulting in rise in market arrivals. However, due to
unseasonal rains, the production of onion declined by about 20% in three major growing states
during 2009-10 and 2010-11. To some extent, this reduction in production was offset by
marginally higher production in other states like Rajasthan and MP. The magnitude of decline
in production did not affect much on arrivals in the market.
The astronomical increase in the prices of onion was a result of hoarding of the stocks
in anticipation of rise in the price and higher retailers mark-up. The rise in price was also partly
due to reduction in MEP and consequent increase in exports during November, 2010.
Moreover, the crop situations were not predicted timely and thus, the information on loss in
production was not anticipated by market intelligence.
Proper staggered planting of onions with suitable varieties can address supply gap
during the slack period, there by stabilizing the prices across the year uniformly. As part of
market reforms, minimum support prices for onions and implementing market intelligence
systems can help in discovering the right prices for producers as well as consumers. The blame
game should be stopped and policies should aim at providing right price to the producers and
supply of onion to the consumer at reasonable price.
74
Policy Recommendations
1. Results of seasonal indices, daily, monthly arrivals their prices etc. indicated the
volatile nature of marketing of onion. The prices went up by more than two and half
time during lean season. This indicates that, there exists a problem of storage of onion
and thus none could have control on regulation of supply of onion. Moreover, during
survey it was observed that, few giant players (buyers) had control over the market.
This might have led to hoarding of onion stock at different points of time. This
situation can be overcome by encouraging farmers to go for storage during glut season.
Various agencies have developed cost effective and simple storage structure wherein
onion can be stored for more than three months. Thus concerned government agencies
should come forward to encourage storage and APMCs should also monitor the
dominance of few traders by issuing more number of licenses.
2. The situation of 2010 was mainly due to lack of forecasting of quantity of onion
produced and the loss caused by the unseasonal rainfall. Forecasting of production with
appropriate meteorological observation in place would help in averting such an
exceptional situations
3. The tremendous increase in area and production of onion has been attributed to the
rising exports in the recent decade. However, the spurt in export should not lead to
price rise. Hence, an appropriate export policy along with policy on fixing Minimum
Export Price during glut season should be in place. This will bring a balance in the
price discovery of onion
4. NAFED should purchase produce directly from the farmers rather than purchasing it
from traders. Market intervention should be at an appropriate time so that neither
producer is put under loss nor consumer is affecting by skyrocketing of prices.

75
5. The analysis of retail mark up in some of the markets revealed that, retailers are taking
undue advantage of rise in the price. This practice should be curbed by increasing
competition by allowing more number of private players, investment in retailing,
storage strengthening information dissemination system.
6. The marketing cost, margin and price spread analysis revealed that, the total marketing
margin is too high. It happens due to long and multiple chains in the supply chain of
onion. Hence, there is a need to promote orderly marketing and linking farmer directly
to retail chains.
7. Proper staggered planting of onions with suitable varieties can address supply gap
during the slack period, there by stabilizing the prices across the year uniformly. As
part of market reforms, minimum support prices for onions and implementing market
intelligence systems can help in discovering the right prices for producers as well as
consumers.

76
Chapter-VI References:
References
Anonymous (2012) “A Report on Competitive Assessment of Onion Markets in India”
Competition Commission of India
Anonymous (2012) “A Report on Price and Competition Issues in the Indian Market for
Onions” National Council of Applied Economic Research, India
Indra, T. Pushpa Jothi and M. Sendhil Velan (2004). “A Study on Marketing of Onion in
Dindigul District of Tamil Nadu”, Indian Journal of Agricultural Marketing, Vol.
18 (2), May-August, pp. 98-104.
Kalamkar, S.S. (2006). “Agricultural Marketing Infrastructure in Maharashtra”, Agricultural
Khunt K. A., H.M. Gajipara and S. B. Vekariya (2006): “Price Behaviour of Major Vegetables
in Gujarat State”, Indian Journal of Agricultural Marketing, 20 (1); 28-37.
Kumar, Sant, P.K. Joshi and Suresh Pal. (2004) Impact of Vegetable Research in India. NCAP
Workshop Proceedings No.13. National Centre for Agricultural Economics and
Policy Research, ICAR, New Delhi.
Marketing, Vol. 18, No. 2, May-August, pp. 45-55.
Mathur, V. C. (2001): Export Potential of Onion: A Case Study of India, paper presented in
“Regional Workshop on Commodity Export Diversification and Poverty Reduction
in South and South-East Asia”, held from 3-5 April, 2001, at Bangkok, Thailand
by UNCTAD and ESCAP.
Mittal, Surabhi. (2007). Strengthening Backward and Forward Linkages in Horticulture: Some
Successful Initiatives. Agricultural Economics Research Review, 20 (Conf. Issue):
457-469.
Murthy, D. Sreenivasa and T.M. Gajanana; M. Sudha and V. Dakshinamoorthy (2009).
“Marketing and Post-Harvest Losses in Fruits: Its implications on Availability and
Economy”, Indian Journal of Agricultural Marketing, Vol. 64, No. 2, April-June, p
260-273
NHB. (2011) Horticulture Database, 2010, National Horticulture Board, Gurgaon, India
Samra, et. al. (2006): “Impact of Access Rains on Yield, Market Availability and Prices of
Onion”, Information Bulletin - Hyderabad: Central Research Institute for Dry land
Agriculture (ICAR)
Shalendra, Gummagolmath, K. C. and P. Sharma. (2011) ICT Initiatives in Indian Agriculture-
An Overview. Indian Journal of Agricultural Economics. 66 (3):489-497.
Sharma, P., K. C. Gummagolmath and R. C. Sharma (2011). Prices of Onion: An Analysis,
Economic and Political Weekly, Vol. XLVI (2); 22-25.
Shroff, Sangeeta (2004). “Marketing of Onions in Maharashtra”, Indian Journal of Agricultural
Shroff, Sangeeta; S.S. Kalamkar and Jayanti Kajale (2011). ‘Impact of Emerging Marketing
Channels in Agriculture Marketing in Maharashtra: Benefit to Producers-Sellers,
Marketing Costs and Margins of Major Agricultural Commodities”, Pune: Gokhale
Institute of Politics and Economics.
Situation in India, Vol. LXII, No. 7, October 2005, pp. 489-500.
Sudhir, B. (2004): “Onion Prices and State Intervention”, Economic and Political Weekly,
August 14, 2004; 3684-3686.
World Bank. (2008b) India: Taking Agriculture to the Market. Report No. 35953-IN, World
Bank.
77
Annexure
Market Intervention Scheme of Government of Karnataka
Karnataka is also one of the main growing regions of potato, onion, tomato, chillies and
other horticultural crops. Horticulture crops occupy about 15.2 Lakh hectares of land with an
annual production of about 97 Lakh tones. Although, the area comprises only 14 per cent of
the net cultivated area in the State, the total income generated from horticulture crops account
to over 40 per cent of the total income derived from the agricultural sector as whole. All these
crops are not covered under MSP. With liberalized international trade in agricultural and
horticultural commodities under WTO regime, the farmers growing these crops are likely to
encounter the situation of volatile prices. IN the absence of safety net in the form of MSP and
government market intervention, the producers were often faced with the problem of distress
sale and getting lower price, which not only distorted incentives to production but also
adversely affected their livelihood. IN the case of these horticultural crops, due to occasional
glut in production and lack of effective local demand, a large proportion of the produce was
destroyed, resulting in heavy losses to farmers.
Recognizing the critical importance of agricultural price policy and the need for
government intervention, the Government of Karnataka, with its strong commitment to the
welfare of farming community, has passed. The Agricultural Policy Resolution in 1999,
which stressed the need to bring in “Price and Market Reforms” in the agricultural sector of the
State “Farmers in Karnataka often complain that they produce more only to get a lower price
for their produce, indicating the absence of any affected support policy in the State. While it
is recognized that the Central Government announces support prices of several agricultural
commodities, but the support mechanism remains effective basically for wheat and rice and
that too primarily in the north-western States. There are several occasions when prices of
coarse cereals go below minimum support prices announced by the Centre….”

78
The price policy implemented by the Government of Karnataka is known as “Floor
Price Scheme for Agricultural / horticultural commodities in Karnataka”. The floor price as
per the policy resolution means a price declared by the Government of Karnataka as minimum
price for a commodity having the prescribed Fair Average Quality (FAQ) standards to be
purchased under the FPS, not covered by MSP of Government of India. The objective of the
Floor Price Scheme (FPS) is to protect the farmers against distress sale of agricultural /
horticultural commodities by assuring minimum support price. Para-36 of the policy
resolution, however clearly states as follows:
Thus, the intention of the FPS is not to fix or control the market prices of agricultural
produce. Pricing of produce would be determined by the market forces overall demand and
supply conditions. The policy of providing a floor price support is only to act as an
instrument against any sudden and precipitous fall in its price below the floor price announced
by the Government. This would prevent distress selling by farmers during conditions of glut
in production or a consequence of inadequate or ineffective demand. The FPS is also expected
to operate as complementary to MSP scheme of Government of India and not as a substitute
for it. To start with, the FPS is expected to applicable to onion and potato growth in Karnataka
and it could be extended as and when considered necessary by the Government of Karnataka to
cover other agricultural/ horticultural commodities, which are not covered under MSP of
Government of India. The FPS can be also operated to supplement the MSP scheme for
commodities which is covered under it if necessary. The FPS is applicable in the whole of
Karnataka State in agricultural and horticultural produce.
The operational features of the FPS are stipulated as under:
1. A Revolving Fund was established for funding the operation of the FPS through
contribution, for the Revolving Fund has come from the State Government
contribution, Central Government contribution and the contribution of Agricultural
79
Produce Marketing Committees (APMCs) of the State by way of a part of the
market fee levied for the produce marketed. The Revolving Fund would be
replenished using the sale proceeds of the commodities procured under FPS as well
as from contribution of APMCs from the market levy from time to time. The
Karnataka Agricultural Marketing Board (KSAMB) as an apex marketing body is
made responsible for maintenance and operation of the Revolving Fund.
2. Agriculture Price Commission was set up at the State level to advise the State
Government on the measures necessary for effective implementation of the price
policy for all agricultural and horticultural commodities. A Cabinet Sub-Committee
of concerned agricultural ministries under the Chairmanship of Minister of
Agriculture constituted to take decisions regarding fixation of floor price grade,
opening of purchasing points, marketing arrangements etc.
3. A State Level Committee (SLC) under the Chairmanship of Additional Secretary /
Development Commissioner-cum-Agricultural Production Committee, Government
of Karnataka comprising Secretaries of concerned ministries and heads of the
Departments and The Director of Agricultural Marketing, Government of
Karnataka and the Managing Director of KSAMB as convener was set up to
implement and oversee the planning and implementation of the FPS.
4. A District Level Committee (DLC) under the Chairmanship of the divisional
Commissioner of the District was constituted at district level for effective operation
of FPS. The composition of the DLC included the Chief Executive Officer of
Zillah Parishad, District Heads of concerned agricultural departments, Deputy
Registrar of Cooperative Societies, representative of Lead Bank, Member of
KSAMB representative of Purchasing Agency and Deputy Director of Agricultural
Marketing as convener.

80
5. The procurement under the fps WOULD BEMADEBY THE Purchase Agency
authorized by the Cabinet Sub-Committee of the State Government from time to
time to purchase the specified agricultural / horticultural commodities. The
purchase agencies authorised mainly included public sector and cooperative
marketing bodies.
6. The modus operandi for procurement operation as envisaged under the scheme is as
under:
All notified commodities procured under the scheme should meet the FAQ
standards and no purchase to be made of commodities which do not meet the
FAQ standards.
The Purchasing Agency should make immediate payment to farmers and settle
the accounts towards purchase of commodities.
The Purchasing agency should properly transport, trade, store and handle the
commodities purchased under this scheme so as to avoid quantitative and
qualitative losses.
The commodities procured under the scheme by the Purchasing Agency should
be disposed of as early as possible and should not be kept beyond the normal
shelf life.
In pursuance of the Floor Price Policy objectives and with its commitment to the
welfare farmers, Karnataka State Government has set up Agricultural Price commission
(KAPC) with well defined terms of reference. Ti s preamble States: “It has been felt the
need for the constitution of an independent, professional and technically qualified State
Agricultural Price Commission. The Commission will recommend standard prices that can
be sustained in the market and the support prices at which the State Government may
intervene in the market”/ As per the terms of reference set out by the State Government, the

81
main function of the APC is to estimate costs of production as per the methodology already
laid down by the Government of India under MSP policy and recommend minimum support
prices for crops, which do not fall within the purview of the Government of India minimum
support price policy.
The Floor Price Scheme has come into operation since 1999. It is operated through a
Revolving Fund set up by the government of Karnataka. The Revolving Fund is administered
by the KSAMB as an apex marketing body. The scheme is implemented mainly through
government agencies and public sector and cooperative marketing bodies as procurement
agencies. Under the scheme, the Government as so far released over Rs.500 crore for market
intervention operations for fourteen notified crops. The scheme e is in operation during the
last seven years.
Though the pricing intervention for agricultural and horticultural products is a
continuous phenomenon, the monitoring the evaluation of the operation of the scheme
periodically is critically important to ensure effective functioning of price policy and
realization of its set objectives. The evaluation is also essential to examine the performance of
institutional mechanism involved for undertaking minimum support price procurement storage
disposal operations with a view to improve their institutional capability for effective market
intervention under the scheme.
Market Intervention for Perishable Crops: Onion
The Government of India’s Minimum Support Price policy coves almost all the cereals,
oilseeds and pulses besides cotton and sugarcane. It does not include perishable horticultural
crops. These crops have in fact serious marketing problems in the absence of processing
facilities and due to perishability and lack of storability. Moreover, any glut in production
results in sudden and precipitous fall in prices and distress selling, which affect adversely
82
farmers’ livelihood. The State Government Floor Price Policy is, therefore, more intended to
provide support mechanism to farmers who produce perishable horticultural crops, which are
not covered under the Minimum Support Price Policy of the Government of India.
Accordingly, the State Government in its FPS has accorded top priority to potato, onion,
tomato and chillies.
Karnataka is one of the major producers of onion. Due to glut in production and
precipitous fall in prices of onion during crop year 2006-07, the State Government intervened
massively in the market under the FPS to protect the interest of onion growers. In this chapter,
an attempt is made to evaluate the performance and efficacy of the Government market
intervention operations and to examine whether onion growers have really benefited under the
FPS and whether the Government has achieved the set policy objectives.
Minimum Support Price for Onion:
87 per cent of onion in Karnataka is grown as rainfed crop during Kharif season. In
Dharwad, Gadag and Chithradurga Districts which are the main onion growing districts, it is
grown as rainfed crop in 98 per cent of the total area and production. The risk and uncertainty
involved in the production of onion in these districts are very high due to vagaries of nature.
Moreover the local variety of onion growth is of poor quality with high moisture content and
highly perishable. Because of the high perish ability of the type of onion grown; farmers in
these districts are often faced with the problem of precipitous depression in prices, resulting in
distress sale. Therefore, assurance of minimum remunerative and stable price environment for
onion growers is considered as imperative to protect the income of farmers.
In pursuance of the Floor Price Policy objectives, the Karnataka Agricultural Price
Commission has for the first time estimated cost of production of onion based on the
methodology laid down by the Commission for agricultural Cost and Prices. Based on the
cost of production estimate, the Commission had recommended a minimum support price of
83
Rs.340 per quintal of FAQ onion for the crop year 2001-02. Prior to the prevailing minimum
procurement price fixed by the State Government for market intervention was Rs.300 per
quintal. Since there were no changes in prices of important inflation in general, the minimum
support price for onion remained unchanged at Rs.300 per quintal till 2005-06. Though during
this period, the wholesale price for onion was fluctuating around Rs.800 to 1000 per quintal,
the farm level market price remained stagnant at Rs.360 per quintal.
During the crop year 2005-06, due to pressure from the farmers’ organizations,
Karnataka Agricultural Price Commission has reviewed the minimum support price for onion
and fixed at Rs.370 per quintal of FAQ onion. Annexure provides data on per acre estimate of
cost of production and the basis of recommending the minimum support price for onion for the
crop season 2006-07.
Though the APC has recommended the minimum support price of Rs.370 per quintal,
the State Government, due to political pressures, has increased the minimum support price for
onion initially to Rs.400 per quintal and subsequently, to Rs.500 per quintal. Moreover, the
Government has, for the first time, fixed minimum support price for three different grades as
under:
Grade –I Rs.500 per quintal
Grade –II Rs.270 per quintal
Grade-III Rs.100 per quintal
Market Intervention Operations:
Announcement of minimum support prices for agricultural commodities does not
automatically mean direct Government intervention in the market at minimum support prices
every crop year. The Government intervention would be only as a last resort, whenever the
market prices fall below the minimum prices and when there is no buyer at the minimum price.
With the Government intervention, the market price is expected to recover and stabilize at

84
price above the MSP. Whenever market prices are above the minimum fixed by the
Government, farmers are free to sell at the prevailing market prices. The question of the
Government intervention does not arise.
The Government market intervention operations with minimum support price under the
FPS actually took place for onion only thrice during the last eight years of its implementation.
In the first year of operation 1999-2000, it was only marginal intervention. The total amount
disbursed from the Revolving Fund for the procurement operation during that year was only
Rs.1.06 crore. The quantity of onion procured was 3204 tons, mainly in Dharwad and
Belgaum districts. During the crop years 2004-05 and 2006-07, the Government market
interventions in onion market were significantly higher. Table-I shows the magnitude of the
Government market intervention in the onion market in different districts.
Table–I: Government’s Market Intervention in the Onion Market
(Amount –Rs. in crore; Quantity procured in Tons)
Districts
1999-2000 2004-05 2006-07
Amount Quantity Amount Quantity Amount Quantity
Dharwad 0.98 5.75 62.00 105936
Gadag 0.08 4.73 16.67 26958
Belgaum -- 6.47 10212
Chithradurga 0.50 -- --
Bijapur 0.50 -- --
Bagalkote 0.50 0.01 13
Koppal 0.50 -- --
Raichur 0.50 0.04 88
Total 1.06 3204 12.98 26333 85.19 143207
Note: Amount includes besides price payable to farmers, transport costs,
storage costs and margin for Purchasing Agencies.
85
During the crop year 2004-05, the Government market intervention involved
procurement of 26,333 tons of onion at the cost of Rs.12.98 crore. As against this, during the
crop year 2006-07, the Government involvement has increased more than five times. The
quantity procured has gone up to 1, 43,207 tons and the financial outlay has gone up to
Rs.85.19 crore. Surprisingly, the main thrust areas for market intervention during all these
three years were Dharwad, Gadag and Belgaum districts. In other important onion growing
districts such as Chitradurga, Bijapur and Bellary, the market intervention was only marginal.
The number of onion growers covered under this scheme also increased fourfold from 7,982
during 2004-05 to 31,689 during 2006-07. The highest number of farmers benefited under this
program was from Dharwad district, accounting for 67 per cent of the total followed by Gadag
district with 23 per cent and Belgaum with nine per cent.