trends in graduate education - council of graduate schools...trends in graduate education ... •...
TRANSCRIPT

@CGSGradEd
Wednesday, February 26, 2020
Jaqui FalkenheimSenior Science Resources AnalystNational Center for Science and Engineering Statistics at the National Science Foundation
Josh TrapaniSenior AnalystNational Center for Science and Engineering Statistics at the National Science Foundation
Trends in Graduate Education
@CGSGradEd
• Three speakers will speak for approximately 45 minutes total, followed by Q & A
• Hironao Okahana of the Council of Graduate Schools will speak for approximately 5 minutes introducing the speakers and discussing CGS data initiatives.
• Jaqui Falkenheim and Josh Trapani will speak for 40 minutes on recent data on graduate students from the Survey of Earned Doctorates and the Science and Engineering Indicators. They will include trends in the humanities and other non-STEM fields, as well as U.S. graduate education in a global context, when available.
Plan for today
@CGSGradEd
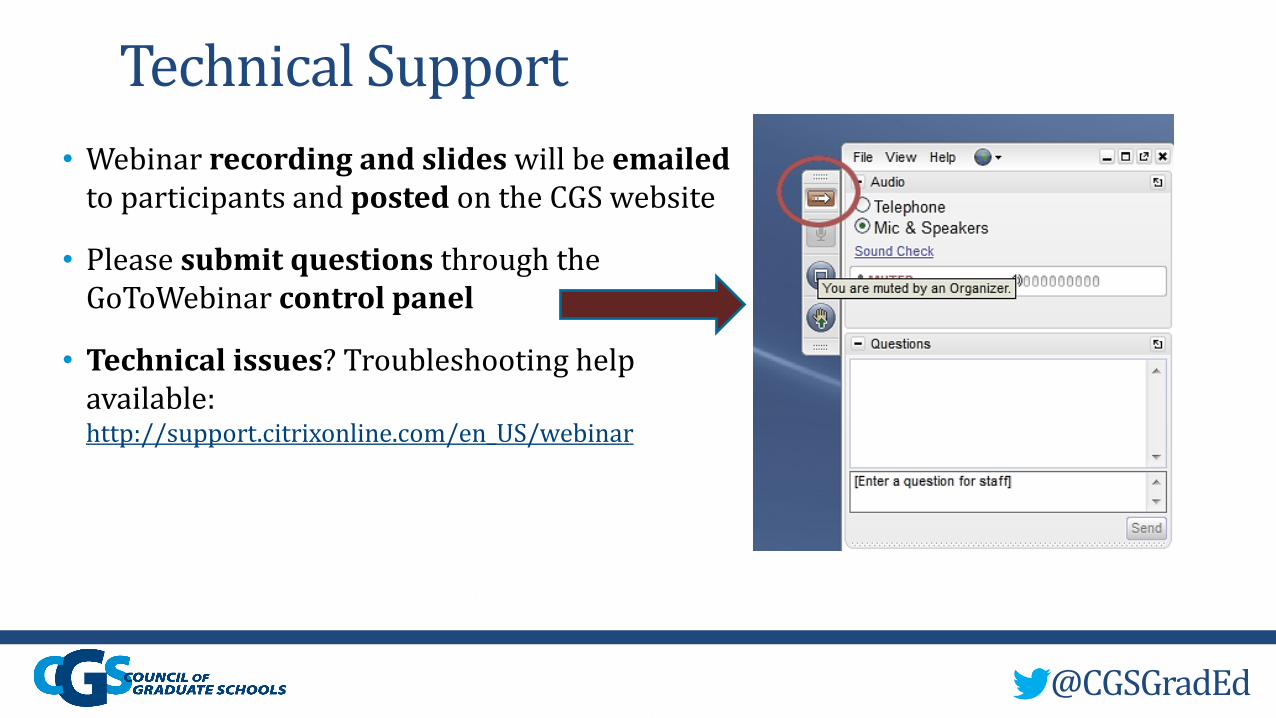
• Webinar recording and slides will be emailedto participants and posted on the CGS website
• Please submit questions through the GoToWebinar control panel
• Technical issues? Troubleshooting help available: http://support.citrixonline.com/en_US/webinar
Technical Support

@CGSGradEd
• Having trouble hearing us? Try switching to a different audio connection. You can change from Telephone to Mic & Speakers or vice versa without leaving the session.
• If you experience trouble with a telephone connection, click “Problem dialing in?” for an alternate phone number to dial.
Audio Troubleshooting

@CGSGradEd
Introduction: Hironao Okahana

Many thanks to all the institutions who contribute data to our two enrollment surveys!
The Fall 2019 Data Collection Cycle for CGS/GRE Survey of Graduate Enrollment & Degrees is still open. If your institution has not completed the survey, please contact [email protected].
#CGSResearch
National Center for Science and Engineering StatisticsSocial, Behavioral and Economic SciencesNational Science Foundation
Trends in Graduate EducationDr. Jaqui Falkenheim and Dr. Josh Trapani
February 26, 2020
CGS Webinar
8
Presentation Outline• About NCSES• Trends in master’s degrees• Trends in doctoral degrees• International graduate student enrollment and doctoral degrees• Financial support of graduate students • Debt levels, postgraduation employment commitments, and salary
of doctoral recipients• Take-home messages• Data availability and how to access our data

NCSES is NSF’s statistical agency, one of thirteen principal federal statistical agencies in the United States
9

NCSES’s mission is to be the federal clearinghouse for data that provides key insights on the American economy
• Science and engineering education: S&E graduate school enrollment; post-graduation plans of U.S. S&E doctorates.
• The science and engineering workforce: Counts and fields of postdoctoral appointees, characteristics of U.S. college graduates.
• Research and development: Microbusiness R&D expenditures; federal R&D obligations.
• U.S. competitiveness in science and engineering: S&E research outputs (i.e. publications, citations, patents); regional share of R&D expenditures.
10

NCSES Data Products
11
Congressionally Mandated Reports
NCSES Website and Data Tools
Data TablesInfoBriefs and Special Reports

12
Numbers of master’s degrees awarded have grown rapidly inengineering and mathematics and computer sciences.
0
10,000
20,000
30,000
40,000
50,000
60,000
2000 2001 2002 2003 2004 2005 2006 2007 2008 2009 2010 2011 2012 2013 2014 2015 2016 2017
Num
ber o
f deg
rees
Engineering Mathematics and computer sciences Social sciences
Psychology Biological sciences Agricultural sciences
Physical sciences Earth, atmospheric, and ocean sciences
S&E master’s degrees by field: 2000-17
Source: IPEDS.

13
Much of the growth in those fields is attributable to increasing numbers of students on temporary visas earning master’s degrees.
0
5,000
10,000
15,000
20,000
25,000
30,000
35,000
40,000
2000 2001 2002 2003 2004 2005 2006 2007 2008 2009 2010 2011 2012 2013 2014 2015 2016 2017
Num
ber o
f deg
rees
U.S. citizens - engineering U.S. citizens - mathematics and computer sciences
Temp visa holders - Engineering Temp visa holders - mathematics and computer sciencesSource: IPEDS.
Master’s degrees in engineering and math and computer sciences, by citizenship: 2000-17

14
The share of S&E master’s degrees earned by women is highly field-dependent, which is a long-standing pattern.
0% 25% 50% 75% 100%
All fields
S&E
Engineering
Agricultural sciences
Biological sciences
Earth, atmospheric, and ocean sciences
Mathematics and computer sciences
Physical sciences
Psychology
Social sciences
Non-S&E
Percent of degrees awarded to women2000 2017 Source: IPEDS.

15
Numbers and percentages of underrepresented minority students earning master’s degrees have increased. But these groups remain underrepresented, particularly in certain fields.
0
5,000
10,000
15,000
20,000
25,000
30,000
2001 2009 2017
Num
ber o
f deg
rees
American Indian or Alaska Native
Black or African American
Hispanic or Latino
5.7%
8.6%
10.6%
10.5%
Source: IPEDS.
S&E master’s degrees earned by URMs
0% 10% 20% 30% 40% 50% 60% 70% 80% 90% 100%
Hispanic or Latino
American Indian or Alaska Native
Black or African American
Asian
White
Engineering Mathematics and computer sciences
Physical sciences Earth, atmospheric, and ocean sciences
Agricultural sciences Biological sciences
Psychology Social sciences
S&E master’s degrees by field and race and ethnicity: 2017
Source: IPEDS.
6.7%
9.5%

16
Most S&E master’s degrees are awarded by doctoral and master’s institutions. Different types of institutions focus on specific fields.
Source: IPEDS.
0 10,000 20,000 30,000 40,000 50,000 60,000 70,000 80,000 90,000 100,000
Doctoral universities: highest research activity
Doctoral universities: higher research activity
Doctoral universities: moderate research activity
Master's colleges and universities
All others
Number of degrees
Engineering Psychology Mathematics and computer sciences Social sciences
Biological sciences Agricultural sciences Physical sciences Earth, atmospheric, and ocean sciences
S&E master’s degrees awarded by Carnegie classification and field: 2017

The number of doctorates awarded shows a strong upward trend over time
17
Data source: National Center for Science and Engineering Statistics, Survey of Earned Doctorates, 2018
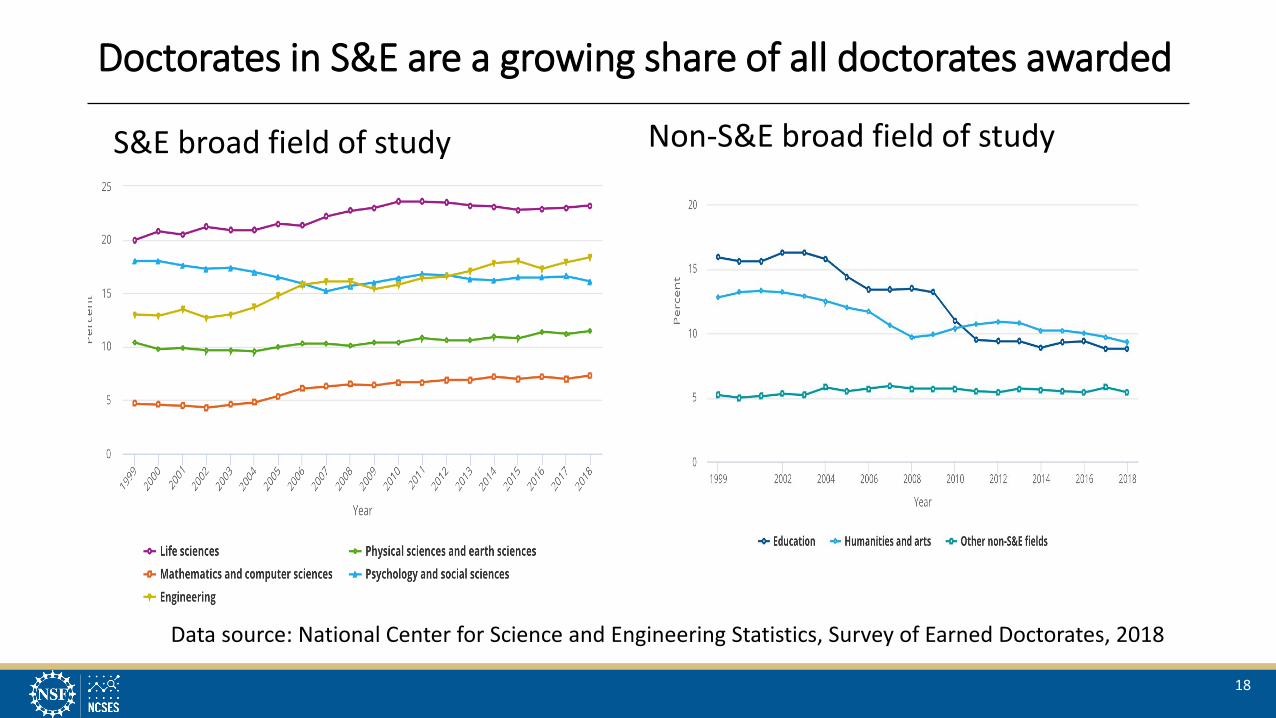
Non-S&E broad field of study
Doctorates in S&E are a growing share of all doctorates awarded
18
S&E broad field of study
Data source: National Center for Science and Engineering Statistics, Survey of Earned Doctorates, 2018
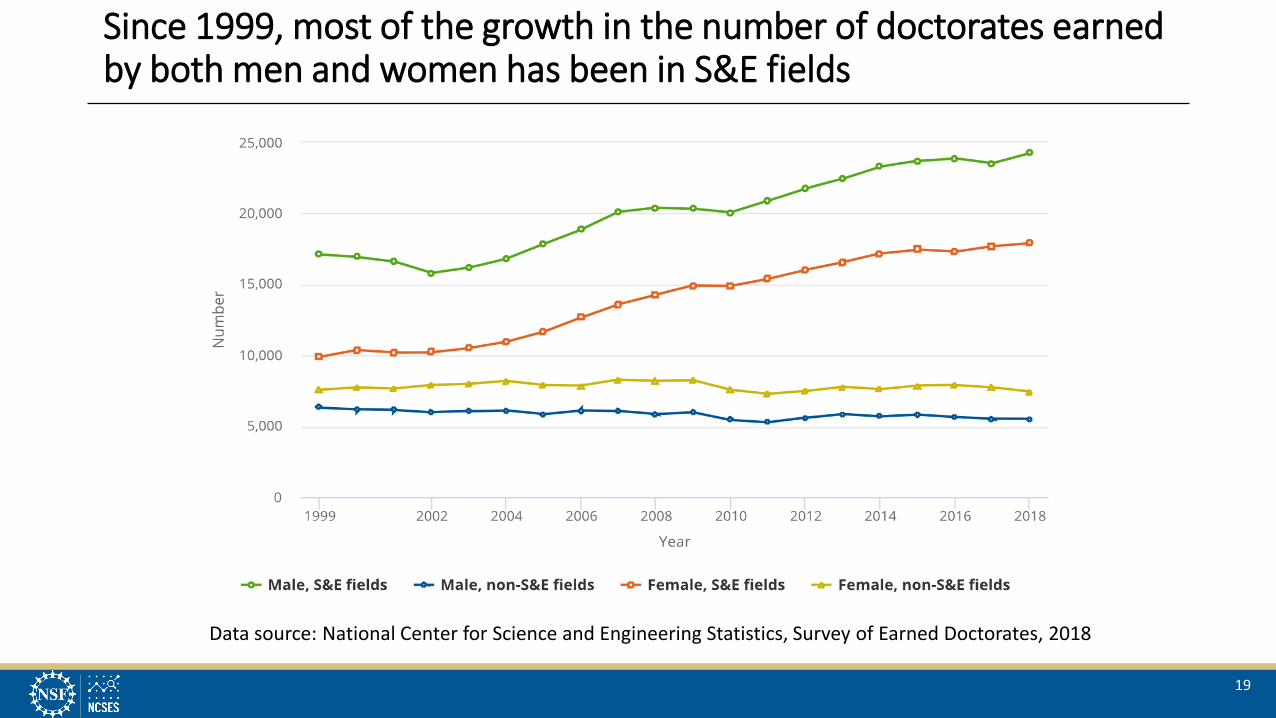
Since 1999, most of the growth in the number of doctorates earned by both men and women has been in S&E fields
19
Data source: National Center for Science and Engineering Statistics, Survey of Earned Doctorates, 2018
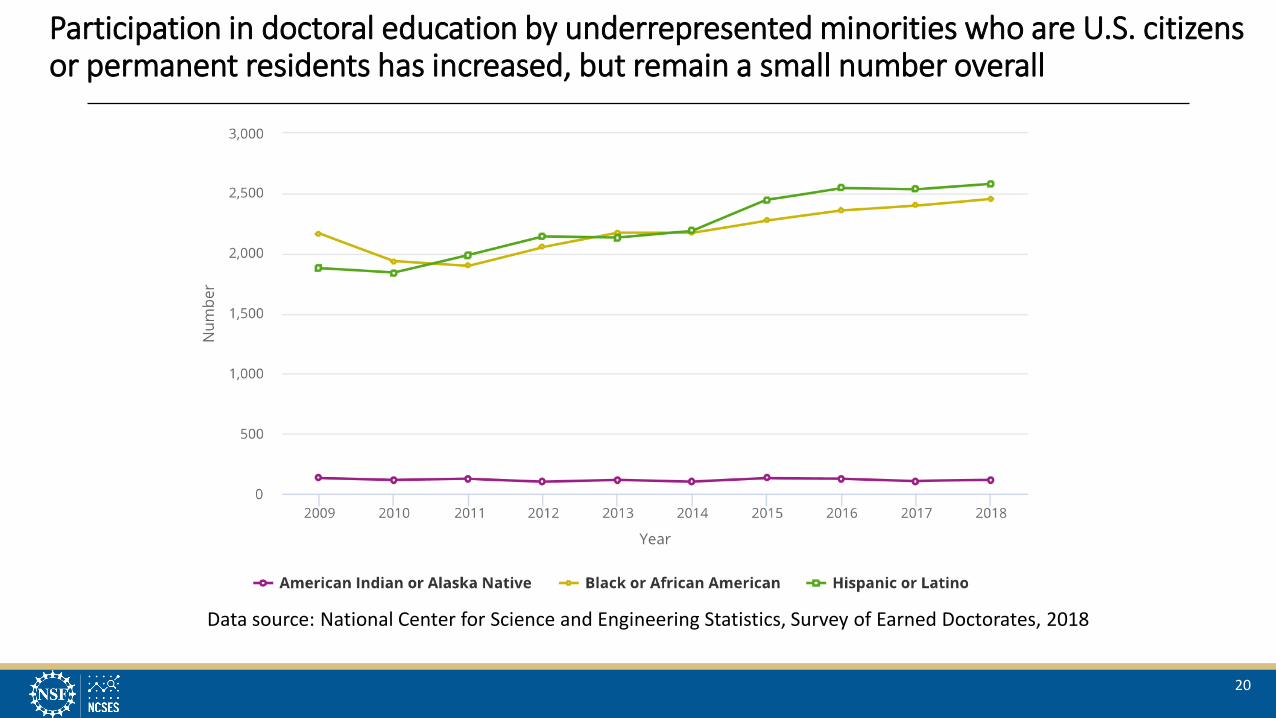
Participation in doctoral education by underrepresented minorities who are U.S. citizens or permanent residents has increased, but remain a small number overall
20
Data source: National Center for Science and Engineering Statistics, Survey of Earned Doctorates, 2018
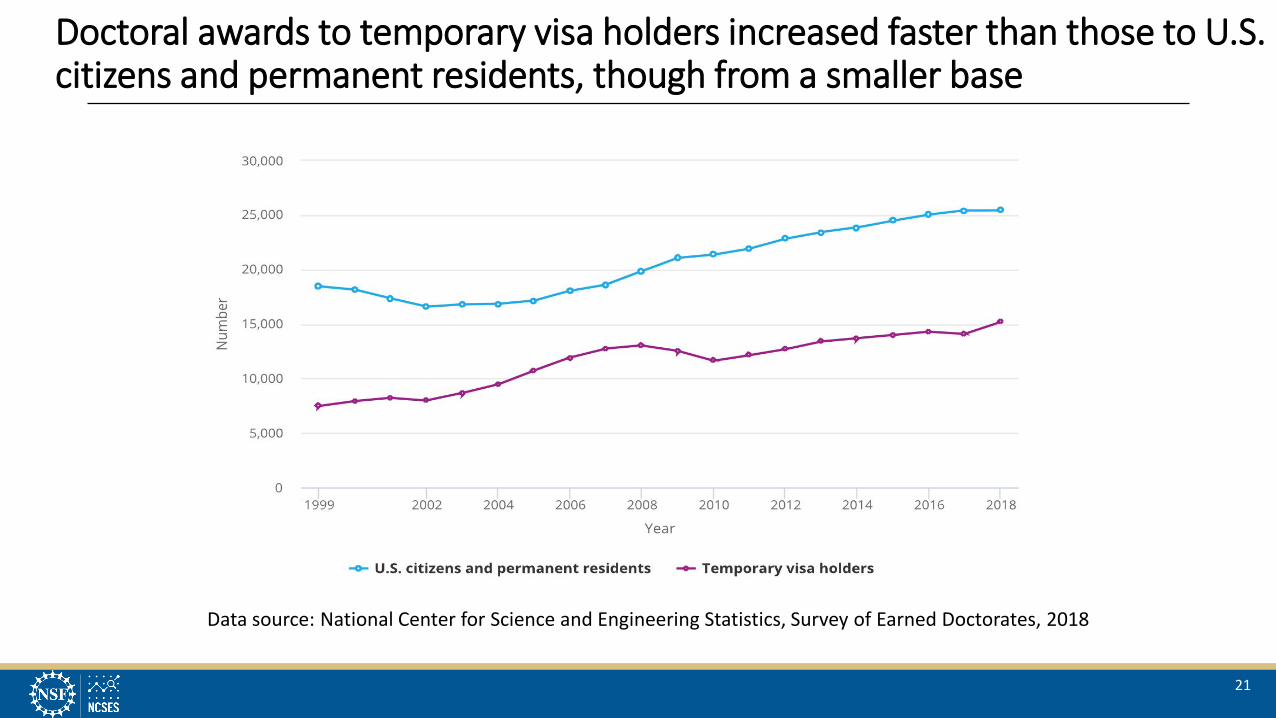
Doctoral awards to temporary visa holders increased faster than those to U.S. citizens and permanent residents, though from a smaller base
21
Data source: National Center for Science and Engineering Statistics, Survey of Earned Doctorates, 2018

Since 2002, women have earned a slim majority of doctorates awarded to U.S. citizens and permanent residents
22
Data source: National Center for Science and Engineering Statistics, Survey of Earned Doctorates, 2018

23
U.S. international student enrollment has declined since 2016.
349,400 371,990 405,930 416,350 450,850 440,720 435,260
283,680301,490
341,470 360,380389,310 367,920 369,150
0
100,000
200,000
300,000
400,000
500,000
600,000
700,000
800,000
900,000
2012 2013 2014 2015 2016 2017 2018
Num
ber o
f stu
dent
s
Undergraduate Graduate
International students enrolled in U.S. higher education institutions: 2012-18
Source: U.S. Department of Homeland Security, U.S. Immigration and Customs Enforcement, special tabulations (2018) of the Student and Exchange Visitor Information System (SEVIS) database.

24
U.S. graduate student enrollment in science increased between 2017 and 2018. In other fields, the decline from 2016 continued.
0 20,000 40,000 60,000 80,000 100,000 120,000 140,000 160,000
Science
Engineering
Business
Non-S&E
Number of students
2016 2017 2018
Source: U.S. Department of Homeland Security, U.S. Immigration and Customs Enforcement, special tabulations (2018) of the Student and Exchange Visitor Information System (SEVIS) database.
International graduate student enrollment by field

25
Source: U.S. Department of Homeland Security, U.S. Immigration and Customs Enforcement, special tabulations (2018) of the Student and Exchange Visitor Information System (SEVIS) database.
Graduate students from China studying in the U.S. increased across fields. Numbers of students from India declined.
Chinese graduate students in the United States
45,560
48,740
53,030
30,840
30,840
31,450
23,190
23,270
24,370
0 10,000 20,000 30,000 40,000 50,000 60,000
2016
2017
2018
Science Engineering Non-S&E
Indian graduate students in the United States
56,490
45,390
46,410
39,470
32,110
28,600
10,280
9,080
8,460
0 10,000 20,000 30,000 40,000 50,000 60,000
2016
2017
2018
Science Engineering Non-S&E

26
Students from China, India, and South Korea account for more than half of U.S. doctorates awarded to students on temporary visas since 2000
Source: NCSES Survey of Earned Doctorates.
Sources: NCES IPEDS; NCSES IDS.
34%
45%49%
56% 57% 59%
0%
25%
50%
75%
Percentage of doctoral degree recipients on temporary visas for
selected fields: 2017

27
5-year stay rates overall have increased since 2011, and have not changed significantly for China or India.
5-year stay rate of foreign recipients of U.S. S&E doctorates, by country of origin: 2003, 2011, 2017
0
10
20
30
40
50
60
70
80
90
100
Total China India South Korea Europe
Perc
ent
Country of Origin
2003 2011 2017
Sources: NCSES, SDR and SED, and SSA. Note: The data source changed after 2011. Margin of error is shown for the 2017 estimates which are from a sample survey.

28
Intentions of doctoral recipients with temporary visas to stay in the U.S. changed little between 2012 to 2018.
Doctorate recipients with temporary visas intending to stay in the U.S.: 2012, 2015, 2018
0
10
20
30
40
50
60
70
80
90
100
Total China India South Korea Europe
Perc
ent
Country of origin
2012 2015 2018 Source: NCSES Survey of Earned Doctorates.

29
Master’s students are far more likely to self-support. For doctoral students, support patterns vary between fields.
Source: NCSES Survey of Graduate Students and Postdoctorates in Science and Engineering,
Master’s students
0% 25% 50% 75% 100%
All S&E
Agricultural sciences
Biological and biomedical sciences
Computer and information sciences
Geosciences, atmospheric sciences, and ocean sciences
Mathematics and statistics
Physical sciences
Psychology
Social sciences
Engineering
Research assistantships Teaching assistantships Fellowships Traineeships Other Self-support
0% 25% 50% 75% 100%
Doctoral students

30
Mechanisms of support for doctoral recipients vary by demographiccharacteristics (which also relates to field of study differences).
Source: NCSES Survey of Earned Doctorates.
0 25 50 75 100
Male
Female
0 25 50 75 100
Hispanic or Latino
American Indian or Alaska Native
Asian
Black or African American
White
Percent of doctoral recipients: 2015-17
Research assistantship Fellowship or traineeship Teaching assistantship Grant (dissertation grant) Personal Other Unknown
Some values suppressed due to small sample size
Doctorate recipients’ primary mechanism of support by sex and race and ethnicity: 2015-17

31
The number and percentage of full-time S&E graduate studentssupported by the federal government has declined.
Source: NCSES Survey of Graduate Students and Postdoctorates in Science and Engineering,

32
In their support patterns across fields, federal agencies take on portfolios consistent with their missions.
Source: NCSES Survey of Graduate Students and Postdoctorates in Science and Engineering,

Graduate debt is highest among doctorate recipients in psychology and education and lowest in the natural sciences and engineering
33
Data source: National Center for Science and Engineering Statistics, Survey of Earned Doctorates, 2018

Graduate debt is lowest among doctorate recipients from institutions with the highest research activity and from 4-year medical schools and centers
34
Data source: National Center for Science and Engineering Statistics, Survey of Earned Doctorates, 2018

By non-S&E broad field of study
Definite commitments for employment, including postdoc positions, hit low points in 2014-2016 but have rebounded.
35
By S&E broad field of study
Data source: National Center for Science and Engineering Statistics, Survey of Earned Doctorates, 2018

The highest rates of academic employment commitments are reported in the humanities and arts and in other non-S&E fields
36
Data source: National Center for Science and Engineering Statistics, Survey of Earned Doctorates, 2018

Since 1999, postdocs have become more prevalent in math and computer sciences, psychology and social sciences, engineering, and non-S&E fields
37
Data source: National Center for Science and Engineering Statistics, Survey of Earned Doctorates, 2018

Median basic annual salary of doctorate recipients with definite commitments in the U.S. vary by field and type of position
38
Data source: National Center for Science and Engineering Statistics, Survey of Earned Doctorates, 2018

Doctorate recipients in the fields with the lowest median cumulative debt had among the highest median expected annual salaries
39
Data source: National Center for Science and Engineering Statistics, Survey of Earned Doctorates, 2018

40
Take-Home Messages: 1 of 3Master’s Degrees• Numbers of master’s degrees awarded have grown rapidly in engineering and mathematics
and computer sciences, largely due to increasing numbers of students on temporary visas.
Doctoral degrees• Number of doctorates awarded shows a strong upward trend, and S&E doctorates are a
growing share of all doctorates awarded.
• URM participation has increased in the last ten years, but numbers remain small overall.
• Since 2002, women have earned a slim majority of doctorates awarded to U.S. citizens and permanent residents.

41
Take-Home Messages: 2 of 3
International graduate students• Changes in international graduate student enrollment vary by field of study and country of
origin. Stay rates have not decreased significantly in recent years.
Financial Support Patterns• Master’s and doctoral students exhibit very different financial support patterns. There are
also important differences between S&E fields.
• The federal role in financing graduate students remains important, though it has diminished over time.

42
Take-Home Messages: 3 of 3Doctoral recipients’ debt, career outcomes, and salary• Graduate debt is highest among doctorate recipients in psychology and education and
lowest in the natural sciences and engineering.
• Definite commitments for employment, including postdoc positions, hit low points between 2014 and 2016 but have since rebounded.
• The highest rates of academic employment commitments are reported in the humanities and arts and in other non-S&E fields.
• Median basic annual salary of doctorate recipients with definite commitments in the United States varies by field and type of position.

Data availability
GSS• Latest data available at https://nsf.gov/statistics/srvygradpostdoc/• Create custom tables in the NCSES Table Tool at
https://ncsesdata.nsf.gov/ids/gss• Microdata: Public-use files can be downloaded from the GSS website at
http://nsf.gov/statistics/srvygradpostdoc/
SED• Annual report at: http://nsf.gov/statistics/doctorates/• Create custom tables in the NCSES table tool at
https://ncsesdata.nsf.gov/ids/sed• Microdata: Restricted-use files only through license with NCSES
http://nsf.gov/statistics/license/
43
Additional NCSES Publications and Products
• Congressionally mandated biennial reports:• Science and Engineering Indicators (even numbered years)
http://nsf.gov/statistics/seind/
• Women, Minorities, and Persons With Disabilities in Science and Engineering (odd numbered years) http://nsf.gov/statistics/wmpd/\
• InfoBriefs – highlighting results from recent surveys and analyses http://nsf.gov/statistics/
• Detailed Statistical Tables – tabular data and technical material, usually for a particular survey and survey year http://nsf.gov/statistics/
44


@CGSGradEd
Webinar recording and slides will be emailed to participants and posted on the CGS website.
Type them into the Questions box on the GoToWebinar control panel.
Questions?

@CGSGradEd
Thank You for Participating!• Upcoming CGS webinar:
• Culturally Aware Mentoring: Optimizing Mentoring Relationships• Wednesday, March 18, 2020 from 2:00-3:00 PM ETVisit http://cgsnet.org/cgs-webinars for more information on upcoming webinars as well as recordings of past webinars.