trends in dental caries and sealants, tooth …...oral health surveillance report trends in dental...
TRANSCRIPT
O R A L H E A LT H S U R V E I L L A N C E R E P O R T
Trends in Dental Caries and Sealants, Tooth Retention, and Edentulism, United States
1999–2004 to 2011–2016

For More Information Centers for Disease Control and PreventionTelephone: 1-800-CDC-INFO (232-4636)/ TTY: 1-888-232-6348E-mail: CDC-INFOWebsite: www.cdc.gov/oralhealth
This publication can be downloaded at www.cdc.gov/oralhealth/publications/OHSR-2019-index.html.
AcknowledgmentsThis document was written by the following people:Mei Lin, MD, MPH, MS1
Susan O. Griffin, PhD1
Barbara F. Gooch, DMD, MPH2
Lorena Espinoza, DDS, MPH1
Liang Wei, MS2
Chien-Hsun Li, MS3
Gina Thornton-Evans, DDS, MPH1
Michele Junger, DDS, MPH1
Valerie A. Robison, DDS, MPH, PhD1
Eleanor B. Fleming, PhD, DDS, MPH4
Eugenio Beltrán, DMD, MPH, MS, DrPH2
The following people reviewed and commented on this report: Cassandra Stewart, DDS, MPH1
Nicole Johnson, MPH1
Casey Hannan, MPH1
Cassie Brailer1
1 Division of Oral Health, National Center for Chronic Disease Prevention and Health Promotion, CDC2 DB Consulting Group3 Northrop Grumman Corporation4 Division of Health and Nutrition Examination Survey, National Center for Health Statistics, CDC
Suggested CitationCenters for Disease Control and Prevention. Oral Health Surveillance Report: Trends in Dental Caries and Sealants, Tooth Retention, and Edentulism, United States, 1999–2004 to 2011–2016. Atlanta, GA: Centers for Disease Control and Prevention, US Dept of Health and Human Services; 2019.

OR AL HEALTH SURVEILLANCE REPORT
Trends in Dental Caries and Sealants, Tooth Retention, and Edentulism,
United States, 1999–2004 to 2011–2016
US Department of Health and Human ServicesCenters for Disease Control and Prevention
National Center for Chronic Disease Prevention and Health Promotion Division of Oral Health

PAGE II

PAGE III
CONTENTS
List of Tables ..............................................................................................................................................................................................V
Introduction ...............................................................................................................................................................................................1
Methods .......................................................................................................................................................................................................2Data Sources, Study Population, and Sample Size ..........................................................................................................2Oral Health Assessment ...................................................................................................................................................................2
Selected Findings ...................................................................................................................................................................................4Dental Caries in Primary Teeth ....................................................................................................................................................4
Children Aged 2–5 Years ..............................................................................................................................................................4Children Aged 6–8 Years ..............................................................................................................................................................4
Dental Caries in Permanent Teeth of Children and Adolescents ............................................................................5Children Aged 6–11 Years ...........................................................................................................................................................5Adolescents Aged 12–19 Years ................................................................................................................................................5
Dental Sealants ......................................................................................................................................................................................6Children Aged 6–11 Years ...........................................................................................................................................................6Adolescents Aged 12–19 Years ................................................................................................................................................6
Dental Caries Among Adults and Older Adults .................................................................................................................7Adults Aged 20–64 Years .............................................................................................................................................................7Older Adults Aged 65 Years or Older ....................................................................................................................................8
Edentulism and Tooth Retention ................................................................................................................................................9Adults Aged 20–64 Years .............................................................................................................................................................9Older Adults Aged 65 Years or Older ....................................................................................................................................9
Summary................................................................................................................................................................................................... 10Dental Caries in Primary Teeth .................................................................................................................................................. 10
Children Aged 2–5 Years ........................................................................................................................................................... 10Children Aged 6–8 Years .......................................................................................................................................................... 10

PAGE IV
Dental Caries in Permanent Teeth of Children and Adolescents ......................................................................... 10Children Aged 6–11 Years ........................................................................................................................................................ 10Adolescents Aged 12–19 Years ............................................................................................................................................. 11
Dental Sealants ................................................................................................................................................................................... 11Children Aged 6–11 Years ........................................................................................................................................................ 11Adolescents Aged 12–19 Years ............................................................................................................................................. 11
Dental Caries Among Adults and Older Adults .............................................................................................................. 11Adults Aged 20–64 Years .......................................................................................................................................................... 11Older Adults Aged 65 Years or Older ................................................................................................................................. 11
Edentulism and Tooth Retention ........................................................................................................................................... 12Adults Aged 20–64 Years .......................................................................................................................................................... 12Older Adults Aged 65 Years or Older ................................................................................................................................. 12
Conclusion and Comment .............................................................................................................................................................. 13
References................................................................................................................................................................................................ 14
Tables 1–36 ............................................................................................................................................................................................... 17

PAGE V
LIST OF TABLESDental Caries in Primary Teeth of Children Aged 2–5 YearsTable 1. Prevalence of dental caries in primary teeth (dft ≥1) among children aged 2–5 years, by selected characteristics, United States, National Health and Nutrition Examination Survey, 1999–2004 and 2011–2016
Table 2. Prevalence of untreated tooth decay in primary teeth (dt ≥1) among children aged 2–5 years, by selected characteristics, United States, National Health and Nutrition Examination Survey, 1999–2004 and 2011–2016
Table 3. Mean number of untreated decayed (dt), filled (ft), and untreated decayed or filled (dft) primary teeth among children aged 2–5 years with at least one dft, by selected characteristics, United States, National Health and Nutrition Examination Survey, 1999–2004 and 2011–2016
Table 4. Mean percentage contribution of untreated decayed (% dt/dft) or filled (% ft/dft) primary teeth among children aged 2–5 years with at least one untreated decayed or filled primary tooth (dft ≥1), by selected characteristics, United States, National Health and Nutrition Examination Survey, 1999–2004 and 2011–2016
Dental Caries in Primary Teeth of Children Aged 6–8 Years Table 5. Prevalence of dental caries in primary teeth (dft ≥1) among children aged 6–8 years, by selected characteristics, United States, National Health and Nutrition Examination Survey, 1999–2004 and 2011–2016
Table 6. Prevalence of untreated tooth decay in primary teeth (dt ≥1) among children aged 6–8 years, by selected characteristics, United States, National Health and Nutrition Examination Survey, 1999–2004 and 2011–2016
Table 7. Mean number of untreated decayed (dt), filled (ft), and untreated decayed or filled (dft) primary teeth among children aged 6–8 years with at least one dft, by selected characteristics, United States, National Health and Nutrition Examination Survey, 1999–2004 and 2011–2016
Table 8. Mean percentage contribution of untreated decayed (% dt/dft) or filled (% ft/dft) primary teeth among children aged 6–8 years with at least one untreated decayed or filled primary tooth (dft ≥1), by selected characteristics, United States, National Health and Nutrition Examination Survey, 1999–2004 and 2011–2016
Dental Caries in Permanent Teeth of Children Aged 6–11 YearsTable 9. Prevalence of dental caries in permanent teeth (DMFT ≥1) among children aged 6–11 years, by selected characteristics, United States, National Health and Nutrition Examination Survey, 1999–2004 and 2011–2016
Table 10. Prevalence of untreated tooth decay in permanent teeth (DT ≥1) among children aged 6–11 years, by selected characteristics, United States, National Health and Nutrition Examination Survey, 1999–2004 and 2011–2016
Table 11. Mean number of untreated decayed (DT), missing (MT), filled (FT), and untreated decayed, missing, or filled (DMFT) permanent teeth among children aged 6–11 years with at least one DMFT, by selected characteristics, United States, National Health and Nutrition Examination Survey, 1999–2004 and 2011–2016
Table 12. Mean percentage contribution of untreated decayed (% DT/DMFT) or filled (% FT/DMFT) permanent teeth among children aged 6–11 years with at least one untreated decayed, missing, or filled permanent tooth (DMFT ≥1), by selected characteristics, United States, National Health and Nutrition Examination Survey, 1999–2004 and 2011–2016
Table 13. Mean number of untreated decayed, missing, or filled (DMFT) permanent teeth by tooth type among children aged 6–11 years with at least one DMFT, by selected characteristics, United States, National Health and Nutrition Examination Survey, 1999–2004 and 2011–2016

PAGE VI
Dental Caries in Permanent Teeth of Adolescents Aged 12–19 YearsTable 14. Prevalence of dental caries in permanent teeth (DMFT ≥1) among adolescents aged 12–19 years, by selected characteristics, United States, National Health and Nutrition Examination Survey, 1999–2004 and 2011–2016
Table 15. Prevalence of untreated tooth decay in permanent teeth (DT ≥1) among adolescents aged 12–19 years, by selected characteristics, United States, National Health and Nutrition Examination Survey, 1999–2004 and 2011–2016
Table 16. Mean number of untreated decayed (DT), missing (MT), filled (FT), and untreated decayed, missing, or filled (DMFT) permanent teeth among adolescents aged 12–19 years with at least one DMFT, by selected characteristics, United States, National Health and Nutrition Examination Survey, 1999–2004 and 2011–2016
Table 17. Mean percentage contribution of untreated decayed (% DT/DMFT) or filled (% FT/DMFT) permanent teeth among adolescents aged 12–19 years with at least one untreated decayed, missing, or filled permanent tooth (DMFT ≥1), by selected characteristics, United States, National Health and Nutrition Examination Survey, 1999–2004 and 2011–2016
Table 18. Mean number of untreated decayed, missing, or filled permanent teeth (DMFT) by tooth type among adolescents aged 12–19 years with at least one DMFT, by selected characteristics, United States, National Health and Nutrition Examination Survey, 1999–2004 and 2011–2016
Dental Sealants Among Children Aged 6–11 YearsTable 19. Prevalence of dental sealants on permanent teeth among children aged 6–11 years, by selected characteristics, United States, National Health and Nutrition Examination Survey, 1999–2004 and 2011–2016
Table 20. Mean number of permanent teeth with dental sealants among children aged 6–11 years with at least one sealed tooth, by selected characteristics, United States, National Health and Nutrition Examination Survey, 1999–2004 and 2011–2016
Table 21. Mean number of permanent teeth sealed by tooth type among children aged 6–11 years with at least one sealed tooth, by selected characteristics, United States, National Health and Nutrition Examination Survey, 1999–2004 and 2011–2016
Dental Sealants Among Adolescents Aged 12–19 YearsTable 22. Prevalence of dental sealants on permanent teeth among adolescents aged 12–19 years, by selected characteristics, United States, National Health and Nutrition Examination Survey, 1999–2004 and 2011–2016
Table 23. Mean number of permanent teeth with dental sealants among adolescents aged 12–19 years with at least one sealed tooth, by selected characteristics, United States, National Health and Nutrition Examination Survey, 1999–2004 and 2011–2016
Table 24. Mean number of permanent teeth sealed by tooth type among adolescents aged 12–19 years with at least one sealed tooth, by selected characteristics, United States, National Health and Nutrition Examination Survey, 1999–2004 and 2011–2016
Dental Caries Among Adults Aged 20–64 YearsTable 25. Prevalence of dental caries in permanent teeth (DFT ≥1) among dentate adults aged 20–64 years, by selected characteristics, United States, National Health and Nutrition Examination Survey, 1999–2004 and 2011–2016
Table 26. Prevalence of untreated tooth decay in permanent teeth (DT ≥1) among dentate adults aged 20–64 years, by selected characteristics, United States, National Health and Nutrition Examination Survey, 1999–2004 and 2011–2016

PAGE VII
Table 27. Mean number of untreated decayed (DT), missing (MT), filled (FT), untreated decayed or filled (DFT), and untreated decayed, missing, or filled (DMFT) permanent teeth among dentate adults aged 20–64 years with at least one DMFT, by selected characteristics, United States, National Health and Nutrition Examination Survey, 1999–2004 and 2011–2016
Table 28. Mean percentage contribution of untreated decayed (% DT/DFT) or filled (% FT/DFT) permanent teeth among dentate adults aged 20–64 years with at least one untreated decayed or filled permanent tooth (DFT ≥1), by selected characteristics, United States, National Health and Nutrition Examination Survey, 1999–2004 and 2011–2016
Dental Caries Among Older Adults Aged 65 Years or OlderTable 29. Prevalence of dental caries in permanent teeth (DFT ≥1) among dentate adults aged 65 years or older, by selected characteristics, United States, National Health and Nutrition Examination Survey, 1999–2004 and 2011–2016
Table 30. Prevalence of untreated tooth decay in permanent teeth (DT ≥1) among dentate adults aged 65 years or older, by selected characteristics, United States, National Health and Nutrition Examination Survey, 1999–2004 and 2011–2016
Table 31. Mean number of untreated decayed (DT), missing (MT), filled (FT), untreated decayed or filled (DFT), and untreated decayed, missing, or filled (DMFT) permanent teeth among dentate adults aged 65 years or older, by selected characteristics, United States, National Health and Nutrition Examination Survey, 1999–2004 and 2011–2016
Table 32. Mean percentage contribution of untreated decayed (% DT/DFT) or filled (% FT/DFT) permanent teeth among dentate adults aged 65 years or older with at least one untreated decayed or filled permanent tooth (DFT ≥1), by selected characteristics, United States, National Health and Nutrition Examination Survey, 1999–2004 and 2011–2016
Edentulism and Tooth Retention Among Adults Aged 20–64 YearsTable 33. Percentage of adults aged 20–64 years who have lost all their natural teeth, by selected characteristics, United States, National Health and Nutrition Examination Survey, 1999–2004 and 2011–2016
Table 34. Mean number of permanent teeth among dentate adults aged 20–64 years, by selected characteristics, United States, National Health and Nutrition Examination Survey, 1999–2004 and 2011–2016
Edentulism and Tooth Retention Among Older Adults Aged 65 Years or OlderTable 35. Percentage of adults 65 years or older who have lost all their natural teeth, by selected characteristics, United States, National Health and Nutrition Examination Survey, 1999–2004 and 2011–2016
Table 36. Mean number of permanent teeth among dentate adults 65 years or older, by selected characteristics, United States, National Health and Nutrition Examination Survey, 1999–2004 and 2011–2016

PAGE VIII

PAGE 1
IntroductionDental caries, or tooth decay, is a common chronic disease that can cause pain, suffering, and diminished quality of life throughout one’s lifespan.1 Left untreated, tooth decay can progress and lead to infection, tooth loss, and more complex and expensive treatments. Untreated tooth decay can affect essential aspects of daily living, including eating, speaking, and performing at home, school, or work.1 Children with poor oral health miss more school and receive lower grades than those with better oral health, while adults lose more school or work hours for urgent, unplanned dental visits.2–4
Untreated tooth decay can affect essential aspects of daily living, including eating, speaking, and performing at home, school, or work.
The National Health and Nutrition Examination Survey (NHANES) provides information to monitor the overall prevalence and severity of oral diseases,5–12 the extent of health disparities,13–15 and the prevalence of preventive interventions, such as dental sealants. Dental sealants are professionally applied coatings that prevent decay in the chewing surfaces of the molar teeth.16 NHANES data are used by health agencies and organizations, health care providers, and researchers to guide the development of public health policy, direct public health practice, and expand health knowledge in the United States.17
Compared with NHANES 1988–1994, findings from NHANES 1999–2004 showed that the percentage of children aged 6–11 years and adolescents aged 12–19 years with dental caries in their permanent teeth had decreased to about 20% and 60%, respectively, whereas the percentage with untreated decay remained unchanged at about 8% and 20%.6,10 These findings suggest a decrease in receipt of fillings (i.e., restorations).Among young children aged 2–5 years, the prevalence of caries in primary teeth increased 4 percentage points to 28%, with no change in untreated decay.10,18 This finding suggests an increase in restorations. The prevalence of dental sealants in permanent teeth increased by almost 10 percentage points to 30% among children aged 6–11 years and by 20
percentage points to almost 40% among adolescents aged 12–19 years. Adults and older adults were keeping more of their teeth, and the percentage who had lost all their teeth had declined.10,19 These findings highlight overall improvements in oral health across the US population and across the life span by 1999–2004. However, disparities continued by poverty status, education, and race or ethnicity.10
This surveillance report provides national estimates for selected measures for oral health status during 2011–2016, examines changes since 1999–2004, and highlights disparities in oral health by certain sociodemographic characteristics. Measures include the prevalence and severity of dental caries in primary and permanent teeth (for those aged 2 years or older), the prevalence of dental sealants on permanent teeth in children and adolescents (aged 6–19 years), and tooth retention and edentulism (total tooth loss) among adults (aged 20–64 years) and older adults (aged 65 years or older). This report, which provides estimates from 2011 to 2016, builds on findings of earlier data briefs or studies that also examined oral health status and disparities among specific populations in the United States.7,9,11,20,21
A smiling multigenerational family.

PAGE 2
People holding signs of various examples of treatments for teeth.
MethodsData Sources, Study Population, and Sample SizeNHANES is a cross-sectional survey designed to monitor the health and nutritional status of the resident, civilian, noninstitutionalized US population.22 It is administered by CDC’s National Center for Health Statistics. Survey participants are selected by using a complex, multistage probability design, which includes oversampling of selected population subgroups to improve reliability of the estimates. NHANES collected the data during standardized oral health examinations of participants in mobile examination centers and by interviews in participants’ homes. Additional details of the surveys are available on the NHANES website.
This report used NHANES data for two 6-year periods: 1999–2004 (combining 2-year cycles 1999–2000, 2001–2002, and 2003–2004) and 2011–2016 (combining 2-year cycles 2011–2012, 2013–2014, and 2015–2016). Although NHANES data are released in 2-year cycles, this report used 6 years of data to be consistent with data reporting in the last oral health surveillance report, which used 6 years of data to compare changes in oral health status between NHANES 1988–1994 and 1999–2004.10 In addition, because we reported findings for individual age groups stratified by sociodemographic characteristics, we combined cycles as recommended by NHANES guidelines to improve the statistical reliability of our estimates.23
Our study population included participants aged 2 years or older who completed an oral health assessment. During 2011–2016, among 27,925 participants interviewed, 26,799 were selected for an oral health examination (96%), and of these, 25,566 (95.4%) completed the examination. Hispanics, non-Hispanic blacks, and Asians were oversampled. During 1999–2004, among 28,661
participants interviewed, 27,032 were selected for an oral health examination (94.3%), and of these, 25,364 (93.8%) completed the examination. Adolescents aged 12–19 years, adults 60 years or older, non-Hispanic blacks, and Mexican Americans were oversampled.22
Oral Health AssessmentOral health assessments in both survey periods used the same protocols, allowing comparisons of estimates for outcomes, including dental caries, dental sealants, tooth retention, and edentulism. Visual oral health assessments were conducted by previously trained dentists in a mobile examination center, and these dentists were monitored during NHANES data collection to ensure consistent assessment standards. The examinations were used to detect the presence or absence of permanent or primary teeth. In this report, all dental measures of permanent teeth are based on 28 teeth, excluding 3rd molars. Each tooth was assessed for caries and restorations. Caries assessment was based on Radike’s criteria with minor modifications.24,25 Specific surfaces of primary and permanent molars, premolars, and upper permanent lateral incisors were assessed for dental sealants. A sealant was considered present if any portion of the surface was covered by sealant. Further descriptions of the clinical procedures for assessing dental caries and dental sealants are described elsewhere.6,10,17,24
Case definitions for dental caries were based on those proposed by Klein and colleagues.26 This report examines coronal caries, which is decay located on part of the crown of the tooth above the gum line. Assessment of root caries was not included because data were unavailable during 2011–2014 cycles. Prevalence of dental caries was defined as the percentage of the population having at least one tooth with untreated decay

PAGE 3
(d/D) or a restoration or filling (f/F). (Note: In the abbreviations used for categories of teeth affected by caries in this report, lowercase letters denote primary teeth, while uppercase letters denote permanent teeth.) Prevalence of untreated tooth decay was defined as the percentage of the population with at least one tooth with untreated, cavitated carious lesions. Among children and adolescents aged 6–19 years, prevalence of caries in permanent teeth also included permanent teeth missing (M) from disease (i.e., caries).
In this report, caries severity is measured as the mean number of teeth affected by caries among children, adolescents, or adults younger than 65 years with caries. Caries severity is reported for all older adults aged 65 years or older because more than 95% of older adults have caries.7 Previous reports have measured caries severity as the mean number of affected teeth or surfaces for all children or adults.6,10 In this report, caries severity also is described by permanent tooth type (i.e., anterior teeth [incisors and canines], premolars, and first and second molars) for children and adolescents aged 6–19 years.
For sealants, overall prevalence of having one or more sealants on permanent teeth (including permanent molars, premolars, or upper lateral incisors) was reported for children and adolescents. The mean number of sealants—overall and on molars and premolars specifically—was reported only for those with one or more sealants.
Age categories for the study population were 2–5 and 6–8 years for primary teeth in children; 6–11 and 12–19 years for permanent teeth in children and adolescents; 20–34, 35–49, and 50–64 years for adults; and 65–74 years and 75 years or older for older adults. We adjusted all age-specific estimates to the US 2000 standard population to control for potential differences in age distribution.27 Data for children and adolescents were adjusted by using single years of age. Data for adults were adjusted by using 5-year age groups, with the maximum age group set to age 80 years or older.
We used the same selected sociodemographic characteristics used in previous surveillance summary reports.6,10 Educational attainment was classified as less than high school, high school graduate or equivalent, and more than high school. Poverty status was reported as living in a household with income below 100% of the federal poverty level, 100% or higher but below 200% of the federal poverty level, or 200% or higher of the federal poverty level and categorized as poor, near-poor, or not-poor. Findings are also presented for poor and near-poor children combined (less than 200% of the federal poverty level) to more closely align with federal thresholds used to determine eligibility for public health insurance and free and reduced price meal programs within schools.28,29 Similar income
categorizations, such as 185% of the federal poverty level or less, have been used elsewhere to define low- and higher-income children for analyses of untreated tooth decay and sealant use among school-aged children in the United States.16
Information on self-reported race or ethnicity was stratified into three categories to be comparable between 1999–2004 and 2011–2016: non-Hispanic white, non-Hispanic black, and Mexican American. Although NHANES 2011–2016 oversampled the entire Hispanic population, NHANES 1999–2004 only oversampled Mexican Americans.22 Cigarette smoking status was classified into three categories: current smoker, former smoker, and never smoked. Current smokers were defined as respondents who reported having smoked at least 100 cigarettes during their lifetime and currently smoking cigarettes every day or some days. Former smokers were defined as respondents who reported having smoked at least 100 cigarettes during their lifetime but not currently smoking. Never smokers were defined as respondents who reported having smoked fewer than 100 cigarettes during their lifetime.
When comparing outcomes among different categories within the same sociodemographic characteristic, we used reference categories used in previous surveillance reports. The reference category for educational attainment was more than high school; for income, 200% of the federal poverty level or higher; for race or ethnicity, non-Hispanic white; and for smoking status, never smoked.
All statistical analyses were performed with SUDAAN software Version 11.0.0 (RTI International, Research Triangle Park, North Carolina) and SAS software Version 9.3 (SAS Institute Inc., Cary, North Carolina). Age-adjusted oral health outcomes, standard errors, and differences in oral health outcomes between 1999–2004 and 2011–2016 are presented overall and stratified by sociodemographic characteristics. Because of rounding, the differences between the two periods presented may be slightly different from what would have been obtained if we had subtracted the 2011–2016 estimates from the 1999–2004 estimates.
All reported differences are statistically significant at P < 0.05 (2-sided t-test) unless otherwise noted. When a range of differences for a specific outcome was reported in the current analysis, we only presented differences that were significantly different at P < 0.05. For the 2011–2016 data, t-tests were also performed to detect significant differences (P < 0.05) in oral health outcomes between categories within each sociodemographic characteristic. Estimates with relative standard error higher than 30% were considered unreliable and not displayed in the tables.30

PAGE 4
Selected FindingsDental Caries in Primary Teeth
The prevalence of untreated tooth decay in primary teeth was 10% among children aged 2–5 years and 16% among those 6–8 years, reflecting a 10 percentage point decrease in both groups since 1999–2004. Notable decreases occurred among Mexican American, near-poor, and poor children.
Children Aged 2–5 YearsPrevalence of caries among children aged 2–5 years decreased from 28% during 1999–2004 to 23% during 2011–2016 (Table 1). Since 1999–2004, prevalence decreased by 8 percentage points to 33% among Mexican American and poor children, by 7 percentage points to 30% among poor and near-poor combined children, and by 6 percentage points to 24% and 18% among male and non-Hispanic white children, respectively.
The prevalence of untreated tooth decay was 10%, which was about a 10 percentage point decrease since 1999–2004 (21%) (Table 2). Prevalence decreased across all sociodemographic groups. Declines ranged from 7 percentage points among not-poor children (13% vs. 6%) to more than 14 percentage points among Mexican American (31% vs. 15%) and poor (31% vs. 17%) children. During 2011–2016, prevalence of caries and untreated decay was about 1–2 times higher among Mexican American, non-Hispanic black, and poor and near-poor combined children compared to non-Hispanic white and not-poor children (Tables 1 and 2).
Among children with caries, the mean number of affected teeth was 4.3, which represented no detectable change since 1999–2004 (Table 3). However, the mean of untreated decayed primary teeth (dt) decreased overall, from 2.6 to 1.6 teeth, across all sociodemographic characteristics except among not-poor and non-Hispanic black children. Declines in dt ranged from 0.8 teeth for males to 1.5 teeth for poor and near-poor combined children. Mean filled primary teeth (ft) increased overall, from 1.4 to 2.8 teeth, across all sociodemographic characteristics.
Specifically, the number of filled primary teeth increased by 1.9 teeth for Mexican American children, 1.8 for female children, and 1.7 for not-poor children. An overall 27 percentage point decrease was found in the mean percentage of primary teeth with caries (dft ≥1) that were untreated (% dt/dft) and a corresponding increase in the mean percentage that were restored (% ft/dft) compared to 1999–2004 (Table 4). Decreases in mean % dt/dft and increases in mean % ft/dft occurred across all sociodemographic groups.
Kids texting on their smart phones.
Children Aged 6–8 YearsThe prevalence of caries among children aged 6–8 years was 52%, with no changes detected overall or across sociodemographic groups since 1999–2004 (Table 5). The prevalence of untreated tooth decay was 16% (Table 6), which was a reduction of 11 percentage points since 1999–2004. Prevalence was lower across all sociodemographic groups, with reductions ranging from 6 percentage points for not-poor children (18% vs. 11%) to 18 percentage points for Mexican American children (38% vs. 20%).
During 2011–2016, prevalence of caries and untreated decay was higher among Mexican American (caries: 73%, untreated decay: 20%), non-Hispanic black (54%, 22%), and poor and near-poor combined (62%, 22%) children compared with non-Hispanic white (44%, 13%) and not-poor (40%, 11%) children (Tables 5 and 6).

PAGE 5
Among children with caries, the mean dft was 4.4, which represents little change since 1999–2004 (4.3 teeth) (Table 7). However, mean dt decreased overall, from 1.5 to 0.8 teeth, with decreases found across all sociodemographic characteristics. The largest decline was 1.0 tooth for non-Hispanic black, Mexican American, and poor children. Mean ft increased from 2.7 to 3.6 teeth overall, with increases across all sociodemographic groups. The largest increase was 1.5 teeth for Mexican American children. Consistent with these findings, an overall 18 percentage point decrease was found in the mean percentage of teeth with caries (dft ≥1) that were untreated (22%), with a corresponding increase in the mean percentage restored (78%) (Table 8). Decreases in mean % dt/dft and increases in mean % ft/dft occurred across all sociodemographic groups.
Dental Caries in Permanent Teeth of Children and Adolescents
The prevalence of untreated tooth decay in permanent teeth decreased by 3 percentage points, to 5% among children aged 6–11 years and 17% among adolescents aged 12–19 years since 1999–2004.
Children Aged 6–11 YearsPrevalence of caries among children aged 6–11 years decreased from 21% during 1999–2004 to 17% during 2011–2016 (Table 9). Decreases occurred across all sociodemographic groups, except for younger children (aged 6–8 years), non-Hispanic black children, and poor and near-poor combined children. Decreases of more than 5 percentage points were found among older children aged 9–11 years, non-Hispanic white, and Mexican American children. During 2011–2016, prevalence was higher among Mexican American and non-Hispanic black children than among non-Hispanic white children and among poor and near-poor combined than not-poor children.
The prevalence of untreated tooth decay decreased from 8% during 1999–2004 to 5% during 2011–2016 (Table 10). Prevalence declined by more than 4 percentage points among Mexican American children (13% vs. 8%), near-poor children
(12% vs. 6%), and poor and near-poor combined children (12% vs. 7%). During 2011–2016, Mexican American (8%), non-Hispanic black (7%), and poor children (8%) had higher prevalence of untreated tooth decay than non-Hispanic white (4%) and not-poor (4%) children.
Mean decayed, missing, or filled permanent teeth (DMFT) among children with any caries was 2.1 (Table 11). Compared to 1999–2004, this measure was higher by 0.2 teeth overall, by 0.3 teeth among non-Hispanic white children, and by 0.4 teeth among children aged 9–11 years.
Since 1999–2004, no changes were detected in mean untreated decayed permanent teeth (DT), while mean filled permanent teeth (FT) increased by 0.2 teeth overall and by 0.3–0.4 teeth among children who were aged 9–11 years, male, Mexican American, and near-poor (Table 11). Mexican American and near-poor children had the largest increase in filled permanent teeth (0.4 teeth). Among near-poor children, a decrease of more than 20 percentage points was found in the mean percentage of permanent teeth with caries that were untreated (% DT/DMFT), and a corresponding increase was found in the mean percentage of teeth that were filled (% FT/DMFT) (Table 12).
Overall, among children with caries, 2 of 4 first permanent molars were affected by caries (Table 13). The mean number of first molars affected was higher among older children aged 9–11 years than among younger children aged 6–8 years.
Adolescents Aged 12–19 YearsPrevalence of caries among adolescents aged 12–19 years was 57%, with no detectable change since 1999–2004 (59%) (Table 14). Prevalence declined by 6 percentage points among female and not-poor adolescents. During 2011–2016, prevalence was higher among Mexican American (69%) and poor and near-poor combined (65%) adolescents than among non-Hispanic white (54%) and not-poor (49%) adolescents.
The prevalence of untreated tooth decay overall decreased from 20% during 1999–2004 to 17% during 2011–2016 (Table 15). The largest decline was 8 percentage points among Mexican American adolescents, followed by 6 percentage points among near-poor children, and 5 percentage points among non-Hispanic black children. During 2011–2016, prevalence of untreated decay was higher among non-Hispanic black (20%) and Mexican American (21%) adolescents than among non-Hispanic white (16%) adolescents. It was twice as high among poor and near-poor combined (22%) adolescents than among not-poor adolescents (11%).

PAGE 6
combined children, from 22% during 1999–2004 to 39% during 2011–2016. During 2011–2016, prevalence was higher among older children aged 9–11 years (51%) compared to younger children aged 6–8 years (32%), non-Hispanic white children (44%) compared to non-Hispanic black children (32%), and not-poor children (45%) compared to poor children (38%).
On average, children aged 6–11 years with at least one sealed tooth had 3.6 teeth sealed—an increase of 0.2 teeth sealed since 1999–2004 (Table 20). The mean number of sealed teeth increased by 0.5 teeth among Mexican American and poor children and by 0.4 teeth among older and non-Hispanic black children. During 2011–2016, older children aged 9–11 years had more teeth sealed than younger children aged 6–8 years.
First permanent molars were the most likely teeth to be sealed. The mean number of sealed teeth was 3.3 for first permanent molars, 0.3 for premolars, and 0.5 for second molars (Table 21). Since 1999–2004, the mean number of first molars sealed increased by 0.4 teeth among poor children and by 0.3 teeth among Mexican American children. The mean number of first and second molars sealed increased by 0.2 and 0.5, respectively, among older children aged 9–11 years.
Adolescents Aged 12–19 YearsSealant prevalence among adolescents aged 12–19 years increased from 38% during 1999–2004 to 48% during 2011–2016 (Table 22). Increases were observed across all sociodemographic characteristics except not-poor adolescents. Increases ranged from 9 percentage points among non-Hispanic white adolescents (44% vs. 53%) to 18 percentage points among Mexican American (27% vs. 45%) and near-poor (31% vs. 48%) adolescents. During 2011–2016, prevalence was
A girl receiving a dental sealant.
Children Aged 6–11 YearsThe prevalence of sealants increased overall, from 31% during 1999–2004 to 42% during 2011–2016. Increases occurred across all sociodemographic characteristics, except for not-poor children (Table 19). Increases ranged from 7 percentage points among non-Hispanic white children to 20 percentage points among Mexican American children. Sealant prevalence increased by 17 percentage points among poor and near-poor
Nearly half of children aged 6–11 years (42%) and adolescents aged 12–19 years (48%) had dental sealants on permanent teeth, reflecting more than a 10 percentage point increase since 1999–2004. The largest increases—17 percentage points or more—were found among those who were Mexican American, near-poor, and poor.
Dental Sealants
The mean DMFT, DT, and FT among adolescents with caries was 4.3, 0.7, and 3.4 teeth overall, respectively, with no detectable changes compared to 1999–2004 (Table 16). However, increases in mean DMFT were found among non-Hispanic black (0.6 teeth) and poor (0.5 teeth) adolescents. Similarly, increases in mean FT were found among non-Hispanic black (0.7 teeth), Mexican American (0.5 teeth), and near-poor (0.5 teeth) adolescents. No changes in mean DT were detected among any sociodemographic group. Poor and near-poor combined adolescents had higher DMFT and DT than not-poor adolescents. The mean percentage of teeth with caries that were untreated (% DT/DMFT) decreased by 10 percentage points for Mexican American, 9 percentage points for non-Hispanic black, and 7 percentage points for poor adolescents, with corresponding increases in the mean percentage of teeth restored (% FT/DMFT) (Table 17).
Among adolescents with caries, the mean number of affected first molars was 2.2. It was 1.2 for second molars, 0.6 for premolars, and 0.2 for anterior teeth, with no detectable changes since 1999–2004 (Table 18). During 2011–2016, older adolescents aged 16–19 years had almost 2 second molars affected by caries compared to 1 second molar among those aged 12–15 years.

PAGE 7
Adults Aged 20–64 YearsThe prevalence of dental caries among adults aged 20–64 years was 90%, which is a slight decrease from 92% during 1999–2004 (Table 25). Decreases of 2 to 4 percentage points were observed among adults who were younger (aged 20–34 and 35–49 years), male, non-Hispanic white, not-poor, and better educated and who had never or formerly smoked.
Overall, the prevalence of untreated tooth decay was 26% (Table 26). No changes were detected overall or across sociodemographic characteristics since 1999–2004, with the exception of current or former smokers and adults with a high school education, all of whom experienced a 5 percentage point increase. During 2011–2016, the prevalence of untreated decay was almost 40% to 50% among adults who were non-Hispanic black, Mexican American, or poor and near-poor combined; who had a high school education or lower; and who were current smokers. Prevalence among these groups was about twice that of adults who were non-Hispanic white or not-poor, who had more than a high school education, and who had never smoked. Prevalence of untreated decay was higher among younger adults aged 20–34 years (29%) than among adults aged 35–49 years (26%) or 50–64 years (22%).
Among adults with caries, mean DFT was 7.4, lower than the estimate of 8.2 during 1999–2004 (Table 27). Mean DFT and FT both decreased by about 1 tooth overall and among adults who were aged 35–49 or 50–64 years, male, female, non-Hispanic white, or not-poor; who had a high school education or more; and who were current, former, or never smokers. No changes were detected in mean DT overall or across sociodemographic characteristics, except for slight increases among adults who had a high school education or more and were former smokers.
Similar to 1999–2004, about 1 in 4 adults aged 20–64 years and 1 in 6 older adults aged 65 years or older had untreated tooth decay in 2011–2016.
Dental Caries Among Adults and Older Adults
A group of friends in a huddle.
higher among younger adolescents aged 12–15 years (52%) than older adolescents aged 16–19 years (45%), non-Hispanic white children (53%) than non-Hispanic black (37%) and Mexican American (45%) children, and not-poor (51%) than poor (43%) children.
On average, among adolescents with sealants, the mean number of sealed teeth increased from 5 teeth during 1999–2004 to 6 teeth during 2011–2016 (Table 23). Increases ranged from 0.8 among female and not-poor adolescents to 1.7 teeth among non-Hispanic black adolescents. During 2011–2016, no differences were detected by sociodemographic characteristics.
First permanent molars were most likely to be sealed, with almost 3 teeth sealed on average, followed by second permanent molars with 2 teeth sealed on average, and premolars with 1 tooth sealed on average (Table 24). Overall, since 1999–2004, the mean number of first and second molars and premolars sealed increased by 0.2, 0.5, and 0.3 teeth, respectively. Increases in the mean number of sealed first molars were observed among all sociodemographic groups except poor and near-poor children. The largest increase was 0.5 first molars among non-Hispanic black children. Increases in the mean number of sealed second permanent molars were observed among all sociodemographic groups, with larger increases among non-Hispanic black adolescents (1 tooth), poor adolescents (0.7 teeth), and Mexican American and male (0.6 teeth each) adolescents.

PAGE 8
Overall, no change was detected in the mean percentage of caries that were untreated (% DT/DFT), which was 16% during 2011–2016 (Table 28). However, increases in mean % DT/DFT of 3 to 5 percentage points were seen among current and former smokers and those with a high school education or more.
During 2011–2016, adults who were younger (aged 20–34 years), male, non-Hispanic black, Mexican American, or poor and near-poor combined; who had a high school education or less; and who were current smokers had higher DT (1.1–1.8) and lower FT (4.5–6.0) than their respective reference groups within each sociodemographic characteristic, with DT ranging from 0.6 to 0.9 and FT ranging from 6.6 to 8.3 (Table 27).
Similar comparisons showed that, for these same groups, the mean percentage of teeth with caries that were untreated (% DT/DFT) was higher than their respective reference groups, whereas the mean percentage that were filled (% FT/DFT) was lower (Table 28). The mean % DT/DFT of about 24% to 34% among adults who were non-Hispanic black, Mexican American, or poor and near-poor combined; who had a high school education or less; and who were current smokers was 2 to 3 times that of their respective reference groups within each sociodemographic characteristic.
Older Adults Aged 65 Years or OlderThe prevalence of dental caries among adults aged 65 years or older was 96%, showing an overall increase of 3 percentage points since 1999–2004 (Table 29). For most sociodemographic groups, increases in caries prevalence ranged from 3 to 5 percentage points. No group experienced a statistically significant decrease. During 2011–2016, prevalence among older adults who were non-Hispanic white or not-poor, who had more than a high school education, and who were former smokers or never smoked ranged from 96% to 98%, which is higher than estimates of 85% to 95% for their respective counterparts within each sociodemographic characteristic. The estimates of prevalence across all sociodemographic groups were at or above 85%.
The prevalence of untreated tooth decay among adults aged 65 years or older was 16%, with no detectable change during 1999–2004 (Table 30). Except for a decrease of 4 percentage points in not-poor older adults, no differences in prevalence were detected for any other sociodemographic group between the two survey periods. During 2011–2016, however, the prevalence of untreated decay among older adults who were Mexican American, non-Hispanic black, or poor and near-poor combined; who had less than a high school education; and who were current smokers ranged from 29% to 36%, higher than the estimates of 10% to 14% for their respective reference groups within each sociodemographic characteristic.
About 30%–40% of working-age or older adults who were non-Hispanic black, Mexican American, or poor; who had less than a high school education; and who were current smokers had untreated tooth decay. This was about 2 times the prevalence among adults who were non-Hispanic white or not-poor, who had more than a high school education, and who had never smoked.
The mean DFT among adults aged 65 years or older was 10, an increase of 1 tooth during 1999–2004 (Table 31). Increases in DFT between the two survey periods were similar to increases in FT overall and among adults who were aged 65–74 years or 75 years or older, male, non-Hispanic white, non-Hispanic black, not-poor, and former smokers. Small decreases in mean DT were found overall (0.1 teeth) and among those who were aged 75 years or older (0.2), non-Hispanic black (0.4), and not-poor (0.1).
Overall, the mean percentage of teeth with caries that were untreated (% DT/DFT) decreased from 9% during 1999–2004 to 7% during 2011–2016 (Table 32). Decreases of 2 to 3 percentage points in mean % DT/DFT were found among those who were aged 65–74 years, male, female, non-Hispanic white, or not-poor and who had never smoked. Corresponding increases were found in the mean percentage of teeth that were restored (% FT/DFT). Non-Hispanic black older adults had the largest decrease in mean % DT/DFT (11 percentage points) and a corresponding increase in % FT/DFT between the two survey periods.
During 2011–2016, mean DFT and FT were lower and mean DT was higher among older adults who were non-Hispanic black, Mexican American, or poor and near-poor combined; who had less than a high school education; and who were current smokers. Among these groups, mean DFT ranged from 5.1 to 7.5, mean FT from 4.4 to 6.8, and mean DT from 0.7 to 1.0, compared to the reference group within each sociodemographic characteristic, which had mean DFT ranging from 10.4 to 11.5, mean FT ranging from 10.1 to 11.3, and mean DT ranging from 0.2 to 0.3 (Table 31). Similarly, the mean percentage of teeth with caries that were untreated (% DT/DFT) was higher among these groups (16%–29%) compared to their respective reference groups (3%–6%) (Table 32).

PAGE 9
Edentulism and Tooth RetentionAdults Aged 20–64 YearsCompared to 1999–2004, the percentage of adults who were edentulous (i.e., had lost all of their natural teeth) decreased in 2011–2016 (4% vs. 2%) (Table 33). Except for Mexican American adults and current smokers, decreases were observed across all sociodemographic characteristics, with the largest decrease among adults aged 50–64 years (10% vs. 6%). During 2011–2016, edentulism was higher among adults who were poor (6%) or near-poor (4%), had a high school education (3%) or less (5%), and were current smokers (6%), compared to those who were not-poor, had more education, or had never smoked (approximately 1%).
By 2011–2016, the mean number of permanent teeth retained among dentate adults (i.e., those who have at least one permanent tooth present) was 25.5 teeth—an increase of 0.5 teeth from 1999–2004 (Table 34). Increases in the mean number of teeth retained were found across most sociodemographic groups, with the largest increases among those aged 50–64 years (1.1 teeth) and near-poor (0.9 teeth). No group had a decrease in the mean number of teeth. Since 1999–2004, no detectable differences were found in the mean number of teeth retained among adults aged 20–34 years; those who were Mexican American, poor, or current smokers; or those who had a high school education.
During 2011–2016, the mean number of teeth retained across all sociodemographic characteristics ranged from 23 to 27 teeth. Adults in the following groups retained fewer teeth than the respective reference groups in each sociodemographic characteristic: those aged 50–64 years, non-Hispanic blacks, Mexican Americans, or poor and near-poor adults combined, those with a high school education or less, and current or former smokers.
Older Adults Aged 65 Years or OlderSeventeen percent of adults aged 65 or older were edentulous, reflecting a decrease of about 10 percentage points during 1999–2004 (Table 35). Except for non-Hispanic black adults and current smokers, estimates of edentulism decreased from 1999–2004 to 2011–2016 across all sociodemographic characteristics. During 2011–2016, the prevalence of edentulism ranged from 9% among older adults with more than a high school education to 43% among current smokers. Prevalence of edentulism among older adults who were poor (34%), had less than a high school education (35%), and were current smokers (43%) was more than 3 times that of those who were not-poor (11%), had more than a high school education (9%), and had never smoked (12%).
Older man missing a front tooth.
About 1 in 6 older adults (17%) had lost all of their teeth—a decrease of 10 percentage points compared to 1999–2004. Among older adults who were current smokers, 43% had lost all of their teeth, which is more than 3 times the prevalence among those who never smoked (12%).
Dentate older adults had an average of 21 teeth, which is an increase of almost 2 teeth since 1999–2004 (Table 36). No changes were detected in the mean number of teeth among those who were non-Hispanic black, Mexican American, or poor; who had less than a high school education; and who were current smokers. During 2011–2016, the number of teeth retained among older adults across sociodemographic characteristics ranged from 16 to 22 teeth. Adults who were aged 75 years or older (20 teeth), non-Hispanic black (16 teeth), Mexican American (18 teeth), or poor and near-poor combined (18 teeth); who had a high school education (19 teeth) or less (17 teeth); and who were current smokers (16 teeth) retained fewer teeth than their respective reference groups (22 teeth).

PAGE 10
Three elementary school girls smiling.
SummaryDental Caries in Primary Teeth
Children Aged 2–5 YearsOverall, the prevalence of dental caries in the primary teeth of children aged 2–5 years was 23%, reflecting a decrease of 5 percentage points since 1999–2004. Significant declines occurred among Mexican American and poor children, although these groups had the highest caries prevalence (more than 30%). Untreated tooth decay prevalence declined by almost half, to 10%. All sociodemographic groups experienced a decrease. Untreated decay prevalence among poor and near-poor children decreased by more than 13 percentage points, about twice the decrease among not-poor children.
The composition of caries also changed. Among children with caries, the number of untreated decayed teeth declined (2.6 vs. 1.6), and the number of restored teeth increased. As a result, the mean percentage of carious primary teeth that were untreated decreased from over 70% during 1999–2004 to less than 50% during 2011–2016.
Children Aged 6–8 Years Although no change was detected in the prevalence of caries in primary teeth (52% during 2011–2016), untreated decay prevalence declined overall (28% vs. 16%), and decreases occurred across all sociodemographic groups, consistent with findings among younger children. The decline among poor and near-poor children was 2 to 3 times that among
not-poor children. Like younger children, a significant decrease was found in the number of untreated decayed teeth, accompanied by increases in the number of restored teeth. Similarly, the mean percentage of carious primary teeth that were untreated decreased from 40% during 1999–2004 to 22% during 2011–2016.
Dental Caries in Permanent Teeth of Children and Adolescents
Children Aged 6–11 YearsOverall, both prevalence of caries (21% vs. 17%) and untreated decay (8% vs. 5%) decreased. The largest decreases were among older children aged 9–11 years and Mexican American children—groups with the highest prevalence during 1999–2004. Similarly, for prevalence of untreated decay, Mexican American children had the highest prevalence during 1999–2004 and the third highest prevalence during 2011–2016, but they also experienced a notable decline. The largest decrease was observed among near-poor children (12% vs. 6%).
Among children with caries, the mean number of affected teeth (0.2) increased, and this increase was attributed to a corresponding increase in filled teeth (0.2). Similarly, a significant decrease in the mean percentage of carious permanent teeth that were untreated was observed among near-poor children. Among children with caries, the first permanent molars remained the most commonly affected teeth.

PAGE 11
Adolescents Aged 12–19 YearsOverall, untreated tooth decay prevalence decreased (20% vs. 17%), whereas dental caries prevalence had no detectable decrease (59% vs. 57%). More than half of adolescents had caries, and about 1 in 6 had untreated tooth decay. Among poor, Mexican American, and non-Hispanic black adolescents with caries, the mean percentage of permanent teeth with caries that were untreated decreased, whereas the mean percentage filled increased. Among adolescents with caries, permanent molars were most commonly affected.
Dental Sealants
Children Aged 6–11 YearsSince 1999–2004, the prevalence of sealants increased by about 40% overall (31% vs. 42%). Increases were observed across all sociodemographic characteristics, except for not-poor children. Increases of more than 16 percentage points occurred among poor, near-poor, and Mexican American children. By 2011–2016, no difference was detected between Mexican American and non-Hispanic white children or between near-poor and not-poor children. Overall, children with sealants had an average of 3 first permanent molars sealed in both survey periods. Among poor children with sealants, the mean number of first permanent molars sealed increased since 1999–2004, and no difference was detected between this group and their not-poor counterparts during 2011–2016.
Adolescents Aged 12–19 YearsThe prevalence of sealants increased from 38% to 48% overall. Increases were observed across all sociodemographic groups, except for not-poor adolescents. Prevalence increased by 14 percentage points among poor children and 18 percentage points among near-poor and Mexican American children. By 2011–2016, no difference was detected between near-poor and not-poor children. Although prevalence among non-Hispanic black, Mexican American, and poor adolescents increased by about 50% or more since 1999–2004, estimates remained lower than those for non-Hispanic white and not-poor adolescents during 2011–2016.
Among those with sealants, the mean number of sealed first and second permanent molars increased overall and across most sociodemographic groups, with the largest increases among non-Hispanic black adolescents. By 2011–2016, no differences were detected in the mean number of sealed second molars by poverty status or race or ethnicity.
Dental Caries Among Adults and Older Adults
Adults Aged 20–64 YearsBetween the two survey periods, the overall prevalence of caries decreased slightly, but no difference was detected in untreated decay, with 9 in 10 adults affected by caries and 1 in 4 affected by untreated tooth decay. No detectable changes in caries prevalence were observed among adults who were non-Hispanic black, Mexican American, poor and near-poor combined, less educated, and current smokers. Prevalence of untreated decay increased among adults with a high school education and current and former smokers. No declines were detected in the prevalence of untreated tooth decay for any sociodemographic group.
Disparities by race or ethnicity, poverty, education, and smoking status persisted during 2011–2016. Among adults who were non-Hispanic black, Mexican American, poor, or near-poor; who had a high school education or less; or who were current smokers, prevalence of untreated decay was about twice that among their non-Hispanic white, not-poor, more highly educated, or never smoked counterparts.
Among adults with caries, the mean number of teeth affected was lower during 2011–2016 (7.4) than during 1999–2004 (8.2). However, this change appears to be primarily associated with a decrease in the mean number of filled teeth and no detectable change in untreated decay. No decreases in the number of teeth with untreated decay or increases in filled teeth were found across sociodemographic groups between the two survey periods. Consistent with these findings, small increases in the mean percentage of teeth with caries (DFT ≥1) that were untreated and corresponding decreases in the mean percentage that were filled were found among adults who had a high school education or more and who were current and former smokers.
Older Adults Aged 65 Years or OlderAmong older adults, a small increase was found in the prevalence of caries, but no change was detected in the prevalence of untreated decay. More than 9 in 10 adults had experienced dental caries, and 1 in 6 had untreated tooth decay. Although the percentage with untreated decay was smaller than that found among working-age adults, relative differences for some groups defined by race or ethnicity, poverty, and smoking status were larger. Among older adults who were non-Hispanic black, Mexican American, poor, near-

PAGE 12
A group of friends posing for a selfie.
Older Adults Aged 65 Years or OlderOverall, about 1 in 6 (17%) older adults had lost all of their teeth during 2011–2016, a decrease of more than 30% compared to 1999–2004 (27%). The percentage who had lost all of their teeth declined by almost 50% among those aged 65–74 years and by 28% among those aged 75 years or older. By 2011–2016, edentulism among older adults who were poor, had less than a high school education, or were current smokers was more than 3 times that of older adults who were not-poor, had more than a high school education, or never smoked.
By 2011–2016, the mean number of teeth retained by older adults also increased by about 2 teeth, to 21.7 among those aged 65–74 years, and by 1 tooth, to 19.5 among those aged 75 years or older. No increases were detected among older adults who were non-Hispanic black, Mexican American, or poor; who had less than a high school education; or who were current smokers.
poor, or current smokers, the prevalence of untreated decay was about 2 to 3 times that of those who were non-Hispanic white or not-poor or who never smoked.
Mean DFT increased by about 10% between the two survey periods (9.1 vs. 10.1). The increase was associated with a similar increase in the mean number of filled teeth among adults who were aged 65–74 years, non-Hispanic white, not-poor, and former smokers. For older adults who were aged 75 years or older or non-Hispanic black, the increase reflected both an increase in filled teeth and a decrease in teeth with untreated decay. Among older non-Hispanic black adults, a noticeable decrease was found in the mean percentage of teeth with caries that were untreated. A corresponding increase was found in the mean percentage that were filled.
Edentulism and Tooth Retention
Adults Aged 20–64 YearsThe percentage of adults who have lost all of their teeth decreased from 4% during 1999–2004 to 2% during 2011–2016. Among younger adults aged 20–34 years, too few people were edentate to generate stable estimates, suggesting that edentulism is rare among this group. Since 1999–2004, no significant decrease in edentulism has been found among those who are Mexican American or current smokers—groups who also had no detectable increases in the number of teeth retained. The percentage who have lost all their teeth remains higher (6%) among people who are poor and current smokers, compared to about 1% among those who are not-poor or who have never smoked.
By 2011–2016, the mean number of teeth retained among working-age adults aged 20–64 years with at least 1 tooth, overall and across most sociodemographic groups, increased by less than 1 tooth to about 26 teeth. Although the mean number of retained teeth was never less than 23 for any group, some groups—those who were poor, near-poor, non-Hispanic black, or Mexican American; who had a high school education or less; and who were current and former smokers—had a lower mean number of remaining teeth than the reference group for each characteristic.

PAGE 13
major drivers of the use of dental services among poor and near-poor children and adolescents.31–33 A near-doubling of the percentage of children with public dental insurance from 1996 to 2015 resulted in a 15 percentage point increase to 88% in any dental coverage among all children.34 The percentage of working-age adults aged 21–64 years with any dental insurance increased by 7 percentage points to 72%, also driven by increased public dental insurance coverage.
During the same period, the use of dental services in the past year increased among children by 6 percentage points to 48%, but decreased among working-age adults by 4 percentage points to 40%. Among older adults, past-year dental use increased by 7 percentage points to 47%; this increase may have been associated with a 5 percentage point increase in private dental insurance coverage.
The range of covered services among children and adults with public insurance is a key factor affecting dental care use. Public dental insurance coverage among children offers comprehensive dental benefits (e.g., diagnostic, preventive, and restorative services), whereas coverage for adults is commonly limited to emergency services only.31 Cost remains a major barrier to receipt of dental services across the life span and is the most common reason among working-age adults for not seeking dental care.35,36
Other strategies aimed at increasing the availability and accessibility of dental services among populations who may lack access to dental care include the provision of preventive services in primary medical care,37,38 school, and community settings39,40 and the promotion of dental visits for young children at risk of early childhood caries.37,41 The findings in this report indicate that the improvement in children’s oral health status was not experienced by working-age and older adults.
Conclusion and CommentAlthough disparities in oral health by race or ethnicity and poverty remain, the findings in this report highlight improvements among children and adolescents since 1999–2004. These improvements include decreases in the prevalence of untreated decay in the primary teeth of children across sociodemographic groups and in the permanent teeth of near-poor and Mexican American children and adolescents and non-Hispanic black adolescents.
Sealant prevalence in the permanent teeth of children and adolescents increased overall and across all sociodemographic groups except for the not-poor. By 2011–2016, no detectable differences were found in sealant prevalence between near-poor and not-poor children and adolescents and between Mexican American and non-Hispanic white children.
In contrast, during 2011–2016, about 1 in 4 working-age adults and 1 in 6 older adults had untreated tooth decay.These proportions reflect no detectable changes since 1999–2004. Differences in the prevalence of untreated decay by race or ethnicity, poverty, education, and smoking also persisted through 2011–2016. Among working-age adults, no decreases in the mean number of teeth with untreated decay or increases in filled teeth were detected. Among older adults, the mean number of filled teeth did increase by about one tooth overall, and increases were significant for males, females, non-Hispanic whites, non-Hispanic blacks, and former smokers. By poverty level, having more filled teeth was only significant for those who were not-poor.
The mean number of teeth retained increased, and the prevalence of edentulism decreased overall for working-age and older adults. However, by poverty or smoking status, changes in the number of teeth retained among poor adults or current smokers since 1999–2004 were not statistically significant for either of these age groups.
Improvements in children’s oral health status likely reflect increased access to preventive and restorative care. State Medicaid and Children’s Health Insurance Programs are

PAGE 14
References1. US Department of Health and Human Services. Oral
Health in America: A Report of the Surgeon General. Rockville, MD: National Institute of Dental and Craniofacial Research, National Institutes of Health, US Dept of Health and Human Services; 2000.
2. Jackson SL, Vann WF, Jr., Kotch JB, Pahel BT, Lee JY. Impact of poor oral health on children’s school attendance and performance. Am J Public Health. 2011;101(10):1900–1906.
3. Kelekar U, Naavaal S. Hours lost to planned and unplanned dental visits among US adults. Prev Chronic Dis. 2018;15:170225. doi: 10.5888/pcd15.170225.
4. Seirawan H, Faust S, Mulligan R. The impact of oral health on the academic performance of disadvantaged children. Am J Public Health. 2012;102(9):1729–1734.
5. Azofeifa A, Yeung LF, Alverson CJ, Beltran-Aguilar E. Dental caries and periodontal disease among US pregnant women and nonpregnant women of reproductive age, National Health and Nutrition Examination Survey, 1999–2004. J Public Health Dent. 2016;76(4):320–329.
6. Beltran-Aguilar ED, Barker LK, Canto MT, et al. Surveillance for dental caries, dental sealants, tooth retention, edentulism, and enamel fluorosis — United States, 1988–1994 and 1999–2002. MMWR Surveill Summ. 2005;54(3):1–43.
7. Dye B, Thornton-Evans G, Li X, Iafolla T. Dental caries and tooth loss in adults in the United States, 2011–2012. NCHS Data Brief. 2015;197:197.
8. Dye BA, Li X, Beltran-Aguilar ED. Selected oral health indicators in the United States, 2005–2008. NCHS Data Brief. 2012;96:1–8.
9. Dye BA, Mitnik GL, Iafolla TJ, Vargas CM. Trends in dental caries in children and adolescents according to poverty status in the United States from 1999 through 2004 and from 2011 through 2014. J Am Dent Assoc. 2017;148(8):550–565:e7.
10. Dye BA, Tan S, Smith V, et al. Trends in oral health status: United States, 1988–1994 and 1999–2004. Vital Health Stat 11. 2007;248:1–92.
11. Dye BA, Thornton-Evans G, Li X, Iafolla TJ. Dental caries and sealant prevalence in children and adolescents in the United States, 2011–2012. NCHS Data Brief. 2015;191:1–8.
12. Nowjack-Raymer RE, Sheiham A. Association of edentulism and diet and nutrition in US adults. J Dent Res. 2003;82(2):123–126.
13. Capurro DA, Iafolla T, Kingman A, Chattopadhyay A, Garcia I. Trends in income-related inequality in untreated caries among children in the United States: findings from NHANES I, NHANES III, and NHANES 1999–2004. Community Dent Oral Epidemiol. 2015;43(6):500–510.
14. Griffin SO, Jones JA, Brunson D, Griffin PM, Bailey WD. Burden of oral disease among older adults and implications for public health priorities. Am J Public Health. 2012;102(3):411–418.
15. Huang DL, Park M. Socioeconomic and racial/ethnic oral health disparities among US older adults: oral health quality of life and dentition. J Public Health Dent. 2015;75(2):85–92.
16. Griffin SO, Wei L, Gooch BF, Weno K, Espinoza L. Vital signs: dental sealant use and untreated tooth decay among US school-aged children. MMWR Morb Mortal Wkly Rep. 2016;65(41):1141–1145.
17. Centers for Disease Control and Prevention. About the National Health and Nutrition Examination Survey (NHANES) website. https://www.cdc.gov/nchs/nhanes/about_nhanes.htm. Accessed August 13, 2018.
18. Shenkin JD. An increase in caries rate or an increase in access to care: data show mixed results. J Public Health Dent. 2011;71(1):1–5.
19. Slade GD, Akinkugbe AA, Sanders AE. Projections of US edentulism prevalence following 5 decades of decline. J Dent Res. 2014;93(10):959–965.
20. Fleming E, Afful J. Prevalence of total and untreated dental caries among youth: United States, 2015–2016. NCHS Data Brief. 2018;307:1–8.
21. Slade GD, Sanders AE. Two decades of persisting income-disparities in dental caries among US children and adolescents. J Public Health Dent. 2018;78(3):187–191.
22. Johnson CL, Dohrmann SM, Burt VL, Mohadjer LK. National Health and Nutrition Examination Survey: sample design, 2011–2014. Vital Health Stat 2. 2014;162:1–33.

PAGE 15
23. Centers for Disease Control and Prevention. National Health and Nutrition Examination Survey: Analytic Guidelines, 2011–2014 and 2015–2016. Atlanta, GA: Centers for Disease Control and Prevention, US Dept of Health and Human Services; 2018.
24. Centers for Disease Control and Prevention. National Health and Nutrition Examination Survey (NHANES) Oral Health Examiners Manual. Atlanta, GA: Centers for Disease Control and Prevention, US Dept of Health and Human Services; 2016.
25. Radike AW. Criteria for diagnosis of dental caries. In: Proceedings of the Conference on the Clinical Testing of Cariostatic Agents. Chicago, IL: American Dental Association; 1972:87–88.
26. Klein H, Carroll CE, Knutson JW. Studies on dental caries: I. Dental status and dental needs of elementary school children. Public Health Rep. 1938;53(19):751–765.
27. Klein RJ, Schoenborn CA. Age adjustment using the 2000 projected US population. Healthy People Stat Notes. 2001;20.
28. Centers for Medicare & Medicaid Services. Medicaid and CHIP eligibility levels website. https://www.medicaid.gov/medicaid/program-information/medicaid-and-chip-eligibility-levels/index.html. Accessed February 7, 2018.
29. US Department of Agriculture, Food and Nutrition Service. National School Lunch Program. Income Eligibility Guidelines website. https://www.fns.usda.gov/school-meals/income-eligibility-guidelines. Accessed August 14, 2018.
30. Klein RJ, Proctor SE, Boudreault MA, Turczyn KM. Healthy People 2010 criteria for data suppression. Healthy People Stat Notes. 2002;24.
31. Centers for Medicare & Medicaid Services. Dental Care website. https://www.medicaid.gov/medicaid/benefits/dental/index.html. Accessed August 21, 2018.
32. Ku L, Sharac J, Bruen B, Thomas M, Norris L. Increased use of dental services by children covered by Medicaid: 2000–2010. Medicare Medicaid Res Rev. 2013;3(3):E1–E13.
33. Steinmetz E, Bruen B, Ku L. Children’s Use of Dental Care in Medicaid: Federal Fiscal Years 2000–2012. Washington, DC: Milken Institute School of Public Health, The George Washington University; 2014.
34. Manski RJ, Rohde F. Dental Services: Use, Expenses, Source of Payment, Coverage and Procedure Type, 1996–2015. Research Findings #38. Rockville, MD: Agency for Healthcare Research and Quality, US Dept of Health and Human Services; 2017.
35. Vujicic M, Buchmueller T, Klein R. Dental care presents the highest level of financial barriers, compared to other types of health care services. Health Aff. 2016;35(12):2176–2182.
36. American Dental Association. Cost Barriers to Dental Care in the U.S. https://www.ada.org/~/media/ADA/Science%20and%20Research/HPI/Files/HPIgraphic_1117_4.pdf?la=en. Accessed March 15, 2019.
37. American Academy of Pediatrics. Recommendations for Preventive Pediatric Health Care. https://www.aap.org/en-us/documents/periodicity_schedule.pdf. Accessed August 13, 2018.
38. US Preventive Services Task Force. Clinical Summary website. Dental Caries in Children from Birth Through Age 5 Years: Screening. https://www.uspreventiveservicestaskforce.org/Page/Document/ClinicalSummaryFinal/dental-caries-in-children-from-birth-through-age-5-years-screening. Accessed August 14, 2018.
39. Community Preventive Services Task Force. Dental Caries (Cavities); School-Based Dental Sealant Delivery Programs. https://www.thecommunityguide.org/oral/schoolsealants.html. Accessed February 7, 2018.
40. Gooch BF, Griffin SO, Gray SK, et al. Preventing dental caries through school-based sealant programs: updated recommendations and reviews of evidence. J Am Dent Assoc. 2009;140(11):1356–1365.
41. American Academy of Pediatric Dentistry. Policy on dental home. Pediatr Dent. 2017;39(6):29–30.

PAGE 16

PAGE 17
TABLES 1–36

PA
GE
18
Tabl
e 1.
Pre
vale
nce
of d
enta
l car
ies i
n pr
imar
y te
eth
(dft
≥1)a a
mon
g ch
ildre
n ag
ed 2
–5 y
ears
, by
sele
cted
cha
ract
eris
tics,
Uni
ted
Stat
es, N
atio
nal H
ealth
and
Nut
ritio
n Ex
amin
atio
n Su
rvey
, 19
99–2
004
and
2011
–201
6
Not
e: A
ll es
timat
es a
re a
djus
ted
by a
ge (s
ingl
e ye
ars)
to th
e US
200
0 st
anda
rd p
opul
atio
n. S
E =
stan
dard
erro
r. FP
L =
fede
ral p
over
ty le
vel;
<10
0% F
PL =
poo
r; 10
0%–1
99%
FPL
= n
ear-p
oor;
<20
0% F
PL =
poo
r and
nea
r-poo
r com
bine
d; a
nd ≥
200%
FPL
= n
ot-p
oor.
* P
< 0
.05
base
d on
t-te
st fo
r diff
eren
ces b
etw
een
two
perio
ds o
r tw
o gr
oups
with
in e
ach
char
acte
ristic
.a
Defi
ned
as h
avin
g on
e or
mor
e un
treat
ed d
ecay
ed o
r fille
d pr
imar
y te
eth
amon
g ch
ildre
n w
ith a
t lea
st o
ne p
rimar
y to
oth.
b Cha
nge
in p
erce
ntag
e po
ints
from
199
9–20
04 to
201
1–20
16. P
ositi
ve v
alue
= in
crea
se; n
egat
ive
valu
e =
dec
reas
e.c
Refe
renc
e gr
oup
for c
ompa
rison
s with
in e
ach
char
acte
ristic
, 201
1–20
16.
Char
acte
rist
ic19
99–2
004
2011
–201
6Ch
ange
%b
%SE
%SE
Tota
l27
.91.
2923
.31.
38-4
.6*
Sex Male
c30
.12.
1224
.01.
63-6
.1*
Fem
ale25
.81.
5022
.41.
86-3
.4
Race
and
eth
nicit
y
Whi
te, n
on-H
ispan
icc23
.81.
8317
.91.
68-5
.9*
Blac
k, no
n-Hi
span
ic31
.62.
2428
.0*
2.25
-3.6
Mex
ican A
mer
ican
41.3
1.99
32.9
*2.
26-8
.4*
Pove
rty s
tatu
s
<10
0% FP
L41
.82.
2633
.9*
1.65
-7.8
*
100%
–199
% FP
L30
.43.
2124
.4*
2.24
-6.0
≥20
0% FP
Lc17
.81.
5315
.71.
82-2
.1
Pove
rty s
tatu
s
<20
0% FP
L36
.22.
0929
.6*
1.54
-6.6
*
≥20
0% FP
Lc17
.81.
5315
.71.
82-2
.1
Acce
ssib
le v
ersi
on a
t htt
ps://
ww
w.c
dc.g
ov/o
ralh
ealth
/pub
licat
ions
/OH
SR-2
019-
tabl
e-1.
htm
l
Tabl
e 1.
Pre
vale
nce
of d
enta
l car
ies
in p
rimar
y te
eth
(dft
≥1)
a am
ong
child
ren
aged
2–5
yea
rs,
by s
elec
ted
char
acte
ristic
s, U
nite
d St
ates
, Nat
iona
l Hea
lth a
nd N
utrit
ion
Exam
inat
ion
Surv
ey,
1999
–200
4 an
d 20
11–2
016
Acce
ssib
le v
ersio
n at
htt
ps://
ww
w.c
dc.g
ov/o
ralh
ealth
/pub
licat
ions
/OH
SR-2
019-
tabl
e-1.
htm
l

PA
GE
19
Tabl
e 2.
Pre
vale
nce
of u
ntre
ated
toot
h de
cay
in p
rimar
y te
eth
(dt ≥
1)a a
mon
g ch
ildre
n ag
ed
2–5
year
s, b
y se
lect
ed c
hara
cter
istic
s, U
nite
d St
ates
, Nat
iona
l Hea
lth a
nd N
utrit
ion
Exam
inat
ion
Su
rvey
, 199
9–20
04 a
nd 2
011–
2016
Acce
ssib
le v
ersio
n at
htt
ps://
ww
w.c
dc.g
ov/o
ralh
ealth
/pub
licat
ions
/OH
SR-2
019-
tabl
e-2.
htm
l
Tabl
e 2.
Pre
vale
nce
of u
ntre
ated
toot
h de
cay
in p
rimar
y te
eth
(dt ≥
1)a a
mon
g ch
ildre
n ag
ed
2–5
year
s, by
sele
cted
cha
ract
eris
tics,
Uni
ted
Stat
es, N
atio
nal H
ealth
and
Nut
ritio
n Ex
amin
atio
n
Surv
ey, 1
999–
2004
and
201
1–20
16
Not
e: A
ll es
timat
es a
re a
djus
ted
by a
ge (s
ingl
e ye
ars)
to th
e US
200
0 st
anda
rd p
opul
atio
n. S
E =
stan
dard
erro
r. FP
L =
fede
ral p
over
ty le
vel;
<10
0% F
PL =
poo
r; 10
0%–1
99%
FPL
= n
ear-p
oor;
<20
0% F
PL =
poo
r and
nea
r-poo
r com
bine
d; a
nd ≥
200%
FPL
= n
ot-p
oor.
* P
< 0
.05
base
d on
t-te
st fo
r diff
eren
ces b
etw
een
two
perio
ds o
r tw
o gr
oups
with
in e
ach
char
acte
ristic
.a
Defi
ned
as h
avin
g on
e or
mor
e un
treat
ed d
ecay
ed p
rimar
y te
eth
amon
g ch
ildre
n w
ith a
t lea
st o
ne p
rimar
y to
oth.
b Ch
ange
in p
erce
ntag
e po
ints
from
199
9–20
04 to
201
1–20
16. P
ositi
ve v
alue
= in
crea
se; n
egat
ive
valu
e =
dec
reas
e.c
Refe
renc
e gr
oup
for c
ompa
rison
s with
in e
ach
char
acte
ristic
, 201
1–20
16.
Char
acte
rist
ic19
99–2
004
2011
–201
6Ch
ange
%b
%SE
%SE
Tota
l20
.51.
2510
.40.
84-1
0.1*
Sex Male
c21
.21.
8911
.11.
10-1
0.0*
Fem
ale19
.81.
389.
51.
04-1
0.3*
Race
and
eth
nicit
y
Whi
te, n
on-H
ispan
icc16
.91.
626.
70.
90-1
0.1*
Blac
k, no
n-Hi
span
ic24
.32.
1714
.8*
1.90
-9.5
*
Mex
ican A
mer
ican
30.8
1.67
15.1
*1.
69-1
5.7*
Pove
rty s
tatu
s
<10
0% FP
L31
.31.
9017
.2*
1.67
-14.
1*
100%
–199
% FP
L23
.12.
999.
9*1.
32-1
3.1*
≥20
0% FP
Lc12
.91.
186.
00.
85-6
.9*
Pove
rty s
tatu
s
<20
0% FP
L27
.22.
0613
.9*
1.14
-13.
3*
≥20
0% FP
Lc12
.91.
186.
00.
85-6
.9*
Acce
ssib
le v
ersi
on a
t htt
ps://
ww
w.c
dc.g
ov/o
ralh
ealth
/pub
licat
ions
/OH
SR-2
019-
tabl
e-2.
htm
l

PA
GE
20
Tabl
e 3.
Mea
n nu
mbe
r of u
ntre
ated
dec
ayed
(dt),
fille
d (ft
), an
d un
trea
ted
deca
yed
or fi
lled
(dft)
prim
ary
teet
h am
ong
child
ren
aged
2–5
yea
rs w
ith a
t lea
st o
ne d
ft, b
y se
lect
ed c
hara
cter
istic
s, U
nite
d St
ates
, Nat
iona
l Hea
lth a
nd N
utrit
ion
Exam
inat
ion
Su
rvey
, 199
9–20
04 a
nd 2
011–
2016
Acce
ssib
le v
ersio
n at
htt
ps://
ww
w.c
dc.g
ov/o
ralh
ealth
/pub
licat
ions
/OH
SR-2
019-
tabl
e-3.
htm
l
Tabl
e 3.
Mea
n nu
mbe
r of u
ntre
ated
dec
ayed
(dt),
fille
d (ft
), an
d un
trea
ted
deca
yed
or fi
lled
(dft)
prim
ary
teet
h am
ong
child
ren
aged
2–5
yea
rs w
ith a
t lea
st o
ne d
ft, b
y se
lect
ed c
hara
cter
istic
s, U
nite
d St
ates
, Nat
iona
l Hea
lth a
nd N
utrit
ion
Exam
inat
ion
Su
rvey
, 199
9–20
04 a
nd 2
011–
2016
Not
e: A
ll es
timat
es a
re a
djus
ted
by a
ge (s
ingl
e ye
ars)
to th
e US
200
0 st
anda
rd p
opul
atio
n. S
E =
stan
dard
erro
r. FP
L =
fede
ral p
over
ty le
vel; <
100%
FPL
= p
oor;
10
0%–1
99%
FPL
= n
ear-p
oor;
<20
0% F
PL =
poo
r and
nea
r-poo
r com
bine
d; a
nd ≥
200%
FPL
= n
ot-p
oor.
* P
< 0
.05
base
d on
t-te
st fo
r diff
eren
ces b
etw
een
two
perio
ds o
r tw
o gr
oups
with
in e
ach
char
acte
ristic
.a
Chan
ge fr
om 1
999–
2004
to 2
011–
2016
. Pos
itive
val
ue =
incr
ease
; neg
ativ
e va
lue
= d
ecre
ase.
b Ref
eren
ce g
roup
for c
ompa
rison
s with
in e
ach
char
acte
ristic
, 201
1–20
16.
Char
acte
rist
ic
1999
–200
420
11–2
016
Chan
ge
in d
fta
Chan
ge
in d
taCh
ange
in
fta
dft
dtft
dft
dtft
Mea
nSE
Mea
nSE
Mea
nSE
Mea
nSE
Mea
nSE
Mea
nSE
Tota
l4.
10.
212.
60.
201.
40.
154.
30.
161.
60.
112.
80.
150.
3-1
.1*
1.3*
Sex Male
b4.
10.
272.
40.
251.
70.
214.
30.
191.
60.
142.
70.
180.
2-0
.8*
1.0*
Fem
ale4.
10.
212.
90.
211.
20.
164.
50.
261.
50.
153.
00.
270.
4-1
.4*
1.8*
Race
and
eth
nicit
y
Whi
te, n
on-H
ispan
icb4.
10.
362.
60.
311.
50.
264.
70.
421.
70.
252.
90.
390.
6-0
.9*
1.5*
Blac
k, no
n-Hi
span
ic3.
70.
272.
50.
231.
30.
224.
10.
211.
90.
202.
20.
270.
4-0
.60.
9*
Mex
ican A
mer
ican
3.9
0.21
2.4
0.18
1.5
0.19
4.8
0.24
1.3
0.17
3.4
0.22
0.8*
-1.1
*1.
9*
Pove
rty s
tatu
s
<10
0% FP
L4.
90.
293.
00.
251.
80.
244.
40.
211.
50.
152.
90.
23-0
.5-1
.5*
1.0*
100%
–199
% FP
L4.
30.
313.
00.
341.
30.
244.
10.
261.
70.
172.
50.
26-0
.1-1
.3*
1.2*
≥20
0% FP
Lb3.
10.
301.
80.
281.
20.
204.
40.
521.
50.
282.
90.
461.
3*-0
.31.
7*
Pove
rty s
tatu
s
<20
0% FP
L4.
60.
243.
00.
221.
60.
224.
30.
161.
60.
132.
70.
18-0
.3-1
.5*
1.1*
≥20
0% FP
Lb3.
10.
301.
80.
281.
20.
204.
40.
521.
50.
282.
90.
461.
3*-0
.31.
7*
Acce
ssib
le v
ersi
on a
t htt
ps://
ww
w.c
dc.g
ov/o
ralh
ealth
/pub
licat
ions
/OH
SR-2
019-
tabl
e-3.
htm
l

PA
GE
21
Tabl
e 4.
Mea
n pe
rcen
tage
con
trib
utio
n of
unt
reat
ed d
ecay
ed (%
dt/
dft)
or fi
lled
(% ft
/dft)
prim
ary
teet
h am
ong
child
ren
aged
2–5
ye
ars
with
at l
east
one
unt
reat
ed d
ecay
ed o
r fille
d pr
imar
y to
oth
(dft
≥1)
, by
sele
cted
cha
ract
eris
tics,
Uni
ted
Stat
es, N
atio
nal H
ealth
an
d N
utrit
ion
Exam
inat
ion
Surv
ey, 1
999–
2004
and
201
1–20
16Ac
cess
ible
ver
sion
at h
ttps
://w
ww
.cdc
.gov
/ora
lhea
lth/p
ublic
atio
ns/O
HSR
-201
9-ta
ble-
4.ht
ml
Tabl
e 4.
Mea
n pe
rcen
tage
con
trib
utio
n of
unt
reat
ed d
ecay
ed (%
dt/
dft)
or fi
lled
(% ft
/dft)
prim
ary
teet
h am
ong
child
ren
aged
2–5
ye
ars w
ith a
t lea
st o
ne u
ntre
ated
dec
ayed
or fi
lled
prim
ary
toot
h (d
ft ≥1
), by
sele
cted
cha
ract
eris
tics,
Uni
ted
Stat
es, N
atio
nal H
ealth
an
d N
utrit
ion
Exam
inat
ion
Surv
ey, 1
999–
2004
and
201
1–20
16
Not
e: A
ll es
timat
es a
re a
djus
ted
by a
ge (s
ingl
e ye
ars)
to th
e US
200
0 st
anda
rd p
opul
atio
n. S
E =
stan
dard
erro
r. FP
L =
fede
ral p
over
ty le
vel; <
100%
FPL
= p
oor;
100
%–1
99%
FPL =
nea
r-poo
r; <
200%
FPL
= p
oor a
nd n
ear-p
oor c
ombi
ned;
and
≥20
0% F
PL =
not
-poo
r.
* P
< 0
.05
base
d on
t-te
st fo
r diff
eren
ces b
etw
een
two
perio
ds o
r tw
o gr
oups
with
in e
ach
char
acte
ristic
.a
Chan
ge in
per
cent
age
poin
ts fr
om 1
999–
2004
to 2
011–
2016
. Pos
itive
val
ue =
incr
ease
; neg
ativ
e va
lue
= d
ecre
ase.
b Ref
eren
ce g
roup
for c
ompa
rison
s with
in e
ach
char
acte
ristic
, 201
1–20
16.
Acce
ssib
le v
ersi
on a
t htt
ps://
ww
w.c
dc.g
ov/o
ralh
ealth
/pub
licat
ions
/OH
SR-2
019-
tabl
e-4.
htm
l
Char
acte
rist
ic
1999
–200
420
11–2
016
Cha
nge
in
% d
t/df
ta C
hang
e in
%
ft/d
fta
% d
t/df
t%
ft/d
ft%
dt/
dft
% ft
/dft
Mea
nSE
Mea
nSE
Mea
nSE
Mea
nSE
Tota
l72
.32.
4227
.72.
4345
.31.
7754
.71.
77-2
6.9*
26.9
*
Sex Male
b68
.43.
2531
.63.
2545
.92.
5454
.12.
54-2
2.5*
22.5
*
Fem
ale76
.72.
6023
.32.
6043
.93.
2556
.13.
25-3
2.8*
32.8
*
Race
and
eth
nicit
y
Whi
te, n
on-H
ispan
icb71
.93.
7828
.13.
7941
.04.
5359
.04.
53-3
0.8*
30.9
*
Blac
k, no
n-Hi
span
ic75
.52.
8524
.52.
8552
.15.
2447
.95.
24-2
3.4*
23.4
*
Mex
ican A
mer
ican
70.2
3.29
29.8
3.29
43.8
3.17
56.2
3.17
-26.
4*26
.4*
Pove
rty s
tatu
s
<10
0% FP
L70
.82.
7729
.22.
7845
.33.
1954
.73.
20-2
5.5*
25.5
*
100%
–199
% FP
L75
.73.
9424
.33.
9449
.03.
0551
.03.
06-2
6.7*
26.7
*
≥20
0% FP
Lb72
.34.
3727
.74.
3741
.64.
4458
.44.
45-3
0.7*
30.7
*
Pove
rty s
tatu
s
<20
0% FP
L72
.62.
7727
.42.
7746
.52.
3853
.52.
38-2
6.1*
26.1
*
≥20
0% FP
Lb72
.34.
3727
.74.
3741
.64.
4458
.44.
45-3
0.7*
30.7
*
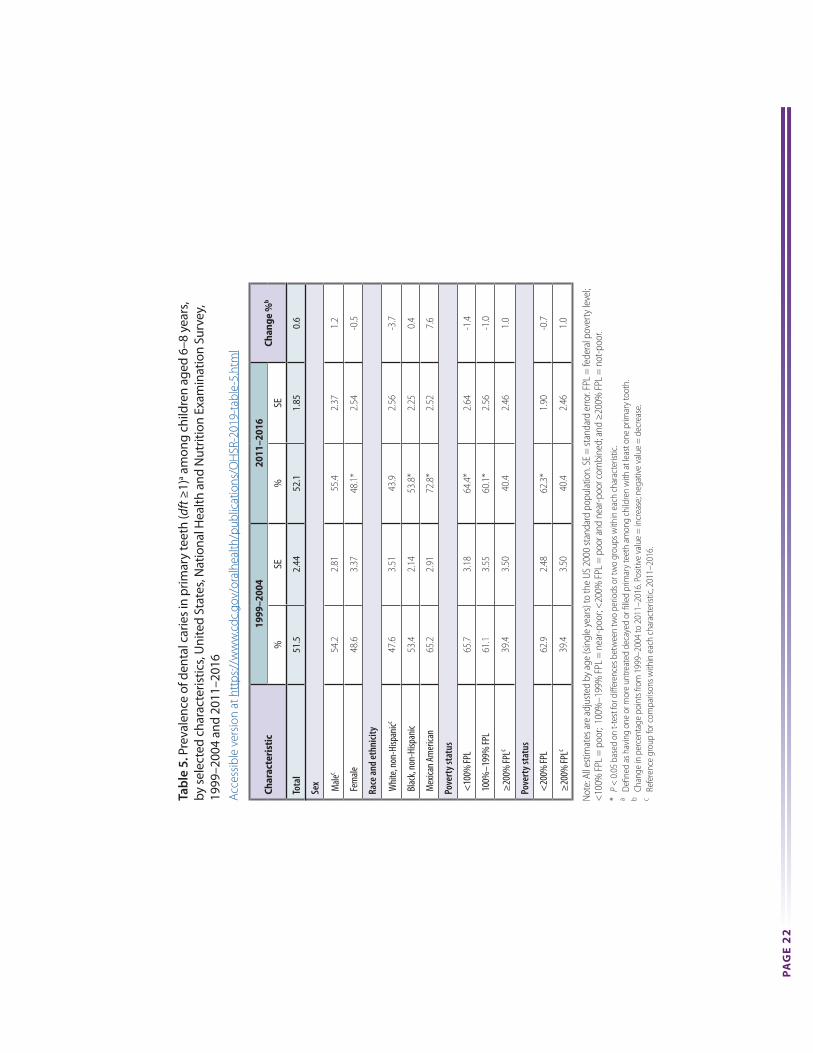
PA
GE
22
Tabl
e 5.
Pre
vale
nce
of d
enta
l car
ies
in p
rimar
y te
eth
(dft
≥1)
a am
ong
child
ren
aged
6–8
yea
rs,
by s
elec
ted
char
acte
ristic
s, U
nite
d St
ates
, Nat
iona
l Hea
lth a
nd N
utrit
ion
Exam
inat
ion
Surv
ey,
1999
–200
4 an
d 20
11–2
016
Acce
ssib
le v
ersio
n at
htt
ps://
ww
w.c
dc.g
ov/o
ralh
ealth
/pub
licat
ions
/OH
SR-2
019-
tabl
e-5.
htm
l
Tabl
e 5.
Pre
vale
nce
of d
enta
l car
ies i
n pr
imar
y te
eth
(dft
≥1)a a
mon
g ch
ildre
n ag
ed 6
–8 y
ears
, by
sele
cted
cha
ract
eris
tics,
Uni
ted
Stat
es, N
atio
nal H
ealth
and
Nut
ritio
n Ex
amin
atio
n Su
rvey
, 19
99–2
004
and
2011
–201
6
Not
e: A
ll es
timat
es a
re a
djus
ted
by a
ge (s
ingl
e ye
ars)
to th
e US
200
0 st
anda
rd p
opul
atio
n. S
E =
stan
dard
erro
r. FP
L =
fede
ral p
over
ty le
vel;
<10
0% F
PL =
poo
r; 1
00%
–199
% F
PL =
nea
r-poo
r; <
200%
FPL
= p
oor a
nd n
ear-p
oor c
ombi
ned;
and
≥20
0% F
PL =
not
-poo
r.
* P
< 0
.05
base
d on
t-te
st fo
r diff
eren
ces b
etw
een
two
perio
ds o
r tw
o gr
oups
with
in e
ach
char
acte
ristic
.a
Defi
ned
as h
avin
g on
e or
mor
e un
treat
ed d
ecay
ed o
r fille
d pr
imar
y te
eth
amon
g ch
ildre
n w
ith a
t lea
st o
ne p
rimar
y to
oth.
b Cha
nge
in p
erce
ntag
e po
ints
from
199
9–20
04 to
201
1–20
16. P
ositi
ve v
alue
= in
crea
se; n
egat
ive
valu
e =
dec
reas
e.c
Refe
renc
e gr
oup
for c
ompa
rison
s with
in e
ach
char
acte
ristic
, 201
1–20
16.
Acce
ssib
le v
ersi
on a
t htt
ps://
ww
w.c
dc.g
ov/o
ralh
ealth
/pub
licat
ions
/OH
SR-2
019-
tabl
e-5.
htm
l
Char
acte
rist
ic19
99–2
004
2011
–201
6Ch
ange
%b
%SE
%SE
Tota
l51
.52.
4452
.11.
850.
6
Sex Male
c54
.22.
8155
.42.
371.
2
Fem
ale48
.63.
3748
.1*
2.54
-0.5
Race
and
eth
nicit
y
Whi
te, n
on-H
ispan
icc47
.63.
5143
.92.
56-3
.7
Blac
k, no
n-Hi
span
ic53
.42.
1453
.8*
2.25
0.4
Mex
ican A
mer
ican
65.2
2.91
72.8
*2.
527.
6
Pove
rty s
tatu
s
<10
0% FP
L65
.73.
1864
.4*
2.64
-1.4
100%
–199
% FP
L61
.13.
5560
.1*
2.56
-1.0
≥20
0% FP
Lc39
.43.
5040
.42.
461.
0
Pove
rty s
tatu
s
<20
0% FP
L62
.92.
4862
.3*
1.90
-0.7
≥20
0% FP
Lc39
.43.
5040
.42.
461.
0

PA
GE
23
Tabl
e 6.
Pre
vale
nce
of u
ntre
ated
toot
h de
cay
in p
rimar
y te
eth
(dt ≥
1)a a
mon
g ch
ildre
n ag
ed
6–8
year
s, b
y se
lect
ed c
hara
cter
istic
s, U
nite
d St
ates
, Nat
iona
l Hea
lth a
nd N
utrit
ion
Exam
inat
ion
Surv
ey, 1
999–
2004
and
201
1–20
16Ac
cess
ible
ver
sion
at h
ttps
://w
ww
.cdc
.gov
/ora
lhea
lth/p
ublic
atio
ns/O
HSR
-201
9-ta
ble-
6.ht
ml
Tabl
e 6.
Pre
vale
nce
of u
ntre
ated
toot
h de
cay
in p
rimar
y te
eth
(dt ≥
1)a a
mon
g ch
ildre
n ag
ed
6–8
year
s, by
sele
cted
cha
ract
eris
tics,
Uni
ted
Stat
es, N
atio
nal H
ealth
and
Nut
ritio
n Ex
amin
atio
n Su
rvey
, 199
9–20
04 a
nd 2
011–
2016
Acce
ssib
le v
ersi
on a
t htt
ps://
ww
w.c
dc.g
ov/o
ralh
ealth
/pub
licat
ions
/OH
SR-2
019-
tabl
e-6.
htm
l
Not
e: A
ll es
timat
es a
re a
djus
ted
by a
ge (s
ingl
e ye
ars)
to th
e US
200
0 st
anda
rd p
opul
atio
n. S
E =
stan
dard
erro
r. FP
L =
fede
ral p
over
ty le
vel;
<10
0% F
PL =
poo
r; 10
0%–1
99%
FPL
= n
ear-p
oor;
<20
0% F
PL =
poo
r and
nea
r-poo
r com
bine
d; a
nd ≥
200%
FPL
= n
ot-p
oor.
* P
< 0
.05
base
d on
t-te
st fo
r diff
eren
ces b
etw
een
two
perio
ds o
r tw
o gr
oups
with
in e
ach
char
acte
ristic
.a
Defi
ned
as h
avin
g on
e or
mor
e un
treat
ed d
ecay
ed p
rimar
y te
eth
amon
g th
ose
with
at l
east
one
prim
ary
toot
h.b C
hang
e in
per
cent
age
poin
ts fr
om 1
999–
2004
to 2
011–
2016
. Pos
itive
val
ue =
incr
ease
; neg
ativ
e va
lue
= d
ecre
ase.
c Re
fere
nce
grou
p fo
r com
paris
ons w
ithin
eac
h ch
arac
teris
tic, 2
011–
2016
.
Char
acte
rist
ic19
99–2
004
2011
–201
6Ch
ange
%b
%SE
%SE
Tota
l27
.82.
0216
.41.
26-1
1.4*
Sex Male
c29
.42.
7117
.41.
64-1
2.0*
Fem
ale26
.22.
8515
.21.
44-1
1.1*
Race
and
eth
nicit
y
Whi
te, n
on-H
ispan
icc24
.23.
2413
.21.
84-1
1.0*
Blac
k, no
n-Hi
span
ic34
.82.
1422
.4*
2.32
-12.
5*
Mex
ican A
mer
ican
37.7
2.98
20.0
*2.
49-1
7.7*
Pove
rty s
tatu
s
<10
0% FP
L39
.32.
4222
.3*
2.26
-17.
0*
100%
–199
% FP
L35
.24.
1520
.9*
2.56
-14.
3*
≥20
0% FP
Lc17
.52.
1211
.11.
39-6
.4*
Pove
rty s
tatu
s
<20
0% FP
L36
.92.
2721
.6*
1.96
-15.
3*
≥20
0% FP
Lc17
.52.
1211
.11.
39-6
.4*

PA
GE
24
Tabl
e 7.
Mea
n nu
mbe
r of u
ntre
ated
dec
ayed
(dt),
fille
d (ft
), an
d un
trea
ted
deca
yed
or fi
lled
(dft)
prim
ary
teet
h am
ong
child
ren
aged
6–8
yea
rs w
ith a
t lea
st o
ne d
ft, b
y se
lect
ed c
hara
cter
istic
s, U
nite
d St
ates
, Nat
iona
l Hea
lth a
nd N
utrit
ion
Exam
inat
ion
Su
rvey
, 199
9–20
04 a
nd 2
011–
2016
Acce
ssib
le v
ersio
n at
htt
ps://
ww
w.c
dc.g
ov/o
ralh
ealth
/pub
licat
ions
/OH
SR-2
019-
tabl
e-7.
htm
l
Tabl
e 7.
Mea
n nu
mbe
r of u
ntre
ated
dec
ayed
(dt),
fille
d (ft
), an
d un
trea
ted
deca
yed
or fi
lled
(dft)
prim
ary
teet
h am
ong
child
ren
aged
6–8
yea
rs w
ith a
t lea
st o
ne d
ft, b
y se
lect
ed c
hara
cter
istic
s, U
nite
d St
ates
, Nat
iona
l Hea
lth a
nd N
utrit
ion
Exam
inat
ion
Su
rvey
, 199
9–20
04 a
nd 2
011–
2016
Not
e: A
ll es
timat
es a
re a
djus
ted
by a
ge (s
ingl
e ye
ars)
to th
e US
200
0 st
anda
rd p
opul
atio
n. S
E =
stan
dard
erro
r. FP
L =
fede
ral p
over
ty le
vel; <
100%
FPL
= p
oor;
100%
–199
% F
PL =
nea
r-poo
r; <
200%
FPL
= p
oor a
nd n
ear-p
oor c
ombi
ned;
and
≥20
0% F
PL =
not
-poo
r. 0.
0 =
zero
due
to ro
undi
ng.
* P
< 0
.05
base
d on
t-te
st fo
r diff
eren
ces b
etw
een
two
perio
ds o
r tw
o gr
oups
with
in e
ach
char
acte
ristic
.a
Chan
ge fr
om 1
999–
2004
to 2
011–
2016
. Pos
itive
val
ue =
incr
ease
; neg
ativ
e va
lue
= d
ecre
ase.
b Re
fere
nce
grou
p fo
r com
paris
ons w
ithin
eac
h ch
arac
teris
tic, 2
011–
2016
.
Char
acte
rist
ic
1999
–200
420
11–2
016
Chan
ge
in d
fta
Chan
ge
in d
taCh
ange
in
fta
dft
dtft
dft
dtft
Mea
nSE
Mea
nSE
Mea
nSE
Mea
nSE
Mea
nSE
Mea
nSE
Tota
l4.
30.
131.
50.
102.
70.
154.
40.
110.
80.
073.
60.
130.
2-0
.7*
0.9*
Sex Male
b4.
20.
171.
50.
152.
70.
184.
30.
140.
80.
093.
50.
160.
1-0
.7*
0.8*
Fem
ale4.
30.
191.
50.
112.
80.
214.
50.
130.
80.
093.
70.
160.
3-0
.7*
0.9*
Race
and
eth
nicit
y
Whi
te, n
on-H
ispan
icb4.
20.
221.
40.
172.
80.
254.
20.
160.
80.
143.
40.
170.
0-0
.6*
0.6*
Blac
k, no
n-Hi
span
ic3.
80.
152.
00.
171.
80.
174.
10.
131.
00.
143.
10.
190.
2-1
.0*
1.3*
Mex
ican A
mer
ican
4.5
0.13
1.7
0.12
2.8
0.14
5.0*
0.25
0.7
0.11
4.3*
0.28
0.5
-1.0
*1.
5*
Pove
rty s
tatu
s
<10
0% FP
L5.
00.
291.
90.
203.
10.
314.
50.
160.
90.
103.
60.
18-0
.5-1
.0*
0.5*
100%
–199
% FP
L4.
40.
201.
60.
192.
80.
254.
50.
210.
80.
113.
60.
230.
1-0
.8*
0.8*
≥20
0% FP
Lb3.
60.
201.
10.
132.
50.
224.
20.
160.
70.
123.
50.
190.
6*-0
.4*
1.0*
Pove
rty s
tatu
s
<20
0% FP
L4.
60.
171.
70.
132.
90.
204.
50.
140.
90.
083.
60.
17-0
.1-0
.9*
0.7*
≥20
0% FP
Lb3.
60.
201.
10.
132.
50.
224.
20.
160.
70.
123.
50.
190.
6*-0
.4*
1.0*
Acce
ssib
le v
ersi
on a
t htt
ps://
ww
w.c
dc.g
ov/o
ralh
ealth
/pub
licat
ions
/OH
SR-2
019-
tabl
e-7.
htm
l
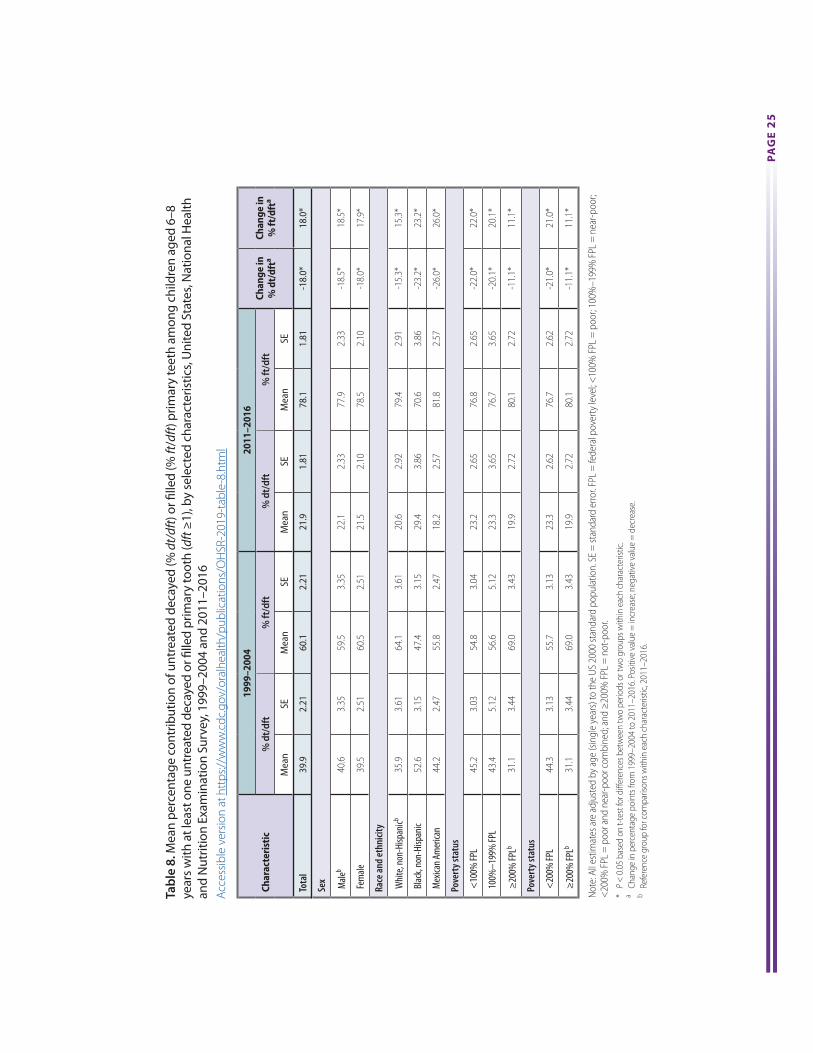
PA
GE
25
Tabl
e 8.
Mea
n pe
rcen
tage
con
trib
utio
n of
unt
reat
ed d
ecay
ed (%
dt/
dft)
or fi
lled
(% ft
/dft)
prim
ary
teet
h am
ong
child
ren
aged
6–8
ye
ars
with
at l
east
one
unt
reat
ed d
ecay
ed o
r fille
d pr
imar
y to
oth
(dft
≥1)
, by
sele
cted
cha
ract
eris
tics,
Uni
ted
Stat
es, N
atio
nal H
ealth
an
d N
utrit
ion
Exam
inat
ion
Surv
ey, 1
999–
2004
and
201
1–20
16Ac
cess
ible
ver
sion
at h
ttps
://w
ww
.cdc
.gov
/ora
lhea
lth/p
ublic
atio
ns/O
HSR
-201
9-ta
ble-
8.ht
ml
Tab
le 8
. Mea
n pe
rcen
tage
con
trib
utio
n of
unt
reat
ed d
ecay
ed (%
dt/
dft)
or fi
lled
(% ft
/dft
) prim
ary
teet
h am
ong
child
ren
aged
6–8
ye
ars
with
at l
east
one
unt
reat
ed d
ecay
ed o
r fille
d pr
imar
y to
oth
(dft
≥1)
, by
sele
cted
cha
ract
eris
tics,
Uni
ted
Stat
es, N
atio
nal H
ealth
an
d N
utrit
ion
Exam
inat
ion
Surv
ey, 1
999–
2004
and
201
1–20
16A
cces
sibl
e ve
rsio
n at
htt
ps://
ww
w.c
dc.g
ov/o
ralh
ealth
/pub
licat
ions
/OH
SR-2
019-
tabl
e-8.
htm
l
Not
e: A
ll es
timat
es a
re a
djus
ted
by a
ge (s
ingl
e ye
ars)
to th
e US
200
0 st
anda
rd p
opul
atio
n. S
E =
stan
dard
erro
r. FP
L =
fede
ral p
over
ty le
vel; <
100%
FPL
= p
oor;
100%
–199
% F
PL =
nea
r-poo
r; <
200%
FPL
= p
oor a
nd n
ear-p
oor c
ombi
ned;
and
≥20
0% F
PL =
not
-poo
r.
* P
< 0
.05
base
d on
t-te
st fo
r diff
eren
ces b
etw
een
two
perio
ds o
r tw
o gr
oups
with
in e
ach
char
acte
ristic
.a
Chan
ge in
per
cent
age
poin
ts fr
om 1
999–
2004
to 2
011–
2016
. Pos
itive
val
ue =
incr
ease
; neg
ativ
e va
lue
= d
ecre
ase.
b Re
fere
nce
grou
p fo
r com
paris
ons w
ithin
eac
h ch
arac
teris
tic, 2
011–
2016
.
Char
acte
rist
ic
1999
–200
420
11–2
016
Chan
ge in
%
dt/
dfta
Chan
ge in
%
ft/d
fta
% d
t/df
t%
ft/d
ft%
dt/
dft
% ft
/dft
Mea
nSE
Mea
nSE
Mea
nSE
Mea
nSE
Tota
l39
.92.
2160
.12.
2121
.91.
8178
.11.
81-1
8.0*
18.0
*
Sex Mal
eb40
.63.
3559
.53.
3522
.12.
3377
.92.
33-1
8.5*
18.5
*
Fem
ale
39.5
2.51
60.5
2.51
21.5
2.10
78.5
2.10
-18.
0*17
.9*
Race
and
eth
nicit
y
Whi
te, n
on-H
ispan
icb35
.93.
6164
.13.
6120
.62.
9279
.42.
91-1
5.3*
15.3
*
Blac
k, n
on-H
ispan
ic52
.63.
1547
.43.
1529
.43.
8670
.63.
86-2
3.2*
23.2
*
Mex
ican
Amer
ican
44.2
2.47
55.8
2.47
18.2
2.57
81.8
2.57
-26.
0*26
.0*
Pove
rty s
tatu
s
<10
0% FP
L45
.23.
0354
.83.
0423
.22.
6576
.82.
65-2
2.0*
22.0
*
100%
–199
% FP
L43
.45.
1256
.65.
1223
.33.
6576
.73.
65-2
0.1*
20.1
*
≥20
0% FP
Lb31
.13.
4469
.03.
4319
.92.
7280
.12.
72-1
1.1*
11.1
*
Pove
rty s
tatu
s
<20
0% FP
L44
.33.
1355
.73.
1323
.32.
6276
.72.
62-2
1.0*
21.0
*
≥20
0% FP
Lb31
.13.
4469
.03.
4319
.92.
7280
.12.
72-1
1.1*
11.1
*

PA
GE
26
Tabl
e 9.
Pre
vale
nce
of d
enta
l car
ies
in p
erm
anen
t tee
th (D
MFT
≥1)
a am
ong
child
ren
aged
6–1
1
year
s, b
y se
lect
ed c
hara
cter
istic
s, U
nite
d St
ates
, Nat
iona
l Hea
lth a
nd N
utrit
ion
Exam
inat
ion
Su
rvey
, 199
9–20
04 a
nd 2
011–
2016
Acce
ssib
le v
ersio
n at
htt
ps://
ww
w.c
dc.g
ov/o
ralh
ealth
/pub
licat
ions
/OH
SR-2
019-
tabl
e-9.
htm
l
Tabl
e 9.
Pre
vale
nce
of d
enta
l car
ies i
n pe
rman
ent t
eeth
(DM
FT ≥
1)a a
mon
g ch
ildre
n ag
ed 6
–11
ye
ars,
by se
lect
ed c
hara
cter
istic
s, U
nite
d St
ates
, Nat
iona
l Hea
lth a
nd N
utrit
ion
Exam
inat
ion
Su
rvey
, 199
9–20
04 a
nd 2
011–
2016
Acce
ssib
le v
ersi
on a
t htt
ps://
ww
w.c
dc.g
ov/o
ralh
ealth
/pub
licat
ions
/OH
SR-2
019-
tabl
e-9.
htm
l
Not
e: A
ll es
timat
es a
re a
djus
ted
by a
ge (s
ingl
e ye
ars)
to th
e US
200
0 st
anda
rd p
opul
atio
n. S
E =
stan
dard
erro
r. FP
L =
fede
ral p
over
ty le
vel;
<10
0% F
PL =
poo
r; 10
0%–1
99%
FPL
= n
ear-p
oor;
<20
0% F
PL =
poo
r and
nea
r-poo
r com
bine
d; a
nd ≥
200%
FPL
= n
ot-p
oor.
* P
< 0
.05
base
d on
t-te
st fo
r diff
eren
ces b
etw
een
two
perio
ds o
r tw
o gr
oups
with
in e
ach
char
acte
ristic
.a
Defi
ned
as h
avin
g on
e or
mor
e un
treat
ed d
ecay
ed, m
issin
g, o
r fille
d pe
rman
ent t
eeth
am
ong
child
ren
with
at l
east
one
per
man
ent t
ooth
.b C
hang
e in
per
cent
age
poin
ts fr
om 1
999–
2004
to 2
011–
2016
. Pos
itive
val
ue =
incr
ease
; neg
ativ
e va
lue
= d
ecre
ase.
c Re
fere
nce
grou
p fo
r com
paris
ons w
ithin
eac
h ch
arac
teris
tic, 2
011–
2016
.
Char
acte
rist
ic19
99–2
004
2011
–201
6Ch
ange
%b
%SE
%SE
Tota
l21
.20.
9317
.40.
94-3
.8*
Age
(yea
rs)
6–8c
10.4
1.07
9.6
0.91
-0.8
9–11
31
.41.
4824
.7*
1.32
-6.7
*
Sex Male
c19
.51.
2315
.61.
16-4
.0*
Fem
ale22
.91.
3119
.0*
1.33
-3.9
*
Race
and
eth
nicit
y
Whi
te, n
on-H
ispan
icc18
.81.
4413
.41.
14-5
.4*
Blac
k, no
n-Hi
span
ic19
.11.
5221
.6*
1.64
2.5
Mex
ican A
mer
ican
30.8
1.99
24.5
*2.
44-6
.4*
Pove
rty s
tatu
s
<10
0% FP
L28
.42.
2824
.6*
1.91
-3.8
100%
–199
% FP
L24
.12.
1419
.3*
1.67
-4.8
≥20
0% FP
Lc16
.51.
3712
.01.
10-4
.4*
Pove
rty s
tatu
s
<20
0% FP
L25
.91.
4922
.0*
1.34
-3.9
≥20
0% FP
Lc16
.51.
3712
.01.
10-4
.4*

PA
GE
27
Tabl
e 10
. Pre
vale
nce
of u
ntre
ated
toot
h de
cay
in p
erm
anen
t tee
th (D
T ≥
1)a a
mon
g ch
ildre
n ag
ed
6–11
yea
rs, b
y se
lect
ed c
hara
cter
istic
s, U
nite
d St
ates
, Nat
iona
l Hea
lth a
nd N
utrit
ion
Exam
inat
ion
Surv
ey, 1
999–
2004
and
201
1–20
16Ac
cess
ible
ver
sion
at h
ttps
://w
ww
.cdc
.gov
/ora
lhea
lth/p
ublic
atio
ns/O
HSR
-201
9-ta
ble-
10.h
tml
Tabl
e 10
. Pre
vale
nce
of u
ntre
ated
toot
h de
cay
in p
erm
anen
t tee
th (D
T ≥1
)a am
ong
child
ren
aged
6–
11 y
ears
, by
sele
cted
cha
ract
eris
tics,
Uni
ted
Stat
es, N
atio
nal H
ealth
and
Nut
ritio
n Ex
amin
atio
n Su
rvey
, 199
9–20
04 a
nd 2
011–
2016
Acce
ssib
le v
ersi
on a
t htt
ps://
ww
w.c
dc.g
ov/o
ralh
ealth
/pub
licat
ions
/OH
SR-2
019-
tabl
e-10
.htm
l
Not
e: A
ll es
timat
es a
re a
djus
ted
by a
ge (s
ingl
e ye
ars)
to th
e US
200
0 st
anda
rd p
opul
atio
n. S
E =
stan
dard
erro
r. FP
L =
fede
ral p
over
ty le
vel;
<10
0% F
PL =
poo
r; 10
0%–1
99%
FPL
= n
ear-p
oor;
<20
0% F
PL =
poo
r and
nea
r-poo
r com
bine
d; a
nd ≥
200%
FPL
= n
ot-p
oor.
0.0
= ze
ro
due
to ro
undi
ng.
* P
<0.
05 b
ased
on
t-tes
t for
diff
eren
ces b
etw
een
two
perio
ds o
r tw
o gr
oups
with
in e
ach
char
acte
ristic
.a
Defi
ned
as h
avin
g on
e or
mor
e un
treat
ed d
ecay
ed p
erm
anen
t tee
th a
mon
g ch
ildre
n w
ith a
t lea
st o
ne p
erm
anen
t too
th.
b Cha
nge
in p
erce
ntag
e po
ints
from
199
9–20
04 to
201
1–20
16. P
ositi
ve v
alue
= in
crea
se; n
egat
ive
valu
e =
dec
reas
e.c
Refe
renc
e gr
oup
for c
ompa
rison
s with
in e
ach
char
acte
ristic
, 201
1–20
16.
Char
acte
rist
ic19
99–2
004
2011
–201
6Ch
ange
%b
%SE
%SE
Tota
l7.
70.
855.
20.
44-2
.4*
Age
(yea
rs)
6–8c
4.1
0.73
2.7
0.43
-1.3
9–11
11
.11.
337.
6*0.
77-3
.5*
Sex Male
c7.
51.
024.
90.
53-2
.6*
Fem
ale7.
91.
135.
50.
61-2
.4
Race
and
eth
nicit
y
Whi
te, n
on-H
ispan
icc5.
61.
174.
30.
63-1
.3
Blac
k, no
n-Hi
span
ic8.
71.
017.
1*0.
81-1
.6
Mex
ican A
mer
ican
12.7
1.07
7.5*
1.14
-5.2
*
Pove
rty s
tatu
s
<10
0% FP
L11
.81.
748.
1*0.
81-3
.6
100%
–199
% FP
L11
.91.
955.
61.
06-6
.3*
≥20
0% FP
Lc3.
60.
663.
50.
540.
0
Pove
rty s
tatu
s
<20
0% FP
L11
.91.
386.
9*0.
71-5
.0*
≥20
0% FP
Lc3.
60.
663.
50.
540.
0
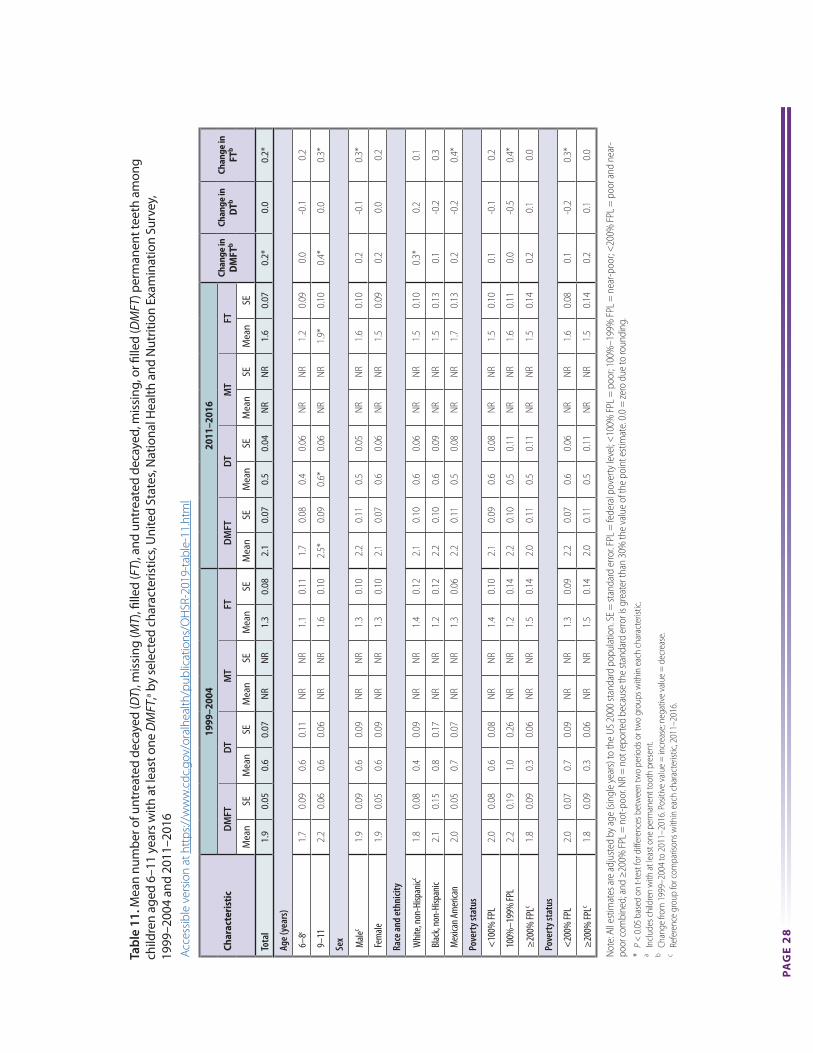
PA
GE
28
Tabl
e 11
. Mea
n nu
mbe
r of u
ntre
ated
dec
ayed
(DT)
, mis
sing
(MT)
, fille
d (F
T), a
nd u
ntre
ated
dec
ayed
, mis
sing
, or fi
lled
(DM
FT) p
erm
anen
t tee
th a
mon
g ch
ildre
n ag
ed 6
–11
year
s with
at l
east
one
DM
FT,a b
y se
lect
ed c
hara
cter
istic
s, U
nite
d St
ates
, Nat
iona
l Hea
lth a
nd N
utrit
ion
Exam
inat
ion
Surv
ey,
1999
–200
4 an
d 20
11–2
016
Not
e: A
ll es
timat
es a
re a
djus
ted
by a
ge (s
ingl
e ye
ars)
to th
e US
200
0 st
anda
rd p
opul
atio
n. S
E =
stan
dard
erro
r. FP
L =
fede
ral p
over
ty le
vel; <
100%
FPL
= p
oor;
100%
–199
% F
PL =
nea
r-poo
r; <
200%
FPL
= p
oor a
nd n
ear-
poor
com
bine
d; a
nd ≥
200%
FPL
= n
ot-p
oor.
NR
= n
ot re
porte
d be
caus
e th
e st
anda
rd e
rror i
s gre
ater
than
30%
the
valu
e of
the
poin
t est
imat
e. 0
.0 =
zero
due
to ro
undi
ng.
* P
< 0
.05
base
d on
t-te
st fo
r diff
eren
ces b
etw
een
two
perio
ds o
r tw
o gr
oups
with
in e
ach
char
acte
ristic
.a
Incl
udes
chi
ldre
n w
ith a
t lea
st o
ne p
erm
anen
t too
th p
rese
nt.
b Cha
nge
from
199
9–20
04 to
201
1–20
16. P
ositi
ve v
alue
= in
crea
se; n
egat
ive
valu
e =
dec
reas
e.c
Refe
renc
e gr
oup
for c
ompa
rison
s with
in e
ach
char
acte
ristic
, 201
1–20
16.
Char
acte
rist
ic
1999
–200
420
11–2
016
Chan
ge in
D
MFT
bCh
ange
in
DTb
Chan
ge in
FT
bD
MFT
DT
MT
FTD
MFT
DT
MT
FT
Mea
nSE
Mea
nSE
Mea
nSE
Mea
nSE
Mea
nSE
Mea
nSE
Mea
nSE
Mea
nSE
Tota
l1.
90.
050.
60.
07N
RN
R1.
30.
082.
10.
070.
50.
04N
RN
R1.
60.
070.
2*0.
00.
2*
Age
(yea
rs)
6–8c
1.7
0.09
0.6
0.11
NR
NR
1.1
0.11
1.7
0.08
0.4
0.06
NR
NR
1.2
0.09
0.0
-0.1
0.2
9–11
2.2
0.06
0.6
0.06
NR
NR
1.6
0.10
2.5*
0.09
0.6*
0.06
NR
NR
1.9*
0.10
0.4*
0.0
0.3*
Sex Male
c1.
90.
090.
60.
09N
RN
R1.
30.
102.
20.
110.
50.
05N
RN
R1.
60.
100.
2-0
.10.
3*
Fem
ale1.
90.
050.
60.
09N
RN
R1.
30.
102.
10.
070.
60.
06N
RN
R1.
50.
090.
20.
00.
2
Race
and
eth
nicit
y
Whi
te, n
on-H
ispan
icc1.
80.
080.
40.
09N
RN
R1.
40.
122.
10.
100.
60.
06N
RN
R1.
50.
100.
3*0.
20.
1
Blac
k, no
n-Hi
span
ic2.
10.
150.
80.
17N
RN
R1.
20.
122.
20.
100.
60.
09N
RN
R1.
50.
130.
1-0
.20.
3
Mex
ican A
mer
ican
2.0
0.05
0.7
0.07
NR
NR
1.3
0.06
2.2
0.11
0.5
0.08
NR
NR
1.7
0.13
0.2
-0.2
0.4*
Pove
rty s
tatu
s
<10
0% FP
L2.
00.
080.
60.
08N
RN
R1.
40.
102.
10.
090.
60.
08N
RN
R1.
50.
100.
1-0
.10.
2
100%
–199
% FP
L2.
20.
191.
00.
26N
RN
R1.
20.
142.
20.
100.
50.
11N
RN
R1.
60.
110.
0-0
.50.
4*
≥20
0% FP
Lc1.
80.
090.
30.
06N
RN
R1.
50.
142.
00.
110.
50.
11N
RN
R1.
50.
140.
20.
10.
0
Pove
rty s
tatu
s
<20
0% FP
L2.
00.
070.
70.
09N
RN
R1.
30.
092.
20.
070.
60.
06N
RN
R1.
60.
080.
1-0
.20.
3*
≥20
0% FP
Lc1.
80.
090.
30.
06N
RN
R1.
50.
142.
00.
110.
50.
11N
RN
R1.
50.
140.
20.
10.
0
Acc
essib
le v
ersio
n at
htt
ps://
ww
w.c
dc.g
ov/o
ralh
ealth
/pub
licat
ions
/OH
SR-2
019-
tabl
e-11
.htm
l
Tabl
e 11
. Mea
n nu
mbe
r of u
ntre
ated
dec
ayed
(DT)
, mis
sing
(MT)
, fille
d (F
T), a
nd u
ntre
ated
dec
ayed
, mis
sing
, or fi
lled
(DM
FT) p
erm
anen
t tee
th a
mon
g ch
ildre
n ag
ed 6
–11
year
s w
ith a
t lea
st o
ne D
MFT
,a by
sele
cted
cha
ract
eris
tics,
Uni
ted
Stat
es, N
atio
nal H
ealth
and
Nut
ritio
n Ex
amin
atio
n Su
rvey
, 19
99–2
004
and
2011
–201
6 A
cces
sible
ver
sion
at h
ttps
://w
ww
.cdc
.gov
/ora
lhea
lth/p
ublic
atio
ns/O
HSR
-201
9-ta
ble-
11.h
tml

PA
GE
29
Tabl
e 12
. Mea
n pe
rcen
tage
con
trib
utio
n of
unt
reat
ed d
ecay
ed (%
DT/
DM
FT) o
r fille
d (%
FT/
DM
FT) p
erm
anen
t tee
th a
mon
g ch
ildre
n ag
ed
6–11
yea
rs w
ith a
t lea
st o
ne u
ntre
ated
dec
ayed
, mis
sing
, or fi
lled
perm
anen
t too
th (D
MFT
≥1)
,a by
sele
cted
cha
ract
eris
tics,
Uni
ted
Stat
es,
Nat
iona
l Hea
lth a
nd N
utrit
ion
Exam
inat
ion
Surv
ey, 1
999–
2004
and
201
1–20
16
Acce
ssib
le v
ersio
n at
htt
ps://
ww
w.c
dc.g
ov/o
ralh
ealth
/pub
licat
ions
/OH
SR-2
019-
tabl
e-12
.htm
l
Tabl
e 12
. Mea
n pe
rcen
tage
con
trib
utio
n of
unt
reat
ed d
ecay
ed (%
DT/
DM
FT) o
r fille
d (%
FT/
DM
FT) p
erm
anen
t tee
th a
mon
g ch
ildre
n ag
ed 6
–11
year
s with
at l
east
one
unt
reat
ed d
ecay
ed, m
issi
ng, o
r fille
d pe
rman
ent t
ooth
(DM
FT ≥
1),a b
y se
lect
ed c
hara
cter
istic
s, U
nite
d St
ates
, Nat
iona
l Hea
lth a
nd N
utrit
ion
Exam
inat
ion
Surv
ey, 1
999–
2004
and
201
1–20
16
Not
e: A
ll es
timat
es a
re a
djus
ted
by a
ge (s
ingl
e ye
ars)
to th
e US
200
0 st
anda
rd p
opul
atio
n. S
E =
stan
dard
erro
r. FP
L =
fede
ral p
over
ty le
vel; <
100%
FPL
= p
oor;
100%
–199
% F
PL =
nea
r-poo
r;
<20
0% F
PL =
poo
r and
nea
r-poo
r com
bine
d; a
nd ≥
200%
FPL
= n
ot-p
oor.
* P
< 0
.05
base
d on
t-te
st fo
r diff
eren
ces b
etw
een
two
perio
ds o
r tw
o gr
oups
with
in e
ach
char
acte
ristic
.a
Incl
udes
chi
ldre
n w
ith a
t lea
st o
ne p
erm
anen
t too
th p
rese
nt.
b Cha
nge
in p
erce
ntag
e po
ints
from
199
9–20
04 to
201
1–20
16. P
ositi
ve v
alue
= in
crea
se; n
egat
ive
valu
e =
dec
reas
e.c
Refe
renc
e gr
oup
for c
ompa
rison
s with
in e
ach
char
acte
ristic
, 201
1–20
16.
Acce
ssib
le v
ersi
on a
t htt
ps://
ww
w.c
dc.g
ov/o
ralh
ealth
/pub
licat
ions
/OH
SR-2
019-
tabl
e-12
.htm
l
Char
acte
rist
ic
1999
–200
420
11–2
016
Chan
ge
in%
DT/
DM
FTb
Chan
ge
in
% F
T/D
MFT
b%
DT/
DM
FT%
FT/
DM
FT%
DT/
DM
FT%
FT/
DM
FT
Mea
nSE
Mea
nSE
Mea
nSE
Mea
nSE
Tota
l33
.14.
0665
.74.
0827
.92.
7470
.92.
74-5
.35.
1
Age
(yea
rs)
6–8c
36.4
6.52
61.9
6.57
29.8
4.82
68.3
4.86
-6.6
6.3
9–11
30
.03.
2569
.23.
2526
.02.
2973
.32.
29-4
.04.
0
Sex Male
c37
.05.
4561
.95.
4525
.63.
1973
.03.
18-1
1.4
11.1
Fem
ale29
.84.
5768
.94.
5930
.53.
4468
.33.
410.
7-0
.8
Race
and
eth
nicit
y
Whi
te, n
on-H
ispan
icc26
.86.
1571
.46.
2426
.13.
0772
.82.
88-0
.71.
2
Blac
k, no
n-Hi
span
ic42
.55.
6856
.15.
8433
.54.
0564
.94.
19-9
.09.
1
Mex
ican A
mer
ican
39.4
3.83
60.1
3.85
29.3
4.63
70.5
4.63
-10.
110
.2
Pove
rty s
tatu
s
<10
0% FP
L36
.94.
7962
.04.
7631
.13.
7767
.03.
96-5
.74.
9
100%
–199
% FP
L45
.78.
3553
.68.
2621
.73.
6376
.53.
45-2
4.0*
23.0
*
≥20
0% FP
Lc20
.13.
8178
.13.
8926
.55.
7073
.25.
826.
4-5
.3
Pove
rty s
tatu
s
<20
0% FP
L41
.44.
4557
.74.
4729
.33.
3669
.03.
32-1
2.2*
11.3
*
≥20
0% FP
Lc20
.13.
8178
.13.
8926
.55.
7073
.25.
826.
4-5
.3

PA
GE
30
Tabl
e 13
. Mea
n nu
mbe
r of u
ntre
ated
dec
ayed
, mis
sing
, or fi
lled
(DM
FT) p
erm
anen
t tee
th b
y to
oth
type
am
ong
child
ren
aged
6–1
1 ye
ars
with
at l
east
one
DM
FT,a b
y se
lect
ed
char
acte
ristic
s, U
nite
d St
ates
, Nat
iona
l Hea
lth a
nd N
utrit
ion
Exam
inat
ion
Surv
ey, 1
999–
2004
and
201
1–20
16Ac
cess
ible
ver
sion
at h
ttps
://w
ww
.cdc
.gov
/ora
lhea
lth/p
ublic
atio
ns/O
HSR
-201
9-ta
ble-
13.h
tml
Not
e: A
ll es
timat
es a
re a
djus
ted
by a
ge (s
ingl
e ye
ars)
to th
e US
200
0 st
anda
rd p
opul
atio
n. S
E =
stan
dard
erro
r. FP
L =
fede
ral p
over
ty le
vel; <
100%
FPL
= p
oor;
100%
–199
% F
PL =
nea
r-poo
r; <
200%
FPL
= p
oor a
nd n
ear-p
oor c
ombi
ned;
and
≥
200%
FPL
= n
ot-p
oor.
NR
= n
ot re
porte
d be
caus
e th
e st
anda
rd e
rror i
s gre
ater
than
30%
the
valu
e of
the
poin
t est
imat
e. 0
.0 =
zero
due
to ro
undi
ng.
* P
<0.
05 b
ased
on
t-tes
t for
diff
eren
ces b
etw
een
two
perio
ds o
r tw
o gr
oups
with
in e
ach
char
acte
ristic
.a
Incl
udes
chi
ldre
n w
ith a
t lea
st o
ne p
erm
anen
t too
th p
rese
nt.
b Cha
nge
from
199
9–20
04 to
201
1–20
16. P
ositi
ve v
alue
= in
crea
se; n
egat
ive
valu
e =
dec
reas
e.c
Refe
renc
e gr
oup
for c
ompa
rison
s with
in e
ach
char
acte
ristic
, 201
1–20
16.
Tabl
e 13
. Mea
n nu
mbe
r of u
ntre
ated
dec
ayed
, miss
ing,
or fi
lled
(DM
FT) p
erm
anen
t tee
th b
y to
oth
type
am
ong
child
ren
aged
6–1
1 ye
ars w
ith a
t lea
st o
ne D
MFT
,a by
sele
cted
ch
arac
teris
tics,
Uni
ted
Stat
es, N
atio
nal H
ealth
and
Nut
ritio
n Ex
amin
atio
n Su
rvey
, 199
9–20
04 a
nd 2
011–
2016
Acce
ssib
le v
ersi
on a
t htt
ps://
ww
w.c
dc.g
ov/o
ralh
ealth
/pub
licat
ions
/OH
SR-2
019-
tabl
e-12
.htm
l
Char
acte
rist
ic
1999
–200
420
11–2
016
Prem
olar
Ch
ange
b
Firs
t M
olar
Ch
ange
b
Seco
nd
Mol
ar
Chan
geb
All
Mol
ar
Chan
geb
Ante
riors
Prem
olar
sFi
rst M
olar
sSe
cond
Mol
ars
All M
olar
sAn
terio
rsPr
emol
ars
Firs
t Mol
ars
Seco
nd M
olar
sAl
l Mol
ars
Mea
nSE
Mea
nSE
Mea
nSE
Mea
nSE
Mea
nSE
Mea
nSE
Mea
nSE
Mea
nSE
Mea
nSE
Mea
nSE
Tota
lN
RN
RN
RN
R1.
80.
060.
00.
011.
90.
060.
10.
020.
10.
011.
90.
080.
00.
011.
90.
08N
R0.
00.
00.
0
Age
(yea
rs)
6–8c
NR
NR
NR
NR
1.6
0.10
NR
NR
1.6
0.10
NR
NR
NR
NR
1.5
0.08
NR
NR
1.5
0.08
NR
-0.1
NR
-0.1
9–11
N
RN
R0.
10.
012.
00.
060.
10.
022.
10.
060.
10.
030.
10.
022.
2*0.
110.
10.
022.
3*0.
120.
00.
20.
00.
2
Sex Male
cN
RN
R0.
00.
011.
80.
09N
RN
R1.
80.
09N
RN
R0.
00.
011.
80.
100.
00.
011.
90.
10.
00.
0N
R0.
0
Fem
aleN
RN
RN
RN
R1.
80.
06N
RN
R1.
90.
06N
RN
R0.
10.
021.
90.
09N
RN
R1.
90.
09N
R0.
0N
R0.
1
Race
and
eth
nicit
y
Whi
te, n
on-H
ispan
iccN
RN
RN
RN
R1.
70.
09N
RN
R1.
80.
09N
RN
RN
RN
R1.
80.
13N
RN
R1.
90.
13N
R0.
1N
R0.
1
Blac
k, no
n-Hi
span
icN
RN
R0.
10.
021.
90.
15N
RN
R1.
90.
16N
RN
RN
RN
R2.
00.
11N
RN
R2.
10.
11N
R0.
2N
R0.
1
Mex
ican A
mer
ican
NR
NR
0.0
0.01
1.9
0.05
NR
NR
1.9
0.05
NR
NR
NR
NR
2.0
0.09
NR
NR
2.1
0.1
NR
0.1
NR
0.1
Pove
rty s
tatu
s
<10
0% FP
LN
RN
RN
RN
R1.
90.
08N
RN
R2.
00.
08N
RN
R0.
10.
021.
90.
09N
RN
R1.
90.
09N
R0.
0N
R0.
0
100%
–199
% FP
LN
RN
RN
RN
R2.
10.
19N
RN
R2.
10.
19N
RN
RN
RN
R1.
90.
10N
RN
R2.
00.
11N
R-0
.2N
R-0
.2
≥20
0% FP
LcN
RN
RN
RN
R1.
70.
10N
RN
R1.
80.
10N
RN
RN
RN
R1.
80.
14N
RN
R1.
80.
14N
R0.
0N
R0.
0
Pove
rty s
tatu
s
<20
0% FP
LN
RN
R0.
00.
011.
90.
070.
00.
012.
00.
070.
00.
010.
10.
021.
90.
080.
00.
011.
90.
080.
00.
00.
00.
0
≥20
0% FP
LcN
RN
RN
RN
R1.
70.
10N
RN
R1.
80.
10N
RN
RN
RN
R1.
80.
14N
RN
R1.
80.
14N
R0.
0N
R0.
0

PA
GE
31
Tabl
e 14
. Pre
vale
nce
of d
enta
l car
ies
in p
erm
anen
t tee
th (D
MFT
≥1)
a am
ong
adol
esce
nts
aged
12
–19
year
s, b
y se
lect
ed c
hara
cter
istic
s, U
nite
d St
ates
, Nat
iona
l Hea
lth a
nd N
utrit
ion
Ex
amin
atio
n Su
rvey
, 199
9–20
04 a
nd 2
011–
2016
Acce
ssib
le v
ersio
n at
htt
ps://
ww
w.c
dc.g
ov/o
ralh
ealth
/pub
licat
ions
/OH
SR-2
019-
tabl
e-14
.htm
l
Tabl
e 14
. Pre
vale
nce
of d
enta
l car
ies i
n pe
rman
ent t
eeth
(DM
FT ≥
1)a a
mon
g ad
oles
cent
s age
d 12
–19
year
s, by
sele
cted
cha
ract
eris
tics,
Uni
ted
Stat
es, N
atio
nal H
ealth
and
Nut
ritio
n
Exam
inat
ion
Surv
ey, 1
999–
2004
and
201
1–20
16Ac
cess
ible
ver
sion
at h
ttps
://w
ww
.cdc
.gov
/ora
lhea
lth/p
ublic
atio
ns/O
HSR
-201
9-ta
ble-
14.h
tml
Not
e: A
ll es
timat
es a
re a
djus
ted
by a
ge (s
ingl
e ye
ars)
to th
e US
200
0 st
anda
rd p
opul
atio
n. S
E =
stan
dard
erro
r. FP
L =
fede
ral p
over
ty le
vel;
<10
0% F
PL =
poo
r; 10
0%–1
99%
FPL
= n
ear-p
oor;
<20
0% F
PL =
poo
r and
nea
r-poo
r com
bine
d; a
nd ≥
200%
FPL
= n
ot-p
oor.
0.0
= ze
ro
due
to ro
undi
ng.
* P
< 0
.05
base
d on
t-te
st fo
r diff
eren
ces b
etw
een
two
perio
ds o
r tw
o gr
oups
with
in e
ach
char
acte
ristic
.a
Defi
ned
as h
avin
g on
e or
mor
e un
treat
ed d
ecay
ed, m
issin
g, o
r fille
d pe
rman
ent t
eeth
am
ong
adol
esce
nts w
ith a
t lea
st o
ne p
erm
anen
t too
th.
b Cha
nge
in p
erce
ntag
e po
ints
from
199
9–20
04 to
201
1–20
16. P
ositi
ve v
alue
= in
crea
se; n
egat
ive
valu
e =
dec
reas
e.c
Refe
renc
e gr
oup
for c
ompa
rison
s with
in e
ach
char
acte
ristic
, 201
1–20
16.
Char
acte
rist
ic19
99–2
004
2011
–201
6Ch
ange
%b
%SE
%SE
Tota
l59
.40.
9556
.81.
18-2
.6
Age
(yea
rs)
12–1
5c50
.91.
1747
.61.
67-3
.3
16–1
9 67
.91.
3765
.9*
1.45
-1.9
Sex Male
c55
.91.
2455
.91.
480.
0
Fem
ale63
.11.
2657
.71.
51-5
.5*
Race
and
eth
nicit
y
Whi
te, n
on-H
ispan
icc57
.91.
5754
.31.
63-3
.6
Blac
k, no
n-Hi
span
ic55
.01.
6557
.12.
012.
1
Mex
ican A
mer
ican
65.0
1.44
68.9
*2.
553.
9
Pove
rty s
tatu
s
<10
0% FP
L65
.81.
3864
.9*
2.13
-1.0
100%
–199
% FP
L64
.91.
5065
.3*
1.93
0.4
≥20
0% FP
Lc54
.21.
4948
.71.
72-5
.5*
Pove
rty s
tatu
s
<20
0% FP
L65
.20.
9665
.0*
1.38
-0.2
≥20
0% FP
Lc54
.21.
4948
.71.
72-5
.5*

PA
GE
32
Tabl
e 15
. Pre
vale
nce
of u
ntre
ated
toot
h de
cay
in p
erm
anen
t tee
th (D
T ≥
1)a a
mon
g ad
oles
cent
s ag
ed 1
2–19
yea
rs, b
y se
lect
ed c
hara
cter
istic
s, U
nite
d St
ates
, Nat
iona
l Hea
lth a
nd N
utrit
ion
Ex
amin
atio
n Su
rvey
, 199
9–20
04 a
nd 2
011–
2016
Acce
ssib
le v
ersio
n at
htt
ps://
ww
w.c
dc.g
ov/o
ralh
ealth
/pub
licat
ions
/OH
SR-2
019-
tabl
e-15
.htm
l
Tabl
e 15
. Pre
vale
nce
of u
ntre
ated
toot
h de
cay
in p
erm
anen
t tee
th (D
T ≥1
)a am
ong
adol
esce
nts
aged
12–
19 y
ears
, by
sele
cted
cha
ract
eris
tics,
Uni
ted
Stat
es, N
atio
nal H
ealth
and
Nut
ritio
n
Exam
inat
ion
Surv
ey, 1
999–
2004
and
201
1–20
16Ac
cess
ible
ver
sion
at h
ttps
://w
ww
.cdc
.gov
/ora
lhea
lth/p
ublic
atio
ns/O
HSR
-201
9-ta
ble-
15.h
tml
Not
e: A
ll es
timat
es a
re a
djus
ted
by a
ge (s
ingl
e ye
ars)
to th
e US
200
0 st
anda
rd p
opul
atio
n. S
E =
stan
dard
erro
r. FP
L =
fede
ral p
over
ty le
vel;
<10
0% F
PL =
poo
r; 10
0%–1
99%
FPL
= n
ear-p
oor;
<20
0% F
PL =
poo
r and
nea
r-poo
r com
bine
d; a
nd ≥
200%
FPL
= n
ot-p
oor.
* P
< 0
.05
base
d on
t-te
st fo
r diff
eren
ces b
etw
een
two
perio
ds o
r tw
o gr
oups
with
in e
ach
char
acte
ristic
.a
Defi
ned
as h
avin
g on
e or
mor
e un
treat
ed d
ecay
ed p
erm
anen
t tee
th a
mon
g ad
oles
cent
s with
at l
east
one
per
man
ent t
ooth
.b C
hang
e in
per
cent
age
poin
ts fr
om 1
999–
2004
to 2
011–
2016
. Pos
itive
val
ue =
incr
ease
; neg
ativ
e va
lue
= d
ecre
ase.
c Re
fere
nce
grou
p fo
r com
paris
ons w
ithin
eac
h ch
arac
teris
tic, 2
011–
2016
.
Char
acte
rist
ic19
99–2
004
2011
–201
6Ch
ange
%b
%SE
%SE
Tota
l19
.61.
0516
.60.
99-3
.0*
Age
(yea
rs)
12–1
5c16
.90.
9812
.70.
93-4
.2*
16–1
9 22
.21.
4520
.4*
1.43
-1.8
Sex Male
c19
.91.
2217
.71.
25-2
.2
Fem
ale19
.31.
3015
.41.
37-3
.9*
Race
and
eth
nicit
y
Whi
te, n
on-H
ispan
icc15
.91.
4615
.61.
45-0
.3
Blac
k, no
n-Hi
span
ic25
.71.
4120
.4*
1.88
-5.3
*
Mex
ican A
mer
ican
28.6
1.54
20.8
*1.
85-7
.8*
Pove
rty s
tatu
s
<10
0% FP
L27
.21.
9922
.7*
1.55
-4.5
100%
–199
% FP
L27
.01.
8220
.9*
1.76
-6.2
*
≥20
0% FP
Lc12
.91.
3311
.11.
30-1
.7
Pove
rty s
tatu
s
<20
0% FP
L26
.91.
5221
.6*
1.19
-5.3
*
≥20
0% FP
Lc12
.91.
3311
.11.
30-1
.7

PA
GE
33
Tabl
e 16
. Mea
n nu
mbe
r of u
ntre
ated
dec
ayed
(DT)
, mis
sing
(MT)
, fille
d (F
T), a
nd u
ntre
ated
dec
ayed
, mis
sing
, or fi
lled
(DM
FT) p
erm
anen
t tee
th a
mon
g
adol
esce
nts
aged
12–
19 y
ears
with
at l
east
one
DM
FT,a b
y se
lect
ed c
hara
cter
istic
s, U
nite
d St
ates
, Nat
iona
l Hea
lth a
nd N
utrit
ion
Exam
inat
ion
Surv
ey,
1999
–200
4 an
d 20
11–2
016
Acce
ssib
le v
ersio
n at
htt
ps://
ww
w.c
dc.g
ov/o
ralh
ealth
/pub
licat
ions
/OH
SR-2
019-
tabl
e-16
.htm
l
Not
e: A
ll es
timat
es a
re a
djus
ted
by a
ge (s
ingl
e ye
ars)
to th
e US
200
0 st
anda
rd p
opul
atio
n. S
E =
stan
dard
erro
r. FP
L =
fede
ral p
over
ty le
vel; <
100%
FPL
= p
oor;
100%
–199
% F
PL =
nea
r-poo
r; <
200%
FPL
= p
oor a
nd n
ear-p
oor
com
bine
d; a
nd ≥
200%
FPL
= n
ot-p
oor.
0.0
= ze
ro d
ue to
roun
ding
.
* P
< 0
.05
base
d on
t-te
st fo
r diff
eren
ces b
etw
een
two
perio
ds o
r tw
o gr
oups
with
in e
ach
char
acte
ristic
.a
Incl
udes
ado
lesc
ents
with
at l
east
one
per
man
ent t
ooth
pre
sent
.b C
hang
e fro
m 1
999–
2004
to 2
011–
2016
. Pos
itive
val
ue =
incr
ease
; neg
ativ
e va
lue
= d
ecre
ase.
c Re
fere
nce
grou
p fo
r com
paris
ons w
ithin
eac
h ch
arac
teris
tic, 2
011–
2016
.
Tabl
e 16
. Mea
n nu
mbe
r of u
ntre
ated
dec
ayed
(DT)
, mis
sing
(MT)
, fille
d (F
T), a
nd u
ntre
ated
dec
ayed
, mis
sing
, or fi
lled
(DM
FT) p
erm
anen
t tee
th a
mon
g
adol
esce
nts a
ged
12–1
9 ye
ars w
ith a
t lea
st o
ne D
MFT
,a by
sele
cted
cha
ract
eris
tics,
Uni
ted
Stat
es, N
atio
nal H
ealth
and
Nut
ritio
n Ex
amin
atio
n Su
rvey
, 19
99–2
004
and
2011
–201
6 A
cces
sibl
e ve
rsio
n at
htt
ps://
ww
w.c
dc.g
ov/o
ralh
ealth
/pub
licat
ions
/OH
SR-2
019-
tabl
e-16
.htm
l
Char
acte
rist
ic
1999
–200
420
11–2
016
Chan
gein
DM
FTb
Chan
gein DTb
Chan
gein FT
b D
MFT
DT
MT
FTD
MFT
DT
MT
FT
Mea
nSE
Mea
nSE
Mea
nSE
Mea
nSE
Mea
nSE
Mea
nSE
Mea
nSE
Mea
nSE
Tota
l4.
10.
080.
80.
060.
10.
013.
30.
104.
30.
100.
70.
050.
10.
023.
40.
110.
1-0
.10.
2
Age
(yea
rs)
12–1
5c 3.
40.
110.
70.
060.
10.
012.
70.
143.
60.
120.
60.
060.
10.
022.
90.
130.
1-0
.10.
2
16–1
9 4.
80.
110.
80.
080.
10.
023.
90.
114.
9*0.
140.
8*0.
060.
10.
024.
0*0.
140.
10.
00.
1
Sex Male
c4.
00.
110.
90.
090.
10.
023.
00.
104.
10.
110.
80.
080.
10.
023.
20.
130.
1-0
.10.
2
Fem
ale4.
30.
100.
70.
060.
10.
013.
50.
134.
40.
150.
60.
060.
10.
023.
7*0.
140.
10.
00.
2
Race
and
eth
nicit
y
Whi
te, n
on-H
ispan
icc4.
20.
120.
70.
100.
10.
023.
40.
144.
10.
140.
70.
080.
10.
033.
30.
15-0
.10.
0-0
.1
Blac
k, no
n-Hi
span
ic3.
90.
101.
00.
080.
20.
022.
80.
144.
50.
190.
90.
130.
10.
023.
50.
200.
6*-0
.10.
7*
Mex
ican A
mer
ican
4.3
0.13
1.0
0.07
0.1
0.01
3.2
0.15
4.6*
0.15
0.8
0.08
0.0*
0.01
3.7
0.16
0.3
-0.2
0.5*
Pove
rty s
tatu
s
<10
0% FP
L4.
30.
171.
00.
100.
10.
023.
20.
214.
8*0.
181.
0*0.
090.
20.
043.
70.
160.
5*0.
00.
4
100%
–199
% FP
L4.
20.
151.
10.
130.
10.
023.
00.
134.
4*0.
150.
8*0.
080.
10.
013.
50.
150.
2-0
.30.
5*
≥20
0% FP
Lc4.
00.
130.
50.
070.
10.
013.
40.
123.
90.
170.
50.
080.
10.
023.
40.
180.
00.
0-0
.1
Pove
rty s
tatu
s
<20
0% FP
L4.
30.
121.
00.
090.
10.
023.
10.
134.
6*0.
120.
9*0.
050.
10.
023.
60.
110.
3-0
.10.
4*
≥20
0% FP
Lc4.
00.
130.
50.
070.
10.
013.
40.
123.
90.
170.
50.
080.
10.
023.
40.
180.
00.
0-0
.1

PA
GE
34
Tabl
e 17
. Mea
n pe
rcen
tage
con
trib
utio
n of
unt
reat
ed d
ecay
ed (%
DT/
DM
FT) o
r fille
d (%
FT/
DM
FT) p
erm
anen
t tee
th a
mon
g ad
oles
cent
s ag
ed 1
2–19
yea
rs w
ith a
t lea
st o
ne u
ntre
ated
dec
ayed
, mis
sing
, or fi
lled
perm
anen
t too
th (D
MFT
≥1)
,a by
sele
cted
cha
ract
eris
tics,
Uni
ted
Stat
es, N
atio
nal H
ealth
and
Nut
ritio
n Ex
amin
atio
n Su
rvey
, 199
9–20
04 a
nd 2
011–
2016
Acce
ssib
le v
ersio
n at
htt
ps://
ww
w.c
dc.g
ov/o
ralh
ealth
/pub
licat
ions
/OH
SR-2
019-
tabl
e-17
.htm
l
Tabl
e 17
. Mea
n pe
rcen
tage
con
trib
utio
n of
unt
reat
ed d
ecay
ed (%
DT/
DM
FT) o
r fille
d (%
FT/
DM
FT) p
erm
anen
t tee
th a
mon
g ad
oles
cent
s age
d 12
–19
year
s with
at l
east
one
unt
reat
ed d
ecay
ed, m
issi
ng, o
r fille
d pe
rman
ent t
ooth
(DM
FT ≥
1),a b
y se
lect
ed
char
acte
ristic
s, U
nite
d St
ates
, Nat
iona
l Hea
lth a
nd N
utrit
ion
Exam
inat
ion
Surv
ey, 1
999–
2004
and
201
1–20
16Ac
cess
ible
ver
sion
at h
ttps
://w
ww
.cdc
.gov
/ora
lhea
lth/p
ublic
atio
ns/O
HSR
-201
9-ta
ble-
17.h
tml
Not
e: A
ll es
timat
es a
re a
djus
ted
by a
ge (s
ingl
e ye
ars)
to th
e US
200
0 st
anda
rd p
opul
atio
n. S
E =
stan
dard
erro
r. FP
L =
fede
ral p
over
ty le
vel; <
100%
FPL
= p
oor;
100%
–199
% F
PL =
nea
r-poo
r; <
200%
FPL
= p
oor a
nd n
ear-p
oor c
ombi
ned;
and
≥20
0% F
PL =
not
-poo
r.
* P
< 0
.05
base
d on
t-te
st fo
r diff
eren
ces b
etw
een
two
perio
ds o
r tw
o gr
oups
with
in e
ach
char
acte
ristic
.a
Incl
udes
ado
lesc
ents
with
at l
east
one
per
man
ent t
ooth
pre
sent
.b C
hang
e in
per
cent
age
poin
ts fr
om 1
999–
2004
to 2
011–
2016
. Pos
itive
val
ue =
incr
ease
; neg
ativ
e va
lue
= d
ecre
ase.
c Re
fere
nce
grou
p fo
r com
paris
ons w
ithin
eac
h ch
arac
teris
tic, 2
011–
2016
.
Char
acte
rist
ic
1999
–200
420
11–2
016
Chan
ge in
%
DT/
DM
FTb
Chan
ge in
%
FT/
DM
FTb
% D
T/D
MFT
% F
T/D
MFT
% D
T/D
MFT
% F
T/D
MFT
Mea
nSE
Mea
nSE
Mea
nSE
Mea
nSE
Tota
l22
.11.
2975
.61.
4419
.31.
1678
.11.
20-2
.82.
6
Age
(yea
rs)
12–1
5c24
.21.
7674
.01.
9419
.61.
4477
.61.
46-4
.6*
3.6
16–1
920
.01.
3677
.11.
4518
.91.
3978
.71.
45-1
.01.
6
Sex Mal
ec24
.61.
4773
.21.
5821
.51.
4476
.01.
61-3
.12.
8
Fem
ale
19.9
1.51
77.7
1.70
17.0
*1.
5680
.4*
1.55
-2.8
2.6
Race
and
eth
nicit
y
Whi
te, n
on-H
ispan
icc
17.6
1.96
80.6
2.20
18.5
1.59
78.5
1.67
0.8
-2.1
Blac
k, n
on-H
ispa
nic
32.1
1.82
64.0
2.07
23.5
2.96
73.3
3.05
-8.6
*9.
3*
Mex
ican
Am
eric
an30
.22.
0667
.32.
0620
.51.
8478
.31.
87-9
.7*
11.0
*
Pove
rty s
tatu
s
<10
0% F
PL29
.82.
1867
.42.
1822
.4*
1.87
74.5
*1.
73-7
.4*
7.1*
100%
–199
% F
PL27
.42.
2269
.62.
4821
.9*
2.00
76.2
*2.
07-5
.56.
6*
≥20
0% F
PLc
15.1
1.54
83.5
1.66
14.9
1.87
82.3
1.99
-0.2
-1.2
Pove
rty s
tatu
s
<20
0% F
PL28
.61.
6868
.51.
7622
.1*
1.24
75.4
*1.
22-6
.4*
6.9*
≥20
0% F
PLc
15.1
1.54
83.5
1.66
14.9
1.87
82.3
1.99
-0.2
-1.2

PA
GE
35
Tabl
e 18
. Mea
n nu
mbe
r of u
ntre
ated
dec
ayed
, mis
sing
, or fi
lled
perm
anen
t tee
th (D
MFT
) by
toot
h ty
pe a
mon
g ad
oles
cent
s ag
ed 1
2–19
yea
rs w
ith a
t lea
st o
ne D
MFT
,a by
sele
cted
ch
arac
teris
tics,
Uni
ted
Stat
es, N
atio
nal H
ealth
and
Nut
ritio
n Ex
amin
atio
n Su
rvey
, 199
9–20
04 a
nd 2
011–
2016
Acce
ssib
le v
ersio
n at
htt
ps://
ww
w.c
dc.g
ov/o
ralh
ealth
/pub
licat
ions
/OH
SR-2
019-
tabl
e-18
.htm
l
Tabl
e 18
. Mea
n nu
mbe
r of u
ntre
ated
dec
ayed
, miss
ing,
or fi
lled
perm
anen
t tee
th (D
MFT
) by
toot
h ty
pe a
mon
g ad
oles
cent
s age
d 12
–19
year
s with
at l
east
one
DM
FT,a b
y se
lect
ed
char
acte
ristic
s, U
nite
d St
ates
, Nat
iona
l Hea
lth a
nd N
utrit
ion
Exam
inat
ion
Surv
ey, 1
999–
2004
and
201
1–20
16Ac
cess
ible
ver
sion
at h
ttps
://w
ww
.cdc
.gov
/ora
lhea
lth/p
ublic
atio
ns/O
HSR
-201
9-ta
ble-
18.h
tml
Not
e: A
ll es
timat
es a
re a
djus
ted
by a
ge (s
ingl
e ye
ars)
to th
e US
200
0 st
anda
rd p
opul
atio
n. S
E =
stan
dard
erro
r. FP
L =
fede
ral p
over
ty le
vel; <
100%
FPL
= p
oor;
100%
–199
% F
PL =
nea
r-poo
r; <
200%
FPL
= p
oor a
nd n
ear-p
oor c
ombi
ned;
an
d ≥
200%
FPL
= n
ot-p
oor.
NR
= n
ot re
porte
d be
caus
e th
e st
anda
rd e
rror i
s gre
ater
than
30%
the
valu
e of
the
poin
t est
imat
e. 0
.0 =
zero
due
to ro
undi
ng.
* P
< 0
.05
base
d on
t-te
st fo
r diff
eren
ces b
etw
een
two
perio
ds o
r tw
o gr
oups
with
in e
ach
char
acte
ristic
.a
Incl
udes
ado
lesc
ents
with
at l
east
one
per
man
ent t
ooth
pre
sent
.b
Chan
ge fr
om 1
999–
2004
to 2
011–
2016
. Pos
itive
val
ue =
incr
ease
; neg
ativ
e va
lue
= d
ecre
ase.
c Re
fere
nce
grou
p fo
r com
paris
ons w
ithin
eac
h ch
arac
teris
tic, 2
011–
2016
.
Char
acte
rist
ic
1999
–200
420
11–2
016
Ante
rior
Chan
geb
Prem
olar
Ch
ange
b
Firs
t M
olar
Ch
ange
b
Seco
nd
Mol
ar
Chan
geb
All
Mol
ar
Chan
geb
Ante
riors
Prem
olar
sFi
rst M
olar
sSe
cond
Mol
ars
All M
olar
sAn
terio
rsPr
emol
ars
Firs
t Mol
ars
Seco
nd M
olar
sAl
l Mol
ars
Mea
nSE
Mea
nSE
Mea
nSE
Mea
nSE
Mea
nSE
Mea
nSE
Mea
nSE
Mea
nSE
Mea
nSE
Mea
nSE
Tota
l0.
20.
020.
50.
042.
20.
041.
20.
033.
40.
050.
20.
030.
60.
052.
20.
071.
20.
043.
40.
100.
00.
1-0
.10.
00.
0
Age
(yea
rs)
12–1
5c0.
20.
020.
30.
062.
20.
050.
80.
032.
90.
070.
10.
030.
40.
062.
10.
090.
80.
072.
90.
130.
00.
1-0
.10.
00.
0
16–1
9 0.
30.
030.
70.
042.
30.
041.
60.
043.
90.
080.
3*0.
030.
8*0.
082.
30.
071.
6*0.
063.
8*0.
100.
00.
1-0
.10.
00.
0
Sex Male
c0.
30.
030.
50.
052.
20.
041.
10.
043.
30.
070.
20.
040.
60.
062.
10.
081.
20.
043.
30.
100.
00.
1-0
.10.
10.
0
Fem
ale0.
20.
020.
60.
052.
30.
041.
20.
043.
50.
070.
1*0.
030.
70.
082.
3*0.
081.
30.
083.
50.
140.
00.
10.
00.
00.
0
Race
and
eth
nicit
y
Whi
te, n
on-H
ispan
icc0.
20.
030.
50.
052.
20.
051.
20.
043.
40.
080.
20.
040.
50.
072.
10.
091.
20.
063.
30.
130.
00.
0-0
.20.
0-0
.1
Blac
k, no
n-Hi
span
ic0.
10.
010.
50.
052.
20.
051.
00.
043.
30.
07N
RN
R0.
8*0.
102.
4*0.
091.
10.
063.
50.
120.
00.
2*0.
10.
00.
2
Mex
ican A
mer
ican
0.2
0.02
0.5
0.05
2.4
0.05
1.1
0.04
3.5
0.08
0.2
0.04
0.8*
0.10
2.3*
0.09
1.2
0.08
3.5
0.15
0.0
0.2*
-0.1
0.1
0.0
Pove
rty s
tatu
s
<10
0% FP
L0.
20.
030.
60.
102.
30.
061.
10.
043.
50.
080.
30.
060.
9*0.
092.
4*0.
091.
30.
073.
7*0.
130.
00.
20.
10.
2*0.
3
100%
–199
% FP
L0.
30.
050.
50.
052.
40.
051.
10.
073.
50.
100.
20.
050.
50.
072.
20.
091.
30.
063.
50.
130.
00.
0-0
.20.
20.
0
≥20
0% FP
Lc0.
20.
020.
50.
042.
10.
061.
20.
053.
30.
100.
10.
040.
50.
092.
10.
101.
20.
083.
30.
160.
00.
10.
00.
0-0
.1
Pove
rty s
tatu
s
<20
0% FP
L0.
20.
030.
60.
062.
30.
041.
10.
043.
50.
070.
20.
040.
70.
062.
30.
061.
30.
043.
60.
080.
00.
1-0
.10.
2*0.
1
≥20
0% FP
Lc0.
20.
020.
50.
042.
10.
061.
20.
053.
30.
100.
10.
040.
50.
092.
10.
101.
20.
083.
30.
160.
00.
10.
00.
0-0
.1
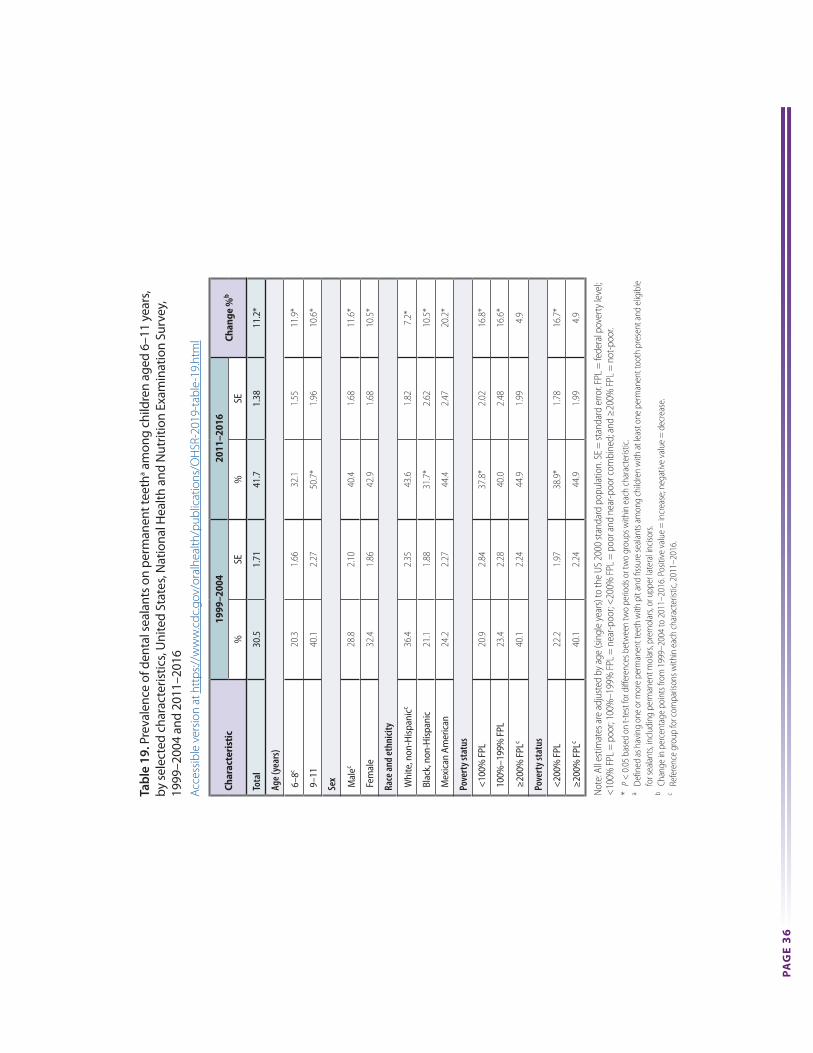
PA
GE
36
Tabl
e 19
. Pre
vale
nce
of d
enta
l sea
lant
s on
per
man
ent t
eeth
a am
ong
child
ren
aged
6–1
1 ye
ars,
by
sel
ecte
d ch
arac
teris
tics,
Uni
ted
Stat
es, N
atio
nal H
ealth
and
Nut
ritio
n Ex
amin
atio
n Su
rvey
, 19
99–2
004
and
2011
–201
6Ac
cess
ible
ver
sion
at h
ttps
://w
ww
.cdc
.gov
/ora
lhea
lth/p
ublic
atio
ns/O
HSR
-201
9-ta
ble-
19.h
tml
Tabl
e 19
. Pre
vale
nce
of d
enta
l sea
lant
s on
perm
anen
t tee
tha a
mon
g ch
ildre
n ag
ed 6
–11
year
s, by
sele
cted
cha
ract
eris
tics,
Uni
ted
Stat
es, N
atio
nal H
ealth
and
Nut
ritio
n Ex
amin
atio
n Su
rvey
, 19
99–2
004
and
2011
–201
6Ac
cess
ible
ver
sion
at h
ttps
://w
ww
.cdc
.gov
/ora
lhea
lth/p
ublic
atio
ns/O
HSR
-201
9-ta
ble-
19.h
tml
Not
e: A
ll es
timat
es a
re a
djus
ted
by a
ge (s
ingl
e ye
ars)
to th
e US
200
0 st
anda
rd p
opul
atio
n. S
E =
stan
dard
erro
r. FP
L =
fede
ral p
over
ty le
vel;
<10
0% F
PL =
poo
r; 10
0%–1
99%
FPL
= n
ear-p
oor;
<20
0% F
PL =
poo
r and
nea
r-poo
r com
bine
d; a
nd ≥
200%
FPL
= n
ot-p
oor.
* P
< 0
.05
base
d on
t-te
st fo
r diff
eren
ces b
etw
een
two
perio
ds o
r tw
o gr
oups
with
in e
ach
char
acte
ristic
.a
Defi
ned
as h
avin
g on
e or
mor
e pe
rman
ent t
eeth
with
pit
and
fissu
re se
alan
ts a
mon
g ch
ildre
n w
ith a
t lea
st o
ne p
erm
anen
t too
th p
rese
nt a
nd e
ligib
le
for s
eala
nts,
incl
udin
g pe
rman
ent m
olar
s, pr
emol
ars,
or u
pper
late
ral i
nciso
rs.
b Ch
ange
in p
erce
ntag
e po
ints
from
199
9–20
04 to
201
1–20
16. P
ositi
ve v
alue
= in
crea
se; n
egat
ive
valu
e =
dec
reas
e.c
Refe
renc
e gr
oup
for c
ompa
rison
s with
in e
ach
char
acte
ristic
, 201
1–20
16.
Char
acte
rist
ic19
99–2
004
2011
–201
6Ch
ange
%b
%SE
%SE
Tota
l30
.51.
7141
.71.
3811
.2*
Age
(yea
rs)
6–8c
20.3
1.66
32.1
1.55
11.9
*
9–11
40
.12.
2750
.7*
1.96
10.6
*
Sex Mal
ec28
.82.
1040
.41.
6811
.6*
Fem
ale
32.4
1.86
42.9
1.68
10.5
*
Race
and
eth
nicit
y
Whi
te, n
on-H
ispa
nicc
36.4
2.35
43.6
1.82
7.2*
Blac
k, n
on-H
ispan
ic21
.11.
8831
.7*
2.62
10.5
*
Mex
ican
Am
eric
an24
.22.
2744
.42.
4720
.2*
Pove
rty s
tatu
s
<10
0% F
PL20
.92.
8437
.8*
2.02
16.8
*
100%
–199
% F
PL23
.42.
2840
.02.
4816
.6*
≥20
0% F
PLc
40.1
2.24
44.9
1.99
4.9
Pove
rty s
tatu
s
<20
0% F
PL22
.21.
9738
.9*
1.78
16.7
*
≥20
0% F
PLc
40.1
2.24
44.9
1.99
4.9

PA
GE
37
Tabl
e 20
. Mea
n nu
mbe
r of p
erm
anen
t tee
th w
ith d
enta
l sea
lant
s am
ong
child
ren
aged
6–1
1 ye
ars
with
at l
east
one
sea
led
toot
h,a b
y se
lect
ed c
hara
cter
istic
s, U
nite
d St
ates
, Nat
iona
l H
ealth
and
Nut
ritio
n Ex
amin
atio
n Su
rvey
, 199
9–20
04 a
nd 2
011–
2016
Acce
ssib
le v
ersio
n at
htt
ps://
ww
w.c
dc.g
ov/o
ralh
ealth
/pub
licat
ions
/OH
SR-2
019-
tabl
e-20
.htm
l
Tabl
e 20
. Mea
n nu
mbe
r of p
erm
anen
t tee
th w
ith d
enta
l sea
lant
s am
ong
child
ren
aged
6–1
1 ye
ars w
ith a
t lea
st o
ne se
aled
toot
h,a b
y se
lect
ed c
hara
cter
istic
s, U
nite
d St
ates
, Nat
iona
l Hea
lth
and
Nut
ritio
n Ex
amin
atio
n Su
rvey
, 199
9–20
04 a
nd 2
011–
2016
Acce
ssib
le v
ersi
on a
t htt
ps://
ww
w.c
dc.g
ov/o
ralh
ealth
/pub
licat
ions
/OH
SR-2
019-
tabl
e-20
.htm
l
Not
e: A
ll es
timat
es a
re a
djus
ted
by a
ge (s
ingl
e ye
ars)
to th
e US
200
0 st
anda
rd p
opul
atio
n. S
E =
stan
dard
erro
r. FP
L =
fede
ral p
over
ty le
vel;
<10
0% F
PL =
poo
r; 10
0%–1
99%
FPL
= n
ear-p
oor;
<20
0% F
PL =
poo
r and
nea
r-poo
r com
bine
d; a
nd ≥
200%
FPL
= n
ot-p
oor.
0.0
= ze
ro
due
to ro
undi
ng.
* P
< 0
.05
base
d on
t-te
st fo
r diff
eren
ces b
etw
een
two
perio
ds o
r tw
o gr
oups
with
in e
ach
char
acte
ristic
.a
Incl
udin
g pe
rman
ent m
olar
s, pr
emol
ars,
or u
pper
late
ral i
nciso
rs.
b Ch
ange
from
199
9–20
04 to
201
1–20
16. P
ositi
ve v
alue
= in
crea
se; n
egat
ive
valu
e =
dec
reas
e.c
Refe
renc
e gr
oup
for c
ompa
rison
s with
in e
ach
char
acte
ristic
, 201
1–20
16.
Char
acte
rist
ic19
99–2
004
2011
–201
6Ch
ange
b
Mea
nSE
Mea
nSE
Tota
l3.
40.
073.
60.
070.
2*
Age
(yea
rs)
6–8c
3.4
0.08
3.4
0.06
0.0
9–11
3.
40.
093.
8*0.
100.
4*
Sex Male
c3.
30.
083.
60.
080.
2*
Fem
ale3.
40.
093.
60.
080.
2
Race
and
eth
nicit
y
Whi
te, n
on-H
ispan
icc3.
40.
093.
60.
090.
2
Blac
k, no
n-Hi
span
ic3.
30.
103.
70.
140.
4*
Mex
ican A
mer
ican
3.1
0.10
3.6
0.14
0.5*
Pove
rty s
tatu
s
<10
0% FP
L3.
10.
113.
60.
100.
5*
100%
–199
% FP
L3.
30.
143.
50.
110.
2
≥20
0% FP
Lc3.
50.
093.
60.
090.
2
Pove
rty s
tatu
s
<20
0% FP
L3.
20.
113.
60.
080.
4*
≥20
0% FP
Lc3.
50.
093.
60.
090.
2

PA
GE
38
Tabl
e 21
. Mea
n nu
mbe
r of p
erm
anen
t tee
th s
eale
d by
toot
h ty
pe a
mon
g ch
ildre
n ag
ed 6
–11
year
s w
ith a
t lea
st o
ne s
eale
d to
oth,
a by
sel
ecte
d ch
arac
teris
tics,
Uni
ted
Stat
es, N
atio
nal H
ealth
and
Nut
ritio
n Ex
amin
atio
n Su
rvey
, 199
9–20
04 a
nd 2
011–
2016
Acce
ssib
le v
ersio
n at
htt
ps://
ww
w.c
dc.g
ov/o
ralh
ealth
/pub
licat
ions
/OH
SR-2
019-
tabl
e-21
.htm
l
Tabl
e 21
. Mea
n nu
mbe
r of p
erm
anen
t tee
th se
aled
by
toot
h ty
pe a
mon
g ch
ildre
n ag
ed 6
–11
year
s with
at l
east
one
seal
ed to
oth,
a by
sele
cted
cha
ract
eris
tics,
Uni
ted
Stat
es, N
atio
nal H
ealth
and
Nut
ritio
n Ex
amin
atio
n Su
rvey
, 199
9–20
04 a
nd 2
011–
2016
Not
e: A
ll es
timat
es a
re a
djus
ted
by a
ge (s
ingl
e ye
ars)
to th
e US
200
0 st
anda
rd p
opul
atio
n. S
E =
stan
dard
erro
r. FP
L =
fede
ral p
over
ty le
vel; <
100%
FPL
= p
oor;
100%
–199
% F
PL =
nea
r-po
or; <
200%
FPL
= p
oor a
nd n
ear-p
oor c
ombi
ned;
and
≥20
0% F
PL =
not
-poo
r. N
R =
not
repo
rted
beca
use
the
poin
t est
imat
e of
mea
n is
zero
or t
he st
anda
rd e
rror i
s gre
ater
than
30%
th
e va
lue
of th
e po
int e
stim
ate.
0.0
= ze
ro d
ue to
roun
ding
.
* P
< 0
.05
base
d on
t-te
st fo
r diff
eren
ces b
etw
een
two
perio
ds o
r tw
o gr
oups
with
in e
ach
char
acte
ristic
.a
Incl
udin
g pe
rman
ent m
olar
s, pr
emol
ars,
or u
pper
late
ral i
nciso
rs.
b Cha
nge
from
199
9–20
04 to
201
1–20
16. P
ositi
ve v
alue
= in
crea
se; n
egat
ive
valu
e =
dec
reas
e.c
Refe
renc
e gr
oup
for c
ompa
rison
s with
in e
ach
char
acte
ristic
, 201
1–20
16.
Char
acte
rist
ic
1999
–200
420
11–2
016
Chan
gein
Prem
olar
b
Chan
ge
in F
irst
M
olar
b
Chan
ge
in S
econ
d M
olar
bPr
emol
arFi
rst M
olar
Seco
nd M
olar
Prem
olar
Firs
t Mol
arSe
cond
Mol
ar
Mea
nSE
Mea
nSE
Mea
nSE
Mea
nSE
Mea
nSE
Mea
nSE
Tota
l0.
20.
053.
20.
060.
10.
030.
30.
053.
30.
050.
50.
080.
10.
10.
4*
Age
(yea
rs)
6–8c
NR
NR
3.4
0.08
NR
NR
NR
NR
3.4
0.06
NR
NR
NR
0.0
NR
9–11
0.
30.
083.
10.
070.
10.
040.
40.
083.
30.
060.
70.
100.
10.
2*0.
5*
Sex Male
cN
RN
R3.
20.
07N
RN
R0.
30.
083.
30.
060.
60.
12N
R0.
1N
R
Fem
aleN
RN
R3.
30.
06N
RN
R0.
20.
043.
40.
070.
50.
10N
R0.
1N
R
Race
and
eth
nicit
y
Whi
te, n
on-H
ispan
iccN
RN
R3.
30.
08N
RN
RN
RN
R3.
50.
070.
50.
12N
R0.
2N
R
Blac
k, no
n-Hi
span
icN
RN
R3.
10.
07N
RN
R0.
40.
113.
2*0.
090.
80.
16N
R0.
2N
R
Mex
ican A
mer
ican
0.3
0.08
2.9
0.10
NR
NR
0.5
0.12
3.2*
0.09
0.8
0.14
0.2
0.3*
NR
Pove
rty s
tatu
s
<10
0% FP
L0.
30.
072.
90.
11N
RN
R0.
40.
083.
30.
070.
70.
140.
10.
4*N
R
100%
–199
% FP
LN
RN
R3.
10.
11N
RN
R0.
30.
093.
2*0.
080.
80.
19N
R0.
1N
R
≥20
0% FP
LcN
RN
R3.
30.
07N
RN
RN
RN
R3.
50.
070.
50.
12N
R0.
1N
R
Pove
rty s
tatu
s
<20
0% FP
LN
RN
R3.
00.
09N
RN
R0.
40.
073.
2*0.
050.
70.
12N
R0.
2*N
R
≥20
0% FP
LcN
RN
R3.
30.
07N
RN
RN
RN
R3.
50.
070.
50.
12N
R0.
1N
R
Acce
ssib
le v
ersi
on a
t htt
ps://
ww
w.c
dc.g
ov/o
ralh
ealth
/pub
licat
ions
/OH
SR-2
019-
tabl
e-21
.htm
l
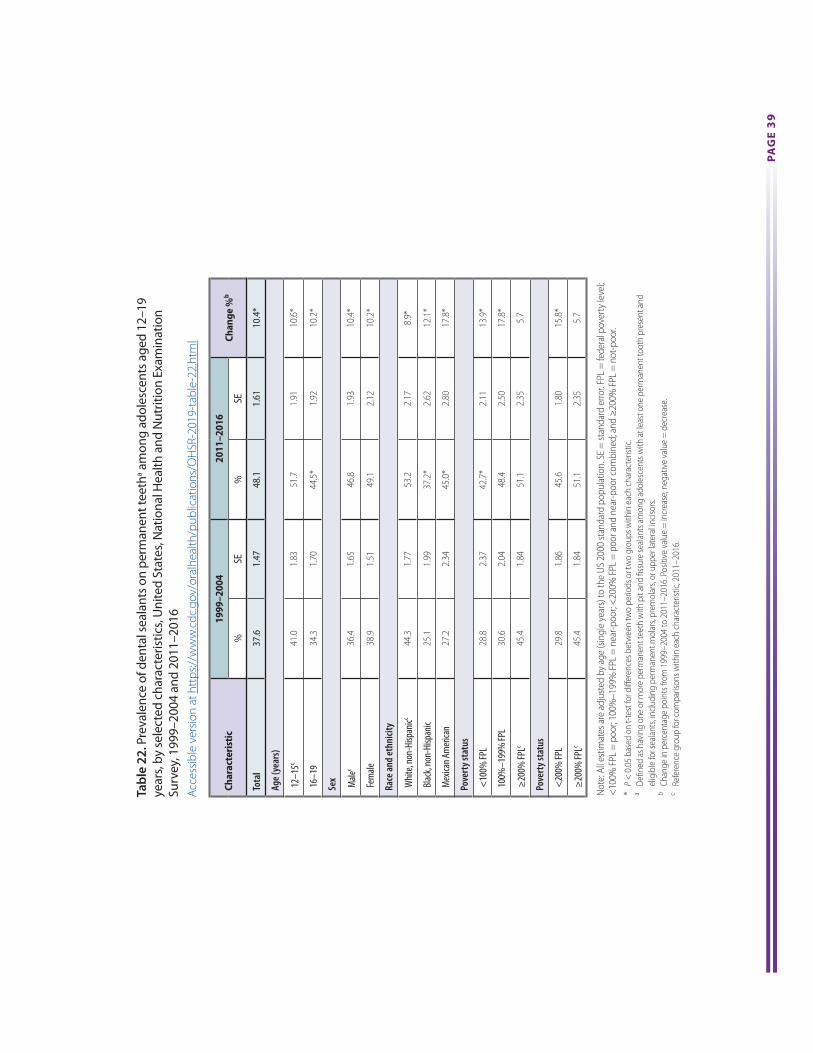
PA
GE
39
Tabl
e 22
. Pre
vale
nce
of d
enta
l sea
lant
s on
per
man
ent t
eeth
a am
ong
adol
esce
nts
aged
12–
19
year
s, b
y se
lect
ed c
hara
cter
istic
s, U
nite
d St
ates
, Nat
iona
l Hea
lth a
nd N
utrit
ion
Exam
inat
ion
Surv
ey, 1
999–
2004
and
201
1–20
16Ac
cess
ible
ver
sion
at h
ttps
://w
ww
.cdc
.gov
/ora
lhea
lth/p
ublic
atio
ns/O
HSR
-201
9-ta
ble-
22.h
tml
Tabl
e 22
. Pre
vale
nce
of d
enta
l sea
lant
s on
perm
anen
t tee
tha a
mon
g ad
oles
cent
s age
d 12
–19
year
s, by
sele
cted
cha
ract
eris
tics,
Uni
ted
Stat
es, N
atio
nal H
ealth
and
Nut
ritio
n Ex
amin
atio
n Su
rvey
, 199
9–20
04 a
nd 2
011–
2016
Acce
ssib
le v
ersi
on a
t htt
ps://
ww
w.c
dc.g
ov/o
ralh
ealth
/pub
licat
ions
/OH
SR-2
019-
tabl
e-22
.htm
l
Not
e: A
ll es
timat
es a
re a
djus
ted
by a
ge (s
ingl
e ye
ars)
to th
e US
200
0 st
anda
rd p
opul
atio
n. S
E =
stan
dard
erro
r. FP
L =
fede
ral p
over
ty le
vel;
<10
0% F
PL =
poo
r; 10
0%–1
99%
FPL
= n
ear-p
oor;
<20
0% F
PL =
poo
r and
nea
r-poo
r com
bine
d; a
nd ≥
200%
FPL
= n
ot-p
oor.
* P
< 0
.05
base
d on
t-te
st fo
r diff
eren
ces b
etw
een
two
perio
ds o
r tw
o gr
oups
with
in e
ach
char
acte
ristic
.a
Defi
ned
as h
avin
g on
e or
mor
e pe
rman
ent t
eeth
with
pit
and
fissu
re se
alan
ts a
mon
g ad
oles
cent
s with
at l
east
one
per
man
ent t
ooth
pre
sent
and
el
igib
le fo
r sea
lant
s, in
clud
ing
perm
anen
t mol
ars,
prem
olar
s, or
upp
er la
tera
l inc
isors
.b
Chan
ge in
per
cent
age
poin
ts fr
om 1
999–
2004
to 2
011–
2016
. Pos
itive
val
ue =
incr
ease
; neg
ativ
e va
lue
= d
ecre
ase.
c Re
fere
nce
grou
p fo
r com
paris
ons w
ithin
eac
h ch
arac
teris
tic, 2
011–
2016
.
Char
acte
rist
ic19
99–2
004
2011
–201
6Ch
ange
%b
%SE
%SE
Tota
l37
.61.
4748
.11.
6110
.4*
Age
(yea
rs)
12–1
5c41
.01.
8351
.71.
9110
.6*
16–1
9 34
.31.
7044
.5*
1.92
10.2
*
Sex Male
c36
.41.
6546
.81.
9310
.4*
Fem
ale38
.91.
5149
.12.
1210
.2*
Race
and
eth
nicit
y
Whi
te, n
on-H
ispan
icc44
.31.
7753
.22.
178.
9*
Blac
k, no
n-Hi
span
ic25
.11.
9937
.2*
2.62
12.1
*
Mex
ican A
mer
ican
27.2
2.34
45.0
*2.
8017
.8*
Pove
rty s
tatu
s
<10
0% FP
L28
.82.
3742
.7*
2.11
13.9
*
100%
–199
% FP
L30
.62.
0448
.42.
5017
.8*
≥20
0% FP
Lc45
.41.
8451
.12.
355.
7
Pove
rty s
tatu
s
<20
0% FP
L29
.81.
8645
.61.
8015
.8*
≥20
0% FP
Lc45
.41.
8451
.12.
355.
7

PA
GE
40
Tabl
e 23
. Mea
n nu
mbe
r of p
erm
anen
t tee
th w
ith d
enta
l sea
lant
s am
ong
adol
esce
nts
aged
12–
19
year
s w
ith a
t lea
st o
ne s
eale
d to
oth,
a by
sele
cted
cha
ract
eris
tics,
Uni
ted
Stat
es, N
atio
nal H
ealth
an
d N
utrit
ion
Exam
inat
ion
Surv
ey, 1
999–
2004
and
201
1–20
16Ac
cess
ible
ver
sion
at h
ttps
://w
ww
.cdc
.gov
/ora
lhea
lth/p
ublic
atio
ns/O
HSR
-201
9-ta
ble-
23.h
tml
Tabl
e 23
. Mea
n nu
mbe
r of p
erm
anen
t tee
th w
ith d
enta
l sea
lant
s am
ong
adol
esce
nts a
ged
12–1
9 ye
ars w
ith a
t lea
st o
ne se
aled
toot
h,a b
y se
lect
ed c
hara
cter
istic
s, U
nite
d St
ates
, Nat
iona
l H
ealth
and
Nut
ritio
n Ex
amin
atio
n Su
rvey
, 199
9–20
04 a
nd 2
011–
2016
Acce
ssib
le v
ersi
on a
t htt
ps://
ww
w.c
dc.g
ov/o
ralh
ealth
/pub
licat
ions
/OH
SR-2
019-
tabl
e-23
.htm
l
Not
e: A
ll es
timat
es a
re a
djus
ted
by a
ge (s
ingl
e ye
ars)
to th
e US
200
0 st
anda
rd p
opul
atio
n. S
E =
stan
dard
erro
r. FP
L =
fede
ral p
over
ty le
vel;
<10
0% F
PL =
poo
r; 10
0%–1
99%
FPL
= n
ear-p
oor;
<20
0% F
PL =
poo
r and
nea
r-poo
r com
bine
d; a
nd ≥
200%
FPL
= n
ot-p
oor.
* P
< 0
.05
base
d on
t-te
st fo
r diff
eren
ces b
etw
een
two
perio
ds o
r tw
o gr
oups
with
in e
ach
char
acte
ristic
.a
Incl
udin
g pe
rman
ent m
olar
s, pr
emol
ars,
or u
pper
late
ral i
nciso
rs.
b Ch
ange
from
199
9–20
04 to
201
1–20
16. P
ositi
ve v
alue
= in
crea
se; n
egat
ive
valu
e =
dec
reas
e.c
Refe
renc
e gr
oup
for c
ompa
rison
s with
in e
ach
char
acte
ristic
, 201
1–20
16.
Char
acte
rist
ic19
99–2
004
2011
–201
6Ch
ange
b
Mea
nSE
Mea
nSE
Tota
l5.
10.
136.
00.
200.
9*
Age
(yea
rs)
12–1
5c4.
90.
145.
80.
201.
0*
16–1
9 5.
30.
206.
20.
250.
9*
Sex Male
c5.
00.
156.
00.
241.
1*
Fem
ale5.
20.
166.
00.
230.
8*
Race
and
eth
nicit
y
Whi
te, n
on-H
ispan
icc5.
10.
165.
90.
260.
8
Blac
k, no
n-Hi
span
ic4.
60.
246.
30.
321.
7*
Mex
ican A
mer
ican
5.0
0.24
6.0
0.32
1.1*
Pove
rty s
tatu
s
<10
0% FP
L5.
00.
236.
20.
261.
2*
100%
–199
% FP
L5.
20.
376.
20.
261.
0*
≥20
0% FP
Lc5.
10.
155.
90.
260.
8*
Pove
rty s
tatu
s
<20
0% FP
L5.
10.
226.
20.
231.
1*
≥20
0% FP
Lc5.
10.
155.
90.
260.
8*

PA
GE
41
Tabl
e 24
. Mea
n nu
mbe
r of p
erm
anen
t tee
th s
eale
d by
toot
h ty
pe a
mon
g ad
oles
cent
s ag
ed 1
2–19
yea
rs w
ith a
t lea
st o
ne s
eale
d to
oth,
a by
sele
cted
cha
ract
eris
tics,
Uni
ted
Stat
es, N
atio
nal H
ealth
and
Nut
ritio
n Ex
amin
atio
n Su
rvey
, 199
9–20
04 a
nd 2
011–
2016
Acce
ssib
le v
ersio
n at
htt
ps://
ww
w.c
dc.g
ov/o
ralh
ealth
/pub
licat
ions
/OH
SR-2
019-
tabl
e-24
.htm
l
Tabl
e 24
. Mea
n nu
mbe
r of p
erm
anen
t tee
th se
aled
by
toot
h ty
pe a
mon
g ad
oles
cent
s age
d 12
–19
year
s with
at l
east
one
seal
ed
toot
h,a b
y se
lect
ed c
hara
cter
istic
s, U
nite
d St
ates
, Nat
iona
l Hea
lth a
nd N
utrit
ion
Exam
inat
ion
Surv
ey, 1
999–
2004
and
201
1–20
16
Not
e: A
ll es
timat
es a
re a
djus
ted
by a
ge (s
ingl
e ye
ars)
to th
e US
200
0 st
anda
rd p
opul
atio
n. S
E =
stan
dard
erro
r. FP
L =
fede
ral p
over
ty le
vel; <
100%
FPL
= p
oor;
100%
–199
% F
PL =
nea
r-poo
r; <
200%
FPL
= p
oor a
nd n
ear-p
oor c
ombi
ned;
and
≥20
0% F
PL =
not
-poo
r.
* P
< 0
.05
base
d on
t-te
st fo
r diff
eren
ces b
etw
een
two
perio
ds o
r tw
o gr
oups
with
in e
ach
char
acte
ristic
.a
Incl
udin
g pe
rman
ent m
olar
s, pr
emol
ars,
and
uppe
r lat
eral
inci
sors
.b
Chan
ge fr
om 1
999–
2004
to 2
011–
2016
. Pos
itive
val
ue =
incr
ease
; neg
ativ
e va
lue
= d
ecre
ase.
c Re
fere
nce
grou
p fo
r com
paris
ons w
ithin
eac
h ch
arac
teris
tic, 2
011–
2016
.
Char
acte
rist
ic
1999
–200
420
11–2
016
Chan
ge
in
Prem
olar
b
Chan
ge
in Fi
rst
Mol
arb
Chan
ge
in Se
cond
M
olar
bPr
emol
arFi
rst M
olar
Seco
nd M
olar
Prem
olar
Firs
t Mol
arSe
cond
Mol
ar
Mea
nSE
Mea
nSE
Mea
nSE
Mea
nSE
Mea
nSE
Mea
nSE
Tota
l0.
90.
102.
50.
051.
60.
061.
30.
112.
80.
072.
10.
090.
3*0.
2*0.
5*
Age
(yea
rs)
12–1
5c0.
70.
092.
80.
071.
40.
081.
10.
113.
00.
081.
90.
100.
4*0.
2*0.
5*
16–1
91.
10.
142.
30.
061.
80.
081.
4*0.
162.
5*0.
082.
3*0.
110.
30.
2*0.
5*
Sex Mal
ec0.
80.
092.
60.
061.
60.
081.
20.
132.
90.
082.
10.
110.
4*0.
2*0.
6*
Fem
ale
1.1
0.13
2.4
0.06
1.7
0.08
1.3
0.15
2.7
0.10
2.1
0.09
0.3
0.2*
0.4*
Race
and
eth
nicit
y
Whi
te, n
on-H
ispa
nicc
0.8
0.12
2.6
0.06
1.7
0.06
1.0
0.14
2.9
0.08
2.1
0.11
0.3
0.3*
0.3*
Blac
k, n
on-H
ispan
ic1.
20.
222.
20.
091.
20.
081.
7*0.
232.
7*0.
092.
20.
170.
50.
5*1.
0*
Mex
ican
Am
eric
an1.
20.
172.
30.
071.
50.
091.
60.
252.
5*0.
082.
10.
110.
30.
2*0.
6*
Pove
rty s
tatu
s
<10
0% F
PL1.
20.
162.
30.
121.
50.
101.
7*0.
192.
5*0.
112.
20.
100.
50.
20.
7*
100%
–199
% F
PL1.
20.
262.
40.
091.
60.
121.
7*0.
172.
6*0.
102.
10.
150.
50.
20.
5*
≥20
0% F
PLc
0.7
0.07
2.6
0.06
1.7
0.07
1.0
0.16
2.9
0.07
2.1
0.11
0.3
0.3*
0.4*
Pove
rty s
tatu
s
<20
0% F
PL1.
20.
192.
40.
071.
60.
061.
7*0.
142.
5*0.
092.
10.
100.
40.
20.
6*
≥20
0% F
PLc
0.7
0.07
2.6
0.06
1.7
0.07
1.0
0.16
2.9
0.07
2.1
0.11
0.3
0.3*
0.4*
Acce
ssib
le v
ersi
on a
t htt
ps://
ww
w.c
dc.g
ov/o
ralh
ealth
/pub
licat
ions
/OH
SR-2
019-
tabl
e-24
.htm
l

PA
GE
42
Tabl
e 25
. Pre
vale
nce
of d
enta
l car
ies
in p
erm
anen
t tee
th (D
FT ≥
1)a a
mon
g de
ntat
e ad
ults
age
d 20
–64
year
s, b
y se
lect
ed c
hara
cter
istic
s, U
nite
d St
ates
, Nat
iona
l Hea
lth a
nd N
utrit
ion
Exam
inat
ion
Surv
ey, 1
999–
2004
and
201
1–20
16Ac
cess
ible
ver
sion
at h
ttps
://w
ww
.cdc
.gov
/ora
lhea
lth/p
ublic
atio
ns/O
HSR
-201
9-ta
ble-
25.h
tml
Tabl
e 25
. Pre
vale
nce
of d
enta
l car
ies i
n pe
rman
ent t
eeth
(DFT
≥1)
a am
ong
dent
ate
adul
ts
aged
20–
64 y
ears
, by
sele
cted
cha
ract
eris
tics,
Uni
ted
Stat
es, N
atio
nal H
ealth
and
Nut
ritio
n Ex
amin
atio
n Su
rvey
, 199
9–20
04 a
nd 2
011–
2016
Acce
ssib
le v
ersi
on a
t htt
ps://
ww
w.c
dc.g
ov/o
ralh
ealth
/pub
licat
ions
/OH
SR-2
019-
tabl
e-25
.htm
l
Not
e: A
ll es
timat
es a
re a
djus
ted
by a
ge (5
-yea
r gro
ups)
to th
e US
200
0 st
anda
rd p
opul
atio
n. S
E =
stan
dard
erro
r. FP
L =
fede
ral p
over
ty le
vel;
<10
0% F
PL =
poo
r; 10
0%–1
99%
FPL
= n
ear-p
oor;
<20
0% F
PL =
poo
r and
nea
r-poo
r com
bine
d; a
nd ≥
200%
FPL
= n
ot-p
oor.
* P
< 0
.05
base
d on
t-te
st fo
r diff
eren
ces b
etw
een
two
perio
ds o
r tw
o gr
oups
with
in e
ach
char
acte
ristic
.a
Defi
ned
as h
avin
g on
e or
mor
e un
treat
ed d
ecay
ed o
r fille
d pe
rman
ent t
eeth
am
ong
adul
ts w
ith a
t lea
st o
ne p
erm
anen
t too
th.
b Cha
nge
in p
erce
ntag
e po
ints
from
199
9–20
04 to
201
1–20
16. P
ositi
ve v
alue
= in
crea
se; n
egat
ive
valu
e =
dec
reas
e.c
Refe
renc
e gr
oup
for c
ompa
rison
s with
in e
ach
char
acte
ristic
, 201
1–20
16.
Char
acte
rist
ic19
99–2
004
2011
–201
6Ch
ange
%b
%SE
%SE
Tota
l91
.60.
3989
.90.
43-1
.8*
Age
(yea
rs)
20–3
4c85
.70.
8182
.00.
79-3
.7*
35–4
994
.20.
5292
.5*
0.66
-1.8
*
50–6
495
.60.
3896
.4*
0.35
0.8
Sex Male
c90
.60.
6088
.20.
55-2
.4*
Fem
ale92
.60.
4891
.5*
0.48
-1.2
Race
and
eth
nicit
y
Whi
te, n
on-H
ispan
icc93
.40.
3991
.50.
49-1
.9*
Blac
k, no
n-Hi
span
ic87
.60.
7586
.1*
0.93
-1.5
Mex
ican A
mer
ican
83.2
1.52
86.6
*1.
113.
4
Pove
rty s
tatu
s
<10
0% FP
L89
.21.
0988
.0*
0.70
-1.1
100%
–199
% FP
L88
.90.
9689
.31.
030.
4
≥20
0% FP
Lc92
.70.
5190
.20.
54-2
.5*
Pove
rty s
tatu
s
<20
0% FP
L89
.00.
8488
.80.
71-0
.2
≥20
0% FP
Lc92
.70.
5190
.20.
54-2
.5*
Educ
atio
n
<Hi
gh sc
hool
85.9
0.90
87.2
*1.
031.
3
High
scho
ol92
.50.
8091
.4*
0.55
-1.1
>Hi
gh sc
hoolc
92.8
0.43
89.9
0.45
-2.9
*
Ciga
rett
e sm
okin
g h
istor
y
Curre
nt sm
oker
91.5
0.67
91.3
*0.
65-0
.2
Form
er sm
oker
92.4
0.85
90.0
0.86
-2.5
*
Neve
r sm
oked
c91
.20.
4789
.20.
46-2
.0*
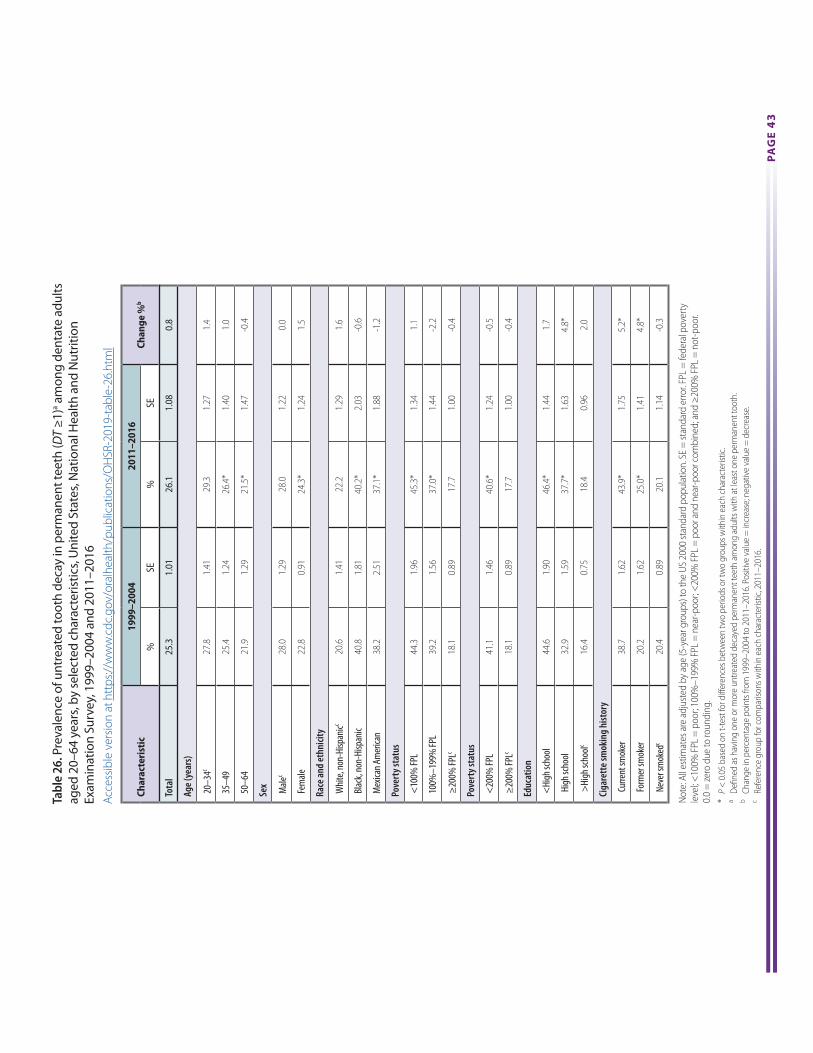
PA
GE
43
Tabl
e 26
. Pre
vale
nce
of u
ntre
ated
toot
h de
cay
in p
erm
anen
t tee
th (D
T ≥
1)a a
mon
g de
ntat
e ad
ults
ag
ed 2
0–64
yea
rs, b
y se
lect
ed c
hara
cter
istic
s, U
nite
d St
ates
, Nat
iona
l Hea
lth a
nd N
utrit
ion
Ex
amin
atio
n Su
rvey
, 199
9–20
04 a
nd 2
011–
2016
Acce
ssib
le v
ersio
n at
htt
ps://
ww
w.c
dc.g
ov/o
ralh
ealth
/pub
licat
ions
/OH
SR-2
019-
tabl
e-26
.htm
l
Tabl
e 26
. Pre
vale
nce
of u
ntre
ated
toot
h de
cay
in p
erm
anen
t tee
th (D
T ≥1
)a am
ong
dent
ate
adul
ts
aged
20–
64 y
ears
, by
sele
cted
cha
ract
eris
tics,
Uni
ted
Stat
es, N
atio
nal H
ealth
and
Nut
ritio
n
Exam
inat
ion
Surv
ey, 1
999–
2004
and
201
1–20
16Ac
cess
ible
ver
sion
at h
ttps
://w
ww
.cdc
.gov
/ora
lhea
lth/p
ublic
atio
ns/O
HSR
-201
9-ta
ble-
26.h
tml
Char
acte
rist
ic19
99–2
004
2011
–201
6Ch
ange
%b
%SE
%SE
Tota
l25
.31.
0126
.11.
080.
8
Age
(yea
rs)
20–3
4c27
.81.
4129
.31.
271.
4
35–4
925
.41.
2426
.4*
1.40
1.0
50–6
421
.91.
2921
.5*
1.47
-0.4
Sex Male
c28
.01.
2928
.01.
220.
0
Fem
ale22
.80.
9124
.3*
1.24
1.5
Race
and
eth
nicit
y
Whi
te, n
on-H
ispan
icc20
.61.
4122
.21.
291.
6
Blac
k, no
n-Hi
span
ic40
.81.
8140
.2*
2.03
-0.6
Mex
ican A
mer
ican
38.2
2.51
37.1
*1.
88-1
.2
Pove
rty s
tatu
s
<10
0% FP
L44
.31.
9645
.3*
1.34
1.1
100%
–199
% FP
L39
.21.
5637
.0*
1.44
-2.2
≥20
0% FP
Lc18
.10.
8917
.71.
00-0
.4
Pove
rty s
tatu
s
<20
0% FP
L41
.11.
4640
.6*
1.24
-0.5
≥20
0% FP
Lc18
.10.
8917
.71.
00-0
.4
Educ
atio
n
<Hi
gh sc
hool
44.6
1.90
46.4
*1.
441.
7
High
scho
ol32
.91.
5937
.7*
1.63
4.8*
>Hi
gh sc
hoolc
16.4
0.75
18.4
0.96
2.0
Ciga
rett
e sm
okin
g hi
stor
y
Curre
nt sm
oker
38.7
1.62
43.9
*1.
755.
2*
Form
er sm
oker
20.2
1.62
25.0
*1.
414.
8*
Nev
er sm
oked
c20
.40.
8920
.11.
14-0
.3
Not
e: A
ll es
timat
es a
re a
djus
ted
by a
ge (5
-yea
r gro
ups)
to th
e US
200
0 st
anda
rd p
opul
atio
n. S
E =
stan
dard
erro
r. FP
L =
fede
ral p
over
ty
leve
l; <10
0% F
PL =
poo
r; 10
0%–1
99%
FPL
= n
ear-p
oor;
<20
0% F
PL =
poo
r and
nea
r-poo
r com
bine
d; a
nd ≥
200%
FPL
= n
ot-p
oor.
0.
0 =
zero
due
to ro
undi
ng.
* P
< 0
.05
base
d on
t-te
st fo
r diff
eren
ces b
etw
een
two
perio
ds o
r tw
o gr
oups
with
in e
ach
char
acte
ristic
.a
Defi
ned
as h
avin
g on
e or
mor
e un
treat
ed d
ecay
ed p
erm
anen
t tee
th a
mon
g ad
ults
with
at l
east
one
per
man
ent t
ooth
.b C
hang
e in
per
cent
age
poin
ts fr
om 1
999–
2004
to 2
011–
2016
. Pos
itive
val
ue =
incr
ease
; neg
ativ
e va
lue
= d
ecre
ase.
c Re
fere
nce
grou
p fo
r com
paris
ons w
ithin
eac
h ch
arac
teris
tic, 2
011–
2016
.

PA
GE
44
Tabl
e 27
. Mea
n nu
mbe
r of u
ntre
ated
dec
ayed
(DT)
, mis
sing
(MT)
, fille
d (F
T), u
ntre
ated
dec
ayed
or fi
lled
(DFT
), an
d un
trea
ted
deca
yed,
mis
sing
, or fi
lled
(DM
FT)
perm
anen
t tee
th a
mon
g de
ntat
e ad
ults
age
d 20
–64
year
s w
ith a
t lea
st o
ne D
MFT
,a by
sele
cted
cha
ract
eris
tics,
Uni
ted
Stat
es, N
atio
nal H
ealth
and
Nut
ritio
n Ex
amin
atio
n Su
rvey
, 199
9–20
04 a
nd 2
011–
2016
Acce
ssib
le v
ersio
n at
htt
ps://
ww
w.c
dc.g
ov/o
ralh
ealth
/pub
licat
ions
/OH
SR-2
019-
tabl
e-27
.htm
l
Tabl
e 27
. Mea
n nu
mbe
r of u
ntre
ated
dec
ayed
(DT)
, mis
sing
(MT)
, fille
d (F
T), u
ntre
ated
dec
ayed
or fi
lled
(DFT
), an
d un
trea
ted
deca
yed,
mis
sing
, or fi
lled
(DM
FT)
perm
anen
t tee
th a
mon
g de
ntat
e ad
ults
age
d 20
–64
year
s with
at l
east
one
DM
FT,a b
y se
lect
ed c
hara
cter
istic
s, U
nite
d St
ates
, Nat
iona
l Hea
lth a
nd N
utrit
ion
Exam
inat
ion
Surv
ey, 1
999–
2004
and
201
1–20
16
Not
e: A
ll es
timat
es a
re a
djus
ted
by a
ge (5
-yea
r gro
ups)
to th
e US
200
0 st
anda
rd p
opul
atio
n. S
E =
stan
dard
erro
r. FP
L =
fede
ral p
over
ty le
vel; <
100%
FPL
= p
oor;
100%
–199
% F
PL =
nea
r-poo
r; <
200%
FPL
= p
oor a
nd n
ear-p
oor c
ombi
ned;
an
d ≥
200%
FPL
= n
ot-p
oor.
0.0
= ze
ro d
ue to
roun
ding
.
* P
< 0
.05
base
d on
t-te
st fo
r diff
eren
ces b
etw
een
two
perio
ds o
r tw
o gr
oups
with
in e
ach
char
acte
ristic
.a
Incl
udes
adu
lts w
ith a
t lea
st o
ne p
erm
anen
t too
th p
rese
nt. M
issin
g te
eth
incl
ude
teet
h “m
issin
g du
e to
dise
ase”
(den
tal c
arie
s or p
erio
dont
al d
iseas
es).
b Cha
nge
from
199
9–20
04 to
201
1–20
16. P
ositi
ve v
alue
= in
crea
se; n
egat
ive
valu
e =
dec
reas
e.c
Refe
renc
e gr
oup
for c
ompa
rison
s with
in e
ach
char
acte
ristic
, 201
1–20
16.
Char
acte
rist
ic
1999
–200
420
11–2
016
Chan
ge
in
DM
FTb
Chan
ge
inD
FTb
Chan
ge
in
DTb
Chan
ge
in
FTb
DM
FTD
FTD
TM
TFT
DM
FTD
FTD
TM
TFT
Mea
nSE
Mea
nSE
Mea
nSE
Mea
nSE
Mea
nSE
Mea
nSE
Mea
nSE
Mea
nSE
Mea
nSE
Mea
nSE
Tota
l10
.80.
128.
20.
090.
80.
052.
60.
097.
40.
119.
30.
097.
40.
090.
90.
051.
90.
076.
50.
11-1
.5*
-0.8
*0.
1-1
.0*
Age
(yea
rs)
20–3
4c7.
10.
146.
40.
121.
10.
090.
70.
065.
30.
136.
70.
126.
10.
111.
20.
070.
60.
054.
90.
12-0
.4-0
.30.
2-0
.4*
35–4
911
.30.
138.
80.
120.
80.
062.
50.
108.
00.
149.
4*0.
157.
5*0.
120.
9*0.
061.
8*0.
106.
6*0.
14-1
.9*
-1.3
*0.
1-1
.4*
50–6
415
.30.
219.
80.
170.
50.
045.
40.
229.
30.
1912
.7*
0.13
8.9*
0.16
0.6*
0.05
3.9*
0.16
8.3*
0.18
-2.5
*-1
.0*
0.0
-1.0
*
Sex Male
c10
.50.
157.
90.
111.
00.
072.
60.
137.
00.
129.
00.
127.
10.
111.
10.
061.
90.
086.
00.
13-1
.6*
-0.9
*0.
1-1
.0*
Fem
ale11
.10.
128.
50.
110.
70.
052.
60.
087.
80.
139.
6*0.
117.
7*0.
110.
8*0.
051.
90.
086.
9*0.
12-1
.5*
-0.8
*0.
1-0
.9*
Race
and
eth
nicit
y
Whi
te, n
on-H
ispan
icc11
.10.
158.
80.
110.
70.
082.
20.
128.
10.
159.
40.
137.
90.
110.
90.
061.
60.
097.
00.
13-1
.6*
-1.0
*0.
1-1
.1*
Blac
k, no
n-Hi
span
ic10
.30.
166.
00.
151.
20.
084.
30.
134.
80.
169.
10.
175.
8*0.
141.
3*0.
093.
3*0.
124.
5*0.
14-1
.3*
-0.2
0.1
-0.3
Mex
ican A
mer
ican
9.0
0.15
6.4
0.17
1.1
0.12
2.7
0.08
5.2
0.22
8.7*
0.20
6.6*
0.17
1.2*
0.10
2.1*
0.09
5.4*
0.20
0.3
0.2
0.1
0.1
Pove
rty s
tatu
s
<10
0% FP
L10
.90.
236.
40.
181.
60.
114.
50.
204.
90.
1910
.0*
0.17
6.4*
0.14
1.7*
0.09
3.6*
0.15
4.6*
0.15
-0.9
*-0
.10.
1-0
.2
100%
–199
% FP
L11
.20.
247.
00.
161.
30.
114.
20.
195.
70.
179.
9*0.
157.
0*0.
161.
4*0.
082.
9*0.
115.
6*0.
18-1
.3*
0.0
0.0
0.0
≥20
0% FP
Lc10
.70.
138.
70.
120.
50.
042.
00.
088.
20.
139.
00.
117.
70.
100.
60.
041.
30.
067.
10.
11-1
.7*
-1.0
*0.
0-1
.0*
Pove
rty s
tatu
s
<20
0% FP
L11
.10.
206.
80.
131.
40.
094.
30.
165.
30.
149.
9*0.
146.
7*0.
131.
5*0.
073.
20.
105.
2*0.
15-1
.2*
0.0
0.1
-0.1
≥20
0% FP
Lc10
.70.
138.
70.
120.
50.
042.
00.
088.
20.
139.
00.
117.
70.
100.
60.
041.
3*0.
067.
10.
11-1
.7*
-1.0
*0.
0-1
.0*
Educ
atio
n
<Hi
gh sc
hool
11.1
0.19
6.2
0.15
1.7
0.12
4.9
0.17
4.5
0.19
9.9*
0.22
6.3*
0.19
1.8*
0.10
3.6*
0.16
4.5*
0.18
-1.2
*0.
10.
10.
0
High
scho
ol11
.30.
237.
90.
191.
10.
093.
30.
156.
90.
1910
.0*
0.17
7.2*
0.14
1.4*
0.09
2.8*
0.11
5.8*
0.16
-1.3
*-0
.8*
0.3*
-1.1
*
>Hi
gh sc
hoolc
10.6
0.10
8.9
0.10
0.4
0.03
1.7
0.08
8.4
0.11
9.0
0.10
7.7
0.10
0.6
0.03
1.3
0.06
7.1
0.11
-1.6
*-1
.2*
0.2*
-1.4
*
Ciga
rett
e sm
okin
g hi
stor
y
Curre
nt sm
oker
12.0
0.19
7.6
0.13
1.5
0.12
4.3
0.14
6.2
0.15
10.7
*0.
207.
10.
151.
8*0.
113.
6*0.
165.
3*0.
14-1
.3*
-0.6
*0.
3-0
.9*
Form
er sm
oker
10.9
0.18
8.5
0.16
0.6
0.08
2.3
0.13
8.0
0.15
9.6*
0.15
7.7*
0.16
0.8
0.06
1.9*
0.09
6.9
0.16
-1.3
*-0
.9*
0.2*
-1.1
*
Neve
r sm
oked
c10
.20.
128.
30.
110.
60.
031.
90.
097.
70.
138.
70.
107.
40.
110.
70.
051.
30.
076.
70.
12-1
.5*
-0.9
*0.
1-1
.0*
Acc
essi
ble
vers
ion
at h
ttps
://w
ww
.cdc
.gov
/ora
lhea
lth/p
ublic
atio
ns/O
HSR
-201
9-ta
ble-
27.h
tml

PA
GE
45
Tabl
e 28
. Mea
n pe
rcen
tage
con
trib
utio
n of
unt
reat
ed d
ecay
ed (%
DT/
DFT
) or fi
lled
(% F
T/D
FT) p
erm
anen
t tee
th a
mon
g de
ntat
e ad
ults
ag
ed 2
0–64
yea
rs w
ith a
t lea
st o
ne u
ntre
ated
dec
ayed
or fi
lled
perm
anen
t too
th (D
FT ≥
1), b
y se
lect
ed c
hara
cter
istic
s, U
nite
d St
ates
, N
atio
nal H
ealth
and
Nut
ritio
n Ex
amin
atio
n Su
rvey
, 199
9–20
04 a
nd 2
011–
2016
Acce
ssib
le v
ersio
n at
htt
ps://
ww
w.c
dc.g
ov/o
ralh
ealth
/pub
licat
ions
/OH
SR-2
019-
tabl
e-28
.htm
l
Tabl
e 28
. Mea
n pe
rcen
tage
con
trib
utio
n of
unt
reat
ed d
ecay
ed (%
DT/
DFT
) or fi
lled
(% F
T/D
FT) p
erm
anen
t tee
th a
mon
g de
ntat
e ad
ults
age
d 20
–64
year
s with
at l
east
one
unt
reat
ed d
ecay
ed o
r fille
d pe
rman
ent t
ooth
(DFT
≥1)
, by
sele
cted
cha
ract
eris
tics,
Uni
ted
Stat
es, N
atio
nal H
ealth
and
Nut
ritio
n Ex
amin
atio
n Su
rvey
, 199
9–20
04 a
nd 2
011–
2016
Acce
ssib
le v
ersi
on a
t htt
ps://
ww
w.c
dc.g
ov/o
ralh
ealth
/pub
licat
ions
/OH
SR-2
019-
tabl
e-28
.htm
l
Not
es: A
ll es
timat
es a
re a
djus
ted
by a
ge (5
-yea
r gro
ups)
to th
e US
200
0 st
anda
rd p
opul
atio
n. S
E =
stan
dard
erro
r. FP
L =
fede
ral p
over
ty le
vel; <
100%
FPL
= p
oor;
100%
–199
% F
PL =
nea
r-poo
r; <
200%
FPL
= p
oor a
nd n
ear-p
oor c
ombi
ned;
and
≥20
0% F
PL =
not
-poo
r.
* P
< 0
.05
base
d on
t-te
st fo
r diff
eren
ces b
etw
een
two
perio
ds o
r tw
o gr
oups
with
in e
ach
char
acte
ristic
.a
Chan
ge in
per
cent
age
poin
ts fr
om 1
999–
2004
to 2
011–
2016
. Pos
itive
val
ue =
incr
ease
; neg
ativ
e va
lue
= d
ecre
ase.
b Ref
eren
ce g
roup
for c
ompa
rison
s with
in e
ach
char
acte
ristic
, 201
1–20
16.
Char
acte
rist
ic
1999
–200
420
11–2
016
Chan
ge in
%
DT/
DFT
aCh
ange
in
% F
T/D
FTa
% D
T/D
FT%
FT/
DFT
% D
T/D
FT%
FT/
DFT
Mea
nSE
Mea
nSE
Mea
nSE
Mea
nSE
Tota
l14
.10.
6885
.90.
6815
.80.
7484
.20.
741.
7-1
.7
Age
(yea
rs)
20–3
4b18
.70.
9881
.30.
9821
.21.
0678
.81.
062.
6-2
.6
35–4
912
.70.
8187
.40.
8114
.4*
0.93
85.6
*0.
931.
8-1
.8
50–6
410
.10.
7989
.90.
7910
.5*
0.85
89.5
*0.
840.
4-0
.4
Sex Male
b16
.40.
8883
.60.
8818
.70.
9081
.30.
902.
3-2
.3
Fem
ale11
.90.
6188
.10.
6113
.1*
0.73
86.9
*0.
731.
1-1
.1
Race
and
eth
nicit
y
Whi
te, n
on-H
ispan
icb10
.30.
9689
.70.
9612
.40.
8287
.60.
822.
2-2
.2
Blac
k, no
n-Hi
span
ic27
.91.
6172
.11.
6128
.2*
1.75
71.8
*1.
750.
3-0
.3
Mex
ican A
mer
ican
28.4
2.30
71.6
2.30
25.3
*1.
6974
.7*
1.69
-3.1
3.1
Pove
rty s
tatu
s
<10
0% FP
L30
.31.
5469
.71.
5431
.2*
1.16
68.8
*1.
160.
9-0
.9
100%
–199
% FP
L23
.71.
3176
.31.
3124
.0*
1.28
76.0
*1.
280.
3-0
.3
≥20
0% FP
Lb8.
40.
4991
.60.
499.
00.
5791
.00.
570.
7-0
.7
Pove
rty s
tatu
s
<20
0% FP
L26
.41.
2173
.61.
2127
.1*
1.04
73.0
*1.
040.
6-0
.6
≥20
0% FP
Lb8.
40.
4991
.60.
499.
00.
5791
.00.
570.
7-0
.7
Educ
atio
n
<Hi
gh sc
hool
33.6
1.68
66.5
1.68
33.8
*1.
3566
.2*
1.35
0.3
-0.3
High
scho
ol18
.20.
9881
.80.
9823
.5*
1.23
76.5
*1.
235.
3*-5
.3*
>Hi
gh sc
hoolb
6.9
0.45
93.1
0.45
9.7
0.53
90.3
0.53
2.8*
-2.8
*
Ciga
rett
e sm
okin
g hi
stor
y
Curre
nt sm
oker
23.3
1.31
76.7
1.31
28.1
*1.
3572
.0*
1.35
4.8*
-4.8
*
Form
er sm
oker
9.9
0.94
90.1
0.94
14.1
*0.
9286
.0*
0.91
4.2*
-4.2
*
Neve
r sm
oked
b11
.20.
5888
.90.
5811
.80.
7888
.20.
780.
7-0
.7
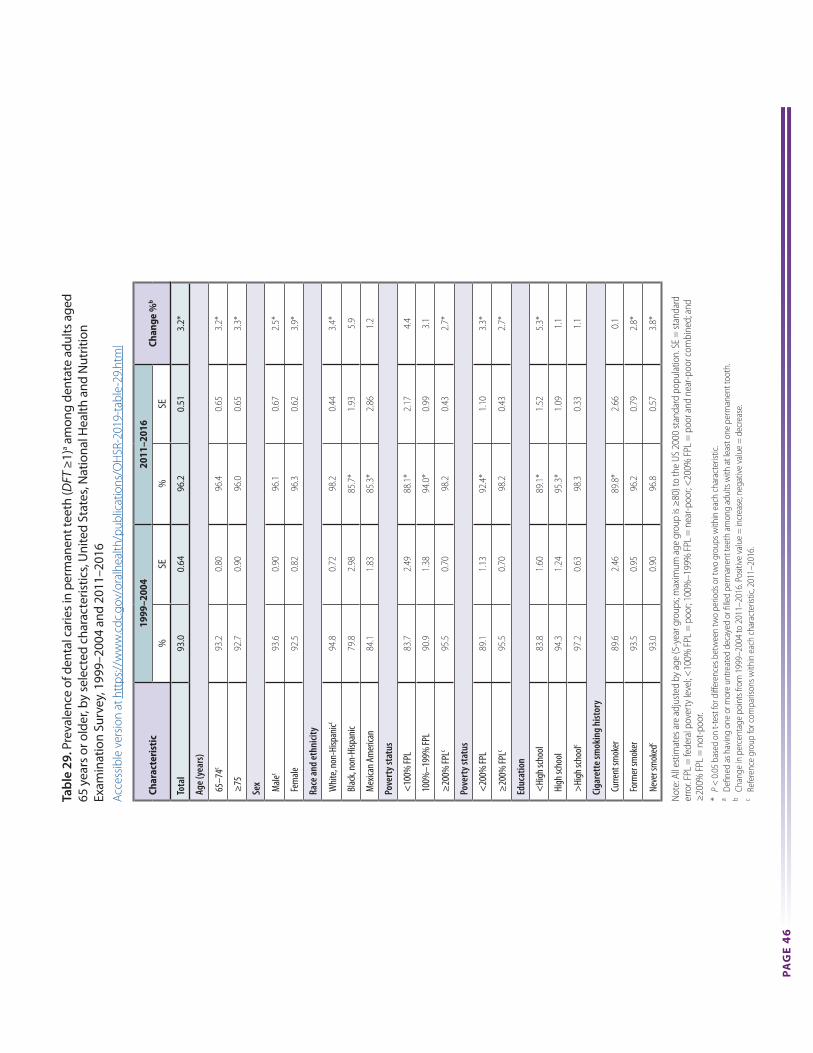
PA
GE
46
Tabl
e 29
. Pre
vale
nce
of d
enta
l car
ies
in p
erm
anen
t tee
th (D
FT ≥
1)a a
mon
g de
ntat
e ad
ults
age
d
65 y
ears
or o
lder
, by
sele
cted
cha
ract
eris
tics,
Uni
ted
Stat
es, N
atio
nal H
ealth
and
Nut
ritio
n Ex
amin
atio
n Su
rvey
, 199
9–20
04 a
nd 2
011–
2016
Acce
ssib
le v
ersio
n at
htt
ps://
ww
w.c
dc.g
ov/o
ralh
ealth
/pub
licat
ions
/OH
SR-2
019-
tabl
e-29
.htm
l
Tabl
e 29
. Pre
vale
nce
of d
enta
l car
ies i
n pe
rman
ent t
eeth
(DFT
≥1)
a am
ong
dent
ate
adul
ts a
ged
65
yea
rs o
r old
er, b
y se
lect
ed c
hara
cter
istic
s, U
nite
d St
ates
, Nat
iona
l Hea
lth a
nd N
utrit
ion
Exam
inat
ion
Surv
ey, 1
999–
2004
and
201
1–20
16
Acce
ssib
le v
ersi
on a
t htt
ps://
ww
w.c
dc.g
ov/o
ralh
ealth
/pub
licat
ions
/OH
SR-2
019-
tabl
e-29
.htm
l
Not
e: A
ll es
timat
es a
re a
djus
ted
by a
ge (5
-yea
r gro
ups;
max
imum
age
gro
up is
≥80
) to
the
US 2
000
stan
dard
pop
ulat
ion.
SE
= st
anda
rd
erro
r. FP
L =
fede
ral p
over
ty le
vel; <
100%
FPL
= p
oor;
100%
–199
% F
PL =
nea
r-poo
r; <
200%
FPL
= p
oor a
nd n
ear-p
oor c
ombi
ned;
and
≥
200%
FPL
= n
ot-p
oor.
* P
< 0
.05
base
d on
t-te
st fo
r diff
eren
ces b
etw
een
two
perio
ds o
r tw
o gr
oups
with
in e
ach
char
acte
ristic
.a
Defi
ned
as h
avin
g on
e or
mor
e un
treat
ed d
ecay
ed o
r fille
d pe
rman
ent t
eeth
am
ong
adul
ts w
ith a
t lea
st o
ne p
erm
anen
t too
th.
b Cha
nge
in p
erce
ntag
e po
ints
from
199
9–20
04 to
201
1–20
16. P
ositi
ve v
alue
= in
crea
se; n
egat
ive
valu
e =
dec
reas
e.c
Refe
renc
e gr
oup
for c
ompa
rison
s with
in e
ach
char
acte
ristic
, 201
1–20
16.
Char
acte
rist
ic19
99–2
004
2011
–201
6Ch
ange
%b
%SE
%SE
Tota
l93
.00.
6496
.20.
513.
2*
Age
(yea
rs)
65–7
4c93
.20.
8096
.40.
653.
2*
≥75
92.7
0.90
96.0
0.65
3.3*
Sex Male
c93
.60.
9096
.10.
672.
5*
Fem
ale92
.50.
8296
.30.
623.
9*
Race
and
eth
nicit
y
Whi
te, n
on-H
ispan
icc94
.80.
7298
.20.
443.
4*
Blac
k, no
n-Hi
span
ic79
.82.
9885
.7*
1.93
5.9
Mex
ican A
mer
ican
84.1
1.83
85.3
*2.
861.
2
Pove
rty s
tatu
s
<10
0% FP
L83
.72.
4988
.1*
2.17
4.4
100%
–199
% FP
L90
.91.
3894
.0*
0.99
3.1
≥20
0% FP
Lc95
.50.
7098
.20.
432.
7*
Pove
rty s
tatu
s
<20
0% FP
L89
.11.
1392
.4*
1.10
3.3*
≥20
0% FP
Lc95
.50.
7098
.20.
432.
7*
Educ
atio
n
<Hi
gh sc
hool
83.8
1.60
89.1
*1.
525.
3*
High
scho
ol94
.31.
2495
.3*
1.09
1.1
>Hi
gh sc
hoolc
97.2
0.63
98.3
0.33
1.1
Ciga
rett
e sm
okin
g hi
stor
y
Curre
nt sm
oker
89.6
2.46
89.8
*2.
660.
1
Form
er sm
oker
93.5
0.95
96.2
0.79
2.8*
Neve
r sm
oked
c93
.00.
9096
.80.
573.
8*

PA
GE
47
Tabl
e 30
. Pre
vale
nce
of u
ntre
ated
toot
h de
cay
in p
erm
anen
t tee
th (D
T ≥
1)a a
mon
g de
ntat
e ad
ults
ag
ed 6
5 ye
ars
or o
lder
, by
sele
cted
cha
ract
eris
tics,
Uni
ted
Stat
es, N
atio
nal H
ealth
and
Nut
ritio
n Ex
amin
atio
n Su
rvey
, 199
9–20
04 a
nd 2
011–
2016
Acce
ssib
le v
ersio
n at
htt
ps://
ww
w.c
dc.g
ov/o
ralh
ealth
/pub
licat
ions
/OH
SR-2
019-
tabl
e-30
.htm
l
Tabl
e 30
. Pre
vale
nce
of u
ntre
ated
toot
h de
cay
in p
erm
anen
t tee
th (D
T ≥1
)a am
ong
dent
ate
adul
ts
aged
65
year
s or o
lder
, by
sele
cted
cha
ract
eris
tics,
Uni
ted
Stat
es, N
atio
nal H
ealth
and
Nut
ritio
n Ex
amin
atio
n Su
rvey
, 199
9–20
04 a
nd 2
011–
2016
Acce
ssib
le v
ersi
on a
t htt
ps://
ww
w.c
dc.g
ov/o
ralh
ealth
/pub
licat
ions
/OH
SR-2
019-
tabl
e-30
.htm
l
Not
e: A
ll es
timat
es a
re a
djus
ted
by a
ge (5
-yea
r gro
ups;
max
imum
age
gro
up is
≥80
) to
the
US 2
000
stan
dard
pop
ulat
ion.
SE
= st
anda
rd e
rror.
FPL
= fe
dera
l pov
erty
leve
l; <10
0% F
PL =
poo
r; 10
0%–1
99%
FPL
= n
ear-p
oor;
<20
0% F
PL =
poo
r and
nea
r-poo
r com
bine
d; a
nd ≥
200%
FPL
=
not
-poo
r.
* P
< 0
.05
base
d on
t-te
st fo
r diff
eren
ces b
etw
een
two
perio
ds o
r tw
o gr
oups
with
in e
ach
char
acte
ristic
.a
Defi
ned
as h
avin
g on
e or
mor
e un
treat
ed d
ecay
ed p
erm
anen
t tee
th a
mon
g ad
ults
with
at l
east
one
per
man
ent t
ooth
.b C
hang
e in
per
cent
age
poin
ts fr
om 1
999–
2004
to 2
011–
2016
. Pos
itive
val
ue =
incr
ease
; neg
ativ
e va
lue
= d
ecre
ase.
c Re
fere
nce
grou
p fo
r com
paris
ons w
ithin
eac
h ch
arac
teris
tic, 2
011–
2016
.
Char
acte
rist
ic19
99–2
004
2011
–201
6Ch
ange
%b
%SE
%SE
Tota
l18
.11.
0115
.91.
20-2
.2
Age
(yea
rs)
65–7
4c17
.01.
3715
.41.
55-1
.6
≥75
19.5
1.28
16.5
1.40
-3.0
Sex Male
c20
.41.
3418
.01.
53-2
.4
Fem
ale16
.41.
1814
.2*
1.25
-2.3
Race
and
eth
nicit
y
Whi
te, n
on-H
ispan
icc15
.81.
2413
.41.
25-2
.4
Blac
k, no
n-Hi
span
ic37
.13.
4829
.1*
2.49
-8.0
Mex
ican A
mer
ican
42.1
3.07
35.9
*3.
24-6
.2
Pove
rty s
tatu
s
<10
0% FP
L33
.43.
4233
.1*
3.18
-0.3
100%
–199
% FP
L23
.81.
7526
.9*
2.64
3.1
≥20
0% FP
Lc14
.21.
209.
91.
27-4
.3*
Pove
rty s
tatu
s
<20
0% FP
L26
.21.
7528
.6*
2.30
2.4
≥20
0% FP
Lc14
.21.
209.
91.
27-4
.3*
Educ
atio
n
<Hi
gh sc
hool
26.2
2.33
30.8
*2.
764.
7
High
scho
ol17
.71.
3918
.8*
2.22
1.1
>Hi
gh sc
hoolc
14.2
1.27
11.7
1.35
-2.5
Ciga
rett
e sm
okin
g h
istor
y
Curre
nt sm
oker
27.6
3.66
33.9
*5.
106.
3
Form
er sm
oker
18.6
1.31
15.3
1.67
-3.3
Neve
r sm
oked
c16
.51.
3014
.21.
37-2
.4

PA
GE
48
Tabl
e 31
. Mea
n nu
mbe
r of u
ntre
ated
dec
ayed
(DT)
, mis
sing
(MT)
, fille
d (F
T), u
ntre
ated
dec
ayed
or fi
lled
(DFT
), an
d un
trea
ted
deca
yed,
mis
sing
, or fi
lled
(DM
FT)
perm
anen
t tee
tha a
mon
g de
ntat
e ad
ults
age
d 65
yea
rs o
r old
er, b
y se
lect
ed c
hara
cter
istic
s, U
nite
d St
ates
, Nat
iona
l Hea
lth a
nd N
utrit
ion
Exam
inat
ion
Surv
ey,
1999
–200
4 an
d 20
11–2
016
Acce
ssib
le v
ersio
n at
htt
ps://
ww
w.c
dc.g
ov/o
ralh
ealth
/pub
licat
ions
/OH
SR-2
019-
tabl
e-31
.htm
l
Tabl
e 31
. Mea
n nu
mbe
r of u
ntre
ated
dec
ayed
(DT)
, mis
sing
(MT)
, fille
d (F
T), u
ntre
ated
dec
ayed
or fi
lled
(DFT
), an
d un
trea
ted
deca
yed,
mis
sing
, or fi
lled
(DM
FT)
perm
anen
t tee
tha a
mon
g de
ntat
e ad
ults
age
d 65
yea
rs o
r old
er, b
y se
lect
ed c
hara
cter
istic
s, U
nite
d St
ates
, Nat
iona
l Hea
lth a
nd N
utrit
ion
Exam
inat
ion
Surv
ey,
1999
–200
4 an
d 20
11–2
016
Acce
ssib
le v
ersi
on a
t htt
ps://
ww
w.c
dc.g
ov/o
ralh
ealth
/pub
licat
ions
/OH
SR-2
019-
tabl
e-31
.htm
l
Not
e: A
ll es
timat
es a
re a
djus
ted
by a
ge (5
-yea
r gro
ups;
max
imum
age
gro
up is
≥80
) to
the
US 2
000
stan
dard
pop
ulat
ion.
SE
= st
anda
rd e
rror.
FPL
= fe
dera
l pov
erty
leve
l; <10
0% F
PL =
poo
r; 10
0%–1
99%
FPL
= n
ear-p
oor;
<20
0% F
PL =
poo
r an
d ne
ar-p
oor c
ombi
ned;
and
≥20
0% F
PL =
not
-poo
r. 0.
0 =
zero
due
to ro
undi
ng.
* P
< 0
.05
base
d on
t-te
st fo
r diff
eren
ces b
etw
een
two
perio
ds o
r tw
o gr
oups
with
in e
ach
char
acte
ristic
.a
Incl
udes
old
er a
dults
with
at l
east
one
per
man
ent t
ooth
pre
sent
. Miss
ing
teet
h in
clud
e te
eth
“miss
ing
due
to d
iseas
e” (d
enta
l car
ies o
r per
iodo
ntal
dise
ases
).b C
hang
e fro
m 1
999–
2004
to 2
011–
2016
. Pos
itive
val
ue =
incr
ease
; neg
ativ
e va
lue
= d
ecre
ase.
c Re
fere
nce
grou
p fo
r com
paris
ons w
ithin
eac
h ch
arac
teris
tic, 2
011–
2016
.
Char
acte
rist
ic
1999
–200
420
11–2
016
Chan
gein
DM
FTb
Chan
gein DFT
b
Chan
gein DTb
Chan
gein FT
bD
MFT
DFT
DT
MT
FTD
MFT
DFT
DT
MT
FT
Mea
nSE
Mea
nSE
Mea
nSE
Mea
nSE
Mea
nSE
Mea
nSE
Mea
nSE
Mea
nSE
Mea
nSE
Mea
nSE
Tota
l18
.00.
239.
10.
210.
40.
048.
80.
238.
70.
2316
.70.
1410
.10.
200.
30.
036.
60.
219.
80.
21-1
.2*
0.9*
-0.1
*1.
0*
Age
(yea
rs)
65–7
4c17
.70.
259.
30.
240.
40.
058.
30.
289.
00.
2615
.90.
2110
.20.
230.
30.
035.
60.
239.
90.
24-1
.8*
0.9*
-0.1
1.0*
≥75
18.3
0.29
8.9
0.26
0.5
0.05
9.4
0.30
8.4
0.28
17.8
*0.
219.
90.
270.
30.
037.
9*0.
309.
60.
28-0
.51.
0*-0
.2*
1.1*
Sex Male
c17
.60.
278.
90.
220.
50.
058.
70.
298.
30.
2516
.60.
2210
.10.
260.
40.
046.
50.
289.
70.
27-1
.0*
1.2*
-0.1
1.4*
Fem
ale18
.30.
259.
30.
270.
40.
049.
00.
289.
00.
2916
.90.
1710
.00.
220.
3*0.
036.
80.
259.
80.
23-1
.5*
0.7
-0.1
0.8*
Race
and
eth
nicit
y
Whi
te, n
on-H
ispan
icc18
.20.
249.
90.
220.
40.
048.
30.
259.
60.
2416
.80.
1711
.10.
190.
30.
035.
80.
2210
.80.
19-1
.4*
1.1*
-0.1
1.2*
Blac
k, no
n-Hi
span
ic16
.90.
404.
20.
311.
10.
1512
.70.
493.
20.
3016
.20.
405.
1*0.
270.
7*0.
0811
.2*
0.43
4.4*
0.29
-0.7
0.9*
-0.4
*1.
3*
Mex
ican A
mer
ican
15.3
0.42
5.4
0.45
1.2
0.09
9.9
0.36
4.2
0.48
14.6
*0.
605.
7*0.
531.
0*0.
158.
8*0.
454.
8*0.
53-0
.70.
4-0
.20.
6
Pove
rty s
tatu
s
<10
0% FP
L17
.30.
515.
10.
381.
00.
1512
.20.
734.
10.
3516
.50.
425.
7*0.
430.
9*0.
1010
.8*
0.54
4.8*
0.45
-0.8
0.6
-0.2
0.7
100%
–199
% FP
L18
.20.
487.
40.
390.
60.
0710
.80.
526.
90.
4217
.00.
298.
2*0.
280.
6*0.
078.
8*0.
397.
6*0.
29-1
.2*
0.8
0.0
0.7
≥20
0% FP
Lc18
.10.
2110
.50.
160.
30.
047.
60.
2210
.20.
1716
.80.
1911
.50.
210.
20.
035.
30.
2111
.30.
21-1
.4*
1.0*
-0.1
*1.
1*
Pove
rty s
tatu
s
<20
0% FP
L18
.00.
466.
80.
310.
70.
0811
.10.
476.
20.
3416
.80.
257.
5*0.
280.
7*0.
079.
3*0.
346.
8*0.
30-1
.1*
0.7
0.0
0.7
≥20
0% FP
Lc18
.10.
2110
.50.
160.
30.
047.
60.
2210
.20.
1716
.80.
1911
.50.
210.
20.
035.
30.
2111
.30.
21-1
.4*
1.0*
-0.1
*1.
1*
Educ
atio
n
<Hi
gh sc
hool
17.7
0.37
5.7
0.30
0.8
0.11
12.0
0.39
4.9
0.36
16.5
0.38
6.1*
0.27
0.7*
0.08
10.3
*0.
375.
4*0.
28-1
.2*
0.5
0.0
0.5
High
scho
ol18
.40.
348.
80.
290.
40.
069.
60.
368.
40.
3017
.10.
328.
9*0.
400.
4*0.
058.
1*0.
348.
5*0.
41-1
.3*
0.2
0.0
0.1
>Hi
gh sc
hoolc
17.9
0.23
11.2
0.21
0.3
0.04
6.7
0.25
10.9
0.22
16.7
0.20
11.4
0.20
0.2
0.03
5.2
0.22
11.2
0.21
-1.2
*0.
2-0
.10.
3
Ciga
rett
e sm
okin
g hi
stor
y
Curre
nt sm
oker
19.0
0.49
6.5
0.59
0.8
0.14
12.5
0.73
5.7
0.61
18.0
*0.
577.
2*0.
690.
8*0.
1510
.8*
0.77
6.4*
0.74
-1.0
0.7
0.0
0.7
Form
er sm
oker
18.4
0.24
8.8
0.22
0.4
0.05
9.6
0.29
8.4
0.24
17.2
*0.
2410
.00.
260.
30.
047.
2*0.
309.
70.
27-1
.2*
1.2*
-0.1
1.3*
Neve
r sm
oked
c17
.50.
319.
70.
290.
40.
057.
80.
339.
30.
3216
.10.
1910
.40.
260.
30.
035.
70.
2610
.10.
27-1
.4*
0.7
-0.1
0.8

PA
GE
49
Tabl
e 32
. Mea
n pe
rcen
tage
con
trib
utio
n of
unt
reat
ed d
ecay
ed (%
DT/
DFT
) or fi
lled
(% F
T/D
FT) p
erm
anen
t tee
th a
mon
g de
ntat
e ad
ults
age
d 65
yea
rs o
r old
er w
ith a
t lea
st o
ne u
ntre
ated
dec
ayed
or fi
lled
perm
anen
t too
th (D
FT ≥
1), b
y se
lect
ed c
hara
cter
istic
s,
Uni
ted
Stat
es, N
atio
nal H
ealth
and
Nut
ritio
n Ex
amin
atio
n Su
rvey
, 199
9–20
04 a
nd 2
011–
2016
Acce
ssib
le v
ersio
n at
htt
ps://
ww
w.c
dc.g
ov/o
ralh
ealth
/pub
licat
ions
/OH
SR-2
019-
tabl
e-32
.htm
l
Tabl
e 32
. Mea
n pe
rcen
tage
con
trib
utio
n of
unt
reat
ed d
ecay
ed (%
DT/
DFT
) or fi
lled
(% F
T/D
FT) p
erm
anen
t tee
th a
mon
g de
ntat
e ad
ults
age
d 65
yea
rs o
r old
er w
ith a
t lea
st o
ne u
ntre
ated
dec
ayed
or fi
lled
perm
anen
t too
th (D
FT ≥
1), b
y se
lect
ed c
hara
cter
istic
s, U
nite
d St
ates
, Nat
iona
l Hea
lth a
nd N
utrit
ion
Exam
inat
ion
Surv
ey, 1
999–
2004
and
201
1–20
16
Acce
ssib
le v
ersi
on a
t htt
ps://
ww
w.c
dc.g
ov/o
ralh
ealth
/pub
licat
ions
/OH
SR-2
019-
tabl
e-32
.htm
l
Not
e: A
ll es
timat
es a
re a
djus
ted
by a
ge (5
-yea
r gro
ups;
max
imum
age
gro
up is
≥80
) to
the
US 2
000
stan
dard
pop
ulat
ion.
SE
= st
anda
rd e
rror.
FPL
= fe
dera
l pov
erty
leve
l; <10
0% F
PL =
poo
r; 10
0%–1
99%
FPL
= n
ear-p
oor;
<20
0% F
PL =
poo
r and
nea
r-poo
r com
bine
d; a
nd ≥
200%
FPL
= n
ot-p
oor.
* P
< 0
.05
base
d on
t-te
st fo
r diff
eren
ces b
etw
een
two
perio
ds o
r tw
o gr
oups
with
in e
ach
char
acte
ristic
.a
Chan
ge in
per
cent
age
poin
ts fr
om 1
999–
2004
to 2
011–
2016
. Pos
itive
val
ue =
incr
ease
; neg
ativ
e va
lue
= d
ecre
ase.
b Ref
eren
ce g
roup
for c
ompa
rison
s with
in e
ach
char
acte
ristic
, 201
1–20
16.
Char
acte
rist
ic
1999
–200
420
11–2
016
Chan
ge in
% D
T/D
FTa
Chan
ge in
% F
T/D
FTa
% D
T/D
FT%
FT/
DFT
% D
T/D
FT%
FT/
DFT
Mea
nSE
Mea
nSE
Mea
nSE
Mea
nSE
Tota
l8.
80.
6891
.20.
686.
70.
5593
.30.
55-2
.1*
2.1*
Age
(yea
rs)
65–7
4b8.
40.
8291
.60.
826.
30.
6393
.70.
63-2
.2*
2.2*
≥75
9.2
0.85
90.8
0.85
7.3
0.85
92.7
0.85
-1.9
1.9
Sex Male
b10
.80.
8889
.20.
888.
30.
7891
.70.
78-2
.5*
2.5*
Fem
ale7.
30.
7592
.70.
755.
4*0.
5694
.6*
0.56
-1.9
*1.
9*
Race
and
eth
nicit
y
Whi
te, n
on-H
ispan
icb6.
50.
7893
.50.
784.
40.
4095
.60.
40-2
.1*
2.1*
Blac
k, no
n-Hi
span
ic32
.03.
8068
.03.
8021
.0*
2.30
79.0
*2.
29-1
1.0*
11.0
*
Mex
ican A
mer
ican
31.8
3.22
68.3
3.23
28.5
*3.
8371
.5*
3.83
-3.3
3.3
Pove
rty s
tatu
s
<10
0% FP
L25
.93.
1374
.13.
1324
.1*
2.60
75.9
*2.
60-1
.81.
8
100%
–199
% FP
L13
.11.
2986
.91.
2912
.6*
1.36
87.4
*1.
36-0
.50.
5
≥20
0% FP
Lb4.
90.
5195
.20.
512.
80.
3597
.20.
34-2
.1*
2.1*
Pove
rty s
tatu
s
<20
0% FP
L16
.21.
5183
.81.
5115
.7*
1.43
84.3
*1.
43-0
.40.
4
≥20
0% FP
Lb4.
90.
5195
.20.
512.
80.
3597
.20.
34-2
.1*
2.1*
Educ
atio
n
<Hi
gh sc
hool
19.4
2.17
80.6
2.17
19.9
*1.
7780
.1*
1.77
0.6
-0.6
High
scho
ol7.
40.
8492
.60.
848.
1*1.
1791
.9*
1.17
0.6
-0.6
>Hi
gh sc
hoolb
4.8
0.59
95.2
0.59
3.5
0.44
96.5
0.44
-1.3
1.3
Ciga
rett
e sm
okin
g hi
stor
y
Curre
nt sm
oker
17.5
2.91
82.5
2.91
21.4
*3.
5178
.6*
3.51
3.9
-3.9
Form
er sm
oker
8.5
0.87
91.5
0.87
6.5
0.81
93.5
0.81
-2.0
2.0
Neve
r sm
oked
b8.
00.
8092
.00.
805.
50.
5594
.50.
55-2
.5*
2.5*
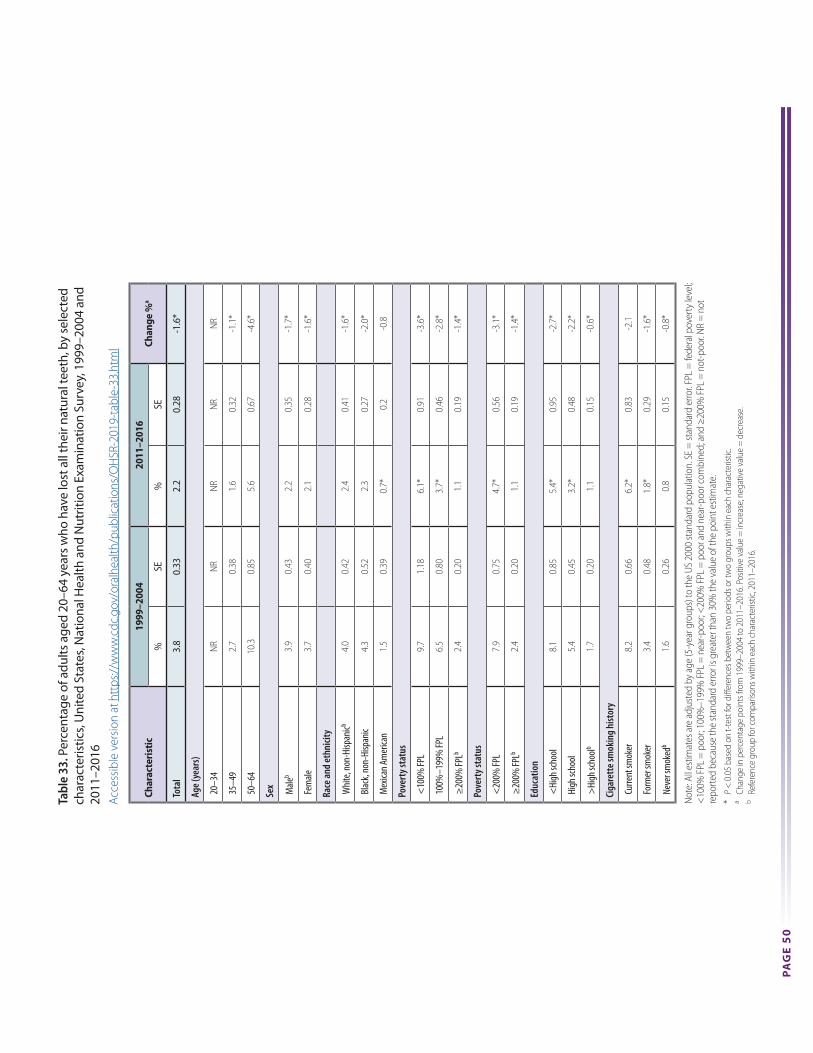
PA
GE
50
Tabl
e 33
. Per
cent
age
of a
dults
age
d 20
–64
year
s w
ho h
ave
lost
all
thei
r nat
ural
teet
h, b
y se
lect
ed
char
acte
ristic
s, U
nite
d St
ates
, Nat
iona
l Hea
lth a
nd N
utrit
ion
Exam
inat
ion
Surv
ey, 1
999–
2004
and
20
11–2
016
Acce
ssib
le v
ersio
n at
htt
ps://
ww
w.c
dc.g
ov/o
ralh
ealth
/pub
licat
ions
/OH
SR-2
019-
tabl
e-33
.htm
l
Tabl
e 33
. Per
cent
age
of a
dults
age
d 20
–64
year
s who
hav
e lo
st a
ll th
eir n
atur
al te
eth,
by
sele
cted
ch
arac
teris
tics,
Uni
ted
Stat
es, N
atio
nal H
ealth
and
Nut
ritio
n Ex
amin
atio
n Su
rvey
, 199
9–20
04 a
nd
2011
–201
6Ac
cess
ible
ver
sion
at h
ttps
://w
ww
.cdc
.gov
/ora
lhea
lth/p
ublic
atio
ns/O
HSR
-201
9-ta
ble-
33.h
tml
Not
e: A
ll es
timat
es a
re a
djus
ted
by a
ge (5
-yea
r gro
ups)
to th
e US
200
0 st
anda
rd p
opul
atio
n. S
E =
stan
dard
erro
r. FP
L =
fede
ral p
over
ty le
vel;
<10
0% F
PL =
poo
r; 10
0%–1
99%
FPL
= n
ear-p
oor;
<20
0% F
PL =
poo
r and
nea
r-poo
r com
bine
d; a
nd ≥
200%
FPL
= n
ot-p
oor.
NR
= n
ot
repo
rted
beca
use
the
stan
dard
erro
r is g
reat
er th
an 3
0% th
e va
lue
of th
e po
int e
stim
ate.
* P
< 0
.05
base
d on
t-te
st fo
r diff
eren
ces b
etw
een
two
perio
ds o
r tw
o gr
oups
with
in e
ach
char
acte
ristic
.a
Chan
ge in
per
cent
age
poin
ts fr
om 1
999–
2004
to 2
011–
2016
. Pos
itive
val
ue =
incr
ease
; neg
ativ
e va
lue
= d
ecre
ase.
b Ref
eren
ce g
roup
for c
ompa
rison
s with
in e
ach
char
acte
ristic
, 201
1–20
16.
Char
acte
rist
ic19
99–2
004
2011
–201
6Ch
ange
%a
%SE
%SE
Tota
l3.
80.
332.
20.
28-1
.6*
Age
(yea
rs)
20–3
4N
RN
RN
RN
RN
R
35–4
92.
70.
381.
60.
32-1
.1*
50–6
410
.30.
855.
60.
67-4
.6*
Sex Male
b3.
90.
432.
20.
35-1
.7*
Fem
ale3.
70.
402.
10.
28-1
.6*
Race
and
eth
nicit
y
Whi
te, n
on-H
ispan
icb4.
00.
422.
40.
41-1
.6*
Blac
k, no
n-Hi
span
ic4.
30.
522.
30.
27-2
.0*
Mex
ican A
mer
ican
1.5
0.39
0.7*
0.2
-0.8
Pove
rty s
tatu
s
<10
0% FP
L9.
71.
186.
1*0.
91-3
.6*
100%
–199
% FP
L6.
50.
803.
7*0.
46-2
.8*
≥20
0% FP
Lb2.
40.
201.
10.
19-1
.4*
Pove
rty s
tatu
s
<20
0% FP
L7.
90.
754.
7*0.
56-3
.1*
≥20
0% FP
Lb2.
40.
201.
10.
19-1
.4*
Educ
atio
n
<Hi
gh sc
hool
8.1
0.85
5.4*
0.95
-2.7
*
High
scho
ol5.
40.
453.
2*0.
48-2
.2*
>Hi
gh sc
hoolb
1.7
0.20
1.1
0.15
-0.6
*
Ciga
rett
e sm
okin
g hi
stor
y
Curre
nt sm
oker
8.2
0.66
6.2*
0.83
-2.1
Form
er sm
oker
3.4
0.48
1.8*
0.29
-1.6
*
Neve
r sm
oked
b1.
60.
260.
80.
15-0
.8*

PA
GE
51
Tabl
e 34
. Mea
n nu
mbe
r of p
erm
anen
t tee
th a
mon
g de
ntat
e ad
ults
age
d 20
–64
year
s, b
y se
lect
ed
char
acte
ristic
s, U
nite
d St
ates
, Nat
iona
l Hea
lth a
nd N
utrit
ion
Exam
inat
ion
Surv
ey, 1
999–
2004
and
20
11–2
016
Acce
ssib
le v
ersio
n at
htt
ps://
ww
w.c
dc.g
ov/o
ralh
ealth
/pub
licat
ions
/OH
SR-2
019-
tabl
e-34
.htm
l
Tabl
e 34
. Mea
n nu
mbe
r of p
erm
anen
t tee
th a
mon
g de
ntat
e ad
ults
age
d 20
–64
year
s, by
sele
cted
ch
arac
teris
tics,
Uni
ted
Stat
es, N
atio
nal H
ealth
and
Nut
ritio
n Ex
amin
atio
n Su
rvey
, 199
9–20
04 a
nd
2011
–201
6Ac
cess
ible
ver
sion
at h
ttps
://w
ww
.cdc
.gov
/ora
lhea
lth/p
ublic
atio
ns/O
HSR
-201
9-ta
ble-
34.h
tml
Not
e: A
ll es
timat
es a
re a
djus
ted
by a
ge (5
-yea
r gro
ups)
to th
e US
200
0 st
anda
rd p
opul
atio
n. S
E =
stan
dard
erro
r. FP
L =
fede
ral p
over
ty le
vel;
<10
0% F
PL =
poo
r; 10
0%–1
99%
FPL
= n
ear-p
oor;
<20
0% F
PL =
poo
r and
nea
r-poo
r com
bine
d; a
nd ≥
200%
FPL
= n
ot-p
oor.
* P
< 0
.05
base
d on
t-te
st fo
r diff
eren
ces b
etw
een
two
perio
ds o
r tw
o gr
oups
with
in e
ach
char
acte
ristic
.a
Chan
ge fr
om 1
999–
2004
to 2
011–
2016
. Pos
itive
val
ue =
incr
ease
; neg
ativ
e va
lue
= d
ecre
ase.
b Ref
eren
ce g
roup
for c
ompa
rison
s with
in e
ach
char
acte
ristic
, 201
1–20
16.
Char
acte
rist
ic
1999
–200
420
11–2
016
Chan
gea
Mea
nSE
Mea
nSE
Tota
l24
.90.
0925
.50.
070.
5*
Age
(yea
rs)
20–3
4b26
.90.
0527
.00.
050.
1
35–4
925
.00.
1025
.5*
0.10
0.5*
50–6
422
.20.
2223
.4*
0.17
1.1*
Sex Male
b25
.00.
1325
.50.
090.
5*
Fem
ale24
.90.
0825
.50.
080.
6*
Race
and
eth
nicit
y
Whi
te, n
on-H
ispan
icb25
.20.
1225
.70.
100.
5*
Blac
k, no
n-Hi
span
ic23
.60.
1324
.2*
0.14
0.6*
Mex
ican A
mer
ican
25.2
0.07
25.4
*0.
110.
2
Pove
rty s
tatu
s
<10
0% FP
L23
.30.
1723
.6*
0.18
0.2
100%
–199
% FP
L23
.50.
1824
.4*
0.11
0.9*
≥20
0% FP
Lb25
.50.
0826
.10.
060.
7*
Pove
rty s
tatu
s
<20
0% FP
L23
.40.
1524
.1*
0.12
0.6*
≥20
0% FP
Lb25
.50.
0826
.10.
060.
7*
Educ
atio
n
<Hi
gh sc
hool
23.0
0.17
23.8
*0.
170.
8*
High
scho
ol24
.30.
1624
.5*
0.13
0.2
>Hi
gh sc
hoolb
25.7
0.07
26.1
0.07
0.4*
Ciga
rett
e sm
okin
g hi
stor
y
Curre
nt sm
oker
23.3
0.16
23.5
*0.
180.
2
Form
er sm
oker
25.1
0.12
25.5
*0.
100.
4*
Neve
r sm
oked
b25
.60.
0826
.10.
060.
5*
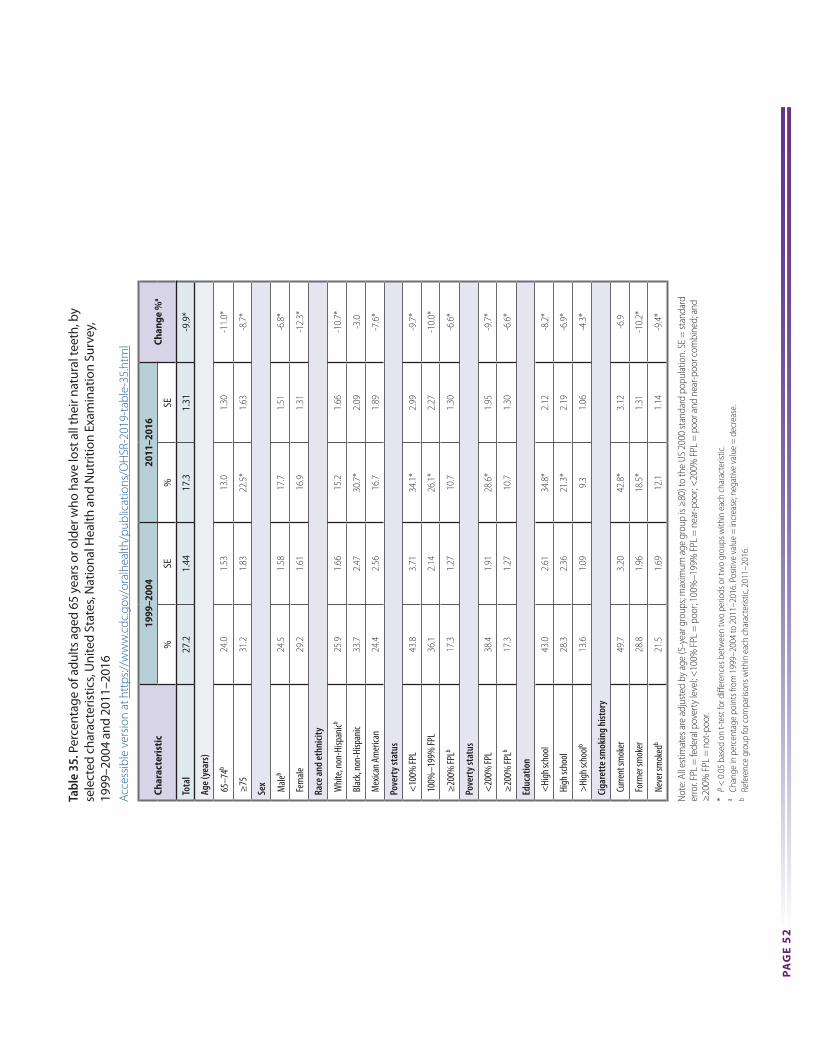
PA
GE
52
Tabl
e 35
. Per
cent
age
of a
dults
age
d 65
yea
rs o
r old
er w
ho h
ave
lost
all
thei
r nat
ural
teet
h, b
y se
lect
ed c
hara
cter
istic
s, U
nite
d St
ates
, Nat
iona
l Hea
lth a
nd N
utrit
ion
Exam
inat
ion
Surv
ey,
1999
–200
4 an
d 20
11–2
016
Acce
ssib
le v
ersio
n at
htt
ps://
ww
w.c
dc.g
ov/o
ralh
ealth
/pub
licat
ions
/OH
SR-2
019-
tabl
e-35
.htm
l
Tabl
e 35
. Per
cent
age
of a
dults
age
d 65
yea
rs o
r old
er w
ho h
ave
lost
all
thei
r nat
ural
teet
h, b
y se
lect
ed c
hara
cter
istic
s, U
nite
d St
ates
, Nat
iona
l Hea
lth a
nd N
utrit
ion
Exam
inat
ion
Surv
ey,
1999
–200
4 an
d 20
11–2
016
Acce
ssib
le v
ersi
on a
t htt
ps://
ww
w.c
dc.g
ov/o
ralh
ealth
/pub
licat
ions
/OH
SR-2
019-
tabl
e-35
.htm
l
Not
e: A
ll es
timat
es a
re a
djus
ted
by a
ge (5
-yea
r gro
ups;
max
imum
age
gro
up is
≥80
) to
the
US 2
000
stan
dard
pop
ulat
ion.
SE
= st
anda
rd
erro
r. FP
L =
fede
ral p
over
ty le
vel; <
100%
FPL
= p
oor;
100%
–199
% F
PL =
nea
r-poo
r; <
200%
FPL
= p
oor a
nd n
ear-p
oor c
ombi
ned;
and
≥
200%
FPL
= n
ot-p
oor.
* P
< 0
.05
base
d on
t-te
st fo
r diff
eren
ces b
etw
een
two
perio
ds o
r tw
o gr
oups
with
in e
ach
char
acte
ristic
.a
Chan
ge in
per
cent
age
poin
ts fr
om 1
999–
2004
to 2
011–
2016
. Pos
itive
val
ue =
incr
ease
; neg
ativ
e va
lue
= d
ecre
ase.
b Ref
eren
ce g
roup
for c
ompa
rison
s with
in e
ach
char
acte
ristic
, 201
1–20
16.
Char
acte
rist
ic19
99–2
004
2011
–201
6Ch
ange
%a
%SE
%SE
Tota
l27
.21.
4417
.31.
31-9
.9*
Age
(yea
rs)
65–7
4b24
.01.
5313
.01.
30-1
1.0*
≥75
31.2
1.83
22.5
*1.
63-8
.7*
Sex Male
b24
.51.
5817
.71.
51-6
.8*
Fem
ale29
.21.
6116
.91.
31-1
2.3*
Race
and
eth
nicit
y
Whi
te, n
on-H
ispan
icb25
.91.
6615
.21.
66-1
0.7*
Blac
k, no
n-Hi
span
ic33
.72.
4730
.7*
2.09
-3.0
Mex
ican A
mer
ican
24.4
2.56
16.7
1.89
-7.6
*
Pove
rty s
tatu
s
<10
0% FP
L43
.83.
7134
.1*
2.99
-9.7
*
100%
–199
% FP
L36
.12.
1426
.1*
2.27
-10.
0*
≥20
0% FP
Lb17
.31.
2710
.71.
30-6
.6*
Pove
rty s
tatu
s
<20
0% FP
L38
.41.
9128
.6*
1.95
-9.7
*
≥20
0% FP
Lb17
.31.
2710
.71.
30-6
.6*
Educ
atio
n
<Hi
gh sc
hool
43.0
2.61
34.8
*2.
12-8
.2*
High
scho
ol28
.32.
3621
.3*
2.19
-6.9
*
>Hi
gh sc
hoolb
13.6
1.09
9.3
1.06
-4.3
*
Ciga
rett
e sm
okin
g hi
stor
y
Curre
nt sm
oker
49.7
3.20
42.8
*3.
12-6
.9
Form
er sm
oker
28.8
1.96
18.5
*1.
31-1
0.2*
Neve
r sm
oked
b21
.51.
6912
.11.
14-9
.4*

PA
GE
53
Tabl
e 36
. Mea
n nu
mbe
r of p
erm
anen
t tee
th a
mon
g de
ntat
e ad
ults
65
year
s or
old
er, b
y se
lect
ed
char
acte
ristic
s, U
nite
d St
ates
, Nat
iona
l Hea
lth a
nd N
utrit
ion
Exam
inat
ion
Surv
ey, 1
999–
2004
an
d 20
11–2
016
Acce
ssib
le v
ersio
n at
htt
ps://
ww
w.c
dc.g
ov/o
ralh
ealth
/pub
licat
ions
/OH
SR-2
019-
tabl
e-36
.htm
l
Tabl
e 36
. Mea
n nu
mbe
r of p
erm
anen
t tee
th a
mon
g de
ntat
e ad
ults
65
year
s or o
lder
, by
sele
cted
ch
arac
teris
tics,
Uni
ted
Stat
es, N
atio
nal H
ealth
and
Nut
ritio
n Ex
amin
atio
n Su
rvey
, 199
9–20
04
and
2011
–201
6Ac
cess
ible
ver
sion
at h
ttps
://w
ww
.cdc
.gov
/ora
lhea
lth/p
ublic
atio
ns/O
HSR
-201
9-ta
ble-
36.h
tml
Not
e: A
ll es
timat
es a
re a
djus
ted
by a
ge (5
-yea
r gro
ups;
max
imum
age
gro
up is
≥80
) to
the
US 2
000
stan
dard
pop
ulat
ion.
SE
= st
anda
rd
erro
r. FP
L =
fede
ral p
over
ty le
vel; <
100%
FPL
= p
oor;
100%
–199
% F
PL =
nea
r-poo
r; <
200%
FPL
= p
oor a
nd n
ear-p
oor c
ombi
ned;
and
≥
200%
FPL
= n
ot-p
oor.
* P
< 0
.05
base
d on
t-te
st fo
r diff
eren
ces b
etw
een
two
perio
ds o
r tw
o gr
oups
with
in e
ach
char
acte
ristic
.a
Chan
ge fr
om 1
999–
2004
to 2
011–
2016
. Pos
itive
val
ue =
incr
ease
; neg
ativ
e va
lue
= d
ecre
ase.
b Ref
eren
ce g
roup
for c
ompa
rison
s with
in e
ach
char
acte
ristic
, 201
1–20
16.
Char
acte
rist
ic19
99–2
004
2011
–201
6Ch
ange
a
Mea
nSE
Mea
nSE
Tota
l18
.90.
2220
.70.
221.
8*
Age
(yea
rs)
65–7
4b19
.30.
2721
.70.
242.
4*
≥75
18.4
0.30
19.5
*0.
311.
1*
Sex Male
b19
.00.
2920
.80.
291.
8*
Fem
ale18
.80.
2720
.60.
261.
8*
Race
and
eth
nicit
y
Whi
te, n
on-H
ispan
icb19
.40.
2421
.60.
242.
2*
Blac
k, no
n-Hi
span
ic15
.10.
4916
.0*
0.46
0.9
Mex
ican A
mer
ican
18.0
0.37
17.9
*0.
49-0
.1
Pove
rty s
tatu
s
<10
0% FP
L15
.60.
7716
.0*
0.51
0.4
100%
–199
% FP
L17
.00.
5018
.3*
0.38
1.3*
≥20
0% FP
Lb20
.10.
2122
.20.
222.
1*
Pove
rty s
tatu
s
<20
0% FP
L16
.60.
4617
.6*
0.33
1.0
≥20
0% FP
Lb20
.10.
2122
.20.
222.
1*
Educ
atio
n
<Hi
gh sc
hool
15.9
0.39
16.9
*0.
351.
0
High
scho
ol18
.10.
3419
.2*
0.34
1.1*
>Hi
gh sc
hoolb
21.0
0.25
22.1
0.23
1.2*
Ciga
rett
e sm
okin
g hi
stor
y
Curre
nt sm
oker
15.3
0.75
15.8
*0.
750.
5
Form
er sm
oker
18.1
0.29
20.2
*0.
322.
1*
Neve
r sm
oked
b19
.90.
3321
.60.
261.
7*

PAGE 54
Notes

PAGE 55
Notes

PAGE 56


CS303090A