trends in analytical chemistry, vol. 26, no. 2, 2007 ... · recent trends in liquid...
TRANSCRIPT
Trends in Analytical Chemistry, Vol. 26, No. 2, 2007 Trends
Recent trends in liquidchromatography-tandem massspectrometry to determinepesticides and their metabolitesin foodCarla Soler, Yolanda Pico
The applications of liquid chromatography-mass spectrometry (LC-MS) have
exploded in innumerable analytical fields, including pesticide-residue deter-
mination. There is no doubt that LC-MS is currently competing with gas
chromatography (GC)-MS for the status of �reference� analytical technique to
determine pesticide residues and that its ever-increasing application is bound
to the evolution of modern instruments and their growing performance
qualities. We highlight the large number and variety of pesticides that can be
readily determined using such instruments, the respective merits of the
different mass analyzers, and the improvements brought about by tandem
MS (MS2). We also discuss new applications of LC-MS in this field, such as
‘‘non-target’’ screening procedures and unknown identification by MS or
MSn presenting the different solutions proposed to solve this challenging
problem. Finally, we address the opportunities afforded by the most recent
instrument designs.
ª 2006 Elsevier Ltd. All rights reserved.
Keywords: Food; LC; Liquid chromatography; Metabolites; MS2; Pesticides; Tandem
mass spectrometry
Carla Soler,
Yolanda Pico*
Laboratori de Bromatologia i
Toxicologia,
Facultat de Farmacia,
Universitat de Valencia,
Av. Vicent Andres Estelles s/n,
46100 Burjassot,
Valencia,
Spain
*Corresponding author.
Tel.: +96 354 3092;
Fax: +96 354 4954;
E-mail: [email protected]
0165-9936/$ - see front matter ª 20060165-9936/$ - see front matter ª 2006
1. Introduction
Pesticide residues in food continue to bethe target of many studies due to theuncertainty about the adverse effects thatthose residues may have after a lengthyexposure at low doses. More than 1000active ingredients have been employedand are currently formulated in thousandsof different commercial products. Theseresidues comprise a variety of compounds,mainly insecticides, herbicides and fungi-cides, as well as their metabolites, withvery different physico-chemical charac-teristics and large differences in polarity,volatility and persistence [1,2]
Elsevier Ltd. All rights reserved. doi:10.1016/j.trac.2006.08.005Elsevier Ltd. All rights reserved. doi:10.1016/j.trac.2006.08.005
Since the early 1970s, most routinepesticide-residue determination has beenconducted by gas chromatography (GC)with different detectors, including massspectrometry (MS). However, timeschange and there is now a clear trend toincrease the number of liquid chroma-tography (LC) applications in pesticide-residue analysis, both in specific/individ-ual and in multi-residue methods, espe-cially after the introduction into themarket of robust, easily operated LC-MSinstruments that provide a new way ofanalyzing pesticides more sensitively andefficiently, and with greater scope [2–5].In recent years, different reviews pub-lished, which cover totally or in part thesubject of the analysis of pesticide resi-dues in food by LC-MS or LC-tandem MS(LC-MS2), document this movement fromGC to LC [2–8].
This trend is closely bound to the evo-lution of modern LC-MS instruments andthe improvements in the quality of theirperformance. MS research is focusedmainly on expanding the implementationof mass analyzers instead of on ionizationsources, as it was 10 years ago [2,6,9–12].The sensitivity and specificity of pesticideanalysis in food matrices have advancedby combining different designs of analyzerin order to enlarge versatility and toincrease application of MS2 (triplequadrupole (QqQ), quadrupole ion trap(QIT), quadrupole linear ion-trap (QLIT),
103103

Trends Trends in Analytical Chemistry, Vol. 26, No. 2, 2007
quadrupole time-of-flight (QqTOF), ion-trap time-of-flight(IT-TOF)) [2,7,13–16].
These LC-MS instruments are well suited to solvedifficult problems of identification, quantification andconfirmation of pesticides and their metabolites. Theselection of the mass analyzer, apart from its accessi-bility, is determined by the required sensitivity andselectivity and the general objective, taking into ac-count their complementarity [16]. As a result of allthese innovations, rather interesting advances andpractical applications in pesticide-residue determinationare available for a wide range of compound classes andmatrices [4,15]. However, there is no comprehensiveinformation about the relationship between wideningthe scope of these analyses and instrument develop-ments.
This article reviews typical applications of the mostcommon LC-MSn mass analyzers used in pesticide-resi-due laboratories today, summarizing recent trends inthis field. We highlight the large number and variety ofpesticides that can be readily determined using suchinstruments, the respective merits of the different massanalyzers, and the improvements brought about by MS2.We discuss new applications of LC-MS in this field, suchas ‘‘non-target’’ screening procedures and unknownidentification by MS or MS2, and present different solu-tions proposed to solve this challenging problem. Finally,we address the opportunities afforded by the most recentinstrument designs.
2. Opportunities
The aims of pesticide residue determination in food arerelated to quality enhancement in the agricul-tural production and governmental scrutiny of foodsafety. These analysis are required for the followingreasons:
(i) to verify that no unexpected residues are occurring;(ii) to check that statutory maximum residue levels
(MRLs) are not exceeded;(iii) to carry out enforcement programs; and,(iv) to ensure that human dietary intakes of residues
are at acceptable levels [5,10].Analytical methods employed must be rapid and
capable of screening for and identifying pesticidesaccurately to fulfill the aims of these analyses [2,3,5].Both characteristics are quite contradictory – it is dif-ficult to have both rapidity and accuracy in the samemethod [5]. However, the high specificity of MS2
detection is expected to eliminate most of the problemsarising from the presence of endogenous compounds, soreducing method-development time significantly [2,10].We discuss below in detail how the application of LC-MS2 offers outstanding possibilities to combine speedwith accuracy by:
104 http://www.elsevier.com/locate/trac
(i) simplifying sample preparation;(ii) simultaneously screening and quantifying an in-
creased number of target pesticides; and,(iii) searching for non-target pesticides and unknown
compounds in the same extracts.
2.1. Simplification of the extraction procedureOne analytical challenge involved in pesticide-residueanalysis is that reliable results should be presented as fastas possible – often within 24 hours – without damagingmethod characteristics, such as sensitivity, selectivity,precision and specificity [10]. Several sample pre-treat-ment steps are necessary between sampling and chro-matography. This phase has traditionally beenconsidered the limiting factor, or ‘‘bottleneck’’, becausesample pre-treatment occupies more than 60% of theanalyst�s time [2,3,10]. Matrix components co-extractedwith pesticides produce several additional signals inchromatograms that can lead to false-positive identifica-tions. While such interferences are not odd if extracts ofcomplex matrices (e.g., herbs or tea) are analyzed by GC-MS or by LC-MS using selected ion monitoring (SIM), thisis not so when MS2 is used [7,15,16]. For this reason, LC-MS2 methods do not require either extensive clean-up orsophisticated chromatographic separation. Differentmolecules that share the same transition are found morerarely than molecules producing fragments of identicalmass. As a consequence, peak identification is easier andfaster in LC-MS2 than in GC-MS or LC-MS [8,17,18].
As an image is said to be worth more than 1000words, Fig. 1 compares the extraction schemes proposedby Mills et al. [19] in 1963 and the QuEChERS (quick,easy, cheap, effective, rugged and safe) method recentlyproposed by Anastassiades et al. [20]. The Mills methodwas the first important quantitative multi-residue GCmethod reported in the literature. At present, this multi-residue method is undoubtedly one of the most com-monly used for analysis of pesticides in non-fatty food,considered official by AOAC for a number of pesticides(AOAC, 1984,1990), and it is widely applied in gov-ernmental monitoring programs to determine pesticidelevels in food products and to trace possible residue tol-erance-level excesses [2,3,10,21]. This method andmany others similar usually consist of common steps,such as extraction, clean-up by liquid-liquid partitioning,adsorbent column chromatography and/or gel perme-ation chromatography, determination by GC andconfirmation of identity, most often by MS. Typically, inaddition to the many steps included, the method isrestricted to extract non-polar pesticides, such asorganochlorine and organophosphorus pesticides [21].In contrast to these methods developed a long time ago,the principal objective of the multi-residue methodsbeing developed now is to obtain methods for theextraction of a large number of different pesticides using

“Salting-out” effectLiquid-liquid partitioning (LLP)
FDA Mills multi-residue method
+ acetonitrile (high fat only)
Chopped sample(50 g)
+ acetonitrile (100 mL) low fat sampleor petroleum ether (100 mL) high fat sample
Petroleum ether(Removal of coextractives)
Discard
Acetonitrile+ NaCl water
+ Petroleum ether
AqueousacetonitrilePetroleum ether
(Residues)Concentrate de petroleum ether extractClean up on a Florisil columnElute the residues with different percentages of
petroleum ether (PE)/diethyl ether (Et2O)
GC-FPD, NPD, ECD, MS
Homogeneize in an agitation deviceFiltrate using a Buchner funnel
Liquid-liquid partitioning (LLP)
0% Et2O/PEPCBs
6% Et2O/PEOrganochlorines
pyrethroids
15% Et2O/PEOrganophosphorus
Chopped sample(10 g)
+ acetonitrile (10 mL)+ MgSO4 anh. (4g)+ NaCl (1 g)
QuEChERS
Shake the sample vigorously“Salting-out” effectCentrifuge
1 mL of supernatant(acetonitrile)+ 25 mg PSA
+125 mg Mg SO4
Clean-up by dispersive SPE with PSA
LC-MS2
GC-MS
sample(10 g)
+ acetonitrile (10 mL)+ MgSO4 anh. (4g)+ NaCl (1 g)
QuEChERS
Shake the sample “Salting-out” effectCentrifuge
1 mL of supernatant(acetonitrile)+ 25 mg PSA
+125 mg Mg SO4
Clean-up by dispersive SPE with PSACentrifuge
LC-MS2
GC-MS
Figure 1. Scheme of the multi-residue methods developed by Mills et al. [19] and Anastassiades et al. [20].
Trends in Analytical Chemistry, Vol. 26, No. 2, 2007 Trends
a simple extraction scheme, preferably without the needfor a clean-up step. The evolution of the extractionprocedures has strongly reflected the need for simplifi-cation.
Solvent-extraction (SE) methods, such as thatpreviously mentioned, have largely been employedwith satisfactory results [22–26]. Fig. 2 shows theresults of an SE procedure involving extraction ofresidues with methanol-water and partition intodichloromethane for the analysis of 98 pesticides thatbelong to 20 different groups in fruits and flour. Thechromatogram obtained by LC-MS2 is free of anyinterfering compound [17].
Preliminary clean-up procedures before determinationby LC-MS2 are used in few studies. While liquid-liquidpartitioning (LLP), solid-phase extraction (SPE),dispersive SPE, solid-phase microextraction (SPME) andstir-bar sorptive extraction (SBSE) are still widelyreported [17,25–30], complicated fractionation schemesor long, tedious combinations of several procedures havedisappeared.
Other alternatives to SE that are also reported withsome frequency are matrix solid-phase dispersion(MSPD) and pressurized liquid extraction (PLE). MSPDhas shown very good characteristics for analyzing bothfatty samples [31,32] and fruits and vegetables[33–35]. PLE has been especially recommended forgrain and cereal samples with low moisture content[36] but has also been used for fruits and vegetables[37,38]. The possibility of using water as extractantreduces the use of organic solvents and provides goodresults [39].
Table 1 shows some characteristics of the extractionmethods reported for the analysis of pesticides in fruitsand vegetables; their advantages and disadvantages andsome applications are also summarized.
As a consequence of the greater specificity, endoge-nous components are no longer observed but they maystill affect quantitation because of the matrix effect,which is induced by matrix components co-eluting withthe analyte from the LC column and interfering in theionization response of the analytes, affecting the
http://www.elsevier.com/locate/trac 105

Chopped sample
(10 or 5 g) + water
+ 20 mL methanol
homogenization
filtration or centrifugation
Aliquots (6 ml)
+ 20 ml NaCl
Salting out effect
SPE Chem Elut
Elution with Cl2CH2
Evaporate to dryness
Redissolve in methanol
LC-MS2
Figure 2. Chromatogram of a standard with 98 pesticides at a level of 0.025 mg/kg prepared in a blank extract of wheat flour. Flow chart of theSE-SPE method employed for the extraction. (Adapted from [17] with permission from AOAC International, ª 2003).
Table 1. Extraction procedures combined with LC-MS2 to determine pesticide residues in food
Method Protocol Cost (consumption/time) Comments Ref.
SE Extraction with an organic solvent(methanol, acetonitrile, acetone, ethylacetate and dichloromethane) by shaking,homogenizing or sonication. This stepcan be followed or not by a simpleclean-up, such as LLP, SPE, dispersiveSPE, MSPD or SBSE
5–25 g of sample10–50 mL of organic solvent< 1 g of solid phase for SPE ordispersive SPE1 fiber for SPME1 stir bar for SBSE batches 2–10samples < 30 minApproximately 2 € in reactivesper sample
� Specially recommended forfood with high water content(mostly fruits and vegetables)� Universal for any type of
sample and a wide range ofpesticides� Risk of emulsion formation
[22–26,30,32,40]
MSPD Sample dispersion with solid phase (C18
or Florisil) until a homogeneous mixtureis obtained. This dispersion is placed ontoa column. Pesticide residues are elutedwith a few milliliters of organic solvent
0.5 g of C18
10 mL dichloromethane5 mL methanol1 sample < 15 minApproximately 1 € in reactivesper sample
� Limited amount of samplebecause it is difficult to processmore than 0.5 g and maintainthe method
[32–34]
PLE Extraction with an organic solvent orwater at high pressure and temperature.Sample is homogenized with a solid-phase and inserted into a stainless-steelcell of the commercial system
For a 22-mL extraction cell5 g sample, 4 g of diatomaceousearth or 12 g of Na2SO4 or otherdesiccants22 mL of organic solvent or water24 samples < 45 minApproximately 3 € in reactivesper sample
� High temperatures candegrade some labilecompounds� Specially recommended for
food with low moisturecontent (cereals)� Able to substitute organic
solvents by water. Ecofriendly
[10,37–39]
Trends Trends in Analytical Chemistry, Vol. 26, No. 2, 2007
reproducibility and accuracy of the determined com-pound. To prevent enhancement or suppression prob-lems during food analysis, the matrix effect should beinvestigated first and compensated for during methoddevelopment and validation [41]. Although the matrixeffects reported using these simpler, more rapid and
106 http://www.elsevier.com/locate/trac
shorter procedures are as low and consistent as thosereported using the traditional ones, accurate quantifi-cation still needs to correct for the matrix effect by usingmatrix-matched standards (most common procedures)or by other compensating techniques, such as the ECHOPeak [22,24,42,43].
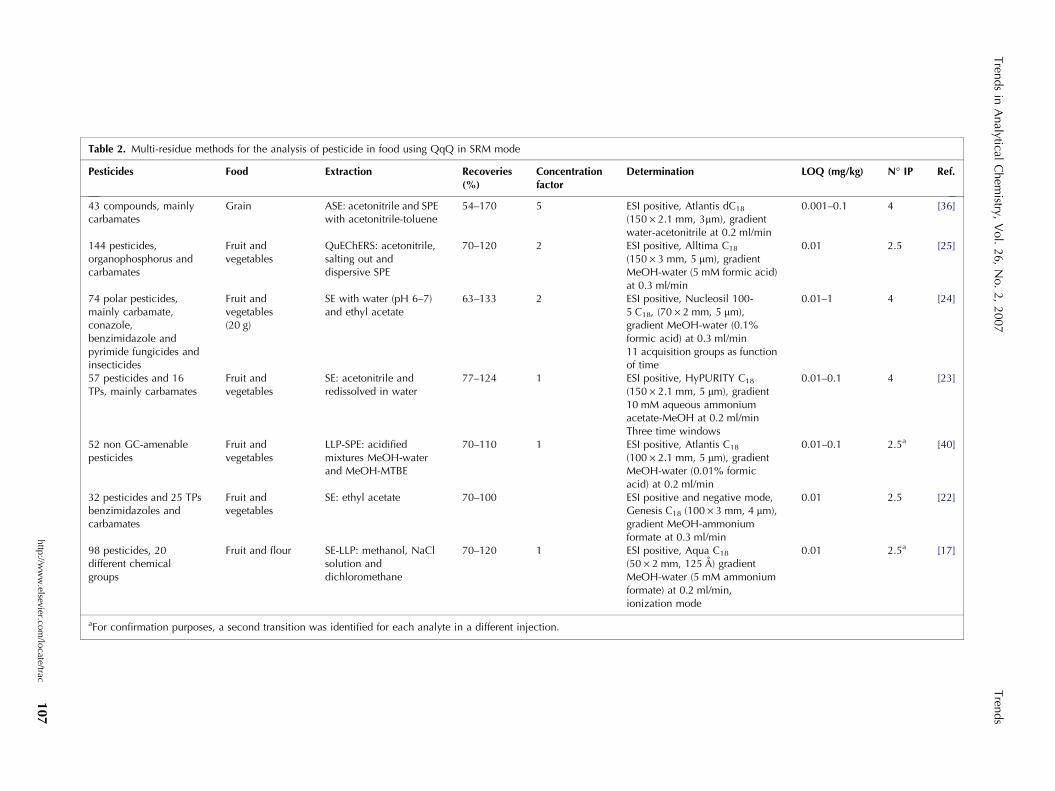
Table 2. Multi-residue methods for the analysis of pesticide in food using QqQ in SRM mode
Pesticides Food Extraction Recoveries(%)
Concentrationfactor
Determination LOQ (mg/kg) N� IP Ref.
43 compounds, mainlycarbamates
Grain ASE: acetonitrile and SPEwith acetonitrile-toluene
54–170 5 ESI positive, Atlantis dC18
(150 · 2.1 mm, 3lm), gradientwater-acetonitrile at 0.2 ml/min
0.001–0.1 4 [36]
144 pesticides,organophosphorus andcarbamates
Fruit andvegetables
QuEChERS: acetonitrile,salting out anddispersive SPE
70–120 2 ESI positive, Alltima C18
(150 · 3 mm, 5 lm), gradientMeOH-water (5 mM formic acid)at 0.3 ml/min
0.01 2.5 [25]
74 polar pesticides,mainly carbamate,conazole,benzimidazole andpyrimide fungicides andinsecticides
Fruit andvegetables(20 g)
SE with water (pH 6–7)and ethyl acetate
63–133 2 ESI positive, Nucleosil 100-5 C18, (70 · 2 mm, 5 lm),gradient MeOH-water (0.1%formic acid) at 0.3 ml/min11 acquisition groups as functionof time
0.01–1 4 [24]
57 pesticides and 16TPs, mainly carbamates
Fruit andvegetables
SE: acetonitrile andredissolved in water
77–124 1 ESI positive, HyPURITY C18
(150 · 2.1 mm, 5 lm), gradient10 mM aqueous ammoniumacetate-MeOH at 0.2 ml/minThree time windows
0.01–0.1 4 [23]
52 non GC-amenablepesticides
Fruit andvegetables
LLP-SPE: acidifiedmixtures MeOH-waterand MeOH-MTBE
70–110 1 ESI positive, Atlantis C18
(100 · 2.1 mm, 5 lm), gradientMeOH-water (0.01% formicacid) at 0.2 ml/min
0.01–0.1 2.5a [40]
32 pesticides and 25 TPsbenzimidazoles andcarbamates
Fruit andvegetables
SE: ethyl acetate 70–100 ESI positive and negative mode,Genesis C18 (100 · 3 mm, 4 lm),gradient MeOH-ammoniumformate at 0.3 ml/min
0.01 2.5 [22]
98 pesticides, 20different chemicalgroups
Fruit and flour SE-LLP: methanol, NaClsolution anddichloromethane
70–120 1 ESI positive, Aqua C18
(50 · 2 mm, 125 A) gradientMeOH-water (5 mM ammoniumformate) at 0.2 ml/min,ionization mode
0.01 2.5a [17]
aFor confirmation purposes, a second transition was identified for each analyte in a different injection.
Tren
ds
inA
nalytical
Chem
istry,V
ol.
26,
No.
2,
2007
Tren
ds
http
://ww
w.elsevier.co
m/lo
cate/trac107

100 200 300 400m/z
0
%
100388
194
164
NN
Cl
O
NCH3O CO2CH3
100 200 300 400m/z
0
%
100 388
194
296
164 356323
b
a
Figure 3. (a) Mass spectrum of the pesticide pyraclostrobin. Thestructure of the molecule is shown as an insert. Spectrum recordedby infusion of a standard solution (5 lg/ml in water/methanol 1:1,v/v) to the electrospray (ES) ionization source in positive mode.(b) Product-ion spectrum of the [M+H]+ ion of pyraclostrobin (pre-cursor ion m/z 388). (Reproduced from [23] with permission fromWiley InterScience, ª 2004).
Trends Trends in Analytical Chemistry, Vol. 26, No. 2, 2007
2.2. Development of multi-residue methods for targetpesticidesThese analyses highlight the large number of pesticidesin use, which, as result of agricultural treatments, can bepresent in a sample. Accordingly, a suitable methodshould simultaneously be applicable to a wide range ofpesticides and matrices, and capable of providingunambiguous identification at the low concentrationlevels required to quantify pesticide residues below thestrict MRLs established by current legislations [44–48].
Classical routine screening methods, which were pre-viously carried out by GC-MS, involve the screening,identification, quantification and confirmation of asmany target pesticides as possible, with only one samplepreparation method and one chromatographictechnique. The enhanced selectivity afforded by MS2
detection also attains discrimination between pesticidesthat are marginally separated [43]. A recent comparisonof the scope and the sensitivity of GC-MS and LC-MS2
really illustrates the better performance of LC-MS2. Dueto the small peak width in GC, the cycle time in GC-MSmethods must be 1 s or shorter. Since all ions are re-corded using a dwell time of 40 ms, no more than 25characteristic ions can be recorded in one time window.Assuming 10 time windows in one GC run, 250 ions or83 pesticides with 3 characteristic ions each can theo-retically be analyzed in parallel. The peak width in LCmeasurements is usually higher, often allowing a typicalcycle time of 2.5 s. Considering a typical dwell time of20 ms, approximately 125 SRM transitions can beacquired simultaneously in one time window. Assuming5 time windows per LC run, in that case, 625 SRMtransitions are obtained with one injection. Since twoSRM transitions are often sufficient to quantify and toconfirm a result, up to 312 pesticides can theoretically beanalyzed in one run. In practice, the theoretical numberscalculated above cannot be reached because usuallymore pesticides elute in the middle than in the beginningor the end of the chromatograms. However, irrespectiveof this limitation, the number of analytes covered in oneLC-MS2 run is at least two or three times greater thanthe number of pesticides measured in parallel by GC-MSin the SIM mode [8]. Another particular feature of MS2
detection, which can be exploited in these LC-MS2
methods, is the capability to differentiate between coel-uting isobaric analytes (same nominal mass, differentstructure). Differences in the product-ion mass spectrayielded by common precursor ions were decisive in theunhindered determination of the following pairs ofpesticides: (i) aldicarb and butocarboxim, (ii) aldicarbsulfoxide and butocarboxim sulfoxide, and (iii) carbaryland thiabendazole [43].
The use of multi-residue methods would be ideal,especially if optimized conditions could be established incompliance with European Union (EU) regulations [44].
108 http://www.elsevier.com/locate/trac
Recent improvements in LC-MS2 instrumentation, whichhave improved the sensitivity, the selectivity and therobustness of the method, make it possible to increasethe number and the diversity of pesticides that can beincluded in a single LC-MS2 analysis [10]. As a conse-quence, LC-MS2 methods for determining a large num-ber of pesticides in food have flooded into currentliterature, showing that this technique can be compa-rable or even superior to GC for the development ofmulti-residue methods [8,25,36]. Table 2 summarizesthe methods developed for multi-residue pesticide deter-mination in food by LC-MS2 that are suitable forscreening more than 50 pesticides simultaneously.
As an example, Pang et al. [36] established an ana-lytical method using GC-MS and LC-MS2 for simulta-neous determination of 405 pesticides worldwide used in

Trends in Analytical Chemistry, Vol. 26, No. 2, 2007 Trends
grain. After its optimization, based on the characteristicsof the compounds, only 35 pesticides could not bedetermined by LC-MS2, because recoveries were less than40%. These low recoveries are linked to the matrixeffects because the extraction procedure is the same,independent of the determination technique. In spite ofthis, finally only 43 pesticides of the total were analyzedby LC-MS2.
Lehotay et al. [25] studied the combination of LC-MS2
and GC-MS to quantify and identify 229 pesticides in tworepresentative commodities (lettuce and orange). Aftercomparing the results obtained for each technique, asvalues of recoveries and RSD, the authors concluded thatthe results do not differ greatly. However, LC-MS2 is thepreferred approach for those pesticides that are com-patible in both analytical systems (GC and LC) because ofthe inherent advantages of the technique, such as: itsbetter intrinsic instrument sensitivity and selectivity; itsbetter reproducibility in the injection process, whichprovided better consistency in the results; its capability ofdetection at low concentrations spiked; and, unlike GC,its avoidance of degradation problems with thermolabilepesticides.
Figure 4. Chromatogram of orange spiked with pesticides studied at 0.01(1) Butocarboxim sulphoxide, (2) Oxamyl-oxime, (3) Aldicarb sulphoxide,thion sulphoxide, (8) Demeton-S-methyl sulphoxide, (9) Methomyl, (10) Decarb sulphone, (13) Ethiofencarb sulphoxide, (14) Imidacloprid, (15) MetAcetamiprid, (19) Carbendazim, (20) Methiocarb sulphone, (21) Butocarbo(25) Terbufos-O-sulphone, (26) Thiometon sulphone, (27) Propoxur, (28) ThS-methyl, (32) Carbary, (33) Thiodicarb, (34) Ethiofencarb, (35) Disulfotonsulphone, (39) Phorate sulphone, (40) Isoprocarb, (41) Trimethacarb-2,3,5 (4Imazalil, (46) Linuron, (47) Methiocarb, (48) Promecarb, (49) Fenoxycarb (5Terbufos, (55) Dinocap, (56) Hexythiazox, (57) Carbosulfan. (Reproduced
Ortelli et al. [24] developed a multi-residue method forthe determination of 74 pesticides commonly used incrop protection, mainly including carbamate, conazole,benzimidazole and pyrimidine fungicides and insecti-cides. All pesticides studied were determined with highsensitivity and selectivity in one single injection, makingit possible to apply the method satisfactorily to routineanalysis; more than 2500 fruit and vegetables sampleswere analyzed as a part of a pesticide-monitoring pro-gram.
Hetherton et al. [23] proposed a multi-residuescreening method for the simultaneous analysis of 73pesticides and their metabolites employing LC-MS2.The method was successfully used to determine alarge number of target pesticides in apple, orange andlettuce, demonstrating its potential for multi-residueapplications. In spite of the enhanced specificity, thepossibility of MS2 techniques achieving two transitions(one transition for screening and the other one forconfirmation) can help to confirm the identity of ana-lytes. As an example, Fig. 3 shows the MS2 spectrum of arecently developed pesticide, pyraclostrobin, whosestructure is shown in Fig. 3A. The mass spectrum
mg/kg. One MS2 fragment for each pesticide. Identification of peak:(4) Butoxycarboxim, (5) Aldicarb sulphone, (6) Oxamyl, (7) Vamido-meton-S-methyl sulphone, (11) Vamidothion sulphone, (12) Ethiofen-hiocarb sulphoxide, (16) Vamidothion, (17) Carbofuran-3-OH, (18)xim, (22) Thiabendazole, (23) Aldicarb, (24) Thiometon sulphoxide,iophanate methyl, (29) Carbofuran, (30) Bendiocarb, (31) Demeton-
sulphoxide, (36) Phorate sulphoxide, (37) Thiometon, (38) Disulfoton2) Trimethacarb-3,4,5, (43) Phorate-O-analogue, (44) Demeton, (45)0) Phorate, (51) Clofentezine, (52) Disulfoton, (53) Furathiocarb, (54)from [22] with permission from Elsevier, ª 2003).
http://www.elsevier.com/locate/trac 109

Trends Trends in Analytical Chemistry, Vol. 26, No. 2, 2007
(Fig. 3A) shows that the dominant molecular specie was[M+H]+ at m/z 388, corresponding to the most abun-dant ion containing the 35Cl isotope; the MS2 spectrum(Fig. 3B) produced dominant product ions at m/z 296,194 and 164. The transition m/z 388 fi 194 corre-sponds to cleavage of the ether bond. The product ion atm/z 296 corresponds to the loss of 92 Da, attributed to amethanol molecule and a methylformate molecule.
Hernandez et al. [40] developed a method using LC-MS2 for the screening, quantification and confirmationof 43 pesticides and 9 pesticide metabolites in four fruitand vegetable matrices, paying special attention to theconfirmation of positive findings. In this case, theauthors suggested that, if one of the transitions isinterfered with by a matrix component, the confirmationwould be troublesome. For this reason, they proposed theuse of the maximum number of available transitions foreach compound to have ultimate confirmation of thepresence of the analyte, performing an independentsecond injection into the system.
According to Decision 2002/647/EC [49], the num-bers of identification points (IPs) assigned using LC-MS2
are 1 IP for the precursor ion and 1.5 IPs for each
Table 3. Capabilities of the different mass analyzers to tackle multi-residu
Analyzer Remarkable example Advantages
QqQ 52 non-GC-amenable pesticides andmetabolites (insecticides, acaricides,fungicides, herbicides and plantgrowth regulators, and 9transformation products) extractedfrom 20 g of four types of foodcommodities: lemon (high acidity),raisin (high sugar content), tomato(high water content) and avocado(high lipid content), withmethanol:water (80:20) 0.1%HCOOH and then clean-up by OasisHLB SPE [40]
The use of Mmultiple transreduces the pinterferencesunambiguousmonitoring 2for the screenthe confirmatGood quantitMRM mode
QIT 10 pesticides (benzimidazoles,azoles, organophosphorus,neonicotinoids, carbamates andacaricides) extracted from peachesand oranges (2.5 g) by PLE with silicaand ethyl acetate (75�C, 1500 psi)and concentrated to 0.5 mL [37]
Multiplies maMS (high speHigh sensitivi(attains monitspectrum):LOQ range 0Possibility ofspectrum withfragmentationmonitored
QqTOF Identification of seven transformationproducts of carbosulfan in rice,potato and orange (5 g) by PLE withdichloromethane and sodiumsulphate anhydrous (40�C, 2000 psi)and concentrated to 1 mL [51]
High sensitiviusing only TOwithout isolatthe quadrupoAccurate masproduct ions.< 20 ppm, almstructures can
110 http://www.elsevier.com/locate/trac
product ion measured, so that, with two transitions, theconfirmation strategy established in the EU guidelinecould be reached. As indicated in Table 2, only tworeferred multi-residue methods met the demandedrequirements in one single injection. Another reportedstrategy to meet the EU criteria is to carry out a secondinjection to identify the analyte by more than onetransition.
One of the main problems of LC-MS2 for quantitativepurposes is the presence of coeluting matrix compoundsthat can interfere with ionization of the target analytes(suppression or enhancement), as described in somecurrent literature [50]. Jansson et al. [22] validated amulti-residue method, using ethyl acetate extraction anddetermination by LC-MS2, for a total of 57 differentpesticides and pesticide metabolites in different crops. Allthe pesticides studied, as shown in Fig. 4, were separatedwith high sensitivity and selectivity. This chromatogramis typical of the data obtained using these methods. Theauthors evaluated the matrix effects in more than 2000tests on the selected pesticides. Because the matrix effectdepends considerably on the pesticide and the matrixselected, to know what a detected concentration means
e analysis
Disadvantages
RM mode selectingitions simultaneouslyrobability of spectralallowing anidentification by(or 3) transitions: oneing and the second forion.ative capabilities in
The number of transitions that can bemonitored in a chromatographic runlimits the number of compounds tobe included in the method.The required selection of the analytesand their confirmation prior to thedevelopment of the method (targetanalysis only).Repeatability in the retention timeand product-ion spectra were studiedby 10 injections of a fortified sampleextract
ny times the stages ofcificity): LC-MS3.ty in full mass spectrumoring of product-ion full
.01–0.25 mg/kg.obtaining full massout isolation andor limit on compounds
Only a limited number of ions can bedetermined simultaneously: in theexample, the 10 pesticides requiredthree time-windows, each onemonitoring 4 pesticides as much.Limited dynamic range: only twoorders of magnitude. Limited m/zrange: 1/3 of the original mass
ty in the scan modeF mass analyzer
ing the precursor ion inle.ses for both parent andWith a relative error ofost all metabolitebe confirmed
At present, the information availableabout the use of the technique forquantification and identification ofpesticides at trace levels in food israther limited

Trends in Analytical Chemistry, Vol. 26, No. 2, 2007 Trends
in a specific matrix, in relation to standards in solvent, itis very important to be able to estimate the trueconcentration in that matrix. If this is impossible,samples with low concentrations have to be reanalyzedand quantified using matrix-matched standards.
The selection of suitable transitions from precursor toproduct ions is explained by Klein and Alder [17] intheir study on the applicability of LC-MS2 to thesimultaneous screening for 98 pesticides in crops. Inorder to select the appropriate transitions, each analytewas tuned individually to optimize the yield of productsions. To avoid any misinterpretation of detected signals,first the selectivity of the chosen transitions wasexamined by flow injection analysis without separationon an LC column, discovering that only in 9 casesadditional peaks were detected due to partial decom-position. Second, to separate the target analyte frominterfering additional peaks, a mixture containing allanalytes was analyzed.
Comprehensive information about the typical precur-sor and product-ion transitions, appropriate for LC-ESI-MS2, can be found in a review by Alder et al. [8], whichcompiled data for 500 pesticides. The comparisonbetween GC-MS and LC-MS2 reported in this reviewdemonstrated that LC-MS2 attained better limits of
Table 4. Application of tandem MS in searching for non-target pesticides
Compound/sample Approach Ext
Buprofezin/tomato � LC-TOF-MS � QCarbendazim/tomato Reduced number of elemental
compositionsEsafou
Chlrotoluron/tomatoImazalil/lemon/ � DATABASEImazalil/orange Search to find the identity of suspected
species orImazalil/oranges parent compounds using the elemental
compositionIprodione/apples � EProcymidone/grapes � LC-QIT-MS skProchloraz/lemon Structural information provided by ion
trap MS2
Prochloraz/orangeThiophanate-methyl/tomato
� CONFIRMATION WITH STANDARDSIf possible
Unknowns/water(particularly triazinesand some derivatives
� LC-QqTOF in combination with andelimination strategy based on theisotopic abundances to identifyunknown compounds
� O
� LC-QqTOF-MS Possible elementalcomposition is calculated. Approachbased on the experimental isotopicabundances� LC-QTOF-MS2 experiments. (accurate
masses of small neutral losses andproduct ion). Reduce the number ofpossible empirical formulae
detection for all types of selected pesticides, apart fromthe persistent organochlorines, for which the limits ofdetection are more sensitive by GC-MS.
In addition, the study reported by Klein and Alder [17]showed a comparison between the individual multiplereaction monitoring (MRM) transition chosen by themand those chosen by other researchers. This collection ofdata shows that, in many cases, the same ions are themost suitable for tracing a given analyte, irrespective ofthe type of spectrometer and the source parameters. Thisfact is especially well illustrated when the comparison ismade with the multi-residue method presented by Jassonet al. [22], who used the same mass spectrometer. Jassonet al. [22] studied 32 of the analytes included in thestudy of Klein and Alder [17]. For 21 compounds,exactly the same transition was selected as the mostsuitable, and, for another 7 analytes, the transitionchosen by ones as qualifier ions were used for the othersas quantifier ions.
There are other instruments that perform MS2 andhave been applied to determine pesticide residues in food,such as QIT and QqTOF. However, they are not socommonly applied in this type of multi-residue analysis.The main disadvantages of these mass analyzers are thelower sensitivity obtained, and, in the case of QIT, only a
and unknown metabolites in food
raction Amount reported Ref.
uEChERS – [52]xtraction with acetonitrile bylting out with NaCl and MgSO4
llowed by dispersive SPE clean-p with PSA
– [52]
0.05 mg/kg [53]1.7 mg/kg [54]2.1 mg/kg [54]
– [37]
xtraction by washing the 0.6 mg/kg [53]in with methanol 0.23 mg/kg [53]
1.0 mg/kg [54]
– [54]– [52]
n-line SPE – [55–57]
http://www.elsevier.com/locate/trac 111

Trends Trends in Analytical Chemistry, Vol. 26, No. 2, 2007
limited number of ions can be fragmentedsimultaneously. According to the specifications of themanufacturer, around 30 precursor ions can be frag-
Figure 5. (a) Total ion chromatogram (TIC) obtained from the LC-TOF-MS a(tR 18.0 min), (b) accurate mass spectrum of the protonated molecule of imfragment ions m/z 255 and 159), and (c) proposed fragmentation pathway omission from Elsevier, ª 2005).
112 http://www.elsevier.com/locate/trac
mented at the same time but, in practice, it is difficult toisolate more than 10 compounds. Table 3 shows acharacteristic example of multi-residue methods and
nalysis of the orange extract studied, in which imazalil was identifiedazalil; (Table: accurate mass data of imazalil and its characteristic
f imazalil by LC-ion trap-MSn analysis. (Adapted from [54] with per-

Trends in Analytical Chemistry, Vol. 26, No. 2, 2007 Trends
analyses, giving the advantages and disadvantages ofthem.
All these studies demonstrated that LC-MS2 is areproducible and suitable alternative to the conventionalmethods used to screen different classes of pesticides infood samples, reaching low limits of quantification (LOQ)in compliance with the EU Directive on Food Quality[44].
2.3. Identification of non-target and unknownpesticidesAnother important aspect that should be dealt withwhen developing a pesticide-monitoring program is theidentification of ‘‘non-target’’ pesticides and ‘‘unknown’’metabolites and/or transformation products [2,10].There are still few attempts to propose methods toidentify unknown pesticides. Table 4 outlines theseschemes as well as the applications based on their use.
Thurman et al. [52] have developed an identificationscheme using a combination of LC-TOF-MS and LC-QIT-MS (or LC-QIT-MS2). The method is based on the searchof the empirical formulae obtained through the accuratemass in the Chem Index and/or Merck Index databases.This protocol was applied to identify unknown pesticidesin tomato skin [54], to discover unknown metabolites ofpost-harvest fungicides in citrus [52], and to searchingfor non-target chlorinated pesticides in foods [53]. Thequality of the information achieved by the combinationof LC-TOF-MS and LC-QIT-MSn to identify non-targetimazalil is illustrated in Fig. 5. Fig. 5a shows the total ionchromatogram of the orange extract, in which chlorine-containing species are identified. The presence and thenumber of chlorine atoms present in the suspectedspecies can easily be found by taking into account therelative intensity of 37Cl/35Cl. This approach makes itmuch easier to assign an elemental composition to thesuspected species. Searching the database gave a uniquematch: imazalil. The next step in the discovery processwas to search for the characteristic fragment ions of theproposed pesticide to confirm (or refute) its identity. Inthis particular case, there are two fragment ions, whichprovide enough information to confirm the identity ofthe proposed species based on fragmentation of theparent structures. Fig. 5c shows how this fragmentationis verified by MS4 using an ion trap.
Within this field, not all is in favor of LC-MS2, as thereare also very strong arguments against LC-MS2 (e.g., it isa targeted method that detects and precisely quantifiesonly a relatively large set of analytes defined in advancefrom all the possible pesticides (because the precursor ionof an analyte must be pre-selected). In such targetedanalyses, signals from all other components are ignored(including other pesticides or metabolites). This charac-teristic makes MSn less suitable for screening ofnon-target pesticides and unknown compounds thatneed the full spectrum of the food extract to be able to
search it for any unexpected or suspected compoundinstead of selecting a few (or many) ions. However, thepossibility of performing MSn by selecting a defined pre-cursor ion to obtain the product ion is a feature, not arequirement. The instruments that can perform MS2 canalso carry out single MS to obtain the full mass spectrumthat enables identification of compounds not specified inthe study.
The ability of QqTOF to identify non-target compoundshas been studied by Hernandez et al. [55] for polarpesticides and transformation products in water. Thesestudies shows that (Qq)TOF instruments are well suitedto screening, as their high resolving power may besufficient to provide molecular formulae and to confirmor reject a suggested structure. LC-MS2 shows strongpotential for non-target screening, especially when usinginformation-dependent acquisition, where, at each timeunit, the m/z ions of high intensity in scan mode areautomatically selected for fragmentation in product ion-scan mode (automated MS2). This approach also hasseveral limitations in the field of pesticide residues (e.g.,the low sensitivity of TOF instruments compared withQqQ in SRM mode, which hampers the detection and theidentification of analytes at low concentration level, orthe requirement of a preconcentration step).
Extraction methods have to be critically evaluatedbecause they predetermine the selection of compounds(e.g., according to their polarity). This approach has sofar been applied only to water. However, it has veryappropriate perspectives to apply to more complexmatrices, such as food.
3. Conclusions and future trends
Recent innovations have made mass spectrometersincreasingly more sensitive and selective. These inno-vations have allowed MS to be established as much asGC, and have transformed it into a good alternative forthe screening of target pesticides. In the field of target-screening, the QqQ is the ultimate mass spectrometer,because it provides better detection limits, at the sametime as simultaneously determines the highest numberof pesticides with the reliability needed to confirm pes-ticide identity, and with quantification strategies to avoidthe classical problem of the matrix effect. Several com-pilations provide evidence of the repeatability ofprecursor-product-ion transitions selected in the differentstudies and some reviews already remark that LC-MS2 ismore sensitive for most pesticide groups. This techniqueis already a ‘‘routine’’ and ‘‘reference’’ method fordetermining pesticide residues to guarantee food safety.
The application of LC-MS2 contributes anotheradvantage: the simplification of extraction methods.Most traditional extraction methods are based in organicSE followed by long, tedious processes of separation,
http://www.elsevier.com/locate/trac 113

Trends Trends in Analytical Chemistry, Vol. 26, No. 2, 2007
fractionation and clean up. The selectivity of the deter-mination techniques makes it possible to eliminate clean-up steps. This simple achievement has revolutionized thefield of pesticide-residue analysis.
Protocols to identify unknown pesticides and targetcompounds are still required. It is clearly establishedthat there is no single instrument able to provide allthe information required to accomplish this task, butcomplementary information of several instruments cansuccessfully identify a non-target and/or an unknowncompound. Although analytical chemistry is heavilyoriented to the development of new instrument tech-nology and of protocols for this application, it is verycomplex and there are few studies that cover thissubject. However, the possibilities of mass analyzers,perhaps combined with a quadrupole, and the infor-mation obtained with the different mass spectrometersopen an interesting opportunity to solve this problemand to create useful multi-residue methods for thisend.
We should also say that there are other novel massanalyzers on the horizon that have not yet been fullytested. QqTOF mass spectrometers present a good massrange and mass-assignment accuracies of a few ppm.The combination of dissimilar mass analyzers hasallowed mass-measurement instruments beyond theconventional tandem platforms (e.g., QLITs can addsignificant functionality to other traditional mass ana-lyzers).
References
[1] L. Nasreddine, D. Parent-Massin, Toxicol. Lett. 127 (2002) 29.
[2] Y. Pico, C. Blasco, G. Font, Mass Spectrom. Rev. 23 (2004) 45.
[3] Y. Pico, G. Font, J.C. Molto, J. Manes, J. Chromatogr., A 882
(2000) 153.
[4] V. Andreu, Y. Pico, Curr. Anal. Chem. 1 (2005) 238.
[5] M. Careri, F. Bianchi, C. Corradini, J. Chromatogr., A 970 (2002)
3.
[6] C. Medana, P. Calza, C. Baiocchi, E. Pelizzetti, Curr. Org. Chem. 9
(2005) 859.
[7] O. Nunez, E. Moyano, M.T. Galceran, Trends. Anal. Chem. 24
(2005) 683.
[8] L. Alder, K. Greulich, G. Kempe, B. Vieth, Mass Spectrom. Rev. 25
(2006) 838.
[9] E.M. Thurman, I. Ferrer, D. Barcelo, Anal. Chem. 73 (2001)
5441.
[10] Y. Pico, G. Font, M.J. Ruiz, M. Fernandez, Mass Spectrom. Rev. 25
(2006) 916.
[11] I. Ferrer, E.M. Thurman, A.R. Fernandez-Alba, Anal. Chem. 77
(2005) 2818.
[12] I. Manisali, D.D.Y. Chen, B.B. Schneider, Trends. Anal. Chem. 25
(2006) 243.
[13] W.H. Hager, Anal. Bioanal. Chem. 378 (2004) 845.
[14] S. Lacorte, A.R. Fernandez-Alba, Mass Spectrom. Rev. 25 (2006)
866.
[15] I. Ferrer, J.F. Garcıa-Reyes, A.R. Fernandez-Alba, Trends. Anal.
Chem. 24 (2005) 671.
[16] M. Petrovic, D. Barcelo, Anal. Bioanal. Chem. 385 (2006) 422.
114 http://www.elsevier.com/locate/trac
[17] J. Klein, L. Alder, J. AOAC Int. 86 (2003) 1015.
[18] M. Kuster, M. Lopez de Alda, D. Barcelo, Mass Spectrom. Rev. 25
(2006) 900.
[19] P.A. Mills, J.H. Onley, P.A. Gaither, J. Assoc. Off. Anal. Chem. 46
(1963) 186.
[20] M. Anastassiades, S.J. Lehotay, D. Stajhbaher, F.J. Schenck,
J. AOAC Int. 86 (2003) 412.
[21] F.E. Ahmed, Trends. Anal. Chem. 20 (2001) 649.
[22] C. Jansson, T. Pihlstrom, B.G. Osterdahl, K.E. Markides, J. Chro-
matogr., A 1023 (2004) 93.
[23] C.L. Hetherton, M.D. Sykes, R.J. Fussell, D.M. Goodall, Rapid
Commun. Mass Spectrom. 18 (2004) 2443.
[24] D. Ortelli, P. Edder, C. Corvi, Anal. Chim. Acta 520 (2004) 33.
[25] S.J. Lehotay, A. de Kok, M. Hiemstra, P. van Bodegraven, J. AOAC
Int. 88 (2005) 595.
[26] S.J. Lehotay, K. Mastovska, A.R. Lightfield, J. AOAC Int. 88
(2005) 615.
[27] A. Sannino, L. Bolzoni, M. Bandini, J. Chromatogr., A 1036
(2004) 161.
[28] A. Sannino, J. AOAC Int. 87 (2004) 991.
[29] C. Blasco, G. Font, Y. Pico, J. Chromatogr., A 970 (2002) 201.
[30] C. Blasco, G. Font, J. Manes, Y. Pico, Anal. Chem. 75 (2003)
3606.
[31] C. Ferrer, M.J. Gomez, J.F. Garcıa-Reyes, I. Ferrer, E.M. Thurman,
A.R. Fernandez-Alba, J. Chromatogr., A 1069 (2005) 183.
[32] S.J. Lehotay, K. Mastovska, S.J. Yun, J. AOAC Int. 88 (2005)
630.
[33] C. Soler, J. Manes, Y. Pico, J. Chromatogr., A 1048 (2004) 41.
[34] C. Soler, J. Manes, Y. Pico, J. Chromatogr., A 1067 (2005)
115.
[35] C. Soler, J. Manes, Y. Pico, J. Chromatogr., A 1088 (2005) 224.
[36] G.F. Pang, Y.M. Liu, C.L. Fan, J.J. Zhang, Y.Z. Cao, X.M. Li,
Z.Y. Li, Y.P. Wu, T.T. Guo, Anal. Bioanal. Chem. 384 (2006)
1366.
[37] C. Blasco, G. Font, Y. Pico, J. Chromatogr., A 1098 (2005) 37.
[38] A. Garrido Frenich, I. Martınez Salvador, J.L. Martinez Vidal,
T. Lopez Lopez, Anal. Bioanal. Chem. 383 (2005) 1618.
[39] S. Biogialli, R. Curini, A. Di Corcia, M. Nazzari, D. Tamburro,
J. Agric. Food. Chem. 52 (2004) 665.
[40] F. Hernandez, O.J. Pozo, J.V. Sancho, L. Bijlsma, M. Barreda,
E. Pitarch, J. Chromatogr., A 1109 (2006) 242.
[41] W.M.A. Niessen, P. Mnini, R. Andreoli, Mass Spectrom. Rev. 25
(2006) 881.
[42] L. Alder, S. Luderitz, K. Lindtner, H.J. Stan, J. Chromatogr., A
1058 (2004) 67.
[43] M.J. Taylor, K. Hunter, K.B. Hunter, D. Lindsay, S. Le Bouhellec,
J. Chromatogr., A 982 (2002) 225.
[44] European Union, MRLs sorted by pesticide update 04/11/2004,
2005: http://www.europa.eu.int/comm/food/plant/protection/
pesticides/index_en.htm.
[45] Code of Federal Regulations (CFR) of the USA, Title40, Protection
of the Environment, Part 180, Tolerances and exemptions from
tolerances for pesticide chemicals in food, 2004: http://
www.gpoaaccess.gov/cfr/index.html..
[46] UN Food and Agricultural Organization, Agricultural data,
FAOSTAT, 2005: http://faostat.fao.org/.
[47] European Union, Residue analytical methods for post-registration,
control and monitoring (SANCO/825/00), 17 March 2004:
http://europa.eu.int/comm/food/plant/protection/resources/
publications_en.htm.
[48] European Union, Quality control procedures for pesticide residues
analysis (SANCO/10476/2003): http://europa.eu.int/comm/
food/plant/protection/resources/publications_en.htm.
[49] European Union, Commission Decision 2002/657/EC implement-
ing Council Directive 96/23/EC concerning the performance of
analytical methods and interpretation of results, Off. J. Eur.
Commun. L239 (2002) 66.

[50] J. Zrostlikova, J. Hajslova, J. Poustka, P. Begany, J. Chromatogr., A
973 (2002) 13.
[51] C. Soler, B. Hamilton, A. Furey, J.K. James, J. Manes, Y. Pico,
Rapid Commun. Mass Spectrom. 20 (2006) 2151.
[52] E.M. Thurman, I. Ferrer, A.R. Fernandez-Alba, J. Chromatogr., A
1067 (2005) 127.
[53] J.F. Garcia-Reyes, I. Ferrer, E.M. Thurman, A. Molina-Dıaz,
A.R. Fernandez-Alba, Rapid Commun. Mass Spectrom. 19
(2005) 2780.
[54] E.M. Thurman, I. Ferrer, J.A. Zweigenbaum, J.F. Garcıa-Reyes,
M. Woodman, A.R. Fernandez-Alba, J. Chromatogr., A 1082
(2005) 71.
[55] F. Hernandez, O.J. Pozo, J.V. Sancho, F. Lopez, J.M. Marin,
M. Ibanez, Trends. Anal. Chem. 24 (2005) 596.
[56] M. Ibanez, J.V. Sancho, O.J. Pozo, W.M.A. Niessen, F. Hernandez,
Rapid Commun. Mass Spectrom. 19 (2005) 169.
[57] F. Hernandez, M. Ibanez, J.V. Sancho, O.J. Pozo, Anal. Chem. 76
(2004) 4349.