trends in advertising spend and effectiveness - shared value media
TRANSCRIPT

TRENDS IN ADVERTISING SPEND AND EFFECTIVENESS June 2011
STATEOF THEMEDIA
2 3
State of the Media: Trends in Advertising Spend and Effectiveness
As consumer choice and media fragmentation continue to grow, advertising effectiveness increasingly depends on reaching the right consumer, with the right message, in the right time and place—and being able to understand the direct sales impact of those efforts.
Nielsen delivers a comprehensive understanding of advertising’s impact by tracking the full spectrum of advertising spend and performance. Nielsen has prepared this fact sheet to provide a high-level snapshot of advertising spend, effectiveness trends and the latest insights on branded entertainment.
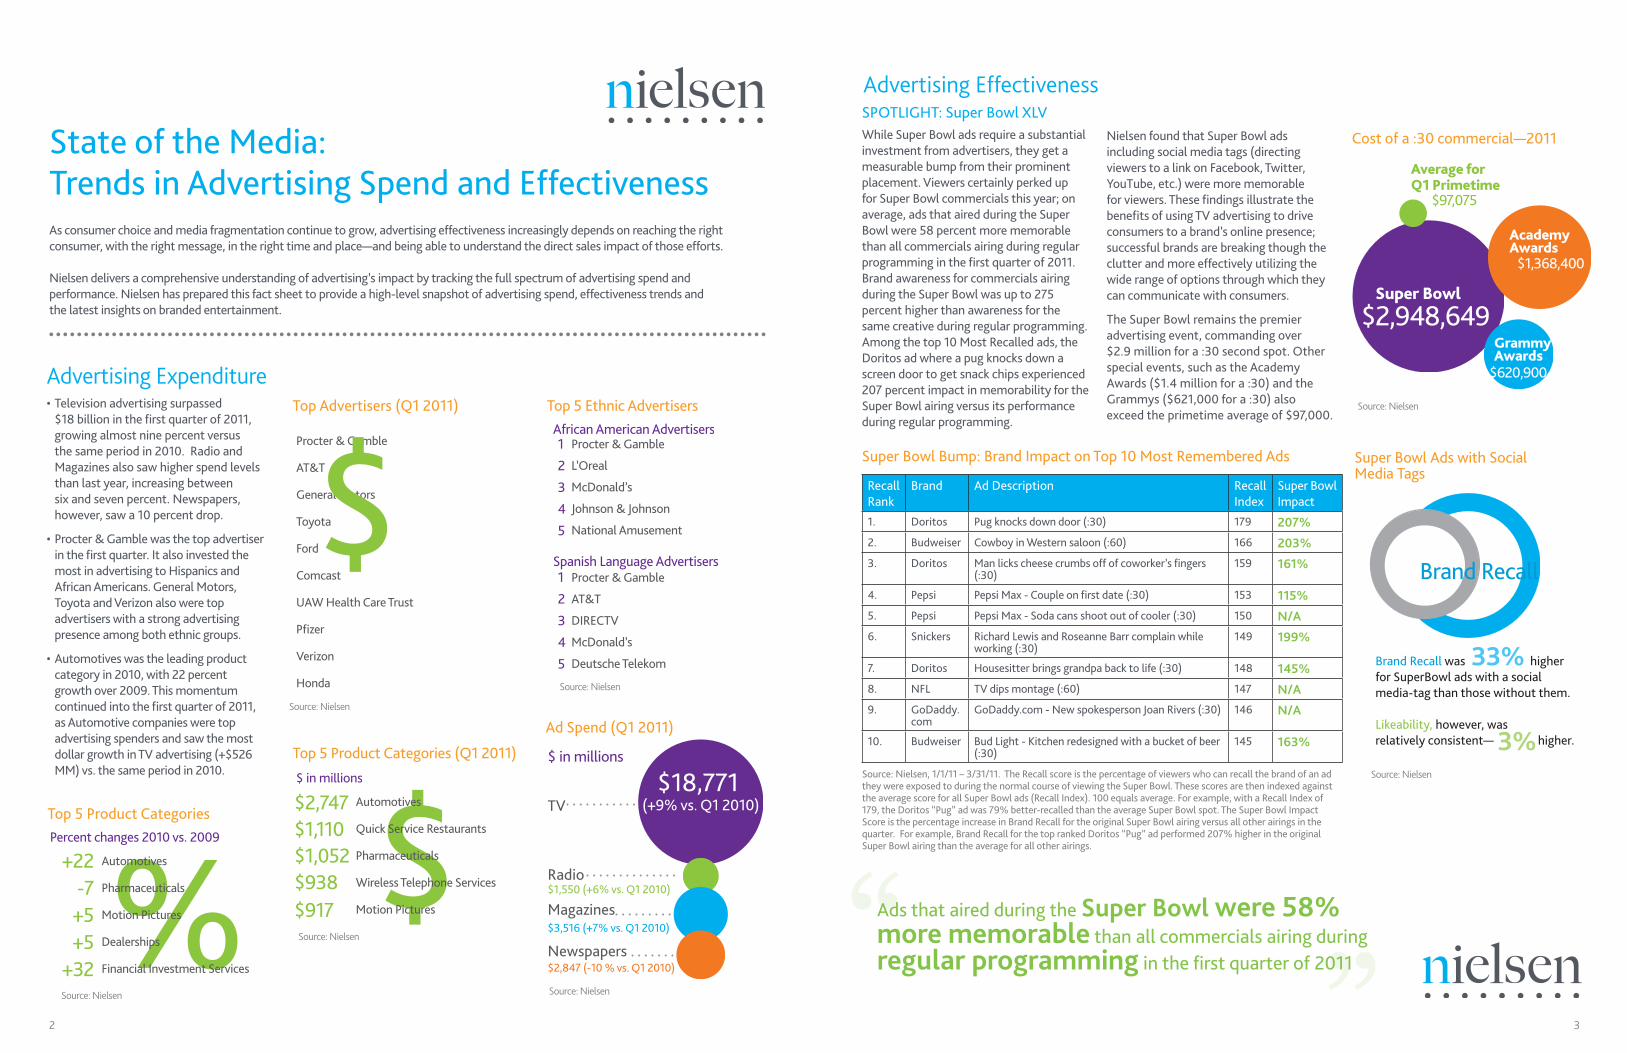
Advertising ExpenditureTelevision advertising surpassed •$18 billion in the first quarter of 2011, growing almost nine percent versus the same period in 2010. Radio and Magazines also saw higher spend levels than last year, increasing between six and seven percent. Newspapers, however, saw a 10 percent drop.
Procter & Gamble was the top advertiser •in the first quarter. It also invested the most in advertising to Hispanics and African Americans. General Motors, Toyota and Verizon also were top advertisers with a strong advertising presence among both ethnic groups.
Automotives was the leading product •category in 2010, with 22 percent growth over 2009. This momentum continued into the first quarter of 2011, as Automotive companies were top advertising spenders and saw the most dollar growth in TV advertising (+$526 MM) vs. the same period in 2010.
Ad Spend (Q1 2011)
$1,550 (+6% vs. Q1 2010)
$3,516 (+7% vs. Q1 2010)
$2,847 (-10 % vs. Q1 2010)
TV
$ in millions
Radio
Magazines
Newspapers
$18,771 (+9% vs. Q1 2010)
Source: Nielsen
Top 5 Ethnic Advertisers
Spanish Language Advertisers
African American AdvertisersProcter & Gamble
L’Oreal
McDonald’s
Johnson & Johnson
National Amusement
Procter & Gamble
AT&T
DIRECTV
McDonald’s
Deutsche Telekom
1
2
3
4
5
1
2
3
4
5
Source: Nielsen
Top Advertisers (Q1 2011)
Procter & Gamble
AT&T
General Motors
Toyota
Ford
Comcast
UAW Health Care Trust
Pfizer
Verizon
Honda
$Source: Nielsen
Top 5 Product Categories
%Automotives
Pharmaceuticals
Motion Pictures
Dealerships
Financial Investment Services
Percent changes 2010 vs. 2009
+22-7+5+5
+32Source: Nielsen
Top 5 Product Categories (Q1 2011)
$Automotives
Quick Service Restaurants
Pharmaceuticals
Wireless Telephone Services
Motion Pictures
$ in millions
$2,747$1,110$1,052$938$917Source: Nielsen
Ads that aired during the Super Bowl were 58% more memorable than all commercials airing during regular programming in the first quarter of 2011
SPOTLIGHT: Super Bowl XLVWhile Super Bowl ads require a substantial investment from advertisers, they get a measurable bump from their prominent placement. Viewers certainly perked up for Super Bowl commercials this year; on average, ads that aired during the Super Bowl were 58 percent more memorable than all commercials airing during regular programming in the first quarter of 2011. Brand awareness for commercials airing during the Super Bowl was up to 275 percent higher than awareness for the same creative during regular programming. Among the top 10 Most Recalled ads, the Doritos ad where a pug knocks down a screen door to get snack chips experienced 207 percent impact in memorability for the Super Bowl airing versus its performance during regular programming.
Super Bowl Bump: Brand Impact on Top 10 Most Remembered Ads
Recall Rank
Brand Ad Description Recall Index
Super Bowl Impact
1. Doritos Pug knocks down door (:30) 179 207%2. Budweiser Cowboy in Western saloon (:60) 166 203%3. Doritos Man licks cheese crumbs off of coworker’s fingers
(:30)159 161%
4. Pepsi Pepsi Max - Couple on first date (:30) 153 115%5. Pepsi Pepsi Max - Soda cans shoot out of cooler (:30) 150 N/A6. Snickers Richard Lewis and Roseanne Barr complain while
working (:30)149 199%
7. Doritos Housesitter brings grandpa back to life (:30) 148 145%8. NFL TV dips montage (:60) 147 N/A9. GoDaddy.
comGoDaddy.com - New spokesperson Joan Rivers (:30) 146 N/A
10. Budweiser Bud Light - Kitchen redesigned with a bucket of beer (:30)
145 163%
Source: Nielsen, 1/1/11 – 3/31/11. The Recall score is the percentage of viewers who can recall the brand of an ad they were exposed to during the normal course of viewing the Super Bowl. These scores are then indexed against the average score for all Super Bowl ads (Recall Index). 100 equals average. For example, with a Recall Index of 179, the Doritos “Pug” ad was 79% better-recalled than the average Super Bowl spot. The Super Bowl Impact Score is the percentage increase in Brand Recall for the original Super Bowl airing versus all other airings in the quarter. For example, Brand Recall for the top ranked Doritos “Pug” ad performed 207% higher in the original Super Bowl airing than the average for all other airings.
Cost of a :30 commercial—2011
Super Bowl Ads with Social Media Tags
Average for Q1 Primetime
$97,075
$2,948,649Super Bowl
$620,900
$1,368,400
GrammyAwards
Academy Awards
Source: Nielsen
Nielsen found that Super Bowl ads including social media tags (directing viewers to a link on Facebook, Twitter, YouTube, etc.) were more memorable for viewers. These findings illustrate the benefits of using TV advertising to drive consumers to a brand’s online presence; successful brands are breaking though the clutter and more effectively utilizing the wide range of options through which they can communicate with consumers.
The Super Bowl remains the premier advertising event, commanding over $2.9 million for a :30 second spot. Other special events, such as the Academy Awards ($1.4 million for a :30) and the Grammys ($621,000 for a :30) also exceed the primetime average of $97,000.
Advertising Effectiveness
Brand Recall was 33% higher for SuperBowl ads with a social media-tag than those without them.
Likeability, however, was relatively consistent— higher.3%
Brand Recall
Source: Nielsen
4 5
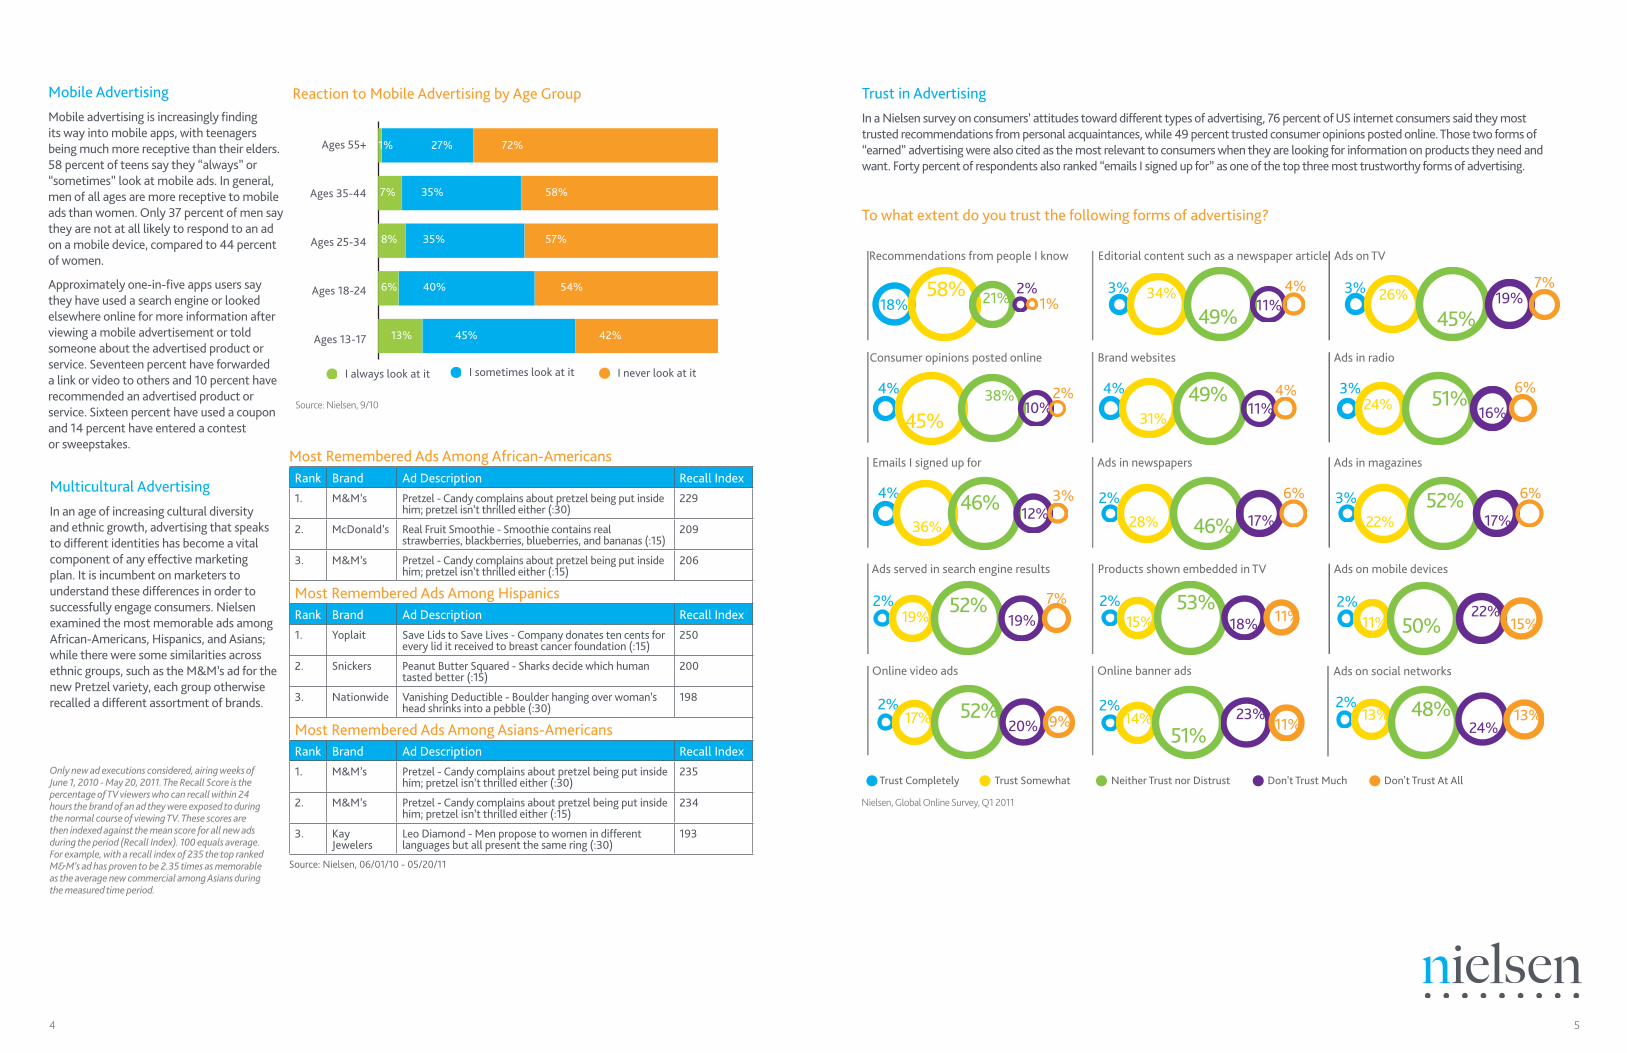
Mobile Advertising
Mobile advertising is increasingly finding its way into mobile apps, with teenagers being much more receptive than their elders. 58 percent of teens say they “always” or “sometimes” look at mobile ads. In general, men of all ages are more receptive to mobile ads than women. Only 37 percent of men say they are not at all likely to respond to an ad on a mobile device, compared to 44 percent of women.
Approximately one-in-five apps users say they have used a search engine or looked elsewhere online for more information after viewing a mobile advertisement or told someone about the advertised product or service. Seventeen percent have forwarded a link or video to others and 10 percent have recommended an advertised product or service. Sixteen percent have used a coupon and 14 percent have entered a contest or sweepstakes.
Most Remembered Ads Among African-AmericansRank Brand Ad Description Recall Index1. M&M’s Pretzel - Candy complains about pretzel being put inside
him; pretzel isn’t thrilled either (:30)229
2. McDonald’s Real Fruit Smoothie - Smoothie contains real strawberries, blackberries, blueberries, and bananas (:15)
209
3. M&M’s Pretzel - Candy complains about pretzel being put inside him; pretzel isn’t thrilled either (:15)
206
Most Remembered Ads Among HispanicsRank Brand Ad Description Recall Index1. Yoplait Save Lids to Save Lives - Company donates ten cents for
every lid it received to breast cancer foundation (:15)250
2. Snickers Peanut Butter Squared - Sharks decide which human tasted better (:15)
200
3. Nationwide Vanishing Deductible - Boulder hanging over woman’s head shrinks into a pebble (:30)
198
Most Remembered Ads Among Asians-AmericansRank Brand Ad Description Recall Index1. M&M’s Pretzel - Candy complains about pretzel being put inside
him; pretzel isn’t thrilled either (:30)235
2. M&M’s Pretzel - Candy complains about pretzel being put inside him; pretzel isn’t thrilled either (:15)
234
3. Kay Jewelers
Leo Diamond - Men propose to women in different languages but all present the same ring (:30)
193
Source: Nielsen, 06/01/10 - 05/20/11
Multicultural Advertising
In an age of increasing cultural diversity and ethnic growth, advertising that speaks to different identities has become a vital component of any effective marketing plan. It is incumbent on marketers to understand these differences in order to successfully engage consumers. Nielsen examined the most memorable ads among African-Americans, Hispanics, and Asians; while there were some similarities across ethnic groups, such as the M&M’s ad for the new Pretzel variety, each group otherwise recalled a different assortment of brands.
Only new ad executions considered, airing weeks of June 1, 2010 - May 20, 2011. The Recall Score is the percentage of TV viewers who can recall within 24 hours the brand of an ad they were exposed to during the normal course of viewing TV. These scores are then indexed against the mean score for all new ads during the period (Recall Index). 100 equals average. For example, with a recall index of 235 the top ranked M&M’s ad has proven to be 2.35 times as memorable as the average new commercial among Asians during the measured time period.
1%Ages 55+
Ages 35-44
Ages 25-34
Ages 18-24
Ages 13-17
27% 72%
58%35%7%
8% 35% 57%
6% 40% 54%
13% 45% 42%
I always look at it I sometimes look at it I never look at it
Source: Nielsen, 9/10
Reaction to Mobile Advertising by Age Group Trust in Advertising
In a Nielsen survey on consumers’ attitudes toward different types of advertising, 76 percent of US internet consumers said they most trusted recommendations from personal acquaintances, while 49 percent trusted consumer opinions posted online. Those two forms of “earned” advertising were also cited as the most relevant to consumers when they are looking for information on products they need and want. Forty percent of respondents also ranked “emails I signed up for” as one of the top three most trustworthy forms of advertising.
To what extent do you trust the following forms of advertising?
Nielsen, Global Online Survey, Q1 2011
Trust Completely Trust Somewhat Neither Trust nor Distrust Don't Trust Much Don't Trust At All
45%38%
10%4% 2%
Consumer opinions posted online
Recommendations from people I know
58% 21%2%
18% 1%
46%36%
12%4% 3%
Emails I signed up for
31%49%
11%4% 4%
Brand websites
Editorial content such as a newspaper article
34%
49%11%
3% 4%
46%28% 17%2% 6%
Ads in newspapers
24% 51%16%
3% 6%
Ads in radio
Ads on TV
26%
45%19%
3% 7%
48%13%24%
2%13%
Ads on social networks
Ads on mobile devices
11% 50%22%
2%15%
52%22% 17%
3% 6%
Ads in magazines
Products shown embedded in TV
15%53%
18%2%
11%
Ads served in search engine results
19%52%
19%2% 7%
51%14% 23%2%
11%
Online banner ads
52%17% 20%2%
9%
Online video ads
6 7
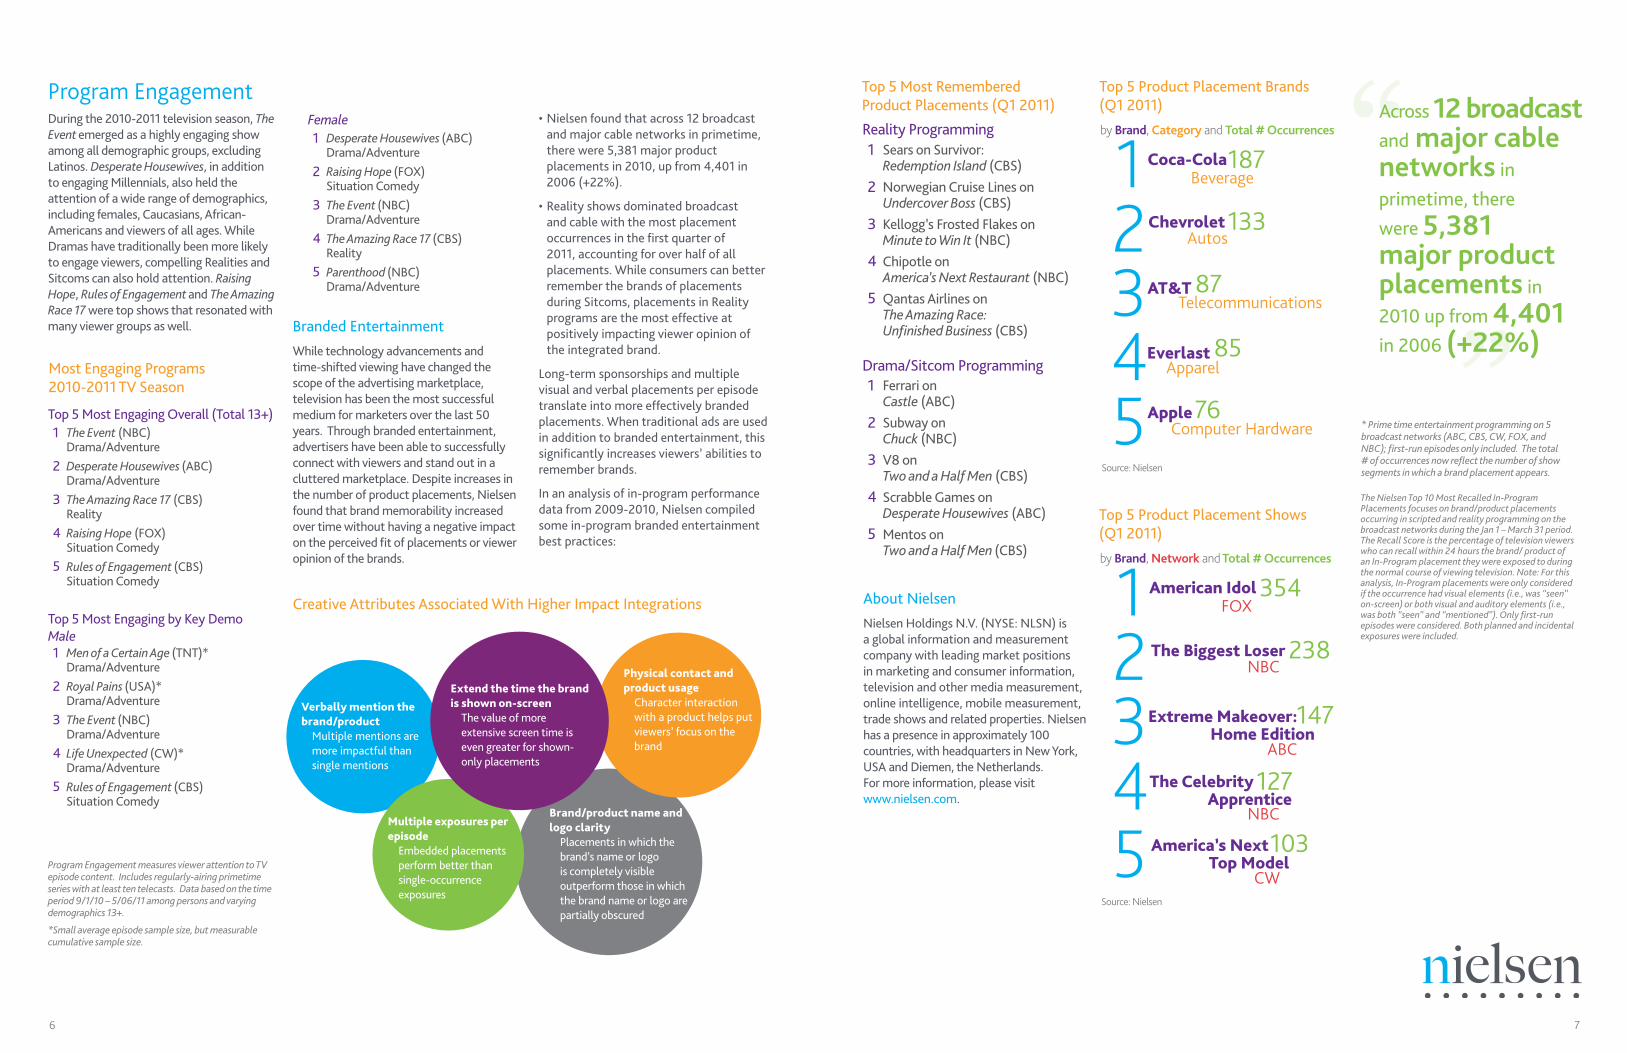
Program EngagementDuring the 2010-2011 television season, The Event emerged as a highly engaging show among all demographic groups, excluding Latinos. Desperate Housewives, in addition to engaging Millennials, also held the attention of a wide range of demographics, including females, Caucasians, African-Americans and viewers of all ages. While Dramas have traditionally been more likely to engage viewers, compelling Realities and Sitcoms can also hold attention. Raising Hope, Rules of Engagement and The Amazing Race 17 were top shows that resonated with many viewer groups as well. Branded Entertainment
While technology advancements and time-shifted viewing have changed the scope of the advertising marketplace, television has been the most successful medium for marketers over the last 50 years. Through branded entertainment, advertisers have been able to successfully connect with viewers and stand out in a cluttered marketplace. Despite increases in the number of product placements, Nielsen found that brand memorability increased over time without having a negative impact on the perceived fit of placements or viewer opinion of the brands.
Nielsen found that across 12 broadcast •and major cable networks in primetime, there were 5,381 major product placements in 2010, up from 4,401 in 2006 (+22%).
Reality shows dominated broadcast •and cable with the most placement occurrences in the first quarter of 2011, accounting for over half of all placements. While consumers can better remember the brands of placements during Sitcoms, placements in Reality programs are the most effective at positively impacting viewer opinion of the integrated brand.
Long-term sponsorships and multiple visual and verbal placements per episode translate into more effectively branded placements. When traditional ads are used in addition to branded entertainment, this significantly increases viewers’ abilities to remember brands.
In an analysis of in-program performance data from 2009-2010, Nielsen compiled some in-program branded entertainment best practices:
Creative Attributes Associated With Higher Impact Integrations
Verbally mention the brand/product
Multiple mentions are more impactful than single mentions
Brand/product name and logo clarity
Placements in which the brand’s name or logo is completely visible outperform those in which the brand name or logo are partially obscured
Physical contact and product usage
Character interaction with a product helps put viewers’ focus on the brand
Multiple exposures per episode
Embedded placements perform better than single-occurrence exposures
Extend the time the brand is shown on-screen
The value of more extensive screen time is even greater for shown-only placements
Program Engagement measures viewer attention to TV episode content. Includes regularly-airing primetime series with at least ten telecasts. Data based on the time period 9/1/10 – 5/06/11 among persons and varying demographics 13+.
*Small average episode sample size, but measurable cumulative sample size.
Most Engaging Programs 2010-2011 TV Season
Top 5 Most Engaging Overall (Total 13+) The Event (NBC) Drama/AdventureDesperate Housewives (ABC) Drama/AdventureThe Amazing Race 17 (CBS) RealityRaising Hope (FOX) Situation ComedyRules of Engagement (CBS) Situation Comedy
1
2
3
4
5
Female Desperate Housewives (ABC) Drama/AdventureRaising Hope (FOX) Situation ComedyThe Event (NBC) Drama/AdventureThe Amazing Race 17 (CBS) RealityParenthood (NBC) Drama/Adventure
1
2
3
4
5
Top 5 Most Engaging by Key Demo Male
Men of a Certain Age (TNT)* Drama/AdventureRoyal Pains (USA)* Drama/AdventureThe Event (NBC) Drama/AdventureLife Unexpected (CW)* Drama/AdventureRules of Engagement (CBS) Situation Comedy
1
2
3
4
5
Top 5 Most Remembered Product Placements (Q1 2011)
Across 12 broadcast and major cable networks in primetime, there were 5,381 major product placements in 2010 up from 4,401 in 2006 (+22%)
Top 5 Product Placement Brands (Q1 2011)
12345
by Brand, Category and Total # Occurrences
Coca-ColaBeverage
187
133
87
85
76
Autos
Telecommunications
Apparel
Computer Hardware
Chevrolet
AT&T
Everlast
Apple
by Brand, Network and Total # Occurrences
American IdolFOX
354
238
147
127
103
NBC
ABC
NBC
CW
The Biggest Loser
Extreme Makeover: Home Edition
The Celebrity Apprentice
America’s Next Top Model
12345
Source: Nielsen
Top 5 Product Placement Shows (Q1 2011)
12345
by Brand, Category and Total # Occurrences
Coca-ColaBeverage
187
133
87
85
76
Autos
Telecommunications
Apparel
Computer Hardware
Chevrolet
AT&T
Everlast
Apple
by Brand, Network and Total # Occurrences
American IdolFOX
354
238
147
127
103
NBC
ABC
NBC
CW
The Biggest Loser
Extreme Makeover: Home Edition
The Celebrity Apprentice
America’s Next Top Model
12345
Source: Nielsen
About Nielsen
Nielsen Holdings N.V. (NYSE: NLSN) is a global information and measurement company with leading market positions in marketing and consumer information, television and other media measurement, online intelligence, mobile measurement, trade shows and related properties. Nielsen has a presence in approximately 100 countries, with headquarters in New York, USA and Diemen, the Netherlands. For more information, please visit www.nielsen.com.
* Prime time entertainment programming on 5 broadcast networks (ABC, CBS, CW, FOX, and NBC); first-run episodes only included. The total # of occurrences now reflect the number of show segments in which a brand placement appears.
The Nielsen Top 10 Most Recalled In-Program Placements focuses on brand/product placements occurring in scripted and reality programming on the broadcast networks during the Jan 1 – March 31 period. The Recall Score is the percentage of television viewers who can recall within 24 hours the brand/ product of an In-Program placement they were exposed to during the normal course of viewing television. Note: For this analysis, In-Program placements were only considered if the occurrence had visual elements (i.e., was “seen” on-screen) or both visual and auditory elements (i.e., was both “seen” and “mentioned”). Only first-run episodes were considered. Both planned and incidental exposures were included.
Reality ProgrammingSears on Survivor: Redemption Island (CBS)Norwegian Cruise Lines on Undercover Boss (CBS)Kellogg’s Frosted Flakes on Minute to Win It (NBC)Chipotle on America’s Next Restaurant (NBC)Qantas Airlines on The Amazing Race: Unfinished Business (CBS)
1
2
3
4
5
Drama/Sitcom Programming Ferrari on Castle (ABC)Subway on Chuck (NBC)V8 on Two and a Half Men (CBS)Scrabble Games on Desperate Housewives (ABC)Mentos on Two and a Half Men (CBS)
1
2
3
4
5

Copyright © 2011 The Nielsen Company. All rights reserved. Printed in the USA. Nielsen and the Nielsen
logo are trademarks or registered trademarks of CZT/ACN Trademarks, L.L.C. Other product and service
names are trademarks or registered trademarks of their respective companies. 11/3313
www.nielsen.com