trends in accommodations and accessibility features...
TRANSCRIPT

Trends in Accommodations and Accessibility Features English Learners Received on Statewide Assessments
YI-CHEN WU & MARTHA THURLOWMARCH 7, 2019

Outline• Project Supporting Work• Accessibility Paradigm Shift• Analysis of State Data on Accommodations

Relevance to ESL Educators in MinnesotaOverview of the DIAMOND Project

Need for Project• Sometimes educators make decisions about accessibility
features and accommodations based on:◦ Feasibility (e.g., selecting only supports that are readily
available)◦ Placement information (e.g., selecting the same supports
for all below-level readers)◦ Demographic information (e.g., selecting the same
supports for all English learners)

Purpose• The DIAMOND Project aims to improve the validity of
assessment results and interpretations for students with documented needs by developing guidelines for educators to make informed decisions about accessibility features and accommodations.

Partners• Funded by a US Department of Education Enhanced Assessment
Instruments Grant• Collaboration between the National Center on Educational Outcomes
and the departments of education of nine states
• Alabama• Connecticut• Maryland• Michigan• Minnesota • Ohio• West Virginia• Wisconsin• U.S. Virgin Islands

Research Activities1.Facilitating online focus groups with teachers2.Conducting teacher interviews and student demonstrations3.Analyzing state assessment data4.Hosting a forum with national experts to develop guidelines5.Creating a training module and supplemental materials6.Piloting and revising the professional development materials

Relevance to ESL Educators in MinnesotaAccessibility Paradigm Shift

What Do We Mean by Accessibility?• Accessibility means providing students with tools or
supports that level the playing field• Some examples:
◦ ASL video for a deaf student◦ Extended time for an English learner◦ Answer masking for a student with ADHD◦ Separate setting for struggling student
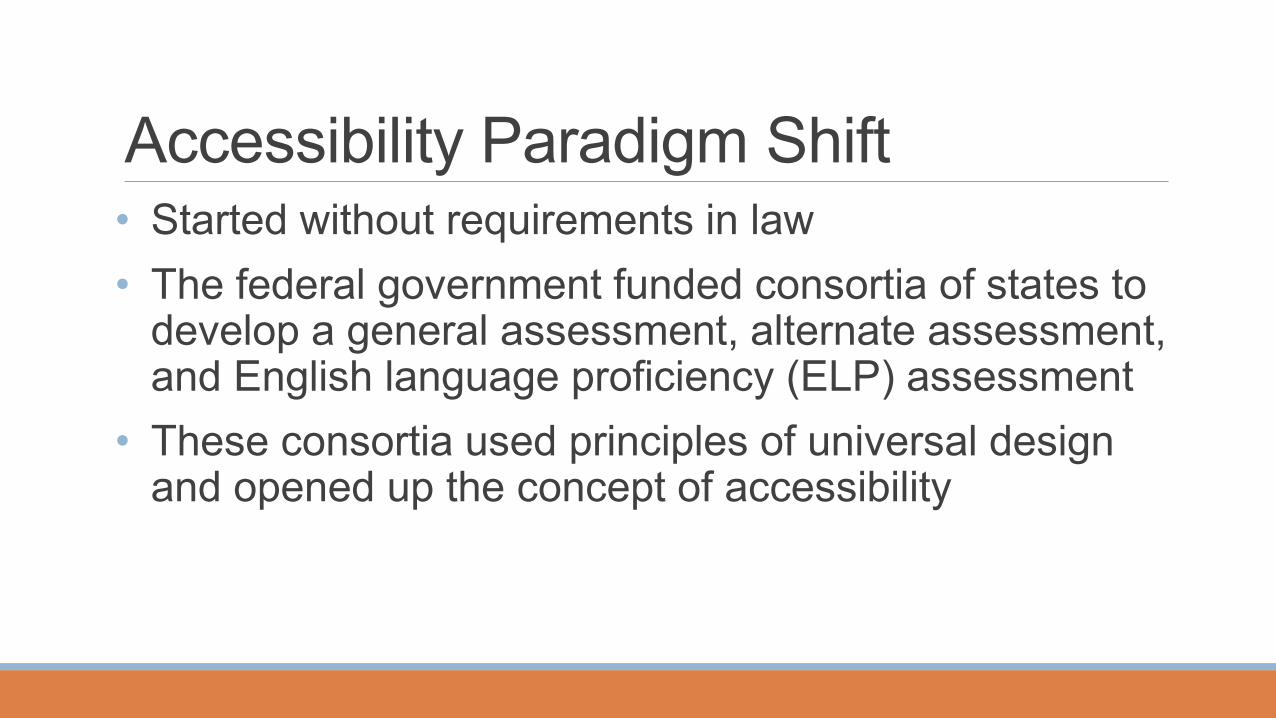
Accessibility Paradigm Shift• Started without requirements in law• The federal government funded consortia of states to
develop a general assessment, alternate assessment, and English language proficiency (ELP) assessment
• These consortia used principles of universal design and opened up the concept of accessibility

Tiers of AccessibilityUniversal Features
for all students
Designated Featuresfor students who need them as
identified by an educator in advance
Accommodationsfor students with disabilities; in some
cases, ELs are also eligible
Your Thoughts
Has this accommodationsparadigm shift occurred in
your state?

Relevance to ESL Educators in MinnesotaDeveloping a Common Language

Accessibility Features and Accommodations• More than 50 distinct accessibility features and
accommodations have been identified• These supports often have different names • For example, one support that allows students to
cross out answers that seem incorrect is called strikethrough, eliminate answer choices, and answer choice eliminator on different tests

White Paper• Describes inconsistencies in
accessibility language• Advocates for consistent language
and implementation• Input obtained from more than 80
educators, policymakers, and test vendors in 2016
• Available in English and Spanish

Forum on Common Language for States and Assessment Vendors• Highlighted White Paper on common
accessibility language• Provided demonstrations by three
vendors• Led discussions of 80 participants,
focused on:• Students with IEPs and 504 plans• English learners
• General education students

Data Analyses

Rationale• ESSA reaffirmed the importance of ensuring that
assessments are accessible and that ELs are provided accommodations for classroom and state assessments.
• English Learner Tool Kit (2017) includes information on providing accommodations to ELs
• ESEA Peer Review Guidance emphasized that states monitor the provision and use of accommodations.

Data• Student-level data
One state’s data to illustrate how data can be used to answer important questions about accommodations.
Results will be analyzed by school level (elementary, middle and high school levels).
• Research Questions Receiving accommodationsHow many ELs received accommodations?What is the performance of ELs who received accommodations?What were the characteristics of ELs receiving accommodations? How does performance relate to changes over time in accommodations received by individual
ELs? Commonly used accommodationsWhat were the commonly received accommodations and accessibility features for ELs?

Results• Receiving Accommodations
◦ Accommodations Received During Regular Assessments◦ Characteristics of Students Receiving Accommodations◦ Performance Related to Changes Over Time in
Accommodations Received by Individual Students• Commonly used Accommodations
◦ Changes Over Time in Most Commonly Used Accommodations

Receiving accommodations
05
10152025303540
2012-13 2013-14 2014-15 2015-16 2012-13 2013-14 2014-15 2015-16
Perc
enta
ge o
f ELs
rece
ivin
g ac
com
mod
atio
ns
Year
Elementary Middle High School
Math Reading

Characteristics
020406080
100O
vera
ll
Rece
ivin
gAc
com
mod
atio
ns
Ove
rall
Rece
ivin
gAc
com
mod
atio
nsMath Reading
Perc
ent o
f ELs
Gender in 2015-16
Female Male
020406080
100
Ove
rall
Rece
ivin
gAc
com
mod
atio
ns
Ove
rall
Rece
ivin
gAc
com
mod
atio
ns
Math Reading
Perc
ent o
f ELs
Free/Reduced Lunch in 2015-16
Yes

0%
29%
39%
27%
5%Overall
0%
22%
54%
19%
5%Receiving Accommodations
American Indian/Alaska Native Asian or Pacific IslanderHispanic/Latino Black/African AmericanWhite
EL Characteristics - Math Assessment in 2015-16
Ethnicity
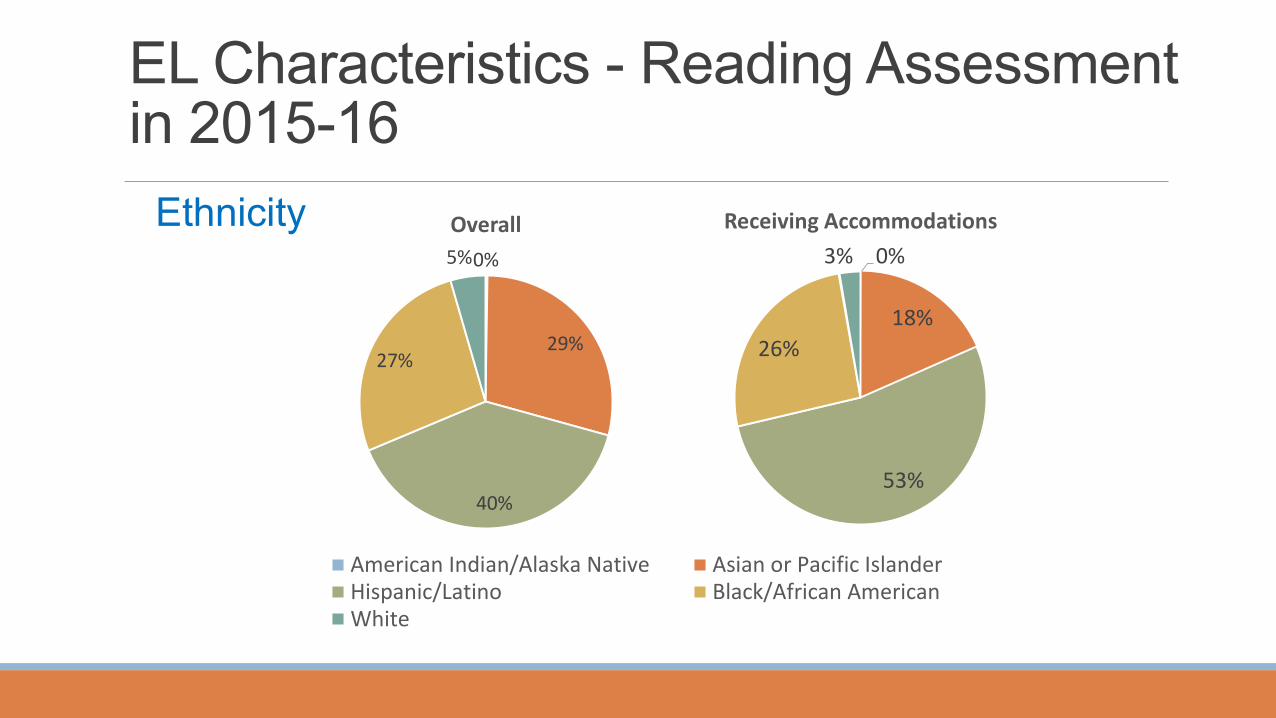
0%
29%
40%
27%
5%Overall
0%
18%
53%
26%
3%Receiving Accommodations
American Indian/Alaska Native Asian or Pacific IslanderHispanic/Latino Black/African AmericanWhite
EL Characteristics - Reading Assessment in 2015-16
Ethnicity
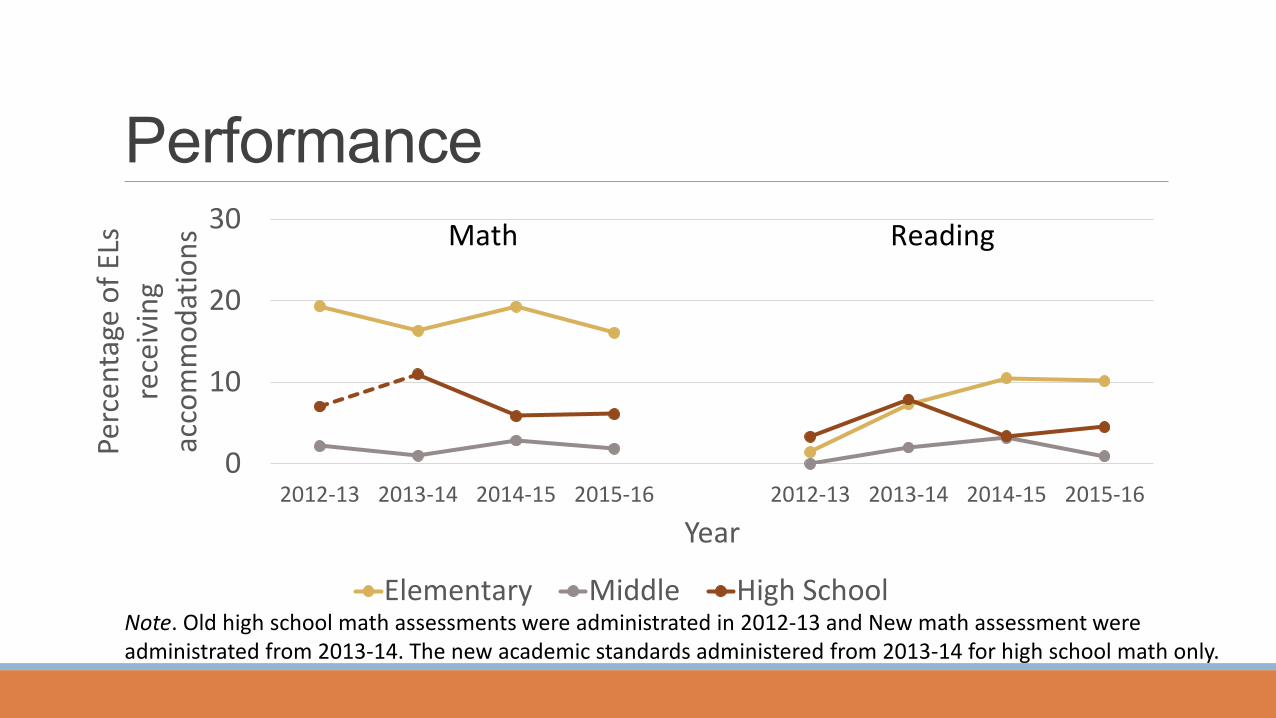
Performance
0
10
20
30
2012-13 2013-14 2014-15 2015-16 2012-13 2013-14 2014-15 2015-16
Perc
enta
ge o
f ELs
re
ceiv
ing
acco
mm
odat
ions
Year
Elementary Middle High School
Math Reading
Note. Old high school math assessments were administrated in 2012-13 and New math assessment were administrated from 2013-14. The new academic standards administered from 2013-14 for high school math only.

Commonly Used Math Accommodations—Elementary
47.7 42.2
16.2
83.2
19.1 11.0
47.738.7
16.4
54.8
30.7 25.2
020406080
100
MS MC OA MS OA TD MC MS OA MC MS OA
2012-13 2013-14 2014-15 2015-16
Perc
enta
ge o
f ELs
Accommodations CodesNote. MS = math script; MC – math CD; OA = other accommodation; TD = translated directions.

Commonly Used Math Accommodations—Middle school
47.234.1
22.7
56.1
30.4 22.443.0
31.0 23.6
46.637.3
26.1
020406080
100
MC MS OA MS OA TD MC MS OA MC OA MS
2012-13 2013-14 2014-15 2015-16
Perc
enta
ge o
f ELs
Accommodations CodesNote. MS = math script; MC – math CD; OA = other accommodation; TD = translated directions.

Commonly Used Math Accommodations—HS
36.5 44.524.8
59.4
31.713.9 18.9
29.5 26.7
71.3
32.4 30.6
020406080
100
OA MC TD OA TD MS TD OA MC OA MC TD
2012-13 2013-14 2014-15 2015-16
Perc
enta
ge o
f ELs
Accommodations Codes
Note. MS = math script; MC – math CD; OA = other accommodation; TD = translated directions.

Commonly Used Reading Accommodations—Elementary
Note. OA = other accommodation; TD = sign interpretation of test directions or writing prompt; 18 = large print.
75.9
23.92.5
69.9
34.4
4.3
63.6
37.2
2.4
69.752.8
1.70
20406080
100
OA TD 18 OA TD 18 OA TD 18 OA TD 18
2012-13 2013-14 2014-15 2015-16
Perc
enta
ge o
f ELs
Accommodations Codes

Commonly Used Reading Accommodations—Middle school
Note. OA = other accommodation; 18 = large print; 24 = large print; TD = sign interpretation of test directions or writing prompt; AT = assistive technology.
58.137.1
4.8
48.847.8
4.4
63.444.5
1.8
78.2
47.5
1.60
20406080
100
OA TD AT OA TD AT OA TD AT OA TD 18
2012-13 2013-14 2014-15 2015-16
Perc
enta
ge o
f ELs
Accommodations Codes

Commonly Used Reading Accommodations—HS
Note. OA = other accommodation; 18 = large print; 24 = large print; AT = assistive technology; TD = sign interpretation of test directions or writing prompt.
50.0 48.5
3.0
38.0
62.0
4.0
50.8 46.0
3.2
94.3
38.7
1.90
20406080
100
OA TD AT OA TD MT TD OA 24 OA TD 18
2012-13 2013-14 2014-15 2015-16
Perc
enta
ge o
f ELs
Accommodations Codes

Student Level Data—Consistency• Patterns of accommodations received for ELs with 4 years of records
who ever received special education services
82.4
17.0
0.5
94.6
5.30.1
0102030405060708090
100
Noaccommodations
ever
Accommodations1 to 3 years
Accommodationsevery year
Noaccommodations
ever
Accommodations1 to 3 years
Accommodationsevery year
Perc
enta
ge o
f ELs
Patterns of Receiving Accommodations
Math(N = 17,159)
Reading(N = 16,716)

Performance
80.2
17.6N/A
87.5
N/A N/A0
20
40
60
80
100
BelowProficientEvery Year
At or AboveProficient 1to 3 years
At or AboveProficientEvery Year
BelowProficientEvery Year
At or AboveProficient 1to 3 years
At or AboveProficientEvery Year
Perc
enta
ge o
f ELs Math Reading
Performance for ELs who received accommodations 4 years

Summary• Percentages of ELs receiving accommodations were lower for reading
than math.• Differences among school levels were obvious for math assessments,
but not for reading assessments.• Gender distributions for the two groups (EL vs. EL with
accommodations) were very similar, with just slightly more of the ELs receiving accommodations being male.
• More ELs receiving accommodations were Hispanic/Latino, and fewer ELs were Asian or Pacific Islander.
• For both math and reading, the percentages of ELs in each group receiving free/reduced price lunch were similar (90%).

Summary – cont.• The percentage of ELs proficient across years was generally higher for
math compared to reading for ELs in the elementary school level, but about the same for ELs in the middle school and high school levels.
• Math script was always used by the largest percentage of ELs at the elementary school level. "Other Accommodations" were among the top three most commonly used accommodations.
• ELs with 4 years of accommodations data◦ Low percentages of ELs received accommodations
◦ Not consistently receiving accommodations might be due to accessibility features only available since 2014-15.
◦ Most ELs who received accommodations for four years had performance below proficient.

Implications• Educators should examine information on the
accommodations provided to ELs. Are the numbers and types of accommodations appropriate for the students' needs?
• Educators should study the characteristics of ELs receiving accommodations (e.g., gender, ethnicity, free/reduced lunch) to determine whether accommodations are used equitably.

Questions or Comments?

For More Information• Visit the DIAMOND
webpage on the NCEO website: https://nceo.info/About/projects/nceoprojects/diamond