trends final report - oklahoma water resources board€¦ · discharge, water sample lab number,...
TRANSCRIPT

09‐400 Annual Report | 1
Funded by Arkansas Natural Resources CommissionProject #09‐400 | July 1, 2009‐ June 30, 2011
WATER QUALITY TRENDS ACROSS SELECT 319 MONITORING SITES IN NORTHWEST ARKANSAS
July 2011
09‐400 Annual Report | 2
Water Quality Trends across Select 319 Monitoring Sites in Northwest Arkansas
Bryan W. Bailey, Brian E. Haggard and Leslie B. Massey Arkansas Water Resources Center
EXECUTIVE SUMMARY
Northwest Arkansas contains two 319 priority watersheds that the Arkansas Natural Resources Commission has identified as being impacted by point source and nonpoint source pollution (i.e., phosphorus, nitrogen, and sediment). The Arkansas Water Resources Center completed a comprehensive assessment of water quality trends of the data that has been collected through the ANRC 319 Program from 1997 to 2010, or at sites where sufficient constituent concentration data were available. This project specifically focused on determining water quality trends at select sites within the Illinois River (HUC# 11110103) and Beaver Reservoir (HUC# 11010001) priority watersheds, including Ballard Creek, Osage Creek, Illinois River, White River, West Fork White River and the Kings River. Water quality trends were analyzed using flow‐adjusted constituent concentrations of phosphorus, nitrogen, sediment, sulfate and chloride, and parametric and non‐parametric statistical techniques to determine if constituent concentrations were increasing, decreasing or not significantly changing over time. Overall, flow‐adjusted concentrations of phosphorus and sediment have been decreasing across these watersheds based upon both statistical approaches. The decrease in phosphorus was likely the most important observation, because most water quality concerns in this region have focused on elevated phosphorus concentrations in these transboundary watersheds. These trends can be used along with other watershed information to improve the knowledge of how past, current, and future management decisions have influenced the watershed. This project was funded from July 1, 2009 through June 30, 2011 with a budget of $54,357 (federal) and $41,016 (non federal).
ABBREVIATIONS: Chloride (Cl), Sulfate (SO4), Ammonia‐Nitrogen (NH3‐N), Nitrate‐Nitrogen (NO3‐N), Soluble Reactive Phosphorus (SRP), Total Nitrogen (TN), Total Phosphorus (TP), Total Suspended Solids (TSS), Arkansas Water Resources Center (AWRC), Arkansas Natural Resources Commission (ANRC), Arkansas Department of Environmental Quality (ADEQ), Center for Applied Spatial Technology (CAST), Illinois River Watershed (IRW), Upper White River Basin (UWRB), Discharge (Q), Concentration (C),Flow‐Adjusted Concentration (FAC), Event Mean Discharge (EMQ), Event Mean Concentration (EMC), Cubic Feet per Second (cfs), Practical Quantitation Limit (PQL), Method Detection Limit (MDL)

09‐400 Annual Report | 3
PROJECT CHRONOLOGY
STUDY SITE DESCRIPTION The Illinois River Watershed (IRW; HUC# 11110103) and the Upper White River Basin (UWRB; HUC# 11010001) have been identified by the Arkansas Natural Resources Commission (ANRC) as nutrient surplus watersheds and classified as priority watersheds by the 319 Program. In addition, Arkansas is the upstream state in both watersheds and can be required to meet water quality standards set by downstream states, Oklahoma and Missouri, respectively. The purpose of this project was to conduct a comprehensive evaluation of the available data in these priority watersheds from the ANRC 319 Program using acceptable statistical methods to determine long‐term trends in water quality. The IRW (see Appendix A) has a drainage area of approximately 195,285 ha in northwest Arkansas and the Illinois River originates near Hogeye, southwest of Fayetteville, Arkansas flowing through the Ozark Highlands into Oklahoma. From 1990 to 2000, the watershed has seen a 48 percent increase in population, from 131,240 to 193,914 (CAST, 2006). According to the 2010 Census, the population of residents has increased for the cities of Bentonville, Springdale, and Rogers by over 30 percent in the past 10 years. The population growth is credited to local economic growth and stability, resulting in considerable increases in residential, commercial and industrial developments. In 2006, land coverage was primarily pasture (45%), forest (36%) and urban (13%) (CAST, 2006). The Upper White River Basin (UWRB; see Appendix A) is composed of four counties in northwest Arkansas with a drainage area of approximately 574,718 ha and crosses into southwest Missouri. In 2006, land coverage in Arkansas was dominated by forest (64%) and pasture (23%) with a fraction of urban (4%), water (2%) and herbaceous (7%) (CAST, 2006). The population of residents in the watershed increased from 77,661 to 101,859 from 1990 to 2000, which is approximately 31 percent increase within the watershed (CAST, 2006). According to the 2010 Census, the populations of residents in Benton and Washington Counties have increased from 153,406 to 221,339 and 157,715 to 203,065 in the past 10 years, respectively. Also, located within the UWRB is northwest Arkansas’s primary drinking water supply, Beaver Lake. Site location, land use and land cover data (LULC). Table 1. Selected study sites with global positioning coordinates in the Illinois River Watershed (HUC: 11110103) and the Upper White River Basin (Beaver Reservoir HUC: 11010001) – 319 Priority Watersheds, U.S. Geological Survey (USGS) site identification, land use for the specified drainage area (CAST, 2006), and available water quality data collected by Arkansas Water Resources Center (AWRC).
Land Use ( ) [b] Water Quality
Site[c] USGS Station Latitude Longitude Area[a] (ha) U W H F P Period of Record
1‐BC AWRC 35°59’49” 94°31’38” 5,956 3.9 0.2 4.1 32 59 2000‐2010
2‐OC 7195000 36°13’19” 94°17’18” 33,669 30 0.2 4.6 14 47 2007‐2010
3‐IR 7195430 36°06’31” 94°32’00" 148,924 13 0.4 4.2 37 45 1997‐2010
4‐KR 7050500 36°25’38” 93°37’15” 136,492 1.7 0.1 6.3 71 20 2001‐2010
5‐WFWR 7048550 36°03’14” 94°04’59” 31,856 14 0.4 5.6 66 14 2002‐2010
6‐WR 7048700 36°06’21” 94°00’42” 106,707 5.8 0.5 4.7 76 13 2003‐2010
[a] Drainage area (ha) of study site; [b] Land use categories: urban (U), water (W), herbaceous (H), forest (F), pasture (P), with crop and barren less than 1% in all the watersheds; [c] 1‐BC: Ballard Creek on County Road 76 near Summers, AR, 2‐OC: Osage Creek on Snavely Road near Elm Springs, AR, 3‐IR: Illinois River on Highway 59 near Siloam Springs, AR, 4‐KR: Kings River on Highway 143 near Berryville, AR, 5‐WFWR: West Fork of the White River on County Road 195 near Fayetteville, AR, 6‐WR: White River on Highway 45 near Goshen, AR.

09‐400 Annual Report | 4
METHODS Water Quality Data Water quality data were obtained from the Arkansas Water Resources Center (AWRC) in an electronic format (i.e., Excel files). The sampling sites had been monitored long‐term through the ANRC 319 Program and water samples were analyzed by the AWRC Water Quality Lab following approved quality assurance project plans (QAPP). During this previous sampling water samples were collected every other week to monthly during base flow as grab samples or during storm events as discrete storm grab samples and/or composite samples from automated sampling equipment. Constituent concentrations, including sulfate (SO4), chloride (Cl
‐), nitrate‐nitrogen (NO3‐N), total nitrogen (TN), ammonium‐nitrogen (NH4‐N), soluble reactive phosphorus (SRP), total phosphorus (TP), and total suspended solids (TSS) were measured. The event mean constituent concentration data was paired with mean daily discharge that represented the time frame during which samples were collected. When total nitrogen (TN) was not directly measured, it was calculated as the sum of total Kjeldahl nitrogen (TKN) plus nitrate‐nitrogen (NO3‐N). Concentration data were then paired with respective discharge data that was obtained from the US Geological Survey (USGS) or the AWRC. After the data were obtained, databases were organized by date sampled, stage level, instantaneous discharge, water sample lab number, and constituent concentrations and then compiled for each of the six study sites. Finally, the original (i.e., raw (no)) water quality data for each of the six sampled sites within the two watersheds were explored with descriptive statistics (see Appendix B). Next, the original (no) water quality data were collapsed to a single daily value when multiple samples were collected in a day. This produced water quality databases that were more consistent across the study sites and minimized autocorrelation between the data. The daily values were calculated using two simple procedures. First, the event mean discharge (EMQ, cfs) was determined by taking the average of all individual discharges representative of the samples collected. Then, the event mean concentration (EMC, mg/L) for each constituent was calculated by dividing the sum of discharge (Q) times concentration (C) by the sum of discharges in that day. Descriptive statistics were evaluated and summarized (see Appendix B). Transformation of Water Quality Data. The daily (nd) water quality data (i.e., constituent concentration and discharge) were log‐transformed prior to trend analysis. This has become a common practice because stream discharge and concentrations are typically log‐normally distributed (Richards and Baker, 2002), and log‐transformation is suggested when values range across orders of magnitude (Helsel and Hirsch, 1991; Hirsch et al., 1991). Flow‐Adjustment of Water Quality Data. Stream discharge is an exogenous variable that must be accounted for and removed when analyzing trends in water quality data, because constituent concentrations are often a function of discharge (Q); it causes variation in the data that make trend detection more difficult (Helsel and Hirsch, 1991; Hirsch et al., 1991). Constituent concentration data were flow‐adjusted using locally weighted scatterplot smoothing (LOESS) regression (Cleveland, 1979). The LOESS regression was accomplished by using a combination of an add‐on program to Excel, called XLSTAT (Addinsoft, Inc., New York, NY) and SigmaPlot (Systat software Inc., San Jose, CA). Flow‐adjusting the daily (nd) water quality data was completed following the three step process outlined by White et al. (2004) (e.g., see Figure 1). First, a scatter plot of the constituent concentration as a function of time was created for visual inspection (Figure 1a). Next, the log‐transformed concentration

09‐400 Annual Report | 5
data were plotted against log‐transformed discharge (Figure 1b), and then the LOESS two‐dimensional smoothing technique was applied (Richards and Baker, 2002; Hirsh et al., 1991; White et al., 2004). The LOESS regression used a sample proportion of 0.5, which Bekele and McFarland (2004) showed to be effective at flow‐adjusting constituent concentrations. Finally, the LOESS residuals (i.e., flow‐adjusted concentrations, FACs) were used in both parametric and nonparametric trend analyses methods. Figure 1c shows FACs of total phosphorus as a function of time at the Illinois River in Arkansas. Figure 1. Example calculation, 774 daily samples (nd): (a) Total phosphorus concentration from daily water quality samples at Illinois River from 1997‐2010, (b) log‐transformed total phosphorus concentration and log‐transformed discharge with LOESS smoothing, and (c) LOESS residuals (i.e., flow‐adjusted concentrations, FACs) as a function of time. Removal of Outliers. An outlier is an observation that has a value that is quite different from others in the data set, but should not be removed just because it appears unusual (Helsel and Hirsch, 1991). Outliers should be checked for errors that might have occurred while measuring or recording of data and then removed accordingly. In this study, outliers were detected by assuming the FACs (i.e., LOESS residuals) were normalized after the daily (nd) water quality data were log‐transformed and flow‐adjusted. Since the FACs were assumed to be normally distributed, then an upper and lower prediction interval was determined for each individual constituent’s dataset. The 99percent prediction interval was calculated for the FACs using the standard score equation,
z= (x‐µ)/σ (Equation 1) and was solved for the x variable (i.e., FAC value), which represented the upper and lower 99percent prediction value. Then the FAC observations outside of this prediction were removed. After the outliers were removed from the daily (nd) water quality data, the remaining water quality data (n) were run through the three step process again to attain FACs independent of the potential influence from the outliers. Trend Analyses Simple linear regression between the FACs (i.e., LOESS residuals) and time was the parametric method used to examine the long‐term trends in water quality. The Seasonal Kendall Test and Sen Slope estimator were the nonparametric methods used in determining trends. The major advantage of the Seasonal Kendall Test was accounting for seasonality. However, prior to being analyzed by the Seasonal Kendall Test, the water quality data had to be collapsed down to one sample per season, where a season was set as each individual month. The one sample per season (i.e., month) was determined by using the median FAC (i.e., LOESS residual) from the available data in that particular season, when three or more samples existed. If only two samples were in a season, then an average of the values was used. These FACs that represent monthly (nm) water quality data were examined for trends by the Seasonal Kendall
A
Year
97 98 99 00 01 02 03 04 05 06 07 08 09 10 11
Tota
l Pho
spho
rus,
TP
(mg/
L)
0.0
0.5
1.0
1.5
2.0
2.5B
Log (Discharge, Q [cfs])
1.5 2.0 2.5 3.0 3.5 4.0 4.5 5.0
Log
(Tot
al P
hosp
horu
s, T
P [m
g/L]
)
-2.5
-2.0
-1.5
-1.0
-0.5
0.0
0.5
1.0
C
Year
97 98 99 00 01 02 03 04 05 06 07 08 09 10 11
TP F
AC (L
OES
S R
esid
uals
)
-1.5
-1.0
-0.5
0.0
0.5
1.0
1.5

09‐400 Annual Report | 6
Test in XLSTAT. The program provided the Kendall tau (τ) value, which showed if a trend existed and whether it increased (positive) or decreased (negative) over time. Also, WQStat Plus v9 (Sanitas Technologies, Shawnee, KS) was used to estimate the Sen Slope, the magnitude of change in FACs over time. However, the water quality data was log‐transformed prior to trend analysis; therefore, the slope represents a trend that is expressed in log units and can be converted back to the original units. The slope is expressed in percent change per year using the equation,
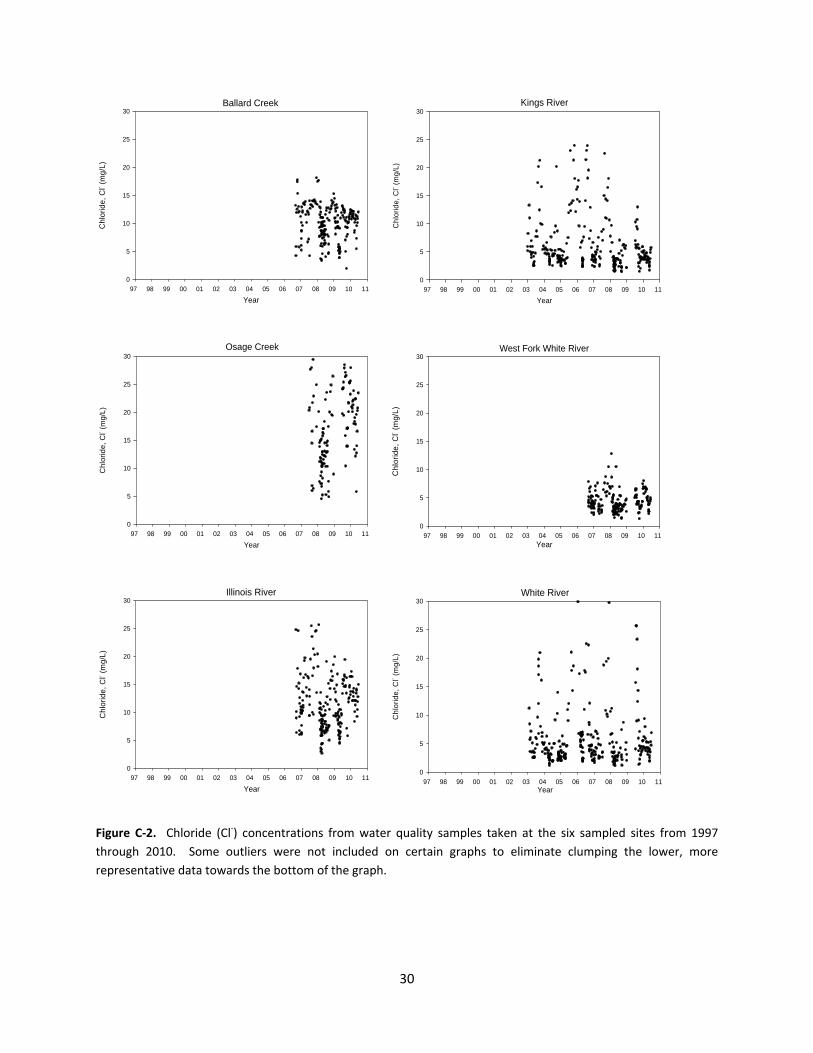
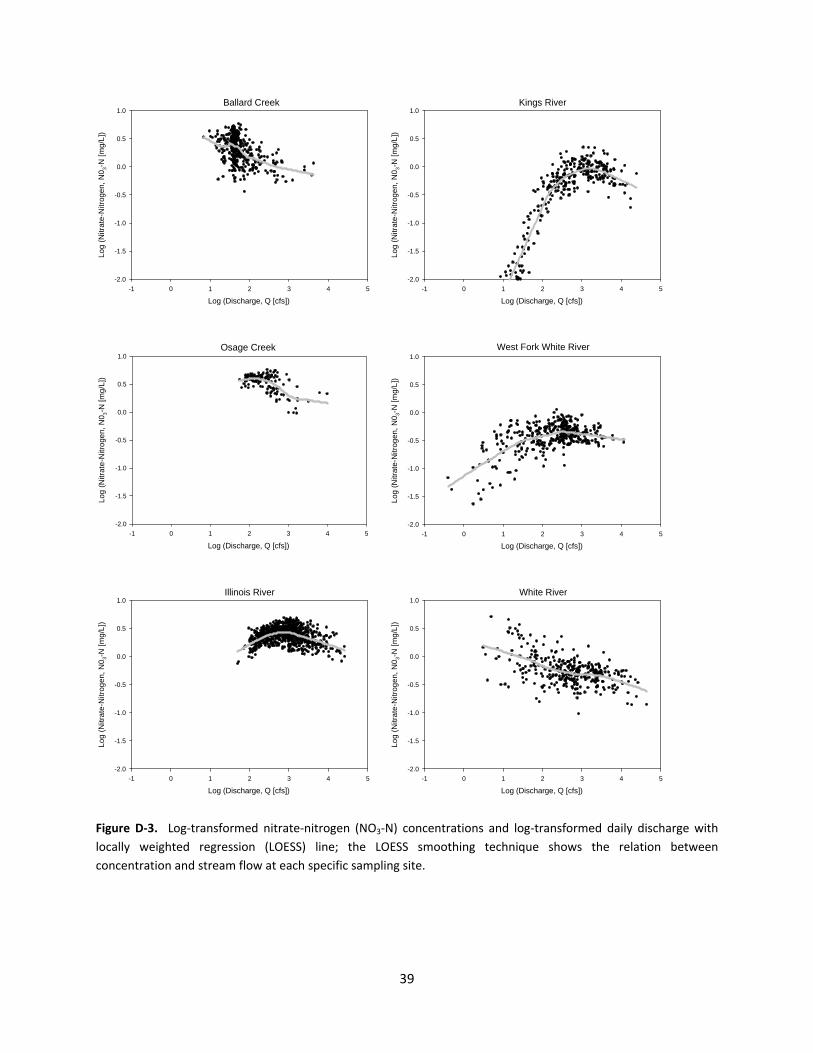
S= (10b1‐1) x 100 (Equation 2) RESULTS Data Considerations Outliers. Outliers were identified and reviewed before being removed from the flow‐adjusted daily (nd) water quality data. The percentage of the removed outliers for the six sites ranged from zero to 3.5 percent for sulfate, 4.2 percent for chloride, 3.2 percent for nitrate‐nitrogen, 3.5 percent for total nitrogen, 1.6 percent for ammonium‐nitrogen, 2.6 percent for soluble reactive phosphorus, 2.8 percent for total phosphorus, and 2.2 percent for total suspended solids. After the outliers were removed, the remaining water quality data (n) were flow‐adjusted again and used in trend analyses. Censored Data. The Arkansas Water Resources Center (AWRC) Water Quality Lab generally reports constituent concentrations as measured, which allows the user to evaluate data below the method detection limit (MDL). The lab provides MDL as well as practical quantitation limits (PQL) for every constituent. Only select parameters, including NH4‐N and SRP, had a small number of censored values reported. Due to the very small number of censored values in these databases, the censored data were excluded from the trend analyses. Flow‐Adjusting The results from flow‐adjusting the water quality data produced graphs that illustrate the complex relationship between stream discharge and constituent concentrations (see Appendix C). The correlation between these two variables demonstrates different kinds of physical phenomena, which include dilution effect (i.e., decreasing), wash‐off effect (i.e., increasing), or combinations of both across the range of discharge (Hirsch et al., 1991). These relationships were examined on a constituent by site basis, focusing on two flow regimes – base flow conditions and surface runoff events. Base Flow Conditions. During base flow conditions, the relationship between concentration and discharge was variable across constituents and study sites. A total of 48 flow‐concentrations were evaluated and approximately 65 showed decreasing concentrations as base flow discharge increased. Overall, SO4 and Cl concentrations decreased with increasing discharge during base flow conditions; except SO4 at Ballard Creek, where it increased. Both, NO3‐N and TN concentrations showed decreasing relationships at Ballard Creek and the White River, and increasing relationships at Osage Creek, Illinois River, Kings River, and West Fork of the White River. Ammonium‐N concentrations decreased with increasing base flow discharge across all sites, except Osage Creek. Soluble reactive P and TP concentrations showed decreasing relationships across all sites, except the relatively constant concentration seen at the West Fork of the White River during base flow conditions. Total SS

09‐400 Annual Report | 7
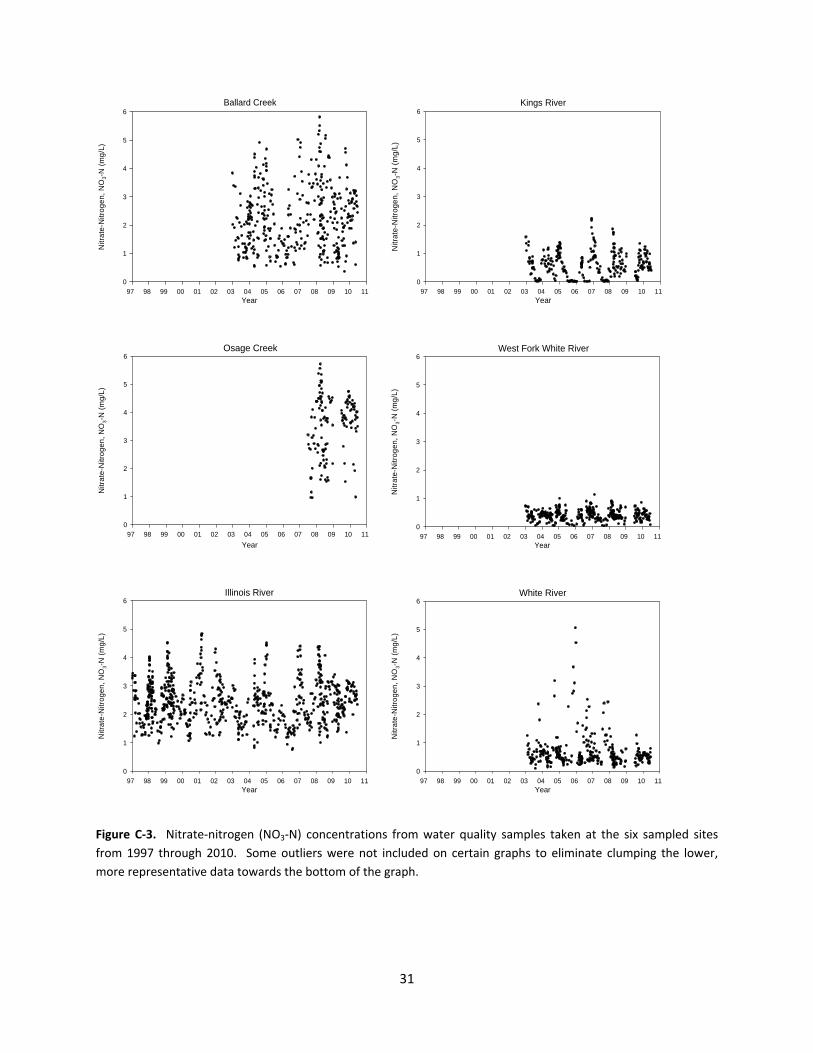
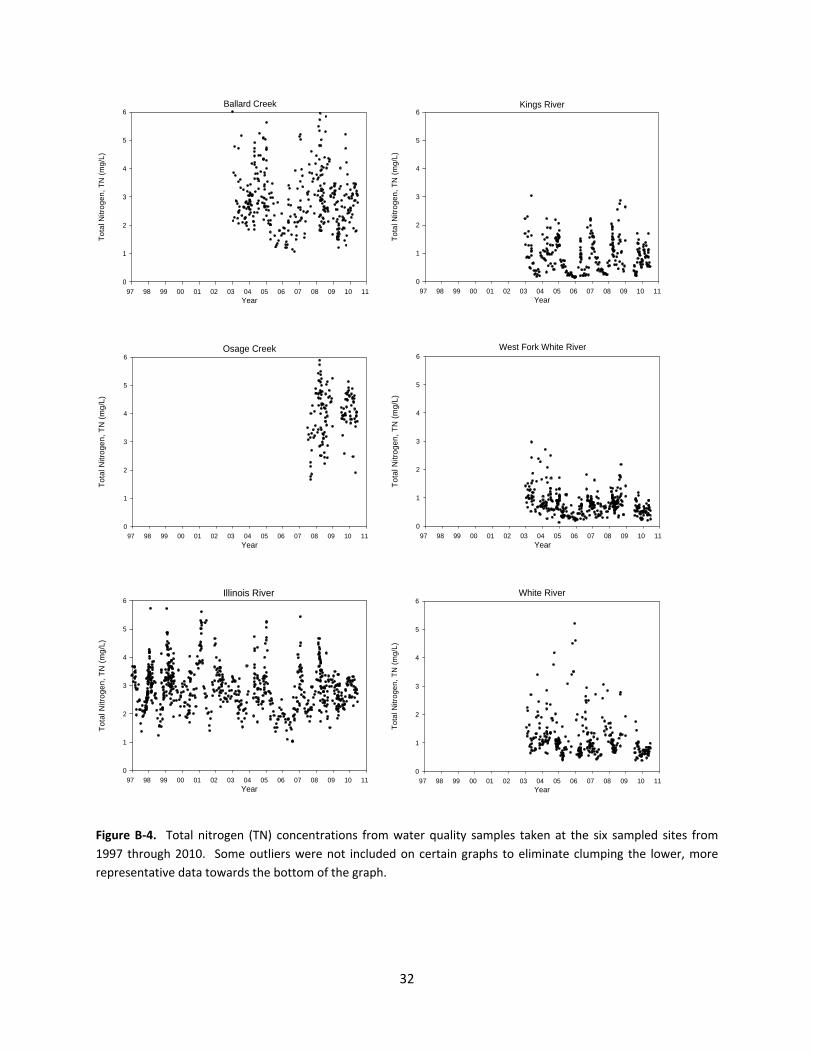
concentrations decreased with increasing base flow discharge at the Kings River; however, all other sites displayed a slight increase in concentration with flow. Surface Runoff Events. The relationship between constituent concentrations and discharge varied during surface runoff events across the study sites, where about half the relationships showed concentrations that were decreasing with increasing flow and the others increased. Overall, SO4, Cl and NO3‐N concentrations decreased with increasing discharge during surface runoff events across all sites. Total N concentrations exhibited decreasing relationships at Ballard Creek, Osage Creek, Illinois River, and the Kings River, while the other two sites displayed increasing relationships during surface runoff events. Ammonium‐N, SRP, TP, and TSS concentrations increased with increasing discharge during surface runoff events across all sites. Flow‐Adjusted Concentration Trends Graphs of the LOESS smoothing technique applied to the log transformed constituent conencetrations as a function of daily discharge and graphs of the LOESS residual (FAC) over time are presented in Appendices D and E, respectively. The results of trend analyses on FACs, representing the daily (n) and monthly (nm) data are presented in Tables 2 and 3. Trends were considered statistically significant if the p‐value was less than 0.05 (p < 0.05). Sulfate. Flow‐adjusted SO4 concentrations did not significantly change over time at Ballard Creek, Osage Creek, and the White River during the study period (Tables 2 and 3, Figure 2). The regression analysis suggested that FACs significantly decreased at rates between ‐2.2 to ‐6.4 percent per year at the Illinois River, Kings River, and the West Fork of the White River over the period of the study based on simple linear regression. The Seasonal Kendall analysis indicated a decreasing trend of ‐6.2 percent per year in the FACs at the Illinois River, but FACs did not significantly change at the other sites (based on Seasonal Kendall). Chloride. Flow‐adjusted Cl‐ concentrations did not show any significant monotonic trends at Osage Creek and the West Fork of the White River during the study period (Tables 2 and 3, Figure 3). The change in FACs ranged from ‐3.0 to ‐4.4 percent per year across Ballard Creek, Illinois River, and the Kings River (based on simple linear regression). In addition, regression analysis indicated an increasing trend in FACs of 2.1 percent per year at the White River. The Seasonal Kendall analysis suggested that FACs decreased (‐6.2% per year) at the Illinois River during the study period. Nitrate‐Nitrogen. Overall, FACs of NO3‐N were not significantly changing over time across these sites, except at Ballard Creek (Tables 2 and 3, Figure 4). Nitrate‐N increased at a rate of 4.1 percent per year over the study period (based on simple linear regression). This NO3‐N trend was not statistically significant based on the Seasonal Kendall analysis. Total Nitrogen. Flow‐adjusted TN concentrations showed no monotonic changes over time at Ballard Creek and Osage Creek during the study period (Tables 2 and 3, Figure 5). Several decreasing trends were observed (based on simple linear regression), ranging from ‐0.8 to ‐5.5 percent per year across the Illinois River, Kings River, West Fork of the White River, and the White River. A significant decreasing trend of ‐6.6 percent per year was also observed at the West Fork of the White River based on the Seasonal Kendall analysis, whereas the nonparametric test did not suggest FACs were changing at any other sites.

09‐400 Annual Report | 8
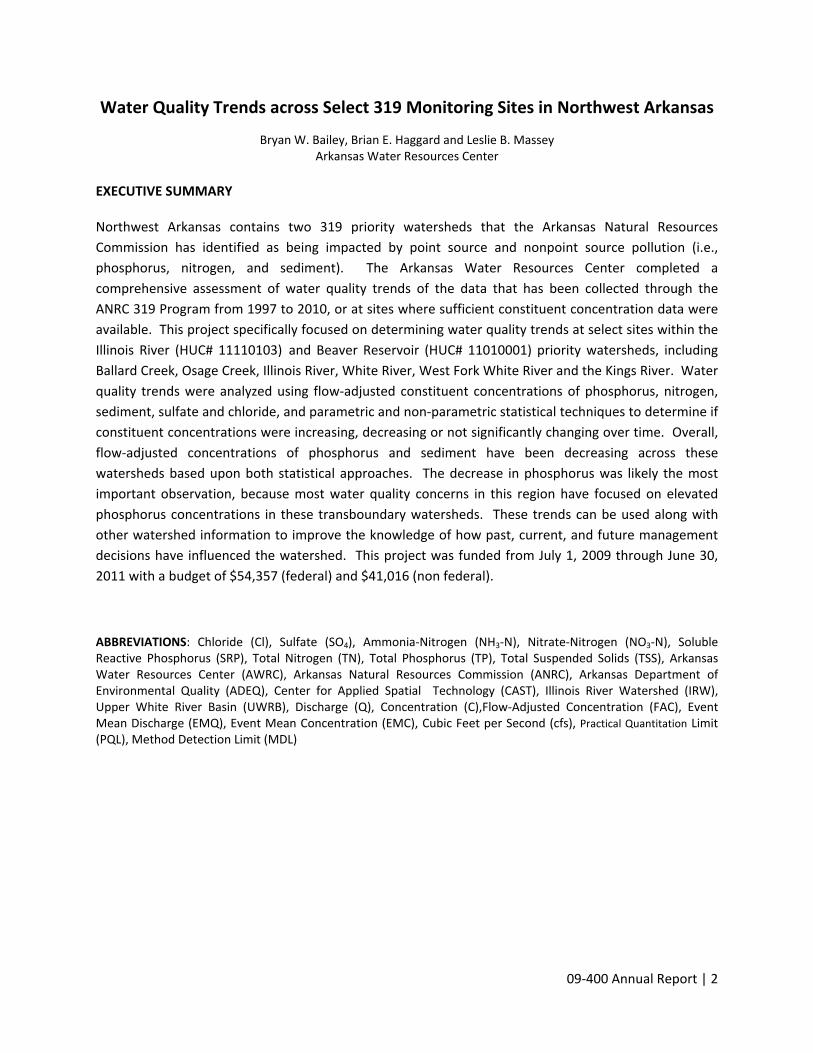
Ammonium‐Nitrogen. Flow‐adjusted NH4‐N concentrations showed no significant changes over time at Osage Creek, Kings River, West Fork of the White River, and the White River during the study period (Tables 2 and 3, Figure 6). However, FACs of NH4‐N showed decreasing trends at Ballard Creek, where the rate of change varied from ‐4.1 percent per year based on regression to ‐7.0 percent per year based on the Seasonal Kendall analysis. Based on simple linear regression analysis, FACs of NH4‐N increased at a rate of 2.9 percent per year at the Illinois River over the study period. Soluble Reactive Phosphorus. Flow‐adjusted SRP concentrations showed decreasing trends across all sites during the study period (Tables 2 and 3, Figure 7). Significant decreasing trends in FACs were observed across these sites (based on simple linear regression) ranging from ‐4.0 to ‐17.5 percent per year during the study period. The Seasonal Kendall analysis suggested that FACs of SRP decreased at rates between ‐5.6 to ‐10.8 percent per year at the Illinois River, Kings River, and the West Fork of the White River. Total Phosphorus. Flow‐adjusted TP concentrations exhibited decreasing trends across all sites during the study period (Tables 2 and 3, Figure 8). The regression analysis suggested that FACs significantly decreased at rates between ‐6.7 to ‐19.9 percent per year across all sites. Based on the Seasonal Kendall analysis, FACs of TP significantly decreased at rates ranging between ‐8.2 to ‐15.9 percent per year across all sites; except at Osage Creek where FACs showed did not change over time (based on Seasonal Kendall). Total Suspended Solids. Flow‐adjusted TSS concentrations indicated decreasing trends across all sites during the study period (Tables 2 and 3, Figure 9). Based on regression analysis, significant decreasing trends were observed across these sites and ranged between ‐2.5 to ‐40.2 percent per year over the period of the study. The change in FACs of TSS ranged from ‐4.4 to ‐20.6 percent per year across Ballard Creek, Illinois River, West Fork of the White River, and the White River (based on Seasonal Kendall). Table 2. Regression statistics from trend analyses of the flow‐adjusted concentrations (FACs) at 319 water quality monitoring sites, northwest Arkansas.

09‐400 Annual Report | 9
Constituent Sampling Site n Outliers R2 p‐value % Change[a]
SO4 Ballard Creek 210 3 0.002 0.522 Osage Creek 138 5 0.011 0.223
Illinois River 225 3 0.125 <0.001 ‐5.3
Kings River 285 5 0.063 <0.001 ‐2.2
West Fork White River 197 2 0.057 0.001 ‐6.4
White River 320 8 0.003 0.341 Cl‐ Ballard Creek 210 3 0.028 0.014 ‐3.3
Osage Creek 137 6 <0.001 0.868
Illinois River 221 6 0.068 <0.001 ‐4.4
Kings River 286 4 0.107 <0.001 ‐3.0
West Fork White River 194 5 0.016 0.075 White River 315 13 0.012 0.052 2.1
NO3‐N Ballard Creek 387 3 0.039 <0.001 4.1 Osage Creek 140 3 0.001 0.703
Illinois River 765 7 0.003 0.155
Kings River 277 9 0.000 0.984
West Fork White River 366 12 0.001 0.667
White River 323 4 0.002 0.402 TN Ballard Creek 384 6 <0.001 0.909
Osage Creek 138 5 0.001 0.782
Illinois River 764 8 0.021 <0.001 ‐0.8
Kings River 286 4 0.028 0.005 ‐2.6
West Fork White River 377 6 0.083 <0.001 ‐5.2 White River 322 6 0.080 <0.001 ‐5.5
NH4‐N Ballard Creek 359 6 0.011 0.040 ‐4.1 Osage Creek 131 0 0.014 0.155
Illinois River 642 10 0.020 <0.001 2.9
Kings River 248 4 0.006 0.208
West Fork White River 337 5 0.001 0.594
White River 307 1 0.001 0.534 SRP Ballard Creek 380 10 0.038 <0.001 ‐5.3
Osage Creek 142 1 0.173 <0.001 ‐17.5
Illinois River 690 15 0.323 <0.001 ‐7.9
Kings River 284 6 0.013 0.052 ‐4.0
West Fork White River 373 6 0.050 <0.001 ‐7.0 White River 319 5 0.068 <0.001 ‐10.5
TP Ballard Creek 383 7 0.097 <0.001 ‐8.7 Osage Creek 139 4 0.133 <0.001 ‐19.9
Illinois River 760 14 0.230 <0.001 ‐6.7
Kings River 286 4 0.068 <0.001 ‐8.1
West Fork White River 375 7 0.102 <0.001 ‐10.9
White River 321 7 0.112 <0.001 ‐11.7 TSS Ballard Creek 387 2 0.185 <0.001 ‐20.2
Osage Creek 141 2 0.122 <0.001 ‐40.2
Illinois River 757 17 0.013 0.001 ‐2.5
Kings River 277 5 0.050 <0.001 ‐8.4
West Fork White River 378 4 0.085 <0.001 ‐13.7 White River 321 7 0.140 <0.001 ‐18.1
[a] The percent change per year, negative and positive values correspond to decreasing and increasing flow‐adjusted constituent concentrations over time, respectively.

09‐400 Annual Report | 10
Table 3. Nonparametric statistics from trend analyses on the seasonal flow‐adjusted concentrations (FACs) at 319 water quality monitoring sites, northwest Arkansas.
Constituent Sampling Site n τ[a] p‐Value S'[b] Sen Slope[c]
SO4 Ballard Creek 46 ‐0.167 0.451 ‐6Osage Creek 30 ‐0.500 0.149 ‐6 Illinois River 46 ‐0.500 0.010 ‐18 ‐6.2 Kings River 82 ‐0.056 0.625 ‐10 West Fork White River 40 0.056 0.880 2
White River 80 ‐0.100 0.357 ‐18 Cl‐ Ballard Creek 46 0.278 0.175 10
Osage Creek 30 ‐0.333 0.386 ‐4 Illinois River 46 ‐0.389 0.050 ‐14 ‐5.5 Kings River 83 ‐0.122 0.255 ‐22 West Fork White River 40 ‐0.278 0.175 ‐10
White River 80 0.100 0.357 18 NO3‐N Ballard Creek 90 0.175 0.164 44
Osage Creek 30 0.333 0.386 4 Illinois River 159 0.081 0.187 76 Kings River 83 ‐0.056 0.625 ‐10 West Fork White River 80 0.033 0.786 6
White River 81 ‐0.078 0.481 ‐14 TN Ballard Creek 89 0.063 0.515 16
Osage Creek 30 0.333 0.386 4 Illinois River 159 ‐0.061 0.324 ‐57 Kings River 83 ‐0.067 0.551 ‐12 West Fork White River 84 ‐0.278 0.003 ‐70 ‐6.6
White River 81 ‐0.111 0.303 ‐20 NH4‐N Ballard Creek 88 ‐0.183 0.051 ‐46 ‐7.0
Osage Creek 28 ‐0.167 0.773 ‐2 Illinois River 135 ‐0.050 0.724 ‐6 Kings River 82 ‐0.111 0.303 ‐20 West Fork White River 83 0.078 0.481 14
White River 80 0.144 0.175 26 SRP Ballard Creek 89 ‐0.103 0.278 ‐26
Osage Creek 30 0.167 0.773 2 Illinois River 142 ‐0.378 < 0.001 ‐68 ‐10.8 Kings River 83 ‐0.400 < 0.001 ‐72 ‐8.5 West Fork White River 84 ‐0.214 0.022 ‐54 ‐5.6
White River 80 ‐0.078 0.481 ‐14 TP Ballard Creek 90 ‐0.238 0.011 ‐60 ‐8.2
Osage Creek 30 0.333 0.386 4 Illinois River 159 ‐0.427 < 0.001 ‐400 ‐9.2 Kings River 84 ‐0.365 < 0.001 ‐92 ‐11.5 West Fork White River 84 ‐0.452 < 0.001 ‐114 ‐15.9
White River 81 ‐0.311 0.003 ‐56 ‐13.4 TSS Ballard Creek 90 ‐0.500 < 0.001 ‐126 ‐20.6
Osage Creek 30 ‐0.333 0.386 ‐4 Illinois River 159 ‐0.135 0.028 ‐126 ‐4.4 Kings River 84 ‐0.119 0.209 ‐30 West Fork White River 83 ‐0.250 0.040 ‐30 ‐16.7
White River 81 ‐0.356 0.001 ‐64 ‐19.4 [a] Seasonal Kendall tau (τ); [b] Seasonal Kendall statistic (S’); [c] Sen’s Slope Estimator; the percent change per year.

09‐400 Annual Report | 11
Figure 2. Flow‐adjusted trends (percent change per year) in sulfate concentrations applying simple linear regression (top) and the Seasonal Kendall Test (bottom).

09‐400 Annual Report | 12
Figure 3. Flow‐adjusted trends (percent change per year) in chloride concentrations applying simple linear regression (top) and the Seasonal Kendall Test (bottom).

09‐400 Annual Report | 13
Figure 4. Flow‐adjusted trends (percent change per year) in nitrate‐nitrogen concentrations applying simple linear regression (top) and the Seasonal Kendall Test (bottom).

09‐400 Annual Report | 14
Figure 5. Flow‐adjusted trends (percent change per year) in total nitrogen concentrations applying simple linear regression (top) and the Seasonal Kendall Test (bottom).

09‐400 Annual Report | 15
Figure 6. Flow‐adjusted trends (percent change per year) in ammonium‐nitrogen concentrations applying simple linear regression (top) and the Seasonal Kendall Test (bottom).

09‐400 Annual Report | 16
Figure 7. Flow‐adjusted trends (percent change per year) in soluble reactive phosphorus (SRP) concentrations applying simple linear regression (top) and the Seasonal Kendall Test (bottom).

09‐400 Annual Report | 17
Figure 8. Flow‐adjusted trends (percent change per year) in total phosphorus concentrations applying simple linear regression (top) and the Seasonal Kendall Test (bottom).
09‐400 Annual Report | 18
Figure 9. Flow‐adjusted trends (percent change per year) in total suspended solids concentrations applying simple linear regression (top) and the Seasonal Kendall Test (bottom).

09‐400 Annual Report | 19
LESSONS LEARNED This project was originally funded from 01 July 2009 to 30 June 2010; however, ANRC granted AWRC a one year, no cost extension from 30 June 2010 to 30 June 2011. The AWRC requested this extension, because this project is the first comprehensive evaluation of water quality trends using available data from the ANRC 319 Program and appropriate statistical techniques. With a one year extension, AWRC was able to include water quality data collected during calendar year 2009. The inclusion of this additional year of data strengthened our statistical analysis, and made AWRC more confident in the ability to detect water quality trends. The inclusion of the 2009 data underscored the importance of looking at flow‐adjusted trends and not just calendar year loads to understand how water quality is changing over time. The observed loads during 2009 were higher than loads previously observed from 2005 to 2007; however, the annual variation in nutrient and sediment loads closely follows the pattern of annual discharge. The more precipitation during a given year, the greater the annual load, and the annual precipitation in 2009 was almost double that observed annually from 2005 to 2007. Therefore, evaluating change in water quality is not a simple as determining if loads have increased or decreased over time. Because of this correlation between loads and discharge, identifying changes in constituent loading following implementation of best management practices and or introduction of new point and nonpoint sources can be difficult, and flow adjusting loads is necessary to identify real trends in water quality. TECHNICAL TRANSFER This project was the first to look at long term water quality trends in the IRW and UWRB. The results of this study are beneficial to state agencies including ANRC and Arkansas Department of Environmental Quality as well as Beaver Water District, local industries, and watershed stakeholders, e.g., the Illinois River Watershed Partnership, Beaver Lake Watershed Alliance, and the Upper White River Basin Foundation. The results of this study are also of value to other managers of transboundary watersheds. The results of this study have been disseminated to scientists, water managers and the public in the following ways: Haggard, B.E. and B.W. Bailey. 2010. Water Quality Trends across 319 Monitoring Sites. Arkansas Natural
Resources Commission Project Review and Stakeholder Meeting. September 20‐22, 2010, Little Rock, Arkansas.
Bailey, B.W., B.E Haggard, L.B. Massey, and L.W. Cash. 2011. Water Quality Trends in Northwest Arkansas, 1997‐
2009. American Ecological Engineering Society Annual Meeting, Asheville, NC, May 23‐25, 2011. Poster Presentation.
Bailey, B.W., B.E Haggard, L.B. Massey, and L.W. Cash. 2011. Water Quality Trends in Northwest Arkansas, 1997‐
2009. SERA‐17 Annual Meeting, Delray Beach, FL, June 20‐23, 2011. Poster Presentation. Haggard, B.E. 2011. State of Water Quality in the Illinois River Watershed‐Phosphorus Concentrations, Loads and
Trends. 2011. Arkansas Water Resources Center Annual Meeting, Fayetteville, AR, July 6‐7, 2011. Bailey, B.W. 2011 anticipated. Water Quality Trends for 319 Priority Watersheds in Northwest Arkansas, 1997‐
2010. Master’s Thesis. University of Arkansas, Fayetteville Arkansas.

09‐400 Annual Report | 20
In addition, the results of this study will be published in a peer‐reviewed scientific journal, and two peer‐reviewed publications that were complementary to this project have already been published including: Haggard, B.E. 2010. Phosphorus Concentrations, Loads and Sources within the Illinois River Drainage Area,
Northwest Arkansas, 1997‐2008. Journal of Environmental Quality 39(6):2113‐2120. Scott, J.T., B.E. Haggard, A.N. Sharpley, J.J. Romeis. 2011. Change Point Analysis of Phosphorus Trends in the Illinois
River (Oklahoma) Demonstrates the Effects of Watershed Management. Journal of Environmental Quality 40(4):1249‐1256.
The AWRC will also publish the results of this study as a technical publication in the AWRC library which is used by a variety of groups including researchers, regulators, planners, lawyers and citizens. This technical report will be publically available at http://www.uark.edu/depts/awrc/pubs‐MSC.htm. EPA FEEDBACK LOOP Over the past decade monitoring projects like the ones that contributed data to this study made up more than 30 percent of the ANRC 319 funding budget. Monitoring projects like these are important, because consistent water quality monitoring is the best way to evaluate the effectiveness of implemented BMPs, and to determine if water quality in priority watersheds is changing over time. And while funding for monitoring projects may be reduced in the future due to tightening federal budgets, it is important to have an established program that consistently collects water quality data each year so that long term trends can be identified. Partnerships with other federal agencies would lessen the financial strain on state programs, and these agencies would likely gain valuable information from watershed management decisions that could be applied to other transboundary and priority watersheds. CONCLUSIONS AND OUTCOMES This project has successfully evaluated trends in water quality at six sites in the priority watersheds of the IRW and UWRB in northwest Arkansas. Overall, the nonparametric (i.e., Seasonal Kendall Test and Sen Slope Estimator) method agreed well with the parametric (i.e., linear regression) method for identifying trends in water quality data except for in the case of small datasets. All of the selected sites in both priority watersheds exhibited significant decreasing trends in SRP and TP, and decreasing trends in TSS were also evident across these watersheds. The decrease in phosphorus was likely the most important observation, because most water quality concerns in this region have focused on elevated phosphorus concentrations in these transboundary watersheds. These trends can be used along with other watershed information to improve the knowledge of how past, current, and future management decisions have influenced the watershed. Over the past decade, the ANRC 319 Program has invested nearly $4,149,900 in demonstration and implementation projects including low impact development, poultry litter feasibility, stream restoration, erosion and nutrient management plan development, and streambank stabilization. The decreasing trends in phosphorus and sediment suggest that there have been watershed management changes or restoration activities which have influenced water quality (especially FACs of phosphorus and sediment). The regional WWTPs have worked hard and invested $180,000,000 into municipal facility upgrades and legislation within the State of Arkansas has been enacted (i.e., Titles 19, 20, 21 and 22) which were
09‐400 Annual Report | 21
intended at improving environmental quality in nutrient surplus watersheds. All of these efforts combined with the investment and activities of the 319 Program have no doubt influenced water quality. While one cannot differentiate the proportion of improvement between these efforts, it is more important that phosphorus and sediment have been decreasing in these priority, transboundary watersheds. Furthermore, ANRC has funded a comprehensive monitoring program in the IRW and UWRB, for the next four years (July 2011 through June 2015). Annual loads will continue to be estimated at the selected sites and others and will contribute to the historical water quality databases for these watersheds which can be used to re‐evaluate trends in water quality over time. This project will complete a five year database at 19 sites in northwest Arkansas, which will allow trends to be estimated showing possible, continued improvement in water quality from the various 319 projects, or other watershed management changes that result from state and federal programs. REFERENCES CAST, 2006. Arkansas Watershed Information System: a module of the Arkansas Automated Reporting and
Mapping System. http://watersheds.cast.uark.edu/ accessed 14 July 2011. Bekele, A., and A. McFarland. 2004. Regression‐based flow adjustment procedures for trend analyses of water
quality data. Trans. American Soc. of Agric Eng 47:1093‐1104. Cleveland, M.S. 1979. Robust locally weighted regression and smoothing scatterplots. J. American Stat. Assoc.
74(368):829‐836. Helsel, D.R. and R.M. Hirsch. 1991. Statistical methods for water resources, Chapter A3, techniques of water –
Resources Investigations of the United States Geological Survey, Book 4, Hydrologic Analysis and Interpretation, Available at: http://water.usgs.gov/pubs/twri/twri4a3/. Accessed 10 October 2010.
Richards, R.P., and D.B. Baker. 2002. Trends in water quality in LEASEQ rivers and streams (Northwestern Ohio),
1975‐1995. J. Environ. Quality 31(1):90‐96. White, K.I., B.E. Haggard, and I. Chaubey. 2004. Water quality at the Buffalo National River, Arkansas, 1991‐2001.
Trans. ASAE 47:407‐417.

09‐400 Annual Report | 22
APPENDIX A: The Illinois River Watershed (top) and the Upper White River Basin (bottom) with the location of the six selected sampling sites in northwest Arkansas. Refer to Table 1 for complete site descriptions.

09‐400 Annual Report | 23
APPENDIX B: Descriptive Statistics of Water Quality Data Table B‐1: Descriptive statistics of stream discharge and constituent concentrations in water quality samples collected at Ballard Creek, 2000‐2010.
[a] no, original (i.e., raw) data; [b] nd, daily (i.e., flow‐weighted) data; [c] n, data (i.e., after extreme outliers were removed from a 99 % P.I. of FACs nd data); [d] nm, monthly (i.e., seasonally) data.
BC Variable n Mean Median Range Min Max STD
no [a] Q (cfs) 508 133 49 4258 7 4265 376
SO4 (mg/L) 237 14.33 14.16 23.54 3.95 27.49 4.50 Cl (mg/L) 237 9.82 10.18 16.15 1.92 18.07 3.22 NO3‐N (mg/L) 508 1.99 1.76 5.80 0.01 5.81 1.14 TN (mg/L) 508 2.86 2.67 8.43 0.72 9.15 1.06 NH4‐N (mg/L) 483 0.12 0.07 1.62 0.001 1.62 0.16 SRP (mg/L) 508 0.21 0.15 1.68 0.005 1.69 0.20 TP (mg/L) 508 0.42 0.27 3.18 0.008 3.19 0.45 TSS (mg/L) 508 71 18 1612 < 1 1612 157
nd [b] Q 390 116 45 4258 7 4265 356
SO4 213 14.59 14.33 23.54 3.95 27.49 4.44 Cl 213 10.05 10.36 16.15 1.92 18.07 3.13 NO3‐N 390 2.25 2.14 5.80 0.009 5.81 1.14 TN 390 2.91 2.79 5.28 0.72 6.00 1.01 NH4‐N 365 0.11 0.06 1.62 0.001 1.62 0.16 SRP 390 0.19 0.11 1.10 0.005 1.10 0.19 TP 390 0.36 0.18 3.18 0.008 3.19 0.44 TSS 389 55 10 834 < 1 835 121
n [c] Q 390 116 45 4258 7 4265 356 SO4 210 14.56 14.31 23.54 3.95 27.49 4.36 Cl 210 10.03 10.34 16.15 1.92 18.07 3.09 NO3‐N 387 2.27 2.17 5.45 0.36 5.81 1.12 TN 384 2.93 2.80 4.94 1.06 6.00 0.98 NH4‐N 359 0.10 0.06 0.81 0.004 0.81 0.12 SRP 380 0.18 0.11 0.98 0.009 0.98 0.18 TP 383 0.36 0.18 3.17 0.02 3.19 0.43 TSS 387 55 10 834 < 1 835 121
nm [d] Q 90 47 41 146 7 153 25
SO4 46 15.38 14.72 15.74 8.95 24.69 3.51 Cl 46 11.16 11.26 11.08 5.24 16.32 2.37 NO3‐N 90 2.23 2.31 4.46 0.55 5.01 0.88 TN 89 2.81 2.86 3.32 1.14 4.46 0.73 NH4‐N 88 0.09 0.06 0.38 0.01 0.39 0.07 SRP 89 0.13 0.10 0.55 0.01 0.56 0.11 TP 90 0.23 0.17 0.79 0.03 0.82 0.18 TSS 90 22 9 200 < 1 201 34

09‐400 Annual Report | 24
Table B‐2: Descriptive statistics of stream discharge and constituent concentrations in water quality samples collected at Osage Creek, 2007‐2010.
OC Variable n Mean Median Range Min Max STD
no [a] Q (cfs) 170 693 289 14865 57 14922 1599
SO4 (mg/L) 170 17.98 16.44 39.02 5.06 44.09 8.09
Cl (mg/L) 170 16.91 15.75 39.15 3.39 42.53 8.36
NO3‐N (mg/L) 170 3.40 3.71 4.90 0.82 5.72 1.19
TN (mg/L) 170 3.81 3.93 4.59 1.57 6.16 1.01
NH4‐N (mg/L) 152 0.06 0.03 0.48 0.01 0.49 0.08
SRP (mg/L) 170 0.10 0.10 0.20 0.03 0.23 0.04
TP (mg/L) 170 0.26 0.14 2.48 0.04 2.52 0.33
TSS (mg/L) 170 118 13 1970 < 1 1970 256
nd [b] Q 143 490 230 9828 57 9886 1056
SO4 143 18.59 17.18 35.16 5.34 40.50 7.53 Cl 143 17.74 17.12 34.16 4.34 38.50 7.83 NO3‐N 143 3.50 3.78 4.90 0.82 5.72 1.12 TN 143 3.90 4.00 4.23 1.65 5.88 0.92 NH4‐N 131 0.05 0.03 0.42 0.01 0.43 0.07 SRP 143 0.09 0.09 0.18 0.03 0.20 0.04 TP 143 0.24 0.14 1.69 0.04 1.74 0.28 TSS 143 108 11 1970 < 1 1970 251
n [c] Q 143 490 230 9828 57 9886 1056 SO4 138 18.81 17.77 34.12 6.38 40.50 7.29 Cl 137 17.95 17.14 34.03 4.47 38.50 7.62 NO3‐N 140 3.55 3.80 4.77 0.95 5.72 1.07 TN 138 3.95 4.04 4.23 1.65 5.88 0.88 NH4‐N 131 0.05 0.03 0.42 0.01 0.43 0.07 SRP 142 0.09 0.09 0.18 0.03 0.20 0.04 TP 139 0.22 0.13 1.69 0.04 1.74 0.27 TSS 141 91 11 1065 < 1 1065 192
nm [d] Q 30 236 161 573 80 652 161
SO4 30 20.89 19.98 28.90 8.62 37.52 6.95 Cl 30 20.18 19.98 29.06 6.71 35.77 6.83 NO3‐N 30 3.61 3.84 3.17 1.65 4.83 0.79 TN 30 3.98 4.01 2.96 2.19 5.15 0.64 NH4‐N 28 0.04 0.03 0.11 0.01 0.12 0.03 SRP 30 0.09 0.10 0.12 0.03 0.15 0.03 TP 30 0.16 0.12 0.44 0.05 0.48 0.10 TSS 30 45 6 503 < 1 503 98
[a] no, original (i.e., raw) data; [b] nd, daily (i.e., flow‐weighted) data; [c] n, data (i.e., after extreme outliers were removed from a 99 % P.I. of FACs nd data) ; [d] nm, monthly (i.e., seasonally) data.

09‐400 Annual Report | 25
Table B‐3: Descriptive statistics of stream discharge and constituent concentrations in water quality samples collected at Illinois River, 1997‐2010.
IR Variable n Mean Median Range Min Max STD
no [a] Q (cfs) 1751 2644 1326 32238 50 32288 3841
SO4 (mg/L) 281 12.73 12.27 25.60 4.91 30.51 3.70
Cl (mg/L) 280 10.59 9.83 23.27 2.32 25.60 4.65
NO3‐N (mg/L) 1749 2.33 2.26 5.73 0.18 5.91 0.75
TN (mg/L) 1751 3.05 2.96 10.10 0.37 10.48 0.86
NH4‐N (mg/L) 1611 0.07 0.04 0.57 0.0002 0.57 0.08
SRP (mg/L) 1672 0.17 0.16 0.96 0.005 0.96 0.10
TP (mg/L) 1751 0.41 0.27 4.62 0.01 4.63 0.42
TSS (mg/L) 1751 129 45 3550 < 1 3550 229
nd [b] Q 774 1660 865 26391 50 26441 2811
SO4 228 13.23 12.90 25.28 5.23 30.51 3.67
Cl 227 11.37 10.46 22.93 2.67 25.60 4.66
NO3‐N 772 2.46 2.40 5.34 0.57 5.91 0.79
TN 774 2.95 2.92 5.84 0.37 6.21 0.81
NH4‐N 652 0.06 0.04 0.49 0.001 0.49 0.07
SRP 705 0.15 0.13 0.62 0.005 0.62 0.09
TP 774 0.30 0.20 3.06 0.01 3.07 0.30
TSS 774 73 18 2277 < 1 2277 153
n [c] Q 774 1660 865 26391 50 26441 2811
SO4 225 13.12 12.90 18.73 5.23 23.96 3.46
Cl 221 11.31 10.42 22.93 2.67 25.60 4.66
NO3‐N 765 2.47 2.41 4.09 0.75 4.84 0.77
TN 766 2.95 2.93 5.35 0.37 5.72 0.79
NH4‐N 642 0.06 0.04 0.49 0.004 0.49 0.07
SRP 690 0.15 0.13 0.60 0.02 0.62 0.09
TP 760 0.29 0.20 1.69 0.03 1.72 0.26
TSS 757 67 17 958 < 1 959 124
nm [d] Q 159 729 477 3410 75 3485 649
SO4 46 14.43 14.27 13.53 9.24 22.77 3.09
Cl 46 13.18 12.86 19.10 6.31 25.40 4.47
NO3‐N 159 2.34 2.34 3.15 1.07 4.22 0.64
TN 159 2.73 2.70 3.23 1.45 4.68 0.65
NH4‐N 135 0.05 0.04 0.43 0.01 0.44 0.05
SRP 142 0.15 0.12 0.45 0.03 0.48 0.09
TP 159 0.22 0.20 0.66 0.03 0.69 0.12
TSS 159 27 12 213 < 1 214 36 [a] no, original (i.e., raw) data; [b] nd, daily (i.e., flow‐weighted) data; [c] n, data (i.e., after extreme outliers were removed from a 99 % P.I. of FACs nd data); [d] nm, monthly (i.e., seasonally) data.
09‐400 Annual Report | 26
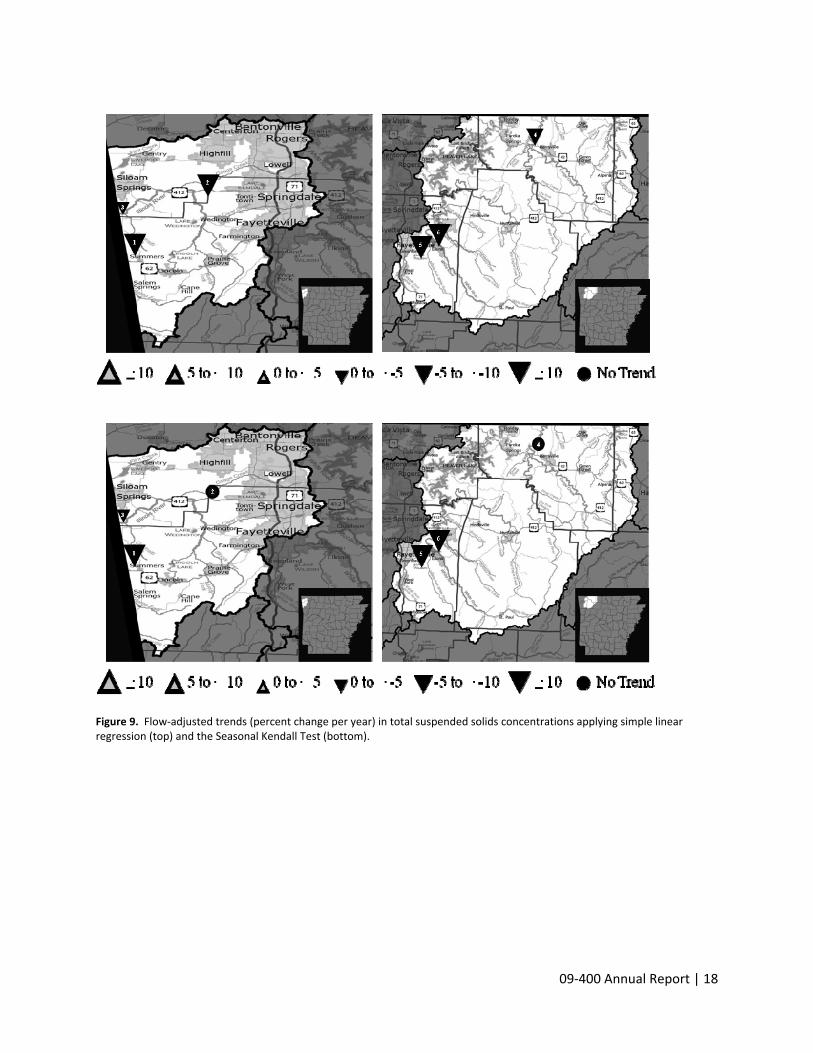
Table B‐4: Descriptive statistics of stream discharge and constituent concentrations in water quality samples collected at Kings River, 2001‐2010.
KR Variable n Mean Median Range Min Max STD
no [a] Q (cfs) 337 2344 687 28690 9 28698 4031
SO4 (mg/L) 337 7.15 5.91 33.17 0.05 33.22 4.02 Cl (mg/L) 337 5.78 3.94 30.53 0.50 31.03 4.76 NO3‐N (mg/L) 332 0.68 0.64 4.10 0.003 4.10 0.51 TN (mg/L) 337 1.04 1.00 4.00 0.06 4.06 0.62 NH4‐N (mg/L) 294 0.06 0.03 0.42 0.001 0.42 0.07 SRP (mg/L) 337 0.06 0.03 0.49 0.001 0.49 0.06 TP (mg/L) 337 0.20 0.10 2.04 0.006 2.05 0.28 TSS (mg/L) 336 101 9 1589 < 1 1589 228
nd [b] Q 291 1739 509 24491 9 24500 3175
SO4 291 7.52 6.17 33.17 0.05 33.22 4.18 Cl 291 6.21 4.27 30.53 0.50 31.03 4.94 NO3‐N 287 0.65 0.63 4.10 0.004 4.10 0.50 TN 291 0.97 0.92 2.97 0.06 3.03 0.58 NH4‐N 253 0.05 0.03 0.42 0.001 0.42 0.06 SRP 291 0.06 0.04 0.49 0.001 0.49 0.06 TP 291 0.16 0.09 1.37 0.006 1.38 0.20 TSS 290 66 7 1140 < 1 1140 149
n [c] Q 290 1742 502 24491 9 24500 3180 SO4 285 7.29 6.13 19.72 2.41 22.13 3.57 Cl 286 6.11 4.25 22.55 1.37 23.93 4.73 NO3‐N 277 0.66 0.63 2.22 0.006 2.22 0.45 TN 286 0.98 0.94 2.91 0.12 3.03 0.58 NH4‐N 248 0.05 0.03 0.38 0.003 0.38 0.05 SRP 284 0.06 0.04 0.49 0.004 0.49 0.06 TP 286 0.15 0.08 1.37 0.01 1.38 0.19 TSS 284 64 6 1140 < 1 1140 147
nm [d] Q 84 700 328 4503 12 4515 977
SO4 82 8.48 6.61 16.32 3.74 20.06 4.01 Cl 83 7.51 5.09 19.13 2.20 21.33 5.14 NO3‐N 83 0.53 0.53 2.15 0.007 2.15 0.42 TN 83 0.79 0.72 2.02 0.14 2.16 0.46 NH4‐N 82 0.04 0.03 0.13 0.004 0.14 0.03 SRP 83 0.06 0.04 0.26 0.006 0.27 0.05 TP 84 0.10 0.09 0.32 0.02 0.34 0.07 TSS 84 17 5 165 < 1 166 33
[a] no, original (i.e., raw) data; [b] nd, daily (i.e., flow‐weighted) data; [c] n, data (i.e., after extreme outliers were removed from a 99 % P.I. of FACs nd data); [d] nm, monthly (i.e., seasonally) data.

09‐400 Annual Report | 27
Table B‐5: Descriptive statistics of stream discharge and constituent concentrations in water quality samples collected at West Fork White River, 2002‐2010.
WFWR Variable n Mean Median Range Min Max STD
no [a] Q (cfs) 468 592 325 11782 < 1 11782 1129
SO4 (mg/L) 219 21.82 20.18 51.69 4.49 56.18 10.16
Cl (mg/L) 219 4.38 3.89 12.21 1.17 13.38 2.08
NO3‐N (mg/L) 464 0.43 0.42 2.66 0.01 2.67 0.22
TN (mg/L) 468 0.87 0.79 2.94 0.13 3.06 0.46
NH4‐N (mg/L) 425 0.09 0.05 0.76 0.002 0.76 0.11
SRP (mg/L) 463 0.02 0.01 1.97 0.001 1.97 0.09
TP (mg/L) 468 0.20 0.10 1.24 0.001 1.24 0.23
TSS (mg/L) 468 98 33 1098 1 1099 145
nd [b] Q 382 536 254 11782 < 1 11782 1131
SO4 199 22.22 20.34 50.75 5.43 56.18 10.24 Cl 199 4.44 3.92 12.14 1.24 13.38 2.10 NO3‐N 378 0.41 0.39 2.66 0.01 2.67 0.22 TN 382 0.80 0.73 2.84 0.13 2.96 0.43 NH4‐N 343 0.09 0.05 0.76 0.002 0.76 0.11 SRP 379 0.02 0.01 1.97 0.001 1.97 0.10 TP 382 0.18 0.08 1.24 0.001 1.24 0.23 TSS 382 90 23 720 1 721 138
n [c] Q 382 536 254 11782 < 1 11782 1131 SO4 197 22.12 20.34 48.71 5.43 54.14 9.95 Cl 194 4.26 3.86 11.52 1.24 12.76 1.79 NO3‐N 366 0.41 0.39 1.11 0.02 1.13 0.18 TN 377 0.79 0.73 2.84 0.13 2.96 0.41 NH4‐N 337 0.09 0.05 0.68 0.004 0.68 0.11 SRP 373 0.01 0.01 0.09 0.001 0.09 0.01 TP 375 0.18 0.08 1.23 0.01 1.24 0.23 TSS 378 87 23 720 1 721 134
nm [d] Q 84 212 153 792 < 1 792 210
SO4 40 24.99 22.46 38.47 10.61 49.08 9.40 Cl 40 4.71 4.22 5.08 2.71 7.79 1.49 NO3‐N 80 0.35 0.36 0.78 0.03 0.81 0.16 TN 84 0.71 0.66 1.49 0.21 1.70 0.30 NH4‐N 83 0.06 0.04 0.26 0.008 0.27 0.05 SRP 84 0.02 0.01 0.08 0.001 0.08 0.01 TP 84 0.11 0.07 0.46 0.01 0.47 0.10 TSS 83 44 22 266 2 268 57
[a] no, original (i.e., raw) data; [b] nd, daily (i.e., flow‐weighted) data; [c] n, data (i.e., after extreme outliers were removed from a 99 % P.I. of FACs nd data); [d] nm, monthly (i.e., seasonally) data.

09‐400 Annual Report | 28
Table B‐6: Descriptive statistics of stream discharge and constituent concentrations in water quality samples collected at White River, 2001‐2010.
WR Variable n Mean Median Range Min Max STD
no [a] Q (cfs) 683 3797 799 50197 3 50200 8033
SO4 (mg/L) 683 15.08 11.03 87.73 1.52 89.25 12.67
Cl (mg/L) 683 6.44 3.43 74.40 0.84 75.24 8.97
NO3‐N (mg/L) 678 0.58 0.48 5.05 0.001 5.05 0.53
TN (mg/L) 683 1.25 0.99 6.89 0.13 7.01 0.80
NH4‐N (mg/L) 578 0.12 0.07 0.67 0.001 0.67 0.13
SRP (mg/L) 679 0.04 0.02 1.04 0.001 1.04 0.09
TP (mg/L) 683 0.35 0.17 5.33 0.001 5.33 0.48
TSS (mg/L) 683 214 69 3405 2 3407 320
nd [b] Q 328 1886 512 44360 3 44363 4299
SO4 328 15.99 11.59 85.62 3.63 89.25 13.46
Cl 328 7.84 4.05 74.15 1.09 75.24 11.37
NO3‐N 327 0.68 0.53 5.05 0.001 5.05 0.61
TN 328 1.15 0.93 5.08 0.13 5.20 0.75
NH4‐N 308 0.10 0.06 0.59 0.001 0.59 0.10
SRP 324 0.02 0.01 0.17 0.001 0.17 0.02
TP 328 0.23 0.11 2.30 0.008 2.31 0.30
TSS 328 128 34 1434 2 1436 223
n [c] Q 328 1886 512 44360 3 44363 4299 SO4 320 15.26 11.58 85.62 3.63 89.25 11.94 Cl 315 7.00 3.99 69.00 1.09 70.08 9.22 NO3‐N 323 0.69 0.53 4.96 0.10 5.05 0.61 TN 322 1.15 0.94 4.82 0.38 5.20 0.72 NH4‐N 307 0.10 0.06 0.59 0.003 0.59 0.10 SRP 319 0.02 0.01 0.11 0.001 0.11 0.01 TP 321 0.21 0.11 2.29 0.02 2.31 0.27 TSS 321 114 33 1434 2 1436 203
nm [d] Q 81 753 359 8567 4 8571 1216
SO4 80 18.68 13.65 74.10 5.62 79.72 14.26 Cl 80 9.80 5.09 52.50 1.97 54.47 11.37 NO3‐N 81 0.81 0.57 4.77 0.28 5.05 0.75 TN 81 1.27 1.02 4.68 0.52 5.20 0.81 NH4‐N 80 0.07 0.05 0.25 0.01 0.25 0.05 SRP 80 0.01 0.01 0.11 0.001 0.11 0.01 TP 81 0.14 0.09 0.60 0.02 0.62 0.12 TSS 81 52 28 384 2 387 68
[a] no, original (i.e., raw) data; [b] nd, daily (i.e., flow‐weighted) data; [c] n, data (i.e., after extreme outliers were removed from a 99 % P.I. of FACs nd data); [d] nm, monthly (i.e., seasonally) data.

29
APPENDIX C: Constituent Concentration as a Function of Time
Ballard Creek
Year97 98 99 00 01 02 03 04 05 06 07 08 09 10 11
Sul
fate
, SO
4 (m
g/L)
0
10
20
30
40
Osage Creek
Year97 98 99 00 01 02 03 04 05 06 07 08 09 10 11
Sul
fate
, SO
4 (m
g/L)
0
10
20
30
40
Illinois River
Year97 98 99 00 01 02 03 04 05 06 07 08 09 10 11
Sulfa
te, S
O4 (
mg/
L)
0
10
20
30
40
Kings River
Year97 98 99 00 01 02 03 04 05 06 07 08 09 10 11
Sul
fate
, SO
4 (m
g/L)
0
10
20
30
40
West Fork White River
Year97 98 99 00 01 02 03 04 05 06 07 08 09 10 11
Sulfa
te, S
O4 (
mg/
L)
0
10
20
30
40
White River
Year97 98 99 00 01 02 03 04 05 06 07 08 09 10 11
Sul
fate
, SO
4 (m
g/L)
0
10
20
30
40
Figure C‐1. Sulfate (SO4) concentrations from water quality samples taken at the six sampled sites from 1997 through 2010. Some outliers were not included on certain graphs to eliminate clumping the lower, more representative data towards the bottom of the graph.
30
Ballard Creek
Year97 98 99 00 01 02 03 04 05 06 07 08 09 10 11
Chl
orid
e, C
l- (mg/
L)
0
5
10
15
20
25
30
Osage Creek
Year97 98 99 00 01 02 03 04 05 06 07 08 09 10 11
Chl
orid
e, C
l- (mg/
L)
0
5
10
15
20
25
30
Illinois River
Year97 98 99 00 01 02 03 04 05 06 07 08 09 10 11
Chl
orid
e, C
l- (mg/
L)
0
5
10
15
20
25
30
Kings River
Year97 98 99 00 01 02 03 04 05 06 07 08 09 10 11
Chl
orid
e, C
l- (mg/
L)
0
5
10
15
20
25
30
West Fork White River
Year97 98 99 00 01 02 03 04 05 06 07 08 09 10 11
Chl
orid
e, C
l- (mg/
L)
0
5
10
15
20
25
30
White River
Year97 98 99 00 01 02 03 04 05 06 07 08 09 10 11
Chl
orid
e, C
l- (mg/
L)
0
5
10
15
20
25
30
Figure C‐2. Chloride (Cl‐) concentrations from water quality samples taken at the six sampled sites from 1997 through 2010. Some outliers were not included on certain graphs to eliminate clumping the lower, more representative data towards the bottom of the graph.
31
Ballard Creek
Year97 98 99 00 01 02 03 04 05 06 07 08 09 10 11
Nitr
ate-
Nitr
ogen
, NO
3-N
(mg/
L)
0
1
2
3
4
5
6
Osage Creek
Year97 98 99 00 01 02 03 04 05 06 07 08 09 10 11
Nitr
ate-
Nitr
ogen
, NO
3-N
(mg/
L)
0
1
2
3
4
5
6
Illinois River
Year97 98 99 00 01 02 03 04 05 06 07 08 09 10 11
Nitr
ate-
Nitr
ogen
, NO
3-N
(mg/
L)
0
1
2
3
4
5
6
Kings River
Year97 98 99 00 01 02 03 04 05 06 07 08 09 10 11
Nitr
ate-
Nitr
ogen
, NO
3-N
(mg/
L)
0
1
2
3
4
5
6
West Fork White River
Year97 98 99 00 01 02 03 04 05 06 07 08 09 10 11
Nitr
ate-
Nitr
ogen
, NO
3-N
(mg/
L)
0
1
2
3
4
5
6
White River
Year97 98 99 00 01 02 03 04 05 06 07 08 09 10 11
Nitr
ate-
Nitr
ogen
, NO
3-N
(mg/
L)
0
1
2
3
4
5
6
Figure C‐3. Nitrate‐nitrogen (NO3‐N) concentrations from water quality samples taken at the six sampled sites from 1997 through 2010. Some outliers were not included on certain graphs to eliminate clumping the lower, more representative data towards the bottom of the graph.
32
Ballard Creek
Year97 98 99 00 01 02 03 04 05 06 07 08 09 10 11
Tota
l Nitr
ogen
, TN
(mg/
L)
0
1
2
3
4
5
6
Osage Creek
Year97 98 99 00 01 02 03 04 05 06 07 08 09 10 11
Tota
l Nitr
ogen
, TN
(mg/
L)
0
1
2
3
4
5
6
Illinois River
Year97 98 99 00 01 02 03 04 05 06 07 08 09 10 11
Tota
l Nitr
ogen
, TN
(mg/
L)
0
1
2
3
4
5
6
Kings River
Year97 98 99 00 01 02 03 04 05 06 07 08 09 10 11
Tota
l Nitr
ogen
, TN
(mg/
L)
0
1
2
3
4
5
6
West Fork White River
Year97 98 99 00 01 02 03 04 05 06 07 08 09 10 11
Tota
l Nitr
ogen
, TN
(mg/
L)
0
1
2
3
4
5
6
White River
Year97 98 99 00 01 02 03 04 05 06 07 08 09 10 11
Tota
l Nitr
ogen
, TN
(mg/
L)
0
1
2
3
4
5
6
Figure B‐4. Total nitrogen (TN) concentrations from water quality samples taken at the six sampled sites from 1997 through 2010. Some outliers were not included on certain graphs to eliminate clumping the lower, more representative data towards the bottom of the graph.

33
Ballard Creek
Year97 98 99 00 01 02 03 04 05 06 07 08 09 10 11
Amm
oniu
m-N
itrog
en, N
H4-
N (m
g/L)
0.0
0.1
0.2
0.3
0.4
0.5
Osage Creek
Year97 98 99 00 01 02 03 04 05 06 07 08 09 10 11
Am
mon
ium
-Nitr
ogen
, NH
4-N
(mg/
L)
0.0
0.1
0.2
0.3
0.4
0.5
Illinois River
Year97 98 99 00 01 02 03 04 05 06 07 08 09 10 11
Am
mon
ium
-Nitr
ogen
, NH
4-N
(mg/
L)
0.0
0.1
0.2
0.3
0.4
0.5
KIngs River
Year97 98 99 00 01 02 03 04 05 06 07 08 09 10 11
Am
mon
ium
-Nitr
ogen
, NH
4-N
(mg/
L)
0.0
0.1
0.2
0.3
0.4
0.5
West Fork White River
Year97 98 99 00 01 02 03 04 05 06 07 08 09 10 11
Amm
oniu
m-N
itrog
en, N
H4-
N (m
g/L)
0.0
0.1
0.2
0.3
0.4
0.5
White River
Year97 98 99 00 01 02 03 04 05 06 07 08 09 10 11
Am
mon
ium
-Nitr
ogen
, NH
4-N (m
g/L)
0.0
0.1
0.2
0.3
0.4
0.5
Figure C‐5. Ammonium‐nitrogen (NH4‐N) concentrations from water quality samples taken at the six sampled sites from 1997 through 2010. Some outliers were not included on certain graphs to eliminate clumping the lower, more representative data towards the bottom of the graph.

34
Ballard Creek
Year97 98 99 00 01 02 03 04 05 06 07 08 09 10 11
Sol
uble
Rea
ctiv
e P
hosp
horu
s, S
RP
(mg/
L)
0.0
0.1
0.2
0.3
0.4
0.5
0.6
Osage Creek
Year97 98 99 00 01 02 03 04 05 06 07 08 09 10 11
Solu
ble
Rea
ctiv
e P
hosp
horu
s, S
RP
(mg/
L)
0.0
0.1
0.2
0.3
0.4
0.5
0.6
Illinois River
Year97 98 99 00 01 02 03 04 05 06 07 08 09 10 11
Solu
ble
Rea
ctiv
e P
hosp
horu
s, S
RP
(mg/
L)
0.0
0.1
0.2
0.3
0.4
0.5
0.6
Kings River
Year97 98 99 00 01 02 03 04 05 06 07 08 09 10 11
Solu
ble
Rea
ctiv
e P
hosp
horu
s, S
RP
(mg/
L)
0.0
0.1
0.2
0.3
0.4
0.5
0.6
West Fork White River
Year97 98 99 00 01 02 03 04 05 06 07 08 09 10 11
Solu
ble
Rea
ctiv
e Ph
osph
orus
, SR
P (m
g/L)
0.0
0.1
0.2
0.3
0.4
0.5
0.6
White River
Year97 98 99 00 01 02 03 04 05 06 07 08 09 10 11
Solu
ble
Rea
ctiv
e Ph
osph
orus
, SR
P (m
g/L)
0.0
0.1
0.2
0.3
0.4
0.5
0.6
Figure C‐6. Soluble reactive phosphorus (SRP) concentrations from water quality samples taken at the six sampled sites from 1997 through 2010. Some outliers were not included on certain graphs to eliminate clumping the lower, more representative data towards the bottom of the graph.

35
Ballard Creek
Year97 98 99 00 01 02 03 04 05 06 07 08 09 10 11
Tota
l Pho
spho
rus,
TP
(mg/
L)
0.0
0.5
1.0
1.5
2.0
Osage Creek
Year97 98 99 00 01 02 03 04 05 06 07 08 09 10 11
Tota
l Pho
spho
rus,
TP
(mg/
L)
0.0
0.5
1.0
1.5
2.0
Illinois River
Year97 98 99 00 01 02 03 04 05 06 07 08 09 10 11
Tota
l Pho
spho
rus,
TP
(mg/
L)
0.0
0.5
1.0
1.5
2.0
Kings River
Year97 98 99 00 01 02 03 04 05 06 07 08 09 10 11
Tota
l Pho
spho
rus,
TP
(mg/
L)
0.0
0.5
1.0
1.5
2.0
West Fork White River
Year97 98 99 00 01 02 03 04 05 06 07 08 09 10 11
Tota
l Pho
spho
rus,
TP
(mg/
L)
0.0
0.5
1.0
1.5
2.0
White River
Year97 98 99 00 01 02 03 04 05 06 07 08 09 10 11
Tota
l Pho
spho
rus,
TP
(mg/
L)
0.0
0.5
1.0
1.5
2.0
Figure C‐7. Total phosphorus (TP) concentrations from water quality samples taken at the six sampled sites from 1997 through 2010. Some outliers were not included on certain graphs to eliminate clumping the lower, more representative data towards the bottom of the graph.

36
Ballard Creek
Year97 98 99 00 01 02 03 04 05 06 07 08 09 10 11
Tota
l Sus
pend
ed S
olid
s, T
SS (m
g/L)
0
200
400
600
800
Osage Creek
Year97 98 99 00 01 02 03 04 05 06 07 08 09 10 11
Tota
l Sus
pend
ed S
olid
s, T
SS
(mg/
L)
0
200
400
600
800
Illinois River
Year97 98 99 00 01 02 03 04 05 06 07 08 09 10 11
Tota
l Sus
pend
ed S
olid
s, T
SS (m
g/L)
0
200
400
600
800
Kings River
Year97 98 99 00 01 02 03 04 05 06 07 08 09 10 11
Tota
l Sus
pend
ed S
olid
s, T
SS (m
g/L)
0
200
400
600
800
West Fork White River
Year97 98 99 00 01 02 03 04 05 06 07 08 09 10 11
Tota
l Sus
pend
ed S
olid
s, T
SS (m
g/L)
0
200
400
600
800
White River
Year97 98 99 00 01 02 03 04 05 06 07 08 09 10 11
Tota
l Sus
pend
ed S
olid
s, T
SS (m
g/L)
0
200
400
600
800
Figure C‐8. Total suspended solids (TSS) concentrations from water quality samples taken at the six sampled sites from 1997 through 2010. Some outliers were not included on certain graphs to eliminate clumping the lower, more representative data towards the bottom of the graph.

37
APPENDIX D: Log‐Transformed Water Quality Data with LOESS Smoothing
Ballard Creek
Log (Discharge, Q [cfs])-1 0 1 2 3 4 5
Log
(Sul
fate
, SO
4 [m
g/L]
)
0.4
0.6
0.8
1.0
1.2
1.4
1.6
1.8
2.0
Osage Creek
Log (Discharge, Q [cfs])-1 0 1 2 3 4 5
Log
(Sul
fate
, SO
4 [m
g/L]
)
0.4
0.6
0.8
1.0
1.2
1.4
1.6
1.8
2.0
Illinois River
Log (Discharge, Q [cfs])-1 0 1 2 3 4 5
Log
(Sul
fate
, SO
4 [m
g/L]
)
0.4
0.6
0.8
1.0
1.2
1.4
1.6
1.8
2.0
Kings River
Log (Discharge, Q [cfs])-1 0 1 2 3 4 5
Log
(Sul
fate
, SO
4 [m
g/L]
)
0.4
0.6
0.8
1.0
1.2
1.4
1.6
1.8
2.0
West Fork White River
Log (Discharge, Q [cfs])-1 0 1 2 3 4 5
Log
(Sul
fate
, SO
4 [m
g/L]
)
0.4
0.6
0.8
1.0
1.2
1.4
1.6
1.8
2.0
White River
Log (Discharge, Q [cfs])-1 0 1 2 3 4 5
Log
(Sul
fate
, SO
4 [m
g/L]
)
0.4
0.6
0.8
1.0
1.2
1.4
1.6
1.8
2.0
Figure D‐1. Log‐transformed sulfate (SO4) concentrations and log‐transformed daily discharge with locally weighted regression (LOESS) line; the LOESS smoothing technique shows the relation between concentration and stream flow at each specific sampling site.

38
Ballard Creek
Log (Discharge, Q [cfs])-1 0 1 2 3 4 5
Log
(Chl
orid
e, C
l- [mg/
L])
0.0
0.5
1.0
1.5
2.0
Osage Creek
Log (Discharge, Q [cfs])-1 0 1 2 3 4 5
Log
(Chl
orid
e, C
l- [mg/
L])
0.0
0.5
1.0
1.5
2.0
Illinois River
Log (Discharge, Q [cfs])-1 0 1 2 3 4 5
Log
(Chl
orid
e, C
l- [mg/
L])
0.0
0.5
1.0
1.5
2.0
Kings River
Log (Discharge, Q [cfs])-1 0 1 2 3 4 5
Log
(Chl
orid
e, C
l- [mg/
L])
0.0
0.5
1.0
1.5
2.0
West Fork White River
Log (Discharge, Q [cfs])-1 0 1 2 3 4 5
Log
(Chl
orid
e, C
l- [mg/
L])
0.0
0.5
1.0
1.5
2.0
White River
Log (Discharge, Q [cfs])-1 0 1 2 3 4 5
Log
(Chl
orid
e, C
l- [mg/
L])
0.0
0.5
1.0
1.5
2.0
Figure D2. Log‐transformed chloride (Cl‐) concentrations and log‐transformed daily discharge with locally weighted regression (LOESS) line; the LOESS smoothing technique shows the relation between concentration and stream flow at each specific sampling site.
39
Ballard Creek
Log (Discharge, Q [cfs])-1 0 1 2 3 4 5
Log
(Nitr
ate-
Nitr
ogen
, N0 3
-N [m
g/L]
)
-2.0
-1.5
-1.0
-0.5
0.0
0.5
1.0
Osage Creek
Log (Discharge, Q [cfs])-1 0 1 2 3 4 5
Log
(Nitr
ate-
Nitr
ogen
, N0 3-
N [m
g/L]
)
-2.0
-1.5
-1.0
-0.5
0.0
0.5
1.0
Illinois River
Log (Discharge, Q [cfs])-1 0 1 2 3 4 5
Log
(Nitr
ate-
Nitr
ogen
, N0 3
-N [m
g/L]
)
-2.0
-1.5
-1.0
-0.5
0.0
0.5
1.0
Kings River
Log (Discharge, Q [cfs])-1 0 1 2 3 4 5
Log
(Nitr
ate-
Nitr
ogen
, N0 3
-N [m
g/L]
)
-2.0
-1.5
-1.0
-0.5
0.0
0.5
1.0
West Fork White River
Log (Discharge, Q [cfs])-1 0 1 2 3 4 5
Log
(Nitr
ate-
Nitr
ogen
, N0 3
-N [m
g/L]
)
-2.0
-1.5
-1.0
-0.5
0.0
0.5
1.0
White River
Log (Discharge, Q [cfs])-1 0 1 2 3 4 5
Log
(Nitr
ate-
Nitr
ogen
, N0 3
-N [m
g/L]
)
-2.0
-1.5
-1.0
-0.5
0.0
0.5
1.0
Figure D‐3. Log‐transformed nitrate‐nitrogen (NO3‐N) concentrations and log‐transformed daily discharge with locally weighted regression (LOESS) line; the LOESS smoothing technique shows the relation between concentration and stream flow at each specific sampling site.

40
Ballard Creek
Log (Discharge, Q [cfs])-1 0 1 2 3 4 5
Log
(Tot
al N
itrog
en, T
N [m
g/L]
)
-2.0
-1.5
-1.0
-0.5
0.0
0.5
1.0
Osage Creek
Log (Discharge, Q [cfs])-1 0 1 2 3 4 5
Log
(Tot
al N
itrog
en, T
N [m
g/L]
)
-2.0
-1.5
-1.0
-0.5
0.0
0.5
1.0
Illinois River
Log (Discharge, Q [cfs])-1 0 1 2 3 4 5
Log
(Tot
al N
itrog
en, T
N [m
g/L]
)
-2.0
-1.5
-1.0
-0.5
0.0
0.5
1.0
Kings River
Log (Discharge, Q [cfs])-1 0 1 2 3 4 5
Log
(Tot
al N
itrog
en, T
N [m
g/L]
)
-2.0
-1.5
-1.0
-0.5
0.0
0.5
1.0
West Fork White River
Log (Discharge, Q [cfs])-1 0 1 2 3 4 5
Log
(Tot
al N
itrog
en, T
N [m
g/L]
)
-2.0
-1.5
-1.0
-0.5
0.0
0.5
1.0
White River
Log (Discharge, Q [cfs])-1 0 1 2 3 4 5
Log
(Tot
al N
itrog
en, T
N [m
g/L]
)
-2.0
-1.5
-1.0
-0.5
0.0
0.5
1.0
Figure D‐4. Log‐transformed total nitrogen (TN) concentrations and log‐transformed daily discharge with locally weighted regression (LOESS) line; the LOESS smoothing technique shows the relation between concentration and stream flow at each specific sampling site.
41
Ballard Creek
Log (Discharge, Q [cfs])-1 0 1 2 3 4 5
Log
(Am
mon
ium
-Nitr
ogen
, NH
4-N
[mg/
L])
-3.0
-2.5
-2.0
-1.5
-1.0
-0.5
0.0
Osage Creek
Log (Discharge, Q [cfs])-1 0 1 2 3 4 5
Log
(Am
mon
ium
-Nitr
ogen
, NH
4-N
[mg/
L])
-3.0
-2.5
-2.0
-1.5
-1.0
-0.5
0.0
Illinois River
Log (Discharge, Q [cfs])-1 0 1 2 3 4 5
Log
(Am
mon
ium
-Nitr
ogen
, NH
4-N
[mg/
L])
-3.0
-2.5
-2.0
-1.5
-1.0
-0.5
0.0
Kings River
Log (Discharge, Q [cfs])-1 0 1 2 3 4 5
Log
(Am
mon
ium
-Nitr
ogen
, NH
4-N
[mg/
L])
-3.0
-2.5
-2.0
-1.5
-1.0
-0.5
0.0
West Fork White River
Log (Discharge, Q [cfs])-1 0 1 2 3 4 5
Log
(Am
mon
ium
-Nitr
ogen
, NH
4-N
[mg/
L])
-3.0
-2.5
-2.0
-1.5
-1.0
-0.5
0.0
White River
Log (Discharge, Q [cfs])-1 0 1 2 3 4 5
Log
(Am
mon
ium
-Nitr
ogen
, NH
4-N
[mg/
L])
-3.0
-2.5
-2.0
-1.5
-1.0
-0.5
0.0
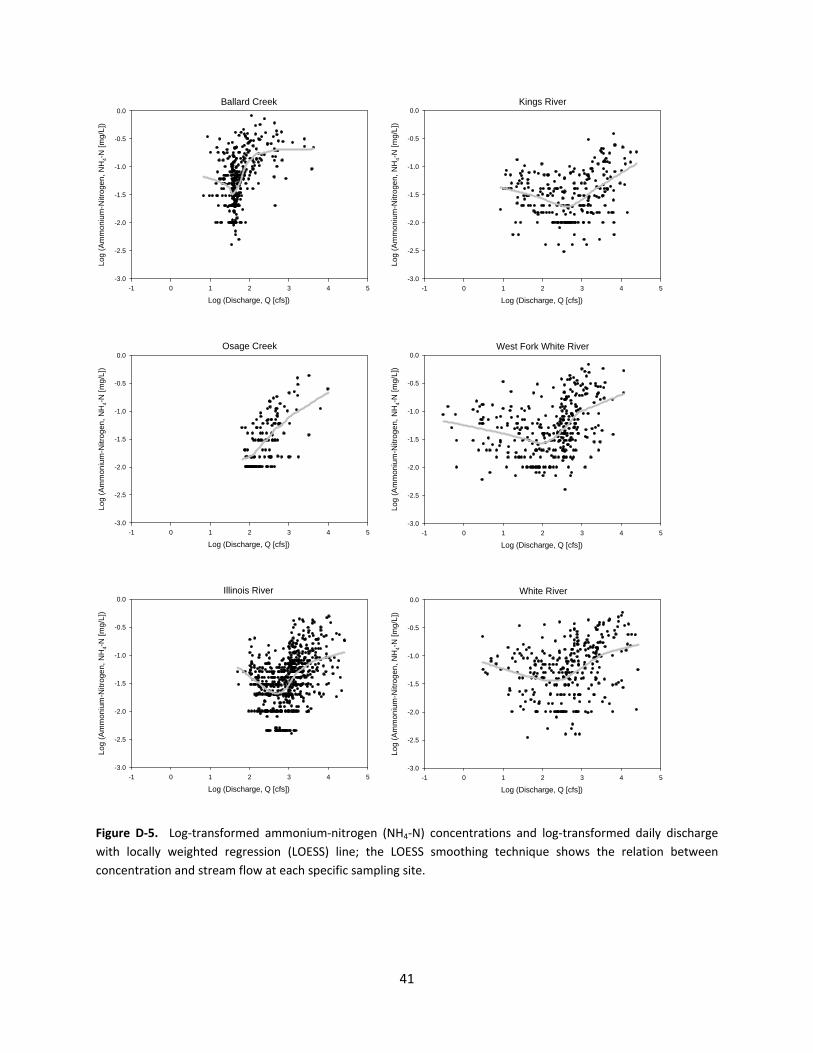
Figure D‐5. Log‐transformed ammonium‐nitrogen (NH4‐N) concentrations and log‐transformed daily discharge with locally weighted regression (LOESS) line; the LOESS smoothing technique shows the relation between concentration and stream flow at each specific sampling site.

42
Ballard Creek
Log (Discharge, Q [cfs])-1 0 1 2 3 4 5
Log
(Sol
uble
Rea
ctiv
e Ph
osph
orus
, SR
P [m
g/L]
)
-3
-2
-1
0
1
Osage Creek
Log (Discharge, Q [cfs])-1 0 1 2 3 4 5
Log
(Sol
uble
Rea
ctiv
e P
hosp
horu
s, S
RP
[mg/
L])
-3
-2
-1
0
1
Illinois River
Log (Discharge, Q [cfs])-1 0 1 2 3 4 5
Log
(Sol
uble
Rea
ctiv
e P
hosp
horu
s, S
RP
[mg/
L])
-3
-2
-1
0
1
Kings River
Log (Discharge, Q [cfs])-1 0 1 2 3 4 5
Log
(Sol
uble
Rea
ctiv
e P
hosp
horu
s, S
RP
[mg/
L])
-3
-2
-1
0
1
West Fork White River
Log (Discharge, Q [cfs])-1 0 1 2 3 4 5
Log
(Sol
uble
Rea
ctiv
e P
hosp
horu
s, S
RP
[mg/
L])
-3
-2
-1
0
1
White River
Log (Discharge, Q [cfs])-1 0 1 2 3 4 5
Log
(Sol
uble
Rea
ctiv
e P
hosp
horu
s, S
RP
[mg/
L])
-3
-2
-1
0
1
Figure D‐6. Log‐transformed soluble reactive phosphorus (SRP) concentrations and log‐transformed daily discharge with locally weighted regression (LOESS) line; the LOESS smoothing technique shows the relation concentration and stream flow at each specific sampling site.

43
Ballard Creek
Log (Discharge, Q [cfs])-1 0 1 2 3 4 5
Log
(Tot
al P
hosp
horu
s, T
P [m
g/L]
)
-3
-2
-1
0
1
Osage Creek
Log (Discharge, Q [cfs])-1 0 1 2 3 4 5
Log
(Tot
al P
hosp
horu
s, T
P [m
g/L]
)
-3
-2
-1
0
1
Illinois River
Log (Discharge, Q [cfs])-1 0 1 2 3 4 5
Log
(Tot
al P
hosp
horu
s, T
P [m
g/L]
)
-3
-2
-1
0
1
Kings River
Log (Discharge, Q [cfs])-1 0 1 2 3 4 5
Log
(Tot
al P
hosp
horu
s, T
P [m
g/L]
)
-3
-2
-1
0
1
West Fork White River
Log (Discharge, Q [cfs])-1 0 1 2 3 4 5
Log
(Tot
al P
hosp
horu
s, T
P [m
g/L]
)
-3
-2
-1
0
1
White River
Log (Discharge, Q [cfs])-1 0 1 2 3 4 5
Log
(Tot
al P
hosp
horu
s, T
P [m
g/L]
)
-3
-2
-1
0
1
Figure D‐7. Log‐transformed total phosphorus (TP) concentrations and log‐transformed daily discharge with locally weighted regression (LOESS) line; the LOESS smoothing technique shows the relation between concentration and stream flow at each specific sampling site.

44
Ballard Creek
Log (Discharge, Q [cfs])-1 0 1 2 3 4 5
Log
(Tot
al S
uspe
nded
Sol
ids,
TS
S [m
g/L]
)
-1
0
1
2
3
4
Osage Creek
Log (Discharge, Q [cfs])-1 0 1 2 3 4 5
Log
(Tot
al S
uspe
nded
Sol
ids,
TS
S [m
g/L]
)
-1
0
1
2
3
4
Illinois River
Log (Discharge, Q [cfs])-1 0 1 2 3 4 5
Log
(Tot
al S
uspe
nded
Sol
ids,
TSS
[mg/
L])
-1
0
1
2
3
4
Kings River
Log (Discharge, Q [cfs])-1 0 1 2 3 4 5
Log
(Tot
al S
uspe
nded
Sol
ids,
TSS
[mg/
L])
-1
0
1
2
3
4
West Fork White River
Log (Discharge, Q [cfs])-1 0 1 2 3 4 5
Log
(Tot
al S
uspe
nded
Sol
ids,
TSS
[mg/
L])
-1
0
1
2
3
4
White River
Log (Discharge, Q [cfs])-1 0 1 2 3 4 5
Log
(Tot
al S
uspe
nded
Sol
ids,
TSS
[mg/
L])
-1
0
1
2
3
4
Figure D‐8. Log‐transformed total suspended solids (TSS) concentrations and log‐transformed daily discharge with locally weighted regression (LOESS) line; the LOESS smoothing technique shows the relation between concentration and stream flow at each specific sampling site.

45
Appendix E: Flow‐Adjusted Concentrations (FACs) as a Function of Time
Ballard Creek
Year
97 98 99 00 01 02 03 04 05 06 07 08 09 10 11
SO
4 FA
C (L
OE
SS
Res
idua
ls)
-0.4
-0.2
0.0
0.2
0.4
Osage Creek
Year
97 98 99 00 01 02 03 04 05 06 07 08 09 10 11
SO
4 FA
C (L
OE
SS
Res
idua
ls)
-0.4
-0.2
0.0
0.2
0.4
Illinois River
Year
97 98 99 00 01 02 03 04 05 06 07 08 09 10 11
SO
4 FA
C (L
OE
SS
Res
idua
ls)
-0.4
-0.2
0.0
0.2
0.4
Kings River
Year
97 98 99 00 01 02 03 04 05 06 07 08 09 10 11
SO
4 FA
C (L
OE
SS
Res
idua
ls)
-0.4
-0.2
0.0
0.2
0.4
West Fork White River
Year
97 98 99 00 01 02 03 04 05 06 07 08 09 10 11
SO4 F
AC
(LO
ES
S R
esid
uals
)
-0.4
-0.2
0.0
0.2
0.4
White River
Year
97 98 99 00 01 02 03 04 05 06 07 08 09 10 11
SO
4 FAC
(LO
ESS
Res
idua
ls)
-0.4
-0.2
0.0
0.2
0.4
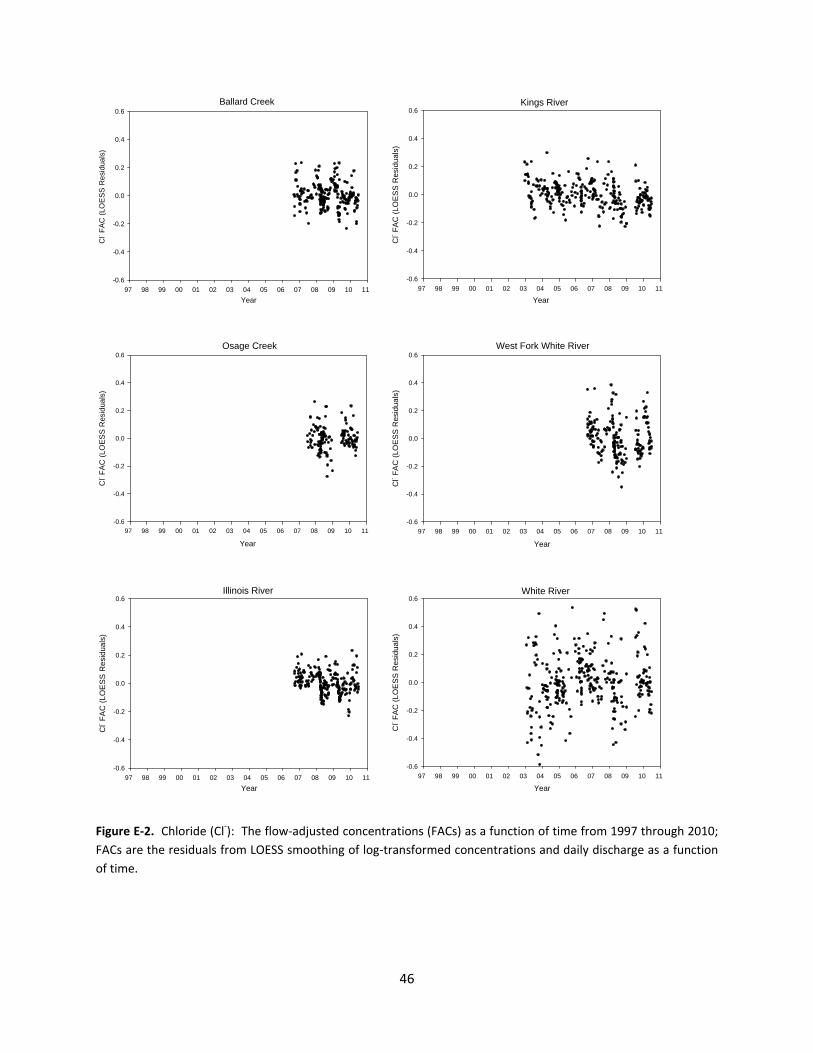
Figure E‐1. Sulfate (SO4): The flow‐adjusted concentrations (FACs) as a function of time from 1997 through 2010; FACs are the residuals from LOESS smoothing of log‐transformed concentrations and daily discharge as a function of time.
46
Ballard Creek
Year97 98 99 00 01 02 03 04 05 06 07 08 09 10 11
Cl- F
AC (L
OE
SS
Res
idua
ls)
-0.6
-0.4
-0.2
0.0
0.2
0.4
0.6
Osage Creek
Year
97 98 99 00 01 02 03 04 05 06 07 08 09 10 11
Cl- F
AC
(LO
ESS
Res
idua
ls)
-0.6
-0.4
-0.2
0.0
0.2
0.4
0.6
Illinois River
Year97 98 99 00 01 02 03 04 05 06 07 08 09 10 11
Cl- F
AC
(LO
ESS
Res
idua
ls)
-0.6
-0.4
-0.2
0.0
0.2
0.4
0.6
Kings River
Year97 98 99 00 01 02 03 04 05 06 07 08 09 10 11
Cl- F
AC
(LO
ES
S R
esid
uals
)
-0.6
-0.4
-0.2
0.0
0.2
0.4
0.6
West Fork White River
Year
97 98 99 00 01 02 03 04 05 06 07 08 09 10 11
Cl- F
AC
(LO
ESS
Res
idua
ls)
-0.6
-0.4
-0.2
0.0
0.2
0.4
0.6
White River
Year97 98 99 00 01 02 03 04 05 06 07 08 09 10 11
Cl- F
AC
(LO
ES
S R
esid
uals
)
-0.6
-0.4
-0.2
0.0
0.2
0.4
0.6
Figure E‐2. Chloride (Cl‐): The flow‐adjusted concentrations (FACs) as a function of time from 1997 through 2010; FACs are the residuals from LOESS smoothing of log‐transformed concentrations and daily discharge as a function of time.
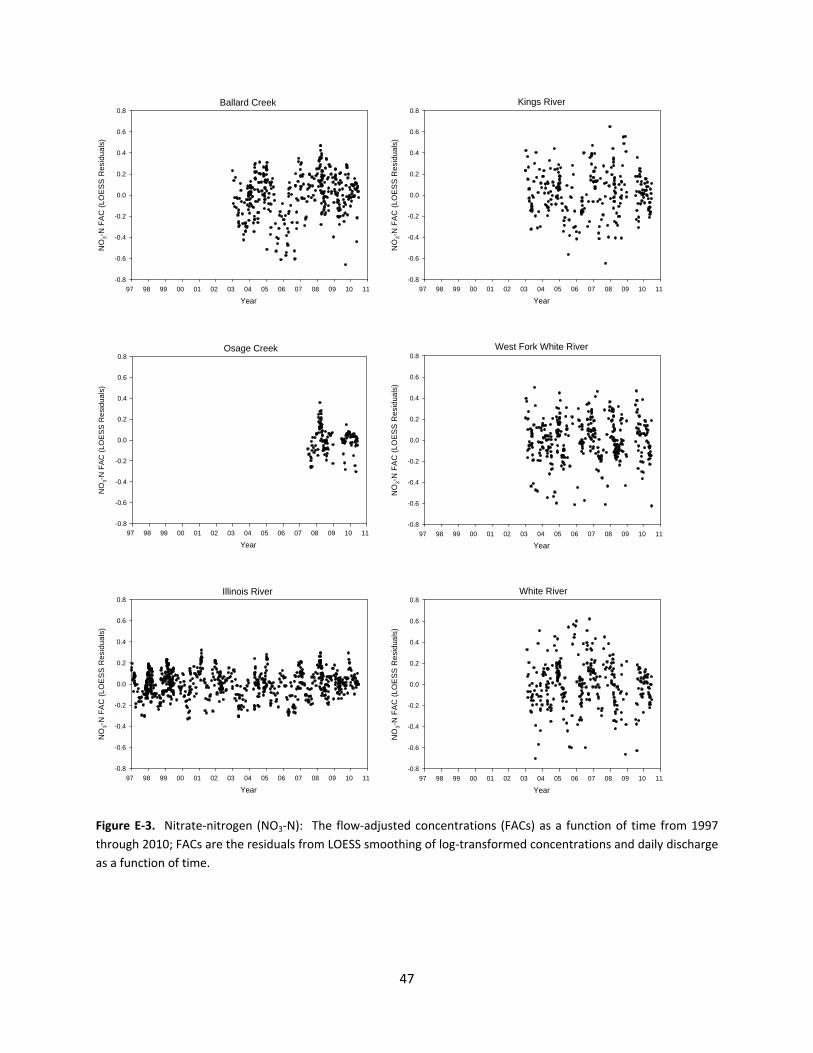
47
Ballard Creek
Year97 98 99 00 01 02 03 04 05 06 07 08 09 10 11
NO
3-N
FA
C (L
OE
SS
Res
idua
ls)
-0.8
-0.6
-0.4
-0.2
0.0
0.2
0.4
0.6
0.8
Osage Creek
Year97 98 99 00 01 02 03 04 05 06 07 08 09 10 11
NO
3-N
FAC
(LO
ESS
Res
idua
ls)
-0.8
-0.6
-0.4
-0.2
0.0
0.2
0.4
0.6
0.8
Illinois River
Year97 98 99 00 01 02 03 04 05 06 07 08 09 10 11
NO
3-N
FA
C (L
OE
SS R
esid
uals
)
-0.8
-0.6
-0.4
-0.2
0.0
0.2
0.4
0.6
0.8
Kings River
Year97 98 99 00 01 02 03 04 05 06 07 08 09 10 11
NO
3-N
FA
C (L
OE
SS
Res
idua
ls)
-0.8
-0.6
-0.4
-0.2
0.0
0.2
0.4
0.6
0.8
West Fork White River
Year97 98 99 00 01 02 03 04 05 06 07 08 09 10 11
NO
3-N
FA
C (L
OES
S R
esid
uals
)
-0.8
-0.6
-0.4
-0.2
0.0
0.2
0.4
0.6
0.8
White River
Year97 98 99 00 01 02 03 04 05 06 07 08 09 10 11
NO
3-N
FA
C (L
OE
SS R
esid
uals
)
-0.8
-0.6
-0.4
-0.2
0.0
0.2
0.4
0.6
0.8
Figure E‐3. Nitrate‐nitrogen (NO3‐N): The flow‐adjusted concentrations (FACs) as a function of time from 1997 through 2010; FACs are the residuals from LOESS smoothing of log‐transformed concentrations and daily discharge as a function of time.
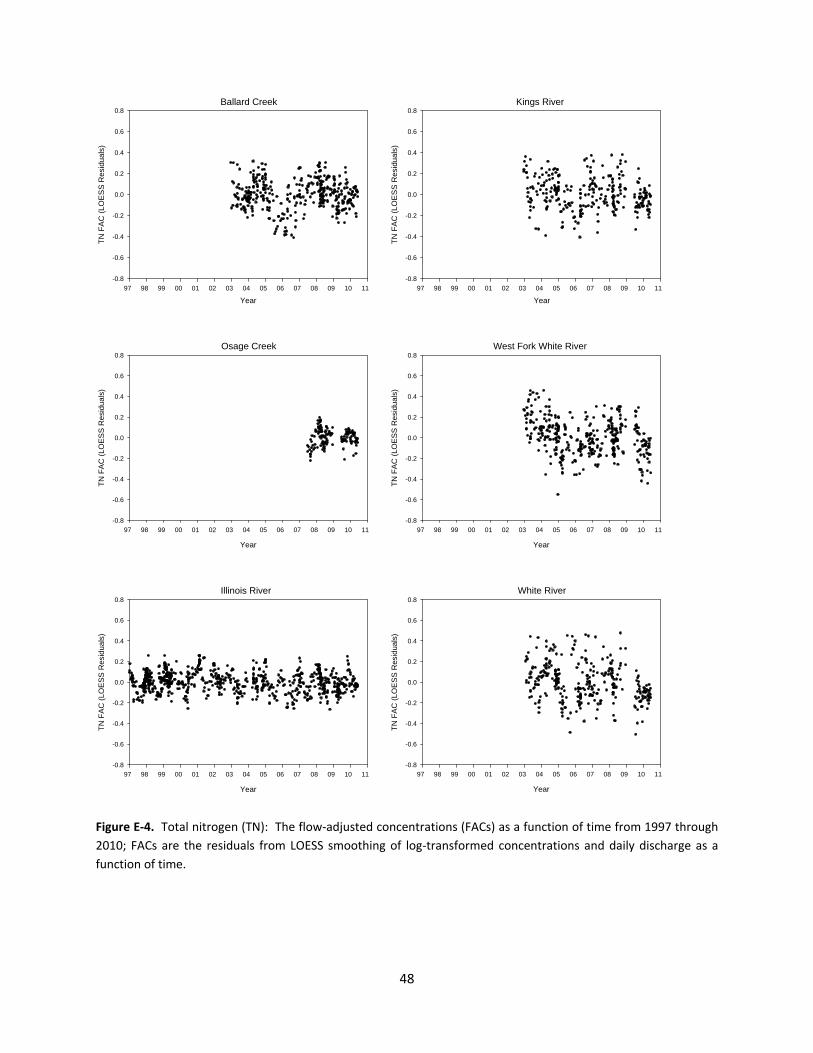
48
Ballard Creek
Year97 98 99 00 01 02 03 04 05 06 07 08 09 10 11
TN F
AC
(LO
ES
S R
esid
uals
)
-0.8
-0.6
-0.4
-0.2
0.0
0.2
0.4
0.6
0.8
Osage Creek
Year
97 98 99 00 01 02 03 04 05 06 07 08 09 10 11
TN F
AC
(LO
ESS
Res
idua
ls)
-0.8
-0.6
-0.4
-0.2
0.0
0.2
0.4
0.6
0.8
Illinois River
Year
97 98 99 00 01 02 03 04 05 06 07 08 09 10 11
TN F
AC
(LO
ESS
Res
idua
ls)
-0.8
-0.6
-0.4
-0.2
0.0
0.2
0.4
0.6
0.8
Kings River
Year97 98 99 00 01 02 03 04 05 06 07 08 09 10 11
TN F
AC
(LO
ES
S R
esid
uals
)
-0.8
-0.6
-0.4
-0.2
0.0
0.2
0.4
0.6
0.8
West Fork White River
Year
97 98 99 00 01 02 03 04 05 06 07 08 09 10 11
TN F
AC
(LO
ESS
Res
idua
ls)
-0.8
-0.6
-0.4
-0.2
0.0
0.2
0.4
0.6
0.8
White River
Year
97 98 99 00 01 02 03 04 05 06 07 08 09 10 11
TN F
AC
(LO
ES
S R
esid
uals
)
-0.8
-0.6
-0.4
-0.2
0.0
0.2
0.4
0.6
0.8
Figure E‐4. Total nitrogen (TN): The flow‐adjusted concentrations (FACs) as a function of time from 1997 through 2010; FACs are the residuals from LOESS smoothing of log‐transformed concentrations and daily discharge as a function of time.

49
Ballard Creek
Year
97 98 99 00 01 02 03 04 05 06 07 08 09 10 11
NH
4-N
FA
C (L
OES
S R
esid
uals
)
-1.5
-1.0
-0.5
0.0
0.5
1.0
1.5
Osage Creek
Year
97 98 99 00 01 02 03 04 05 06 07 08 09 10 11
NH
4-N
FA
C (L
OES
S R
esid
uals
)
-1.5
-1.0
-0.5
0.0
0.5
1.0
1.5
Illinois River
Year
97 98 99 00 01 02 03 04 05 06 07 08 09 10 11
NH
4-N
FA
C (L
OES
S R
esid
uals
)
-1.5
-1.0
-0.5
0.0
0.5
1.0
1.5
Kings River
Year97 98 99 00 01 02 03 04 05 06 07 08 09 10 11
NH
4-N
FA
C (L
OE
SS
Res
idua
ls)
-1.5
-1.0
-0.5
0.0
0.5
1.0
1.5
West Fork White River
Year
97 98 99 00 01 02 03 04 05 06 07 08 09 10 11
NH
4-N
FA
C (L
OES
S R
esid
uals
)
-1.5
-1.0
-0.5
0.0
0.5
1.0
1.5
White River
Year
97 98 99 00 01 02 03 04 05 06 07 08 09 10 11
NH
4-N
FA
C (L
OE
SS
Res
idua
ls)
-1.5
-1.0
-0.5
0.0
0.5
1.0
1.5
Figure E‐5. Ammonium‐nitrogen (NH4‐N): The flow‐adjusted concentrations (FACs) as a function of time from 1997 through 2010; FACs are the residuals from LOESS smoothing of log‐transformed concentrations and daily discharge as a function of time.
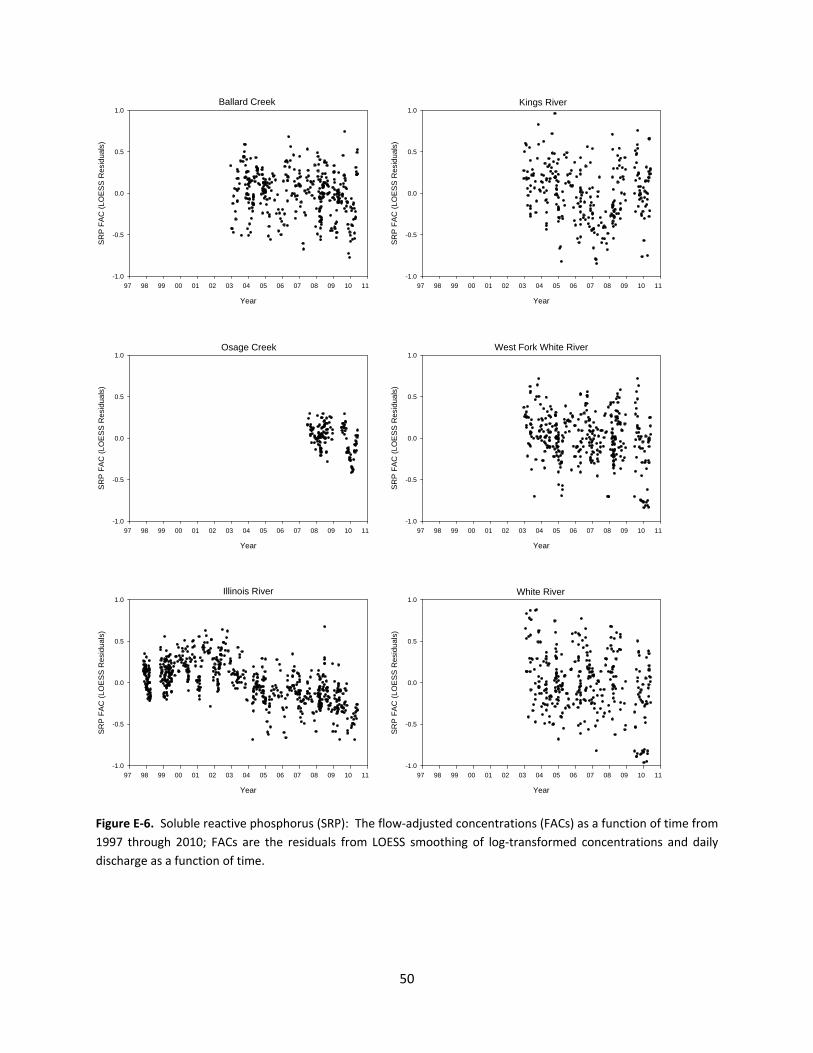
50
Ballard Creek
Year
97 98 99 00 01 02 03 04 05 06 07 08 09 10 11
SR
P F
AC
(LO
ES
S R
esid
uals
)
-1.0
-0.5
0.0
0.5
1.0
Osage Creek
Year
97 98 99 00 01 02 03 04 05 06 07 08 09 10 11
SR
P F
AC
(LO
ES
S R
esid
uals
)
-1.0
-0.5
0.0
0.5
1.0
Illinois River
Year
97 98 99 00 01 02 03 04 05 06 07 08 09 10 11
SR
P F
AC
(LO
ES
S R
esid
uals
)
-1.0
-0.5
0.0
0.5
1.0
Kings River
Year
97 98 99 00 01 02 03 04 05 06 07 08 09 10 11
SR
P F
AC
(LO
ES
S R
esid
uals
)
-1.0
-0.5
0.0
0.5
1.0
West Fork White River
Year
97 98 99 00 01 02 03 04 05 06 07 08 09 10 11
SR
P F
AC
(LO
ES
S R
esid
uals
)
-1.0
-0.5
0.0
0.5
1.0
White River
Year
97 98 99 00 01 02 03 04 05 06 07 08 09 10 11
SR
P F
AC
(LO
ES
S R
esid
uals
)
-1.0
-0.5
0.0
0.5
1.0
Figure E‐6. Soluble reactive phosphorus (SRP): The flow‐adjusted concentrations (FACs) as a function of time from 1997 through 2010; FACs are the residuals from LOESS smoothing of log‐transformed concentrations and daily discharge as a function of time.

51
Ballard Creek
Year
97 98 99 00 01 02 03 04 05 06 07 08 09 10 11
TP F
AC
(LO
ES
S R
esid
uals
)
-1.0
-0.5
0.0
0.5
1.0
Osage Creek
Year
97 98 99 00 01 02 03 04 05 06 07 08 09 10 11
TP F
AC (L
OE
SS
Res
idua
ls)
-1.0
-0.5
0.0
0.5
1.0
Illinois River
Year
97 98 99 00 01 02 03 04 05 06 07 08 09 10 11
TP F
AC
(LO
ES
S R
esid
uals
)
-1.0
-0.5
0.0
0.5
1.0
Kings River
Year
97 98 99 00 01 02 03 04 05 06 07 08 09 10 11
TP F
AC
(LO
ES
S R
esid
uals
)
-1.0
-0.5
0.0
0.5
1.0
West Fork White River
Year
97 98 99 00 01 02 03 04 05 06 07 08 09 10 11
TP F
AC
(LO
ESS
Res
idua
ls)
-1.0
-0.5
0.0
0.5
1.0
White River
Year
97 98 99 00 01 02 03 04 05 06 07 08 09 10 11
TP F
AC
(LO
ES
S R
esid
uals
)
-1.0
-0.5
0.0
0.5
1.0
Figure E‐7. Total phosphorus (TP): The flow‐adjusted concentrations (FACs) as a function of time from 1997 through 2010; FACs are the residuals from LOESS smoothing of log‐transformed concentrations and daily discharge as a function of time.

52
Ballard Creek
Year
97 98 99 00 01 02 03 04 05 06 07 08 09 10 11
TSS
FA
C (L
OE
SS
Res
idua
ls)
-1.5
-1.0
-0.5
0.0
0.5
1.0
1.5
Osage Creek
Year
97 98 99 00 01 02 03 04 05 06 07 08 09 10 11
TSS
FAC
(LO
ESS
Res
idua
ls)
-1.5
-1.0
-0.5
0.0
0.5
1.0
1.5
Illinois River
Year
97 98 99 00 01 02 03 04 05 06 07 08 09 10 11
TSS
FA
C (L
OES
S R
esid
uals
)
-1.5
-1.0
-0.5
0.0
0.5
1.0
1.5
Kings River
Year
97 98 99 00 01 02 03 04 05 06 07 08 09 10 11
TSS
FA
C (L
OES
S R
esid
uals
)
-1.5
-1.0
-0.5
0.0
0.5
1.0
1.5
West Fork White River
Year
97 98 99 00 01 02 03 04 05 06 07 08 09 10 11
TSS
FA
C (L
OE
SS
Res
idua
ls)
-1.5
-1.0
-0.5
0.0
0.5
1.0
1.5
White River
Year
97 98 99 00 01 02 03 04 05 06 07 08 09 10 11
TSS
FAC
(LO
ESS
Res
idua
ls)
-1.5
-1.0
-0.5
0.0
0.5
1.0
1.5
Figure E‐8. Total suspended solids (TSS): The flow‐adjusted concentrations (FACs) as a function of time from 1997 through 2010; FACs are the residuals from LOESS smoothing of log‐transformed concentrations and daily discharge as a function of time.