trends and projections of caesarean section rates: global
TRANSCRIPT

1
Trends and projections of caesarean section rates: global and regional estimates
Appendix
Supplementary material
Betrán AP, Ye J, Moller AB,1 MSc, Souza JP, Zhang JJ.
Contents
1. GATHER Statement ............................................................................................................................. 2
2. United Nations Population Division (UNPD) regions and subregions ................................................. 3
3. Detailed description of statistical methods and codes ........................................................................... 5
4. Supplementary tables and other results ............................................................................................... 21
5. Data points included in the analysis by country and year and source of data ..................................... 29
BMJ Publishing Group Limited (BMJ) disclaims all liability and responsibility arising from any relianceSupplemental material placed on this supplemental material which has been supplied by the author(s) BMJ Global Health
doi: 10.1136/bmjgh-2021-005671:e005671. 6 2021;BMJ Global Health, et al. Betran AP

2
1. GATHER Statement
Supplementary box 1: GATHER Statement.
Item # Checklist item Reported on
page #
Objectives and funding 1 Define the indicator(s), populations (including age, sex, and geographic entities), and time period(s) for which estimates
were made. 4-6
2 List the funding sources for the work. 12
Data Inputs For all data inputs from multiple sources that are synthesized as part of the study:
3 Describe how the data were identified and how the data were accessed. 4-5 4 Specify the inclusion and exclusion criteria. Identify all ad-hoc exclusions. 4-6 5 Provide information on all included data sources and their main characteristics. For each data source used, report reference
information or contact name/institution, population represented, data collection method, year(s) of data collection, sex and age range, diagnostic criteria or measurement method, and sample size, as relevant.
Appendix pp 29-282
6 Identify and describe any categories of input data that have potentially important biases (e.g., based on characteristics listed in item 5).
NA
For data inputs that contribute to the analysis but were not synthesized as part of the study:
7 Describe and give sources for any other data inputs. 5-6 For all data inputs:
8 Provide all data inputs in a file format from which data can be efficiently extracted (e.g., a spreadsheet rather than a PDF), including all relevant meta-data listed in item 5. For any data inputs that cannot be shared because of ethical or legal reasons, such as third-party ownership, provide a contact name or the name of the institution that retains the right to the data.
Appendix pp 29-282
Data analysis 9 Provide a conceptual overview of the data analysis method. A diagram may be helpful. 5-7, Appendix pp
5-20 10 Provide a detailed description of all steps of the analysis, including mathematical formulae. This description should cover, as
relevant, data cleaning, data pre-processing, data adjustments and weighting of data sources, and mathematical or statistical model(s).
Appendix pp 5-20
11 Describe how candidate models were evaluated and how the final model(s) were selected. Appendix pp 5-20 12 Provide the results of an evaluation of model performance, if done, as well as the results of any relevant sensitivity analysis. Appendix pp 5-20 13 Describe methods for calculating uncertainty of the estimates. State which sources of uncertainty were, and were not,
accounted for in the uncertainty analysis. 5-7
14 State how analytic or statistical source code used to generate estimates can be accessed. Appendix pp 5-20
Results and Discussion 15 Provide published estimates in a file format from which data can be efficiently extracted. 14-15, appendix
pp 21-28 16 Report a quantitative measure of the uncertainty of the estimates (e.g. uncertainty intervals). 14-15 appendix pp
21-28 17 Interpret results in light of existing evidence. If updating a previous set of estimates, describe the reasons for changes in
estimates. 10-11
18 Discuss limitations of the estimates. Include a discussion of any modelling assumptions or data limitations that affect interpretation of the estimates.
11-12
Source: http://gather-statement.org/.
BMJ Publishing Group Limited (BMJ) disclaims all liability and responsibility arising from any relianceSupplemental material placed on this supplemental material which has been supplied by the author(s) BMJ Global Health
doi: 10.1136/bmjgh-2021-005671:e005671. 6 2021;BMJ Global Health, et al. Betran AP

3
2. United Nations Population Division (UNPD) regions and subregions
Supplementary box 2: United Nations Population Division (UNDP) regions and subregions.
Regions Countries
Africa
Northern Africa Algeria, Egypt, Morocco, State of Libya, Sudan, Tunisia.
Sub-Saharan Africa
Angola, Benin, Botswana, Burkina Faso, Burundi, Cabo Verde, Cameroon, Central African Republic, Chad, Comoros, Congo, Côte d'Ivoire, Democratic Republic of the Congo, Djibouti, Equatorial Guinea, Eritrea, Ethiopia, Gabon, Gambia, Ghana, Guinea, Guinea-Bissau, Kenya, Lesotho, Liberia, Madagascar, Malawi, Mali, Mauritania, Mauritius, Mozambique, Namibia, Niger, Nigeria, Rwanda, Sao Tome and Principe, Senegal, Seychelles, Sierra Leone, Somalia, South Africa, South Sudan, Eswatini, Togo, Uganda, United Republic of Tanzania, Zambia, Zimbabwe.
Asia
Central Asia Kazakhstan, Kyrgyzstan, Tajikistan, Turkmenistan, Uzbekistan.
Eastern Asia China, Democratic People’s Republic of Korea, Japan, Mongolia, Republic of Korea.
South-eastern Asia Brunei Darussalam, Cambodia, Indonesia, Lao People’s Democratic Republic, Malaysia, Myanmar, Philippines, Singapore, Thailand, Timor-Leste, Viet Nam.
Southern Asia Afghanistan, Bangladesh, Bhutan, India, Iran (Islamic Republic of), Maldives, Nepal, Pakistan, Sri Lanka.
Western Asia Armenia, Azerbaijan, Bahrain, Cyprus, Georgia, Iraq, Israel, Jordan, Kuwait, Lebanon, Oman, Qatar, Saudi Arabia, Syrian Arab Republic, Turkey, United Arab Emirates, Yemen.
Europe
Eastern Europe Belarus, Bulgaria, Czechia, Hungary, Poland, Republic of Moldova, Romania, Russian Federation, Slovakia, Ukraine.
Northern Europe Denmark, Estonia, Finland, Iceland, Ireland, Latvia, Lithuania, Norway, Sweden, United Kingdom of Great Britain and Northern Ireland.
Southern Europe Albania, Bosnia and Herzegovina, Croatia, Greece, Italy, Malta, Montenegro, Portugal, Republic of North Macedonia, Serbia, Slovenia, Spain.
Western Europe Austria, Belgium, France, Germany, Luxembourg, Netherlands, Switzerland.
Americas
Latin America and the Caribbean
Antigua and Barbuda, Argentina, Bahamas, Barbados, Belize, Bolivia (Plurinational State of), Brazil, Chile, Colombia, Costa Rica, Cuba, Dominica, Dominican Republic, Ecuador, El Salvador, Grenada, Guatemala, Guyana, Haiti, Honduras, Jamaica, Mexico, Nicaragua, Panama, Paraguay, Peru, Saint Kitts and Nevis, Saint Lucia, Saint Vincent and the Grenadines, Suriname, Trinidad and Tobago, Uruguay, Venezuela (Bolivarian Republic of).
Northern America Canada, United States of America
Oceania
Australia and New Zealand Australia and New Zealand
Melanesia, Micronesia, and Polynesia Fiji, Kiribati, Micronesia (Federated States of), Papua New Guinea, Samoa, Solomon Islands, Tonga, Vanuatu.
BMJ Publishing Group Limited (BMJ) disclaims all liability and responsibility arising from any relianceSupplemental material placed on this supplemental material which has been supplied by the author(s) BMJ Global Health
doi: 10.1136/bmjgh-2021-005671:e005671. 6 2021;BMJ Global Health, et al. Betran AP

4
Regions Countries
More developed countries
Albania, Australia, Austria, Belarus, Belgium, Bosnia and Herzegovina, Bulgaria, Canada, Croatia, Czechia, Denmark, Estonia, Finland, France, Germany, Greece, Hungary, Iceland, Ireland, Italy, Japan, Latvia, Lithuania, Luxembourg, Malta, Montenegro, Netherlands, New Zealand, Norway, Poland, Portugal, Republic of Moldova, Republic of North Macedonia, Romania, Russian Federation, Serbia, Slovakia, Slovenia, Spain, Sweden, Switzerland, Ukraine, United Kingdom of Great Britain and Northern Ireland.
Less developed countries
Afghanistan, Algeria, Angola, Antigua and Barbuda, Argentina, Armenia, Azerbaijan, Bahamas, Bahrain, Bangladesh, Barbados, Belize, Benin, Bhutan, Bolivia (Plurinational State of), Botswana, Brazil, Brunei Darussalam, Burkina Faso, Burundi, Cabo Verde, Cambodia, Cameroon, Central African Republic, Chad, Chile, China, Colombia, Comoros, Congo, Costa Rica, Côte d'Ivoire, Cuba, Cyprus, Democratic People's Republic of Korea, Democratic Republic of the Congo, Djibouti, Dominican Republic, Ecuador, Egypt, El Salvador, Equatorial Guinea, Eritrea, Ethiopia, Eswatini, Fiji, Gabon, Gambia, Georgia, Ghana, Grenada, Guatemala, Guinea, Guinea-Bissau, Guyana, Haiti, Honduras, India, Indonesia, Iran (Islamic Republic of), Iraq, Israel, Jamaica, Jordan, Kazakhstan, Kenya, Kiribati, Kuwait, Kyrgyzstan, Lao People's Democratic Republic, Lebanon, Lesotho, Liberia, State of Libya, Madagascar, Malawi, Malaysia, Maldives, Mali, Mauritania, Mauritius, Mexico, Micronesia (Federated States of), Mongolia, Morocco, Mozambique, Myanmar, Namibia, Nepal, Nicaragua, Niger, Nigeria, Oman, Pakistan, Panama, Papua New Guinea, Paraguay, Peru, Philippines, Puerto Rico, Qatar, Republic of Korea, Rwanda, Saint Lucia, Saint Vincent and the Grenadines, Samoa, Sao Tome and Principe, Saudi Arabia, Senegal, Seychelles, Sierra Leone, Singapore, Solomon Islands, Somalia, South Africa, South Sudan, Sri Lanka, Sudan, Suriname, Syrian Arab Republic, Tajikistan, Thailand, Timor-Leste, Togo, Tonga, Trinidad and Tobago, Tunisia, Turkey, Turkmenistan, Uganda, United Arab Emirates, United Republic of Tanzania, Uruguay, Uzbekistan, Vanuatu, Venezuela (Bolivarian Republic of), Viet Nam, Yemen, Zambia, Zimbabwe.
Least developed countries
Afghanistan, Angola, Bangladesh, Benin, Bhutan, Burkina Faso, Burundi, Cambodia, Central African Republic, Chad, Comoros, Democratic Republic of the Congo, Djibouti, Eritrea, Ethiopia, Gambia, Guinea, Guinea-Bissau, Haiti, Kiribati, Lao People’s Democratic Republic, Lesotho, Liberia, Madagascar, Malawi, Mali, Mauritania, Mozambique, Myanmar, Nepal, Niger, Rwanda, Sao Tome and Principe, Senegal, Sierra Leone, Solomon Islands, Somalia, South Sudan, Sudan, Timor-Leste, Togo, Uganda, United Republic of Tanzania, Vanuatu, Yemen, Zambia.
Source: UNPD region (https://unstats.un.org/unsd/methodology/m49/ ).
BMJ Publishing Group Limited (BMJ) disclaims all liability and responsibility arising from any relianceSupplemental material placed on this supplemental material which has been supplied by the author(s) BMJ Global Health
doi: 10.1136/bmjgh-2021-005671:e005671. 6 2021;BMJ Global Health, et al. Betran AP

5
3. Detailed description of statistical methods and codes
Statistical methods
Data imputation
As most countries did not have CS rate records yearly, we performed data imputation. First, we conducted a linear interpolation between available data points (observed CS rates) for each country. Second, missing values from 1990 through the first available data point and the latest available data point through 2018 were filled in using multiple imputations. A Markov chain Monte Carlo (MCMC) method with five imputations was performed to impute all the missing values of CS rate for each country.
Current global and regional caesarean section rates estimates
The latest available data from each country was used to calculate the current global and regional CS rates. Countries with the most recent available data in or after 2010 were included in this analysis. Countries were grouped according to the United Nations' geographical grouping. Regional and sub-regional averages for the proportion of CS were calculated as weighted means based on the country's share of live births in 2018 in the region or sub-region, respectively [using the original (Table 1) and imputed dataset (Appendixt Table 1), respectively]. The average difference between CS rate estimates using the original and the imputed datasets was calculated as the weighted mean and 95% confidence intervals of the difference between the estimate CS rates at subregional level using the two datasets respectively. "Coverage" was used as a measure to express how representative an estimate was regarding the region or sub-region. Regional and sub-regional coverage were calculated as the proportion of total regional and sub-regional live births for which nationally representative data on CS were available. Estimates for sub-regions with coverage less than 60% were not calculated.
Trends on caesarean section rates
We analyzed the piecewise trend of CS rates at the national, regional and global levels from 1990 to 2018 in three periods: 1990 to 2000, 2000 to 2010, and 2010 to 2018. Countries with a minimum of two data points (observed CS rates) within the period (1990 – 2018) were included in the analyses. We described the CS rate changes at the national, regional, sub-regional, and global levels using the imputed dataset. The CS rate changes at the national level were calculated by subtracting the earliest CS rate from the latest CS rate during each period. Regional, sub-regional and global averages for the CS rate changes were calculated as the weighted means of the CS rate changes at the national level using the number of live births of each country in 2005 as the weight.
Projections of caesarean section rates for 2030
We generated projections of CS rates in 2021, 2025 and 2030 to predict the trend of CS rates. Predictions were calculated using the autoregressive integrated moving-average (ARIMA) models fitted for the CS rate at the sub-regional level, which represented what would happen if the past decades' CS rate trajectory continued until 2030. The sub-regions were categorized into three groups based on the availability of nationally representative data on CS rates during the periods of 2010-2018, 2000-2018, or 1990-2018. Given the number of data points required for generating reliable projections of CS rates, the period of reference was determined based on the availability of nationally representative data on CS rates. Sub-regions with more than 80% of data on nationally CS rates from 2010 to 2018, we used data from this period to fit the ARIMA models. Sub-regions with more than 80% of data from 2000 to 2018, but with insufficient data from 2010 to 2018, CS rates from 2000 to 2018 were included for the projection. Sub-regions with less than 80% of data from 2000 to 2018, the ARIMA models were fitted with data for the whole period (1990-2018). Stationarity of the CS rate series was judged by examining the autocorrelation function plots (ACF). For non-stationary series, differencing was performed to transform it into a stationary series. The minimum information criterion (MINIC), extended sample autocorrelation function (ESACF) and the smallest canonical (SCAN) correlation method were performed to identify the orders of ARIMA processes tentatively. Candidate models with the smallest BIC statistics and the residuals' autocorrelations were non-significant at the level of 0.05 were selected. Based on the final selected models, we forecasted CS rates at sub-regional level in 2021, 2025, and 2030. The projections at the regional and global level were calculated as weighted means based on the share of live births by sub-region in the corresponding year.
BMJ Publishing Group Limited (BMJ) disclaims all liability and responsibility arising from any relianceSupplemental material placed on this supplemental material which has been supplied by the author(s) BMJ Global Health
doi: 10.1136/bmjgh-2021-005671:e005671. 6 2021;BMJ Global Health, et al. Betran AP

6
Codes
/*data imputation*/
/*MI*/ /* A total of 194 countries exclude: 14 countries csincount=0, 9 countries csincount=1, 8 countries csincount=2: these 8 countries with 1 observed cs rate records in two consecutive years, 9 countries with complete csincount=29 not need to do MI:DNK,EST,FIN,GBR,ISL,NOR,PRT,SWE,USA, A total of 154 countries need MI */ /*MCMC MI*/ /*MI var: csinter */ proc sort data=csinterext; by ISO_Code;run; /*estimate mi mu0*/ proc means data=csinterext; var csinter; weight lb; run; /*mi succeed in 113 countries (163-9(countries with complete data)-41(countries not complete mi) */ proc mi data=csinterext seed=100 out=csinmi1 nimpute=5 round=0.1 maximum=70 minimum=0 mu0=15; mcmc impute=full; var csinter year; by ISO_Code; where 2<csincount<29 and ISO_Code^="AFG" and ISO_Code^="AND" and ISO_Code^="ARE" and ISO_Code^="BDI" and ISO_Code^="CPV" and ISO_Code^="CYP" and ISO_Code^="FSM" and ISO_Code^="MDV" and ISO_Code^="SMR" and ISO_Code^="GUY" and ISO_Code^="SUR" and ISO_Code^="SWZ" and ISO_Code^="SLB" and ISO_Code^="BGD" and ISO_Code^="LAO" and ISO_Code^="BIH" and ISO_Code^="COD" and ISO_Code^="CHN" and ISO_Code^="GMB" and ISO_Code^="GNB" and ISO_Code^="IRQ" and ISO_Code^="LBR" and ISO_Code^="MCO" and ISO_Code^="MKD" and ISO_Code^="MYS" and ISO_Code^="NAM" and ISO_Code^="NPL" and ISO_Code^="PAN" and ISO_Code^="SAU" and ISO_Code^="SDN" and ISO_Code^="SRB" and ISO_Code^="TLS" and ISO_Code^="TON" and ISO_Code^="VNM" and ISO_Code^="WSM" and ISO_Code^="CAF" and ISO_Code^="PRK" and ISO_Code^="STP" and ISO_Code^="SYC" and ISO_Code^="UZB" and ISO_Code^="KHM"; run; /*retry mcmc mi in 41 countries*/ /* data retry; set csinterext;
BMJ Publishing Group Limited (BMJ) disclaims all liability and responsibility arising from any relianceSupplemental material placed on this supplemental material which has been supplied by the author(s) BMJ Global Health
doi: 10.1136/bmjgh-2021-005671:e005671. 6 2021;BMJ Global Health, et al. Betran AP

7
where ISO_Code="AFG" or ISO_Code="AND" or ISO_Code="ARE" or ISO_Code="BDI" /*or ISO_Code="CPV" or ISO_Code="CYP"*/ or ISO_Code="FSM" /*or ISO_Code="MDV"*/ or ISO_Code="SMR" or ISO_Code="GUY" or ISO_Code="SUR" /*or ISO_Code="SWZ" or ISO_Code="SLB"*/ or ISO_Code="BGD" or ISO_Code="LAO" or ISO_Code="BIH" or ISO_Code="COD" or ISO_Code="CHN" or ISO_Code="GMB" or ISO_Code="GNB" /*or ISO_Code="IRQ"*/ or ISO_Code="LBR" or ISO_Code="MCO" /*or ISO_Code="MKD"*/ or ISO_Code="MYS" or ISO_Code="NAM" /*or ISO_Code="NPL"*/ or ISO_Code="PAN" /*or ISO_Code="SAU"*/ or ISO_Code="SDN" or ISO_Code="SRB" or ISO_Code="TLS" or ISO_Code="TON" or ISO_Code="VNM" or ISO_Code="WSM" /*or ISO_Code="CAF" or ISO_Code="PRK" or ISO_Code="STP" or ISO_Code="SYC" or ISO_Code="UZB" or ISO_Code="KHM"*/; run; proc sort data=retry; by ISO_Code; run; proc mi data=retry seed=100 out=csinmi2 nimpute=5 round=0.1 maximum=100 minimum=0 mu0=15 MINMAXITER=1500; mcmc impute=full; var csinter year; by ISO_Code; run; */ /*retry1 mi succeed in 4 countries: MKD,SAU,SYC,UZB (increase minmaxiter)*/ data retry1; set csinterext; where ISO_Code="MKD" or ISO_Code="SAU" or ISO_Code="SYC" or ISO_Code="UZB"; run; proc sort data=retry1; by ISO_Code; run; proc mi data=retry1 seed=100 out=csinmiretry1 nimpute=5 round=0.1 maximum=100 minimum=0 mu0=15 MINMAXITER=1500; mcmc impute=full; var csinter year; by ISO_Code; run; /*retry2 mi succeeded in 7 countries (CPV,CYP,IRQ,MDV,NPL,SLB,SWZ) (increase em maxiter=1000)*/ data retry2; set csinterext; where ISO_Code="CPV" or ISO_Code="CYP" or ISO_Code="IRQ" or ISO_Code="MDV" or ISO_Code="NPL"
BMJ Publishing Group Limited (BMJ) disclaims all liability and responsibility arising from any relianceSupplemental material placed on this supplemental material which has been supplied by the author(s) BMJ Global Health
doi: 10.1136/bmjgh-2021-005671:e005671. 6 2021;BMJ Global Health, et al. Betran AP

8
or ISO_Code="SLB" or ISO_Code="SWZ"; run; proc sort data=retry2; by ISO_Code; run; proc mi data=retry2 seed=100 out=csinmiretry2 nimpute=5 round=0.1 maximum=100 minimum=0 mu0=15 MINMAXITER=3000; mcmc impute=full; em /*CONVERGE=0.001*/ maxiter=1000; var csinter year; by ISO_Code; run; /*retry3:3 countries (CAF, PRK, STP) WARNING: The posterior covariance matrix is singular. Imputed values for some variables may be fixed. */ data retry3; set csinterext; where ISO_Code="CAF" or ISO_Code="PRK" or ISO_Code="STP"; run; proc sort data=retry3; by ISO_Code; run; proc mi data=retry3 seed=100 out=csinmiretry3 nimpute=5 round=0.1 maximum=100 minimum=0 mu0=15 MINMAXITER=3000; mcmc impute=full; /*em CONVERGE=0.001;*/ var csinter year; by ISO_Code; run; /*retry4: 15 countries:BGD,BIH,CHN,COD,GMB,GNB, LAO, PAN, SDN, SRB, TLS, TON, VNM, WAM, KHM An imputed variable value is not in the specified range after 3000 tries. */ /*retry4_1: 6 countries:COD, GMB, PAN, TLS, VNM, KHM (minimum=-5)*/ data retry4_1; set csinterext; where ISO_Code="COD" or ISO_Code="GMB" or ISO_Code="PAN" or ISO_Code="TLS" or ISO_Code="VNM" or ISO_Code="KHM"; run; proc sort data=retry4_1; by ISO_Code; run; proc mi data=retry4_1 seed=100 out=csinmiretry4_1 nimpute=5 round=0.1 maximum=100 minimum=-5 mu0=15 MINMAXITER=8000; mcmc impute=full;
BMJ Publishing Group Limited (BMJ) disclaims all liability and responsibility arising from any relianceSupplemental material placed on this supplemental material which has been supplied by the author(s) BMJ Global Health
doi: 10.1136/bmjgh-2021-005671:e005671. 6 2021;BMJ Global Health, et al. Betran AP

9
em maxiter=1000; var csinter year; by ISO_Code; run; proc univariate data=csinmiretry4_1; var csinter; run; /*retry4_2 in 8 countries: An imputed variable value is not in the specified range after 8000 tries. ISO_Code="BGD" or ISO_Code="CHN" or ISO_Code="LAO" or ISO_Code="SRB" or ISO_Code="TON" or ISO_Code="GNB" or ISO_Code="WSM" or ISO_Code="SDN" minimum=-10 */ data retry4_2; set csinterext; where ISO_Code="BGD" or ISO_Code="CHN" or ISO_Code="LAO" or ISO_Code="SRB" or ISO_Code="TON" or ISO_Code="GNB" or ISO_Code="WSM" or ISO_Code="SDN"; run; proc sort data=retry4_2; by ISO_Code; run; proc mi data=retry4_2 seed=100 out=csinmiretry4_2 nimpute=5 round=0.1 maximum=100 minimum=-10 mu0=15 MINMAXITER=10000; mcmc impute=full; em CONVERGE=0.001 maxiter=2000; var csinter year; by ISO_Code; run; proc univariate data=csinmiretry4_2; var csinter; run; /*retry4-3:BIH minimum=-15 */ data retry4_3; set csinterext; where ISO_Code="BIH"; run; proc mi data=retry4_3 seed=100 out=csinmiretry4_3 nimpute=5 round=0.1 maximum=100 minimum=-25 mu0=15 MINMAXITER=10000; mcmc impute=full; em CONVERGE=0.001 maxiter=500; var csinter year;
BMJ Publishing Group Limited (BMJ) disclaims all liability and responsibility arising from any relianceSupplemental material placed on this supplemental material which has been supplied by the author(s) BMJ Global Health
doi: 10.1136/bmjgh-2021-005671:e005671. 6 2021;BMJ Global Health, et al. Betran AP

10
run; proc univariate data=csinmiretry4_3; var csinter; run; /*csinmiretry4*/ data csinmiretry4 (rename=(csinterrev=csinter)); set csinmiretry4_1-csinmiretry4_3; if csinter>=0 then csinterrev=csinter; if csinter<0 then csinterrev=0; drop csinter; run; /*retry5: 12 countries:ISO_Code="AFG" or ISO_Code="AND" or ISO_Code="ARE" or ISO_Code="BDI" or ISO_Code="FSM" or ISO_Code="SMR" or ISO_Code="GUY" or ISO_Code="SUR" or ISO_Code="LBR" or ISO_Code="MCO" or ISO_Code="MYS" or ISO_Code="NAM" (em CONVERGE=0.001 maxiter=1000) */ data retry5; set csinterext; where ISO_Code="AFG" or ISO_Code="AND" or ISO_Code="ARE" or ISO_Code="BDI" or ISO_Code="FSM" or ISO_Code="SMR" or ISO_Code="GUY" or ISO_Code="SUR" or ISO_Code="LBR" or ISO_Code="MCO" or ISO_Code="MYS" or ISO_Code="NAM" ; run; proc sort data=retry5; by ISO_Code; run; proc mi data=retry5 seed=100 out=csinmiretry5 nimpute=5 round=0.1 maximum=100 minimum=0 mu0=15 MINMAXITER=10000; mcmc impute=full; em CONVERGE=0.001 maxiter=2000; var csinter year; by ISO_Code; run; /*combine data csinmi (163 countries) 9 countries with complete csinter (completere) +113 countries MI(cdinmi1) + 4 countries retry MI(csinmiretry1) +7 countries (csinmiretry2) +3 countries (csinmiretry3) +15 countries (csinmiretry4): including 6 countries(csinmitrtry4_1)+ 8 countries (csinmiretry4_2)+1 country (csinmiretry4_3) +12 countries (csinmiretry5) =163 countries included in data csinmi*/
BMJ Publishing Group Limited (BMJ) disclaims all liability and responsibility arising from any relianceSupplemental material placed on this supplemental material which has been supplied by the author(s) BMJ Global Health
doi: 10.1136/bmjgh-2021-005671:e005671. 6 2021;BMJ Global Health, et al. Betran AP

11
data csinmi; set completere csinmi1 csinmiretry1-csinmiretry5; run;
/* Current global and regional caesarean section rates estimates*/
/*cs by region*/ /*cs*/ proc sql; create table cscrossinmiregion as select distinct Region_Name, count(csinter) as csnum, sum(csinter*lb2018)/sum(lb2018) as lastcs,min (csinter) as mincs,max(csinter) as maxcs,sum(csinter*lb2018)/100*1000 as lastcsnum,sum(lb2018)*1000 as lastlbnum from Cslastcrossinmiave where lb2018^=. and lastcsinyear>=2010 group by Region_Name order by Region_Name; quit; /*coverage*/ data cscrossinmiregion; merge cscrossinmiregion cs.lbregion; coverage=lastlbnum/lbregion2018*100; drop lbregion1990-lbregion2017; run;
/*lastcs by un subregion*/
/*cs*/ proc sql; create table cscrossinmisubregion as select distinct Region_Name, Sub_region_Name, count(csinter) as csnum, sum(csinter*lb2018)/sum(lb2018) as lastcs,min (csinter) as mincs,max(csinter) as maxcs,sum(csinter*lb2018)/100*1000 as lastcsnum,sum(lb2018)*1000 as lastlbnum from Cslastcrossinmiave where lb2018^=. and lastcsinyear>=2010 group by Sub_region_Name order by Region_Name,Sub_region_Name; quit; /*coverage*/ data cscrossinmisubregion; merge cscrossinmisubregion cs.lbsubregion; coverage=lastlbnum/lbsubregion2018*100; drop lbsubregion1990-lbsubregion2017; run;
/*lastcs world total*/ /*cs*/ proc sql; create table cscrossinmiworld as select distinct count(csinter) as csnum, sum(csinter*lb2018)/sum(lb2018) as lastcs,min (csinter) as mincs,max(csinter) as maxcs,sum(csinter*lb2018)/100*1000 as lastcsnum,sum(lb2018)*1000 as lastlbnum from Cslastcrossinmiave where lb2018^=. and lastcsinyear>=2010; quit; /*coverage*/
BMJ Publishing Group Limited (BMJ) disclaims all liability and responsibility arising from any relianceSupplemental material placed on this supplemental material which has been supplied by the author(s) BMJ Global Health
doi: 10.1136/bmjgh-2021-005671:e005671. 6 2021;BMJ Global Health, et al. Betran AP

12
data cscrossinmiworld; merge cscrossinmiworld cs.lbworld; coverage=lastlbnum/lbworld2018*100; drop lbworld1990-lbworld2017; run; /*lastcs by develop3*/ /*cs*/ proc sql; create table cscrossinmidevelop as select distinct develop3, count(csinter) as csnum, sum(csinter*lb2018)/sum(lb2018) as lastcs,min (csinter) as mincs,max(csinter) as maxcs,sum(csinter*lb2018)/100*1000 as lastcsnum,sum(lb2018)*1000 as lastlbnum from Cslastcrossinmiave where lb2018^=. and lastcsinyear>=2010 group by develop3 order by develop3; quit; /*coverage*/ data cscrossinmidevelop; merge cscrossinmidevelop cs.lbdevelop; coverage=lastlbnum/lbdevelop2018*100; drop lbdevelop1990-lbdevelop2017; run; /* Trends on caesarean section rates*/ /*by region*/ proc sort data=csinmiavehor; by Region_Name; run; /*change9000*/ proc glimmix data=csinmiavehor method=laplace; /* conditional mean */ class ISO_Code; model changenum9000/lb2005num = /solution; random intercept/subject=ISO_Code; estimate 'intercept' intercept 1 / cl ilink; by Region_Name; run; /*change0010*/ proc glimmix data=csinmiavehor method=laplace; /* conditional mean */ class ISO_Code; model changenum0010/lb2005num = /solution; random intercept/subject=ISO_Code; estimate 'intercept' intercept 1 / cl ilink; by Region_Name; run; /*change1018*/ proc glimmix data=csinmiavehor method=laplace; /* conditional mean */ class ISO_Code; model changenum1018/lb2005num = /solution; random intercept/subject=ISO_Code; estimate 'intercept' intercept 1 / cl ilink; by Region_Name; run; /*change9018*/ proc glimmix data=csinmiavehor method=laplace; /* conditional mean */
BMJ Publishing Group Limited (BMJ) disclaims all liability and responsibility arising from any relianceSupplemental material placed on this supplemental material which has been supplied by the author(s) BMJ Global Health
doi: 10.1136/bmjgh-2021-005671:e005671. 6 2021;BMJ Global Health, et al. Betran AP

13
class ISO_Code; model changenum9018/lb2005num = /solution; random intercept/subject=ISO_Code; estimate 'intercept' intercept 1 / cl ilink; by Region_Name; run; /*by subregion*/ proc sort data=csinmiavehor; by Region_Name Sub_region_Name; run; /*change9000*/ proc glimmix data=csinmiavehor method=laplace; /* conditional mean */ class ISO_Code; model changenum9000/lb2005num = /solution; random intercept/subject=ISO_Code; estimate 'intercept' intercept 1 / cl ilink; by Region_Name Sub_region_Name; run; /*change0010*/ proc glimmix data=csinmiavehor method=laplace; /* conditional mean */ class ISO_Code; model changenum0010/lb2005num = /solution; random intercept/subject=ISO_Code; estimate 'intercept' intercept 1 / cl ilink; by Region_Name Sub_region_Name; run; /*change1018*/ proc glimmix data=csinmiavehor method=laplace; /* conditional mean */ class ISO_Code; model changenum1018/lb2005num = /solution; random intercept/subject=ISO_Code; estimate 'intercept' intercept 1 / cl ilink; by Region_Name Sub_region_Name; run; /*change9018*/ proc glimmix data=csinmiavehor method=laplace; /* conditional mean */ class ISO_Code; model changenum9018/lb2005num = /solution; random intercept/subject=ISO_Code; estimate 'intercept' intercept 1 / cl ilink; by Region_Name Sub_region_Name; run; /* Projections of caesarean section rates for 2030*/ /*Northern Africa*/ ods output Forecasts=pnorafr; proc arima data=csinmiregsubdev; identify var=csinter(1) minic scan esacf stationarity=(adf=(5,6,7,8)); where Sub_region_Name="Northern Africa"; estimate p=4 q=0 plot; forecast lead=12 interval=year id=time out=results; run; quit;
BMJ Publishing Group Limited (BMJ) disclaims all liability and responsibility arising from any relianceSupplemental material placed on this supplemental material which has been supplied by the author(s) BMJ Global Health
doi: 10.1136/bmjgh-2021-005671:e005671. 6 2021;BMJ Global Health, et al. Betran AP

14
ods output close; data pnorafr; set pnorafr; Region_Name="Africa"; Sub_region_Name="Northern Africa"; run; data norafr ; set results; Region_Name="Africa"; Sub_region_Name="Northern Africa"; where time=mdy(1,1,2021) or time=mdy(1,1,2025) or time=mdy(1,1,2030); run; /*Sub-Saharan Africa*/ ods output Forecasts=psubafr; proc arima data=csinmiregsubdev; identify var=csinter(3) minic scan esacf stationarity=(adf=(5,6,7,8)); where Sub_region_Name="Sub-Saharan Africa"; estimate p=0 q=1 plot; forecast lead=12 interval=year id=time out=results; run; quit; ods output close; data psubafr; set psubafr; Region_Name="Africa"; Sub_region_Name="Sub-Saharan Africa"; run; data subafr ; set results; Region_Name="Africa"; Sub_region_Name="Sub-Saharan Africa"; where time=mdy(1,1,2021) or time=mdy(1,1,2025) or time=mdy(1,1,2030); run; /*Latin America and the Caribbean*/ ods output Forecasts=platame; proc arima data=csinmiregsubdev; identify var=csinter(2) minic scan esacf stationarity=(adf=(5,6,7,8)); where Sub_region_Name="Latin America and the Caribbean"; estimate p=0 q=1 plot; forecast lead=12 interval=year id=time out=results; run; quit; ods output close; data platame; set platame; Region_Name="Americas"; Sub_region_Name="Latin America and the Caribbean"; run;
BMJ Publishing Group Limited (BMJ) disclaims all liability and responsibility arising from any relianceSupplemental material placed on this supplemental material which has been supplied by the author(s) BMJ Global Health
doi: 10.1136/bmjgh-2021-005671:e005671. 6 2021;BMJ Global Health, et al. Betran AP

15
data latame ; set results; Region_Name="Americas"; Sub_region_Name="Latin America and the Caribbean"; where time=mdy(1,1,2021) or time=mdy(1,1,2025) or time=mdy(1,1,2030); run; /*Northern America*/ ods output Forecasts=pnorame; proc arima data=csinmiregsubdev; identify var=csinter(1) nlag=6 minic scan esacf stationarity=(adf=(1,2,3)); where Sub_region_Name="Northern America" and 2005<=year<=2018; estimate p=1 q=1 plot; forecast lead=12 interval=year id=time out=results; run; quit; ods output close; data pnorame; set pnorame; Region_Name="Americas"; Sub_region_Name="Northern America"; run; data norame ; set results; Region_Name="Americas"; Sub_region_Name="Northern America"; where time=mdy(1,1,2021) or time=mdy(1,1,2025) or time=mdy(1,1,2030); run; /*Central Asia*/ ods output Forecasts=pcenasi; proc arima data=csinmiregsubdev; identify var=csinter(1,1) nlag=6 minic scan esacf stationarity=(adf=(1,2,3)); where Sub_region_Name="Central Asia" and 2000<=year<=2018; estimate p=0 q=3 plot; forecast lead=12 interval=year id=time out=results; run; quit; ods output close; data pcenasi; set pcenasi; Region_Name="Asia"; Sub_region_Name="Central Asia"; run; data cenasi ; set results; Region_Name="Asia"; Sub_region_Name="Central Asia"; where time=mdy(1,1,2021) or time=mdy(1,1,2025) or time=mdy(1,1,2030); run;
BMJ Publishing Group Limited (BMJ) disclaims all liability and responsibility arising from any relianceSupplemental material placed on this supplemental material which has been supplied by the author(s) BMJ Global Health
doi: 10.1136/bmjgh-2021-005671:e005671. 6 2021;BMJ Global Health, et al. Betran AP

16
/*Eastern Asia*/ ods output Forecasts=peasasi; proc arima data=csinmiregsubdev; identify var=csinter(2) minic scan esacf stationarity=(adf=(5,6,7,8)); where Sub_region_Name="Eastern Asia"; estimate p=4 q=0 plot; forecast lead=12 interval=year id=time out=results; run; quit; ods output close; data peasasi; set peasasi; Region_Name="Asia"; Sub_region_Name="Eastern Asia"; run; data easasi ; set results; Region_Name="Asia"; Sub_region_Name="Eastern Asia"; where time=mdy(1,1,2021) or time=mdy(1,1,2025) or time=mdy(1,1,2030); run; /*South-eastern Asia*/ ods output Forecasts=psoueasasi; proc arima data=csinmiregsubdev; identify var=csinter(3) minic scan esacf stationarity=(adf=(5,6,7,8)); where Sub_region_Name="South-eastern Asia"; estimate p=2 q=0 plot; forecast lead=12 interval=year id=time out=results; run; quit; ods output close; data psoueasasi; set psoueasasi; Region_Name="Asia"; Sub_region_Name="South-eastern Asia"; run; data soueasasi ; set results; Region_Name="Asia"; Sub_region_Name="South-eastern Asia"; where time=mdy(1,1,2021) or time=mdy(1,1,2025) or time=mdy(1,1,2030); run; /*Southern Asia*/ ods output Forecasts=psouasi; proc arima data=csinmiregsubdev; identify var=csinter(2) minic scan esacf stationarity=(adf=(5,6,7,8)); where Sub_region_Name="Southern Asia"; estimate p=2 q=1 plot;
BMJ Publishing Group Limited (BMJ) disclaims all liability and responsibility arising from any relianceSupplemental material placed on this supplemental material which has been supplied by the author(s) BMJ Global Health
doi: 10.1136/bmjgh-2021-005671:e005671. 6 2021;BMJ Global Health, et al. Betran AP

17
forecast lead=12 interval=year id=time out=results; run; quit; ods output close; data psouasi; set psouasi; Region_Name="Asia"; Sub_region_Name="Southern Asia"; run; data souasi ; set results; Region_Name="Asia"; Sub_region_Name="Southern Asia"; where time=mdy(1,1,2021) or time=mdy(1,1,2025) or time=mdy(1,1,2030); run; /*Western Asia*/ ods output Forecasts=pwesasi; proc arima data=csinmiregsubdev; identify var=csinter(5) nlag=6 minic scan esacf stationarity=(adf=(5,6,7,8)); where Sub_region_Name="Western Asia"; estimate p=0 q=1 plot; forecast lead=12 interval=year id=time out=results; run; quit; ods output close; data pwesasi; set pwesasi; Region_Name="Asia"; Sub_region_Name="Western Asia"; run; data wesasi ; set results; Region_Name="Asia"; Sub_region_Name="Western Asia"; where time=mdy(1,1,2021) or time=mdy(1,1,2025) or time=mdy(1,1,2030); run; /*Eastern Europe*/ ods output Forecasts=peaseur; proc arima data=csinmiregsubdev; identify var=csinter(2) minic scan esacf nlag=6 stationarity=(adf=(5,6,7,8)); where Sub_region_Name="Eastern Europe"; estimate p=0 q=2 plot; forecast lead=12 interval=year id=time out=results; run; quit; ods output close; data peaseur; set peaseur;
BMJ Publishing Group Limited (BMJ) disclaims all liability and responsibility arising from any relianceSupplemental material placed on this supplemental material which has been supplied by the author(s) BMJ Global Health
doi: 10.1136/bmjgh-2021-005671:e005671. 6 2021;BMJ Global Health, et al. Betran AP

18
Region_Name="Europe"; Sub_region_Name="Eastern Europe"; run; data easeur ; set results; Region_Name="Europe"; Sub_region_Name="Eastern Europe"; where time=mdy(1,1,2021) or time=mdy(1,1,2025) or time=mdy(1,1,2030); run; /*Northern Europe*/ /* After any differencing is performed, at least six (6) observations are required by the ARIMA procedure for the identification step. */ ods output Forecasts=pnoreur; proc arima data=csinmiregsubdev; identify var=csinter(1,1) nlag=6 minic scan esacf stationarity=(adf=(1,2,3)); where Sub_region_Name="Northern Europe" and 2005<=year<=2018; estimate p=0 q=0 plot; forecast lead=12 interval=year id=time out=results; run; quit; ods output close; data pnoreur; set pnoreur; Region_Name="Europe"; Sub_region_Name="Northern Europe"; run; data noreur ; set results; Region_Name="Europe"; Sub_region_Name="Northern Europe"; where time=mdy(1,1,2021) or time=mdy(1,1,2025) or time=mdy(1,1,2030); run; /*Southern Europe*/ ods output Forecasts=psoueur; proc arima data=csinmiregsubdev; identify var=csinter(3) nlag=6 minic scan esacf stationarity=(adf=(5,6,7,8)); where Sub_region_Name="Southern Europe"; estimate p=2 q=0 plot; forecast lead=12 interval=year id=time out=results; run; quit; ods output close; data psoueur; set psoueur; Region_Name="Europe"; Sub_region_Name="Southern Europe"; run; data soueur ;
BMJ Publishing Group Limited (BMJ) disclaims all liability and responsibility arising from any relianceSupplemental material placed on this supplemental material which has been supplied by the author(s) BMJ Global Health
doi: 10.1136/bmjgh-2021-005671:e005671. 6 2021;BMJ Global Health, et al. Betran AP

19
set results; Region_Name="Europe"; Sub_region_Name="Southern Europe"; where time=mdy(1,1,2021) or time=mdy(1,1,2025) or time=mdy(1,1,2030); run; /*Western Europe*/ ods output Forecasts=pweseur; proc arima data=csinmiregsubdev; identify var=csinter(3) nlag=6 minic scan esacf stationarity=(adf=(5,6,7,8)); where Sub_region_Name="Western Europe"; estimate p=2 q=0 plot; forecast lead=12 interval=year id=time out=results; run; quit; ods output close; data pweseur; set pweseur; Region_Name="Europe"; Sub_region_Name="Western Europe"; run; data weseur ; set results; Region_Name="Europe"; Sub_region_Name="Western Europe"; where time=mdy(1,1,2021) or time=mdy(1,1,2025) or time=mdy(1,1,2030); run; /*Australia and New Zealand*/ ods output Forecasts=pausoce; proc arima data=csinmiregsubdev; identify var=csinter(1) nlag=6 minic scan esacf stationarity=(adf=(1,2,3)); where Sub_region_Name="Australia and New Zealand" and 1990<=year<=2018; estimate p=1 q=0 plot; forecast lead=12 interval=year id=time out=results; run; quit; ods output close; data pausoce; set pausoce; Region_Name="Oceania"; Sub_region_Name="Australia and New Zealand"; run; data ausoce ; set results; Region_Name="Oceania"; Sub_region_Name="Australia and New Zealand"; where time=mdy(1,1,2021) or time=mdy(1,1,2025) or time=mdy(1,1,2030); run; data subregionarima; set Norafr Subafr Latame Norame Cenasi Easasi Soueasasi Souasi Wesasi Easeur Noreur Soueur Weseur Ausoce;
BMJ Publishing Group Limited (BMJ) disclaims all liability and responsibility arising from any relianceSupplemental material placed on this supplemental material which has been supplied by the author(s) BMJ Global Health
doi: 10.1136/bmjgh-2021-005671:e005671. 6 2021;BMJ Global Health, et al. Betran AP

20
run;
BMJ Publishing Group Limited (BMJ) disclaims all liability and responsibility arising from any relianceSupplemental material placed on this supplemental material which has been supplied by the author(s) BMJ Global Health
doi: 10.1136/bmjgh-2021-005671:e005671. 6 2021;BMJ Global Health, et al. Betran AP

21
4. Supplementary tables and other results
Supplementary table 1: Caesarean section rates in countries categorised according to United Nations geographical grouping in 2018a using imputed data
Region/subregion Estimated CS rate (%, 95% CI)
Range (min-max, %)
Coverage of estimates (%)
Africa (n=44) 10.1 (5.6, 14.5) 1.3-60.4 89.8
Northern Africa (n=5) 36.0 (5.2, 66.8) 12.2-60.4 97.9
Sub-Saharan Africa (n=39) 5.7 (4.0, 7.4) 1.3-53.9 88.6
Asia (n=40) 26.4 (21.6, 31.2) 4.3-62.7 96.9
Central Asia (n=5) 11.9 (6.4, 17.4) 5.4-17.5 100.0
Eastern Asia (n=5) 46.3 (35.5, 57.2) 13.0-48.8 100.0
South-eastern Asia (n=8) 18.0 (10.6, 25.4) 4.7-36.6 94.9
Southern Asia (n=7) 18.2 (12.9, 23.5) 4.3-41.3 96.6
Western Asia (n=15) 35.1 (24.4, 45.8) 7.9-62.7 91.7
Europe (n=38) 29.5 (27.0, 32.1) 14.9-44.0 98.9
Eastern Europe (n=10) 29.8 (24.1, 35.5) 18.8-44.0 100.0
Northern Europe (n=10) 25.9 (21.9, 29.9) 15.9-34.3 100.0
Southern Europe (n=11) 35.7 (31.1, 40.4) 22.6-42.9 93.3
Western Europe (n=7) 27.6 (20.4, 34.9) 14.9-36.8 100.0
Americas (n=25) 41.3 (35.8, 46.8) 6.8-63.4 93.8
Latin America and the Caribbean (n=23) 45.8 (39.7, 51.8) 6.8-63.4 91.1
Northern America (n=2) 31.8 (28.5, 35.1) 31.0-31.9 100.0
Oceania (n=7) 22.3 (6.5, 38.1) 0.0-36.6 96.5
Australia and New Zealand (n=2) 35.1 (-7.3, 77.6) 27.6-36.6 100.0
Melanesia, Micronesia, and Polynesia (n=5)
3.6 (-0.5, 7.7) 0.0-28.5 91.9
World total (n=154) 23.4 (20.6, 26.1) 0.0-63.4 94.5
More developed countries (n=45) 29.8 (27.9, 31.8) 14.9-58.3 99.4
Less developed countries (n=70) 27.2 (22.9, 31.5) 0.0-63.4 94.6
Least developed countries (n=39) 8.9 (6.1, 11.7) 1.3-31.8 91.9 a Countries with the latest CS rate record available in 2010 or later were included.
BMJ Publishing Group Limited (BMJ) disclaims all liability and responsibility arising from any relianceSupplemental material placed on this supplemental material which has been supplied by the author(s) BMJ Global Health
doi: 10.1136/bmjgh-2021-005671:e005671. 6 2021;BMJ Global Health, et al. Betran AP

22
Supplementary table 2: Number of observed caesarean section rate data points and sampling period for projections.
Region/subregion 2010-2018
2000-2018
1990-2018
Sampling period
Data points (N)
Proportion (%)
Data points (N)
Proportion (%)
Data points (N)
Proportion (%)
Africa
Northern Africa 14 31.1 29 30.5 41 28.3 1990-2018
Sub-Saharan Africa 95 24.5 222 27.2 310 24.9 1990-2018
Asia
Central Asia 34 75.6 84 88.4 128 88.3 2000-2018
Eastern Asia 12 26.7 27 28.4 37 25.5 1990-2018
South-eastern Asia 18 25.0 43 28.3 62 26.7 1990-2018
Southern Asia 25 34.7 57 37.5 67 28.9 1990-2018
Western Asia 81 56.3 164 53.9 223 48.1 1990-2018
Europe
Eastern Europe 56 62.2 150 78.9 234 80.7 1990-2018
Northern Europe 85 94.4 185 97.4 282 97.2 2005-2018
Southern Europe 71 60.7 170 68.8 243 64.5 1990-2018
Western Europe 54 75.0 115 75.7 158 68.1 1990-2018
Americas
Latin America and the Caribbean
86 41.5 203 46.5 288 43.2 1990-2018
Northern America 15 83.3 35 92.1 51 87.9 2005-2018
Oceania
Australia and New Zealand
16 88.9 36 94.7 46 79.3 1990-2018
World total
More developed countries
311 72.0 721 79.1 1056 75.9 1990-2018
Less developed countries
272 39.8 627 43.4 878 39.8 1990-2018
Least developed countries
85 24.2 196 26.5 260 23.0 1990-2018
BMJ Publishing Group Limited (BMJ) disclaims all liability and responsibility arising from any relianceSupplemental material placed on this supplemental material which has been supplied by the author(s) BMJ Global Health
doi: 10.1136/bmjgh-2021-005671:e005671. 6 2021;BMJ Global Health, et al. Betran AP

23
Supplementary table 3: Predicted caesarean section rates and numbers using autoregressive integrated moving-average models globaly, by region and sub-region.
Region/subregion a 2021 2025 2030
CS rate (%, 95% CI)
Number of CS (95% CI)
CS rate (%, 95% CI)
Number of CS (95% CI)
CS rate (%, 95% CI)
Number of CS (95% CI)
Africa (n=48) 10.4 (9.6, 11.3)
4366667 (4018732, 4714603)
11.0 (9.5, 12.5)
4820849 (4162233, 5479465)
12.0 (10.1, 13.9)
5579213 (4682901, 6475526)
Northern Africa (n=5) 39.0 (35.1, 42.8)
2140126 (1928253, 2351999)
42.1 (34.3, 49.9)
2285559 (1860664, 2710454)
48.1 (37.4, 58.8)
2648794 (2059522, 3238067)
Sub-Saharan Africa (n=43) 6.1 (5.7,
6.5)
2226542 (2090480, 2362604)
6.6 (6.0, 7.2)
2535290 (2301569, 2769011)
7.1 (6.4, 7.9)
2930419 (2623380, 3237459)
Asia (n=42) 28.5 (25.6, 31.4)
20251726 (18182738, 22320715)
30.6 (25.8, 35.5)
21098704 (17767704, 24429703)
35.2 (29.6, 40.8)
23448681 (19698915, 27198447)
Central Asia (n=5) 11.9 (10.5, 13.4)
176552 (154551, 198554)
12.4 (7.6,
17.2)
172422 (105479, 239365)
13.3 (2.0,
24.6)
179322 (27261, 331382)
Eastern Asia (n=5) 50.6 (44.9, 56.4)
8674013 (7686903, 9661124)
54.7 (45.2, 64.2)
8763514 (7243904, 10283123)
63.4 (52.9, 74.0)
9614950 (8015153, 11214747)
South-eastern Asia (n=8) 20.2 (19.1, 21.3)
2128241 (2014104, 2242379)
22.4 (20.7, 24.1)
2309804 (2133707, 2485900)
25.3 (23.2, 27.4)
2542985 (2331166, 2754803)
Southern Asia (n=8) 19.4 (17.0, 21.7)
7069469 (6210630, 7928309)
20.9 (16.8, 24.9)
7446897 (6001887, 8891907)
24.2 (19.4, 28.9)
8353151 (6719198, 9987103)
Western Asia (n=16) 40.5 (38.9, 42.1)
2203450 (2116551, 2290349)
44.1 (41.8, 46.3)
2406067 (2282727, 2529408)
50.2 (47.4, 52.9)
2758274 (2606137, 2910412)
Europe (n=38) 31.3 (28.5, 34.1)
2334577 (2123342, 2545812)
33.2 (28.5, 38.0)
2380762 (2042680, 2718844)
36.5 (29.7, 43.3)
2509184 (2044674, 2973693)
Eastern Europe (n=10) 31.2 (27.8, 34.6)
954184 (849860, 1058508)
34.3 (29.9, 38.7)
968045 (844397, 1091694)
38.3 (32.9, 43.6)
993099 (854021, 1132177)
Northern Europe (n=10) 26.4 (24.8, 28.1)
328468 (307637, 349300)
27.0 (21.7, 32.3)
330610 (265760, 395460)
27.6 (16.2, 39.1)
331373 (194448, 468298)
Southern Europe (n=11) 39.1 (35.8, 42.3)
454396 (416561, 492231)
41.7 (35.4, 48.0)
471877 (400917, 542838)
47.0 (38.8, 55.3)
527454 (434850, 620058)
Western Europe (n=7) 30.0 (27.5, 32.4)
597528 (549284, 645773)
30.7 (26.7, 34.7)
610229 (531606, 688852)
33.5 (28.7, 38.4)
657258 (561355, 753161)
BMJ Publishing Group Limited (BMJ) disclaims all liability and responsibility arising from any relianceSupplemental material placed on this supplemental material which has been supplied by the author(s) BMJ Global Health
doi: 10.1136/bmjgh-2021-005671:e005671. 6 2021;BMJ Global Health, et al. Betran AP

24
Americas (n=25) 42.6 (40.0, 45.2)
6117950 (5745393, 6490506)
44.6 (39.8, 49.4)
6322345 (5642561, 7002130)
47.2 (39.6, 54.9)
6537574 (5478009, 7597139)
Latin America and the Caribbean (n=23)
47.5 (44.6, 50.5)
4626678 (4339223, 4914133)
50.5 (46.0, 55.0)
4772742 (4346811, 5198673)
54.3 (48.3, 60.2)
4929455 (4392984, 5465927)
Northern America (n=2) 32.2
(30.4, 34)
1491272 (1406171, 1576373)
32.8 (27.4, 38.2)
1549603 (1295750, 1803457)
33.8 (22.8, 44.8)
1608119 (1085025, 2131213)
Oceania (n=6) 36.4 (34.3, 38.5)
148196 (139587, 156806)
39.2 (34.8, 43.7)
160148 (141941, 178355)
42.3 (35.6, 48.9)
172754 (145525, 199984)
Australia and New Zealand (n=2)
38.5 (36.3, 40.7)
146375 (138006, 154745)
41.6 (37.0, 46.3)
158302 (140565, 176038)
45.0 (38.1, 52.0)
170911 (144559, 197262)
World total (n=159) 24.6 (22.3, 26.8)
33219117 (30209793, 36228441)
25.9 (22.1, 29.6)
34782808 (29757119, 39808497)
28.5 (23.9, 33.1)
38247407 (32050024, 44444789)
More developed countries (n=45)
31.4 (29.5, 33.3)
4280118 (4020425, 4539811)
33.7 (30.4, 37.1)
4521314 (4070733, 4971896)
36.6 (31.7, 41.4)
4802717 (4167930, 5437504)
Less developed countries (n=75)
30.2 (28.5, 31.8)
27602787 (26117568, 29088006)
33.7 (30.5, 36.8)
30206101 (27357034, 33055169)
36.5 (32.7, 40.3)
32197073 (28821362, 35572785)
Least developed countries (n=39) 9.0 (7.9,
10.1)
2692984 (2358436, 3027533)
10.1 (8.5,
11.8)
3177239 (2654085, 3700394)
11.8 (9.7,
13.8)
3879770 (3196387, 4563152)
a Countries categorized according to the UN geographical grouping.
BMJ Publishing Group Limited (BMJ) disclaims all liability and responsibility arising from any relianceSupplemental material placed on this supplemental material which has been supplied by the author(s) BMJ Global Health
doi: 10.1136/bmjgh-2021-005671:e005671. 6 2021;BMJ Global Health, et al. Betran AP

25
Supplementary table 4: Projections of CS rates, number of births, number of CS and estimated CS-related mortality by geographic subregion and year (2021-2030).
Sub-region Year
Projected CS rate
(95% CI)
Projected
number of
live births
Estimated
number of
CS
Northern Africa 2021 39% (35,1% -42,8%) 5493805 2140126
Northern Africa 2022 38,7% (33,6% -43,8%) 5471991 2116814
Northern Africa 2023 39,9% (33,5% -46,2%) 5453542 2174780
Northern Africa 2024 42% (35% -49,1%) 5439749 2285742
Northern Africa 2025 42,1% (34,3% -49,9%) 5432088 2285559
Northern Africa 2026 42,9% (34,3% -51,6%) 5431758 2331379
Northern Africa 2027 45,1% (35,9% -54,3%) 5438879 2452970
Northern Africa 2028 45,5% (35,8% -55,2%) 5453251 2480283
Northern Africa 2029 46% (35,8% -56,3%) 5474665 2520490
Northern Africa 2030 48,1% (37,4% -58,8%) 5503036 2648794
Sub-Saharan Africa 2021 6,1% (5,7% -6,5%) 36385972 2226542
Sub-Saharan Africa 2022 6,3% (5,8% -6,7%) 36895590 2307859
Sub-Saharan Africa 2023 6,2% (5,7% -6,8%) 37408921 2332648
Sub-Saharan Africa 2024 6,5% (5,9% -7%) 37925355 2449514
Sub-Saharan Africa 2025 6,6% (6% -7,2%) 38444633 2535290
Sub-Saharan Africa 2026 6,6% (5,9% -7,2%) 38966568 2562085
Sub-Saharan Africa 2027 6,8% (6,2% -7,4%) 39490156 2684667
Sub-Saharan Africa 2028 6,9% (6,2% -7,6%) 40013835 2774638
Sub-Saharan Africa 2029 6,9% (6,2% -7,7%) 40535843 2802903
Sub-Saharan Africa 2030 7,1% (6,4% -7,9%) 41054567 2930419
Latin America and the Caribbean 2021 47,5% (44,6% -50,5%) 9737161 4626678
Latin America and the Caribbean 2022 48,2% (44,8% -51,6%) 9665677 4661043
Latin America and the Caribbean 2023 49% (45,2% -52,8%) 9592749 4702668
Latin America and the Caribbean 2024 49,7% (45,6% -53,9%) 9519067 4733841
Latin America and the Caribbean 2025 50,5% (46% -55%) 9445247 4772742
Latin America and the Caribbean 2026 51,2% (46,4% -56,1%) 9371720 4801842
Latin America and the Caribbean 2027 52% (46,9% -57,2%) 9298733 4838884
Latin America and the Caribbean 2028 52,7% (47,4% -58,1%) 9226566 4866557
Latin America and the Caribbean 2029 53,5% (47,9% -59,2%) 9155608 4902423
BMJ Publishing Group Limited (BMJ) disclaims all liability and responsibility arising from any relianceSupplemental material placed on this supplemental material which has been supplied by the author(s) BMJ Global Health
doi: 10.1136/bmjgh-2021-005671:e005671. 6 2021;BMJ Global Health, et al. Betran AP

26
Latin America and the Caribbean 2030 54,3% (48,3% -60,2%) 9086131 4929455
Central Asia 2021 11,9% (10,5% -13,4%) 1477934 176552
Central Asia 2022 12% (10% -14,1%) 1454371 175011
Central Asia 2023 12,1% (9,3% -15%) 1431382 173736
Central Asia 2024 12,3% (8,5% -16%) 1409933 172836
Central Asia 2025 12,4% (7,6% -17,2%) 1390968 172422
Central Asia 2026 12,5% (6,6% -18,5%) 1375170 172582
Central Asia 2027 12,7% (5,5% -19,9%) 1362619 173332
Central Asia 2028 12,9% (4,4% -21,4%) 1353329 174684
Central Asia 2029 13,1% (3,3% -23%) 1347428 176669
Central Asia 2030 13,3% (2% -24,6%) 1345047 179322
Eastern Asia 2021 50,6% (44,9% -56,4%) 17137965 8674013
Eastern Asia 2022 51,6% (44,6% -58,6%) 16829607 8684255
Eastern Asia 2023 52,2% (43,9% -60,5%) 16537276 8632114
Eastern Asia 2024 53,2% (44,3% -62%) 16267175 8650289
Eastern Asia 2025 54,7% (45,2% -64,2%) 16023617 8763514
Eastern Asia 2026 56,1% (46,4% -65,8%) 15807736 8870838
Eastern Asia 2027 57,9% (47,9% -67,9%) 15615765 9043046
Eastern Asia 2028 59,8% (49,7% -69,9%) 15444396 9240229
Eastern Asia 2029 61,7% (51,3% -72,1%) 15293024 9440314
Eastern Asia 2030 63,4% (52,9% -74%) 15161556 9614950
South-eastern Asia 2021 20,2% (19,1% -21,3%) 10518858 2128241
South-eastern Asia 2022 20,7% (19,3% -22,1%) 10472606 2168692
South-eastern Asia 2023 21,2% (19,7% -22,7%) 10423749 2211757
South-eastern Asia 2024 21,9% (20,4% -23,4%) 10372703 2270525
South-eastern Asia 2025 22,4% (20,7% -24,1%) 10320133 2309804
South-eastern Asia 2026 22,9% (21,1% -24,7%) 10266892 2351334
South-eastern Asia 2027 23,6% (21,7% -25,4%) 10214096 2408126
South-eastern Asia 2028 24,1% (22,1% -26,1%) 10162794 2445958
South-eastern Asia 2029 24,6% (22,5% -26,7%) 10113759 2486587
South-eastern Asia 2030 25,3% (23,2% -27,4%) 10067702 2542985
Southern Asia 2021 19,4% (17% -21,7%) 36475904 7069469
Southern Asia 2022 20,4% (17,7% -23%) 36285073 7385423
BMJ Publishing Group Limited (BMJ) disclaims all liability and responsibility arising from any relianceSupplemental material placed on this supplemental material which has been supplied by the author(s) BMJ Global Health
doi: 10.1136/bmjgh-2021-005671:e005671. 6 2021;BMJ Global Health, et al. Betran AP

27
Southern Asia 2023 20% (16,7% -23,4%) 36087251 7229930
Southern Asia 2024 21,1% (17,5% -24,7%) 35884547 7573092
Southern Asia 2025 20,9% (16,8% -24,9%) 35677725 7446897
Southern Asia 2026 22% (17,8% -26,2%) 35466219 7809541
Southern Asia 2027 21,9% (17,4% -26,3%) 35248654 7703434
Southern Asia 2028 23,1% (18,5% -27,6%) 35024542 8075370
Southern Asia 2029 22,9% (18,2% -27,6%) 34794873 7980140
Southern Asia 2030 24,2% (19,4% -28,9%) 34560468 8353151
Western Asia 2021 40,5% (38,9% -42,1%) 5439007 2203450
Western Asia 2022 41,4% (39,8% -43%) 5443660 2255857
Western Asia 2023 41,7% (40,1% -43,3%) 5448364 2273582
Western Asia 2024 42,4% (40,3% -44,4%) 5453323 2310084
Western Asia 2025 44,1% (41,8% -46,3%) 5458753 2406067
Western Asia 2026 46,6% (44,3% -48,9%) 5464845 2546973
Western Asia 2027 47,5% (45,3% -49,8%) 5471697 2600948
Western Asia 2028 47,8% (45,6% -50,1%) 5479385 2620468
Western Asia 2029 48,5% (45,9% -51,1%) 5487998 2659240
Western Asia 2030 50,2% (47,4% -52,9%) 5497665 2758274
BMJ Publishing Group Limited (BMJ) disclaims all liability and responsibility arising from any relianceSupplemental material placed on this supplemental material which has been supplied by the author(s) BMJ Global Health
doi: 10.1136/bmjgh-2021-005671:e005671. 6 2021;BMJ Global Health, et al. Betran AP

28
Supplementary figure 1: The top 10 countries with the maximum absolute or relative increase in caesarean section rate from 1990 to 2018 and separately for each of the three periods studied (1990-2000, 2000-2010 and 2010-2018).
BMJ Publishing Group Limited (BMJ) disclaims all liability and responsibility arising from any relianceSupplemental material placed on this supplemental material which has been supplied by the author(s) BMJ Global Health
doi: 10.1136/bmjgh-2021-005671:e005671. 6 2021;BMJ Global Health, et al. Betran AP

29
5. Data points included in the analysis by country and year and source of data
Supplementary table 5: Data points included in the analysis by country and year and source of data.
ISO
Cod
e
Country
Coverag
e start
year
Covera
ge end
year
Caesare
an
section
rate (%)
References
AFG Afghanistan 2005 2010 5.0
Afghanistan Mortality Survey 2010. Calverton: Afghan Public Health Institute, Ministry of Public Health (APHI/MoPH) [Afghanistan], Central Statistics Organization (CSO) [Afghanistan], ICF Macro, Indian Institute of Health Management Research (IIHMR) [India], and World Health Organization Regional Office for the Eastern Mediterranean (WHO/EMRO) [Egypt]; 2011.
AFG Afghanistan 2008 2011 3.6
Central Statistics Organisation (CSO), UNICEF. Afghanistan Multiple Indicator Cluster Survey 2010-2011: Final Report. Kabul: Central Statistics Organisation (CSO), UNICEF; 2012.
AFG Afghanistan 2010 2015 2.7
Central Statistics Organization (CSO), Ministry of Public Health (MoPH), ICF. Afghanistan Demographic and Health Survey 2015. Kabul, Afghanistan: Central Statistics Organization; 2017.
AFG Afghanistan 2016 2018 6.6
Afghanistan Health Survey 2018. April 2019. Amsterdam: KIT Royal Tropical Institute; 2018.
ALB Albania 1992 1992 9.3
European Health for All Database (HFA-DB) [online database]. World Health Organization (WHO) Regional Office for Europe; 2012 (http://data.euro.who.int/hfadb, accessed 20 August 2012).
ALB Albania 1993 1993 9.8
European Health for All Database (HFA-DB) [online database]. World Health Organization (WHO) Regional Office for Europe; 2012 (http://data.euro.who.int/hfadb, accessed 20 August 2012).
BMJ Publishing Group Limited (BMJ) disclaims all liability and responsibility arising from any relianceSupplemental material placed on this supplemental material which has been supplied by the author(s) BMJ Global Health
doi: 10.1136/bmjgh-2021-005671:e005671. 6 2021;BMJ Global Health, et al. Betran AP

30
ISO
Cod
e
Country
Coverag
e start
year
Covera
ge end
year
Caesare
an
section
rate (%)
References
ALB Albania 1994 1994 7.8
European Health for All Database (HFA-DB) [online database]. World Health Organization (WHO) Regional Office for Europe; 2012 (http://data.euro.who.int/hfadb, accessed 20 August 2012).
ALB Albania 1995 1995 8.4
European Health for All Database (HFA-DB) [online database]. World Health Organization (WHO) Regional Office for Europe; 2012 (http://data.euro.who.int/hfadb, accessed 20 August 2012).
ALB Albania 1996 1996 8.6
European Health for All Database (HFA-DB) [online database]. World Health Organization (WHO) Regional Office for Europe; 2012 (http://data.euro.who.int/hfadb, accessed 20 August 2012).
ALB Albania 1997 1997 10.0
European Health for All Database (HFA-DB) [online database]. World Health Organization (WHO) Regional Office for Europe; 2012 (http://data.euro.who.int/hfadb, accessed 20 August 2012).
ALB Albania 1998 1998 10.1
European Health for All Database (HFA-DB) [online database]. World Health Organization (WHO) Regional Office for Europe; 2012 (http://data.euro.who.int/hfadb, accessed 20 August 2012).
ALB Albania 2001 2001 13.1
European Health for All Database (HFA-DB) [online database]. World Health Organization (WHO) Regional Office for Europe; 2012 (http://data.euro.who.int/hfadb, accessed 20 August 2012).
ALB Albania 1997 2002 13.4
Institute of Public Health, Albania Ministry of Health, Institute of Statistics, DRH/CDC, United States Agency for International Development (USAID), United Nations Population Fund, Albania (UNFPA), United Nations Children’s Fund (UNICEF). Reproductive Health Survey Albania, 2002. Final Report. Atlanta: DHR/CDC; 2005.
ALB Albania 2002 2002 16.5
European Health for All Database (HFA-DB) [online database]. World Health Organization (WHO) Regional Office for Europe; 2012 (http://data.euro.who.int/hfadb, accessed 20 August 2012).
BMJ Publishing Group Limited (BMJ) disclaims all liability and responsibility arising from any relianceSupplemental material placed on this supplemental material which has been supplied by the author(s) BMJ Global Health
doi: 10.1136/bmjgh-2021-005671:e005671. 6 2021;BMJ Global Health, et al. Betran AP

31
ISO
Cod
e
Country
Coverag
e start
year
Covera
ge end
year
Caesare
an
section
rate (%)
References
ALB Albania 2003 2003 15.1
European Health for All Database (HFA-DB) [online database]. World Health Organization (WHO) Regional Office for Europe; 2012 (http://data.euro.who.int/hfadb, accessed 20 August 2012).
ALB Albania 2004 2004 18.0
European Health for All Database (HFA-DB) [online database]. World Health Organization (WHO) Regional Office for Europe; 2012 (http://data.euro.who.int/hfadb, accessed 20 August 2012).
ALB Albania 2005 2005 20.3
European Health for All Database (HFA-DB) [online database]. World Health Organization (WHO) Regional Office for Europe; 2012 (http://data.euro.who.int/hfadb, accessed 20 August 2012).
ALB Albania 2007 2007 25.6
European Health for All Database (HFA-DB) [online database]. World Health Organization (WHO) Regional Office for Europe; 2012 (http://data.euro.who.int/hfadb, accessed 20 August 2012).
ALB Albania 2008 2008 22.7
European Health for All Database (HFA-DB) [online database]. World Health Organization (WHO) Regional Office for Europe; 2012 (http://data.euro.who.int/hfadb, accessed 20 August 2012).
ALB Albania 2003 2009 18.7
Institute of Statistics, Institute of Public Health [Albania], ICF Macro. Albania Demographic and Health Survey 2008-09. Tirana, Albania: Institute of Statistics, Institute of Public Health, ICF Macro; 2010.
ALB Albania 2009 2009 28.1
European Health for All Database (HFA-DB) [online database]. World Health Organization (WHO) Regional Office for Europe; 2012 (http://data.euro.who.int/hfadb, accessed 20 August 2012).
ALB Albania 2010 2010 29.5
European Health for All Database (HFA-DB) [online database]. World Health Organization (WHO) Regional Office for Europe; 2016 (http://data.euro.who.int/hfadb, accessed 8 August 2016).
BMJ Publishing Group Limited (BMJ) disclaims all liability and responsibility arising from any relianceSupplemental material placed on this supplemental material which has been supplied by the author(s) BMJ Global Health
doi: 10.1136/bmjgh-2021-005671:e005671. 6 2021;BMJ Global Health, et al. Betran AP

32
ISO
Cod
e
Country
Coverag
e start
year
Covera
ge end
year
Caesare
an
section
rate (%)
References
ALB Albania 2011 2011 30.0
European Health for All Database (HFA-DB) [online database]. World Health Organization (WHO) Regional Office for Europe; 2016 (http://data.euro.who.int/hfadb, accessed 8 August 2016).
ALB Albania 2012 2012 32.1
European Health for All Database (HFA-DB) [online database]. World Health Organization (WHO) Regional Office for Europe; 2016 (http://data.euro.who.int/hfadb, accessed 8 August 2016).
ALB Albania 2013 2013 32.3
European Health for All Database (HFA-DB) [online database]. World Health Organization (WHO) Regional Office for Europe; 2016 (http://data.euro.who.int/hfadb, accessed 8 August 2016).
ALB Albania 2012 2018 31
Albania Demographic and Health Survey 2017-18. Tirana: Institute of Statistics, Institute of Public Health, ICF; 2018.
DZA Algeria 1987 1992 6.3
Enquête Algérienne sur la Santé de la Mère et de l'Enfant. Rapport Principal. Alger: Ministère de la Santé et de la Population, Office National des Statistique, Ligue des Etats Arabes; 1993 (in French).
DZA Algeria 2010 2013 16.0
Enquête par Grappes à Indicateurs Multiples (MICS) [Multiple Indicator Cluster Survey (MICS)] République Algérienne Démocratique et Populaire 2012-2013. Rapport final. Algérie: Ministère de la Santé, de la Population et de la Réforme Hospitalière, Fonds des Nations unies pour l’enfance (UNICEF), Fonds des Nations Unies pour la Population (FNUAP/UNFPA); 2015 (in French).
AND Andorra 1996 1996 17.6
European Health for All Database (HFA-DB) [online database]. World Health Organization (WHO) Regional Office for Europe; 2012 (http://data.euro.who.int/hfadb, accessed 20 August 2012).
AND Andorra 1997 1997 19.5
European Health for All Database (HFA-DB) [online database]. World Health Organization (WHO) Regional Office for Europe; 2012 (http://data.euro.who.int/hfadb, accessed 20 August 2012).
BMJ Publishing Group Limited (BMJ) disclaims all liability and responsibility arising from any relianceSupplemental material placed on this supplemental material which has been supplied by the author(s) BMJ Global Health
doi: 10.1136/bmjgh-2021-005671:e005671. 6 2021;BMJ Global Health, et al. Betran AP

33
ISO
Cod
e
Country
Coverag
e start
year
Covera
ge end
year
Caesare
an
section
rate (%)
References
AND Andorra 1998 1998 20.1
European Health for All Database (HFA-DB) [online database]. World Health Organization (WHO) Regional Office for Europe; 2012 (http://data.euro.who.int/hfadb, accessed 20 August 2012).
AND Andorra 1999 1999 23.7
European Health for All Database (HFA-DB) [online database]. World Health Organization (WHO) Regional Office for Europe; 2012 (http://data.euro.who.int/hfadb, accessed 20 August 2012).
AGO Angola 2010 2016 3.7
Instituto Nacional de Estatística (INE), Ministério da Saúde (MINSA), Ministério do Planeamento e do Desenvolvimento Territorial (MINPLAN), ICF. Inquérito de Indicadores Múltiplos e de Saúde em Angola 2015-2016. Luanda, Angola e Rockville, Maryland, EUA: INE, MINSA, MINPLAN, ICF; 2017 (in Portuguese).
ARG Argentina 1999 2005 33.0
Encuesta Nacional de Nutrición y Salud (ENNyS). Documento de Resultados 2007. Buenos Aires: Ministerio de Salud, Plan Federal de Salud [Argentina]; 2007 (in Spanish).
ARG Argentina 2005 2005 22.9
Sistema Informático Perinatal de la República Argentina. Anuario 2005 de Información Perinatal. Buenos Aires: Ministerio de Salud, Dirección Nacional de Maternidad e Infancia [Argentina]; 2006 (in Spanish).
ARG Argentina 2006 2006 22.7
Sistema Informático Perinatal de la República Argentina. Anuario 2006 de Información Perinatal. Buenos Aires: Ministerio de Salud, Dirección Nacional de Maternidad e Infancia [Argentina]; 2007 (in Spanish).
ARG Argentina 2011 2011 29.1
Karolinski A, Mercer R, Salgado P, Ocampo C, Bolzán A, Nieto R et al. Primer informe nacional de relevamiento epidemiológico SIP-Gestión: Desarrollo e implementación a escala nacional de un sistema de información en salud de la mujer y perinatal en Argentina. Buenos Aires: Organización Panamericana de la Salud (OPS); Ministerio de Salud de la Nación [Argentina]; 2013 (in Spanish).
ARM Armenia 1990 1990 3.4
European Health for All Database (HFA-DB) [online database]. World Health Organization (WHO) Regional Office for Europe; 2012 (http://data.euro.who.int/hfadb, accessed 20 August 2012).
BMJ Publishing Group Limited (BMJ) disclaims all liability and responsibility arising from any relianceSupplemental material placed on this supplemental material which has been supplied by the author(s) BMJ Global Health
doi: 10.1136/bmjgh-2021-005671:e005671. 6 2021;BMJ Global Health, et al. Betran AP

34
ISO
Cod
e
Country
Coverag
e start
year
Covera
ge end
year
Caesare
an
section
rate (%)
References
ARM Armenia 1991 1991 3.6
European Health for All Database (HFA-DB) [online database]. World Health Organization (WHO) Regional Office for Europe; 2012 (http://data.euro.who.int/hfadb, accessed 20 August 2012).
ARM Armenia 1992 1992 3.7
European Health for All Database (HFA-DB) [online database]. World Health Organization (WHO) Regional Office for Europe; 2012 (http://data.euro.who.int/hfadb, accessed 20 August 2012).
ARM Armenia 1993 1993 3.8
European Health for All Database (HFA-DB) [online database]. World Health Organization (WHO) Regional Office for Europe; 2012 (http://data.euro.who.int/hfadb, accessed 20 August 2012).
ARM Armenia 1994 1994 3.7
European Health for All Database (HFA-DB) [online database]. World Health Organization (WHO) Regional Office for Europe; 2012 (http://data.euro.who.int/hfadb, accessed 20 August 2012).
ARM Armenia 1995 1995 4.3
European Health for All Database (HFA-DB) [online database]. World Health Organization (WHO) Regional Office for Europe; 2012 (http://data.euro.who.int/hfadb, accessed 20 August 2012).
ARM Armenia 1996 1996 4.8
European Health for All Database (HFA-DB) [online database]. World Health Organization (WHO) Regional Office for Europe; 2012 (http://data.euro.who.int/hfadb, accessed 20 August 2012).
ARM Armenia 1999 1999 6.6
European Health for All Database (HFA-DB) [online database]. World Health Organization (WHO) Regional Office for Europe; 2012 (http://data.euro.who.int/hfadb, accessed 20 August 2012).
ARM Armenia 2000 2000 7.4
European Health for All Database (HFA-DB) [online database]. World Health Organization (WHO) Regional Office for Europe; 2012 (http://data.euro.who.int/hfadb, accessed 20 August 2012).
BMJ Publishing Group Limited (BMJ) disclaims all liability and responsibility arising from any relianceSupplemental material placed on this supplemental material which has been supplied by the author(s) BMJ Global Health
doi: 10.1136/bmjgh-2021-005671:e005671. 6 2021;BMJ Global Health, et al. Betran AP

35
ISO
Cod
e
Country
Coverag
e start
year
Covera
ge end
year
Caesare
an
section
rate (%)
References
ARM Armenia 1995 2000 6.6
National Statistical Service [Armenia], Ministry of Health [Armenia], ORC Macro. Armenia Demographic and Health Survey 2000. Calverton, Maryland: National Statistical Service, Ministry of Health, ORC Macro; 2001.
ARM Armenia 2001 2001 7.9
European Health for All Database (HFA-DB) [online database]. World Health Organization (WHO) Regional Office for Europe; 2012 (http://data.euro.who.int/hfadb, accessed 20 August 2012).
ARM Armenia 2004 2004 9.6
European Health for All Database (HFA-DB) [online database]. World Health Organization (WHO) Regional Office for Europe; 2012 (http://data.euro.who.int/hfadb, accessed 20 August 2012).
ARM Armenia 2005 2005 11.3
European Health for All Database (HFA-DB) [online database]. World Health Organization (WHO) Regional Office for Europe; 2012 (http://data.euro.who.int/hfadb, accessed 20 August 2012).
ARM Armenia 2000 2005 9.0
National Statistical Service [Armenia], Ministry of Health [Armenia], ORC Macro. Armenia Demographic and Health Survey 2005. Calverton, Maryland: National Statistical Service, Ministry of Health, ORC Macro; 2006.
ARM Armenia 2006 2006 11.3
European Health for All Database (HFA-DB) [online database]. World Health Organization (WHO) Regional Office for Europe; 2012 (http://data.euro.who.int/hfadb, accessed 20 August 2012).
ARM Armenia 2009 2009 17.7
European Health for All Database (HFA-DB) [online database]. World Health Organization (WHO) Regional Office for Europe; 2012 (http://data.euro.who.int/hfadb, accessed 20 August 2012).
ARM Armenia 2005 2010 12.5
National Statistical Service [Armenia], Ministry of Health [Armenia], ICF International. Armenia Demographic and Health Survey 2010. Calverton, Maryland: National Statistical Service, Ministry of Health, ICF International; 2012.
BMJ Publishing Group Limited (BMJ) disclaims all liability and responsibility arising from any relianceSupplemental material placed on this supplemental material which has been supplied by the author(s) BMJ Global Health
doi: 10.1136/bmjgh-2021-005671:e005671. 6 2021;BMJ Global Health, et al. Betran AP

36
ISO
Cod
e
Country
Coverag
e start
year
Covera
ge end
year
Caesare
an
section
rate (%)
References
ARM Armenia 2010 2010 18.8
European Health for All Database (HFA-DB) [online database]. World Health Organization (WHO) Regional Office for Europe; 2016 (http://data.euro.who.int/hfadb, accessed 8 August 2016).
ARM Armenia 2011 2011 21.7
European Health for All Database (HFA-DB) [online database]. World Health Organization (WHO) Regional Office for Europe; 2016 (http://data.euro.who.int/hfadb, accessed 8 August 2016).
ARM Armenia 2012 2012 22.5
European Health for All Database (HFA-DB) [online database]. World Health Organization (WHO) Regional Office for Europe; 2016 (http://data.euro.who.int/hfadb, accessed 8 August 2016).
ARM Armenia 2014 2014 25.9
European Health for All Database (HFA-DB) [online database]. World Health Organization (WHO) Regional Office for Europe; 2016 (http://data.euro.who.int/hfadb, accessed 8 August 2016).
ARM Armenia 2015 2015 27.5
European Health Information Gateway. European Health for All database (HFA-DB). Caesarean sections per 1000 live births [online database]. World Health Organization (WHO) Regional Office for Europe; 2018 (https://gateway.euro.who.int/en/indicators/hfa_596-7060-caesarean-sections-per-1000-live-births/, accessed 14 February 2019).
ARM Armenia 2010 2016 18.0
National Statistical Service [Armenia], Ministry of Health [Armenia], ICF. Armenia Demographic and Health Survey 2015-16. Rockville, Maryland, USA: National Statistical Service, Ministry of Health, ICF; 2017.
AUS Australia 1991 1991 18.0
Lancaster P, Huang J, Pedisich E. Australia's mothers and babies 1991. Perinatal Statistics Series No. 1. Sydney: Australian Institute of Health and Welfare (AIHW) National Perinatal Statistics Unit; 1994.
AUS Australia 1992 1992 18.3
Lancaster P, Huang J, Pedisich E. Australia's mothers and babies 1992. Perinatal Statistics Series No. 2. Sydney: Australian Institute of Health and Welfare (AIHW) National Perinatal Statistics Unit; 1995.
BMJ Publishing Group Limited (BMJ) disclaims all liability and responsibility arising from any relianceSupplemental material placed on this supplemental material which has been supplied by the author(s) BMJ Global Health
doi: 10.1136/bmjgh-2021-005671:e005671. 6 2021;BMJ Global Health, et al. Betran AP

37
ISO
Cod
e
Country
Coverag
e start
year
Covera
ge end
year
Caesare
an
section
rate (%)
References
AUS Australia 1993 1993 19.0
Lancaster P, Huang J, Lin M. Australia's mothers and babies 1993. Perinatal Statistics Series No. 3. Sydney: Australian Institute of Health and Welfare (AIHW) National Perinatal Statistics Unit; 1996.
AUS Australia 1994 1994 19.4
Day P, Lancaster P, Huang J. Australia's mothers and babies 1994. Perinatal Statistics Series No. 5. Sydney: Australian Institute of Health and Welfare (AIHW) National Perinatal Statistics Unit; 1997.
AUS Australia 1995 1995 19.3
Day P, Lancaster P, Huang J. Australia's mothers and babies 1995. Perinatal Statistics Series No. 6. Sydney: Australian Institute of Health and Welfare (AIHW) National Perinatal Statistics Unit; 1997.
AUS Australia 1996 1996 19.5
Day P, Sullivan EA, Lancaster P. Australia's mothers and babies 1996. Perinatal Statistics Series No. 7. AIHW Cat. No. PER 4. Sydney: Australian Institute of Health and Welfare (AIHW) National Perinatal Statistics Unit; 1999.
AUS Australia 1997 1997 20.3
Day P, Sullivan EA, Ford J, Lancaster P. Australia's mothers and babies 1997. Perinatal Statistics Series no.9. AIHW Cat. No. PER 12. Sydney: Australian Institute of Health and Welfare (AIHW) National Perinatal Statistics Unit; 1999.
AUS Australia 1998 1998 21.1
Nassar N, Sullivan EA, Lancaster P, Day P. Australia's mothers and babies 1998. Perinatal Statistics Series no. 10 AIHW Cat. No. PER 15. Sydney: Australian Institute of Health and Welfare (AIHW) National Perinatal Statistics Unit; 2000.
AUS Australia 1999 1999 21.9
Nassar N, Sullivan EA. Australia’s mothers and babies 1999. Perinatal Statistics Series no. 11. AIHW Cat. No. PER 19. Sydney, Australia: Australian Institute of Health and Welfare (AIHW) National Perinatal Statistics Unit; 2001.
AUS Australia 2000 2000 23.3
Australia’s mothers and babies 2000. Perinatal Statistics Series no. 12. AIHW Cat. No. PER 21. Canberra: Australian Institute of Health and Welfare National Perinatal Statistics Unit (AIHW NPSU); 2003.
BMJ Publishing Group Limited (BMJ) disclaims all liability and responsibility arising from any relianceSupplemental material placed on this supplemental material which has been supplied by the author(s) BMJ Global Health
doi: 10.1136/bmjgh-2021-005671:e005671. 6 2021;BMJ Global Health, et al. Betran AP

38
ISO
Cod
e
Country
Coverag
e start
year
Covera
ge end
year
Caesare
an
section
rate (%)
References
AUS Australia 2001 2001 25.4
Laws PJ, Sullivan EA. Australia’s mothers and babies 2001. Perinatal Statistics Series No. 13. AIHW Cat. No. PER 25. Sydney: Australian Institute of Health and Welfare (AIHW) National Perinatal Statistics Unit; 2004.
AUS Australia 2002 2002 27.0
Laws PJ, Sullivan EA. Australia’s mothers and babies 2002. Perinatal Statistics Series No. 15. AIHW Cat. No. PER 28. Sydney: Australian Institute of Health and Welfare (AIHW) National Perinatal Statistics Unit; 2004.
AUS Australia 2003 2003 28.5
Laws PJ, Sullivan EA. Australia’s mothers and babies 2003. Perinatal Statistics Series No. 16. AIHW Cat. No. PER 29. Sydney: Australian Institute of Health and Welfare (AIHW) National Perinatal Statistics Unit; 2005.
AUS Australia 2004 2004 29.4
Laws PJ, Grayson N, Sullivan EA. Australia’s mothers and babies 2004. Perinatal statistics series no. 18. AIHW cat. no. PER 34. Sydney: Australian Institute of Health and Welfare (AIHW) National Perinatal Statistics Unit; 2006.
AUS Australia 2005 2005 30.3
Laws PJ, Abeywardana S, Walker J, Sullivan EA. Australia’s mothers and babies 2005. Perinatal statistics series no. 20. Cat. no. PER 40. Sydney: Australian Institute of Health and Welfare (AIHW) National Perinatal Statistics Unit; 2007.
AUS Australia 2006 2006 30.8
Laws PJ, Hilder L. Australia’s mothers and babies 2006. Perinatal statistics series no. 22. Cat. no. PER 46. Sydney: Australian Institute of Health and Welfare (AIHW) National Perinatal Statistics Unit; 2008.
AUS Australia 2007 2007 30.9
Laws P, Sullivan EA. Australia’s mothers and babies 2007. Perinatal statistics series no. 23. Cat. no. PER 48. Sydney: Australian Institute of Health and Welfare (AIHW) National Perinatal Statistics Unit; 2009.
AUS Australia 2008 2008 31.1
Laws PJ, Li Z, Sullivan EA. Australia's mothers and babies 2008. Perinatal statistics series no. 24. Cat. No. PER 50. Canberra: Australian Institute of Health and Welfare (AIHW); 2010.
BMJ Publishing Group Limited (BMJ) disclaims all liability and responsibility arising from any relianceSupplemental material placed on this supplemental material which has been supplied by the author(s) BMJ Global Health
doi: 10.1136/bmjgh-2021-005671:e005671. 6 2021;BMJ Global Health, et al. Betran AP

39
ISO
Cod
e
Country
Coverag
e start
year
Covera
ge end
year
Caesare
an
section
rate (%)
References
AUS Australia 2009 2009 31.5
Li Z, McNally L, Hilder L, Sullivan EA. Australia’s mothers and babies 2009. Perinatal statistics series no. 25. Cat. no. PER 52. Sydney: Australian Institute of Health and Welfare (AIHW) National Perinatal Epidemiology and Statistics Unit; 2011.
AUS Australia 2010 2010 31.6
Li Z, Zeki R, Hilder L, Sullivan EA. Australia’s mothers and babies 2010. Perinatal statistics series no. 27. Cat. no. PER 57. Canberra: Australian Institute of Health and Welfare (AIHW) National Perinatal Epidemiology and Statistics Unit; 2012.
AUS Australia 2011 2011 32.3
Li Z, Zeki R, Hilder L, Sullivan EA. Australia’s mothers and babies 2011. Perinatal statistics series no. 28. Cat. no. PER 59. Canberra: Australian Institute of Health and Welfare (AIHW) National Perinatal Epidemiology and Statistics Unit; 2013.
AUS Australia 2012 2012 32.4
Hilder L, Zhichao Z, Parker M, Jahan S, Chambers GM. Australia’s mothers and babies 2012. Perinatal statistics series no. 30. Cat no. PER 69. Canberra: Australian Institute of Health and Welfare (AIHW); 2014.
AUS Australia 2013 2013 33.0
Australia’s mothers and babies 2013—in brief. Perinatal statistics series no. 31. Cat no. PER 72. Canberra: Australian Institute of Health and Welfare (AIHW); 2015.
AUS Australia 2014 2014 33.1
Australia’s mothers and babies 2014—in brief. Perinatal statistics series no. 32. Cat no. PER 87. Canberra: Australian Institute of Health and Welfare (AIHW); 2016.
AUS Australia 2015 2015 33.3
Australia’s mothers and babies 2015—in brief. Perinatal statistics series no. 33. Cat no. PER 91. Canberra: Australian Institute of Health and Welfare (AIHW); 2017.
AUS Australia 2016 2016 33.8
Australia’s mothers and babies 2016 - in brief. Perinatal statistics series no. 34. Cat no. PER 97. Canberra: Australian Institute of Health and Welfare (AIHW); 2018.
BMJ Publishing Group Limited (BMJ) disclaims all liability and responsibility arising from any relianceSupplemental material placed on this supplemental material which has been supplied by the author(s) BMJ Global Health
doi: 10.1136/bmjgh-2021-005671:e005671. 6 2021;BMJ Global Health, et al. Betran AP

40
ISO
Cod
e
Country
Coverag
e start
year
Covera
ge end
year
Caesare
an
section
rate (%)
References
AUS Australia 2017 2017 34.6
Australia’s mothers and babies 2017 - in brief. Perinatal statistics series no. 35. Cat no. PER 100. Canberra: Australian Institute of Health and Welfare (AIHW); 2019.
AUT Austria 1995 1995 12.4
European Health for All Database (HFA-DB) [online database]. World Health Organization (WHO) Regional Office for Europe; 2012 (http://data.euro.who.int/hfadb, accessed 20 August 2012).
AUT Austria 1996 1996 13.1
European Health for All Database (HFA-DB) [online database]. World Health Organization (WHO) Regional Office for Europe; 2012 (http://data.euro.who.int/hfadb, accessed 20 August 2012).
AUT Austria 1997 1997 13.9
European Health for All Database (HFA-DB) [online database]. World Health Organization (WHO) Regional Office for Europe; 2012 (http://data.euro.who.int/hfadb, accessed 20 August 2012).
AUT Austria 1998 1998 14.6
European Health for All Database (HFA-DB) [online database]. World Health Organization (WHO) Regional Office for Europe; 2012 (http://data.euro.who.int/hfadb, accessed 20 August 2012).
AUT Austria 1999 1999 16.4
European Health for All Database (HFA-DB) [online database]. World Health Organization (WHO) Regional Office for Europe; 2012 (http://data.euro.who.int/hfadb, accessed 20 August 2012).
AUT Austria 2000 2000 17.2
Vital statistics. Births since 2000 by selected characteristics [website]. Vienna: Statistics Austria; 2011 (http://www.statistik.at/web_en/statisticspopulation-births-index.html, accessed 19 May 2011).
AUT Austria 2001 2001 18.9
Vital statistics. Births since 2000 by selected characteristics [website]. Vienna: Statistics Austria; 2011 (http://www.statistik.at/web_en/statisticspopulation-births-index.html, accessed 19 May 2011).
BMJ Publishing Group Limited (BMJ) disclaims all liability and responsibility arising from any relianceSupplemental material placed on this supplemental material which has been supplied by the author(s) BMJ Global Health
doi: 10.1136/bmjgh-2021-005671:e005671. 6 2021;BMJ Global Health, et al. Betran AP

41
ISO
Cod
e
Country
Coverag
e start
year
Covera
ge end
year
Caesare
an
section
rate (%)
References
AUT Austria 2002 2002 20.6
Vital statistics. Births since 2000 by selected characteristics [website]. Vienna: Statistics Austria; 2011 (http://www.statistik.at/web_en/statisticspopulation-births-index.html, accessed 19 May 2011).
AUT Austria 2003 2003 22.1
Vital statistics. Births since 2003 by selected characteristics [website]. Vienna: Statistics Austria; 2014 (http://www.statistik.at/web_en/statisticspopulation-births-index.html, accessed 28 May 2014).
AUT Austria 2004 2004 23.6
Vital statistics. Births since 2003 by selected characteristics [website]. Vienna: Statistics Austria; 2014 (http://www.statistik.at/web_en/statisticspopulation-births-index.html, accessed 28 May 2014).
AUT Austria 2005 2005 24.4
Vital statistics. Births since 2003 by selected characteristics [website]. Vienna: Statistics Austria; 2014 (http://www.statistik.at/web_en/statisticspopulation-births-index.html, accessed 28 May 2014).
AUT Austria 2006 2006 25.8
Vital statistics. Births since 2003 by selected characteristics [website]. Vienna: Statistics Austria; 2014 (http://www.statistik.at/web_en/statisticspopulation-births-index.html, accessed 28 May 2014).
AUT Austria 2007 2007 27.1
Vital statistics. Births since 2003 by selected characteristics [website]. Vienna: Statistics Austria; 2014 (http://www.statistik.at/web_en/statisticspopulation-births-index.html, accessed 28 May 2014).
AUT Austria 2008 2008 28.0
Vital statistics. Births since 2003 by selected characteristics [website]. Vienna: Statistics Austria; 2014 (http://www.statistik.at/web_en/statisticspopulation-births-index.html, accessed 28 May 2014).
AUT Austria 2009 2009 28.8
Vital statistics. Births since 2003 by selected characteristics [website]. Vienna: Statistics Austria; 2014 (http://www.statistik.at/web_en/statisticspopulation-births-index.html, accessed 28 May 2014).
BMJ Publishing Group Limited (BMJ) disclaims all liability and responsibility arising from any relianceSupplemental material placed on this supplemental material which has been supplied by the author(s) BMJ Global Health
doi: 10.1136/bmjgh-2021-005671:e005671. 6 2021;BMJ Global Health, et al. Betran AP

42
ISO
Cod
e
Country
Coverag
e start
year
Covera
ge end
year
Caesare
an
section
rate (%)
References
AUT Austria 2010 2010 28.9
Vital statistics. Births since 2003 by selected characteristics [website]. Vienna: Statistics Austria; 2014 (http://www.statistik.at/web_en/statisticspopulation-births-index.html, accessed 28 May 2014).
AUT Austria 2011 2011 29.0
Vital statistics. Births since 2003 by selected characteristics [website]. Vienna: Statistics Austria; 2014 (http://www.statistik.at/web_en/statisticspopulation-births-index.html, accessed 28 May 2014).
AUT Austria 2012 2012 28.8
European Health for All Database (HFA-DB) [online database]. World Health Organization (WHO) Regional Office for Europe; 2016 (http://data.euro.who.int/hfadb, accessed 8 August 2016).
AUT Austria 2013 2013 29.3
Vital statistics. Births since 2003 by selected characteristics [website]. Vienna: Statistics Austria; 2014 (http://www.statistik.at/web_en/statisticspopulation-births-index.html, accessed 28 May 2014).
AUT Austria 2014 2014 29.3
Vital statistics. Births since 2003 by selected characteristics [website]. Vienna: Statistics Austria; 2014 (http://www.statistik.at/web_en/statisticspopulation-births-index.html, accessed 28 May 2014).
AUT Austria 2014 2014 29.3
European Health for All Database (HFA-DB) [online database]. World Health Organization (WHO) Regional Office for Europe; 2016 (http://data.euro.who.int/hfadb, accessed 8 August 2016).
AUT Austria 2015 2015 29.7
Vital statistics. Live births (with place of birth in Austria) by medical characteristics since 2006 [website]. Vienna: Statistics Austria; 2017 (http://www.statistik.at/web_en/statistics/PeopleSociety/health/medical_and_sociomedical_characteristics_of_live_birth/110639.html, accessed 27 October 2017).
AUT Austria 2016 2016 29.5
Vital statistics. Live births (with place of birth in Austria) by medical characteristics since 2006 [website]. Vienna: Statistics Austria; 2017 (http://www.statistik.at/web_en/statistics/PeopleSociety/health/medical_and_sociomedical_characteristics_of_live_birth/110639.html, accessed 27 October 2017).
BMJ Publishing Group Limited (BMJ) disclaims all liability and responsibility arising from any relianceSupplemental material placed on this supplemental material which has been supplied by the author(s) BMJ Global Health
doi: 10.1136/bmjgh-2021-005671:e005671. 6 2021;BMJ Global Health, et al. Betran AP

43
ISO
Cod
e
Country
Coverag
e start
year
Covera
ge end
year
Caesare
an
section
rate (%)
References
AUT Austria 2017 2017 29.6
Vital statistics. Live births (with place of birth in Austria) by medical characteristics since 2007 [website]. Vienna: Statistics Austria; 2018 (http://www.statistik.at/web_en/statistics/PeopleSociety/health/medical_and_sociomedical_characteristics_of_live_birth/110639.html, accessed 11 September 2018).
AUT Austria 2018 2018 29.4
Vital statistics. Live births (with place of birth in Austria) by medical characteristics since 2008 [website]. Vienna: Statistics Austria; 2019 (http://www.statistik.at/web_en/statistics/PeopleSociety/health/medical_and_sociomedical_characteristics_of_live_birth/110639.html, accessed 10 February 2020).
AZE Azerbaijan 1990 1990 1.4
European Health for All Database (HFA-DB) [online database]. World Health Organization (WHO) Regional Office for Europe; 2012 (http://data.euro.who.int/hfadb, accessed 20 August 2012).
AZE Azerbaijan 1991 1991 1.6
European Health for All Database (HFA-DB) [online database]. World Health Organization (WHO) Regional Office for Europe; 2012 (http://data.euro.who.int/hfadb, accessed 20 August 2012).
AZE Azerbaijan 1992 1992 1.7
European Health for All Database (HFA-DB) [online database]. World Health Organization (WHO) Regional Office for Europe; 2012 (http://data.euro.who.int/hfadb, accessed 20 August 2012).
AZE Azerbaijan 1993 1993 1.7
European Health for All Database (HFA-DB) [online database]. World Health Organization (WHO) Regional Office for Europe; 2012 (http://data.euro.who.int/hfadb, accessed 20 August 2012).
AZE Azerbaijan 1994 1994 1.8
European Health for All Database (HFA-DB) [online database]. World Health Organization (WHO) Regional Office for Europe; 2012 (http://data.euro.who.int/hfadb, accessed 20 August 2012).
AZE Azerbaijan 1995 1995 1.9
European Health for All Database (HFA-DB) [online database]. World Health Organization (WHO) Regional Office for Europe; 2012 (http://data.euro.who.int/hfadb, accessed 20 August 2012).
BMJ Publishing Group Limited (BMJ) disclaims all liability and responsibility arising from any relianceSupplemental material placed on this supplemental material which has been supplied by the author(s) BMJ Global Health
doi: 10.1136/bmjgh-2021-005671:e005671. 6 2021;BMJ Global Health, et al. Betran AP

44
ISO
Cod
e
Country
Coverag
e start
year
Covera
ge end
year
Caesare
an
section
rate (%)
References
AZE Azerbaijan 1996 1996 2.0
European Health for All Database (HFA-DB) [online database]. World Health Organization (WHO) Regional Office for Europe; 2012 (http://data.euro.who.int/hfadb, accessed 20 August 2012).
AZE Azerbaijan 1997 1997 2.0
European Health for All Database (HFA-DB) [online database]. World Health Organization (WHO) Regional Office for Europe; 2012 (http://data.euro.who.int/hfadb, accessed 20 August 2012).
AZE Azerbaijan 2000 2000 2.6
European Health for All Database (HFA-DB) [online database]. World Health Organization (WHO) Regional Office for Europe; 2012 (http://data.euro.who.int/hfadb, accessed 20 August 2012).
AZE Azerbaijan 2001 2001 3.1
European Health for All Database (HFA-DB) [online database]. World Health Organization (WHO) Regional Office for Europe; 2012 (http://data.euro.who.int/hfadb, accessed 20 August 2012).
AZE Azerbaijan 1996 2001 2.6
Ministry of Health [Azerbaijan], Division of Reproductive Health - Centers for Disease Control and Prevention (DRH/CDC). Reproductive Health Survey Azerbaijan, 2001. Final Report. Atlanta: CDC; 2003.
AZE Azerbaijan 2002 2002 3.6
European Health for All Database (HFA-DB) [online database]. World Health Organization (WHO) Regional Office for Europe; 2012 (http://data.euro.who.int/hfadb, accessed 20 August 2012).
AZE Azerbaijan 2004 2004 4.7
European Health for All Database (HFA-DB) [online database]. World Health Organization (WHO) Regional Office for Europe; 2012 (http://data.euro.who.int/hfadb, accessed 20 August 2012).
AZE Azerbaijan 2005 2005 5.3
European Health for All Database (HFA-DB) [online database]. World Health Organization (WHO) Regional Office for Europe; 2012 (http://data.euro.who.int/hfadb, accessed 20 August 2012).
BMJ Publishing Group Limited (BMJ) disclaims all liability and responsibility arising from any relianceSupplemental material placed on this supplemental material which has been supplied by the author(s) BMJ Global Health
doi: 10.1136/bmjgh-2021-005671:e005671. 6 2021;BMJ Global Health, et al. Betran AP

45
ISO
Cod
e
Country
Coverag
e start
year
Covera
ge end
year
Caesare
an
section
rate (%)
References
AZE Azerbaijan 2006 2006 6.1
European Health for All Database (HFA-DB) [online database]. World Health Organization (WHO) Regional Office for Europe; 2012 (http://data.euro.who.int/hfadb, accessed 20 August 2012).
AZE Azerbaijan 2001 2006 4.7
State Statistical Committee (SSC) [Azerbaijan], Macro International Inc. Azerbaijan Demographic and Health Survey 2006. Calverton, Maryland, USA: State Statistical Committee, Macro International Inc.; 2008.
AZE Azerbaijan 2007 2007 7.6
European Health for All Database (HFA-DB) [online database]. World Health Organization (WHO) Regional Office for Europe; 2012 (http://data.euro.who.int/hfadb, accessed 20 August 2012).
AZE Azerbaijan 2010 2010 13.7
European Health for All Database (HFA-DB) [online database]. World Health Organization (WHO) Regional Office for Europe; 2016 (http://data.euro.who.int/hfadb, accessed 8 August 2016).
AZE Azerbaijan 2006 2011 20.0
Public Health and Reforms Centre (PHRC) [Azerbaijan]. Demographic and Health Survey, Azerbaijan, 2011. Baku: Ministry of Health (MoH) [Azerbaijan]; 2013.
AZE Azerbaijan 2011 2011 14.7
European Health for All Database (HFA-DB) [online database]. World Health Organization (WHO) Regional Office for Europe; 2014 (http://data.euro.who.int/hfadb, accessed 15 December 2014).
AZE Azerbaijan 2012 2012 20.5
Healthcare, social security and housing conditions in Azerbaijan. Baku: State Statistical Committee of the Republic of Azerbaijan; 2013.
AZE Azerbaijan 2013 2013 17.0
European Health for All Database (HFA-DB) [online database]. World Health Organization (WHO) Regional Office for Europe; 2016 (http://data.euro.who.int/hfadb, accessed 30 June 2016).
BMJ Publishing Group Limited (BMJ) disclaims all liability and responsibility arising from any relianceSupplemental material placed on this supplemental material which has been supplied by the author(s) BMJ Global Health
doi: 10.1136/bmjgh-2021-005671:e005671. 6 2021;BMJ Global Health, et al. Betran AP

46
ISO
Cod
e
Country
Coverag
e start
year
Covera
ge end
year
Caesare
an
section
rate (%)
References
AZE Azerbaijan 2014 2014 18.3
European Health for All Database (HFA-DB) [online database]. World Health Organization (WHO) Regional Office for Europe; 2016 (http://data.euro.who.int/hfadb, accessed 8 August 2016).
AZE Azerbaijan 2015 2015 27.6
European Health for All Database (HFA-DB) [online database]. World Health Organization (WHO) Regional Office for Europe; 2016 (http://data.euro.who.int/hfadb, accessed 8 August 2016).
AZE Azerbaijan 2017 2017 33.5
European Health Information Gateway. European Health for All database (HFA-DB). Caesarean sections per 1000 live births [online database]. World Health Organization (WHO) Regional Office for Europe; 2019 (https://gateway.euro.who.int/en/indicators/hfa_596-7060-caesarean-sections-per-1000-live-births/, accessed 5 March 2020).
BHR Bahrain 1992 1995 16.0
Tawfeeq N, Farid SM. Bahrain Family Health Survey 1995. Principal Report. Manama: Ministry of Health, Bahrain; 2000.
BHR Bahrain 2004 2004 16.2
Health Statistics of 2008. Bahrain: Ministry of Health; 2009.
BHR Bahrain 2005 2005 19.8
Health Statistics of 2008. Bahrain: Ministry of Health; 2009.
BHR Bahrain 2006 2006 20.9
Health Statistics of 2010. Bahrain: Ministry of Health; 2011.
BHR Bahrain 2007 2007 23.4
Health Statistics of 2010. Bahrain: Ministry of Health; 2011.
BMJ Publishing Group Limited (BMJ) disclaims all liability and responsibility arising from any relianceSupplemental material placed on this supplemental material which has been supplied by the author(s) BMJ Global Health
doi: 10.1136/bmjgh-2021-005671:e005671. 6 2021;BMJ Global Health, et al. Betran AP

47
ISO
Cod
e
Country
Coverag
e start
year
Covera
ge end
year
Caesare
an
section
rate (%)
References
BHR Bahrain 2008 2008 23.9
Health Statistics of 2010. Bahrain: Ministry of Health; 2011.
BHR Bahrain 2009 2009 23.6
Health Statistics of 2010. Bahrain: Ministry of Health; 2011.
BHR Bahrain 2010 2010 26.8
Health Statistics of 2010. Bahrain: Ministry of Health; 2011.
BHR Bahrain 2011 2011 30.0
Health Statistics of 2011. Bahrain: Ministry of Health; 2012.
BHR Bahrain 2012 2012 26.0
Health Statistics of 2012. Bahrain: Ministry of Health; 2013.
BHR Bahrain 2013 2013 24.0
Health Statistics of 2015. Bahrain: Ministry of Health; 2016.
BHR Bahrain 2014 2014 27.0
Health Statistics of 2015. Bahrain: Ministry of Health; 2016.
BHR Bahrain 2015 2015 28.0
Health Statistics of 2015. Bahrain: Ministry of Health; 2016.
BMJ Publishing Group Limited (BMJ) disclaims all liability and responsibility arising from any relianceSupplemental material placed on this supplemental material which has been supplied by the author(s) BMJ Global Health
doi: 10.1136/bmjgh-2021-005671:e005671. 6 2021;BMJ Global Health, et al. Betran AP

48
ISO
Cod
e
Country
Coverag
e start
year
Covera
ge end
year
Caesare
an
section
rate (%)
References
BHR Bahrain 2016 2016 28.0
Health Statistics of 2016. Bahrain: Ministry of Health; 2017.
BHR Bahrain 2017 2017 29.0
Health Statistics of 2017. Bahrain: Ministry of Health; 2018.
BGD Bangladesh 1994 2000 2.4
National Institute of Population Research and Training (NIPORT), Mitra and Associates (MA), ORC Macro (ORCM). Bangladesh Demographic and Health Survey 1999-2000. Dhaka, Bangladesh and Calverton, Maryland [USA]: National Institute of Population Research and Training, Mitra and Associates, ORC Macro; 2001.
BGD Bangladesh 1998 2001 2.7
Bangladesh Maternal Health Services and Maternal Mortality Survey 2001. Dhaka: National Institute of Population Research and Training - NIPORT/Bangladesh, ORC Macro, Johns Hopkins University, Centre for Health and Population Research - icddr,b/Bangladesh; 2003.
BGD Bangladesh 1999 2004 3.5
National Institute of Population Research and Training (NIPORT), Mitra and Associates, ORC Macro. Bangladesh Demographic and Health Survey 2004. Dhaka, Bangladesh and Calverton, Maryland [USA]: National Institute of Population Research and Training, Mitra and Associates, ORC Macro; 2005.
BGD Bangladesh 2002 2007 7.5
National Institute of Population Research and Training (NIPORT), Mitra and Associates, Macro International. Bangladesh Demographic and Health Survey 2007. Dhaka, Bangladesh and Calverton, Maryland, USA: National Institute of Population Research and Training, Mitra and Associates, Macro International; 2009.
BGD Bangladesh 2005 2010 12.2
Bangladesh Maternal Mortality and Health Care Survey 2010. Dhaka: National Institute of Population Research and Training (NIPORT), MEASURE Evaluation, icddr,b.; 2012.
BGD Bangladesh 2008 2011 17.1
National Institute of Population Research and Training (NIPORT), Mitra and Associates, ICF International. Bangladesh Demographic and Health Survey 2011. Dhaka, Bangladesh and Calverton, Maryland, USA: NIPORT, Mitra and Associates, ICF International; 2013.
BMJ Publishing Group Limited (BMJ) disclaims all liability and responsibility arising from any relianceSupplemental material placed on this supplemental material which has been supplied by the author(s) BMJ Global Health
doi: 10.1136/bmjgh-2021-005671:e005671. 6 2021;BMJ Global Health, et al. Betran AP

49
ISO
Cod
e
Country
Coverag
e start
year
Covera
ge end
year
Caesare
an
section
rate (%)
References
BGD Bangladesh 2010 2013 19.1
Bangladesh Multiple Indicator Cluster Survey 2012-2013, Progotir Pathey: Final Report. Dhaka, Bangladesh: Bangladesh Bureau of Statistics (BBS), UNICEF Bangladesh; 2014.
BGD Bangladesh 2013 2016 30.7
Bangladesh Maternal Mortality and Health Care Survey 2016: Final Report. Dhaka and Chapel Hill: National Institute of Population Research and Training (NIPORT), International Centre for Diarrhoeal Disease Research, Bangladesh (icddr,b), MEASURE Evaluation; 2019.
BGD Bangladesh 2014 2018 32.7
Bangladesh Demographic and Health Survey 2017-18: Key Indicators. Dhaka, Rockville, maryland: National Institute of Population Research and Training (NIPORT), ICF; 2019.
BRB Barbados 2010 2012 21.3
Barbados Statistical Service, ‘Barbados Multiple Indicator Cluster Survey 2012: Final Report’. BSS, Bridgetown, Barbados: Barbados Statistical Service, United Nations Children’s Fund (UNICEF), United Nations Population Fund (UNFPA), United Nations Entity for Gender Equality and the Empowerment of Women (UN Women); 2014.
BLR Belarus 1993 1993 9.2
European Health for All Database (HFA-DB) [online database]. World Health Organization (WHO) Regional Office for Europe; 2012 (http://data.euro.who.int/hfadb, accessed 20 August 2012).
BLR Belarus 1994 1994 9.7
European Health for All Database (HFA-DB) [online database]. World Health Organization (WHO) Regional Office for Europe; 2012 (http://data.euro.who.int/hfadb, accessed 20 August 2012).
BLR Belarus 1995 1995 11.0
European Health for All Database (HFA-DB) [online database]. World Health Organization (WHO) Regional Office for Europe; 2012 (http://data.euro.who.int/hfadb, accessed 20 August 2012).
BLR Belarus 1996 1996 12.0
European Health for All Database (HFA-DB) [online database]. World Health Organization (WHO) Regional Office for Europe; 2012 (http://data.euro.who.int/hfadb, accessed 20 August 2012).
BMJ Publishing Group Limited (BMJ) disclaims all liability and responsibility arising from any relianceSupplemental material placed on this supplemental material which has been supplied by the author(s) BMJ Global Health
doi: 10.1136/bmjgh-2021-005671:e005671. 6 2021;BMJ Global Health, et al. Betran AP

50
ISO
Cod
e
Country
Coverag
e start
year
Covera
ge end
year
Caesare
an
section
rate (%)
References
BLR Belarus 1997 1997 13.9
European Health for All Database (HFA-DB) [online database]. World Health Organization (WHO) Regional Office for Europe; 2012 (http://data.euro.who.int/hfadb, accessed 20 August 2012).
BLR Belarus 1998 1998 15.2
European Health for All Database (HFA-DB) [online database]. World Health Organization (WHO) Regional Office for Europe; 2012 (http://data.euro.who.int/hfadb, accessed 20 August 2012).
BLR Belarus 1999 1999 15.6
European Health for All Database (HFA-DB) [online database]. World Health Organization (WHO) Regional Office for Europe; 2012 (http://data.euro.who.int/hfadb, accessed 20 August 2012).
BLR Belarus 2000 2000 16.7
European Health for All Database (HFA-DB) [online database]. World Health Organization (WHO) Regional Office for Europe; 2012 (http://data.euro.who.int/hfadb, accessed 20 August 2012).
BLR Belarus 2001 2001 16.4
European Health for All Database (HFA-DB) [online database]. World Health Organization (WHO) Regional Office for Europe; 2012 (http://data.euro.who.int/hfadb, accessed 20 August 2012).
BLR Belarus 2002 2002 17.4
European Health for All Database (HFA-DB) [online database]. World Health Organization (WHO) Regional Office for Europe; 2012 (http://data.euro.who.int/hfadb, accessed 20 August 2012).
BLR Belarus 2003 2003 17.8
European Health for All Database (HFA-DB) [online database]. World Health Organization (WHO) Regional Office for Europe; 2012 (http://data.euro.who.int/hfadb, accessed 20 August 2012).
BLR Belarus 2004 2004 18.3
European Health for All Database (HFA-DB) [online database]. World Health Organization (WHO) Regional Office for Europe; 2012 (http://data.euro.who.int/hfadb, accessed 20 August 2012).
BMJ Publishing Group Limited (BMJ) disclaims all liability and responsibility arising from any relianceSupplemental material placed on this supplemental material which has been supplied by the author(s) BMJ Global Health
doi: 10.1136/bmjgh-2021-005671:e005671. 6 2021;BMJ Global Health, et al. Betran AP

51
ISO
Cod
e
Country
Coverag
e start
year
Covera
ge end
year
Caesare
an
section
rate (%)
References
BLR Belarus 2005 2005 18.9
Public Health in the Republic of Belarus. An Official Statistics Collection, 2011. Minsk: Public Health Ministry of the Republic of Belarus. Division of Methodology and Analysis of Medical Statistics; 2012.
BLR Belarus 2006 2006 19.5
Public Health in the Republic of Belarus. An Official Statistics Collection, 2011. Minsk: Public Health Ministry of the Republic of Belarus. Division of Methodology and Analysis of Medical Statistics; 2012.
BLR Belarus 2007 2007 20.5
Public Health in the Republic of Belarus. An Official Statistics Collection, 2011. Minsk: Public Health Ministry of the Republic of Belarus. Division of Methodology and Analysis of Medical Statistics; 2012.
BLR Belarus 2008 2008 21.0
Public Health in the Republic of Belarus. An Official Statistics Collection, 2011. Minsk: Public Health Ministry of the Republic of Belarus. Division of Methodology and Analysis of Medical Statistics; 2012.
BLR Belarus 2009 2009 22.0
Public Health in the Republic of Belarus. An Official Statistics Collection, 2011. Minsk: Public Health Ministry of the Republic of Belarus. Division of Methodology and Analysis of Medical Statistics; 2012.
BLR Belarus 2010 2010 23.0
Public Health in the Republic of Belarus. An Official Statistics Collection, 2011. Minsk: Public Health Ministry of the Republic of Belarus. Division of Methodology and Analysis of Medical Statistics; 2012.
BLR Belarus 2011 2011 24.0
European Health for All Database (HFA-DB) [online database]. World Health Organization (WHO) Regional Office for Europe; 2016 (http://data.euro.who.int/hfadb, accessed 8 August 2016).
BLR Belarus 2012 2012 25.3
European Health for All Database (HFA-DB) [online database]. World Health Organization (WHO) Regional Office for Europe; 2016 (http://data.euro.who.int/hfadb, accessed 8 August 2016).
BMJ Publishing Group Limited (BMJ) disclaims all liability and responsibility arising from any relianceSupplemental material placed on this supplemental material which has been supplied by the author(s) BMJ Global Health
doi: 10.1136/bmjgh-2021-005671:e005671. 6 2021;BMJ Global Health, et al. Betran AP

52
ISO
Cod
e
Country
Coverag
e start
year
Covera
ge end
year
Caesare
an
section
rate (%)
References
BLR Belarus 2013 2013 26.6
European Health for All Database (HFA-DB) [online database]. World Health Organization (WHO) Regional Office for Europe; 2016 (http://data.euro.who.int/hfadb, accessed 8 August 2016).
BLR Belarus 2014 2014 27.1
European Health for All Database (HFA-DB) [online database]. World Health Organization (WHO) Regional Office for Europe; 2016 (http://data.euro.who.int/hfadb, accessed 8 August 2016).
BLR Belarus 2017 2017 29.6
European Health Information Gateway. European Health for All database (HFA-DB). Caesarean sections per 1000 live births [online database]. World Health Organization (WHO) Regional Office for Europe; 2019 (https://gateway.euro.who.int/en/indicators/hfa_596-7060-caesarean-sections-per-1000-live-births/, accessed 5 March 2020).
BEL Belgium 1990 1990 10.9
Standardized Procedures for Mortality Analysis (SPMA). Number and proportion of live births by delivery for all Belgium, Belgium 1990-2008 [website]. Brussels: Scientific Institute of Public Health; 2009 (https://www.wiv-isp.be/epidemio/spma/, accessed 23 August 2012).
BEL Belgium 1991 1991 11.5
Standardized Procedures for Mortality Analysis (SPMA). Number and proportion of live births by delivery for all Belgium, Belgium 1990-2008 [website]. Brussels: Scientific Institute of Public Health; 2009 (https://www.wiv-isp.be/epidemio/spma/, accessed 23 August 2012).
BEL Belgium 1992 1992 11.9
Standardized Procedures for Mortality Analysis (SPMA). Number and proportion of live births by delivery for all Belgium, Belgium 1990-2008 [website]. Brussels: Scientific Institute of Public Health; 2009 (https://www.wiv-isp.be/epidemio/spma/, accessed 23 August 2012).
BEL Belgium 1993 1993 12.9
Standardized Procedures for Mortality Analysis (SPMA). Number and proportion of live births by delivery for all Belgium, Belgium 1990-2008 [website]. Brussels: Scientific Institute of Public Health; 2009 (https://www.wiv-isp.be/epidemio/spma/, accessed 23 August 2012).
BEL Belgium 1994 1994 12.9
Standardized Procedures for Mortality Analysis (SPMA). Number and proportion of live births by delivery for all Belgium, Belgium 1990-2008 [website]. Brussels: Scientific Institute of Public Health; 2009 (https://www.wiv-isp.be/epidemio/spma/, accessed 23 August 2012).
BMJ Publishing Group Limited (BMJ) disclaims all liability and responsibility arising from any relianceSupplemental material placed on this supplemental material which has been supplied by the author(s) BMJ Global Health
doi: 10.1136/bmjgh-2021-005671:e005671. 6 2021;BMJ Global Health, et al. Betran AP

53
ISO
Cod
e
Country
Coverag
e start
year
Covera
ge end
year
Caesare
an
section
rate (%)
References
BEL Belgium 1995 1995 13.4
Standardized Procedures for Mortality Analysis (SPMA). Number and proportion of live births by delivery for all Belgium, Belgium 1990-2008 [website]. Brussels: Scientific Institute of Public Health; 2009 (https://www.wiv-isp.be/epidemio/spma/, accessed 23 August 2012).
BEL Belgium 1996 1996 14.0
Standardized Procedures for Mortality Analysis (SPMA). Number and proportion of live births by delivery for all Belgium, Belgium 1990-2008 [website]. Brussels: Scientific Institute of Public Health; 2009 (https://www.wiv-isp.be/epidemio/spma/, accessed 23 August 2012).
BEL Belgium 1997 1997 14.5
Standardized Procedures for Mortality Analysis (SPMA). Number and proportion of live births by delivery for all Belgium, Belgium 1990-2008 [website]. Brussels: Scientific Institute of Public Health; 2009 (https://www.wiv-isp.be/epidemio/spma/, accessed 23 August 2012).
BEL Belgium 1998 1998 15.4
Standardized Procedures for Mortality Analysis (SPMA). Number and proportion of live births by delivery for all Belgium, Belgium 1990-2008 [website]. Brussels: Scientific Institute of Public Health; 2009 (https://www.wiv-isp.be/epidemio/spma/, accessed 23 August 2012).
BEL Belgium 1999 1999 16.0
Standardized Procedures for Mortality Analysis (SPMA). Number and proportion of live births by delivery for all Belgium, Belgium 1990-2008 [website]. Brussels: Scientific Institute of Public Health; 2009 (https://www.wiv-isp.be/epidemio/spma/, accessed 23 August 2012).
BEL Belgium 2000 2000 16.9
Standardized Procedures for Mortality Analysis (SPMA). Number and proportion of live births by delivery for all Belgium, Belgium 1990-2008 [website]. Brussels: Scientific Institute of Public Health; 2009 (https://www.wiv-isp.be/epidemio/spma/, accessed 23 August 2012).
BEL Belgium 2001 2001 17.6
Standardized Procedures for Mortality Analysis (SPMA). Number and proportion of live births by delivery for all Belgium, Belgium 1990-2008 [website]. Brussels: Scientific Institute of Public Health; 2009 (https://www.wiv-isp.be/epidemio/spma/, accessed 23 August 2012).
BEL Belgium 2002 2002 18.3
Standardized Procedures for Mortality Analysis (SPMA). Number and proportion of live births by delivery for all Belgium, Belgium 1990-2008 [website]. Brussels: Scientific Institute of Public Health; 2009 (https://www.wiv-isp.be/epidemio/spma/, accessed 23 August 2012).
BMJ Publishing Group Limited (BMJ) disclaims all liability and responsibility arising from any relianceSupplemental material placed on this supplemental material which has been supplied by the author(s) BMJ Global Health
doi: 10.1136/bmjgh-2021-005671:e005671. 6 2021;BMJ Global Health, et al. Betran AP

54
ISO
Cod
e
Country
Coverag
e start
year
Covera
ge end
year
Caesare
an
section
rate (%)
References
BEL Belgium 2003 2003 18.9
Standardized Procedures for Mortality Analysis (SPMA). Number and proportion of live births by delivery for all Belgium, Belgium 1990-2008 [website]. Brussels: Scientific Institute of Public Health; 2009 (https://www.wiv-isp.be/epidemio/spma/, accessed 23 August 2012).
BEL Belgium 2004 2004 18.9
Standardized Procedures for Mortality Analysis (SPMA). Number and proportion of live births by delivery for all Belgium, Belgium 1990-2008 [website]. Brussels: Scientific Institute of Public Health; 2009 (https://www.wiv-isp.be/epidemio/spma/, accessed 23 August 2012).
BEL Belgium 2005 2005 19.5
Standardized Procedures for Mortality Analysis (SPMA). Number and proportion of live births by delivery for all Belgium, Belgium 1990-2008 [website]. Brussels: Scientific Institute of Public Health; 2009 (https://www.wiv-isp.be/epidemio/spma/, accessed 23 August 2012).
BEL Belgium 2006 2006 20.0
Standardized Procedures for Mortality Analysis (SPMA). Number and proportion of live births by delivery for all Belgium, Belgium 1990-2008 [website]. Brussels: Scientific Institute of Public Health; 2009 (https://www.wiv-isp.be/epidemio/spma/, accessed 23 August 2012).
BEL Belgium 2007 2007 19.9
Standardized Procedures for Mortality Analysis (SPMA). Number and proportion of live births by delivery for all Belgium, Belgium 1990-2008 [website]. Brussels: Scientific Institute of Public Health; 2009 (https://www.wiv-isp.be/epidemio/spma/, accessed 23 August 2012).
BEL Belgium 2008 2008 20.3
Standardized Procedures for Mortality Analysis (SPMA). Number and proportion of live births by delivery for all Belgium, Belgium 1990-2008 [website]. Brussels: Scientific Institute of Public Health; 2009 (https://www.wiv-isp.be/epidemio/spma/, accessed 23 August 2012).
BEL Belgium 2009 2009 19.8
Standardized Procedures for Mortality Analysis (SPMA). Number and proportion of live births by delivery for all Belgium, Belgium 2008-2009 [website]. Brussels: Scientific Institute of Public Health; 2010 (https://www.wiv-isp.be/epidemio/spma/, accessed 10 October 2013).
BEL Belgium 2010 2010 19.6
Standardized Procedures for Mortality Analysis (SPMA). Number of births by delivery for all Belgium, Belgium 2010 [website]. Brussels: Scientific Institute of Public Health; 2011 (https://www.wiv-isp.be/epidemio/spma/, accessed 17 December 2014).
BMJ Publishing Group Limited (BMJ) disclaims all liability and responsibility arising from any relianceSupplemental material placed on this supplemental material which has been supplied by the author(s) BMJ Global Health
doi: 10.1136/bmjgh-2021-005671:e005671. 6 2021;BMJ Global Health, et al. Betran AP

55
ISO
Cod
e
Country
Coverag
e start
year
Covera
ge end
year
Caesare
an
section
rate (%)
References
BEL Belgium 2011 2011 20.1
Standardized Procedures for Mortality Analysis (SPMA). Number of births by delivery for all Belgium, Belgium 2011 [website]. Brussels: Scientific Institute of Public Health; 2012 (https://www.wiv-isp.be/epidemio/spma/, accessed 30 October 2017).
BEL Belgium 2011 2011 20.1
European Health for All Database (HFA-DB) [online database]. World Health Organization (WHO) Regional Office for Europe; 2016 (http://data.euro.who.int/hfadb, accessed 8 August 2016).
BEL Belgium 2012 2012 20.6
Standardized Procedures for Mortality Analysis (SPMA). Number of births by delivery for all Belgium, Belgium 2012 [website]. Brussels: Scientific Institute of Public Health; 2013 (https://www.wiv-isp.be/epidemio/spma/, accessed 30 October 2017).
BEL Belgium 2013 2013 21.2
Standardized Procedures for Mortality Analysis (SPMA). Number of births by delivery for all Belgium, Belgium 2013 [website]. Brussels: Scientific Institute of Public Health; 2014 (https://www.wiv-isp.be/epidemio/spma/, accessed 30 October 2017).
BEL Belgium 2015 2015 21.3
European Perinatal Health Report. Core indicators of the health and care of pregnant women and babies in Europe in 2015. Euro-Peristat Project; 2018.
BLZ Belize 1994 1999 9.1
1999 Belize Family Health Survey Females. Belize: Central Statistical Office; 2001.
BLZ Belize 2009 2011 28.1
Belize Multiple Indicator Cluster Survey 2011. Final Report. Belize: The Statistical Institute of Belize (SIB), United Nations Children’s Fund (UNICEF); 2012.
BLZ Belize 2013 2016 34.2
Statistical Institute of Belize, UNICEF Belize. Belize Multiple Indicator Cluster Survey, 2015-2016, Final Report. Belmopan, Belize: Statistical Institute of Belize, UNICEF Belize; 2017.
BMJ Publishing Group Limited (BMJ) disclaims all liability and responsibility arising from any relianceSupplemental material placed on this supplemental material which has been supplied by the author(s) BMJ Global Health
doi: 10.1136/bmjgh-2021-005671:e005671. 6 2021;BMJ Global Health, et al. Betran AP

56
ISO
Cod
e
Country
Coverag
e start
year
Covera
ge end
year
Caesare
an
section
rate (%)
References
BEN Benin 1991 1996 2.2
Kodjogbé, N, Mboup G, Tossou J, de Souza L, Gandaho T, Guédémé A et al. (Institut National de la Statistique et de l'Analyse Économique, Macro International Inc.). Enquête Démographique et de Santé, République de Bénin 1996. Calverton, Maryland USA: Institut National de la Statistique et de l'Analyse Économique et Macro International Inc.; 1997 (in French).
BEN Benin 1996 2001 3.3
Institut National de la Statistique et de l’Analyse Économique (INSAE), ORC Macro. Enquête Démographique et de Santé au Bénin 2001. Calverton, Maryland, USA: Institut National de la Statistique et de l’Analyse Économique, ORC Macro; 2002 (in French).
BEN Benin 2001 2006 3.6
Institut National de la Statistique et de l’Analyse Économique (INSAE) [Bénin], Macro International Inc. Enquête Démographique et de Santé (EDSB-III) - Bénin 2006. Calverton, Maryland, USA: Institut National de la Statistique et de l’Analyse Économique, Macro International Inc.; 2007 (in French).
BEN Benin 2005 2012 5.4
Institut National de la Statistique et de l’Analyse Économique (INSAE), ICF International. Enquête Démographique et de Santé du Bénin 2011-2012. Calverton, Maryland, USA: INSAE, ICF International; 2013 (in French).
BEN Benin 2012 2014 5.3
Institut national de la statistique et de l’analyse économique (INSAE), Bénin, Fonds des Nations Unies pour l’Enfance (UNICEF). Enquête par grappes à indicateurs multiples 2014, Rapport final. Cotonou, Bénin: Institut national de la statistique et de l’analyse économique; 2015 (in French).
BEN Benin 2012 2018 5.1
Enquête Démographique et de Santé au Bénin, 2017-2018. Cotonou, Rockville, Maryland: Institut National de la Statistique et de l’Analyse Économique (INSAE), ICF; 2018 (in French).
BTN Bhutan 2008 2010 12.4
National Statistics Bureau, Bhutan, United Nations Children's Fund (UNICEF), United Nations Population Fund (UNFPA). Bhutan Multiple Indicator Survey 2010. Thrimphu, Bhutan: National Statistics Bureau; 2011.
BOL Bolivia
(Plurinational State of)
1995 1998 14.7
Gutiérrez Sardán M, Ochoa LH, Gómez Vargas A (Instituto Nacional de Estadística - INE [Bolivia], Macro International). Bolivia Encuesta Nacional de Demografía y Salud 1998. Calverton, Maryland: Instituto Nacional de Estadística - INE [Bolivia], Macro International; 1998 (in Spanish).
BMJ Publishing Group Limited (BMJ) disclaims all liability and responsibility arising from any relianceSupplemental material placed on this supplemental material which has been supplied by the author(s) BMJ Global Health
doi: 10.1136/bmjgh-2021-005671:e005671. 6 2021;BMJ Global Health, et al. Betran AP

57
ISO
Cod
e
Country
Coverag
e start
year
Covera
ge end
year
Caesare
an
section
rate (%)
References
BOL Bolivia
(Plurinational State of)
1998 2003 14.6
Gutiérrez Sardán M, Ochoa LH, Castillo Guerra W, ORC Macro. Bolivia Encuesta Nacional de Demografía y Salud 2003. Calverton, Maryland: Instituto Nacional de Estadística [Bolivia], ORC Macro; 2004 (in Spanish).
BOL Bolivia
(Plurinational State of)
2003 2008 18.6
Ramiro C, Ochoa LH, Macro International. Bolivia Encuesta Nacional de Demografía y Salud - ENDSA - 2008. Calverton, Maryland: Ministerio de Salud y Deportes and Macro International; 2009 (in Spanish).
BOL Bolivia
(Plurinational State of)
2007 2012 26.7
Encuesta de Evaluación de Salud y Nutrición 2012: Informe de Resultados. La Paz: Unidad de Análisis de Políticas Sociales y Económicas (UDAPE), Ministerio de Salud, Estado Plurinacional de Bolivia, Comité Técnico – Consejo Nacional de Alimentación y Nutrición (CT-CONAN); 2014 (in Spanish).
BOL Bolivia
(Plurinational State of)
2011 2016 33.4
Encuesta de Demografía y Salud - EDSA 2016. Bolivia: Indicadores Priorizados. La Paz: Ministerio de Salud, Instituto Nacional de Estadística (INE); 2017 (in Spanish).
BIH Bosnia and
Herzegovina 2009 2009 17.5
European Health for All Database (HFA-DB) [online database]. World Health Organization (WHO) Regional Office for Europe; 2012 (http://data.euro.who.int/hfadb, accessed 20 August 2012).
BIH Bosnia and
Herzegovina 2009 2012 13.9
The Agency for Statistics of Bosnia and Herzegovina, the Federal Ministry of Health, the Ministry of Health and Social Welfare of the Republic of Srpska, the Institute for Public Health of the Federation of Bosnia and Herzegovina, UNICEF. Bosnia and Herzegovina Multiple Indicator Cluster Survey (MICS) 2011–2012, Final Report. Sarajevo: UNICEF; 2013.
BIH Bosnia and
Herzegovina 2013 2013 24.1
European Health for All Database (HFA-DB) [online database]. World Health Organization (WHO) Regional Office for Europe; 2016 (http://data.euro.who.int/hfadb, accessed 8 August 2016).
BIH Bosnia and
Herzegovina 2014 2014 24.0
European Health for All Database (HFA-DB) [online database]. World Health Organization (WHO) Regional Office for Europe; 2016 (http://data.euro.who.int/hfadb, accessed 8 August 2016).
BMJ Publishing Group Limited (BMJ) disclaims all liability and responsibility arising from any relianceSupplemental material placed on this supplemental material which has been supplied by the author(s) BMJ Global Health
doi: 10.1136/bmjgh-2021-005671:e005671. 6 2021;BMJ Global Health, et al. Betran AP

58
ISO
Cod
e
Country
Coverag
e start
year
Covera
ge end
year
Caesare
an
section
rate (%)
References
BIH Bosnia and
Herzegovina 2015 2015 24.9
European Health Information Gateway. European Health for All database (HFA-DB). Caesarean sections per 1000 live births [online database]. World Health Organization (WHO) Regional Office for Europe; 2018 (https://gateway.euro.who.int/en/indicators/hfa_596-7060-caesarean-sections-per-1000-live-births/, accessed 14 February 2019).
BIH Bosnia and
Herzegovina 2017 2017 26.7
European Health Information Gateway. European Health for All database (HFA-DB). Caesarean sections per 1000 live births [online database]. World Health Organization (WHO) Regional Office for Europe; 2019 (https://gateway.euro.who.int/en/indicators/hfa_596-7060-caesarean-sections-per-1000-live-births/, accessed 5 March 2020).
BRA Brazil 1995 1995 39.6
DATASUS [online database]. Brazil: MS/SVS/DASIS - Sistema de Informações sobre Nacidos Vivos – SINASC. Nascim p/ocorrênc por Região segundo Tipo de parto. Período: 1995; 2012 (http://tabnet.datasus.gov.br/cgi/tabcgi.exe?sinasc/cnv/nvuf.def, accessed 24 August 2012, in Portuguese).
BRA Brazil 1996 1996 40.2
DATASUS [online database]. Brazil: MS/SVS/DASIS - Sistema de Informações sobre Nacidos Vivos – SINASC. Nascim p/ocorrênc por Região segundo Tipo de parto. Período: 1996; 2012 (http://tabnet.datasus.gov.br/cgi/tabcgi.exe?sinasc/cnv/nvuf.def, accessed 24 August 2012, in Portuguese).
BRA Brazil 1991 1996 36.4
Sociedade Civil Bem-Estar Familiar no Brazil, BEMFAM, Programa de Pesquisas de Demografia e Saúde (DHS) Macro International Inc. Brazil Pesquisa Nacional Sobre Demografia e Saúde 1996. Calverton, Maryland, USA: Macro International Inc.; 1997 (in Portuguese).
BRA Brazil 1997 1997 39.8
DATASUS [online database]. Brazil: MS/SVS/DASIS - Sistema de Informações sobre Nacidos Vivos – SINASC. Nascim p/ocorrênc por Região segundo Tipo de parto. Período: 1997; 2012 (http://tabnet.datasus.gov.br/cgi/tabcgi.exe?sinasc/cnv/nvuf.def, accessed 24 August 2012, in Portuguese).
BRA Brazil 1998 1998 38.1
DATASUS [online database]. Brazil: MS/SVS/DASIS - Sistema de Informações sobre Nacidos Vivos – SINASC. Nascim p/ocorrênc por Região segundo Tipo de parto. Período: 1998; 2012 (http://tabnet.datasus.gov.br/cgi/tabcgi.exe?sinasc/cnv/nvuf.def, accessed 24 August 2012, in Portuguese).
BRA Brazil 1999 1999 36.9
DATASUS [online database]. Brazil: MS/SVS/DASIS - Sistema de Informações sobre Nacidos Vivos – SINASC. Nascim p/ocorrênc por Região segundo Tipo de parto. Período: 1999; 2012 (http://tabnet.datasus.gov.br/cgi/tabcgi.exe?sinasc/cnv/nvuf.def, accessed 24 August 2012, in Portuguese).
BMJ Publishing Group Limited (BMJ) disclaims all liability and responsibility arising from any relianceSupplemental material placed on this supplemental material which has been supplied by the author(s) BMJ Global Health
doi: 10.1136/bmjgh-2021-005671:e005671. 6 2021;BMJ Global Health, et al. Betran AP

59
ISO
Cod
e
Country
Coverag
e start
year
Covera
ge end
year
Caesare
an
section
rate (%)
References
BRA Brazil 2000 2000 37.8
DATASUS [online database]. Brazil: MS/SVS/DASIS - Sistema de Informações sobre Nacidos Vivos – SINASC. Nascim p/ocorrênc por Região segundo Tipo de parto. Período: 2000; 2012 (http://tabnet.datasus.gov.br/cgi/tabcgi.exe?sinasc/cnv/nvuf.def, accessed 24 August 2012, in Portuguese).
BRA Brazil 2001 2001 38.1
DATASUS [online database]. Brazil: MS/SVS/DASIS - Sistema de Informações sobre Nacidos Vivos – SINASC. Nascim p/ocorrênc por Região segundo Tipo de parto. Período: 2001; 2012 (http://tabnet.datasus.gov.br/cgi/tabcgi.exe?sinasc/cnv/nvuf.def, accessed 24 August 2012, in Portuguese).
BRA Brazil 2002 2002 38.6
DATASUS [online database]. Brazil: MS/SVS/DASIS - Sistema de Informações sobre Nacidos Vivos – SINASC. Nascim p/ocorrênc por Região segundo Tipo de parto. Período: 2002; 2012 (http://tabnet.datasus.gov.br/cgi/tabcgi.exe?sinasc/cnv/nvuf.def, accessed 24 August 2012, in Portuguese).
BRA Brazil 2003 2003 40.0
DATASUS [online database]. Brazil: MS/SVS/DASIS - Sistema de Informações sobre Nacidos Vivos – SINASC. Nascim p/ocorrênc por Região segundo Tipo de parto. Período: 2003; 2012 (http://tabnet.datasus.gov.br/cgi/tabcgi.exe?sinasc/cnv/nvuf.def, accessed 24 August 2012, in Portuguese).
BRA Brazil 2004 2004 41.8
DATASUS [online database]. Brazil: MS/SVS/DASIS - Sistema de Informações sobre Nacidos Vivos – SINASC. Nascim p/ocorrênc por Região segundo Tipo de parto. Período: 2004; 2012 (http://tabnet.datasus.gov.br/cgi/tabcgi.exe?sinasc/cnv/nvuf.def, accessed 24 August 2012, in Portuguese).
BRA Brazil 2005 2005 43.2
DATASUS [online database]. Brazil: MS/SVS/DASIS - Sistema de Informações sobre Nacidos Vivos – SINASC. Nascim p/ocorrênc por Região segundo Tipo de parto. Período: 2005; 2012 (http://tabnet.datasus.gov.br/cgi/tabcgi.exe?sinasc/cnv/nvuf.def, accessed 24 August 2012, in Portuguese).
BRA Brazil 2006 2006 45.0
DATASUS [online database]. Brazil: MS/SVS/DASIS - Sistema de Informações sobre Nacidos Vivos – SINASC. Nascim p/ocorrênc por Região segundo Tipo de parto. Período: 2006; 2012 (http://tabnet.datasus.gov.br/cgi/tabcgi.exe?sinasc/cnv/nvuf.def, accessed 24 August 2012, in Portuguese).
BRA Brazil 2007 2007 46.5
DATASUS [online database]. Brazil: MS/SVS/DASIS - Sistema de Informações sobre Nacidos Vivos – SINASC. Nascim p/ocorrênc por Região segundo Tipo de parto. Período: 2007; 2012 (http://tabnet.datasus.gov.br/cgi/tabcgi.exe?sinasc/cnv/nvuf.def, accessed 24 August 2012, in Portuguese).
BMJ Publishing Group Limited (BMJ) disclaims all liability and responsibility arising from any relianceSupplemental material placed on this supplemental material which has been supplied by the author(s) BMJ Global Health
doi: 10.1136/bmjgh-2021-005671:e005671. 6 2021;BMJ Global Health, et al. Betran AP

60
ISO
Cod
e
Country
Coverag
e start
year
Covera
ge end
year
Caesare
an
section
rate (%)
References
BRA Brazil 2008 2008 48.4
DATASUS [online database]. Brazil: MS/SVS/DASIS - Sistema de Informações sobre Nacidos Vivos – SINASC. Nascim p/ocorrênc por Região segundo Tipo de parto. Período: 2008; 2012 (http://tabnet.datasus.gov.br/cgi/tabcgi.exe?sinasc/cnv/nvuf.def, accessed 24 August 2012, in Portuguese).
BRA Brazil 2009 2009 50.0
DATASUS [online database]. Brazil: MS/SVS/DASIS - Sistema de Informações sobre Nacidos Vivos – SINASC. Nascim p/ocorrênc por Região segundo Tipo de parto. Período: 2009; 2012 (http://tabnet.datasus.gov.br/cgi/tabcgi.exe?sinasc/cnv/nvuf.def, accessed 24 August 2012, in Portuguese).
BRA Brazil 2010 2010 52.3
DATASUS [online database]. Brazil: MS/SVS/DASIS - Sistema de Informações sobre Nacidos Vivos – SINASC. Nascim p/ocorrênc por Região segundo Tipo de parto. Período: 2010; 2012 (http://tabnet.datasus.gov.br/cgi/tabcgi.exe?sinasc/cnv/nvuf.def, accessed 24 August 2012, in Portuguese).
BRA Brazil 2011 2011 53.7
DATASUS [online database]. Brazil: MS/SVS/DASIS - Sistema de Informações sobre Nacidos Vivos – SINASC. Nascim p/resid.mãe por Tipo de parto segundo Região. Período: 2011; 2013 (http://tabnet.datasus.gov.br/cgi/tabcgi.exe?sinasc/cnv/nvuf.def, accessed 11 October 2013, in Portuguese).
BRA Brazil 2012 2012 55.6
DATASUS [online database]. Brazil: MS/SVS/DASIS - Sistema de Informações sobre Nacidos Vivos – SINASC. Nascim p/resid.mãe por Tipo de parto segundo Região. Período: 2012; 2014 (http://tabnet.datasus.gov.br/cgi/tabcgi.exe?sinasc/cnv/nvuf.def, accessed 18 December 2014, in Portuguese).
BRA Brazil 2013 2013 56.6
DATASUS [online database]. Brazil: MS/SVS/DASIS - Sistema de Informações sobre Nacidos Vivos – SINASC. Nascim p/ocorrênc por Tipo de parto Segundo Região. Período: 2013; 2016 (http://tabnet.datasus.gov.br/cgi/deftohtm.exe? sinasc/cnv/nvuf.def, accessed 8 July 2016, in Portuguese).
BRA Brazil 2014 2014 57.0
DATASUS [online database]. Brazil: MS/SVS/DASIS - Sistema de Informações sobre Nacidos Vivos – SINASC. Nascim p/ocorrênc por Tipo de parto Segundo Região. Período: 2014; 2016 (http://tabnet.datasus.gov.br/cgi/deftohtm.exe? sinasc/cnv/nvuf.def, accessed 8 July 2016, in Portuguese).
BRA Brazil 2015 2015 55.5
DATASUS [online database]. Brazil: MS/SVS/DASIS - Sistema de Informações sobre Nacidos Vivos – SINASC. Nascim p/ocorrênc por Tipo de parto Segundo Região. Período: 2015; 2017 (http://tabnet.datasus.gov.br/cgi/deftohtm.exe? sinasc/cnv/nvuf.def, accessed 2017, in Portuguese).
BMJ Publishing Group Limited (BMJ) disclaims all liability and responsibility arising from any relianceSupplemental material placed on this supplemental material which has been supplied by the author(s) BMJ Global Health
doi: 10.1136/bmjgh-2021-005671:e005671. 6 2021;BMJ Global Health, et al. Betran AP

61
ISO
Cod
e
Country
Coverag
e start
year
Covera
ge end
year
Caesare
an
section
rate (%)
References
BRA Brazil 2016 2016 55.4
DATASUS [online database]. Brazil: MS/SVS/DASIS - Sistema de Informações sobre Nacidos Vivos – SINASC. Nascim p/ocorrênc por Tipo de parto Segundo Região. Período: 2016; 2019 (http://tabnet.datasus.gov.br/cgi/tabcgi.exe?sinasc/cnv/nvuf.def, accessed 12 February 2019, in Portuguese).
BRA Brazil 2017 2017 55.7
DATASUS [online database]. Brazil: MS/SVS/DASIS - Sistema de Informações sobre Nacidos Vivos – SINASC. Nascim p/ocorrênc por Tipo de parto Segundo Região. Período: 2017; 2020 (http://tabnet.datasus.gov.br/cgi/tabcgi.exe?sinasc/cnv/nvuf.def, accessed 20 February 2020, in Portuguese).
BGR Bulgaria 1990 1990 7.3
European Health for All Database (HFA-DB) [online database]. World Health Organization (WHO) Regional Office for Europe; 2012 (http://data.euro.who.int/hfadb, accessed 20 August 2012).
BGR Bulgaria 1991 1991 7.1
European Health for All Database (HFA-DB) [online database]. World Health Organization (WHO) Regional Office for Europe; 2012 (http://data.euro.who.int/hfadb, accessed 20 August 2012).
BGR Bulgaria 1992 1992 7.8
European Health for All Database (HFA-DB) [online database]. World Health Organization (WHO) Regional Office for Europe; 2012 (http://data.euro.who.int/hfadb, accessed 20 August 2012).
BGR Bulgaria 1993 1993 8.5
European Health for All Database (HFA-DB) [online database]. World Health Organization (WHO) Regional Office for Europe; 2012 (http://data.euro.who.int/hfadb, accessed 20 August 2012).
BGR Bulgaria 1994 1994 9.2
European Health for All Database (HFA-DB) [online database]. World Health Organization (WHO) Regional Office for Europe; 2012 (http://data.euro.who.int/hfadb, accessed 20 August 2012).
BGR Bulgaria 1995 1995 10.0
European Health for All Database (HFA-DB) [online database]. World Health Organization (WHO) Regional Office for Europe; 2012 (http://data.euro.who.int/hfadb, accessed 20 August 2012).
BMJ Publishing Group Limited (BMJ) disclaims all liability and responsibility arising from any relianceSupplemental material placed on this supplemental material which has been supplied by the author(s) BMJ Global Health
doi: 10.1136/bmjgh-2021-005671:e005671. 6 2021;BMJ Global Health, et al. Betran AP

62
ISO
Cod
e
Country
Coverag
e start
year
Covera
ge end
year
Caesare
an
section
rate (%)
References
BGR Bulgaria 1996 1996 10.3
European Health for All Database (HFA-DB) [online database]. World Health Organization (WHO) Regional Office for Europe; 2012 (http://data.euro.who.int/hfadb, accessed 20 August 2012).
BGR Bulgaria 1997 1997 11.0
European Health for All Database (HFA-DB) [online database]. World Health Organization (WHO) Regional Office for Europe; 2012 (http://data.euro.who.int/hfadb, accessed 20 August 2012).
BGR Bulgaria 1998 1998 12.4
European Health for All Database (HFA-DB) [online database]. World Health Organization (WHO) Regional Office for Europe; 2012 (http://data.euro.who.int/hfadb, accessed 20 August 2012).
BGR Bulgaria 1999 1999 13.1
European Health for All Database (HFA-DB) [online database]. World Health Organization (WHO) Regional Office for Europe; 2012 (http://data.euro.who.int/hfadb, accessed 20 August 2012).
BGR Bulgaria 2000 2000 13.5
European Health for All Database (HFA-DB) [online database]. World Health Organization (WHO) Regional Office for Europe; 2012 (http://data.euro.who.int/hfadb, accessed 20 August 2012).
BGR Bulgaria 2001 2001 14.7
European Health for All Database (HFA-DB) [online database]. World Health Organization (WHO) Regional Office for Europe; 2012 (http://data.euro.who.int/hfadb, accessed 20 August 2012).
BGR Bulgaria 2002 2002 16.8
European Health for All Database (HFA-DB) [online database]. World Health Organization (WHO) Regional Office for Europe; 2012 (http://data.euro.who.int/hfadb, accessed 20 August 2012).
BGR Bulgaria 2003 2003 17.5
European Health for All Database (HFA-DB) [online database]. World Health Organization (WHO) Regional Office for Europe; 2012 (http://data.euro.who.int/hfadb, accessed 20 August 2012).
BMJ Publishing Group Limited (BMJ) disclaims all liability and responsibility arising from any relianceSupplemental material placed on this supplemental material which has been supplied by the author(s) BMJ Global Health
doi: 10.1136/bmjgh-2021-005671:e005671. 6 2021;BMJ Global Health, et al. Betran AP

63
ISO
Cod
e
Country
Coverag
e start
year
Covera
ge end
year
Caesare
an
section
rate (%)
References
BGR Bulgaria 2004 2004 19.2
European Health for All Database (HFA-DB) [online database]. World Health Organization (WHO) Regional Office for Europe; 2012 (http://data.euro.who.int/hfadb, accessed 20 August 2012).
BGR Bulgaria 2005 2005 22.0
European Health for All Database (HFA-DB) [online database]. World Health Organization (WHO) Regional Office for Europe; 2012 (http://data.euro.who.int/hfadb, accessed 20 August 2012).
BGR Bulgaria 2006 2006 23.6
European Health for All Database (HFA-DB) [online database]. World Health Organization (WHO) Regional Office for Europe; 2012 (http://data.euro.who.int/hfadb, accessed 20 August 2012).
BGR Bulgaria 2007 2007 26.8
European Health for All Database (HFA-DB) [online database]. World Health Organization (WHO) Regional Office for Europe; 2012 (http://data.euro.who.int/hfadb, accessed 20 August 2012).
BGR Bulgaria 2008 2008 28.4
European Health for All Database (HFA-DB) [online database]. World Health Organization (WHO) Regional Office for Europe; 2012 (http://data.euro.who.int/hfadb, accessed 20 August 2012).
BGR Bulgaria 2009 2009 32.8
European Health for All Database (HFA-DB) [online database]. World Health Organization (WHO) Regional Office for Europe; 2012 (http://data.euro.who.int/hfadb, accessed 20 August 2012).
BGR Bulgaria 2010 2010 31.0
European Health for All Database (HFA-DB) [online database]. World Health Organization (WHO) Regional Office for Europe; 2016 (http://data.euro.who.int/hfadb, accessed 8 August 2016).
BGR Bulgaria 2011 2011 33.1
European Health for All Database (HFA-DB) [online database]. World Health Organization (WHO) Regional Office for Europe; 2016 (http://data.euro.who.int/hfadb, accessed 8 August 2016).
BMJ Publishing Group Limited (BMJ) disclaims all liability and responsibility arising from any relianceSupplemental material placed on this supplemental material which has been supplied by the author(s) BMJ Global Health
doi: 10.1136/bmjgh-2021-005671:e005671. 6 2021;BMJ Global Health, et al. Betran AP

64
ISO
Cod
e
Country
Coverag
e start
year
Covera
ge end
year
Caesare
an
section
rate (%)
References
BGR Bulgaria 2012 2012 33.4
European Health for All Database (HFA-DB) [online database]. World Health Organization (WHO) Regional Office for Europe; 2016 (http://data.euro.who.int/hfadb, accessed 8 August 2016).
BGR Bulgaria 2013 2013 36.0
European Health for All Database (HFA-DB) [online database]. World Health Organization (WHO) Regional Office for Europe; 2016 (http://data.euro.who.int/hfadb, accessed 8 August 2016).
BGR Bulgaria 2014 2014 39.1
European Health for All Database (HFA-DB) [online database]. World Health Organization (WHO) Regional Office for Europe; 2016 (http://data.euro.who.int/hfadb, accessed 8 August 2016).
BGR Bulgaria 2015 2015 43.0
European Perinatal Health Report. Core indicators of the health and care of pregnant women and babies in Europe in 2015. Euro-Peristat Project; 2018.
BFA Burkina Faso 1988 1993 1.3
Institut National de la Statistique et de la Démographie, Macro International Inc. Enquête Démographique et de Santé Burkina Faso 1993. Calverton, Maryland USA: Macro International Inc.; 1994 (in French).
BFA Burkina Faso 1993 1999 1.1
Institut National de la Statistique et de la Démographie, Macro International Inc. Enquête Démographique et de Santé, Burkina Faso 1998-1999. Calverton, Maryland, USA: Macro International Inc.; 2000 (in French).
BFA Burkina Faso 1998 2003 0.7
Institut National de la Statistique et de la Démographie (INSD), ORC Macro. Enquête Démographique et de Santé du Burkina Faso 2003. Calverton, Maryland, USA: INSD; ORC Macro; 2004 (in French).
BFA Burkina Faso 2005 2010 1.9
Institut National de la Statistique et de la Démographie (INSD), ICF International. Enquête Démographique et de Santé et à Indicateurs Multiples du Burkina Faso 2010. Calverton, Maryland, USA: INSD, ICF International; 2012 (in French).
BMJ Publishing Group Limited (BMJ) disclaims all liability and responsibility arising from any relianceSupplemental material placed on this supplemental material which has been supplied by the author(s) BMJ Global Health
doi: 10.1136/bmjgh-2021-005671:e005671. 6 2021;BMJ Global Health, et al. Betran AP

65
ISO
Cod
e
Country
Coverag
e start
year
Covera
ge end
year
Caesare
an
section
rate (%)
References
BFA Burkina Faso 2010 2015 3.7
Rapport du Module Démographie et Santé (MDS) de L’Enquête Multisectorielle Continue (EMC). Version en relecture. Burkina Faso: Institut National de la Statistique et de la Démographie (INSD); 2016 (in French).
BDI Burundi 2005 2010 4.0
Institut de Statistiques et d’Études Économiques du Burundi (ISTEEBU), Ministère de la Santé Publique et de la Lutte contre le Sida [Burundi] (MSPLS), ICF International. Enquête Démographique et de Santé Burundi 2010. Bujumbura, Burundi: ISTEEBU, MSPLS, ICF International; 2012 (in French).
BDI Burundi 2011 2017 5.0
Ministère à la Présidence chargé de la Bonne Gouvernance et du Plan [Burundi] (MPBGP), Ministère de la Santé Publique et de la Lutte contre le Sida [Burundi] (MSPLS), Institut de Statistiques et d’Études Économiques du Burundi (ISTEEBU), ICF. Troisième Enquête Démographique et de Santé. Bujumbura, Burundi : ISTEEBU, MSPLS, ICF; 2017 (in French).
CPV Cabo Verde 1993 1998 6.0
Inquérito Demográfico e de Saúde Reprodutiva IDSR 1998. Cabo Verde Relatório Final. Praia: Instituto Nacional de Estatística (INE) [Cabo Verde], CDC; 2000 (in Portuguese).
CPV Cabo Verde 2000 2005 10.7
Instituto Nacional de Estatística (INE) [Cabo Verde], Ministério da Saúde, Macro International. Segundo Inquérito Demográfico e de Saúde Reprodutiva, Cabo Verde, IDSR-II, 2005. Calverton, Maryland, USA: INE; 2008 (in Portuguese).
KHM Cambodia 1995 2000 0.8
National Institute of Statistics, Directorate General for Health [Cambodia], ORC Macro. Cambodia Demographic and Health Survey 2000. Phnom Penh, Cambodia, and Calverton, Maryland USA: National Institute of Statistics, Directorate General for Health, ORC Macro; 2001.
KHM Cambodia 2000 2005 1.8
National Institute of Public Health, National Institute of Statistics [Cambodia], ORC Macro. Cambodia Demographic and Health Survey 2005. Phnom Penh, Cambodia and Calverton, Maryland, USA: National Institute of Public Health, National Institute of Statistics, ORC Macro; 2006.
KHM Cambodia 2005 2010 3.0
National Institute of Statistics, Directorate General for Health, ICF Macro. Cambodia Demographic and Health Survey 2010. Phnom Penh, Cambodia and Calverton, Maryland, USA: National Institute of Statistics, Directorate General for Health, ICF Macro; 2011.
BMJ Publishing Group Limited (BMJ) disclaims all liability and responsibility arising from any relianceSupplemental material placed on this supplemental material which has been supplied by the author(s) BMJ Global Health
doi: 10.1136/bmjgh-2021-005671:e005671. 6 2021;BMJ Global Health, et al. Betran AP

66
ISO
Cod
e
Country
Coverag
e start
year
Covera
ge end
year
Caesare
an
section
rate (%)
References
KHM Cambodia 2009 2014 6.3
National Institute of Statistics, Directorate General for Health, ICF International. Cambodia Demographic and Health Survey 2014. Phnom Penh, Cambodia, and Rockville, Maryland, USA: National Institute of Statistics, Directorate General for Health, ICF International; 2015.
CMR Cameroon 1993 1998 2.5
Fotso M, Ndonou R, Libité PR, Tsafack M, Wakou R, Ghapoutsa A et al. (Bureau Central des Recensements et des Études de Population et Macro International Inc.). Enquête Démographique et de Santé, Cameroun 1998. Calverton, Maryland, USA: Bureau Central des Recensements et des Études de Population, Macro International Inc.; 1999 (in French).
CMR Cameroon 1999 2004 2.0
Institut National de la Statistique (INS) et ORC Macro. Enquête Démographique et de Santé du Cameroun 2004. Calverton, Maryland, USA: INS et ORC Macro; 2005 (in French).
CMR Cameroon 2006 2011 3.8
Institut National de la Statistique (INS) et ICF. International. Enquête Démographique et de Santé et à Indicateurs Multiples du Cameroun 2011. Calverton, Maryland, USA: INS et ICF International; 2012 (in French.
CMR Cameroon 2012 2014 2.4
Institut National de la Statistique, UNICEF. Enquête par grappes à indicateurs multiples (MICS5), 2014, Rapport Final. Yaoundé, Cameroun, Institut National de la Statistique; 2015 (in French).
CAN Canada 1994 1994 17.8
Canadian Perinatal Health Report 2000. Ottawa: Minister of Public Works and Government Services Canada; 2000.
CAN Canada 1995 1995 17.6
Canadian Perinatal Health Report 2008 Edition. Ottawa: Public Health Agency of Canada; 2008.
CAN Canada 1996 1996 18.2
Canadian Perinatal Health Report 2008 Edition. Ottawa: Public Health Agency of Canada; 2008.
BMJ Publishing Group Limited (BMJ) disclaims all liability and responsibility arising from any relianceSupplemental material placed on this supplemental material which has been supplied by the author(s) BMJ Global Health
doi: 10.1136/bmjgh-2021-005671:e005671. 6 2021;BMJ Global Health, et al. Betran AP

67
ISO
Cod
e
Country
Coverag
e start
year
Covera
ge end
year
Caesare
an
section
rate (%)
References
CAN Canada 1997 1997 18.5
Canadian Perinatal Health Report 2008 Edition. Ottawa: Public Health Agency of Canada; 2008.
CAN Canada 1998 1998 19.0
Canadian Perinatal Health Report 2008 Edition. Ottawa: Public Health Agency of Canada; 2008.
CAN Canada 1999 1999 19.7
Canadian Perinatal Health Report 2008 Edition. Ottawa: Public Health Agency of Canada; 2008.
CAN Canada 2000 2000 21.9
Perinatal Health Indicators for Canada 2011. Ottawa: Public Health Agency of Canada; 2012.
CAN Canada 2001 2001 23.4
Perinatal Health Indicators for Canada 2011. Ottawa: Public Health Agency of Canada; 2012.
CAN Canada 2002 2002 24.5
Perinatal Health Indicators for Canada 2011. Ottawa: Public Health Agency of Canada; 2012.
CAN Canada 2003 2003 25.8
Perinatal Health Indicators for Canada 2011. Ottawa: Public Health Agency of Canada; 2012.
CAN Canada 2004 2004 26.5
Perinatal Health Indicators for Canada 2011. Ottawa: Public Health Agency of Canada; 2012.
BMJ Publishing Group Limited (BMJ) disclaims all liability and responsibility arising from any relianceSupplemental material placed on this supplemental material which has been supplied by the author(s) BMJ Global Health
doi: 10.1136/bmjgh-2021-005671:e005671. 6 2021;BMJ Global Health, et al. Betran AP

68
ISO
Cod
e
Country
Coverag
e start
year
Covera
ge end
year
Caesare
an
section
rate (%)
References
CAN Canada 2005 2005 27.3
Perinatal Health Indicators for Canada 2011. Ottawa: Public Health Agency of Canada; 2012.
CAN Canada 2006 2006 27.3
Perinatal Health Indicators for Canada 2011. Ottawa: Public Health Agency of Canada; 2012.
CAN Canada 2007 2007 27.7
Perinatal Health Indicators for Canada 2011. Ottawa: Public Health Agency of Canada; 2012.
CAN Canada 2008 2008 28.0
Perinatal Health Indicators for Canada 2011. Ottawa: Public Health Agency of Canada; 2012.
CAN Canada 2009 2009 27.8
Perinatal Health Indicators for Canada 2011. Ottawa: Public Health Agency of Canada; 2012.
CAN Canada 2010 2011 26.9
Health Indicators 2012. Ottawa: Canadian Institute for Health Information (CIHI); 2012.
CAN Canada 2011 2012 27.1
Health Indicators 2013. Ottawa: Canadian Institute for Health Information (CIHI); 2013.
CAN Canada 2014 2014 27.5
Health Indicators Interactive Tool. Health System Performance. 2014. Caesarean Section-2014-Percent [database]. Ottawa: Canadian Institute for Health Information (CIHI); 2016 (http://yourhealthsystem.cihi.ca/epub/SearchServlet, accessed on 30 June 2016).
BMJ Publishing Group Limited (BMJ) disclaims all liability and responsibility arising from any relianceSupplemental material placed on this supplemental material which has been supplied by the author(s) BMJ Global Health
doi: 10.1136/bmjgh-2021-005671:e005671. 6 2021;BMJ Global Health, et al. Betran AP

69
ISO
Cod
e
Country
Coverag
e start
year
Covera
ge end
year
Caesare
an
section
rate (%)
References
CAN Canada 2015 2015 27.9
Health Indicators Interactive Tool. Health System Performance. 2015. Caesarean Section-2015-Percent [database]. Ottawa: Canadian Institute for Health Information (CIHI); 2017 (http://yourhealthsystem.cihi.ca/epub/SearchServlet, accessed on 22 December 2017).
CAN Canada 2016 2016 28.2
Health Indicators Interactive Tool. Health System Performance. 2016. Caesarean Section-2016-Percent [database]. Ottawa: Canadian Institute for Health Information (CIHI); 2019 (http://yourhealthsystem.cihi.ca/epub/SearchServlet, accessed on 12 February 2019).
CAN Canada 2017 2017 28.8
Health Indicators Interactive Tool. Health System Performance. 2016. Caesarean Section-2017-Percent [database]. Ottawa: Canadian Institute for Health Information (CIHI); 2020 (http://yourhealthsystem.cihi.ca/epub/SearchServlet, accessed on 20 February 2020).
CAF Central African
Republic 1991 1995 1.9
Ndamobissi R, Mboup G, Nguélébé EO. Enquête Démographique et de Santé, République Centrafricaine 1994-95. Calverton, Maryland, USA: Direction des Statistiques Démographiques et Sociales et Macro International Inc.; 1995 (in French).
CAF Central African
Republic 2008 2010 4.5
ICASEES, Fonds des Nations Unies pour l'Enfance (UNICEF). Enquête par grappes à indicateurs multiples MICS, RCA 2010 Rapport final. Bangui: RCA ICASEES; 2012 (in French).
TCD Chad 1991 1997 0.5
Ouagadjio B, Nodjimadji K, Ngoniri JN, Ngakoutou N, Ignégongba K, Tokindang JS et al. (Bureau Central du Recensement, Macro International Inc.) Enquête Démographique et de Santé, Tchad 1996-1997. Calverton, Maryland, USA: Bureau Central du Recensement, Macro International Inc.; 1998 (in French).
TCD Chad 1999 2004 0.4
Ouagadjio B, Nodjimadji K, Bagamla T, Madnodji R, Tokindang JS, Ngakoutou N et al. (INSEED, ORC Macro). Enquête Démographique et de Santé Tchad 2004. Calverton, Maryland, USA: INSEED, ORC Macro; 2005 (in French).
TCD Chad 2008 2010 1.5
Enquête par grappes à indicateurs multiples Tchad 2010 - Rapport Final. Tchad: Ministère du Plan, de l’Economie et de la Coopération Internationale. Institut National de la Statistique, des Études Économiques et Démographiques (INSEED), Fonds des Nations Unies pour la population (FNUAP/UNFPA), Fonds des Nations Unies pour l'Enfance (UNICEF); 2011 (in French).
BMJ Publishing Group Limited (BMJ) disclaims all liability and responsibility arising from any relianceSupplemental material placed on this supplemental material which has been supplied by the author(s) BMJ Global Health
doi: 10.1136/bmjgh-2021-005671:e005671. 6 2021;BMJ Global Health, et al. Betran AP

70
ISO
Cod
e
Country
Coverag
e start
year
Covera
ge end
year
Caesare
an
section
rate (%)
References
TCD Chad 2009 2015 1.4
Institut National de la Statistique, des Études Économiques et Démographiques (INSEED), Ministère de la Santé Publique (MSP), ICF International. Enquête Démographique et de Santé et à Indicateurs Multiples (EDS-MICS 2014-2015). Rockville, Maryland, USA : INSEED, MSP, ICF International; 2016 (in French).
CHL Chile 1990 1990 30.6
Murray SF, Serani Pradenas F. Cesarean Birth Trends in Chile, 1986 to 1994. Birth. 1997; 24:4:258-63.
CHL Chile 1991 1991 33.1
Murray SF, Serani Pradenas F. Cesarean Birth Trends in Chile, 1986 to 1994. Birth. 1997; 24:4:258-63.
CHL Chile 1992 1992 34.8
Murray SF, Serani Pradenas F. Cesarean Birth Trends in Chile, 1986 to 1994. Birth. 1997; 24:4:258-63.
CHL Chile 1993 1993 36.0
Murray SF, Serani Pradenas F. Cesarean Birth Trends in Chile, 1986 to 1994. Birth. 1997; 24:4:258-63.
CHL Chile 1994 1994 37.2
Murray SF, Serani Pradenas F. Cesarean Birth Trends in Chile, 1986 to 1994. Birth. 1997; 24:4:258-63.
CHL Chile 2001 2001 30.7
Guzmán E. Perfil epidemiológico de la cesárea en Chile en la década 2000-2010 [Epidemiological profile of caesarean section in Chile in the decade 2000-2010]. Medwave. 2012;12(3):e5331. Doi: 10.5867/medwave.2012.03.5331 (in Spanish).
CHL Chile 2002 2002 30.7
Guzmán E. Perfil epidemiológico de la cesárea en Chile en la década 2000-2010 [Epidemiological profile of caesarean section in Chile in the decade 2000-2010]. Medwave. 2012;12(3):e5331. Doi: 10.5867/medwave.2012.03.5331 (in Spanish).
BMJ Publishing Group Limited (BMJ) disclaims all liability and responsibility arising from any relianceSupplemental material placed on this supplemental material which has been supplied by the author(s) BMJ Global Health
doi: 10.1136/bmjgh-2021-005671:e005671. 6 2021;BMJ Global Health, et al. Betran AP

71
ISO
Cod
e
Country
Coverag
e start
year
Covera
ge end
year
Caesare
an
section
rate (%)
References
CHL Chile 2003 2003 30.9
Guzmán E. Perfil epidemiológico de la cesárea en Chile en la década 2000-2010 [Epidemiological profile of caesarean section in Chile in the decade 2000-2010]. Medwave. 2012;12(3):e5331. Doi: 10.5867/medwave.2012.03.5331 (in Spanish).
CHL Chile 2004 2004 31.6
Guzmán E. Perfil epidemiológico de la cesárea en Chile en la década 2000-2010 [Epidemiological profile of caesarean section in Chile in the decade 2000-2010]. Medwave. 2012;12(3):e5331. Doi: 10.5867/medwave.2012.03.5331 (in Spanish).
CHL Chile 2005 2005 32.4
Guzmán E. Perfil epidemiológico de la cesárea en Chile en la década 2000-2010 [Epidemiological profile of caesarean section in Chile in the decade 2000-2010]. Medwave. 2012;12(3):e5331. Doi: 10.5867/medwave.2012.03.5331 (in Spanish).
CHL Chile 2006 2006 33.7
Guzmán E. Perfil epidemiológico de la cesárea en Chile en la década 2000-2010 [Epidemiological profile of caesarean section in Chile in the decade 2000-2010]. Medwave. 2012;12(3):e5331. Doi: 10.5867/medwave.2012.03.5331 (in Spanish).
CHL Chile 2007 2007 34.7
Guzmán E. Perfil epidemiológico de la cesárea en Chile en la década 2000-2010 [Epidemiological profile of caesarean section in Chile in the decade 2000-2010]. Medwave. 2012;12(3):e5331. Doi: 10.5867/medwave.2012.03.5331 (in Spanish).
CHL Chile 2008 2008 35.7
Guzmán E. Perfil epidemiológico de la cesárea en Chile en la década 2000-2010 [Epidemiological profile of caesarean section in Chile in the decade 2000-2010]. Medwave. 2012;12(3):e5331. Doi: 10.5867/medwave.2012.03.5331 (in Spanish).
CHL Chile 2009 2009 36.4
Guzmán E. Perfil epidemiológico de la cesárea en Chile en la década 2000-2010 [Epidemiological profile of caesarean section in Chile in the decade 2000-2010]. Medwave. 2012;12(3):e5331. Doi: 10.5867/medwave.2012.03.5331 (in Spanish).
CHL Chile 2010 2010 37.0
Guzmán E. Perfil epidemiológico de la cesárea en Chile en la década 2000-2010 [Epidemiological profile of caesarean section in Chile in the decade 2000-2010]. Medwave. 2012;12(3):e5331. Doi: 10.5867/medwave.2012.03.5331 (in Spanish).
BMJ Publishing Group Limited (BMJ) disclaims all liability and responsibility arising from any relianceSupplemental material placed on this supplemental material which has been supplied by the author(s) BMJ Global Health
doi: 10.1136/bmjgh-2021-005671:e005671. 6 2021;BMJ Global Health, et al. Betran AP

72
ISO
Cod
e
Country
Coverag
e start
year
Covera
ge end
year
Caesare
an
section
rate (%)
References
CHL Chile 2012 2012 49.6
Segunda ronda encuesta longitudinal de la primera infancia. Informe resultados encuesta. Santiago: Centro Micro Datos, Departamento de Economía, Universidad de Chile; 2013 (in Spanish).
CHN China 2003 2003 11.0
Xu, K. [e-mail, 3 March 2010].
CHN China 2008 2008 28.8
Li H-T, Luo S, Trasande L, Hellerstein S, Kang C, Li J-X et al. Geographic Variations and Temporal Trends in Cesarean Delivery Rates in China, 2008-2014. JAMA. 2017; 317(1):69-76. doi: 10.1001/jama.2016.18663.
CHN China 2009 2009 30.6
Li H-T, Luo S, Trasande L, Hellerstein S, Kang C, Li J-X et al. Geographic Variations and Temporal Trends in Cesarean Delivery Rates in China, 2008-2014. JAMA. 2017; 317(1):69-76. doi: 10.1001/jama.2016.18663.
CHN China 2010 2010 31.9
Li H-T, Luo S, Trasande L, Hellerstein S, Kang C, Li J-X et al. Geographic Variations and Temporal Trends in Cesarean Delivery Rates in China, 2008-2014. JAMA. 2017; 317(1):69-76. doi: 10.1001/jama.2016.18663.
CHN China 2011 2011 33.1
Li H-T, Luo S, Trasande L, Hellerstein S, Kang C, Li J-X et al. Geographic Variations and Temporal Trends in Cesarean Delivery Rates in China, 2008-2014. JAMA. 2017; 317(1):69-76. doi: 10.1001/jama.2016.18663.
CHN China 2012 2012 34.0
Li H-T, Luo S, Trasande L, Hellerstein S, Kang C, Li J-X et al. Geographic Variations and Temporal Trends in Cesarean Delivery Rates in China, 2008-2014. JAMA. 2017; 317(1):69-76. doi: 10.1001/jama.2016.18663.
CHN China 2013 2013 34.6
Li H-T, Luo S, Trasande L, Hellerstein S, Kang C, Li J-X et al. Geographic Variations and Temporal Trends in Cesarean Delivery Rates in China, 2008-2014. JAMA. 2017; 317(1):69-76. doi: 10.1001/jama.2016.18663.
BMJ Publishing Group Limited (BMJ) disclaims all liability and responsibility arising from any relianceSupplemental material placed on this supplemental material which has been supplied by the author(s) BMJ Global Health
doi: 10.1136/bmjgh-2021-005671:e005671. 6 2021;BMJ Global Health, et al. Betran AP

73
ISO
Cod
e
Country
Coverag
e start
year
Covera
ge end
year
Caesare
an
section
rate (%)
References
CHN China 2014 2014 34.9
Li H-T, Luo S, Trasande L, Hellerstein S, Kang C, Li J-X et al. Geographic Variations and Temporal Trends in Cesarean Delivery Rates in China, 2008-2014. JAMA. 2017; 317(1):69-76. doi: 10.1001/jama.2016.18663.
COL Colombia 1990 1995 16.9
Profamilia, Macro International Inc. Encuesta Nacional de Demografía y Salud 1995. Bogotá, Colombia: Profamilia, Macro International; 1995 (in Spanish).
COL Colombia 1999 1999 26.1
DANE [online database]. Estadísticas Vitales – Nacimientos por tipo de parto, según departamento de residencia de la madre y multiplicidad del embarazo. 1999. Bogotá D.C.: Departamento Administrativo Nacional de Estadística (DANE); 2012 (http://www.dane.gov.co/index.php?option=com_content&view=article&id=786&Itemid=119, accessed 29 August 2012, in Spanish).
COL Colombia 2000 2000 26.9
DANE [online database]. Estadísticas Vitales – Nacimientos por tipo de parto, según departamento de residencia de la madre y multiplicidad del embarazo. 2000. Bogotá D.C.: Departamento Administrativo Nacional de Estadística (DANE); 2012 (http://www.dane.gov.co/index.php?option=com_content&view=article&id=786&Itemid=119, accessed 29 August 2012, in Spanish).
COL Colombia 1995 2000 23.6
Profamilia, Macro International Inc. Salud Sexual y Reproductiva en Colombia. Resultados Encuesta Nacional de Demografía y Salud 2000. Bogotá, Colombia: Profamilia; 2000 (in Spanish).
COL Colombia 2001 2001 27.3
DANE [online database]. Estadísticas Vitales – Nacimientos por tipo de parto, según departamento de residencia de la madre y multiplicidad del embarazo. 2001. Bogotá D.C.: Departamento Administrativo Nacional de Estadística (DANE); 2012 (http://www.dane.gov.co/index.php?option=com_content&view=article&id=786&Itemid=119, accessed 29 August 2012, in Spanish).
COL Colombia 2004 2004 29.4
DANE [online database]. Estadísticas Vitales – Nacimientos por tipo de parto, según departamento de residencia de la madre y multiplicidad del embarazo. 2004. Bogotá D.C.: Departamento Administrativo Nacional de Estadística (DANE); 2012 (http://www.dane.gov.co/index.php?option=com_content&view=article&id=786&Itemid=119, accessed 29 August 2012, in Spanish).
COL Colombia 2005 2005 31.3
DANE [online database]. Estadísticas Vitales – Nacimientos por tipo de parto, según departamento de residencia de la madre y multiplicidad del embarazo. 2005. Bogotá D.C.: Departamento Administrativo Nacional de Estadística (DANE); 2012 (http://www.dane.gov.co/index.php?option=com_content&view=article&id=786&Itemid=119, accessed 29 August 2012, in Spanish).
BMJ Publishing Group Limited (BMJ) disclaims all liability and responsibility arising from any relianceSupplemental material placed on this supplemental material which has been supplied by the author(s) BMJ Global Health
doi: 10.1136/bmjgh-2021-005671:e005671. 6 2021;BMJ Global Health, et al. Betran AP

74
ISO
Cod
e
Country
Coverag
e start
year
Covera
ge end
year
Caesare
an
section
rate (%)
References
COL Colombia 2000 2005 26.7
Ojeda G (Profamilia), Ordonez M (Profamilia), Ochoa LH (Macro International Inc.). Colombia Salud Sexual y Reproductiva: Resultados Encuesta Nacional de Demografía y Salud 2005. Bogotá, Colombia: Profamilia; 2005 (in Spanish).
COL Colombia 2006 2006 33.2
DANE [online database]. Estadísticas Vitales – Nacimientos por tipo de parto, según departamento de residencia de la madre y multiplicidad del embarazo. 2006. Bogotá D.C.: Departamento Administrativo Nacional de Estadística (DANE); 2012 (http://www.dane.gov.co/index.php?option=com_content&view=article&id=786&Itemid=119, accessed 29 August 2012, in Spanish).
COL Colombia 2009 2009 39.0
DANE [online database]. Estadísticas Vitales – Nacimientos por tipo de parto, según departamento de residencia de la madre y multiplicidad del embarazo. 2009. Bogotá D.C.: Departamento Administrativo Nacional de Estadística (DANE); 2012 (http://www.dane.gov.co/index.php?option=com_content&view=article&id=786&Itemid=119, accessed 29 August 2012, in Spanish).
COL Colombia 2010 2010 40.1
DANE [online database]. Estadísticas Vitales – Nacimientos por tipo de parto, según departamento de residencia de la madre y multiplicidad del embarazo. 2010. Bogotá D.C.: Departamento Administrativo Nacional de Estadística (DANE); 2012 (http://www.dane.gov.co/index.php?option=com_content&view=article&id=786&Itemid=119, accessed 29 August 2012, in Spanish).
COL Colombia 2005 2010 34.4
Ojeda G, Ordonez M, Ochoa LH (Profamilia), ICF Macro. Colombia Encuesta Nacional de Demografía y Salud 2010. Bogotá, Colombia: Profamilia; 2011 (in Spanish).
COL Colombia 2011 2011 42.8
DANE [online database]. Estadísticas Vitales – Nacimientos por tipo de parto, según departamento de residencia de la madre y multiplicidad del embarazo. 2011. Bogotá D.C.: Departamento Administrativo Nacional de Estadística (DANE); 2012 (http://www.dane.gov.co/index.php?option=com_content&view=article&id=786&Itemid=119, accessed 29 August 2012, in Spanish).
COL Colombia 2014 2014 46.2
DANE [online database]. Estadísticas Vitales – Nacimientos por tipo de parto, según departamento de residencia de la madre y multiplicidad del embarazo. 2014. Bogotá D.C.: Departamento Administrativo Nacional de Estadística (DANE); 2016 (http://www.dane.gov.com, accessed 11 July 2016, in Spanish).
COL Colombia 2015 2015 46.4
DANE [online database]. Estadísticas Vitales – Nacimientos por tipo de parto, según departamento de residencia de la madre y multiplicidad del embarazo. 2015. Bogotá D.C.: Departamento Administrativo Nacional de Estadística (DANE); 2017 (http://www.dane.gov.com, accessed 31 October 2017, in Spanish).
BMJ Publishing Group Limited (BMJ) disclaims all liability and responsibility arising from any relianceSupplemental material placed on this supplemental material which has been supplied by the author(s) BMJ Global Health
doi: 10.1136/bmjgh-2021-005671:e005671. 6 2021;BMJ Global Health, et al. Betran AP

75
ISO
Cod
e
Country
Coverag
e start
year
Covera
ge end
year
Caesare
an
section
rate (%)
References
COL Colombia 2016 2016 45.8
DANE [online database]. Estadísticas Vitales – Nacimientos por tipo de parto, según departamento de residencia de la madre y multiplicidad del embarazo. 2016. Bogotá D.C.: Departamento Administrativo Nacional de Estadística (DANE); 2017 (http://www.dane.gov.com, accessed 31 October 2017, in Spanish).
COL Colombia 2010 2015 43.2
Ministerio de Salud y Protección Social, Profamilia. Colombia Encuesta Nacional de Demográfia y Salud 2015. Bogotá, Colombia: Profamilia; 2017 (in Spanish).
COL Colombia 2017 2017 45.5
DANE [online database]. Estadísticas Vitales – Nacimientos por tipo de parto, según departamento de residencia de la madre y multiplicidad del embarazo. 2017. Bogotá D.C.: Departamento Administrativo Nacional de Estadística (DANE); 2019 (http://www.dane.gov.com, accessed 12 February 2019, in Spanish).
COL Colombia 2018 2018 44.4
DANE [online database]. Estadísticas Vitales - Nacimientos 2018. Cifras definitivas 2018. Cuadro 10. Nacimientos por tipo de parto, según departamento de residencia de la madre y multiplicidad del embarazo. Bogotá D.C.: Departamento Administrativo Nacional de Estadística (DANE); 2019 (https://www.dane.gov.co/index.php/estadisticas-por-tema/salud/nacimientos-y-defunciones/nacimientos/nacimientos-2018, accessed 20 February 2020, in Spanish).
COM Comoros 1993 1996 5.3
Mondoha KA, Schoemaker J, Barrère M. Enquête Démographique et de Santé, Comores 1996. Calverton, Maryland: Centre National de Documentation et de Recherche Scientifique et Macro International Inc.; 1997 (in French).
COM Comoros 2007 2012 9.6
Direction Générale de la Statistique et de la Prospective (DGSP), ICF International. Enquête Démographique et de Santé et à Indicateurs Multiples aux Comores 2012. Rockville, MD 20850 USA : DGSP, ICF International; 2014 (in French).
COG Congo 2000 2005 3.2
Centre National de la Statistique et des Études Économiques (CNSEE) et ORC Macro. Enquête Démographique et de Santé du Congo 2005. Calverton, Maryland, USA: CNSEE et ORC Macro; 2006 (in French). DHS 2005.
COG Congo 2006 2012 5.8
Centre Nationale de la Statistique et des Études Économiques (CNSEE) [Congo], ICF International. Enquête Démographique et de Santé du Congo (EDSC-II) 2011-2012. Calverton, Maryland, USA: CNSEE, ICF International; 2013 (in French).
BMJ Publishing Group Limited (BMJ) disclaims all liability and responsibility arising from any relianceSupplemental material placed on this supplemental material which has been supplied by the author(s) BMJ Global Health
doi: 10.1136/bmjgh-2021-005671:e005671. 6 2021;BMJ Global Health, et al. Betran AP

76
ISO
Cod
e
Country
Coverag
e start
year
Covera
ge end
year
Caesare
an
section
rate (%)
References
COG Congo 2012 2015 4.9
Institut National de la Statistique (INS), Fonds des Nations Unies pour l'Enfance (UNICEF). Enquête par grappes à indicateurs multiples, MICS5 Congo 2014-2015, Rapport Final. Brazzaville, Congo: INS, UNICEF; 2015 (in French).
CRI Costa Rica 1990 1990 19.7
Estadísticas de Salud. Cuadro No 71. Partos, Nacimientos y porcentajes de parturientas con Atención Prenatal y con Cesárea; Nacimientos con bajo e Insuficiente peso al nacer, C. C. S. S., 1980-2012 [website]. San José: Caja Costarricense del Seguro Social; 2012 (http://www.ccss.sa.cr/estadisticas_salud_docs, accessed 29 August 2012, in Spanish).
CRI Costa Rica 1991 1991 19.7
Estadísticas de Salud. Cuadro No 71. Partos, Nacimientos y porcentajes de parturientas con Atención Prenatal y con Cesárea; Nacimientos con bajo e Insuficiente peso al nacer, C. C. S. S., 1980-2012 [website]. San José: Caja Costarricense del Seguro Social; 2012 (http://www.ccss.sa.cr/estadisticas_salud_docs, accessed 29 August 2012, in Spanish).
CRI Costa Rica 1992 1992 20.4
Estadísticas de Salud. Cuadro No 71. Partos, Nacimientos y porcentajes de parturientas con Atención Prenatal y con Cesárea; Nacimientos con bajo e Insuficiente peso al nacer, C. C. S. S., 1980-2012 [website]. San José: Caja Costarricense del Seguro Social; 2012 (http://www.ccss.sa.cr/estadisticas_salud_docs, accessed 29 August 2012, in Spanish).
CRI Costa Rica 1993 1993 20.9
Estadísticas de Salud. Cuadro No 71. Partos, Nacimientos y porcentajes de parturientas con Atención Prenatal y con Cesárea; Nacimientos con bajo e Insuficiente peso al nacer, C. C. S. S., 1980-2012 [website]. San José: Caja Costarricense del Seguro Social; 2012 (http://www.ccss.sa.cr/estadisticas_salud_docs, accessed 29 August 2012, in Spanish).
CRI Costa Rica 1994 1994 20.6
Estadísticas de Salud. Cuadro No 71. Partos, Nacimientos y porcentajes de parturientas con Atención Prenatal y con Cesárea; Nacimientos con bajo e Insuficiente peso al nacer, C. C. S. S., 1980-2012 [website]. San José: Caja Costarricense del Seguro Social; 2012 (http://www.ccss.sa.cr/estadisticas_salud_docs, accessed 29 August 2012, in Spanish).
CRI Costa Rica 1995 1995 20.7
Estadísticas de Salud. Cuadro No 71. Partos, Nacimientos y porcentajes de parturientas con Atención Prenatal y con Cesárea; Nacimientos con bajo e Insuficiente peso al nacer, C. C. S. S., 1980-2012 [website]. San José: Caja Costarricense del Seguro Social; 2012 (http://www.ccss.sa.cr/estadisticas_salud_docs, accessed 29 August 2012, in Spanish).
CRI Costa Rica 1996 1996 20.9
Estadísticas de Salud. Cuadro No 71. Partos, Nacimientos y porcentajes de parturientas con Atención Prenatal y con Cesárea; Nacimientos con bajo e Insuficiente peso al nacer, C. C. S. S., 1980-2012 [website]. San José: Caja Costarricense del Seguro Social; 2012 (http://www.ccss.sa.cr/estadisticas_salud_docs, accessed 29 August 2012, in Spanish).
BMJ Publishing Group Limited (BMJ) disclaims all liability and responsibility arising from any relianceSupplemental material placed on this supplemental material which has been supplied by the author(s) BMJ Global Health
doi: 10.1136/bmjgh-2021-005671:e005671. 6 2021;BMJ Global Health, et al. Betran AP

77
ISO
Cod
e
Country
Coverag
e start
year
Covera
ge end
year
Caesare
an
section
rate (%)
References
CRI Costa Rica 1997 1997 21.0
Estadísticas de Salud. Cuadro No 71. Partos, Nacimientos y porcentajes de parturientas con Atención Prenatal y con Cesárea; Nacimientos con bajo e Insuficiente peso al nacer, C. C. S. S., 1980-2012 [website]. San José: Caja Costarricense del Seguro Social; 2012 (http://www.ccss.sa.cr/estadisticas_salud_docs, accessed 29 August 2012, in Spanish).
CRI Costa Rica 1998 1998 20.8
Estadísticas de Salud. Cuadro No 71. Partos, Nacimientos y porcentajes de parturientas con Atención Prenatal y con Cesárea; Nacimientos con bajo e Insuficiente peso al nacer, C. C. S. S., 1980-2012 [website]. San José: Caja Costarricense del Seguro Social; 2012 (http://www.ccss.sa.cr/estadisticas_salud_docs, accessed 29 August 2012, in Spanish).
CRI Costa Rica 1999 1999 21.7
Estadísticas de Salud. Cuadro No 71. Partos, Nacimientos y porcentajes de parturientas con Atención Prenatal y con Cesárea; Nacimientos con bajo e Insuficiente peso al nacer, C. C. S. S., 1980-2012 [website]. San José: Caja Costarricense del Seguro Social; 2012 (http://www.ccss.sa.cr/estadisticas_salud_docs, accessed 29 August 2012, in Spanish).
CRI Costa Rica 2000 2000 21.3
Estadísticas de Salud. Cuadro No 71. Partos, Nacimientos y porcentajes de parturientas con Atención Prenatal y con Cesárea; Nacimientos con bajo e Insuficiente peso al nacer, C. C. S. S., 1980-2012 [website]. San José: Caja Costarricense del Seguro Social; 2012 (http://www.ccss.sa.cr/estadisticas_salud_docs, accessed 29 August 2012, in Spanish).
CRI Costa Rica 2001 2001 22.2
Estadísticas de Salud. Cuadro No 71. Partos, Nacimientos y porcentajes de parturientas con Atención Prenatal y con Cesárea; Nacimientos con bajo e Insuficiente peso al nacer, C. C. S. S., 1980-2012 [website]. San José: Caja Costarricense del Seguro Social; 2012 (http://www.ccss.sa.cr/estadisticas_salud_docs, accessed 29 August 2012, in Spanish).
CRI Costa Rica 2002 2002 22.0
Estadísticas de Salud. Cuadro No 71. Partos, Nacimientos y porcentajes de parturientas con Atención Prenatal y con Cesárea; Nacimientos con bajo e Insuficiente peso al nacer, C. C. S. S., 1980-2012 [website]. San José: Caja Costarricense del Seguro Social; 2012 (http://www.ccss.sa.cr/estadisticas_salud_docs, accessed 29 August 2012, in Spanish).
CRI Costa Rica 2003 2003 22.0
Estadísticas de Salud. Cuadro No 71. Partos, Nacimientos y porcentajes de parturientas con Atención Prenatal y con Cesárea; Nacimientos con bajo e Insuficiente peso al nacer, C. C. S. S., 1980-2012 [website]. San José: Caja Costarricense del Seguro Social; 2012 (http://www.ccss.sa.cr/estadisticas_salud_docs, accessed 29 August 2012, in Spanish).
CRI Costa Rica 2004 2004 21.8
Estadísticas de Salud. Cuadro No 71. Partos, Nacimientos y porcentajes de parturientas con Atención Prenatal y con Cesárea; Nacimientos con bajo e Insuficiente peso al nacer, C. C. S. S., 1980-2012 [website]. San José: Caja Costarricense del Seguro Social; 2012 (http://www.ccss.sa.cr/estadisticas_salud_docs, accessed 29 August 2012, in Spanish).
BMJ Publishing Group Limited (BMJ) disclaims all liability and responsibility arising from any relianceSupplemental material placed on this supplemental material which has been supplied by the author(s) BMJ Global Health
doi: 10.1136/bmjgh-2021-005671:e005671. 6 2021;BMJ Global Health, et al. Betran AP

78
ISO
Cod
e
Country
Coverag
e start
year
Covera
ge end
year
Caesare
an
section
rate (%)
References
CRI Costa Rica 2005 2005 21.6
Estadísticas de Salud. Cuadro No 71. Partos, Nacimientos y porcentajes de parturientas con Atención Prenatal y con Cesárea; Nacimientos con bajo e Insuficiente peso al nacer, C. C. S. S., 1980-2012 [website]. San José: Caja Costarricense del Seguro Social; 2012 (http://www.ccss.sa.cr/estadisticas_salud_docs, accessed 29 August 2012, in Spanish).
CRI Costa Rica 2006 2006 22.1
Estadísticas de Salud. Cuadro No 71. Partos, Nacimientos y porcentajes de parturientas con Atención Prenatal y con Cesárea; Nacimientos con bajo e Insuficiente peso al nacer, C. C. S. S., 1980-2012 [website]. San José: Caja Costarricense del Seguro Social; 2012 (http://www.ccss.sa.cr/estadisticas_salud_docs, accessed 29 August 2012, in Spanish).
CRI Costa Rica 2007 2007 21.4
Estadísticas de Salud. Cuadro No 71. Partos, Nacimientos y porcentajes de parturientas con Atención Prenatal y con Cesárea; Nacimientos con bajo e Insuficiente peso al nacer, C. C. S. S., 1980-2012 [website]. San José: Caja Costarricense del Seguro Social; 2012 (http://www.ccss.sa.cr/estadisticas_salud_docs, accessed 29 August 2012, in Spanish).
CRI Costa Rica 2008 2008 20.5
Estadísticas de Salud. Cuadro No 71. Partos, Nacimientos y porcentajes de parturientas con Atención Prenatal y con Cesárea; Nacimientos con bajo e Insuficiente peso al nacer, C. C. S. S., 1980-2012 [website]. San José: Caja Costarricense del Seguro Social; 2012 (http://www.ccss.sa.cr/estadisticas_salud_docs, accessed 29 August 2012, in Spanish).
CRI Costa Rica 2009 2009 20.4
Estadísticas de Salud. Cuadro No 71. Partos, Nacimientos y porcentajes de parturientas con Atención Prenatal y con Cesárea; Nacimientos con bajo e Insuficiente peso al nacer, C. C. S. S., 1980-2012 [website]. San José: Caja Costarricense del Seguro Social; 2012 (http://www.ccss.sa.cr/estadisticas_salud_docs, accessed 29 August 2012, in Spanish).
CRI Costa Rica 2009 2011 26.2
Encuesta de Indicadores Múltiples por Conglomerados 2011: Monitoreo de la Situación de la Niñez y las Mujeres, Costa Rica. San José: Ministerio de Salud [Costa Rica], Fondo de las Naciones Unidas para la Infancia (UNICEF); 2013 (in Spanish).
CRI Costa Rica 2011 2011 20.5
Estadísticas de Salud. Cuadro No 71. Partos, Nacimientos y porcentajes de parturientas con Atención Prenatal y con Cesárea; Nacimientos con bajo e Insuficiente peso al nacer, C. C. S. S., 1980-2012 [website]. San José: Caja Costarricense del Seguro Social; 2012 (http://www.ccss.sa.cr/estadisticas_salud_docs, accessed 29 August 2012, in Spanish).
CRI Costa Rica 2012 2012 21.6
Estadísticas de Salud. Cuadro No 43. Partos, Porcentaje con cesárea, abortos, nacimientos, porcentaje de defunciones fetales y defunciones maternas, segun red de servicios y centro de salud. C. C. S. S., 2012 [website]. San José: Caja Costarricense del Seguro Social; 2013 (http://www.ccss.sa.cr/estadisticas_salud_docs, accessed 14 October 2013, in Spanish).
BMJ Publishing Group Limited (BMJ) disclaims all liability and responsibility arising from any relianceSupplemental material placed on this supplemental material which has been supplied by the author(s) BMJ Global Health
doi: 10.1136/bmjgh-2021-005671:e005671. 6 2021;BMJ Global Health, et al. Betran AP

79
ISO
Cod
e
Country
Coverag
e start
year
Covera
ge end
year
Caesare
an
section
rate (%)
References
CRI Costa Rica 2013 2013 21.9
Estadísticas de Salud. Cuadro No 43. Partos, Porcentaje con cesárea, abortos, nacimientos, porcentaje de defunciones fetales y defunciones maternas, segun red de servicios y centro de salud. C. C. S. S., 2013 [website]. San José: Caja Costarricense del Seguro Social; 2014 (http://www.ccss.sa.cr/estadisticas_salud_docs, accessed 19 December 2014, in Spanish).
CRI Costa Rica 2014 2014 23.5
Estadísticas de Salud. Cuadro No 43. Partos, Porcentaje con cesárea, abortos, nacimientos, porcentaje de defunciones fetales y defunciones maternas, segun red de servicios y centro de salud. C. C. S. S., 2014 [website]. San José: Caja Costarricense del Seguro Social; 2016 (http://www.ccss.sa.cr/arc/estadisticas/salud/80/an_est_8788b_2014.zip, accessed 12 July 2016, in Spanish).
CRI Costa Rica 2015 2015 23.8
Anuario Estadístico 2017. Cuadro No 71. Partos, nacimientos y porcentajes de parturientas con atencion prenatal y con cesárea; naciminetos con bajo e insuficiente peso al nacer, C.C.S.S., 1980 - 2017 [website]. San José: Caja Costarricense del Seguro Social; 2019 (https://www.ccss.sa.cr/est_salud, accessed 19 February 2019, in Spanish).
CRI Costa Rica 2016 2016 23.9
Anuario Estadístico 2017. Cuadro No 71. Partos, nacimientos y porcentajes de parturientas con atencion prenatal y con cesárea; naciminetos con bajo e insuficiente peso al nacer, C.C.S.S., 1980 - 2017 [website]. San José: Caja Costarricense del Seguro Social; 2019 (https://www.ccss.sa.cr/est_salud, accessed 19 February 2019, in Spanish).
CRI Costa Rica 2017 2017 24.3
Anuario Estadístico 2017. Cuadro No 71. Partos, nacimientos y porcentajes de parturientas con atencion prenatal y con cesárea; naciminetos con bajo e insuficiente peso al nacer, C.C.S.S., 1980 - 2017 [website]. San José: Caja Costarricense del Seguro Social; 2019 (https://www.ccss.sa.cr/est_salud, accessed 19 February 2019, in Spanish).
CIV Côte d'Ivoire 1991 1994 1.8
Sombo, N'Cho, Lucien Kouassi, Albert Kouamé Koffi, Juan Schoemaker, Monique Barrère, Bernard Barrère, Prosper Poukouta (Institut National de la Statistique [Côte d'Ivoire], Macro International). Enquête Démographique et de Santé, Côte d'Ivoire 1994. Calverton, Maryland, USA: Institut National de la Statistique [Côte d'Ivoire], Macro International; 1995 (in French).
CIV Côte d'Ivoire 1993 1999 2.5
Institut National de la Statistique [Côte d’Ivoire] et ORC Macro. Enquête Démographique et de Santé, Côte d’Ivoire 1998-1999. Calverton, Maryland USA : Institut National de la Statistique et ORC Macro; 2001 (in French).
CIV Côte d'Ivoire 2000 2005 6.4
Institut National de la Statistique (INS) et Ministère de la Lutte contre le Sida [Côte d’Ivoire] et ORC Macro. Enquête sur les Indicateurs du Sida, Côte d’Ivoire 2005. Calverton, Maryland, USA: INS et ORC Macro; 2006 (in French). DHS 2005.
BMJ Publishing Group Limited (BMJ) disclaims all liability and responsibility arising from any relianceSupplemental material placed on this supplemental material which has been supplied by the author(s) BMJ Global Health
doi: 10.1136/bmjgh-2021-005671:e005671. 6 2021;BMJ Global Health, et al. Betran AP

80
ISO
Cod
e
Country
Coverag
e start
year
Covera
ge end
year
Caesare
an
section
rate (%)
References
CIV Côte d'Ivoire 2006 2012 2.7
Institut National de la Statistique (INS), ICF International. Enquête Démographique et de Santé et à Indicateurs Multiples de Côte d’Ivoire 2011-2012. Calverton, Maryland, USA: INS et ICF International; 2012 (in French).
CIV Côte d'Ivoire 2014 2016 3.3
Enquête par grappes à indicateurs multiples - Côte d’Ivoire 2016 (MICS 2016). Abidjan: Ministère du Plan et du Développement [Côte d’Ivoire], Institut National de la Statistique (INS) [Côte d’Ivoire], Fonds des Nations Unies pour l'Enfance (UNICEF), le Fonds mondial [the Global Fund], Contrat de Désendettement et de Développement, Fonds des Nations unies pour la population (FNUAP/UNFPA); 2017 (in French).
HRV Croatia 1990 1990 9.3
Dražančić A, Rodin U, Filipović-Grčić B. Perinatalna Zaštita U Hrvatskoj. Jučer, danas, sutra [Perinatal Care in Croatia. Yesterday, today, tomorrow]. Liječ Vjesn. 2007;129:87–99.
HRV Croatia 1991 1991 8.8
Dražančić A, Rodin U, Filipović-Grčić B. Perinatalna Zaštita U Hrvatskoj. Jučer, danas, sutra [Perinatal Care in Croatia. Yesterday, today, tomorrow]. Liječ Vjesn. 2007;129:87–99.
HRV Croatia 1992 1992 7.7
Dražančić A, Rodin U, Filipović-Grčić B. Perinatalna Zaštita U Hrvatskoj. Jučer, danas, sutra [Perinatal Care in Croatia. Yesterday, today, tomorrow]. Liječ Vjesn. 2007;129:87–99.
HRV Croatia 1993 1993 8.3
Dražančić A, Rodin U, Filipović-Grčić B. Perinatalna Zaštita U Hrvatskoj. Jučer, danas, sutra [Perinatal Care in Croatia. Yesterday, today, tomorrow]. Liječ Vjesn. 2007;129:87–99.
HRV Croatia 1994 1994 8.6
Dražančić A, Rodin U, Filipović-Grčić B. Perinatalna Zaštita U Hrvatskoj. Jučer, danas, sutra [Perinatal Care in Croatia. Yesterday, today, tomorrow]. Liječ Vjesn. 2007;129:87–99.
HRV Croatia 1995 1995 9.2
Dražančić A, Rodin U, Filipović-Grčić B. Perinatalna Zaštita U Hrvatskoj. Jučer, danas, sutra [Perinatal Care in Croatia. Yesterday, today, tomorrow]. Liječ Vjesn. 2007;129:87–99.
BMJ Publishing Group Limited (BMJ) disclaims all liability and responsibility arising from any relianceSupplemental material placed on this supplemental material which has been supplied by the author(s) BMJ Global Health
doi: 10.1136/bmjgh-2021-005671:e005671. 6 2021;BMJ Global Health, et al. Betran AP

81
ISO
Cod
e
Country
Coverag
e start
year
Covera
ge end
year
Caesare
an
section
rate (%)
References
HRV Croatia 1996 1996 9.3
Dražančić A, Rodin U, Filipović-Grčić B. Perinatalna Zaštita U Hrvatskoj. Jučer, danas, sutra [Perinatal Care in Croatia. Yesterday, today, tomorrow]. Liječ Vjesn. 2007;129:87–99.
HRV Croatia 1997 1997 9.9
Dražančić A, Rodin U, Filipović-Grčić B. Perinatalna Zaštita U Hrvatskoj. Jučer, danas, sutra [Perinatal Care in Croatia. Yesterday, today, tomorrow]. Liječ Vjesn. 2007;129:87–99.
HRV Croatia 1998 1998 10.8
Dražančić A, Rodin U, Filipović-Grčić B. Perinatalna Zaštita U Hrvatskoj. Jučer, danas, sutra [Perinatal Care in Croatia. Yesterday, today, tomorrow]. Liječ Vjesn. 2007;129:87–99.
HRV Croatia 1999 1999 11.5
Dražančić A, Rodin U, Filipović-Grčić B. Perinatalna Zaštita U Hrvatskoj. Jučer, danas, sutra [Perinatal Care in Croatia. Yesterday, today, tomorrow]. Liječ Vjesn. 2007;129:87–99.
HRV Croatia 2000 2000 12.4
Dražančić A, Rodin U, Filipović-Grčić B. Perinatalna Zaštita U Hrvatskoj. Jučer, danas, sutra [Perinatal Care in Croatia. Yesterday, today, tomorrow]. Liječ Vjesn. 2007;129:87–99.
HRV Croatia 2001 2001 13.8
Dražančić A, Rodin U, Filipović-Grčić B. Perinatalna Zaštita U Hrvatskoj. Jučer, danas, sutra [Perinatal Care in Croatia. Yesterday, today, tomorrow]. Liječ Vjesn. 2007;129:87–99.
HRV Croatia 2002 2002 14.8
Dražančić A, Rodin U, Filipović-Grčić B. Perinatalna Zaštita U Hrvatskoj. Jučer, danas, sutra [Perinatal Care in Croatia. Yesterday, today, tomorrow]. Liječ Vjesn. 2007;129:87–99.
HRV Croatia 2003 2003 15.1
Dražančić A, Rodin U, Filipović-Grčić B. Perinatalna Zaštita U Hrvatskoj. Jučer, danas, sutra [Perinatal Care in Croatia. Yesterday, today, tomorrow]. Liječ Vjesn. 2007;129:87–99.
BMJ Publishing Group Limited (BMJ) disclaims all liability and responsibility arising from any relianceSupplemental material placed on this supplemental material which has been supplied by the author(s) BMJ Global Health
doi: 10.1136/bmjgh-2021-005671:e005671. 6 2021;BMJ Global Health, et al. Betran AP

82
ISO
Cod
e
Country
Coverag
e start
year
Covera
ge end
year
Caesare
an
section
rate (%)
References
HRV Croatia 2004 2004 15.5
Dražančić A, Rodin U, Filipović-Grčić B. Perinatalna Zaštita U Hrvatskoj. Jučer, danas, sutra [Perinatal Care in Croatia. Yesterday, today, tomorrow]. Liječ Vjesn. 2007;129:87–99.
HRV Croatia 2005 2005 16.0
European Health for All Database (HFA-DB) [online database]. World Health Organization (WHO) Regional Office for Europe; 2012 (http://data.euro.who.int/hfadb, accessed 20 August 2012).
HRV Croatia 2006 2006 16.2
European Health for All Database (HFA-DB) [online database]. World Health Organization (WHO) Regional Office for Europe; 2012 (http://data.euro.who.int/hfadb, accessed 20 August 2012).
HRV Croatia 2007 2007 16.4
European Health for All Database (HFA-DB) [online database]. World Health Organization (WHO) Regional Office for Europe; 2012 (http://data.euro.who.int/hfadb, accessed 20 August 2012).
HRV Croatia 2008 2008 17.1
European Health for All Database (HFA-DB) [online database]. World Health Organization (WHO) Regional Office for Europe; 2012 (http://data.euro.who.int/hfadb, accessed 20 August 2012).
HRV Croatia 2009 2009 17.5
European Health for All Database (HFA-DB) [online database]. World Health Organization (WHO) Regional Office for Europe; 2012 (http://data.euro.who.int/hfadb, accessed 20 August 2012).
HRV Croatia 2010 2010 18.7
European Health for All Database (HFA-DB) [online database]. World Health Organization (WHO) Regional Office for Europe; 2012 (http://data.euro.who.int/hfadb, accessed 20 August 2012).
HRV Croatia 2012 2012 18.8
Croatian Health Service Yearbook 2012. Zagreb: Croatian National Institute of Public Health; 2013.
BMJ Publishing Group Limited (BMJ) disclaims all liability and responsibility arising from any relianceSupplemental material placed on this supplemental material which has been supplied by the author(s) BMJ Global Health
doi: 10.1136/bmjgh-2021-005671:e005671. 6 2021;BMJ Global Health, et al. Betran AP

83
ISO
Cod
e
Country
Coverag
e start
year
Covera
ge end
year
Caesare
an
section
rate (%)
References
HRV Croatia 2013 2013 19.1
Croatian Health Service Yearbook 2013. Zagreb: Croatian National Institute of Public Health; 2014.
HRV Croatia 2014 2014 19.9
Croatian Health Service Yearbook 2014. Zagreb: Croatian Institute of Public Health; 2015.
HRV Croatia 2015 2015 20.9
Croatian Health Statistics Yearbook 2015. Zagreb: Croatian Institute of Public Health; 2016.
HRV Croatia 2016 2016 23.0
Croatian Health Statistics Yearbook 2016. Zagreb: Croatian National Institute of Public Health; 2017.
CUB Cuba 1990 1990 19.4
Vázquez Cabrera J. Cesárea. Análisis crítico y recomendaciones para disminuir su morbilidad. La Habana: Editorial Ciencias Médicas; 2010 (in Spanish).
CUB Cuba 1991 1991 20.1
Vázquez Cabrera J. Cesárea. Análisis crítico y recomendaciones para disminuir su morbilidad. La Habana: Editorial Ciencias Médicas; 2010 (in Spanish).
CUB Cuba 1992 1992 19.7
Vázquez Cabrera J. Cesárea. Análisis crítico y recomendaciones para disminuir su morbilidad. La Habana: Editorial Ciencias Médicas; 2010 (in Spanish).
CUB Cuba 1993 1993 19.4
Vázquez Cabrera J. Cesárea. Análisis crítico y recomendaciones para disminuir su morbilidad. La Habana: Editorial Ciencias Médicas; 2010 (in Spanish).
BMJ Publishing Group Limited (BMJ) disclaims all liability and responsibility arising from any relianceSupplemental material placed on this supplemental material which has been supplied by the author(s) BMJ Global Health
doi: 10.1136/bmjgh-2021-005671:e005671. 6 2021;BMJ Global Health, et al. Betran AP

84
ISO
Cod
e
Country
Coverag
e start
year
Covera
ge end
year
Caesare
an
section
rate (%)
References
CUB Cuba 1994 1994 20.5
Vázquez Cabrera J. Cesárea. Análisis crítico y recomendaciones para disminuir su morbilidad. La Habana: Editorial Ciencias Médicas; 2010 (in Spanish).
CUB Cuba 1995 1995 22.3
Vázquez Cabrera J. Cesárea. Análisis crítico y recomendaciones para disminuir su morbilidad. La Habana: Editorial Ciencias Médicas; 2010 (in Spanish).
CUB Cuba 1996 1996 15.6
Vázquez Cabrera J. Cesárea. Análisis crítico y recomendaciones para disminuir su morbilidad. La Habana: Editorial Ciencias Médicas; 2010 (in Spanish).
CUB Cuba 1997 1997 23.0
Vázquez Cabrera J. Cesárea. Análisis crítico y recomendaciones para disminuir su morbilidad. La Habana: Editorial Ciencias Médicas; 2010 (in Spanish).
CUB Cuba 1998 1998 24.1
Vázquez Cabrera J. Cesárea. Análisis crítico y recomendaciones para disminuir su morbilidad. La Habana: Editorial Ciencias Médicas; 2010 (in Spanish).
CUB Cuba 1999 1999 25.0
Vázquez Cabrera J. Cesárea. Análisis crítico y recomendaciones para disminuir su morbilidad. La Habana: Editorial Ciencias Médicas; 2010 (in Spanish).
CUB Cuba 2000 2000 26.4
Vázquez Cabrera J. Cesárea. Análisis crítico y recomendaciones para disminuir su morbilidad. La Habana: Editorial Ciencias Médicas; 2010 (in Spanish).
CUB Cuba 2001 2001 26.5
Vázquez Cabrera J. Cesárea. Análisis crítico y recomendaciones para disminuir su morbilidad. La Habana: Editorial Ciencias Médicas; 2010 (in Spanish).
BMJ Publishing Group Limited (BMJ) disclaims all liability and responsibility arising from any relianceSupplemental material placed on this supplemental material which has been supplied by the author(s) BMJ Global Health
doi: 10.1136/bmjgh-2021-005671:e005671. 6 2021;BMJ Global Health, et al. Betran AP

85
ISO
Cod
e
Country
Coverag
e start
year
Covera
ge end
year
Caesare
an
section
rate (%)
References
CUB Cuba 2002 2002 28.1
Vázquez Cabrera J. Cesárea. Análisis crítico y recomendaciones para disminuir su morbilidad. La Habana: Editorial Ciencias Médicas; 2010 (in Spanish).
CUB Cuba 2003 2003 31.5
Vázquez Cabrera J. Cesárea. Análisis crítico y recomendaciones para disminuir su morbilidad. La Habana: Editorial Ciencias Médicas; 2010 (in Spanish).
CUB Cuba 2004 2004 34.5
Vázquez Cabrera J. Cesárea. Análisis crítico y recomendaciones para disminuir su morbilidad. La Habana: Editorial Ciencias Médicas; 2010 (in Spanish).
CUB Cuba 2012 2014 40.4
Dirección de Registros Médicos y Estadísticas de Salud, Ministerio de Salud Pública, Fondo de las Naciones Unidas para la Infancia (UNICEF). Encuesta de Indicadores Múltiples por Conglomerados. Cuba, 2014. Informe final. La Habana, Cuba: Dirección de Registros Médicos y Estadísticas de Salud, Ministerio de Salud Pública, UNICEF; 2015 (in Spanish).
CYP Cyprus 2007 2007 50.9
Perinatal Health Survey 2007. Nicosia: Statistical Service of Cyprus (CYSTAT); 2010 (in Greek).
CYP Cyprus 2008 2008 53.4
Cyprus Public and Private Maternity Units. Perinatal Health Indicators for the Year 2014. Nicosia: Ministry of Health of the Republic of Cyprus; 2016.
CYP Cyprus 2009 2009 52.2
Cyprus Public and Private Maternity Units. Perinatal Health Indicators for the Year 2014. Nicosia: Ministry of Health of the Republic of Cyprus; 2016.
CYP Cyprus 2010 2010 53.7
Cyprus Public and Private Maternity Units. Perinatal Health Indicators for the Year 2014. Nicosia: Ministry of Health of the Republic of Cyprus; 2016.
BMJ Publishing Group Limited (BMJ) disclaims all liability and responsibility arising from any relianceSupplemental material placed on this supplemental material which has been supplied by the author(s) BMJ Global Health
doi: 10.1136/bmjgh-2021-005671:e005671. 6 2021;BMJ Global Health, et al. Betran AP

86
ISO
Cod
e
Country
Coverag
e start
year
Covera
ge end
year
Caesare
an
section
rate (%)
References
CYP Cyprus 2011 2011 53.3
Cyprus Public and Private Maternity Units. Perinatal Health Indicators for the Year 2014. Nicosia: Ministry of Health of the Republic of Cyprus; 2016.
CYP Cyprus 2012 2012 52.5
Cyprus Public and Private Maternity Units. Perinatal Health Indicators for the Year 2014. Nicosia: Ministry of Health of the Republic of Cyprus; 2016.
CYP Cyprus 2013.0 2013.0 55.3
Cyprus Public and Private Maternity Units. Perinatal Health Indicators for the Year 2014. Nicosia: Ministry of Health of the Republic of Cyprus; 2016.
CYP Cyprus 2014 2014 56.9
Cyprus Public and Private Maternity Units. Perinatal Health Indicators for the Year 2014. Nicosia: Ministry of Health of the Republic of Cyprus; 2016.
CYP Cyprus 2015 2015 56.9
Cyprus Public and Private Maternity Units. Important Perinatal Health Indicators for the Year 2015. Nicosia: Ministry of Health of the Republic of Cyprus; 2017.
CYP Cyprus 2016 2016 55.3
Perinatal health report 2018. Important Perinatal Health Indicators. Cyprus Public and Private Maternity Units 2014-2016. Nicosia: Ministry of Health of the Republic of Cyprus; 2018.
CZE Czechia 1990 1990 7.6
European Health for All Database (HFA-DB) [online database]. World Health Organization (WHO) Regional Office for Europe; 2012 (http://data.euro.who.int/hfadb, accessed 20 August 2012).
CZE Czechia 1991 1991 8.4
European Health for All Database (HFA-DB) [online database]. World Health Organization (WHO) Regional Office for Europe; 2012 (http://data.euro.who.int/hfadb, accessed 20 August 2012).
BMJ Publishing Group Limited (BMJ) disclaims all liability and responsibility arising from any relianceSupplemental material placed on this supplemental material which has been supplied by the author(s) BMJ Global Health
doi: 10.1136/bmjgh-2021-005671:e005671. 6 2021;BMJ Global Health, et al. Betran AP

87
ISO
Cod
e
Country
Coverag
e start
year
Covera
ge end
year
Caesare
an
section
rate (%)
References
CZE Czechia 1993 1993 9.1
European Health for All Database (HFA-DB) [online database]. World Health Organization (WHO) Regional Office for Europe; 2012 (http://data.euro.who.int/hfadb, accessed 20 August 2012).
CZE Czechia 1994 1994 10.1
European Health for All Database (HFA-DB) [online database]. World Health Organization (WHO) Regional Office for Europe; 2012 (http://data.euro.who.int/hfadb, accessed 20 August 2012).
CZE Czechia 1995 1995 11.2
European Health for All Database (HFA-DB) [online database]. World Health Organization (WHO) Regional Office for Europe; 2012 (http://data.euro.who.int/hfadb, accessed 20 August 2012).
CZE Czechia 1996 1996 11.6
European Health for All Database (HFA-DB) [online database]. World Health Organization (WHO) Regional Office for Europe; 2012 (http://data.euro.who.int/hfadb, accessed 20 August 2012).
CZE Czechia 1997 1997 11.8
European Health for All Database (HFA-DB) [online database]. World Health Organization (WHO) Regional Office for Europe; 2012 (http://data.euro.who.int/hfadb, accessed 20 August 2012).
CZE Czechia 1998 1998 12.3
European Health for All Database (HFA-DB) [online database]. World Health Organization (WHO) Regional Office for Europe; 2012 (http://data.euro.who.int/hfadb, accessed 20 August 2012).
CZE Czechia 1999 1999 12.6
Rodička a novorozenec 1999 [Mother and Newborn 1999]. Prague: Ústav zdravotnických informací a statistiky ČR [Institute of Health Information and Statistics of the Czech Republic]; 2001 (in Czech).
CZE Czechia 2000 2000 13.8
Rodička a novorozenec 2000 [Mother and Newborn 2000]. Prague: Ústav zdravotnických informací a statistiky ČR [Institute of Health Information and Statistics of the Czech Republic]; 2001 (in Czech).
BMJ Publishing Group Limited (BMJ) disclaims all liability and responsibility arising from any relianceSupplemental material placed on this supplemental material which has been supplied by the author(s) BMJ Global Health
doi: 10.1136/bmjgh-2021-005671:e005671. 6 2021;BMJ Global Health, et al. Betran AP

88
ISO
Cod
e
Country
Coverag
e start
year
Covera
ge end
year
Caesare
an
section
rate (%)
References
CZE Czechia 2001 2001 14.1
Rodička a novorozenec 2001 [Mother and Newborn 2001]. Prague: Ústav zdravotnických informací a statistiky ČR [Institute of Health Information and Statistics of the Czech Republic]; 2002 (in Czech).
CZE Czechia 2002 2002 14.9
Rodička a novorozenec 2002 [Mother and Newborn 2002]. Prague: Ústav zdravotnických informací a statistiky ČR [Institute of Health Information and Statistics of the Czech Republic]; 2004 (in Czech).
CZE Czechia 2003 2003 16.3
Rodička a novorozenec 2003 [Mother and Newborn 2003]. Prague: Ústav zdravotnických informací a statistiky ČR [Institute of Health Information and Statistics of the Czech Republic]; 2004 (in Czech).
CZE Czechia 2004 2004 17.2
Rodička a novorozenec 2004 [Mother and Newborn 2004]. Prague: Ústav zdravotnických informací a statistiky ČR [Institute of Health Information and Statistics of the Czech Republic]; 2005 (in Czech).
CZE Czechia 2005 2005 18.3
Rodička a novorozenec 2005 [Mother and Newborn 2005]. Prague: Ústav zdravotnických informací a statistiky ČR [Institute of Health Information and Statistics of the Czech Republic]; 2006 (in Czech).
CZE Czechia 2006 2006 19.6
Rodička a novorozenec 2006 [Mother and Newborn 2006]. Prague: Ústav zdravotnických informací a statistiky ČR [Institute of Health Information and Statistics of the Czech Republic]; 2007 (in Czech).
CZE Czechia 2007 2007 21.1
Rodička a novorozenec 2007 [Mother and Newborn 2007]. Prague: Ústav zdravotnických informací a statistiky ČR [Institute of Health Information and Statistics of the Czech Republic]; 2008 (in Czech).
CZE Czechia 2008 2008 21.9
Rodička a novorozenec 2008 [Mother and Newborn 2008]. Prague: Ústav zdravotnických informací a statistiky ČR [Institute of Health Information and Statistics of the Czech Republic]; 2009 (in Czech).
BMJ Publishing Group Limited (BMJ) disclaims all liability and responsibility arising from any relianceSupplemental material placed on this supplemental material which has been supplied by the author(s) BMJ Global Health
doi: 10.1136/bmjgh-2021-005671:e005671. 6 2021;BMJ Global Health, et al. Betran AP

89
ISO
Cod
e
Country
Coverag
e start
year
Covera
ge end
year
Caesare
an
section
rate (%)
References
CZE Czechia 2009 2009 22.7
Rodička a novorozenec 2009 [Mother and Newborn 2009]. Prague: Ústav zdravotnických informací a statistiky ČR [Institute of Health Information and Statistics of the Czech Republic]; 2009 (in Czech).
CZE Czechia 2010 2010 24.1
Rodička a novorozenec 2010 [Mother and Newborn 2010]. Prague: Ústav zdravotnických informací a statistiky ČR [Institute of Health Information and Statistics of the Czech Republic]; 2011 (in Czech).
CZE Czechia 2011 2011 24.7
Rodička a novorozenec 2011 [Mother and Newborn 2011]. Prague: Ústav zdravotnických informací a statistiky ČR [Institute of Health Information and Statistics of the Czech Republic]; 2012 (in Czech).
CZE Czechia 2012 2012 25.9
Rodička a novorozenec 2012 [Mother and Newborn 2012]. Prague: Ústav zdravotnických informací a statistiky ČR [Institute of Health Information and Statistics of the Czech Republic]; 2013 (in Czech).
CZE Czechia 2013 2013 26.4
Rodička a novorozenec 2013 [Mother and Newborn 2013]. Prague: Ústav zdravotnických informací a statistiky ČR [Institute of Health Information and Statistics of the Czech Republic]; 2014 (in Czech).
CZE Czechia 2014 2014 26.9
Rodička a novorozenec 2014-2015 [Mother and Newborn 2014-2015]. Prague: Ústav zdravotnických informací a statistiky ČR [Institute of Health Information and Statistics of the Czech Republic]; 2017 (in Czech).
CZE Czechia 2015 2015 26.9
Rodička a novorozenec 2014-2015 [Mother and Newborn 2014-2015]. Prague: Ústav zdravotnických informací a statistiky ČR [Institute of Health Information and Statistics of the Czech Republic]; 2017 (in Czech).
PRK Democratic People's Republic of Korea
2007 2009 12.5
Central Bureau of Statistics (CBS), United Nations Children's Fund (UNICEF). DPR Korea Multiple Indicator Cluster Survey 2009, Final Report. Pyongyang, DPR Korea: Central Bureau of Statistics (CBS), UNICEF; 2010.
BMJ Publishing Group Limited (BMJ) disclaims all liability and responsibility arising from any relianceSupplemental material placed on this supplemental material which has been supplied by the author(s) BMJ Global Health
doi: 10.1136/bmjgh-2021-005671:e005671. 6 2021;BMJ Global Health, et al. Betran AP

90
ISO
Cod
e
Country
Coverag
e start
year
Covera
ge end
year
Caesare
an
section
rate (%)
References
PRK Democratic People's Republic of Korea
2015 2017 12.9
DPR Korea Multiple Indicator Cluster Survey 2017, Survey Findings Report. Pyongyang: Central Bureau of Statistics of the DPR Korea, United Nations Children's Fund (UNICEF); 2017.
COD Democratic Republic
of the Congo 2002 2007 4.0
Ministère du Plan, Macro International. Enquête Démographique et de Santé, République Démocratique du Congo 2007. Calverton, Maryland, U.S.A. : Ministère du Plan, Macro International; 2008 (in French).
COD Democratic Republic
of the Congo 2008 2010 7.2
Institut National de la Statistique, Fonds des Nations Unies pour l'Enfance (UNICEF). Enquête par Grappes à Indicateurs Multiples en République Démocratique du Congo (MICS-RDC 2010), Rapport Final. République Démocratique du Congo; 2011 (in French).
COD Democratic Republic
of the Congo 2008 2014 5.1
Ministère du Plan et Suivi de la Mise en œuvre de la Révolution de la Modernité (MPSMRM), Ministère de la Santé Publique (MSP), ICF International. Enquête Démographique et de Santé en République Démocratique du Congo 2013-2014. Rockville, Maryland, USA: MPSMRM, MSP, ICF International; 2014 (in French).
DNK Denmark 1990 1990 12.5
Sundhedsstyrelsen [National Board of Health, Denmark]. Nye tal fra Sundhedsstyrelsen - Fødselsregisteret 1973-2003, 2004:23 [New figures from the National Board of Health, Denmark - Birth Registry 1973-2003, 2004:23]. Copenhagen: Sundhedsstyrelsen; 2004 (in Danish).
DNK Denmark 1991 1991 12.4
Sundhedsstyrelsen [National Board of Health, Denmark]. Nye tal fra Sundhedsstyrelsen - Fødselsregisteret 1973-2003, 2004:23 [New figures from the National Board of Health, Denmark - Birth Registry 1973-2003, 2004:23]. Copenhagen: Sundhedsstyrelsen; 2004 (in Danish).
DNK Denmark 1992 1992 12.3
Sundhedsstyrelsen [National Board of Health, Denmark]. Nye tal fra Sundhedsstyrelsen - Fødselsregisteret 1973-2003, 2004:23 [New figures from the National Board of Health, Denmark - Birth Registry 1973-2003, 2004:23]. Copenhagen: Sundhedsstyrelsen; 2004 (in Danish).
DNK Denmark 1993 1993 12.7
Sundhedsstyrelsen [National Board of Health, Denmark]. Nye tal fra Sundhedsstyrelsen - Fødselsregisteret 1973-2003, 2004:23 [New figures from the National Board of Health, Denmark - Birth Registry 1973-2003, 2004:23]. Copenhagen: Sundhedsstyrelsen; 2004 (in Danish).
BMJ Publishing Group Limited (BMJ) disclaims all liability and responsibility arising from any relianceSupplemental material placed on this supplemental material which has been supplied by the author(s) BMJ Global Health
doi: 10.1136/bmjgh-2021-005671:e005671. 6 2021;BMJ Global Health, et al. Betran AP

91
ISO
Cod
e
Country
Coverag
e start
year
Covera
ge end
year
Caesare
an
section
rate (%)
References
DNK Denmark 1994 1994 12.7
Sundhedsstyrelsen [National Board of Health, Denmark]. Nye tal fra Sundhedsstyrelsen - Fødselsregisteret 1973-2003, 2004:23 [New figures from the National Board of Health, Denmark - Birth Registry 1973-2003, 2004:23]. Copenhagen: Sundhedsstyrelsen; 2004 (in Danish).
DNK Denmark 1995 1995 12.6
Sundhedsstyrelsen [National Board of Health, Denmark]. Nye tal fra Sundhedsstyrelsen - Fødselsregisteret 1973-2003, 2004:23 [New figures from the National Board of Health, Denmark - Birth Registry 1973-2003, 2004:23]. Copenhagen: Sundhedsstyrelsen; 2004 (in Danish).
DNK Denmark 1996 1996 12.9
Sundhedsstyrelsen [National Board of Health, Denmark]. Nye tal fra Sundhedsstyrelsen - Fødselsregisteret 1973-2003, 2004:23 [New figures from the National Board of Health, Denmark - Birth Registry 1973-2003, 2004:23]. Copenhagen: Sundhedsstyrelsen; 2004 (in Danish).
DNK Denmark 1997 1997 13.6
Sundhedsstyrelsen [National Board of Health, Denmark].Nye tal fra Sundhedsstyrelsen - Fødselsregisteret 1997-2001, 2003:12 [New figures from the National Board of Health, Denmark - Birth Registry 1997-2001, 2003:12]. Copenhagen: Sundhedsstyrelsen; 2003 (in Danish).
DNK Denmark 1998 1998 14.4
Sundhedsstyrelsen [National Board of Health, Denmark].Nye tal fra Sundhedsstyrelsen - Fødselsregisteret 1997-2001, 2003:12 [New figures from the National Board of Health, Denmark - Birth Registry 1997-2001, 2003:12]. Copenhagen: Sundhedsstyrelsen; 2003 (in Danish).
DNK Denmark 1999 1999 15.0
Sundhedsstyrelsen [National Board of Health, Denmark].Nye tal fra Sundhedsstyrelsen - Fødselsregisteret 1997-2001, 2003:12 [New figures from the National Board of Health, Denmark - Birth Registry 1997-2001, 2003:12]. Copenhagen: Sundhedsstyrelsen; 2003 (in Danish).
DNK Denmark 2000 2000 16.0
Sundhedsstyrelsen [National Board of Health, Denmark].Nye tal fra Sundhedsstyrelsen - Fødselsregisteret 1997-2001, 2003:12 [New figures from the National Board of Health, Denmark - Birth Registry 1997-2001, 2003:12]. Copenhagen: Sundhedsstyrelsen; 2003 (in Danish).
DNK Denmark 2001 2001 17.8
Sundhedsstyrelsen [National Board of Health, Denmark].Nye tal fra Sundhedsstyrelsen - Fødselsregisteret 1997-2001, 2003:12 [New figures from the National Board of Health, Denmark - Birth Registry 1997-2001, 2003:12]. Copenhagen: Sundhedsstyrelsen; 2003 (in Danish).
BMJ Publishing Group Limited (BMJ) disclaims all liability and responsibility arising from any relianceSupplemental material placed on this supplemental material which has been supplied by the author(s) BMJ Global Health
doi: 10.1136/bmjgh-2021-005671:e005671. 6 2021;BMJ Global Health, et al. Betran AP

92
ISO
Cod
e
Country
Coverag
e start
year
Covera
ge end
year
Caesare
an
section
rate (%)
References
DNK Denmark 2002 2002 18.5
Sundhedsstyrelsen [National Board of Health, Denmark]. Nye tal fra Sundhedsstyrelsen - Fødselsregisteret 2003, 2004:4 [New figures from the National Board of Health, Denmark - Birth Registry 2003, 2004:4]. Copenhagen: Sundhedsstyrelsen; 2004 (in Danish).
DNK Denmark 2003 2003 19.8
Sundhedsstyrelsen [National Board of Health, Denmark]. Nye tal fra Sundhedsstyrelsen - Fødselsregisteret 2004, 2005:4 [New figures from the National Board of Health, Denmark - Birth Registry 2004, 2005:4]. Copenhagen: Sundhedsstyrelsen; 2005 (in Danish).
DNK Denmark 2004 2004 20.7
Sundhedsstyrelsen [National Board of Health, Denmark]. Nye tal fra Sundhedsstyrelsen - Fødselsregisteret 2004, 2005:4 [New figures from the National Board of Health, Denmark - Birth Registry 2004, 2005:4]. Copenhagen: Sundhedsstyrelsen; 2005 (in Danish).
DNK Denmark 2006 2006 21.0
Sundhedsstyrelsen [National Board of Health, Denmark]. Nye tal fra Sundhedsstyrelsen - Fødselsregisteret 2007, 2008:1 [New figures from the National Board of Health, Denmark - Birth Registry 2007, 2008:1]. Copenhagen: Sundhedsstyrelsen; 2008 (in Danish).
DNK Denmark 2007 2007 21.9
Sundhedsstyrelsen [National Board of Health, Denmark]. Nye tal fra Sundhedsstyrelsen - Fødselsregisteret 2007, 2008:1 [New figures from the National Board of Health, Denmark - Birth Registry 2007, 2008:1]. Copenhagen: Sundhedsstyrelsen; 2008 (in Danish).
DNK Denmark 2008 2008 20.6
Sundhedsstyrelsen [National Board of Health, Denmark].Nye tal fra Sundhedsstyrelsen - Fødselsregisteret 1. Halvår 2008, 2008:8 [New figures from the National Board of Health, Denmark - Birth Registry 1. Half year 2008, 2008:8]. Copenhagen: Sundhedsstyrelsen; 2008 (in Danish).
DNK Denmark 2009 2009 21.0
Sundhedsstyrelsen [National Board of Health, Denmark]. Fødselsstatistikken 2011 [Birth Statistics 2011]. Copenhagen: Sundhedsstyrelsen; 2012 (in Danish).
DNK Denmark 2010 2010 21.2
Sundhedsstyrelsen [National Board of Health, Denmark]. Fødselsstatistikken 2011 [Birth Statistics 2011]. Copenhagen: Sundhedsstyrelsen; 2012 (in Danish).
BMJ Publishing Group Limited (BMJ) disclaims all liability and responsibility arising from any relianceSupplemental material placed on this supplemental material which has been supplied by the author(s) BMJ Global Health
doi: 10.1136/bmjgh-2021-005671:e005671. 6 2021;BMJ Global Health, et al. Betran AP

93
ISO
Cod
e
Country
Coverag
e start
year
Covera
ge end
year
Caesare
an
section
rate (%)
References
DNK Denmark 2011 2011 21.8
Sundhedsstyrelsen [National Board of Health, Denmark]. Fødselsstatistikken 2011 [Birth Statistics 2011]. Copenhagen: Sundhedsstyrelsen; 2012 (in Danish).
DNK Denmark 2012 2012 21.2
European Health for All Database (HFA-DB) [online database]. World Health Organization (WHO) Regional Office for Europe; 2016 (http://data.euro.who.int/hfadb, accessed 8 August 2016).
DNK Denmark 2012 2012 21.2
Statens Serum Institut. Fødselsstatistikken. Tal og analyser 2012 [Birth Statistics. Numbers and analysis 2012]. Copenhagen: Statens Serum Institut; 2013 (in Danish).
DNK Denmark 2015 2015 21.6
European Health Information Gateway. European Health for All database (HFA-DB). Caesarean sections per 1000 live births [online database]. World Health Organization (WHO) Regional Office for Europe; 2018 (https://gateway.euro.who.int/en/indicators/hfa_596-7060-caesarean-sections-per-1000-live-births/, accessed 14 February 2019).
DNK Denmark 2013 2013 22.0
Det Medicinske Fødselsregister (MFR), MFR-kuben, Institutional deliveries [online database]. Copenhagen: Sundhedsdatastyrelsen [National Board of Health Data, Denmark]; 2018 (http://www.esundhed.dk/sundhedsregistre/MFR/Sider/MFR06A.aspx, accessed 7 January 2018, in Danish).
DNK Denmark 2014 2014 21.2
Det Medicinske Fødselsregister (MFR), MFR-kuben, Institutional deliveries [online database]. Copenhagen: Sundhedsdatastyrelsen [National Board of Health Data, Denmark]; 2018 (http://www.esundhed.dk/sundhedsregistre/MFR/Sider/MFR06A.aspx, accessed 7 January 2018, in Danish).
DNK Denmark 2005 2005 20.5
Det Medicinske Fødselsregister (MFR), MFR-kuben, Institutional deliveries [online database]. Copenhagen: Sundhedsdatastyrelsen [National Board of Health Data, Denmark]; 2018 (http://www.esundhed.dk/sundhedsregistre/MFR/Sider/MFR06A.aspx, accessed 7 January 2018, in Danish).
DNK Denmark 2016 2016 19.5
Det Medicinske Fødselsregister (MFR), MFR-kuben, Institutional deliveries [online database]. Copenhagen: Sundhedsdatastyrelsen [National Board of Health Data, Denmark]; 2018 (http://www.esundhed.dk/sundhedsregistre/MFR/Sider/MFR06A.aspx, accessed 7 January 2018, in Danish).
BMJ Publishing Group Limited (BMJ) disclaims all liability and responsibility arising from any relianceSupplemental material placed on this supplemental material which has been supplied by the author(s) BMJ Global Health
doi: 10.1136/bmjgh-2021-005671:e005671. 6 2021;BMJ Global Health, et al. Betran AP

94
ISO
Cod
e
Country
Coverag
e start
year
Covera
ge end
year
Caesare
an
section
rate (%)
References
DNK Denmark 2017 2017 19.7
Det Medicinske Fødselsregister (MFR), MFR-kuben, Institutional deliveries [online database]. Copenhagen: Sundhedsdatastyrelsen [National Board of Health Data, Denmark]; 2019 (http://www.esundhed.dk/sundhedsregistre/MFR/Sider/MFR06A.aspx, accessed 12 February 2019, in Danish).
DNK Denmark 2018 2018 19.1
Det Medicinske Fødselsregister (MFR), MFR-kuben, Institutional deliveries [online database]. Copenhagen: Sundhedsdatastyrelsen [National Board of Health Data, Denmark]; 2020 (http://www.esundhed.dk/sundhedsregistre/MFR/Sider/MFR06A.aspx, accessed 20 February 2020, in Danish).
DJI Djibouti 1997 2002 6.1
Enquête Djiboutienne sur la Santé de la Famille. PAPFAM - Rapport Final. Djibouti: Gouvernement de Djibouti, Ligue des États Arabes; 2004 (in French).
DJI Djibouti 2007 2012 11.0
Deuxième Enquête Djiboutienne sur la Santé de la Famille (EDSF/PAPFAM 2 – 2012). Le Caire: Ministère de la Santé Djibouti, Direction de la Statistique et des Etudes Démographiques Djibouti, Ligue des États Arabes (Projet Pan Arabe sur la Santé de la Famille); 2012 (in French).
DOM Dominican Republic 1991 1996 25.9
Centro de Estudios Sociales y Demográficos (CESDEM), Asociación Dominicana Pro-Bienestar de la Familia (PROFAMILIA), Oficina Nacional de Planificación (ONAPLAN), Macro International Inc. Encuesta Demográfica y de Salud de la República Dominicana 1996 (ENDESA-96). Columbia, Maryland, USA: Macro International Inc.; 1997 (in Spanish).
DOM Dominican Republic 1994 1999 27.9
Centro de Estudios Sociales y Demográficos (CESDEM), USAID, Macro International Inc. Encuesta Experimental de Demográfica y de Salud 1999. Calverton, Maryland, USA: Macro International Inc.; 2001 (in Spanish).
DOM Dominican Republic 1997 2002 31.3
Molina Achécar M, Ramirez N, Polanco JJ, Ochoa LH, Lerebours G, Garcia B (Centro de Estudios Sociales y Demográficos - CESDEM/República Dominicana, ORC Macro). República Dominicana Encuesta Demográfica y de Salud (ENDESA) 2002. Santo Domingo, República Dominicana: Centro de Estudios Sociales y Demográficos - CESDEM/República Dominicana, ORC Macro; 2003 (in Spanish).
DOM Dominican Republic 2003 2003 31.5
Dominicana en cifras 2008. Santo Domingo: Oficina Nacional de Estadística (ONE); 2008 (in Spanish).
BMJ Publishing Group Limited (BMJ) disclaims all liability and responsibility arising from any relianceSupplemental material placed on this supplemental material which has been supplied by the author(s) BMJ Global Health
doi: 10.1136/bmjgh-2021-005671:e005671. 6 2021;BMJ Global Health, et al. Betran AP

95
ISO
Cod
e
Country
Coverag
e start
year
Covera
ge end
year
Caesare
an
section
rate (%)
References
DOM Dominican Republic 2006 2006 32.9
Dominicana en cifras 2008. Santo Domingo: Oficina Nacional de Estadística (ONE); 2008 (in Spanish).
DOM Dominican Republic 2007 2007 34.9
Dominicana en cifras 2008. Santo Domingo: Oficina Nacional de Estadística (ONE); 2008 (in Spanish).
DOM Dominican Republic 2002 2007 41.9
Centro de Estudios Sociales y Demográficos (CESDEM), Macro International Inc. Encuesta Demográfica y de Salud 2007. Santo Domingo, República Dominicana: CESDEM, Macro International Inc.; 2008 (in Spanish).
DOM Dominican Republic 2008 2008 36.2
Dominicana en cifras 2011. Santo Domingo: Oficina Nacional de Estadística (ONE); 2011 (in Spanish).
DOM Dominican Republic 2009 2009 37.5
Anuario de Salud 2009. Santo Domingo: Oficina Nacional de Estadística (ONE); 2009 (in Spanish).
DOM Dominican Republic 2008 2013 56.4
Centro de Estudios Sociales y Demográficos (CESDEM), ICF International. Encuesta Demográfica y de Salud 2013. Santo Domingo, República Dominicana: CESDEM, ICF International; 2014 (in Spanish).
DOM Dominican Republic 2012 2012 58.1
Oficina Nacional de Estadísticas, Fondo de las Naciones Unidas para la Infancia (UNICEF). Encuesta Nacional de Hogares de Propósitos Múltiples - Encuesta de Indicadores Múltiples por Conglomerados 2014. Informe final. Santo Domingo, República Dominicana: Oficina Nacional de Estadística; 2016 (in Spanish).
ECU Ecuador 1989 1994 17.1
Encuesta Demográfica y de Salud Materna e Infantil (ENDEMAIN) Ecuador 94. Informe General. Quito: Centro de Estudios de Población y Paternidad Responsable (CEPAR), Centros para el Control y la Prevención de Enfermedades [Centers for Disease Control and Prevention] (CDC); 1995 (in Spanish).
BMJ Publishing Group Limited (BMJ) disclaims all liability and responsibility arising from any relianceSupplemental material placed on this supplemental material which has been supplied by the author(s) BMJ Global Health
doi: 10.1136/bmjgh-2021-005671:e005671. 6 2021;BMJ Global Health, et al. Betran AP

96
ISO
Cod
e
Country
Coverag
e start
year
Covera
ge end
year
Caesare
an
section
rate (%)
References
ECU Ecuador 1994 1999 19.9
Encuesta Demográfica y de Salud Materna e Infantil (ENDEMAIN) Ecuador 99. Informe General. Quito: Centro de Estudios de Población y Paternidad Responsable (CEPAR), Centros para el Control y la Prevención de Enfermedades [Centers for Disease Control and Prevention] (CDC); 2001 (in Spanish).
ECU Ecuador 1999 2004 25.8
Encuesta Demográfica y de Salud Materna e Infantil (ENDEMAIN) Ecuador 2004. Informe Final. Quito: Centro de Estudios de Población y Paternidad Responsable (CEPAR), Centro de Estudios de Población y Desarrollo Social, Centros para el Control y la Prevención de Enfermedades [Centers for Disease Control and Prevention] (CDC); 2005 (in Spanish).
ECU Ecuador 2006 2006 25.1
Producción Estadística MSP 2006-2014. Quito: Ministerio de Salud del Ecuador; 2015 (in Spanish).
ECU Ecuador 2007 2007 26.6
Producción Estadística MSP 2006-2014. Quito: Ministerio de Salud del Ecuador; 2015 (in Spanish).
ECU Ecuador 2008 2008 27.4
Producción Estadística MSP 2006-2014. Quito: Ministerio de Salud del Ecuador; 2015 (in Spanish).
ECU Ecuador 2009 2009 27.5
Producción Estadística MSP 2006-2014. Quito: Ministerio de Salud del Ecuador; 2015 (in Spanish).
ECU Ecuador 2010 2010 28.9
Producción Estadística MSP 2006-2014. Quito: Ministerio de Salud del Ecuador; 2015 (in Spanish).
ECU Ecuador 2011 2011 30.5
Producción Estadística MSP 2006-2014. Quito: Ministerio de Salud del Ecuador; 2015 (in Spanish).
BMJ Publishing Group Limited (BMJ) disclaims all liability and responsibility arising from any relianceSupplemental material placed on this supplemental material which has been supplied by the author(s) BMJ Global Health
doi: 10.1136/bmjgh-2021-005671:e005671. 6 2021;BMJ Global Health, et al. Betran AP

97
ISO
Cod
e
Country
Coverag
e start
year
Covera
ge end
year
Caesare
an
section
rate (%)
References
ECU Ecuador 2012 2012 38.6
Boletín Nacimientos por cesárea MSP 2012-2015. Quito: Ministerio de Salud Pública del Ecuador; 2016 (in Spanish).
ECU Ecuador 2013 2013 48.8
Boletín Nacimientos por cesárea MSP 2012-2015. Quito: Ministerio de Salud Pública del Ecuador; 2016 (in Spanish).
ECU Ecuador 2014 2014 50.6
Boletín Nacimientos por cesárea MSP 2012-2015. Quito: Ministerio de Salud Pública del Ecuador; 2016 (in Spanish).
ECU Ecuador 2015 2015 49.0
Boletín Nacimientos por cesárea MSP 2012-2015. Quito: Ministerio de Salud Pública del Ecuador; 2016 (in Spanish).
ECU Ecuador 2016 2016 46.2
Boletín Nacimientos por cesárea MSP 2013-2016. Quito: Ministerio de Salud Pública [Ecuador]; 2018 (in Spanish).
EGY Egypt 1987 1992 4.6
EI-Zanaty FH, Sayed H AA, Zaky Hassan HM, Way AA (National Population Council [Egypt], Macro International Inc.). Egypt Demographic and Health Survey 1992. Calverton, Maryland [USA]: National Population Council [Egypt], Macro International Inc.; 1993.
EGY Egypt 1990 1995 6.6
EI-Zanaty F, Hussein EM, Shawky GA, Way AA, Kishor S (National Population Council [Egypt], Macro International Inc.). Egypt Demographic and Health Survey 1995. Calverton, Maryland [USA]: National Population Council [Egypt], Macro International Inc.; 1996.
EGY Egypt 1995 2000 10.3
El-Zanaty F, Way A (Ministry of Health and Population [Egypt], National Population Council, ORC Macro). Egypt Demographic and Health Survey 2000. Calverton, Maryland [USA]: Ministry of Health and Population [Egypt], National Population Council, ORC Macro; 2001.
BMJ Publishing Group Limited (BMJ) disclaims all liability and responsibility arising from any relianceSupplemental material placed on this supplemental material which has been supplied by the author(s) BMJ Global Health
doi: 10.1136/bmjgh-2021-005671:e005671. 6 2021;BMJ Global Health, et al. Betran AP

98
ISO
Cod
e
Country
Coverag
e start
year
Covera
ge end
year
Caesare
an
section
rate (%)
References
EGY Egypt 2000 2005 19.9
El-Zanaty F, Way A (Ministry of Health and Population, National Population Council, El-Zanaty and Associates, ORC Macro). Egypt Demographic and Health Survey 2005. Cairo, Egypt: Ministry of Health and Population, National Population Council, El-Zanaty and Associates, ORC Macro; 2006.
EGY Egypt 2003 2008 27.6
El-Zanaty F, Way A (Ministry of Health, El-Zanaty and Associates, Macro International). Egypt Demographic and Health Survey 2008. Cairo, Egypt: Ministry of Health, El-Zanaty and Associates, Macro International; 2009.
EGY Egypt 2009 2014 51.8
Ministry of Health and Population [Egypt], El-Zanaty and Associates [Egypt], ICF International. Egypt Demographic and Health Survey 2014. Cairo, Egypt and Rockville, Maryland, USA: Ministry of Health and Population, ICF International; 2015.
SLV El Salvador 1991 1993 13.4
Asociación Demográfica Salvadoreña (ADS), Centros para el Control y Prevención de Enfermedades (CDC), Agencia de los Estados Unidos para el Desarrollo Internacional (USAID), Ministerio de Salud Pública y Asistencia Social (MSPAS), MIPLAN, Instituto Salvadoreño del Seguro Social (ISSS), Dirección General de Estadística y Censos (DIGESTYC). Encuesta Nacional de Salud Familiar (FESAL) 93. Informe Final. San Salvador: ADS; 1994 (in Spanish).
SLV El Salvador 1996 1998 15.7
Asociación Demográfica Salvadoreña (ADS), Comité Consultivo Interinstitucional (CCI), Centros para el Control y Prevención de Enfermedades (CDC), Agencia de los Estados Unidos para el Desarrollo Internacional (USAID), Fondo de las Naciones Unidas para la Infancia (UNICEF), Organización Panamericana de la Salud/Instituto de Nutrición de Centro América y Panamá (OPS/INCAP), Fondo de Población de las Naciones Unidas (FNUAP/UNFPA), Ministerio de Salud Pública y Asistencia Social (MSPAS), Ministerio de Relaciones Exteriores (M.RR.EE.), Instituto Salvadoreño del Seguro Social (ISSS), Dirección General de Estadística y Censos (DIGESTYC), Proyecto de Salud Materno Infantil (PROSAMI). Encuesta Nacional de Salud Familiar (FESAL) 98. Informe Final. San Salvador: ADS; 2000 (in Spanish).
SLV El Salvador 1997 2003 22.0
Asociación Demográfica Salvadoreña (ADS), Comité Consultivo Interinstitucional (CCI), Centros para el Control y Prevención de Enfermedades (CDC), Agencia de los Estados Unidos para el Desarrollo Internacional (USAID). Encuesta Nacional de Salud Familiar (FESAL) 2002/03. Informe Final. San Salvador: ADS; 2004 (in Spanish).
SLV El Salvador 2007 2007 28.2
Informe de Labores 2011-2012. San Salvador: Ministerio de Salud de El Salvador; 2012 (in Spanish).
SLV El Salvador 2003 2008 24.9
Asociación Demográfica Salvadoreña (ADS), Comité Consultivo Interinstitucional (CCI), Centros para el Control y Prevención de Enfermedades (CDC), Agencia de los Estados Unidos para el Desarrollo Internacional (USAID). Encuesta Nacional de Salud Familiar (FESAL) 2008. Informe Final. San Salvador: ADS; 2009 (in Spanish).
BMJ Publishing Group Limited (BMJ) disclaims all liability and responsibility arising from any relianceSupplemental material placed on this supplemental material which has been supplied by the author(s) BMJ Global Health
doi: 10.1136/bmjgh-2021-005671:e005671. 6 2021;BMJ Global Health, et al. Betran AP

99
ISO
Cod
e
Country
Coverag
e start
year
Covera
ge end
year
Caesare
an
section
rate (%)
References
SLV El Salvador 2008 2008 28.1
Informe de Labores 2011-2012. San Salvador: Ministerio de Salud de El Salvador; 2012 (in Spanish).
SLV El Salvador 2009 2009 29.9
Informe de Labores 2011-2012. San Salvador: Ministerio de Salud de El Salvador; 2012 (in Spanish).
SLV El Salvador 2010 2010 29.5
Informe de Labores 2011-2012. San Salvador: Ministerio de Salud de El Salvador; 2012 (in Spanish).
SLV El Salvador 2011 2011 30.4
Informe de Labores 2011-2012. San Salvador: Ministerio de Salud de El Salvador; 2012 (in Spanish).
SLV El Salvador 2012 2012 28.2
Informe de Labores 2012-2013. San Salvador: Ministerio de Salud de El Salvador; 2013 (in Spanish).
SLV El Salvador 2014 2014 28.7
Informe de Labores 2016-2017. San Salvador: Ministerio de Salud de El Salvador; 2017 (in Spanish).
SLV El Salvador 2015 2015 29.9
Informe de Labores 2016-2017. San Salvador: Ministerio de Salud de El Salvador; 2017 (in Spanish).
SLV El Salvador 2016 2016 31.3
Informe de Labores 2016-2017. San Salvador: Ministerio de Salud de El Salvador; 2017 (in Spanish).
BMJ Publishing Group Limited (BMJ) disclaims all liability and responsibility arising from any relianceSupplemental material placed on this supplemental material which has been supplied by the author(s) BMJ Global Health
doi: 10.1136/bmjgh-2021-005671:e005671. 6 2021;BMJ Global Health, et al. Betran AP

100
ISO
Cod
e
Country
Coverag
e start
year
Covera
ge end
year
Caesare
an
section
rate (%)
References
SLV El Salvador 2012 2014 32
Ministerio de Salud/Instituto Nacional de Salud, Fondo de las Naciones Unidas para la Infancia (UNICEF). Encuesta Nacional de Salud 2014 - Encuesta de Indicadores Múltiples por Conglomerados 2014, Resultados Principales. San Salvador, El Salvador: Ministerio de Salud e Instituto Nacional de Salud; 2015 (in Spanish).
SLV El Salvador 2017 2017 29.9
Informe de Labores 2017-2018. San Salvador: Ministerio de Salud de El Salvador; 2018 (in Spanish).
SLV El Salvador 2018 2018 29.8
Informe de Labores 2018-2019. San Salvador: Ministerio de Salud de El Salvador; 2019 (in Spanish).
GNQ Equatorial Guinea 2006 2011 6.6
Ministerio de Sanidad y Bienestar Social, Ministerio de Economía, Planificación e Inversiones Públicas, ICF International. Encuesta Demográfica y de Salud (EDSGE-I) 2011. Calverton, Maryland, USA; 2012 (in Spanish).
ERI Eritrea 1992 1995 1.6
National Statistics Office [Eritrea], Macro International Inc. Eritrea Demographic and Health Survey, 1995. Calverton, Maryland: National Statistics Office, Macro International Inc.; 1997.
ERI Eritrea 1997 2002 2.7
National Statistics and Evaluation Office (NSEO) [Eritrea], ORC Macro. Eritrea Demographic and Health Survey 2002. Calverton, Maryland, USA: National Statistics and Evaluation Office, ORC Macro; 2003.
ERI Eritrea 2005 2010 2.8
Eritrea Population and Health Survey 2010. Asmara: National Statistics Office (NSO), Eritrea, Fafo Institute for Applied International Studies (Fafo AIS); 2013.
EST Estonia 1990 1990 6.3
European Health for All Database (HFA-DB) [online database]. World Health Organization (WHO) Regional Office for Europe; 2012 (http://data.euro.who.int/hfadb, accessed 20 August 2012).
BMJ Publishing Group Limited (BMJ) disclaims all liability and responsibility arising from any relianceSupplemental material placed on this supplemental material which has been supplied by the author(s) BMJ Global Health
doi: 10.1136/bmjgh-2021-005671:e005671. 6 2021;BMJ Global Health, et al. Betran AP

101
ISO
Cod
e
Country
Coverag
e start
year
Covera
ge end
year
Caesare
an
section
rate (%)
References
EST Estonia 1991 1991 6.3
European Health for All Database (HFA-DB) [online database]. World Health Organization (WHO) Regional Office for Europe; 2012 (http://data.euro.who.int/hfadb, accessed 20 August 2012).
EST Estonia 1992 1992 6.4
Estonian Medical Birth Registry (EMBR). Mode of delivery, 1992-2013 [website]. Tallinn: National Institute for Health Development [Estonia]; 2014 (http://www.tai.ee/en/r-and-d/registers/estonian-medical-birth-registry-and-estonian-abortion-registry/statistics, accessed 23 October 2014).
EST Estonia 1993 1993 7.0
Estonian Medical Birth Registry (EMBR). Mode of delivery, 1992-2013 [website]. Tallinn: National Institute for Health Development [Estonia]; 2014 (http://www.tai.ee/en/r-and-d/registers/estonian-medical-birth-registry-and-estonian-abortion-registry/statistics, accessed 23 October 2014).
EST Estonia 1994 1994 8.8
Estonian Medical Birth Registry (EMBR). Mode of delivery, 1992-2013 [website]. Tallinn: National Institute for Health Development [Estonia]; 2014 (http://www.tai.ee/en/r-and-d/registers/estonian-medical-birth-registry-and-estonian-abortion-registry/statistics, accessed 23 October 2014).
EST Estonia 1995 1995 9.7
Estonian Medical Birth Registry (EMBR). Mode of delivery, 1992-2013 [website]. Tallinn: National Institute for Health Development [Estonia]; 2014 (http://www.tai.ee/en/r-and-d/registers/estonian-medical-birth-registry-and-estonian-abortion-registry/statistics, accessed 23 October 2014).
EST Estonia 1996 1996 10.2
Estonian Medical Birth Registry (EMBR). Mode of delivery, 1992-2013 [website]. Tallinn: National Institute for Health Development [Estonia]; 2014 (http://www.tai.ee/en/r-and-d/registers/estonian-medical-birth-registry-and-estonian-abortion-registry/statistics, accessed 23 October 2014).
EST Estonia 1997 1997 11.3
Estonian Medical Birth Registry (EMBR). Mode of delivery, 1992-2013 [website]. Tallinn: National Institute for Health Development [Estonia]; 2014 (http://www.tai.ee/en/r-and-d/registers/estonian-medical-birth-registry-and-estonian-abortion-registry/statistics, accessed 23 October 2014).
EST Estonia 1998 1998 13.2
Estonian Medical Birth Registry (EMBR). Mode of delivery, 1992-2013 [website]. Tallinn: National Institute for Health Development [Estonia]; 2014 (http://www.tai.ee/en/r-and-d/registers/estonian-medical-birth-registry-and-estonian-abortion-registry/statistics, accessed 23 October 2014).
BMJ Publishing Group Limited (BMJ) disclaims all liability and responsibility arising from any relianceSupplemental material placed on this supplemental material which has been supplied by the author(s) BMJ Global Health
doi: 10.1136/bmjgh-2021-005671:e005671. 6 2021;BMJ Global Health, et al. Betran AP

102
ISO
Cod
e
Country
Coverag
e start
year
Covera
ge end
year
Caesare
an
section
rate (%)
References
EST Estonia 1999 1999 14.0
Estonian Medical Birth Registry (EMBR). Mode of delivery, 1992-2013 [website]. Tallinn: National Institute for Health Development [Estonia]; 2014 (http://www.tai.ee/en/r-and-d/registers/estonian-medical-birth-registry-and-estonian-abortion-registry/statistics, accessed 23 October 2014).
EST Estonia 2000 2000 14.6
Estonian Medical Birth Registry (EMBR). Mode of delivery, 1992-2013 [website]. Tallinn: National Institute for Health Development [Estonia]; 2014 (http://www.tai.ee/en/r-and-d/registers/estonian-medical-birth-registry-and-estonian-abortion-registry/statistics, accessed 23 October 2014).
EST Estonia 2001 2001 15.6
Estonian Medical Birth Registry (EMBR). Mode of delivery, 1992-2013 [website]. Tallinn: National Institute for Health Development [Estonia]; 2014 (http://www.tai.ee/en/r-and-d/registers/estonian-medical-birth-registry-and-estonian-abortion-registry/statistics, accessed 23 October 2014).
EST Estonia 2002 2002 15.1
Estonian Medical Birth Registry (EMBR). Mode of delivery, 1992-2013 [website]. Tallinn: National Institute for Health Development [Estonia]; 2014 (http://www.tai.ee/en/r-and-d/registers/estonian-medical-birth-registry-and-estonian-abortion-registry/statistics, accessed 23 October 2014).
EST Estonia 2003 2003 16.5
Estonian Medical Birth Registry (EMBR). Mode of delivery, 1992-2013 [website]. Tallinn: National Institute for Health Development [Estonia]; 2014 (http://www.tai.ee/en/r-and-d/registers/estonian-medical-birth-registry-and-estonian-abortion-registry/statistics, accessed 23 October 2014).
EST Estonia 2004 2004 17.3
Estonian Medical Birth Registry (EMBR). Mode of delivery, 1992-2013 [website]. Tallinn: National Institute for Health Development [Estonia]; 2014 (http://www.tai.ee/en/r-and-d/registers/estonian-medical-birth-registry-and-estonian-abortion-registry/statistics, accessed 23 October 2014).
EST Estonia 2005 2005 19.0
Estonian Medical Birth Registry (EMBR). Mode of delivery, 1992-2013 [website]. Tallinn: National Institute for Health Development [Estonia]; 2014 (http://www.tai.ee/en/r-and-d/registers/estonian-medical-birth-registry-and-estonian-abortion-registry/statistics, accessed 23 October 2014).
EST Estonia 2006 2006 19.2
Estonian Medical Birth Registry (EMBR). Mode of delivery, 1992-2013 [website]. Tallinn: National Institute for Health Development [Estonia]; 2014 (http://www.tai.ee/en/r-and-d/registers/estonian-medical-birth-registry-and-estonian-abortion-registry/statistics, accessed 23 October 2014).
BMJ Publishing Group Limited (BMJ) disclaims all liability and responsibility arising from any relianceSupplemental material placed on this supplemental material which has been supplied by the author(s) BMJ Global Health
doi: 10.1136/bmjgh-2021-005671:e005671. 6 2021;BMJ Global Health, et al. Betran AP

103
ISO
Cod
e
Country
Coverag
e start
year
Covera
ge end
year
Caesare
an
section
rate (%)
References
EST Estonia 2007 2007 20.1
Estonian Medical Birth Registry (EMBR). Mode of delivery, 1992-2013 [website]. Tallinn: National Institute for Health Development [Estonia]; 2014 (http://www.tai.ee/en/r-and-d/registers/estonian-medical-birth-registry-and-estonian-abortion-registry/statistics, accessed 23 October 2014).
EST Estonia 2008 2008 20.2
Estonian Medical Birth Registry (EMBR). Mode of delivery, 1992-2013 [website]. Tallinn: National Institute for Health Development [Estonia]; 2014 (http://www.tai.ee/en/r-and-d/registers/estonian-medical-birth-registry-and-estonian-abortion-registry/statistics, accessed 23 October 2014).
EST Estonia 2009 2009 20.9
Estonian Medical Birth Registry (EMBR). Mode of delivery, 1992-2013 [website]. Tallinn: National Institute for Health Development [Estonia]; 2014 (http://www.tai.ee/en/r-and-d/registers/estonian-medical-birth-registry-and-estonian-abortion-registry/statistics, accessed 23 October 2014).
EST Estonia 2010 2010 20.4
Estonian Medical Birth Registry (EMBR). Mode of delivery, 1992-2013 [website]. Tallinn: National Institute for Health Development [Estonia]; 2014 (http://www.tai.ee/en/r-and-d/registers/estonian-medical-birth-registry-and-estonian-abortion-registry/statistics, accessed 23 October 2014).
EST Estonia 2011 2011 20.2
Estonian Medical Birth Registry (EMBR). Mode of delivery, 1992-2013 [website]. Tallinn: National Institute for Health Development [Estonia]; 2014 (http://www.tai.ee/en/r-and-d/registers/estonian-medical-birth-registry-and-estonian-abortion-registry/statistics, accessed 23 October 2014).
EST Estonia 2012 2012 19.9
Estonian Medical Birth Registry (EMBR). SR 45: Mode of delivery by country: 2012 [website]. Tallinn: National Institute for Health Development [Estonia]; 2013 (http://www.tai.ee/en/r-and-d/registers/estonian-medical-birth-registry-and-estonian-abortion-registry/statistics, accessed 15 October 2013).
EST Estonia 2013 2013 19.7
Estonian Medical Birth Registry (EMBR). Mode of delivery, 1992-2013 [website]. Tallinn: National Institute for Health Development [Estonia]; 2014 (http://www.tai.ee/en/r-and-d/registers/estonian-medical-birth-registry-and-estonian-abortion-registry/statistics, accessed 23 October 2014).
EST Estonia 2014 2014 19.9
Estonian Medical Birth Registry (EMBR). Mode of delivery, 1992-2016 [website]. Tallinn: National Institute for Health Development [Estonia]; 2017 (http://www.tai.ee/en/r-and-d/registers/estonian-medical-birth-registry-and-estonian-abortion-registry/statistics, accessed 2 November 2017).
BMJ Publishing Group Limited (BMJ) disclaims all liability and responsibility arising from any relianceSupplemental material placed on this supplemental material which has been supplied by the author(s) BMJ Global Health
doi: 10.1136/bmjgh-2021-005671:e005671. 6 2021;BMJ Global Health, et al. Betran AP

104
ISO
Cod
e
Country
Coverag
e start
year
Covera
ge end
year
Caesare
an
section
rate (%)
References
EST Estonia 2015 2015 18.7
Estonian Medical Birth Registry (EMBR). Mode of delivery,1992-2016 [website]. Tallinn: National Institute for Health Development [Estonia]; 2017 (http://www.tai.ee/en/r-and-d/registers/estonian-medical-birth-registry-and-estonian-abortion-registry/statistics, accessed 2 November 2017).
EST Estonia 2016 2016 20.3
Estonian Medical Birth Registry (EMBR). Mode of delivery, 1992-2016 [website]. Tallinn: National Institute for Health Development [Estonia]; 2017 (http://www.tai.ee/en/r-and-d/registers/estonian-medical-birth-registry-and-estonian-abortion-registry/statistics, accessed 2 November 2017).
EST Estonia 2017 2017 19.9
Estonian Medical Birth Registry (EMBR). Mode of delivery, 1992-2017 [website]. Tallinn: National Institute for Health Development [Estonia]; 2019 (https://www.tai.ee/en/r-and-d/registers/estonian-medical-birth-registry-and-estonian-abortion-registry/statistical-data-of-embr-and-ear, accessed 13 February 2019).
EST Estonia 2018 2018 19.1
Health statistics and health research database. SR45: Mode of delivery by health care provider's county [online database]. Tallinn: National Institute for Health Development [Estonia]; 2019 (http://pxweb.tai.ee/PXWeb2015/pxweb/en/01Rahvastik/01Rahvastik__02Synnid/SR45.px/table/tableViewLayout2/?rxid=9de2b5d7-dedf-4184-b3e9-cc2fcae6c610, accessed 20 February 2020).
ETH Ethiopia 1995 2000 0.7
Central Statistical Authority [Ethiopia], ORC Macro. Ethiopia Demographic and Health Survey 2000. Addis Ababa, Ethiopia and Calverton, Maryland, USA: Central Statistical Authority, ORC Macro; 2001.
ETH Ethiopia 2000 2005 1.0
Central Statistical Agency, ORC Macro. Ethiopia Demographic and Health Survey 2005. Addis Ababa, Ethiopia and Calverton, Maryland, USA: Central Statistical Agency, ORC Macro; 2006.
ETH Ethiopia 2005 2011 1.5
Central Statistical Agency [Ethiopia], ICF International. Ethiopia Demographic and Health Survey 2011. Addis Ababa, Ethiopia and Calverton, Maryland, USA: Central Statistical Agency, ICF International; 2012.
ETH Ethiopia 2009 2014 2.1
Ethiopia Mini Demographic and Health Survey 2014. Addis Ababa: Central Statistical Agency [Ethiopia]; 2014.
BMJ Publishing Group Limited (BMJ) disclaims all liability and responsibility arising from any relianceSupplemental material placed on this supplemental material which has been supplied by the author(s) BMJ Global Health
doi: 10.1136/bmjgh-2021-005671:e005671. 6 2021;BMJ Global Health, et al. Betran AP

105
ISO
Cod
e
Country
Coverag
e start
year
Covera
ge end
year
Caesare
an
section
rate (%)
References
ETH Ethiopia 2011 2016 1.9
Central Statistical Agency (CSA) [Ethiopia], ICF. Ethiopia Demographic and Health Survey 2016. Addis Ababa, Ethiopia, and Rockville, Maryland, USA: CSA , ICF; 2016.
FIN Finland 1990 1990 13.7
Synnyttäjät, synnytykset ja vastasyntyneet 2002 - Parturients, births and newborn infants 2002. Statistical Summary 24/2003. Helsinki: National Research and Development Centre for Welfare and Health; 2003.
FIN Finland 1991 1991 14.3
Synnyttäjät, synnytykset ja vastasyntyneet 2000 - tiedonantajapalaute 16/2001 - Parturients, births and newborn infants 2000 - data supplier feedback 16/2001. Helsinki: STAKES/Stakes Information, Welfare and Health care Statistics; 2001.
FIN Finland 1992 1992 14.6
Perinataalitilasto - synnyttäjät, synnytykset ja vastasyntyneet 2010 - Perinatal statistics: parturients, deliveries and newborns 2010. Statistical report 27/2011. Helsinki: Terveyden ja Hyvinvoinnin Laitos/National Institute for Health and Welfare (THL), Finland; 2011.
FIN Finland 1993 1993 14.7
Synnytykset ja vastasyntyneet 2009 - Births and Newborns 2009. Statistical report 26/2010. Helsinki: Terveyden ja Hyvinvoinnin Laitos/National Institute for Health and Welfare (THL), Finland; 2010.
FIN Finland 1994 1994 15.6
Synnyttäjät, synnytykset ja vastasyntyneet 2004 - Parturients, births and newborns 2004. Statistical Summary 21/2005. Helsinki: National Research and Development Centre for Welfare and Health; 2005.
FIN Finland 1995 1995 15.8
Synnytykset ja vastasyntyneet 2009 - Births and Newborns 2009. Statistical report 26/2010. Helsinki: Terveyden ja Hyvinvoinnin Laitos/National Institute for Health and Welfare (THL), Finland; 2010.
FIN Finland 1996 1996 15.9
Perinataalitilasto - synnyttäjät, synnytykset ja vastasyntyneet 2010 - Perinatal statistics: parturients, deliveries and newborns 2010. Statistical report 27/2011. Helsinki: Terveyden ja Hyvinvoinnin Laitos/National Institute for Health and Welfare (THL), Finland; 2011.
BMJ Publishing Group Limited (BMJ) disclaims all liability and responsibility arising from any relianceSupplemental material placed on this supplemental material which has been supplied by the author(s) BMJ Global Health
doi: 10.1136/bmjgh-2021-005671:e005671. 6 2021;BMJ Global Health, et al. Betran AP

106
ISO
Cod
e
Country
Coverag
e start
year
Covera
ge end
year
Caesare
an
section
rate (%)
References
FIN Finland 1997 1997 15.8
Synnytykset ja vastasyntyneet 2009 - Births and Newborns 2009. Statistical report 26/2010. Helsinki: Terveyden ja Hyvinvoinnin Laitos/National Institute for Health and Welfare (THL), Finland; 2010.
FIN Finland 1998 1998 15.6
Perinataalitilasto - synnyttäjät, synnytykset ja vastasyntyneet 2010 - Perinatal statistics: parturients, deliveries and newborns 2010. Statistical report 27/2011. Helsinki: Terveyden ja Hyvinvoinnin Laitos/National Institute for Health and Welfare (THL), Finland; 2011.
FIN Finland 1999 1999 16.0
Synnytykset ja vastasyntyneet 2009 - Births and Newborns 2009. Statistical report 26/2010. Helsinki: Terveyden ja Hyvinvoinnin Laitos/National Institute for Health and Welfare (THL), Finland; 2010.
FIN Finland 2000 2000 16.0
Perinataalitilasto - synnyttäjät, synnytykset ja vastasyntyneet 2010 - Perinatal statistics: parturients, deliveries and newborns 2010. Statistical report 27/2011. Helsinki: Terveyden ja Hyvinvoinnin Laitos/National Institute for Health and Welfare (THL), Finland; 2011.
FIN Finland 2001 2001 16.7
Synnytykset ja vastasyntyneet 2009 - Births and Newborns 2009. Statistical report 26/2010. Helsinki: Terveyden ja Hyvinvoinnin Laitos/National Institute for Health and Welfare (THL), Finland; 2010.
FIN Finland 2002 2002 16.6
Perinataalitilasto - synnyttäjät, synnytykset ja vastasyntyneet 2010 - Perinatal statistics: parturients, deliveries and newborns 2010. Statistical report 27/2011. Helsinki: Terveyden ja Hyvinvoinnin Laitos/National Institute for Health and Welfare (THL), Finland; 2011.
FIN Finland 2003 2003 16.4
Synnytykset ja vastasyntyneet 2009 - Births and Newborns 2009. Statistical report 26/2010. Helsinki: Terveyden ja Hyvinvoinnin Laitos/National Institute for Health and Welfare (THL), Finland; 2010.
FIN Finland 2004 2004 16.6
Perinataalitilasto - synnyttäjät, synnytykset ja vastasyntyneet 2010 - Perinatal statistics: parturients, deliveries and newborns 2010. Statistical report 27/2011. Helsinki: Terveyden ja Hyvinvoinnin Laitos/National Institute for Health and Welfare (THL), Finland; 2011.
BMJ Publishing Group Limited (BMJ) disclaims all liability and responsibility arising from any relianceSupplemental material placed on this supplemental material which has been supplied by the author(s) BMJ Global Health
doi: 10.1136/bmjgh-2021-005671:e005671. 6 2021;BMJ Global Health, et al. Betran AP

107
ISO
Cod
e
Country
Coverag
e start
year
Covera
ge end
year
Caesare
an
section
rate (%)
References
FIN Finland 2006 2006 16.3
Perinataalitilasto - synnyttäjät, synnytykset ja vastasyntyneet 2010 - Perinatal statistics: parturients, deliveries and newborns 2010. Statistical report 27/2011. Helsinki: Terveyden ja Hyvinvoinnin Laitos/National Institute for Health and Welfare (THL), Finland; 2011.
FIN Finland 2007 2007 16.5
Perinataalitilasto - synnyttäjät, synnytykset ja vastasyntyneet 2010 - Perinatal statistics: parturients, deliveries and newborns 2010. Statistical report 27/2011. Helsinki: Terveyden ja Hyvinvoinnin Laitos/National Institute for Health and Welfare (THL), Finland; 2011.
FIN Finland 2008 2008 16.7
Perinataalitilasto - synnyttäjät, synnytykset ja vastasyntyneet 2010 - Perinatal statistics: parturients, deliveries and newborns 2010. Statistical report 27/2011. Helsinki: Terveyden ja Hyvinvoinnin Laitos/National Institute for Health and Welfare (THL), Finland; 2011.
FIN Finland 2009 2009 15.9
Perinataalitilasto - synnyttäjät, synnytykset ja vastasyntyneet 2010 - Perinatal statistics: parturients, deliveries and newborns 2010. Statistical report 27/2011. Helsinki: Terveyden ja Hyvinvoinnin Laitos/National Institute for Health and Welfare (THL), Finland; 2011.
FIN Finland 2010 2010 16.3
Perinataalitilasto - synnyttäjät, synnytykset ja vastasyntyneet 2010 - Perinatal statistics: parturients, deliveries and newborns 2010. Statistical report 27/2011. Helsinki: Terveyden ja Hyvinvoinnin Laitos/National Institute for Health and Welfare (THL), Finland; 2011.
FIN Finland 2011 2011 16.3
Perinataalitilasto - synnyttäjät, synnytykset ja vastasyntyneet 2011 - Perinatal statistics: parturients, deliveries and newborns 2011. Statistical report 20/2012. Helsinki: Terveyden ja Hyvinvoinnin Laitos/National Institute for Health and Welfare (THL), Finland; 2012.
FIN Finland 2012 2012 16.3
Perinataalitilasto - synnyttäjät, synnytykset ja vastasyntyneet 2012 - Perinatal statistics: parturients, deliveries and newborns 2012. Statistical report 24/2013. Helsinki: Terveyden ja Hyvinvoinnin Laitos/National Institute for Health and Welfare (THL), Finland; 2013.
FIN Finland 2013 2013 16.3
Perinataalitilasto - synnyttäjät, synnytykset ja vastasyntyneet 2013 - Perinatal statistics: parturients, deliveries and newborns 2013. Statistical report 23/2014. Helsinki: Terveyden ja Hyvinvoinnin Laitos/National Institute for Health and Welfare (THL), Finland; 2014.
BMJ Publishing Group Limited (BMJ) disclaims all liability and responsibility arising from any relianceSupplemental material placed on this supplemental material which has been supplied by the author(s) BMJ Global Health
doi: 10.1136/bmjgh-2021-005671:e005671. 6 2021;BMJ Global Health, et al. Betran AP

108
ISO
Cod
e
Country
Coverag
e start
year
Covera
ge end
year
Caesare
an
section
rate (%)
References
FIN Finland 2014 2014 16.1
Perinataalitilasto - synnyttäjät, synnytykset ja vastasyntyneet 2014 - Perinatal statistics: parturients, deliveries and newborns 2014. Statistical report 19/2015. Helsinki: Terveyden ja Hyvinvoinnin Laitos/National Institute for Health and Welfare (THL), Finland; 2015.
FIN Finland 2005 2005 15.9
Perinataalitilasto - synnyttäjät, synnytykset ja vastasyntyneet 2015 - Perinatal statistics: parturients, deliveries and newborns 2015. Statistical report 16/2016. Helsinki: Terveyden ja Hyvinvoinnin Laitos/National Institute for Health and Welfare (THL), Finland; 2016.
FIN Finland 2016 2016 16.4
Perinataalitilasto - synnyttäjät, synnytykset ja vastasyntyneet 2016 [Perinatal statistics: parturients, deliveries and newborns 2016]. [Statistical report] 37/2017. Helsinki: Terveyden ja Hyvinvoinnin Laitos/National Institute for Health and Welfare (THL), Finland; 2017 (in Finnish).
FIN Finland 2015 2015 16.0
Perinataalitilasto - synnyttäjät, synnytykset ja vastasyntyneet 2017 [Perinatal statistics: parturients, deliveries and newborns 2017]. Tilastoraportti [Statistical report] 38/2018. Helsinki: Terveyden ja Hyvinvoinnin Laitos/National Institute for Health and Welfare (THL) [Finland]; 2018.
FIN Finland 2017 2017 16.7
Perinataalitilasto - synnyttäjät, synnytykset ja vastasyntyneet 2017 [Perinatal statistics: parturients, deliveries and newborns 2017]. Tilastoraportti [Statistical report] 38/2018. Helsinki: Terveyden ja Hyvinvoinnin Laitos/National Institute for Health and Welfare (THL) [Finland]; 2018.
FIN Finland 2018 2018 16.7
Perinataalitilasto - synnyttäjät, synnytykset ja vastasyntyneet 2018 [Perinatal statistics: parturients, deliveries and newborns 2018]. Tilastoraportti [Statistical report] 49/2019. Helsinki: Terveyden ja Hyvinvoinnin Laitos/National Institute for Health and Welfare (THL) [Finland]; 2019.
FRA France 1990 1990 13.9
European Health for All Database (HFA-DB) [online database]. World Health Organization (WHO) Regional Office for Europe; 2012 (http://data.euro.who.int/hfadb, accessed 20 August 2012).
FRA France 1991 1991 12.7
European Health for All Database (HFA-DB) [online database]. World Health Organization (WHO) Regional Office for Europe; 2012 (http://data.euro.who.int/hfadb, accessed 20 August 2012).
BMJ Publishing Group Limited (BMJ) disclaims all liability and responsibility arising from any relianceSupplemental material placed on this supplemental material which has been supplied by the author(s) BMJ Global Health
doi: 10.1136/bmjgh-2021-005671:e005671. 6 2021;BMJ Global Health, et al. Betran AP

109
ISO
Cod
e
Country
Coverag
e start
year
Covera
ge end
year
Caesare
an
section
rate (%)
References
FRA France 1992 1992 14.5
European Health for All Database (HFA-DB) [online database]. World Health Organization (WHO) Regional Office for Europe; 2012 (http://data.euro.who.int/hfadb, accessed 20 August 2012).
FRA France 1993 1993 15.5
European Health for All Database (HFA-DB) [online database]. World Health Organization (WHO) Regional Office for Europe; 2012 (http://data.euro.who.int/hfadb, accessed 20 August 2012).
FRA France 1994 1994 15.1
European Health for All Database (HFA-DB) [online database]. World Health Organization (WHO) Regional Office for Europe; 2012 (http://data.euro.who.int/hfadb, accessed 20 August 2012).
FRA France 1995 1995 15.0
European Health for All Database (HFA-DB) [online database]. World Health Organization (WHO) Regional Office for Europe; 2012 (http://data.euro.who.int/hfadb, accessed 20 August 2012).
FRA France 1996 1996 15.4
European Health for All Database (HFA-DB) [online database]. World Health Organization (WHO) Regional Office for Europe; 2012 (http://data.euro.who.int/hfadb, accessed 20 August 2012).
FRA France 1997 1997 16.0
European Health for All Database (HFA-DB) [online database]. World Health Organization (WHO) Regional Office for Europe; 2012 (http://data.euro.who.int/hfadb, accessed 20 August 2012).
FRA France 1998 1998 15.7
European Health for All Database (HFA-DB) [online database]. World Health Organization (WHO) Regional Office for Europe; 2012 (http://data.euro.who.int/hfadb, accessed 20 August 2012).
FRA France 1999 1999 16.1
European Health for All Database (HFA-DB) [online database]. World Health Organization (WHO) Regional Office for Europe; 2012 (http://data.euro.who.int/hfadb, accessed 20 August 2012).
BMJ Publishing Group Limited (BMJ) disclaims all liability and responsibility arising from any relianceSupplemental material placed on this supplemental material which has been supplied by the author(s) BMJ Global Health
doi: 10.1136/bmjgh-2021-005671:e005671. 6 2021;BMJ Global Health, et al. Betran AP

110
ISO
Cod
e
Country
Coverag
e start
year
Covera
ge end
year
Caesare
an
section
rate (%)
References
FRA France 2000 2000 17.2
European Health for All Database (HFA-DB) [online database]. World Health Organization (WHO) Regional Office for Europe; 2012 (http://data.euro.who.int/hfadb, accessed 20 August 2012).
FRA France 2001 2001 17.9
European Health for All Database (HFA-DB) [online database]. World Health Organization (WHO) Regional Office for Europe; 2012 (http://data.euro.who.int/hfadb, accessed 20 August 2012).
FRA France 2002 2002 18.7
European Health for All Database (HFA-DB) [online database]. World Health Organization (WHO) Regional Office for Europe; 2012 (http://data.euro.who.int/hfadb, accessed 20 August 2012).
FRA France 2003 2003 18.8
European Health for All Database (HFA-DB) [online database]. World Health Organization (WHO) Regional Office for Europe; 2012 (http://data.euro.who.int/hfadb, accessed 20 August 2012).
FRA France 2004 2004 19.2
Maternité – les accouchements en 2004 [website]. Paris: Institut National de la Statistique et des Études Économiques (INSEE) [National Institute of Statistics and Economic Studies]; 2005 (http://insee.fr/fr/themes/document.asp?reg_id=2&ref_id=14086&page=dossiers, accessed 21 October 2012, in French).
FRA France 2010 2010 21.0
European Health for All Database (HFA-DB) [online database]. World Health Organization (WHO) Regional Office for Europe; 2016 (http://data.euro.who.int/hfadb, accessed 8 August 2016).
FRA France 2010 2010 21.0
Blondel B, Kermarrec M, editors (Institut National de la santé et de la recherche médicale/INSERM). Enquête nationale périnatale 2010. Les naissances en 2010 et leur évolution depuis 2003. Paris: INSERM, Direction générale de la sante (DGS), Direction de la recherche, des études, de l’évaluation et des statistiques, Ministère de l'Emploi et de la solidarité (DREES); 2011 (in French).
FRA France 2011 2011 21.0
European Health for All Database (HFA-DB) [online database]. World Health Organization (WHO) Regional Office for Europe; 2016 (http://data.euro.who.int/hfadb, accessed 8 August 2016).
BMJ Publishing Group Limited (BMJ) disclaims all liability and responsibility arising from any relianceSupplemental material placed on this supplemental material which has been supplied by the author(s) BMJ Global Health
doi: 10.1136/bmjgh-2021-005671:e005671. 6 2021;BMJ Global Health, et al. Betran AP

111
ISO
Cod
e
Country
Coverag
e start
year
Covera
ge end
year
Caesare
an
section
rate (%)
References
FRA France 2012 2012 20.8
European Health for All Database (HFA-DB) [online database]. World Health Organization (WHO) Regional Office for Europe; 2016 (http://data.euro.who.int/hfadb, accessed 8 August 2016).
FRA France 2013 2013 20.8
European Health for All Database (HFA-DB) [online database]. World Health Organization (WHO) Regional Office for Europe; 2016 (http://data.euro.who.int/hfadb, accessed 8 August 2016).
FRA France 2014 2014 20.8
European Health for All Database (HFA-DB) [online database]. World Health Organization (WHO) Regional Office for Europe; 2016 (http://data.euro.who.int/hfadb, accessed 8 August 2016).
FRA France 2016 2016 19.6
Enquête nationale périnatale Rapport 2016. Les naissances et les établissements. Situation et évaluation depuis 2010. Paris: Institut National de la santé et de la recherche médicale (INSERM), Direction de la recherche, des études, de l’évaluation et des statistiques, Ministère de l'Emploi et de la solidarité (DREES); 2017 (in French).
GAB Gabon 1995 2000 5.6
Direction Générale de la Statistique et des Études Économiques (DGSEE) [Gabon], ORC Macro. Enquête Démographique et de Santé Gabon 2000. Calverton, Maryland: Direction Générale de la Statistique et des Études Économiques, Fonds des Nations Unies pour la population (FNUAP/UNFPA), ORC Macro; 2001 (in French).
GAB Gabon 2007 2012 10.0
Direction Générale de la Statistique (DGS), ICF International. Enquête Démographique et de Santé du Gabon 2012. Calverton, Maryland, Libreville, Gabon: DGS, ICF International; 2013 (in French).
GMB Gambia 2008 2010 2.5
The Gambia Bureau of Statistics (GBOS). The Gambia Multiple Indicator Cluster Survey 2010, Final Report. Banjul, The Gambia: The Gambia Bureau of Statistics (GBOS); 2012.
GMB Gambia 2008 2013 2.0
The Gambia Bureau of Statistics (GBOS), ICF International. The Gambia Demographic and Health Survey 2013. Banjul, The Gambia, and Rockville, Maryland, USA: GBOS, ICF International; 2014.
BMJ Publishing Group Limited (BMJ) disclaims all liability and responsibility arising from any relianceSupplemental material placed on this supplemental material which has been supplied by the author(s) BMJ Global Health
doi: 10.1136/bmjgh-2021-005671:e005671. 6 2021;BMJ Global Health, et al. Betran AP

112
ISO
Cod
e
Country
Coverag
e start
year
Covera
ge end
year
Caesare
an
section
rate (%)
References
GMB Gambia 2016 2018 3.7
The Gambia Multiple Indicator Cluster Survey 2018, Survey Findings Report. Banjul: The Gambia Bureau of Statistics (GBOS); 2019.
GEO Georgia 1990 1990 3.8
European Health for All Database (HFA-DB) [online database]. World Health Organization (WHO) Regional Office for Europe; 2012 (http://data.euro.who.int/hfadb, accessed 20 August 2012).
GEO Georgia 1991 1991 4.6
European Health for All Database (HFA-DB) [online database]. World Health Organization (WHO) Regional Office for Europe; 2012 (http://data.euro.who.int/hfadb, accessed 20 August 2012).
GEO Georgia 1992 1992 5.1
European Health for All Database (HFA-DB) [online database]. World Health Organization (WHO) Regional Office for Europe; 2012 (http://data.euro.who.int/hfadb, accessed 20 August 2012).
GEO Georgia 1993 1993 4.6
European Health for All Database (HFA-DB) [online database]. World Health Organization (WHO) Regional Office for Europe; 2012 (http://data.euro.who.int/hfadb, accessed 20 August 2012).
GEO Georgia 1994 1994 5.5
European Health for All Database (HFA-DB) [online database]. World Health Organization (WHO) Regional Office for Europe; 2012 (http://data.euro.who.int/hfadb, accessed 20 August 2012).
GEO Georgia 1995 1995 5.8
European Health for All Database (HFA-DB) [online database]. World Health Organization (WHO) Regional Office for Europe; 2012 (http://data.euro.who.int/hfadb, accessed 20 August 2012).
GEO Georgia 1996 1996 6.7
European Health for All Database (HFA-DB) [online database]. World Health Organization (WHO) Regional Office for Europe; 2012 (http://data.euro.who.int/hfadb, accessed 20 August 2012).
BMJ Publishing Group Limited (BMJ) disclaims all liability and responsibility arising from any relianceSupplemental material placed on this supplemental material which has been supplied by the author(s) BMJ Global Health
doi: 10.1136/bmjgh-2021-005671:e005671. 6 2021;BMJ Global Health, et al. Betran AP

113
ISO
Cod
e
Country
Coverag
e start
year
Covera
ge end
year
Caesare
an
section
rate (%)
References
GEO Georgia 1998 1998 7.9
European Health for All Database (HFA-DB) [online database]. World Health Organization (WHO) Regional Office for Europe; 2012 (http://data.euro.who.int/hfadb, accessed 20 August 2012).
GEO Georgia 1999 1999 7.2
European Health for All Database (HFA-DB) [online database]. World Health Organization (WHO) Regional Office for Europe; 2012 (http://data.euro.who.int/hfadb, accessed 20 August 2012).
GEO Georgia 1994 2000 6.4
National Center for Disease Control (NCDC) [Georgia], Ministry of Health and Social Affairs (MOH&SA) [Georgia], Center for Medical Statistics and Information (CMSI) [Georgia], State Department of Statistics (SDS) [Georgia], Division of Reproductive Health, Centers for Disease Control and Prevention (DRH/CDC), United Nations Population Fund (UNFPA), United Nations Children's Fund (UNICEF), United States Agency for International Development (USAID), United Nations High Commissioner for Refugees (UNHCR), American International Health Alliance, Inc. (AIHA). Reproductive Health Survey Georgia 1999. Final Report. Atlanta, GA: CDC; 2001.
GEO Georgia 2000 2000 8.7
European Health for All Database (HFA-DB) [online database]. World Health Organization (WHO) Regional Office for Europe; 2012 (http://data.euro.who.int/hfadb, accessed 20 August 2012).
GEO Georgia 2001 2001 10.0
European Health for All Database (HFA-DB) [online database]. World Health Organization (WHO) Regional Office for Europe; 2012 (http://data.euro.who.int/hfadb, accessed 20 August 2012).
GEO Georgia 2004 2004 16.8
Health and Health Care, Georgia, 2005 Statistics. Tbilisi: Ministry of Labour, Health and Social Affairs of Georgia, National Centre for Disease Control and Medical Statistics; 2006.
GEO Georgia 2000 2005 13.0
National Center for Disease Control (NCDC) [Georgia], Ministry of Health and Social Affairs (MOH&SA) [Georgia], Department of Statistics [Georgia], Division of Reproductive Health, Centers for Disease Control and Prevention (DRH/CDC), United Nations Population Fund (UNFPA), United States Agency for International Development (USAID). Reproductive Health Survey Georgia 2005. Final Report. Atlanta, GA: CDC; 2007.
GEO Georgia 2005 2005 19.3
Health and Health Care, Georgia, 2005 Statistics. Tbilisi: Ministry of Labour, Health and Social Affairs of Georgia, National Centre for Disease Control and Medical Statistics; 2006.
BMJ Publishing Group Limited (BMJ) disclaims all liability and responsibility arising from any relianceSupplemental material placed on this supplemental material which has been supplied by the author(s) BMJ Global Health
doi: 10.1136/bmjgh-2021-005671:e005671. 6 2021;BMJ Global Health, et al. Betran AP

114
ISO
Cod
e
Country
Coverag
e start
year
Covera
ge end
year
Caesare
an
section
rate (%)
References
GEO Georgia 2006 2006 20.8
Health and Health Care, Statistical Yearbook 2007 Georgia. Tbilisi: Ministry of Labour, Health and Social Affairs of Georgia, National Centre for Disease Control and Public Health; 2008.
GEO Georgia 2009 2009 28.7
Health Care, Statistical Yearbook 2010 Georgia. Tbilisi: Ministry of Labour, Health and Social Affairs of Georgia, National Centre for Disease Control and Public Health; 2011.
GEO Georgia 2005 2010 23.9
Reproductive Health Survey Georgia 2010 Final Report. Tbilisi: National Center for Disease Control and Public Health (NCDC) [Georgia], Centers for Disease Control and Prevention (DRH/CDC), United Nations Population Fund (UNFPA), United States Agency for International Development (USAID), United Nations Children’s Fund (UNICEF); 2012.
GEO Georgia 2010 2010 31.4
Health Care, Statistical Yearbook 2010 Georgia. Tbilisi: Ministry of Labour, Health and Social Affairs of Georgia, National Centre for Disease Control and Public Health; 2011.
GEO Georgia 2011 2011 35.1
Health Care, Statistical Yearbook 2011 Georgia. Tbilisi: Ministry of Labour, Health and Social Affairs of Georgia, National Centre for Disease Control and Public Health; 2012.
GEO Georgia 2012 2012 36.7
European Health for All Database (HFA-DB) [online database]. World Health Organization (WHO) Regional Office for Europe; 2016 (http://data.euro.who.int/hfadb, accessed 8 August 2016).
GEO Georgia 2013 2013 37.3
Health Care, Statistical Yearbook 2013 Georgia. Tbilisi: Ministry of Labour, Health and Social Affairs of Georgia, National Centre for Disease Control and Public Health; 2014.
GEO Georgia 2014 2014 38.9
Health Care, Statistical Yearbook 2014 Georgia. Tbilisi: Ministry of Labour, Health and Social Affairs of Georgia, National Centre for Disease Control and Public Health; 2015.
BMJ Publishing Group Limited (BMJ) disclaims all liability and responsibility arising from any relianceSupplemental material placed on this supplemental material which has been supplied by the author(s) BMJ Global Health
doi: 10.1136/bmjgh-2021-005671:e005671. 6 2021;BMJ Global Health, et al. Betran AP

115
ISO
Cod
e
Country
Coverag
e start
year
Covera
ge end
year
Caesare
an
section
rate (%)
References
GEO Georgia 2015 2015 41.4
Health Care, Statistical Yearbook 2015 Georgia. Tbilisi: Ministry of Labour, Health and Social Affairs of Georgia, National Centre for Disease Control and Public Health; 2016.
GEO Georgia 2016 2016 43.7
Health Care, Statistical Yearbook 2016 Georgia. Tbilisi: Ministry of Labour, Health and Social Affairs of Georgia, National Centre for Disease Control and Public Health; 2017.
GEO Georgia 2016 2018 46.6
Georgia Multiple Indicator Cluster Survey 2018, Survey Findings Report. Tbilisi: National Statistics Office of Georgia, United Nations Children's Fund (UNICEF); 2019.
DEU Germany 1991 1991 15.3
Krankenhausentbindungen in Deutschland: Jahre 1991 bis 2016 [website]. Wiesbaden: Statistisches Bundesamt (DESTATIS) [Federal Statistical Office, Germany]; 2017 (https://www.destatis.de/DE/ZahlenFakten/GesellschaftStaat, accessed 9 November 2017, in German).
DEU Germany 1992 1992 16.2
Krankenhausentbindungen in Deutschland: Jahre 1991 bis 2016 [website]. Wiesbaden: Statistisches Bundesamt (DESTATIS) [Federal Statistical Office, Germany]; 2017 (https://www.destatis.de/DE/ZahlenFakten/GesellschaftStaat, accessed 9 November 2017, in German).
DEU Germany 1993 1993 16.9
Krankenhausentbindungen in Deutschland: Jahre 1991 bis 2016 [website]. Wiesbaden: Statistisches Bundesamt (DESTATIS) [Federal Statistical Office, Germany]; 2017 (https://www.destatis.de/DE/ZahlenFakten/GesellschaftStaat, accessed 9 November 2017, in German).
DEU Germany 1994 1994 17.3
Krankenhausentbindungen in Deutschland: Jahre 1991 bis 2016 [website]. Wiesbaden: Statistisches Bundesamt (DESTATIS) [Federal Statistical Office, Germany]; 2017 (https://www.destatis.de/DE/ZahlenFakten/GesellschaftStaat, accessed 9 November 2017, in German).
DEU Germany 1995 1995 17.6
Krankenhausentbindungen in Deutschland: Jahre 1991 bis 2016 [website]. Wiesbaden: Statistisches Bundesamt (DESTATIS) [Federal Statistical Office, Germany]; 2017 (https://www.destatis.de/DE/ZahlenFakten/GesellschaftStaat, accessed 9 November 2017, in German).
BMJ Publishing Group Limited (BMJ) disclaims all liability and responsibility arising from any relianceSupplemental material placed on this supplemental material which has been supplied by the author(s) BMJ Global Health
doi: 10.1136/bmjgh-2021-005671:e005671. 6 2021;BMJ Global Health, et al. Betran AP

116
ISO
Cod
e
Country
Coverag
e start
year
Covera
ge end
year
Caesare
an
section
rate (%)
References
DEU Germany 1996 1996 18.0
Krankenhausentbindungen in Deutschland: Jahre 1991 bis 2016 [website]. Wiesbaden: Statistisches Bundesamt (DESTATIS) [Federal Statistical Office, Germany]; 2017 (https://www.destatis.de/DE/ZahlenFakten/GesellschaftStaat, accessed 9 November 2017, in German).
DEU Germany 1997 1997 18.5
Krankenhausentbindungen in Deutschland: Jahre 1991 bis 2016 [website]. Wiesbaden: Statistisches Bundesamt (DESTATIS) [Federal Statistical Office, Germany]; 2017 (https://www.destatis.de/DE/ZahlenFakten/GesellschaftStaat, accessed 9 November 2017, in German).
DEU Germany 1998 1998 19.5
Krankenhausentbindungen in Deutschland: Jahre 1991 bis 2016 [website]. Wiesbaden: Statistisches Bundesamt (DESTATIS) [Federal Statistical Office, Germany]; 2017 (https://www.destatis.de/DE/ZahlenFakten/GesellschaftStaat, accessed 9 November 2017, in German).
DEU Germany 1999 1999 20.3
Krankenhausentbindungen in Deutschland: Jahre 1991 bis 2016 [website]. Wiesbaden: Statistisches Bundesamt (DESTATIS) [Federal Statistical Office, Germany]; 2017 (https://www.destatis.de/DE/ZahlenFakten/GesellschaftStaat, accessed 9 November 2017, in German).
DEU Germany 2000 2000 21.5
Krankenhausentbindungen in Deutschland: Jahre 1991 bis 2016 [website]. Wiesbaden: Statistisches Bundesamt (DESTATIS) [Federal Statistical Office, Germany]; 2017 (https://www.destatis.de/DE/ZahlenFakten/GesellschaftStaat, accessed 9 November 2017, in German).
DEU Germany 2001 2001 22.6
Krankenhausentbindungen in Deutschland: Jahre 1991 bis 2016 [website]. Wiesbaden: Statistisches Bundesamt (DESTATIS) [Federal Statistical Office, Germany]; 2017 (https://www.destatis.de/DE/ZahlenFakten/GesellschaftStaat, accessed 9 November 2017, in German).
DEU Germany 2002 2002 24.4
Krankenhausentbindungen in Deutschland: Jahre 1991 bis 2016 [website]. Wiesbaden: Statistisches Bundesamt (DESTATIS) [Federal Statistical Office, Germany]; 2017 (https://www.destatis.de/DE/ZahlenFakten/GesellschaftStaat, accessed 9 November 2017, in German).
DEU Germany 2003 2003 25.5
Krankenhausentbindungen in Deutschland: Jahre 1991 bis 2016 [website]. Wiesbaden: Statistisches Bundesamt (DESTATIS) [Federal Statistical Office, Germany]; 2017 (https://www.destatis.de/DE/ZahlenFakten/GesellschaftStaat, accessed 9 November 2017, in German).
BMJ Publishing Group Limited (BMJ) disclaims all liability and responsibility arising from any relianceSupplemental material placed on this supplemental material which has been supplied by the author(s) BMJ Global Health
doi: 10.1136/bmjgh-2021-005671:e005671. 6 2021;BMJ Global Health, et al. Betran AP

117
ISO
Cod
e
Country
Coverag
e start
year
Covera
ge end
year
Caesare
an
section
rate (%)
References
DEU Germany 2004 2004 26.8
Krankenhausentbindungen in Deutschland: Jahre 1991 bis 2016 [website]. Wiesbaden: Statistisches Bundesamt (DESTATIS) [Federal Statistical Office, Germany]; 2017 (https://www.destatis.de/DE/ZahlenFakten/GesellschaftStaat, accessed 9 November 2017, in German).
DEU Germany 2005 2005 27.6
Krankenhausentbindungen in Deutschland: Jahre 1991 bis 2016 [website]. Wiesbaden: Statistisches Bundesamt (DESTATIS) [Federal Statistical Office, Germany]; 2017 (https://www.destatis.de/DE/ZahlenFakten/GesellschaftStaat, accessed 9 November 2017, in German).
DEU Germany 2006 2006 28.6
Krankenhausentbindungen in Deutschland: Jahre 1991 bis 2016 [website]. Wiesbaden: Statistisches Bundesamt (DESTATIS) [Federal Statistical Office, Germany]; 2017 (https://www.destatis.de/DE/ZahlenFakten/GesellschaftStaat, accessed 9 November 2017, in German).
DEU Germany 2007 2007 29.3
Krankenhausentbindungen in Deutschland: Jahre 1991 bis 2016 [website]. Wiesbaden: Statistisches Bundesamt (DESTATIS) [Federal Statistical Office, Germany]; 2017 (https://www.destatis.de/DE/ZahlenFakten/GesellschaftStaat, accessed 9 November 2017, in German).
DEU Germany 2008 2008 30.2
Krankenhausentbindungen in Deutschland: Jahre 1991 bis 2016 [website]. Wiesbaden: Statistisches Bundesamt (DESTATIS) [Federal Statistical Office, Germany]; 2017 (https://www.destatis.de/DE/ZahlenFakten/GesellschaftStaat, accessed 9 November 2017, in German).
DEU Germany 2009 2009 31.3
Krankenhausentbindungen in Deutschland: Jahre 1991 bis 2016 [website]. Wiesbaden: Statistisches Bundesamt (DESTATIS) [Federal Statistical Office, Germany]; 2017 (https://www.destatis.de/DE/ZahlenFakten/GesellschaftStaat, accessed 9 November 2017, in German).
DEU Germany 2010 2010 31.9
Krankenhausentbindungen in Deutschland: Jahre 1991 bis 2016 [website]. Wiesbaden: Statistisches Bundesamt (DESTATIS) [Federal Statistical Office, Germany]; 2017 (https://www.destatis.de/DE/ZahlenFakten/GesellschaftStaat, accessed 9 November 2017, in German).
DEU Germany 2011 2011 32.2
Krankenhausentbindungen in Deutschland: Jahre 1991 bis 2016 [website]. Wiesbaden: Statistisches Bundesamt (DESTATIS) [Federal Statistical Office, Germany]; 2017 (https://www.destatis.de/DE/ZahlenFakten/GesellschaftStaat, accessed 9 November 2017, in German).
BMJ Publishing Group Limited (BMJ) disclaims all liability and responsibility arising from any relianceSupplemental material placed on this supplemental material which has been supplied by the author(s) BMJ Global Health
doi: 10.1136/bmjgh-2021-005671:e005671. 6 2021;BMJ Global Health, et al. Betran AP

118
ISO
Cod
e
Country
Coverag
e start
year
Covera
ge end
year
Caesare
an
section
rate (%)
References
DEU Germany 2012 2012 31.9
Krankenhausentbindungen in Deutschland: Jahre 1991 bis 2016 [website]. Wiesbaden: Statistisches Bundesamt (DESTATIS) [Federal Statistical Office, Germany]; 2017 (https://www.destatis.de/DE/ZahlenFakten/GesellschaftStaat, accessed 9 November 2017, in German).
DEU Germany 2013 2013 31.8
Krankenhausentbindungen in Deutschland: Jahre 1991 bis 2016 [website]. Wiesbaden: Statistisches Bundesamt (DESTATIS) [Federal Statistical Office, Germany]; 2017 (https://www.destatis.de/DE/ZahlenFakten/GesellschaftStaat, accessed 9 November 2017, in German).
DEU Germany 2014 2014 31.8
Krankenhausentbindungen in Deutschland: Jahre 1991 bis 2016 [website]. Wiesbaden: Statistisches Bundesamt (DESTATIS) [Federal Statistical Office, Germany]; 2017 (https://www.destatis.de/DE/ZahlenFakten/GesellschaftStaat, accessed 9 November 2017, in German).
DEU Germany 2015 2015 31.1
Krankenhausentbindungen in Deutschland: Jahre 1991 bis 2016 [website]. Wiesbaden: Statistisches Bundesamt (DESTATIS) [Federal Statistical Office, Germany]; 2017 (https://www.destatis.de/DE/ZahlenFakten/GesellschaftStaat, accessed 9 November 2017, in German).
DEU Germany 2016 2016 30.5
Krankenhausentbindungen in Deutschland: Jahre 1991 bis 2016 [website]. Wiesbaden: Statistisches Bundesamt (DESTATIS) [Federal Statistical Office, Germany]; 2017 (https://www.destatis.de/DE/ZahlenFakten/GesellschaftStaat, accessed 9 November 2017, in German).
DEU Germany 2017 2017 30.5
Hospital deliveries in Germany from 1991 to 2017 [website]. Wiesbaden: Statistisches Bundesamt (DESTATIS) [Federal Statistical Office, Germany]; 2019 (https://www.destatis.de/EN/FactsFigures/SocietyState/Health/Hospitals/Tables/HospitalsDeliveriesYears.html, accessed 13 February 2019).
GHA Ghana 1990 1993 4.4
Ghana Statistical Service (GSS), Macro International Inc. (MI). Ghana Demographic and Health Survey 1993. Calverton, Maryland: GSS, MI; 1994.
GHA Ghana 1993 1998 4.0
Ghana Statistical Service (GSS), Macro International Inc. (MI). Ghana Demographic and Health Survey 1998. Calverton, Maryland: GSS, MI; 1999.
BMJ Publishing Group Limited (BMJ) disclaims all liability and responsibility arising from any relianceSupplemental material placed on this supplemental material which has been supplied by the author(s) BMJ Global Health
doi: 10.1136/bmjgh-2021-005671:e005671. 6 2021;BMJ Global Health, et al. Betran AP

119
ISO
Cod
e
Country
Coverag
e start
year
Covera
ge end
year
Caesare
an
section
rate (%)
References
GHA Ghana 1998 2003 3.7
Ghana Statistical Service (GSS), Noguchi Memorial Institute for Medical Research (NMIMR), ORC Macro. Ghana Demographic and Health Survey 2003. Calverton, Maryland: GSS, NMIMR, ORC Macro; 2004.
GHA Ghana 2002 2007 6.5
Ghana Statistical Service (GSS), Ghana Health Service (GHS), Macro International. Ghana Maternal Health Survey 2007. Calverton, Maryland, USA: GSS, GHS, Macro International; 2009.
GHA Ghana 2003 2008 6.9
Ghana Statistical Service (GSS), Ghana Health Service (GHS), ICF Macro. Ghana Demographic and Health Survey 2008. Accra, Ghana: GSS, GHS, ICF Macro; 2009.
GHA Ghana 2009 2011 11.4
Ghana Statistical Service, United Nations Children's Fund (UNICEF). Ghana Multiple Indicator Cluster Survey with an Enhanced Malaria Module and Biomarker, 2011, Final Report. Accra, Ghana: Ghana Statistical Service, United Nations Children's Fund (UNICEF); 2011.
GHA Ghana 2009 2014 12.8
Ghana Statistical Service (GSS), Ghana Health Service (GHS), ICF International. Ghana Demographic and Health Survey 2014. Rockville, Maryland, USA: GSS, GHS, ICF International; 2015.
GHA Ghana 2012 2017 16.0
Ghana Maternal Health Survey 2017. Accra, Ghana: Ghana Statistical Service (GSS), Ghana Health Service (GHS), ICF; 2018.
GTM Guatemala 1990 1995 8.2
Instituto Nacional de Estadística (INE), Macro International Inc. Guatemala Encuesta Nacional de Salud Materno Infantil 1995. Calverton, Maryland, USA: Macro International Inc.; 1996 (in Spanish).
GTM Guatemala 1993 1999 10.8
Instituto Nacional de Estadística (INE), Macro International Inc. Guatemala Encuesta Nacional de Salud Materno Infantil 1998-1999. Calverton, Maryland, USA: Macro International Inc.; 1999 (in Spanish).
BMJ Publishing Group Limited (BMJ) disclaims all liability and responsibility arising from any relianceSupplemental material placed on this supplemental material which has been supplied by the author(s) BMJ Global Health
doi: 10.1136/bmjgh-2021-005671:e005671. 6 2021;BMJ Global Health, et al. Betran AP

120
ISO
Cod
e
Country
Coverag
e start
year
Covera
ge end
year
Caesare
an
section
rate (%)
References
GTM Guatemala 1997 2002 11.4
Encuesta Nacional de Salud Materno Infantil (ENSMI) 2002. Ciudad de Guatemala: Ministerio de Salud Pública y Asistencia Social (MSPAS) [Guatemala], Instituto Nacional de Estadística (INE) [Guatemala], Centros de Control y Prevención de Enfermedades (CDC); 2003 (in Spanish).
GTM Guatemala 2003 2009 16.3
Encuesta Nacional de Salud Materno Infantil (ENSMI) 2008-2009. Ciudad de Guatemala: Ministerio de Salud Pública y Asistencia Social (MSPAS) [Guatemala], Instituto Nacional de Estadística (INE) [Guatemala], Centros de Control y Prevención de Enfermedades (CDC); 2010 (in Spanish).
GTM Guatemala 2009 2015 26.3
Encuesta Nacional de Salud Materno Infantil (ENSMI) 2014-2015. Informe Final. Ciudad de Guatemala: Ministerio de Salud Pública y Asistencia Social (MSPAS) [Guatemala], Instituto Nacional de Estadística (INE) [Guatemala], ICF International; 2015 (in Spanish).
GIN Guinea 1994 1999 2.0
Direction Nationale de la Statistique [Guinée], Macro International Inc. Enquête Démographique et de Santé, Guinée 1999. Calverton, Maryland USA: Direction Nationale de la Statistique, Macro International Inc.; 2000 (in French).
GIN Guinea 2000 2005 1.7
Direction Nationale de la Statistique (DNS) [Guinée], ORC Macro. Enquête Démographique et de Santé, Guinée 2005. Calverton, Maryland, USA: DNS, ORC Macro; 2006 (in French).
GIN Guinea 2002 2007 2.4
Enquête nationale sur l'état nutritionnel et le suivi des principaux indicateurs de survie de l'enfant. Rapport provisoire. Guinée : Ministère de l'Economie des Finances et du Plan, Direction Nationale de la Statistique [Guinée], Fonds des Nations Unies pour l’enfance (UNICEF), PAM; 2008 (in French).
GIN Guinea 2007 2012 2.4
Guinée. Enquête Démographique et de Santé et à Indicateurs Multiples (EDS-MICS 2012). Calverton, Maryland: Institut National de la Statistique [Guinée], MEASURE DHS, ICF international; 2013 (in French).
GIN Guinea 2014 2016 3.1
Institut National de la Statistique [Guinée], Fonds des Nations Unies pour l'Enfance (UNICEF), USAID, le Fonds mondial [the Global Fund], Fonds des Nations Unies pour la Population (FNUAP/UNFPA), Programme des Nations Unies pour le développement (PNUD/UNDP). Enquête par grappes à indicateurs multiples (MICS 2016), Rapport final. Conakry: Institut National de la Statistique [Guinée]; 2017 (in French).
BMJ Publishing Group Limited (BMJ) disclaims all liability and responsibility arising from any relianceSupplemental material placed on this supplemental material which has been supplied by the author(s) BMJ Global Health
doi: 10.1136/bmjgh-2021-005671:e005671. 6 2021;BMJ Global Health, et al. Betran AP

121
ISO
Cod
e
Country
Coverag
e start
year
Covera
ge end
year
Caesare
an
section
rate (%)
References
GIN Guinea 2013 2018 2.7
Enquête Démographique et de Santé en Guinée 2018. Conakry, Rockville, Maryland: Institut National de la Statistique (INS), ICF; 2018 (in French).
GNB Guinea-Bissau 2008 2010 2.3
Ministério da Economia, do Plano e Integração Regional – Direcção Geral do Plano, Fundo das Nações Unidas para a Infância (UNICEF). Inquérito aos Indicadores Múltiplos, Inquérito Demográfico de Saúde Reprodutiva 2010. Relatório Final. Guiné-Bissau: Ministério da Economia, do Plano e Integração Regional – Direcção Geral do Plano; 2011 (in Portuguese).
GNB Guinea-Bissau 2012 2014 3.9
Ministério da Economia e Finanças, Direcção Geral do Plano Instituto Nacional de Estatística (INE), Fundo das Nações Unidas para a Infância (UNICEF). Inquérito aos Indicadores Múltiplos (MICS) 2014, Principais Resultados. Guiné-Bissau: Ministério da Economia e Finanças, Direcção Geral do Plano Instituto Nacional de Estatística (INE); 2015 (in Portuguese).
GUY Guyana 2004 2009 13.3
Ministry of Health (MOH), Bureau of Statistics (BOS), ICF Macro. Guyana Demographic and Health Survey 2009. Georgetown, Guyana: MOH, BOS, ICF Macro; 2010.
GUY Guyana 2012 2014 16.9
Bureau of Statistics, Ministry of Health, United Nations Children's Fund (UNICEF). Guyana Multiple Indicator Cluster Survey 2014. Georgetown, Guyana: Bureau of Statistics, Ministry of Health, UNICEF; 2015.
HTI Haiti 1989 1995 1.6
Cayemittes M, Rival A, Barrère B, Lerebours G, Amédée Gédéon M (Institut Hattien de l'Enfance, Macro International Inc.). Enquête Mortalité, Morbidité et Utilisation des Services (EMMUS-II), Haïti 1994/95. Calverton, Maryland USA: Institut Hattien de l'Enfance, Macro International Inc.; 1995 (in French).
HTI Haiti 1995 2000 1.6
Cayemittes M, Placide MF, Barrère B, Mariko S, Sévère B (Ministère de la Santé Publique et de la Population, Institut Haïtien de l’Enfance, ORC Macro). Enquête Mortalité, Morbidité et Utilisation des Services, Haïti 2000. Calverton, Maryland, USA: Ministère de la Santé Publique et de la Population, Institut Haïtien de l’Enfance, ORC Macro; 2001 (in French).
HTI Haiti 2000 2006 3.0
Cayemittes M, Placide MF, Mariko S, Barrère B, Sévère B, Alexandre C (Ministère de la Santé Publique et de la Population, Institut Haïtien de l’Enfance, Macro International Inc.). Enquête Mortalité, Morbidité et Utilisation des Services, Haïti, 2005-2006. Calverton, Maryland, USA: Ministère de la Santé Publique et de la Population, Institut Haïtien de l’Enfance, Macro International Inc.; 2007 (in French).
BMJ Publishing Group Limited (BMJ) disclaims all liability and responsibility arising from any relianceSupplemental material placed on this supplemental material which has been supplied by the author(s) BMJ Global Health
doi: 10.1136/bmjgh-2021-005671:e005671. 6 2021;BMJ Global Health, et al. Betran AP

122
ISO
Cod
e
Country
Coverag
e start
year
Covera
ge end
year
Caesare
an
section
rate (%)
References
HTI Haiti 2007 2012 5.5
Cayemittes M, Busangu MF, de Dieu Bizimana J, Barrère B, Sévère B, Cayemittes V, Charles E (MSPP, IHE, ICF International). Enquête Mortalité, Morbidité et Utilisation des Services, Haïti, 2012. Calverton, Maryland, USA : MSPP, IHE, ICF International; 2013 (in French).
HTI Haiti 2013 2013 5.4
Rapport Statistique 2013. République d'Haïti, Ministère de la Santé Publique et de la Population, Unité d'Études et de Programmation; 2014 (in French).
HTI Haiti 2011 2012 5.4
Enquête Mortalité, Morbidité et Utilisation des Services (EMMUS-VI 2016-2017). Pétion-Ville, Haïti, Rockville, Maryland, USA: Institut Haïtien de l’Enfance (IHE), ICF; 2018 (in French).
HND Honduras 1987 1992 6.4
Encuesta Nacional de Epidemiología y Salud Familiar 1991/92 (ENESF-91/92). Honduras: Ministerio de Salud Pública, Agencia de los Estados Unidos para el Desarrollo Internacional (USAID); 1993 (in Spanish).
HND Honduras 1991 1996 6.3
Encuesta Nacional de Epidemiología y Salud Familiar 1996 (ENESF-96). Informe Final. Honduras: Secretaría de Salud de Honduras (SS), la Asociación Hondureña de Planificación de Familia (ASHONPLAFA), División de Salud Reproductiva de los Centros para el Control y Prevención de Enfermedades (CDC), Agencia de los Estados Unidos para el Desarrollo Internacional (USAID); 1997 (in Spanish).
HND Honduras 1996 2001 7.9
Encuesta Nacional de Epidemiología y Salud Familiar (ENESF-2001) y de la Encuesta Nacional de Salud Masculina (ENSM-2001). Informe Final. Honduras: Secretaría de Salud de Honduras (SS), la Asociación Hondureña de Planificación de Familia (ASHONPLAFA), Agencia de los Estados Unidos para el Desarrollo Internacional (USAID); 2002 (in Spanish).
HND Honduras 2000 2006 13.0
Secretaría de Salud [Honduras], Instituto Nacional de Estadística (INE), Macro International. Encuesta Nacional de Demografía y Salud 2005-2006 (ENDESA). Tegucigalpa, Honduras: SS, INE, Macro International; 2006 (in Spanish).
HND Honduras 2006 2012 18.6
Secretaría de Salud [Honduras], Instituto Nacional de Estadística (INE), ICF International. ENDESA. Encuesta Nacional de Demografía y Salud 2011-2012. Tegucigalpa, Honduras: SS, INE, ICF International; 2013 (in Spanish).
BMJ Publishing Group Limited (BMJ) disclaims all liability and responsibility arising from any relianceSupplemental material placed on this supplemental material which has been supplied by the author(s) BMJ Global Health
doi: 10.1136/bmjgh-2021-005671:e005671. 6 2021;BMJ Global Health, et al. Betran AP

123
ISO
Cod
e
Country
Coverag
e start
year
Covera
ge end
year
Caesare
an
section
rate (%)
References
HUN Hungary 1994 1994 12.6
European Health for All Database (HFA-DB) [online database]. World Health Organization (WHO) Regional Office for Europe; 2012 (http://data.euro.who.int/hfadb, accessed 20 August 2012).
HUN Hungary 1995 1995 13.6
European Health for All Database (HFA-DB) [online database]. World Health Organization (WHO) Regional Office for Europe; 2012 (http://data.euro.who.int/hfadb, accessed 20 August 2012).
HUN Hungary 1996 1996 14.6
European Health for All Database (HFA-DB) [online database]. World Health Organization (WHO) Regional Office for Europe; 2012 (http://data.euro.who.int/hfadb, accessed 20 August 2012).
HUN Hungary 1997 1997 15.7
European Health for All Database (HFA-DB) [online database]. World Health Organization (WHO) Regional Office for Europe; 2012 (http://data.euro.who.int/hfadb, accessed 20 August 2012).
HUN Hungary 1998 1998 17.0
European Health for All Database (HFA-DB) [online database]. World Health Organization (WHO) Regional Office for Europe; 2012 (http://data.euro.who.int/hfadb, accessed 20 August 2012).
HUN Hungary 1999 1999 18.7
European Health for All Database (HFA-DB) [online database]. World Health Organization (WHO) Regional Office for Europe; 2012 (http://data.euro.who.int/hfadb, accessed 20 August 2012).
HUN Hungary 2000 2000 20.1
European Health for All Database (HFA-DB) [online database]. World Health Organization (WHO) Regional Office for Europe; 2012 (http://data.euro.who.int/hfadb, accessed 20 August 2012).
HUN Hungary 2001 2001 21.2
European Health for All Database (HFA-DB) [online database]. World Health Organization (WHO) Regional Office for Europe; 2012 (http://data.euro.who.int/hfadb, accessed 20 August 2012).
BMJ Publishing Group Limited (BMJ) disclaims all liability and responsibility arising from any relianceSupplemental material placed on this supplemental material which has been supplied by the author(s) BMJ Global Health
doi: 10.1136/bmjgh-2021-005671:e005671. 6 2021;BMJ Global Health, et al. Betran AP

124
ISO
Cod
e
Country
Coverag
e start
year
Covera
ge end
year
Caesare
an
section
rate (%)
References
HUN Hungary 2002 2002 23.2
European Health for All Database (HFA-DB) [online database]. World Health Organization (WHO) Regional Office for Europe; 2012 (http://data.euro.who.int/hfadb, accessed 20 August 2012).
HUN Hungary 2003 2003 24.7
European Health for All Database (HFA-DB) [online database]. World Health Organization (WHO) Regional Office for Europe; 2012 (http://data.euro.who.int/hfadb, accessed 20 August 2012).
HUN Hungary 2004 2004 25.7
European Health for All Database (HFA-DB) [online database]. World Health Organization (WHO) Regional Office for Europe; 2012 (http://data.euro.who.int/hfadb, accessed 20 August 2012).
HUN Hungary 2005 2005 27.9
European Health for All Database (HFA-DB) [online database]. World Health Organization (WHO) Regional Office for Europe; 2012 (http://data.euro.who.int/hfadb, accessed 20 August 2012).
HUN Hungary 2006 2006 28.1
European Health for All Database (HFA-DB) [online database]. World Health Organization (WHO) Regional Office for Europe; 2012 (http://data.euro.who.int/hfadb, accessed 20 August 2012).
HUN Hungary 2007 2007 28.6
European Health for All Database (HFA-DB) [online database]. World Health Organization (WHO) Regional Office for Europe; 2012 (http://data.euro.who.int/hfadb, accessed 20 August 2012).
HUN Hungary 2008 2008 29.9
European Health for All Database (HFA-DB) [online database]. World Health Organization (WHO) Regional Office for Europe; 2012 (http://data.euro.who.int/hfadb, accessed 20 August 2012).
HUN Hungary 2009 2009 31.3
European Health for All Database (HFA-DB) [online database]. World Health Organization (WHO) Regional Office for Europe; 2012 (http://data.euro.who.int/hfadb, accessed 20 August 2012).
BMJ Publishing Group Limited (BMJ) disclaims all liability and responsibility arising from any relianceSupplemental material placed on this supplemental material which has been supplied by the author(s) BMJ Global Health
doi: 10.1136/bmjgh-2021-005671:e005671. 6 2021;BMJ Global Health, et al. Betran AP

125
ISO
Cod
e
Country
Coverag
e start
year
Covera
ge end
year
Caesare
an
section
rate (%)
References
HUN Hungary 2010 2010 32.5
European Health for All Database (HFA-DB) [online database]. World Health Organization (WHO) Regional Office for Europe; 2016 (http://data.euro.who.int/hfadb, accessed 8 August 2016).
HUN Hungary 2011 2011 33.2
European Health for All Database (HFA-DB) [online database]. World Health Organization (WHO) Regional Office for Europe; 2016 (http://data.euro.who.int/hfadb, accessed 8 August 2016).
HUN Hungary 2012 2012 34.0
European Health for All Database (HFA-DB) [online database]. World Health Organization (WHO) Regional Office for Europe; 2016 (http://data.euro.who.int/hfadb, accessed 8 August 2016).
HUN Hungary 2013 2013 35.3
European Health for All Database (HFA-DB) [online database]. World Health Organization (WHO) Regional Office for Europe; 2016 (http://data.euro.who.int/hfadb, accessed 8 August 2016).
HUN Hungary 2014 2014 36.4
European Health for All Database (HFA-DB) [online database]. World Health Organization (WHO) Regional Office for Europe; 2016 (http://data.euro.who.int/hfadb, accessed 8 August 2016).
HUN Hungary 2015 2015 39.0
European Perinatal Health Report. Core indicators of the health and care of pregnant women and babies in Europe in 2015. Euro-Peristat Project; 2018.
ISL Iceland 1990 1990 11.9
Pohjoismaiset perinataalitilastot 2008 - Perinatal statistics in the Nordic countries 2008. Statistical Report 14/2010. Helsinki: Terveyden ja Hyvinvoinnin Laitos/National Institute for Health and Welfare (THL) [Finland]; 2010.
ISL Iceland 1991 1991 11.6
Pohjoismaiset perinataalitilastot 2008 - Perinatal statistics in the Nordic countries 2008. Statistical Report 14/2010. Helsinki: Terveyden ja Hyvinvoinnin Laitos/National Institute for Health and Welfare (THL) [Finland]; 2010.
BMJ Publishing Group Limited (BMJ) disclaims all liability and responsibility arising from any relianceSupplemental material placed on this supplemental material which has been supplied by the author(s) BMJ Global Health
doi: 10.1136/bmjgh-2021-005671:e005671. 6 2021;BMJ Global Health, et al. Betran AP

126
ISO
Cod
e
Country
Coverag
e start
year
Covera
ge end
year
Caesare
an
section
rate (%)
References
ISL Iceland 1992 1992 13.6
Pohjoismaiset perinataalitilastot 2008 - Perinatal statistics in the Nordic countries 2008. Statistical Report 14/2010. Helsinki: Terveyden ja Hyvinvoinnin Laitos/National Institute for Health and Welfare (THL) [Finland]; 2010.
ISL Iceland 1993 1993 13.2
Pohjoismaiset perinataalitilastot 2008 - Perinatal statistics in the Nordic countries 2008. Statistical Report 14/2010. Helsinki: Terveyden ja Hyvinvoinnin Laitos/National Institute for Health and Welfare (THL) [Finland]; 2010.
ISL Iceland 1994 1994 14.0
Pohjoismaiset perinataalitilastot 2008 - Perinatal statistics in the Nordic countries 2008. Statistical Report 14/2010. Helsinki: Terveyden ja Hyvinvoinnin Laitos/National Institute for Health and Welfare (THL) [Finland]; 2010.
ISL Iceland 1995 1995 14.4
Pohjoismaiset perinataalitilastot 2008 - Perinatal statistics in the Nordic countries 2008. Statistical Report 14/2010. Helsinki: Terveyden ja Hyvinvoinnin Laitos/National Institute for Health and Welfare (THL) [Finland]; 2010.
ISL Iceland 1996 1996 15.3
Pohjoismaiset perinataalitilastot 2008 - Perinatal statistics in the Nordic countries 2008. Statistical Report 14/2010. Helsinki: Terveyden ja Hyvinvoinnin Laitos/National Institute for Health and Welfare (THL) [Finland]; 2010.
ISL Iceland 1997 1997 16.6
Pohjoismaiset perinataalitilastot 2008 - Perinatal statistics in the Nordic countries 2008. Statistical Report 14/2010. Helsinki: Terveyden ja Hyvinvoinnin Laitos/National Institute for Health and Welfare (THL) [Finland]; 2010.
ISL Iceland 1998 1998 16.2
Pohjoismaiset perinataalitilastot 2008 - Perinatal statistics in the Nordic countries 2008. Statistical Report 14/2010. Helsinki: Terveyden ja Hyvinvoinnin Laitos/National Institute for Health and Welfare (THL) [Finland]; 2010.
ISL Iceland 1999 1999 17.6
Pohjoismaiset perinataalitilastot 2008 - Perinatal statistics in the Nordic countries 2008. Statistical Report 14/2010. Helsinki: Terveyden ja Hyvinvoinnin Laitos/National Institute for Health and Welfare (THL) [Finland]; 2010.
BMJ Publishing Group Limited (BMJ) disclaims all liability and responsibility arising from any relianceSupplemental material placed on this supplemental material which has been supplied by the author(s) BMJ Global Health
doi: 10.1136/bmjgh-2021-005671:e005671. 6 2021;BMJ Global Health, et al. Betran AP

127
ISO
Cod
e
Country
Coverag
e start
year
Covera
ge end
year
Caesare
an
section
rate (%)
References
ISL Iceland 2000 2000 17.9
Pohjoismaiset perinataalitilastot 2008 - Perinatal statistics in the Nordic countries 2008. Statistical Report 14/2010. Helsinki: Terveyden ja Hyvinvoinnin Laitos/National Institute for Health and Welfare (THL) [Finland]; 2010.
ISL Iceland 2001 2001 17.0
Pohjoismaiset perinataalitilastot 2008 - Perinatal statistics in the Nordic countries 2008. Statistical Report 14/2010. Helsinki: Terveyden ja Hyvinvoinnin Laitos/National Institute for Health and Welfare (THL) [Finland]; 2010.
ISL Iceland 2002 2002 17.7
Pohjoismaiset perinataalitilastot 2008 - Perinatal statistics in the Nordic countries 2008. Statistical Report 14/2010. Helsinki: Terveyden ja Hyvinvoinnin Laitos/National Institute for Health and Welfare (THL) [Finland]; 2010.
ISL Iceland 2003 2003 18.2
Pohjoismaiset perinataalitilastot 2008 - Perinatal statistics in the Nordic countries 2008. Statistical Report 14/2010. Helsinki: Terveyden ja Hyvinvoinnin Laitos/National Institute for Health and Welfare (THL) [Finland]; 2010.
ISL Iceland 2004 2004 16.6
Pohjoismaiset perinataalitilastot 2008 - Perinatal statistics in the Nordic countries 2008. Statistical Report 14/2010. Helsinki: Terveyden ja Hyvinvoinnin Laitos/National Institute for Health and Welfare (THL) [Finland]; 2010.
ISL Iceland 2005 2005 15.8
Pohjoismaiset perinataalitilastot 2008 - Perinatal statistics in the Nordic countries 2008. Statistical Report 14/2010. Helsinki: Terveyden ja Hyvinvoinnin Laitos/National Institute for Health and Welfare (THL) [Finland]; 2010.
ISL Iceland 2006 2006 17.5
Pohjoismaiset perinataalitilastot 2008 - Perinatal statistics in the Nordic countries 2008. Statistical Report 14/2010. Helsinki: Terveyden ja Hyvinvoinnin Laitos/National Institute for Health and Welfare (THL) [Finland]; 2010.
ISL Iceland 2007 2007 17.2
Pohjoismaiset perinataalitilastot 2008 - Perinatal statistics in the Nordic countries 2008. Statistical Report 14/2010. Helsinki: Terveyden ja Hyvinvoinnin Laitos/National Institute for Health and Welfare (THL) [Finland]; 2010.
BMJ Publishing Group Limited (BMJ) disclaims all liability and responsibility arising from any relianceSupplemental material placed on this supplemental material which has been supplied by the author(s) BMJ Global Health
doi: 10.1136/bmjgh-2021-005671:e005671. 6 2021;BMJ Global Health, et al. Betran AP

128
ISO
Cod
e
Country
Coverag
e start
year
Covera
ge end
year
Caesare
an
section
rate (%)
References
ISL Iceland 2008 2008 17.2
Hospital Statistics and Financial Accounts 2009. Reykjavík: Landspítali [Landspítali University Hospital], Office of Finance and Information Services; 2010.
ISL Iceland 2009 2009 17.6
Hospital Statistics and Financial Accounts 2009. Reykjavík: Landspítali [Landspítali University Hospital], Office of Finance and Information Services; 2010.
ISL Iceland 2010 2010 16.0
Hospital Statistics and Financial Accounts 2011. Reykjavík: Landspítali [Landspítali University Hospital], Office of Finance and Information Services; 2012.
ISL Iceland 2011 2011 16.6
Hospital Statistics and Financial Accounts 2011. Reykjavík: Landspítali [Landspítali University Hospital], Office of Finance and Information Services; 2012.
ISL Iceland 2012 2012 17.0
Hospital Statistics and Accounts 2012. Reykjavík: Landspítali [Landspítali University Hospital], Division of Finance and Information; 2013.
ISL Iceland 2013 2013 17.5
Hospital Statistics and Accounts 2013. Reykjavík: Landspítali [Landspítali University Hospital], Division of Finance and Information; 2014.
ISL Iceland 2014 2014 17.1
Hospital Statistics and Accounts 2014. Reykjavík: Landspítali [Landspítali University Hospital], Division of Finance and Information; 2015.
ISL Iceland 2015 2015 17.8
Hospital Statistics and Accounts 2015. Reykjavík: Landspítali [Landspítali University Hospital], Division of Finance and Information; 2016.
BMJ Publishing Group Limited (BMJ) disclaims all liability and responsibility arising from any relianceSupplemental material placed on this supplemental material which has been supplied by the author(s) BMJ Global Health
doi: 10.1136/bmjgh-2021-005671:e005671. 6 2021;BMJ Global Health, et al. Betran AP

129
ISO
Cod
e
Country
Coverag
e start
year
Covera
ge end
year
Caesare
an
section
rate (%)
References
ISL Iceland 2016 2016 18.3
Hospital Statistics and Accounts 2016. Reykjavík: Landspítali [Landspítali University Hospital], Division of Finance and Information; 2017.
ISL Iceland 2017 2017 18.2
Hospital Statistics and Accounts 2017. Reykjavík: Landspítali [Landspítali University Hospital], Division of Finance and Information; 2018.
ISL Iceland 2018 2018 17.2
Hospital Statistics and Accounts 2018. Reykjavík: Landspítali [Landspítali University Hospital], Division of Finance and Information; 2019.
IND India 1987 1993 2.5
International Institute for Population Sciences (IIPS). National Family Health Survey (MCH and Family Planning), India 1992-93. Bombay, India: IIPS; 1995.
IND India 1995 1999 7.1
International Institute for Population Sciences (IIPS), ORC Macro. National Family Health Survey (NFHS-2), 1998–99: India. Mumbai, India: IIPS; 2000.
IND India 1999 2004 8.0
District Level Household and Facility Survey (DLHS-2), 2002-04: India. Mumbai: International Institute for Population Sciences (IIPS) [India]; 2006.
IND India 2000 2006 8.5
International Institute for Population Sciences (IIPS), Macro International. National Family Health Survey (NFHS-3), 2005–06: India: Volume I. Mumbai: IIPS; 2007.
IND India 2004 2008 8.2
District Level Household and Facility Survey (DLHS-3), 2007-08: India. Mumbai: International Institute for Population Sciences (IIPS) [India]; 2010.
BMJ Publishing Group Limited (BMJ) disclaims all liability and responsibility arising from any relianceSupplemental material placed on this supplemental material which has been supplied by the author(s) BMJ Global Health
doi: 10.1136/bmjgh-2021-005671:e005671. 6 2021;BMJ Global Health, et al. Betran AP

130
ISO
Cod
e
Country
Coverag
e start
year
Covera
ge end
year
Caesare
an
section
rate (%)
References
IND India 2010 2016 17.2
National Family Health Survey (NFHS-4) 2015-16: India. Mumbai: International Institute for Population Sciences (IIPS), ICFP [India]; 2017.
IDN Indonesia 1986 1991 1.3
Central Bureau of Statistics, National Family Planning Coordinating Board, Ministry of Health, Macro International Inc. Indonesia Demographic and Health Survey 1991. Columbia, Maryland, USA: Macro International Inc.; 1992.
IDN Indonesia 1989 1994 2.5
Central Bureau of Statistics (CBS) [Indonesia], State Ministry of Population/National Family Planning Coordinating Board (NFPCB), Ministry of Health (MOH), Macro International Inc. (MI). Indonesia Demographic and Health Survey 1994. Calverton, Maryland: CBS, MI; 1995.
IDN Indonesia 1992 1997 4.3
Central Bureau of Statistics (CBS) [Indonesia], State Ministry of Population/National Family Planning Coordinating Board (NFPCB), Ministry of Health (MOH), Macro International Inc. (MI). Indonesia Demographic and Health Survey 1997. Calverton, Maryland: CBS, MI; 1998.
IDN Indonesia 1997 2003 4.1
Badan Pusat Statistik-Statistics Indonesia (BPS), ORC Macro. Indonesia Demographic and Health Survey 2002-2003. Calverton, Maryland, USA: BPS, ORC Macro; 2003.
IDN Indonesia 2002 2007 6.8
Statistics Indonesia (Badan Pusat Statistik-BPS), Macro International. Indonesia Demographic and Health Survey 2007. Calverton, Maryland, USA: BPS, Macro International; 2008.
IDN Indonesia 2007 2012 12.3
Statistics Indonesia (Badan Pusat Statistik—BPS), National Population and Family Planning Board (BKKBN), Kementerian Kesehatan (Kemenkes—MOH),ICF International. Indonesia Demographic and Health Survey 2012. Jakarta, Indonesia: BPS, BKKBN, Kemenkes, ICF International; 2013.
IRN Iran (Islamic Republic of)
1998 2000 35.0
Ahmad-Nia S, Delavar B, Eini-Zinab H, Kazemipour S, Mehryar AH, Naghavi M. Caesarean section in the Islamic Republic of Iran: prevalence and some sociodemographic correlates. East Mediterr Health J. 2009;15(6):1389-98.
BMJ Publishing Group Limited (BMJ) disclaims all liability and responsibility arising from any relianceSupplemental material placed on this supplemental material which has been supplied by the author(s) BMJ Global Health
doi: 10.1136/bmjgh-2021-005671:e005671. 6 2021;BMJ Global Health, et al. Betran AP

131
ISO
Cod
e
Country
Coverag
e start
year
Covera
ge end
year
Caesare
an
section
rate (%)
References
IRN Iran (Islamic Republic of)
2003 2005 40.0
Yazdizadeh B, Nedjat S, Mohammad K, Rashidian A, Changizi N, Majdzadeh R. Cesarean section rate in Iran, multidimensional approaches for behavioral change of providers: a qualitative study. BMC Health Serv Res. 2011;11:159. doi: 10.1186/1472-6963-11-159.
IRN Iran (Islamic Republic of)
2008 2010 45.6
Rashidian A, Khosravi A, Khabiri R, Khodayari-Moez E, Elahi E, Arab M, Radaie Z. Islamic Republic of Iran’s Multiple Indicator Demographic and Health Survey (IrMIDHS) 2010. Tehran: Ministry of Health and Medical Education; 2012 (in Persian).
IRQ Iraq 2004 2006 20.6
Iraq Multiple Indicator Cluster Survey 2006, Final Report. Baghdad: Central Organization for Statistics and Information Technology, Kurdistan Regional Statistics Office, Ministry of Health [Iraq], United Nations Children's Fund (UNICEF); 2007.
IRQ Iraq 2009 2011 22.2
Iraq Multiple Indicator Cluster Survey 2011. Final Report. Baghdad: Central Statistical Organization (CSO), Kurdistan Regional Statistics Office (KRSO), United Nations Children’s Fund (UNICEF); 2012.
IRQ Iraq 2008 2008 18.0
Shabila NP. Rates and trends in cesarean sections between 2008 and 2012 in Iraq. BMC Pregnancy Childbirth. 2017;17:22. doi: 10.1186/s12884-016-1211-6.
IRQ Iraq 2012 2012 24.4
Shabila NP. Rates and trends in cesarean sections between 2008 and 2012 in Iraq. BMC Pregnancy Childbirth. 2017;17:22. doi: 10.1186/s12884-016-1211-6.
IRQ Iraq 2016 2018 33.2
Iraq 2018 Multiple Indicator Cluster Survey (MICS6). Survey Findings Report. Baghdad: Central Statistical Organization (CSO), United Nations Children’s Fund (UNICEF); 2019.
IRL Ireland 1990 1990 10.6
Report on Perinatal Statistics for 1999. Dublin: The Economic and Social Research Institute (ESRI); 2002.
BMJ Publishing Group Limited (BMJ) disclaims all liability and responsibility arising from any relianceSupplemental material placed on this supplemental material which has been supplied by the author(s) BMJ Global Health
doi: 10.1136/bmjgh-2021-005671:e005671. 6 2021;BMJ Global Health, et al. Betran AP

132
ISO
Cod
e
Country
Coverag
e start
year
Covera
ge end
year
Caesare
an
section
rate (%)
References
IRL Ireland 1991 1991 11.8
Report on Perinatal Statistics for 1999. Dublin: The Economic and Social Research Institute (ESRI); 2002.
IRL Ireland 1992 1992 12.2
Report on Perinatal Statistics for 1999. Dublin: The Economic and Social Research Institute (ESRI); 2002.
IRL Ireland 1993 1993 13.0
Report on Perinatal Statistics for 1999. Dublin: The Economic and Social Research Institute (ESRI); 2002.
IRL Ireland 1995 1995 13.4
European Health for All Database (HFA-DB) [online database]. World Health Organization (WHO) Regional Office for Europe; 2012 (http://data.euro.who.int/hfadb, accessed 20 August 2012).
IRL Ireland 1996 1996 14.5
European Health for All Database (HFA-DB) [online database]. World Health Organization (WHO) Regional Office for Europe; 2012 (http://data.euro.who.int/hfadb, accessed 20 August 2012).
IRL Ireland 1997 1997 15.3
European Health for All Database (HFA-DB) [online database]. World Health Organization (WHO) Regional Office for Europe; 2012 (http://data.euro.who.int/hfadb, accessed 20 August 2012).
IRL Ireland 1998 1998 17.5
European Health for All Database (HFA-DB) [online database]. World Health Organization (WHO) Regional Office for Europe; 2012 (http://data.euro.who.int/hfadb, accessed 20 August 2012).
IRL Ireland 1999 1999 20.0
Report on Perinatal Statistics for 1999. Dublin: The Economic and Social Research Institute (ESRI); 2002.
BMJ Publishing Group Limited (BMJ) disclaims all liability and responsibility arising from any relianceSupplemental material placed on this supplemental material which has been supplied by the author(s) BMJ Global Health
doi: 10.1136/bmjgh-2021-005671:e005671. 6 2021;BMJ Global Health, et al. Betran AP

133
ISO
Cod
e
Country
Coverag
e start
year
Covera
ge end
year
Caesare
an
section
rate (%)
References
IRL Ireland 2000 2000 20.9
Report on Perinatal Statistics for 2000. Dublin: The Economic and Social Research Institute (ESRI); 2004.
IRL Ireland 2001 2001 21.5
Report on Perinatal Statistics for 2001. Dublin: The Economic and Social Research Institute (ESRI); 2005.
IRL Ireland 2002 2002 21.9
Report on Perinatal Statistics for 2002. Dublin: The Economic and Social Research Institute (ESRI); 2005.
IRL Ireland 2003 2003 23.6
Report on Perinatal Statistics for 2003. Dublin: Health Policy and Information Division, the Economic and Social Research Institute (ESRI); 2006.
IRL Ireland 2004 2004 24.6
Report on Perinatal Statistics for 2004. Dublin: Health Policy and Information Division, the Economic and Social Research Institute (ESRI); 2007.
IRL Ireland 2005 2005 25.3
Perinatal Statistics Report 2005. Dublin: Health Research and Information Division, the Economic and Social Research Institute (ESRI); 2008.
IRL Ireland 2006 2006 24.8
Perinatal Statistics Report 2006. Dublin: Health Research and Information Division, the Economic and Social Research Institute (ESRI); 2008.
IRL Ireland 2007 2007 25.5
Perinatal Statistics Report 2007. Dublin: Health Research and Information Division, the Economic and Social Research Institute (ESRI); 2009.
BMJ Publishing Group Limited (BMJ) disclaims all liability and responsibility arising from any relianceSupplemental material placed on this supplemental material which has been supplied by the author(s) BMJ Global Health
doi: 10.1136/bmjgh-2021-005671:e005671. 6 2021;BMJ Global Health, et al. Betran AP

134
ISO
Cod
e
Country
Coverag
e start
year
Covera
ge end
year
Caesare
an
section
rate (%)
References
IRL Ireland 2008 2008 25.9
Perinatal Statistics Report 2008. Dublin: Health Research and Information Division, the Economic and Social Research Institute (ESRI); 2010.
IRL Ireland 2009 2009 26.2
Perinatal Statistics Report 2009. Dublin: Health Research and Information Division, the Economic and Social Research Institute (ESRI); 2011.
IRL Ireland 2010 2010 26.3
Perinatal Statistics Report 2010. Dublin: Health Research and Information Division, the Economic and Social Research Institute (ESRI); 2012.
IRL Ireland 2011 2011 28.1
Perinatal Statistics Report 2011. Dublin: Health Research and Information Division, the Economic and Social Research Institute (ESRI); 2012.
IRL Ireland 2012 2012 28.8
Perinatal Statistics Report 2012. Dublin: Health Research and Information Division, the Economic and Social Research Institute (ESRI); 2013.
IRL Ireland 2013 2013 29.7
Healthcare Pricing Office (HPO), Health Service Executive (HSE). Perinatal Statistics Report 2013. Version 1.0. Dublin: HSE; 2014.
IRL Ireland 2014 2014 30.4
Healthcare Pricing Office (HPO), Health Service Executive (HSE). Perinatal Statistics Report 2014. Version 1.0. Dublin: HSE; 2016.
IRL Ireland 2015 2015 31.3
Healthcare Pricing Office (HPO), Health Service Executive (HSE). Perinatal Statistics Report 2015. Version 1.0. Dublin: HSE; 2017.
BMJ Publishing Group Limited (BMJ) disclaims all liability and responsibility arising from any relianceSupplemental material placed on this supplemental material which has been supplied by the author(s) BMJ Global Health
doi: 10.1136/bmjgh-2021-005671:e005671. 6 2021;BMJ Global Health, et al. Betran AP

135
ISO
Cod
e
Country
Coverag
e start
year
Covera
ge end
year
Caesare
an
section
rate (%)
References
IRL Ireland 2016 2016 32.6
Healthcare Pricing Office (HPO), Health Service Executive (HSE). Perinatal Statistics Report 2016. Version 1.0. Dublin: HSE; 2018.
ISR Israel 1990 1990 9.9
European Health for All Database (HFA-DB) [online database]. World Health Organization (WHO) Regional Office for Europe; 2012 (http://data.euro.who.int/hfadb, accessed 20 August 2012).
ISR Israel 1993 1993 10.9
European Health for All Database (HFA-DB) [online database]. World Health Organization (WHO) Regional Office for Europe; 2012 (http://data.euro.who.int/hfadb, accessed 20 August 2012).
ISR Israel 1994 1994 11.6
European Health for All Database (HFA-DB) [online database]. World Health Organization (WHO) Regional Office for Europe; 2012 (http://data.euro.who.int/hfadb, accessed 20 August 2012).
ISR Israel 1995 1995 12.2
European Health for All Database (HFA-DB) [online database]. World Health Organization (WHO) Regional Office for Europe; 2012 (http://data.euro.who.int/hfadb, accessed 20 August 2012).
ISR Israel 1996 1996 12.7
European Health for All Database (HFA-DB) [online database]. World Health Organization (WHO) Regional Office for Europe; 2012 (http://data.euro.who.int/hfadb, accessed 20 August 2012).
ISR Israel 1997 1997 12.8
European Health for All Database (HFA-DB) [online database]. World Health Organization (WHO) Regional Office for Europe; 2012 (http://data.euro.who.int/hfadb, accessed 20 August 2012).
ISR Israel 1998 1998 13.4
European Health for All Database (HFA-DB) [online database]. World Health Organization (WHO) Regional Office for Europe; 2012 (http://data.euro.who.int/hfadb, accessed 20 August 2012).
BMJ Publishing Group Limited (BMJ) disclaims all liability and responsibility arising from any relianceSupplemental material placed on this supplemental material which has been supplied by the author(s) BMJ Global Health
doi: 10.1136/bmjgh-2021-005671:e005671. 6 2021;BMJ Global Health, et al. Betran AP

136
ISO
Cod
e
Country
Coverag
e start
year
Covera
ge end
year
Caesare
an
section
rate (%)
References
ISR Israel 1999 1999 14.6
European Health for All Database (HFA-DB) [online database]. World Health Organization (WHO) Regional Office for Europe; 2012 (http://data.euro.who.int/hfadb, accessed 20 August 2012).
ISR Israel 2000 2000 15.8
European Health for All Database (HFA-DB) [online database]. World Health Organization (WHO) Regional Office for Europe; 2012 (http://data.euro.who.int/hfadb, accessed 20 August 2012).
ISR Israel 2001 2001 16.7
European Health for All Database (HFA-DB) [online database]. World Health Organization (WHO) Regional Office for Europe; 2012 (http://data.euro.who.int/hfadb, accessed 20 August 2012).
ISR Israel 2002 2002 17.3
European Health for All Database (HFA-DB) [online database]. World Health Organization (WHO) Regional Office for Europe; 2012 (http://data.euro.who.int/hfadb, accessed 20 August 2012).
ISR Israel 2003 2003 17.5
European Health for All Database (HFA-DB) [online database]. World Health Organization (WHO) Regional Office for Europe; 2012 (http://data.euro.who.int/hfadb, accessed 20 August 2012).
ISR Israel 2004 2004 17.6
European Health for All Database (HFA-DB) [online database]. World Health Organization (WHO) Regional Office for Europe; 2012 (http://data.euro.who.int/hfadb, accessed 20 August 2012).
ISR Israel 2005 2005 18.6
European Health for All Database (HFA-DB) [online database]. World Health Organization (WHO) Regional Office for Europe; 2012 (http://data.euro.who.int/hfadb, accessed 20 August 2012).
ISR Israel 2006 2006 18.7
European Health for All Database (HFA-DB) [online database]. World Health Organization (WHO) Regional Office for Europe; 2012 (http://data.euro.who.int/hfadb, accessed 20 August 2012).
BMJ Publishing Group Limited (BMJ) disclaims all liability and responsibility arising from any relianceSupplemental material placed on this supplemental material which has been supplied by the author(s) BMJ Global Health
doi: 10.1136/bmjgh-2021-005671:e005671. 6 2021;BMJ Global Health, et al. Betran AP

137
ISO
Cod
e
Country
Coverag
e start
year
Covera
ge end
year
Caesare
an
section
rate (%)
References
ISR Israel 2007 2007 18.9
European Health for All Database (HFA-DB) [online database]. World Health Organization (WHO) Regional Office for Europe; 2012 (http://data.euro.who.int/hfadb, accessed 20 August 2012).
ISR Israel 2008 2008 19.5
European Health for All Database (HFA-DB) [online database]. World Health Organization (WHO) Regional Office for Europe; 2012 (http://data.euro.who.int/hfadb, accessed 20 August 2012).
ISR Israel 2009 2009 19.2
European Health for All Database (HFA-DB) [online database]. World Health Organization (WHO) Regional Office for Europe; 2012 (http://data.euro.who.int/hfadb, accessed 20 August 2012).
ISR Israel 2010 2010 17.5
European Health for All Database (HFA-DB) [online database]. World Health Organization (WHO) Regional Office for Europe; 2016 (http://data.euro.who.int/hfadb, accessed 8 August 2016).
ISR Israel 2011 2011 17.0
European Health for All Database (HFA-DB) [online database]. World Health Organization (WHO) Regional Office for Europe; 2016 (http://data.euro.who.int/hfadb, accessed 8 August 2016).
ISR Israel 2012 2012 16.4
European Health for All Database (HFA-DB) [online database]. World Health Organization (WHO) Regional Office for Europe; 2016 (http://data.euro.who.int/hfadb, accessed 8 August 2016).
ISR Israel 2013 2013 15.9
European Health for All Database (HFA-DB) [online database]. World Health Organization (WHO) Regional Office for Europe; 2016 (http://data.euro.who.int/hfadb, accessed 8 August 2016).
ISR Israel 2014 2014 16.1
European Health for All Database (HFA-DB) [online database]. World Health Organization (WHO) Regional Office for Europe; 2016 (http://data.euro.who.int/hfadb, accessed 8 August 2016).
BMJ Publishing Group Limited (BMJ) disclaims all liability and responsibility arising from any relianceSupplemental material placed on this supplemental material which has been supplied by the author(s) BMJ Global Health
doi: 10.1136/bmjgh-2021-005671:e005671. 6 2021;BMJ Global Health, et al. Betran AP

138
ISO
Cod
e
Country
Coverag
e start
year
Covera
ge end
year
Caesare
an
section
rate (%)
References
ITA Italy 1990 1990 20.8
European Health for All Database (HFA-DB) [online database]. World Health Organization (WHO) Regional Office for Europe; 2012 (http://data.euro.who.int/hfadb, accessed 20 August 2012).
ITA Italy 1991 1991 22.6
European Health for All Database (HFA-DB) [online database]. World Health Organization (WHO) Regional Office for Europe; 2012 (http://data.euro.who.int/hfadb, accessed 20 August 2012).
ITA Italy 1992 1992 22.9
European Health for All Database (HFA-DB) [online database]. World Health Organization (WHO) Regional Office for Europe; 2012 (http://data.euro.who.int/hfadb, accessed 20 August 2012).
ITA Italy 1993 1993 24.1
European Health for All Database (HFA-DB) [online database]. World Health Organization (WHO) Regional Office for Europe; 2012 (http://data.euro.who.int/hfadb, accessed 20 August 2012).
ITA Italy 1994 1994 24.8
European Health for All Database (HFA-DB) [online database]. World Health Organization (WHO) Regional Office for Europe; 2012 (http://data.euro.who.int/hfadb, accessed 20 August 2012).
ITA Italy 1995 1995 26.1
European Health for All Database (HFA-DB) [online database]. World Health Organization (WHO) Regional Office for Europe; 2012 (http://data.euro.who.int/hfadb, accessed 20 August 2012).
ITA Italy 1996 1996 23.5
European Health for All Database (HFA-DB) [online database]. World Health Organization (WHO) Regional Office for Europe; 2012 (http://data.euro.who.int/hfadb, accessed 20 August 2012).
ITA Italy 1997 1997 29.4
Demografia in Cifre. La rilevazione delle nascite di fonte stato civile. Anni 1997 e 1998. Tavola 1.1 – Indicatori sintetici regionali – Anno 1997. [website]. Roma: Istituto Nazionale di Statistica [Italian National Institute of Statistics] (ISTAT); 1999 (http://demo.istat.it/altridati/natid1d2/index.html, accessed 12 September 2012, in Italian).
BMJ Publishing Group Limited (BMJ) disclaims all liability and responsibility arising from any relianceSupplemental material placed on this supplemental material which has been supplied by the author(s) BMJ Global Health
doi: 10.1136/bmjgh-2021-005671:e005671. 6 2021;BMJ Global Health, et al. Betran AP

139
ISO
Cod
e
Country
Coverag
e start
year
Covera
ge end
year
Caesare
an
section
rate (%)
References
ITA Italy 1998 1998 30.3
Demografia in Cifre. La rilevazione delle nascite di fonte stato civile. Anni 1997 e 1998. Tavola 1.1 – Indicatori sintetici regionali – Anno 1998. [website]. Roma: Istituto Nazionale di Statistica [Italian National Institute of Statistics] (ISTAT); 1999 (http://demo.istat.it/altridati/natid1d2/index.html, accessed 12 September 2012, in Italian).
ITA Italy 1999 1999 31.6
European Health for All Database (HFA-DB) [online database]. World Health Organization (WHO) Regional Office for Europe; 2012 (http://data.euro.who.int/hfadb, accessed 20 August 2012).
ITA Italy 2000 2000 33.0
European Health for All Database (HFA-DB) [online database]. World Health Organization (WHO) Regional Office for Europe; 2012 (http://data.euro.who.int/hfadb, accessed 20 August 2012).
ITA Italy 2001 2001 34.5
European Health for All Database (HFA-DB) [online database]. World Health Organization (WHO) Regional Office for Europe; 2012 (http://data.euro.who.int/hfadb, accessed 20 August 2012).
ITA Italy 2002 2002 35.3
Certificato di assistenza al parto (CeDAP). Analisi dell’evento nascita - Anno 2002. Roma: Direzione Generale del Sistema Informativo – Ufficio di Statistica; 2004 (in Italian).
ITA Italy 2003 2003 35.8
Certificato di assistenza al parto (CeDAP). Analisi dell’evento nascita - Anno 2003. Roma: Direzione Generale del Sistema Informativo – Ufficio di Statistica; 2005 (in Italian).
ITA Italy 2004 2004 36.4
Certificato di assistenza al parto (CeDAP). Analisi dell’evento nascita - Anno 2004. Roma: Direzione Generale del Sistema Informativo – Ufficio di Statistica; 2007 (in Italian).
ITA Italy 2005 2005 37.3
Certificato di assistenza al parto (CeDAP). Analisi dell’evento nascita - Anno 2005. Roma: Direzione Generale del Sistema Informativo – Ufficio di Statistica; 2008 (in Italian).
BMJ Publishing Group Limited (BMJ) disclaims all liability and responsibility arising from any relianceSupplemental material placed on this supplemental material which has been supplied by the author(s) BMJ Global Health
doi: 10.1136/bmjgh-2021-005671:e005671. 6 2021;BMJ Global Health, et al. Betran AP

140
ISO
Cod
e
Country
Coverag
e start
year
Covera
ge end
year
Caesare
an
section
rate (%)
References
ITA Italy 2006 2006 37.4
Certificato di assistenza al parto (CeDAP). Analisi dell’evento nascita - Anno 2006. Roma: Direzione Generale del Sistema Informativo – Ufficio di Statistica; 2009 (in Italian).
ITA Italy 2007 2007 37.4
Certificato di assistenza al parto (CeDAP). Analisi dell’evento nascita - Anno 2007. Roma: Direzione Generale del Sistema Informativo – Ufficio di Statistica; 2010 (in Italian).
ITA Italy 2008 2008 37.8
Certificato di assistenza al parto (CeDAP). Analisi dell’evento nascita - Anno 2008. Roma: Direzione Generale del Sistema Informativo – Ufficio di Statistica; 2011 (in Italian).
ITA Italy 2009 2009 38.0
Certificato di assistenza al parto (CeDAP). Analisi dell’evento nascita - Anno 2009. Roma: Direzione Generale del Sistema Informativo – Ufficio di Statistica; 2012 (in Italian).
ITA Italy 2010 2010 37.5
Certificato di assistenza al parto (CeDAP). Analisi dell’evento nascita - Anno 2010. Roma: Direzione Generale del Sistema Informativo e Statistico Sanitario – Ufficio di Statistica; 2013 (in Italian).
ITA Italy 2011 2011 38.1
European Health for All Database (HFA-DB) [online database]. World Health Organization (WHO) Regional Office for Europe; 2016 (http://data.euro.who.int/hfadb, accessed 8 August 2016).
ITA Italy 2012 2012 37.3
European Health for All Database (HFA-DB) [online database]. World Health Organization (WHO) Regional Office for Europe; 2016 (http://data.euro.who.int/hfadb, accessed 8 August 2016).
ITA Italy 2013 2013 35.6
Certificato di assistenza al parto (CeDAP). Analisi dell’evento nascita - Anno 2013. Roma: Direzione Generale della Digitalizzazione, del Sistema Informativo Sanitario e della Statistica – Ufficio di Statistica; 2015 (in Italian).
BMJ Publishing Group Limited (BMJ) disclaims all liability and responsibility arising from any relianceSupplemental material placed on this supplemental material which has been supplied by the author(s) BMJ Global Health
doi: 10.1136/bmjgh-2021-005671:e005671. 6 2021;BMJ Global Health, et al. Betran AP

141
ISO
Cod
e
Country
Coverag
e start
year
Covera
ge end
year
Caesare
an
section
rate (%)
References
ITA Italy 2014 2014 35.0
Certificato di assistenza al parto (CeDAP). Analisi dell’evento nascita - Anno 2014. Roma: Direzione Generale della Digitalizzazione, del Sistema Informativo Sanitario e della Statistica – Ufficio di Statistica; 2017 (in Italian).
ITA Italy 2015 2015 34.3
Certificato di assistenza al parto (CeDAP). Analisi dell’evento nascita - Anno 2015. Roma: Direzione Generale della Digitalizzazione, del Sistema Informativo Sanitario e della Statistica – Ufficio di Statistica; 2018 (in Italian).
ITA Italy 2016 2016 33.7
Certificato di assistenza al parto (CeDAP). Analisi dell’evento nascita - Anno 2016. Roma: Direzione Generale della Digitalizzazione, del Sistema Informativo Sanitario e della Statistica – Ufficio di Statistica; 2019 (in Italian).
JAM Jamaica 1993 1993 6.6
1993 Contraceptive Prevalence Survey Jamaica. Volume III - Sexual Experience Contraceptive Practice and Fertility. Kingston, Atlanta, GA: National Family Planning Board [Jamaica], Centers for Disease Control and Prevention (CDC); 1994.
JAM Jamaica 2003 2003 14.2
Annual Report 2007. Kingston: Ministry of Health and Environment - Policy, Planning and Development Division, Planning and Evaluation Branch [Jamaica]; 2009.
JAM Jamaica 2004 2004 14.2
Annual Report 2007. Kingston: Ministry of Health and Environment - Policy, Planning and Development Division, Planning and Evaluation Branch [Jamaica]; 2009.
JAM Jamaica 2005 2005 13.8
Annual Report 2007. Kingston: Ministry of Health and Environment - Policy, Planning and Development Division, Planning and Evaluation Branch [Jamaica]; 2009.
JAM Jamaica 2006 2006 15.3
Annual Report 2007. Kingston: Ministry of Health and Environment - Policy, Planning and Development Division, Planning and Evaluation Branch [Jamaica]; 2009.
BMJ Publishing Group Limited (BMJ) disclaims all liability and responsibility arising from any relianceSupplemental material placed on this supplemental material which has been supplied by the author(s) BMJ Global Health
doi: 10.1136/bmjgh-2021-005671:e005671. 6 2021;BMJ Global Health, et al. Betran AP

142
ISO
Cod
e
Country
Coverag
e start
year
Covera
ge end
year
Caesare
an
section
rate (%)
References
JAM Jamaica 2007 2007 15.2
Annual Report 2007. Kingston: Ministry of Health and Environment - Policy, Planning and Development Division, Planning and Evaluation Branch [Jamaica]; 2009.
JAM Jamaica 2009 2011 21.2
Statistical Institute of Jamaica (STATIN), United Nations Children's Fund (UNICEF). Jamaica Multiple Indicator Cluster Survey 2011. Final Report. Kingston, Jamaica: STATIN, UNICEF; 2013.
JPN Japan 1990 1990 11.2
Summary of Health Care Facilities and Hospital Statistics 2008. [平成20年 2008医療施設(静態・動態)調査・病院報告の概
況)]. Tokyo: Ministry of Health, Labour and Welfare [Japan]; 2009 (in Japanese).
JPN Japan 1993 1993 13.8
Summary of Health Care Facilities and Hospital Statistics 2008. [平成20年 2008医療施設(静態・動態)調査・病院報告の概
況)]. Tokyo: Ministry of Health, Labour and Welfare [Japan]; 2009 (in Japanese).
JPN Japan 1996 1996 14.7
Summary of Health Care Facilities and Hospital Statistics 2008. [平成20年 2008医療施設(静態・動態)調査・病院報告の概
況)]. Tokyo: Ministry of Health, Labour and Welfare [Japan]; 2009 (in Japanese).
JPN Japan 1999 1999 17.4
Summary of Health Care Facilities and Hospital Statistics 2008. [平成20年 2008医療施設(静態・動態)調査・病院報告の概
況)]. Tokyo: Ministry of Health, Labour and Welfare [Japan]; 2009 (in Japanese).
JPN Japan 2002 2002 17.9
Summary of Health Care Facilities and Hospital Statistics 2008. [平成20年 2008医療施設(静態・動態)調査・病院報告の概
況)]. Tokyo: Ministry of Health, Labour and Welfare [Japan]; 2009 (in Japanese).
JPN Japan 2005 2005 21.4
Summary of Health Care Facilities and Hospital Statistics 2008. [平成20年 2008医療施設(静態・動態)調査・病院報告の概
況)]. Tokyo: Ministry of Health, Labour and Welfare [Japan]; 2009 (in Japanese).
BMJ Publishing Group Limited (BMJ) disclaims all liability and responsibility arising from any relianceSupplemental material placed on this supplemental material which has been supplied by the author(s) BMJ Global Health
doi: 10.1136/bmjgh-2021-005671:e005671. 6 2021;BMJ Global Health, et al. Betran AP

143
ISO
Cod
e
Country
Coverag
e start
year
Covera
ge end
year
Caesare
an
section
rate (%)
References
JPN Japan 2008 2008 23.3
Summary of Health Care Facilities and Hospital Statistics 2008. [平成20年 2008医療施設(静態・動態)調査・病院報告の概
況)]. Tokyo: Ministry of Health, Labour and Welfare [Japan]; 2009 (in Japanese).
JPN Japan 2011 2011 19.2
Summary of Health Care Facilities and Hospital Statistics 2011 (平成 23 年(2011) 医療施設(静態・動態)調査・病院報告の概況). Tokyo: Ministry of Health, Labour and Welfare [Japan]; 2012 (in Japanese).
JPN Japan 2014 2014 19.7
Summary of Health Care Facilities and Hospital Statistics 2014 (平成 26 年(2014) 医療施設(静態・動態)調査・病院報告の概況). Tokyo: Ministry of Health, Labour and Welfare [Japan]; 2015 (in Japanese).
JOR Jordan 1985 1990 5.7
Abdel Aziz Zou'bi A, Poedjastoeti S, Ayad M (Department of Statistics [Jordan], Ministry of Health [Jordan], IRD/Macro International). Jordan Population and Family Health Survey 1990. Columbia, Maryland, USA: Department of Statistics [Jordan], Ministry of Health [Jordan], IRD/Macro International; 1992.
JOR Jordan 1992 1997 10.5
Department of Statistics (DOS) [Jordan], Macro International Inc. (MI). Jordan Population and Family Health Survey 1997. Calverton, Maryland: DOS, MI; 1998.
JOR Jordan 1997 2002 16.0
Department of Statistics [Jordan], ORC Macro. Jordan Population and Family Health Survey 2002. Calverton, Maryland, USA: Department of Statistics, ORC Macro; 2003.
JOR Jordan 2002 2007 18.5
Department of Statistics [Jordan], Macro International Inc. Jordan Population and Family Health Survey 2007. Calverton, Maryland, USA: Department of Statistics, Macro International Inc.; 2008.
JOR Jordan 2007 2012 28.0
Department of Statistics [Jordan], ICF International. Jordan Population and Family Health Survey 2012. Calverton, Maryland, USA: Department of Statistics, ICF International; 2013.
BMJ Publishing Group Limited (BMJ) disclaims all liability and responsibility arising from any relianceSupplemental material placed on this supplemental material which has been supplied by the author(s) BMJ Global Health
doi: 10.1136/bmjgh-2021-005671:e005671. 6 2021;BMJ Global Health, et al. Betran AP

144
ISO
Cod
e
Country
Coverag
e start
year
Covera
ge end
year
Caesare
an
section
rate (%)
References
JOR Jordan 2013 2018 25.8
Jordan Population and Family and Health Survey 2017-18. Amman, Jordan, and Rockville, Maryland, USA: Department of Statistics (DOS) , ICF; 2019.
KAZ Kazakhstan 1990 1990 4.6
European Health for All Database (HFA-DB) [online database]. World Health Organization (WHO) Regional Office for Europe; 2012 (http://data.euro.who.int/hfadb, accessed 20 August 2012).
KAZ Kazakhstan 1991 1991 5.0
European Health for All Database (HFA-DB) [online database]. World Health Organization (WHO) Regional Office for Europe; 2012 (http://data.euro.who.int/hfadb, accessed 20 August 2012).
KAZ Kazakhstan 1992 1992 5.3
European Health for All Database (HFA-DB) [online database]. World Health Organization (WHO) Regional Office for Europe; 2012 (http://data.euro.who.int/hfadb, accessed 20 August 2012).
KAZ Kazakhstan 1992 1995 4.6
National Institute of Nutrition [Kazakhstan], Macro International Inc. Kazakhstan Demographic and Health Survey, 1995. Calverton, Maryland: National Institute of Nutrition, Macro International Inc.; 1996.
KAZ Kazakhstan 1995 1995 5.2
European Health for All Database (HFA-DB) [online database]. World Health Organization (WHO) Regional Office for Europe; 2012 (http://data.euro.who.int/hfadb, accessed 20 August 2012).
KAZ Kazakhstan 1998 1998 6.5
European Health for All Database (HFA-DB) [online database]. World Health Organization (WHO) Regional Office for Europe; 2012 (http://data.euro.who.int/hfadb, accessed 20 August 2012).
KAZ Kazakhstan 1994 1999 9.6
Academy of Preventive Medicine [Kazakhstan], Macro International Inc. Kazakhstan Demographic and Health Survey 1999. Calverton, Maryland: Academy of Preventive Medicine, Macro International Inc.; 2000.
BMJ Publishing Group Limited (BMJ) disclaims all liability and responsibility arising from any relianceSupplemental material placed on this supplemental material which has been supplied by the author(s) BMJ Global Health
doi: 10.1136/bmjgh-2021-005671:e005671. 6 2021;BMJ Global Health, et al. Betran AP

145
ISO
Cod
e
Country
Coverag
e start
year
Covera
ge end
year
Caesare
an
section
rate (%)
References
KAZ Kazakhstan 1999 1999 6.8
European Health for All Database (HFA-DB) [online database]. World Health Organization (WHO) Regional Office for Europe; 2012 (http://data.euro.who.int/hfadb, accessed 20 August 2012).
KAZ Kazakhstan 2000 2000 6.8
European Health for All Database (HFA-DB) [online database]. World Health Organization (WHO) Regional Office for Europe; 2012 (http://data.euro.who.int/hfadb, accessed 20 August 2012).
KAZ Kazakhstan 2001 2001 7.4
European Health for All Database (HFA-DB) [online database]. World Health Organization (WHO) Regional Office for Europe; 2012 (http://data.euro.who.int/hfadb, accessed 20 August 2012).
KAZ Kazakhstan 2002 2002 8.1
European Health for All Database (HFA-DB) [online database]. World Health Organization (WHO) Regional Office for Europe; 2012 (http://data.euro.who.int/hfadb, accessed 20 August 2012).
KAZ Kazakhstan 2003 2003 9.3
European Health for All Database (HFA-DB) [online database]. World Health Organization (WHO) Regional Office for Europe; 2012 (http://data.euro.who.int/hfadb, accessed 20 August 2012).
KAZ Kazakhstan 2004 2004 9.4
European Health for All Database (HFA-DB) [online database]. World Health Organization (WHO) Regional Office for Europe; 2012 (http://data.euro.who.int/hfadb, accessed 20 August 2012).
KAZ Kazakhstan 2005 2005 10.1
European Health for All Database (HFA-DB) [online database]. World Health Organization (WHO) Regional Office for Europe; 2012 (http://data.euro.who.int/hfadb, accessed 20 August 2012).
KAZ Kazakhstan 2006 2006 10.7
European Health for All Database (HFA-DB) [online database]. World Health Organization (WHO) Regional Office for Europe; 2012 (http://data.euro.who.int/hfadb, accessed 20 August 2012).
BMJ Publishing Group Limited (BMJ) disclaims all liability and responsibility arising from any relianceSupplemental material placed on this supplemental material which has been supplied by the author(s) BMJ Global Health
doi: 10.1136/bmjgh-2021-005671:e005671. 6 2021;BMJ Global Health, et al. Betran AP

146
ISO
Cod
e
Country
Coverag
e start
year
Covera
ge end
year
Caesare
an
section
rate (%)
References
KAZ Kazakhstan 2007 2007 11.7
European Health for All Database (HFA-DB) [online database]. World Health Organization (WHO) Regional Office for Europe; 2012 (http://data.euro.who.int/hfadb, accessed 20 August 2012).
KAZ Kazakhstan 2008 2008 12.4
European Health for All Database (HFA-DB) [online database]. World Health Organization (WHO) Regional Office for Europe; 2012 (http://data.euro.who.int/hfadb, accessed 20 August 2012).
KAZ Kazakhstan 2010 2010 13.5
European Health for All Database (HFA-DB) [online database]. World Health Organization (WHO) Regional Office for Europe; 2016 (http://data.euro.who.int/hfadb, accessed 8 August 2016).
KAZ Kazakhstan 2008 2010 15.9
The Agency of Statistics, RK, United Nations Children’s Fund (UNICEF). Multiple Indicator Cluster Survey (MICS) in the Republic of Kazakhstan, 2010-2011. Final Report. Astana, Kazakhstan: the Agency of Statistics, RK, the Republican State Enterprise Information Computing Center; 2012.
KAZ Kazakhstan 2011 2011 14.6
European Health for All Database (HFA-DB) [online database]. World Health Organization (WHO) Regional Office for Europe; 2016 (http://data.euro.who.int/hfadb, accessed 8 August 2016).
KAZ Kazakhstan 2012 2012 15.2
European Health for All Database (HFA-DB) [online database]. World Health Organization (WHO) Regional Office for Europe; 2016 (http://data.euro.who.int/hfadb, accessed 8 August 2016).
KAZ Kazakhstan 2013 2013 15.1
European Health for All Database (HFA-DB) [online database]. World Health Organization (WHO) Regional Office for Europe; 2016 (http://data.euro.who.int/hfadb, accessed 8 August 2016).
KAZ Kazakhstan 2015 2015 16.0
European Health for All Database (HFA-DB) [online database]. World Health Organization (WHO) Regional Office for Europe; 2016 (http://data.euro.who.int/hfadb, accessed 8 August 2016).
BMJ Publishing Group Limited (BMJ) disclaims all liability and responsibility arising from any relianceSupplemental material placed on this supplemental material which has been supplied by the author(s) BMJ Global Health
doi: 10.1136/bmjgh-2021-005671:e005671. 6 2021;BMJ Global Health, et al. Betran AP

147
ISO
Cod
e
Country
Coverag
e start
year
Covera
ge end
year
Caesare
an
section
rate (%)
References
KAZ Kazakhstan 2013 2015 14.8
The Statistics Committee of the Ministry of National Economy of the Republic of Kazakhstan (Statistics Committee of the MNE RK), the United Nations Children’s Fund (UNICEF), the United Nations Population Fund (UNFPA). 2015 Kazakhstan Multiple Indicator Cluster Survey, Final Report. Astana, Kazakhstan: The Statistics Committee of the MNE RK, UNICEF, UNFPA; 2016.
KAZ Kazakhstan 2017 2017 18.0
European Health Information Gateway. European Health for All database (HFA-DB). Caesarean sections per 1000 live births [online database]. World Health Organization (WHO) Regional Office for Europe; 2019 (https://gateway.euro.who.int/en/indicators/hfa_596-7060-caesarean-sections-per-1000-live-births/, accessed 5 March 2020).
KEN Kenya 1988 1993 5.2
National Council for Population and Development (NCPD), Central Bureau of Statistics (CBS) (Office of the Vice President and Ministry of Planning and National Development [Kenya]), Macro International Inc. (MI). Kenya Demographic and Health Survey 1993. Calverton, Maryland: NCPD, CBS, MI; 1994.
KEN Kenya 1995 1998 6.8
National Council for Population and Development (NCPD), Central Bureau of Statistics (CBS) (Office of the Vice President and Ministry of Planning and National Development) [Kenya], Macro International Inc. (MI). Kenya Demographic and Health Survey 1998. Calverton, Maryland: NDPD, CBS, and MI; 1999.
KEN Kenya 1998 2003 4.0
Central Bureau of Statistics (CBS) [Kenya], Ministry of Health (MOH) [Kenya], ORC Macro. Kenya Demographic and Health Survey 2003. Calverton, Maryland: CBS, MOH, ORC Macro; 2004.
KEN Kenya 2003 2009 6.2
Kenya National Bureau of Statistics (KNBS), ICF Macro. Kenya Demographic and Health Survey 2008-09. Calverton, Maryland: KNBS, ICF Macro; 2010.
KEN Kenya 2009 2009 8.7
Kenya National Bureau of Statistics, Ministry of Health, National AIDS Control Council, Kenya Medical Research Institute, National Council for Population and Development, Nairobi, Kenya, The DHS Program. Kenya Demographic and Health Survey 2014. Rockville, Maryland, USA: ICF International; 2015.
KIR Kiribati 2004 2009 9.6
Kiribati National Statistics Office (KNSO), Secretariat of the Pacific Community (SPC) [New Caledonia]. Kiribati Demographic and Health Survey 2009. Noumea: SPC; 2010.
BMJ Publishing Group Limited (BMJ) disclaims all liability and responsibility arising from any relianceSupplemental material placed on this supplemental material which has been supplied by the author(s) BMJ Global Health
doi: 10.1136/bmjgh-2021-005671:e005671. 6 2021;BMJ Global Health, et al. Betran AP

148
ISO
Cod
e
Country
Coverag
e start
year
Covera
ge end
year
Caesare
an
section
rate (%)
References
KWT Kuwait 1993 1996 11.2
Kuwait Family Health Survey 1996. Preliminary Report. Kuwait: Ministry of Health [Kuwait], Council of Health Ministers of GCC States; 1997.
KGZ Kyrgyzstan 1990 1990 3.1
European Health for All Database (HFA-DB) [online database]. World Health Organization (WHO) Regional Office for Europe; 2012 (http://data.euro.who.int/hfadb, accessed 20 August 2012).
KGZ Kyrgyzstan 1991 1991 3.0
European Health for All Database (HFA-DB) [online database]. World Health Organization (WHO) Regional Office for Europe; 2012 (http://data.euro.who.int/hfadb, accessed 20 August 2012).
KGZ Kyrgyzstan 1992 1992 3.9
European Health for All Database (HFA-DB) [online database]. World Health Organization (WHO) Regional Office for Europe; 2012 (http://data.euro.who.int/hfadb, accessed 20 August 2012).
KGZ Kyrgyzstan 1993 1993 3.1
European Health for All Database (HFA-DB) [online database]. World Health Organization (WHO) Regional Office for Europe; 2012 (http://data.euro.who.int/hfadb, accessed 20 August 2012).
KGZ Kyrgyzstan 1994 1994 3.2
European Health for All Database (HFA-DB) [online database]. World Health Organization (WHO) Regional Office for Europe; 2012 (http://data.euro.who.int/hfadb, accessed 20 August 2012).
KGZ Kyrgyzstan 1994 1997 6.0
Research Institute of Obstetrics and Pediatrics [Kyrgyz Republic], Macro International Inc. Kyrgyz Republic Demographic and Health Survey, 1997. Calverton, Maryland: Research Institute of Obstetrics and Pediatrics, Ministry of Health of the Kyrgyz Republic, Macro International Inc.; 1998.
KGZ Kyrgyzstan 1997 1997 3.9
European Health for All Database (HFA-DB) [online database]. World Health Organization (WHO) Regional Office for Europe; 2012 (http://data.euro.who.int/hfadb, accessed 20 August 2012).
BMJ Publishing Group Limited (BMJ) disclaims all liability and responsibility arising from any relianceSupplemental material placed on this supplemental material which has been supplied by the author(s) BMJ Global Health
doi: 10.1136/bmjgh-2021-005671:e005671. 6 2021;BMJ Global Health, et al. Betran AP

149
ISO
Cod
e
Country
Coverag
e start
year
Covera
ge end
year
Caesare
an
section
rate (%)
References
KGZ Kyrgyzstan 1998 1998 3.8
European Health for All Database (HFA-DB) [online database]. World Health Organization (WHO) Regional Office for Europe; 2012 (http://data.euro.who.int/hfadb, accessed 20 August 2012).
KGZ Kyrgyzstan 1999 1999 4.0
European Health for All Database (HFA-DB) [online database]. World Health Organization (WHO) Regional Office for Europe; 2012 (http://data.euro.who.int/hfadb, accessed 20 August 2012).
KGZ Kyrgyzstan 2000 2000 3.9
European Health for All Database (HFA-DB) [online database]. World Health Organization (WHO) Regional Office for Europe; 2012 (http://data.euro.who.int/hfadb, accessed 20 August 2012).
KGZ Kyrgyzstan 2001 2001 4.1
European Health for All Database (HFA-DB) [online database]. World Health Organization (WHO) Regional Office for Europe; 2012 (http://data.euro.who.int/hfadb, accessed 20 August 2012).
KGZ Kyrgyzstan 2002 2002 4.0
European Health for All Database (HFA-DB) [online database]. World Health Organization (WHO) Regional Office for Europe; 2012 (http://data.euro.who.int/hfadb, accessed 20 August 2012).
KGZ Kyrgyzstan 2003 2003 4.2
European Health for All Database (HFA-DB) [online database]. World Health Organization (WHO) Regional Office for Europe; 2012 (http://data.euro.who.int/hfadb, accessed 20 August 2012).
KGZ Kyrgyzstan 2004 2004 5.1
European Health for All Database (HFA-DB) [online database]. World Health Organization (WHO) Regional Office for Europe; 2012 (http://data.euro.who.int/hfadb, accessed 20 August 2012).
KGZ Kyrgyzstan 2005 2005 5.1
European Health for All Database (HFA-DB) [online database]. World Health Organization (WHO) Regional Office for Europe; 2012 (http://data.euro.who.int/hfadb, accessed 20 August 2012).
BMJ Publishing Group Limited (BMJ) disclaims all liability and responsibility arising from any relianceSupplemental material placed on this supplemental material which has been supplied by the author(s) BMJ Global Health
doi: 10.1136/bmjgh-2021-005671:e005671. 6 2021;BMJ Global Health, et al. Betran AP

150
ISO
Cod
e
Country
Coverag
e start
year
Covera
ge end
year
Caesare
an
section
rate (%)
References
KGZ Kyrgyzstan 2006 2006 5.1
European Health for All Database (HFA-DB) [online database]. World Health Organization (WHO) Regional Office for Europe; 2012 (http://data.euro.who.int/hfadb, accessed 20 August 2012).
KGZ Kyrgyzstan 2007 2007 5.8
European Health for All Database (HFA-DB) [online database]. World Health Organization (WHO) Regional Office for Europe; 2012 (http://data.euro.who.int/hfadb, accessed 20 August 2012).
KGZ Kyrgyzstan 2008 2008 6.4
European Health for All Database (HFA-DB) [online database]. World Health Organization (WHO) Regional Office for Europe; 2012 (http://data.euro.who.int/hfadb, accessed 20 August 2012).
KGZ Kyrgyzstan 2009 2009 7.3
European Health for All Database (HFA-DB) [online database]. World Health Organization (WHO) Regional Office for Europe; 2012 (http://data.euro.who.int/hfadb, accessed 20 August 2012).
KGZ Kyrgyzstan 2010 2010 6.9
European Health for All Database (HFA-DB) [online database]. World Health Organization (WHO) Regional Office for Europe; 2016 (http://data.euro.who.int/hfadb, accessed 8 August 2016).
KGZ Kyrgyzstan 2011 2011 7.0
European Health for All Database (HFA-DB) [online database]. World Health Organization (WHO) Regional Office for Europe; 2016 (http://data.euro.who.int/hfadb, accessed 8 August 2016).
KGZ Kyrgyzstan 2012 2012 7.7
European Health for All Database (HFA-DB) [online database]. World Health Organization (WHO) Regional Office for Europe; 2016 (http://data.euro.who.int/hfadb, accessed 8 August 2016).
KGZ Kyrgyzstan 2014 2014 9.8
European Health for All Database (HFA-DB) [online database]. World Health Organization (WHO) Regional Office for Europe; 2016 (http://data.euro.who.int/hfadb, accessed 8 August 2016).
BMJ Publishing Group Limited (BMJ) disclaims all liability and responsibility arising from any relianceSupplemental material placed on this supplemental material which has been supplied by the author(s) BMJ Global Health
doi: 10.1136/bmjgh-2021-005671:e005671. 6 2021;BMJ Global Health, et al. Betran AP

151
ISO
Cod
e
Country
Coverag
e start
year
Covera
ge end
year
Caesare
an
section
rate (%)
References
KGZ Kyrgyzstan 2012 2014 7.4
National Statistical Committee of the Kyrgyz Republic, United Nations Children's Fund (UNICEF). Kyrgyz Republic Multiple Indicator Cluster Survey 2014, Final Report. Bishkek, Kyrgyzstan: National Statistical Committee of the Kyrgyz Republic, UNICEF; 2016.
KGZ Kyrgyzstan 2015 2015 9.4
European Health for All Database (HFA-DB) [online database]. World Health Organization (WHO) Regional Office for Europe; 2016 (http://data.euro.who.int/hfadb, accessed 8 August 2016).
KGZ Kyrgyzstan 2016 2018 8.3
Kyrgyztan Multiple Indicator Cluster Survey 2018, Survey Findings Report. Bishkek: National Statistical Committee of the Kyrgyz Republic, UNICEF; 2019.
LAO Lao People's
Democratic Republic 2006 2007 2.0
Assessment of Skilled Birth Attendance in Lao PDR. Vientiane: Ministry of Health [Lao], United Nations Population Fund (UNFPA); 2008.
LAO Lao People's
Democratic Republic 2009 2010 2.0
National Health Statistic Report FY 2009-2010. Vientiane: Ministry of Health, Department of Planning and Finance [Lao]; 2011.
LAO Lao People's
Democratic Republic 2015 2017 5.8
Lao Statistics Bureau. Lao Social Indicator Survey II 2017, Survey Findings Report. Vientiane, Lao PDR: Lao Statistics Bureau, UNICEF; 2018.
LVA Latvia 1990 1990 7.0
European Health for All Database (HFA-DB) [online database]. World Health Organization (WHO) Regional Office for Europe; 2012 (http://data.euro.who.int/hfadb, accessed 20 August 2012).
LVA Latvia 1991 1991 7.8
European Health for All Database (HFA-DB) [online database]. World Health Organization (WHO) Regional Office for Europe; 2012 (http://data.euro.who.int/hfadb, accessed 20 August 2012).
BMJ Publishing Group Limited (BMJ) disclaims all liability and responsibility arising from any relianceSupplemental material placed on this supplemental material which has been supplied by the author(s) BMJ Global Health
doi: 10.1136/bmjgh-2021-005671:e005671. 6 2021;BMJ Global Health, et al. Betran AP

152
ISO
Cod
e
Country
Coverag
e start
year
Covera
ge end
year
Caesare
an
section
rate (%)
References
LVA Latvia 1992 1992 7.5
European Health for All Database (HFA-DB) [online database]. World Health Organization (WHO) Regional Office for Europe; 2012 (http://data.euro.who.int/hfadb, accessed 20 August 2012).
LVA Latvia 1993 1993 9.0
European Health for All Database (HFA-DB) [online database]. World Health Organization (WHO) Regional Office for Europe; 2012 (http://data.euro.who.int/hfadb, accessed 20 August 2012).
LVA Latvia 1994 1994 9.4
European Health for All Database (HFA-DB) [online database]. World Health Organization (WHO) Regional Office for Europe; 2012 (http://data.euro.who.int/hfadb, accessed 20 August 2012).
LVA Latvia 1995 1995 10.4
European Health for All Database (HFA-DB) [online database]. World Health Organization (WHO) Regional Office for Europe; 2012 (http://data.euro.who.int/hfadb, accessed 20 August 2012).
LVA Latvia 1996 1996 11.5
European Health for All Database (HFA-DB) [online database]. World Health Organization (WHO) Regional Office for Europe; 2012 (http://data.euro.who.int/hfadb, accessed 20 August 2012).
LVA Latvia 1997 1997 12.3
European Health for All Database (HFA-DB) [online database]. World Health Organization (WHO) Regional Office for Europe; 2012 (http://data.euro.who.int/hfadb, accessed 20 August 2012).
LVA Latvia 1998 1998 15.8
European Health for All Database (HFA-DB) [online database]. World Health Organization (WHO) Regional Office for Europe; 2012 (http://data.euro.who.int/hfadb, accessed 20 August 2012).
LVA Latvia 1999 1999 14.2
European Health for All Database (HFA-DB) [online database]. World Health Organization (WHO) Regional Office for Europe; 2012 (http://data.euro.who.int/hfadb, accessed 20 August 2012).
BMJ Publishing Group Limited (BMJ) disclaims all liability and responsibility arising from any relianceSupplemental material placed on this supplemental material which has been supplied by the author(s) BMJ Global Health
doi: 10.1136/bmjgh-2021-005671:e005671. 6 2021;BMJ Global Health, et al. Betran AP

153
ISO
Cod
e
Country
Coverag
e start
year
Covera
ge end
year
Caesare
an
section
rate (%)
References
LVA Latvia 2000 2000 15.0
European Health for All Database (HFA-DB) [online database]. World Health Organization (WHO) Regional Office for Europe; 2012 (http://data.euro.who.int/hfadb, accessed 20 August 2012).
LVA Latvia 2001 2001 16.4
European Health for All Database (HFA-DB) [online database]. World Health Organization (WHO) Regional Office for Europe; 2012 (http://data.euro.who.int/hfadb, accessed 20 August 2012).
LVA Latvia 2002 2002 17.4
European Health for All Database (HFA-DB) [online database]. World Health Organization (WHO) Regional Office for Europe; 2012 (http://data.euro.who.int/hfadb, accessed 20 August 2012).
LVA Latvia 2003 2003 19.1
European Health for All Database (HFA-DB) [online database]. World Health Organization (WHO) Regional Office for Europe; 2012 (http://data.euro.who.int/hfadb, accessed 20 August 2012).
LVA Latvia 2004 2004 19.6
European Health for All Database (HFA-DB) [online database]. World Health Organization (WHO) Regional Office for Europe; 2012 (http://data.euro.who.int/hfadb, accessed 20 August 2012).
LVA Latvia 2005 2005 20.4
Statistical Yearbook of Health Care in Latvia 12th edition, 2010. Riga: The Centre of Health Economics [Latvia]; 2011.
LVA Latvia 2006 2006 21.1
Statistical Yearbook of Health Care in Latvia 12th edition, 2010. Riga: The Centre of Health Economics [Latvia]; 2011.
LVA Latvia 2007 2007 23.1
Statistical Yearbook of Health Care in Latvia 12th edition, 2010. Riga: The Centre of Health Economics [Latvia]; 2011.
BMJ Publishing Group Limited (BMJ) disclaims all liability and responsibility arising from any relianceSupplemental material placed on this supplemental material which has been supplied by the author(s) BMJ Global Health
doi: 10.1136/bmjgh-2021-005671:e005671. 6 2021;BMJ Global Health, et al. Betran AP

154
ISO
Cod
e
Country
Coverag
e start
year
Covera
ge end
year
Caesare
an
section
rate (%)
References
LVA Latvia 2008 2008 22.7
Statistical Yearbook of Health Care in Latvia 12th edition, 2010. Riga: The Centre of Health Economics [Latvia]; 2011.
LVA Latvia 2009 2009 23.4
Statistical Yearbook of Health Care in Latvia 12th edition, 2010. Riga: The Centre of Health Economics [Latvia]; 2011.
LVA Latvia 2010 2010 23.9
Statistical Yearbook of Health Care in Latvia 12th edition, 2010. Riga: The Centre of Health Economics [Latvia]; 2011.
LVA Latvia 2011 2011 23.6
Statistical Yearbook of Health Care in Latvia 13th edition, 2011. Riga: The Centre for Disease Prevention and Control of Latvia; 2012.
LVA Latvia 2012 2012 23.0
Statistical Yearbook of Health Care in Latvia 14th edition, 2012. Riga: The Centre for Disease Prevention and Control of Latvia; 2013.
LVA Latvia 2013 2013 20.9
European Health for All Database (HFA-DB) [online database]. World Health Organization (WHO) Regional Office for Europe; 2016 (http://data.euro.who.int/hfadb, accessed 8 August 2016).
LVA Latvia 2014 2014 19.9
European Health for All Database (HFA-DB) [online database]. World Health Organization (WHO) Regional Office for Europe; 2016 (http://data.euro.who.int/hfadb, accessed 8 August 2016).
LVA Latvia 2015 2015 21.5
Statistical Yearbook of Health Care in Latvia 17th edition, 2015. Riga: The Centre for Disease Prevention and Control of Latvia; 2016.
BMJ Publishing Group Limited (BMJ) disclaims all liability and responsibility arising from any relianceSupplemental material placed on this supplemental material which has been supplied by the author(s) BMJ Global Health
doi: 10.1136/bmjgh-2021-005671:e005671. 6 2021;BMJ Global Health, et al. Betran AP

155
ISO
Cod
e
Country
Coverag
e start
year
Covera
ge end
year
Caesare
an
section
rate (%)
References
LVA Latvia 2016 2016 21.7
Statistical Yearbook of Health Care in Latvia 18th edition, 2016. Riga: The Centre for Disease Prevention and Control of Latvia; 2017.
LVA Latvia 2017 2017 22.7
Statistical Yearbook of Health Care in Latvia 19th edition, 2017. Riga: The Centre for Disease Prevention and Control of Latvia; 2018.
LBN Lebanon 1991 1996 15.0
Lebanon Maternal and Child Health Survey - Summary Report. Beirut: Ministry of Public Health [Lebanon], League of Arab States, Pan Arab Project for Child Development; 1998.
LBN Lebanon 1999 2000 23.1
National Perinatal Survey 1999-2000. Beirut: Ministry of Public Health [Lebanon], United Nations Children's Fund (UNICEF); 2001.
LBN Lebanon 1999 2004 23.2
Lebanon Family Health Survey 2004. Principal Report. Beirut: Central Administration of Statistics [Lebanon], The Arab League, The Pan Arab Project for Family Health; 2006.
LBN Lebanon 2011 2011 46.1
Statistical Bulletin 2011. Beirut: Ministry of Public Health [Lebanon]; 2012.
LBN Lebanon 2012 2012 46.6
Statistical Bulletin 2012. Beirut: Ministry of Public Health [Lebanon]; 2013.
LBN Lebanon 2013 2013 45.6
Ministry of Public Health [Lebanon]. Statistical Bulletin 2013. Beirut: World Health Organization (WHO) Lebanon Office; 2014.
BMJ Publishing Group Limited (BMJ) disclaims all liability and responsibility arising from any relianceSupplemental material placed on this supplemental material which has been supplied by the author(s) BMJ Global Health
doi: 10.1136/bmjgh-2021-005671:e005671. 6 2021;BMJ Global Health, et al. Betran AP

156
ISO
Cod
e
Country
Coverag
e start
year
Covera
ge end
year
Caesare
an
section
rate (%)
References
LBN Lebanon 2014 2014 45.6
Ministry of Public Health [Lebanon]. Statistical Bulletin 2014. Beirut: World Health Organization (WHO) Lebanon Office; 2015.
LBN Lebanon 2015 2015 46.7
Statistical Bulletin 2015. Beirut: Ministry of Public Health [Lebanon]; 2016.
LBN Lebanon 2016 2016 47.1
Vital Data Observatory (VDO) statistics by Qada and nationality, 2016 [website]. Beirut: Ministry of Public Health [Lebanon]; 2017 (https://moph.gov.lb/en/Pages/8/327/#/en/Pages/8/14246/vital-data-observatory-statistics, accessed 30 November 2017).
LBN Lebanon 2017 2017 47.3
Vital Data Observatory (VDO) statistics by Qada and nationality, 2017 [website]. Beirut: Ministry of Public Health [Lebanon]; 2019 (https://moph.gov.lb/en/Pages/8/327/#/en/Pages/8/14246/vital-data-observatory-statistics, accessed 13 February 2019).
LBN Lebanon 2018 2018 47.8
Vital Data Observatory (VDO) statistics by Qada and nationality, 2018 [website]. Beirut: Ministry of Public Health [Lebanon]; 2020 (https://moph.gov.lb/en/Pages/8/327/#/en/Pages/8/14246/vital-data-observatory-statistics, accessed 5 March 2020).
LSO Lesotho 2003 2003 9.4
Statistical Yearbook 2010 Kingdom of Lesotho. Statistical Reports No 12:2009. Maseru: Bureau of Statistics [Lesotho]; 2010.
LSO Lesotho 1999 2004 5.1
Ministry of Health and Social Welfare (MOHSW) [Lesotho], Bureau of Statistics (BOS) [Lesotho], ORC Macro. Lesotho Demographic and Health Survey 2004. Calverton, Maryland: MOH, BOS, ORC Macro; 2005.
LSO Lesotho 2004 2004 9.5
Statistical Yearbook 2010 Kingdom of Lesotho. Statistical Reports No 12:2009. Maseru: Bureau of Statistics [Lesotho]; 2010.
BMJ Publishing Group Limited (BMJ) disclaims all liability and responsibility arising from any relianceSupplemental material placed on this supplemental material which has been supplied by the author(s) BMJ Global Health
doi: 10.1136/bmjgh-2021-005671:e005671. 6 2021;BMJ Global Health, et al. Betran AP

157
ISO
Cod
e
Country
Coverag
e start
year
Covera
ge end
year
Caesare
an
section
rate (%)
References
LSO Lesotho 2005 2005 9.0
Statistical Yearbook 2010 Kingdom of Lesotho. Statistical Reports No 12:2009. Maseru: Bureau of Statistics [Lesotho]; 2010.
LSO Lesotho 2004 2009 6.7
Ministry of Health and Social Welfare (MOHSW) [Lesotho], ICF Macro. Lesotho Demographic and Health Survey 2009. Maseru, Lesotho: MOHSW, ICF Macro; 2010.
LSO Lesotho 2009 2014 9.7
Ministry of Health [Lesotho], ICF International. Lesotho Demographic and Health Survey 2014. Maseru, Lesotho: Ministry of Health, ICF International; 2016.
LSO Lesotho 2016 2018 17.4
Lesotho Multiple Indicator Cluster Survey 2018, Survey Findings Report. Maseru: Bureau of Statistics [Lesotho]; 2019.
LBR Liberia 2002 2007 3.5
Liberia Institute of Statistics and Geo-Information Services (LISGIS) [Liberia], Ministry of Health and Social Welfare [Liberia], National AIDS Control Program [Liberia], Macro International Inc. Liberia Demographic and Health Survey 2007. Monrovia, Liberia: Liberia Institute of Statistics and Geo-Information Services (LISGIS), Macro International Inc.; 2008.
LBR Liberia 2008 2013 3.9
Liberia Institute of Statistics and Geo-Information Services (LISGIS), Ministry of Health and Social Welfare [Liberia], National AIDS Control Program [Liberia], ICF International. Liberia Demographic and Health Survey 2013. Monrovia, Liberia: Liberia Institute of Statistics and Geo- Information Services (LISGIS), ICF International; 2014.
LTU Lithuania 1992 1992 8.3
European Health for All Database (HFA-DB) [online database]. World Health Organization (WHO) Regional Office for Europe; 2012 (http://data.euro.who.int/hfadb, accessed 20 August 2012).
LTU Lithuania 1993 1993 9.3
European Health for All Database (HFA-DB) [online database]. World Health Organization (WHO) Regional Office for Europe; 2012 (http://data.euro.who.int/hfadb, accessed 20 August 2012).
BMJ Publishing Group Limited (BMJ) disclaims all liability and responsibility arising from any relianceSupplemental material placed on this supplemental material which has been supplied by the author(s) BMJ Global Health
doi: 10.1136/bmjgh-2021-005671:e005671. 6 2021;BMJ Global Health, et al. Betran AP
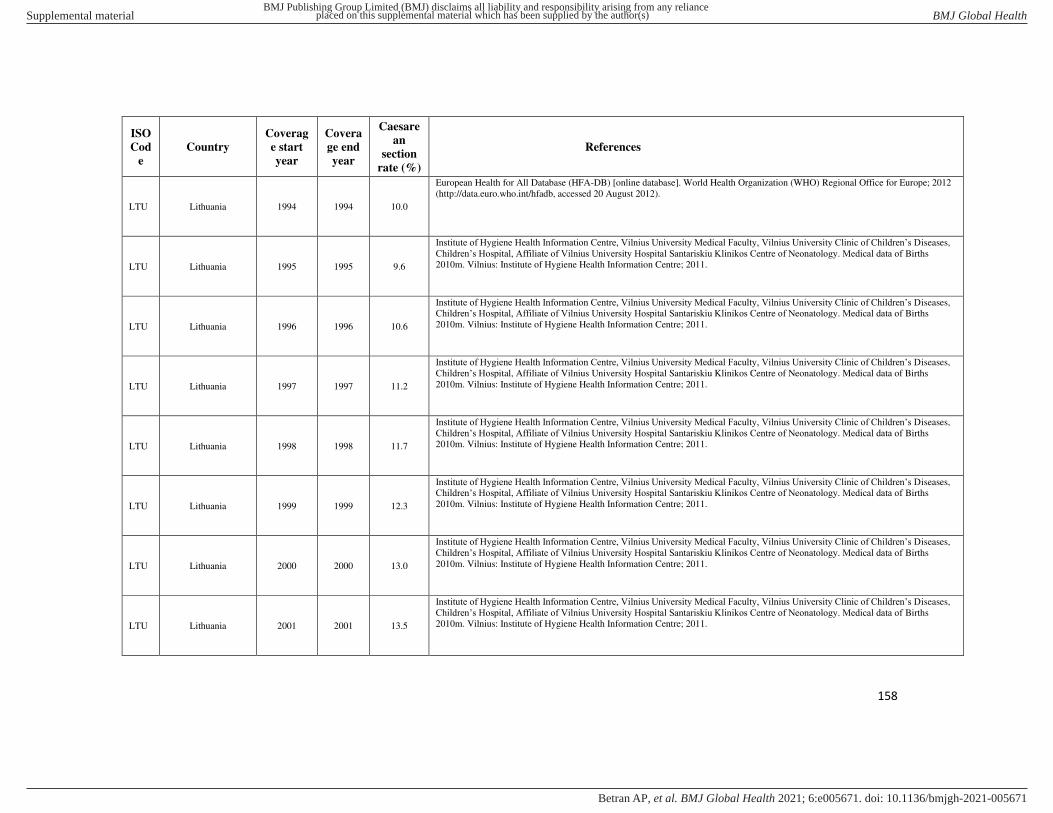
158
ISO
Cod
e
Country
Coverag
e start
year
Covera
ge end
year
Caesare
an
section
rate (%)
References
LTU Lithuania 1994 1994 10.0
European Health for All Database (HFA-DB) [online database]. World Health Organization (WHO) Regional Office for Europe; 2012 (http://data.euro.who.int/hfadb, accessed 20 August 2012).
LTU Lithuania 1995 1995 9.6
Institute of Hygiene Health Information Centre, Vilnius University Medical Faculty, Vilnius University Clinic of Children’s Diseases, Children’s Hospital, Affiliate of Vilnius University Hospital Santariskiu Klinikos Centre of Neonatology. Medical data of Births 2010m. Vilnius: Institute of Hygiene Health Information Centre; 2011.
LTU Lithuania 1996 1996 10.6
Institute of Hygiene Health Information Centre, Vilnius University Medical Faculty, Vilnius University Clinic of Children’s Diseases, Children’s Hospital, Affiliate of Vilnius University Hospital Santariskiu Klinikos Centre of Neonatology. Medical data of Births 2010m. Vilnius: Institute of Hygiene Health Information Centre; 2011.
LTU Lithuania 1997 1997 11.2
Institute of Hygiene Health Information Centre, Vilnius University Medical Faculty, Vilnius University Clinic of Children’s Diseases, Children’s Hospital, Affiliate of Vilnius University Hospital Santariskiu Klinikos Centre of Neonatology. Medical data of Births 2010m. Vilnius: Institute of Hygiene Health Information Centre; 2011.
LTU Lithuania 1998 1998 11.7
Institute of Hygiene Health Information Centre, Vilnius University Medical Faculty, Vilnius University Clinic of Children’s Diseases, Children’s Hospital, Affiliate of Vilnius University Hospital Santariskiu Klinikos Centre of Neonatology. Medical data of Births 2010m. Vilnius: Institute of Hygiene Health Information Centre; 2011.
LTU Lithuania 1999 1999 12.3
Institute of Hygiene Health Information Centre, Vilnius University Medical Faculty, Vilnius University Clinic of Children’s Diseases, Children’s Hospital, Affiliate of Vilnius University Hospital Santariskiu Klinikos Centre of Neonatology. Medical data of Births 2010m. Vilnius: Institute of Hygiene Health Information Centre; 2011.
LTU Lithuania 2000 2000 13.0
Institute of Hygiene Health Information Centre, Vilnius University Medical Faculty, Vilnius University Clinic of Children’s Diseases, Children’s Hospital, Affiliate of Vilnius University Hospital Santariskiu Klinikos Centre of Neonatology. Medical data of Births 2010m. Vilnius: Institute of Hygiene Health Information Centre; 2011.
LTU Lithuania 2001 2001 13.5
Institute of Hygiene Health Information Centre, Vilnius University Medical Faculty, Vilnius University Clinic of Children’s Diseases, Children’s Hospital, Affiliate of Vilnius University Hospital Santariskiu Klinikos Centre of Neonatology. Medical data of Births 2010m. Vilnius: Institute of Hygiene Health Information Centre; 2011.
BMJ Publishing Group Limited (BMJ) disclaims all liability and responsibility arising from any relianceSupplemental material placed on this supplemental material which has been supplied by the author(s) BMJ Global Health
doi: 10.1136/bmjgh-2021-005671:e005671. 6 2021;BMJ Global Health, et al. Betran AP

159
ISO
Cod
e
Country
Coverag
e start
year
Covera
ge end
year
Caesare
an
section
rate (%)
References
LTU Lithuania 2002 2002 15.3
Institute of Hygiene Health Information Centre, Vilnius University Medical Faculty, Vilnius University Clinic of Children’s Diseases, Children’s Hospital, Affiliate of Vilnius University Hospital Santariskiu Klinikos Centre of Neonatology. Medical data of Births 2010m. Vilnius: Institute of Hygiene Health Information Centre; 2011.
LTU Lithuania 2003 2003 15.2
Institute of Hygiene Health Information Centre, Vilnius University Medical Faculty, Vilnius University Clinic of Children’s Diseases, Children’s Hospital, Affiliate of Vilnius University Hospital Santariskiu Klinikos Centre of Neonatology. Medical data of Births 2010m. Vilnius: Institute of Hygiene Health Information Centre; 2011.
LTU Lithuania 2004 2004 17.3
Institute of Hygiene Health Information Centre, Vilnius University Medical Faculty, Vilnius University Clinic of Children’s Diseases, Children’s Hospital, Affiliate of Vilnius University Hospital Santariskiu Klinikos Centre of Neonatology. Medical data of Births 2010m. Vilnius: Institute of Hygiene Health Information Centre; 2011.
LTU Lithuania 2005 2005 19.1
Institute of Hygiene Health Information Centre, Vilnius University Medical Faculty, Vilnius University Clinic of Children’s Diseases, Children’s Hospital, Affiliate of Vilnius University Hospital Santariskiu Klinikos Centre of Neonatology. Medical data of Births 2010m. Vilnius: Institute of Hygiene Health Information Centre; 2011.
LTU Lithuania 2006 2006 20.9
Institute of Hygiene Health Information Centre, Vilnius University Medical Faculty, Vilnius University Clinic of Children’s Diseases, Children’s Hospital, Affiliate of Vilnius University Hospital Santariskiu Klinikos Centre of Neonatology. Medical data of Births 2010m. Vilnius: Institute of Hygiene Health Information Centre; 2011.
LTU Lithuania 2007 2007 22.9
Institute of Hygiene Health Information Centre, Vilnius University Medical Faculty, Vilnius University Clinic of Children’s Diseases, Children’s Hospital, Affiliate of Vilnius University Hospital Santariskiu Klinikos Centre of Neonatology. Medical data of Births 2010m. Vilnius: Institute of Hygiene Health Information Centre; 2011.
LTU Lithuania 2008 2008 23.8
Institute of Hygiene Health Information Centre, Vilnius University Medical Faculty, Vilnius University Clinic of Children’s Diseases, Children’s Hospital, Affiliate of Vilnius University Hospital Santariskiu Klinikos Centre of Neonatology. Medical data of Births 2010m. Vilnius: Institute of Hygiene Health Information Centre; 2011.
LTU Lithuania 2009 2009 24.4
Institute of Hygiene Health Information Centre, Vilnius University Medical Faculty, Vilnius University Clinic of Children’s Diseases, Children’s Hospital, Affiliate of Vilnius University Hospital Santariskiu Klinikos Centre of Neonatology. Medical data of Births 2010m. Vilnius: Institute of Hygiene Health Information Centre; 2011.
BMJ Publishing Group Limited (BMJ) disclaims all liability and responsibility arising from any relianceSupplemental material placed on this supplemental material which has been supplied by the author(s) BMJ Global Health
doi: 10.1136/bmjgh-2021-005671:e005671. 6 2021;BMJ Global Health, et al. Betran AP

160
ISO
Cod
e
Country
Coverag
e start
year
Covera
ge end
year
Caesare
an
section
rate (%)
References
LTU Lithuania 2010 2010 25.2
Institute of Hygiene Health Information Centre, Vilnius University Medical Faculty, Vilnius University Clinic of Children’s Diseases, Children’s Hospital, Affiliate of Vilnius University Hospital Santariskiu Klinikos Centre of Neonatology. Medical data of Births 2010m. Vilnius: Institute of Hygiene Health Information Centre; 2011.
LTU Lithuania 2011 2011 25.0
Institute of Hygiene Health Information Centre, Vilnius University Medical Faculty, Vilnius University Clinic of Children’s Diseases, Children’s Hospital, Affiliate of Vilnius University Hospital Santariskiu Klinikos Centre of Neonatology. Medical data of Births 2011 m. Vilnius: Institute of Hygiene Health Information Centre; 2012.
LTU Lithuania 2012 2012 26.5
Institute of Hygiene Health Information Centre, Vilnius University Medical Faculty, Vilnius University, Center of Neonatology. Medical data of Births 2012 m. Vilnius: Institute of Hygiene Health Information Centre; 2013.
LTU Lithuania 2013 2013 25.7
Institute of Hygiene Health Information Centre, Vilnius University Medical Faculty, Vilnius University, Center of Neonatology. Medical data of Births 2013 m. Vilnius: Institute of Hygiene Health Information Centre; 2014.
LTU Lithuania 2014 2014 22.0
Institute of Hygiene Health Information Centre, Vilnius University Medical Faculty, Vilnius University, Center of Neonatology. Medical data of Births 2014 m. Vilnius: Institute of Hygiene Health Information Centre; 2015.
LTU Lithuania 2015 2015 21.9
Institute of Hygiene Health Information Centre, Vilnius University Medical Faculty, Vilnius University, Center of Neonatology. Medical data of Births 2015 m. Vilnius: Institute of Hygiene Health Information Centre; 2016.
LTU Lithuania 2016 2016 20.6
Medical data of Births 2016. Vilnius: Institute of Hygiene Health Information Centre, Vilnius University Medical Faculty, Vilnius University, Center of Neonatology; 2017.
LTU Lithuania 2017 2017 20.2
Medical data of Births 2017. Vilnius: Institute of Hygiene Health Information Centre, Vilnius University Medical Faculty, Vilnius University, Center of Neonatology; 2018.
BMJ Publishing Group Limited (BMJ) disclaims all liability and responsibility arising from any relianceSupplemental material placed on this supplemental material which has been supplied by the author(s) BMJ Global Health
doi: 10.1136/bmjgh-2021-005671:e005671. 6 2021;BMJ Global Health, et al. Betran AP

161
ISO
Cod
e
Country
Coverag
e start
year
Covera
ge end
year
Caesare
an
section
rate (%)
References
LUX Luxembourg 1997 1997 18.1
European Health for All Database (HFA-DB) [online database]. World Health Organization (WHO) Regional Office for Europe; 2012 (http://data.euro.who.int/hfadb, accessed 20 August 2012).
LUX Luxembourg 1998 1998 17.7
European Health for All Database (HFA-DB) [online database]. World Health Organization (WHO) Regional Office for Europe; 2012 (http://data.euro.who.int/hfadb, accessed 20 August 2012).
LUX Luxembourg 1999 1999 18.9
European Health for All Database (HFA-DB) [online database]. World Health Organization (WHO) Regional Office for Europe; 2012 (http://data.euro.who.int/hfadb, accessed 20 August 2012).
LUX Luxembourg 2000 2000 19.8
European Health for All Database (HFA-DB) [online database]. World Health Organization (WHO) Regional Office for Europe; 2012 (http://data.euro.who.int/hfadb, accessed 20 August 2012).
LUX Luxembourg 2001 2001 22.0
European Health for All Database (HFA-DB) [online database]. World Health Organization (WHO) Regional Office for Europe; 2012 (http://data.euro.who.int/hfadb, accessed 20 August 2012).
LUX Luxembourg 2002 2002 23.3
European Health for All Database (HFA-DB) [online database]. World Health Organization (WHO) Regional Office for Europe; 2012 (http://data.euro.who.int/hfadb, accessed 20 August 2012).
LUX Luxembourg 2004 2004 24.0
European Health for All Database (HFA-DB) [online database]. World Health Organization (WHO) Regional Office for Europe; 2012 (http://data.euro.who.int/hfadb, accessed 20 August 2012).
LUX Luxembourg 2007 2007 29.2
Indications de la césarienne programmée à terme au Luxembourg – Version longue (Version 1.0). Luxembourg: Secrétariat du Conseil Scientifique; 2014 (in French).
BMJ Publishing Group Limited (BMJ) disclaims all liability and responsibility arising from any relianceSupplemental material placed on this supplemental material which has been supplied by the author(s) BMJ Global Health
doi: 10.1136/bmjgh-2021-005671:e005671. 6 2021;BMJ Global Health, et al. Betran AP

162
ISO
Cod
e
Country
Coverag
e start
year
Covera
ge end
year
Caesare
an
section
rate (%)
References
LUX Luxembourg 2008 2008 29.9
Indications de la césarienne programmée à terme au Luxembourg – Version longue (Version 1.0). Luxembourg: Secrétariat du Conseil Scientifique; 2014 (in French).
LUX Luxembourg 2009 2009 28.9
Indications de la césarienne programmée à terme au Luxembourg – Version longue (Version 1.0). Luxembourg: Secrétariat du Conseil Scientifique; 2014 (in French).
LUX Luxembourg 2010 2010 29.1
Indications de la césarienne programmée à terme au Luxembourg – Version longue (Version 1.0). Luxembourg: Secrétariat du Conseil Scientifique; 2014 (in French).
LUX Luxembourg 2011 2011 31.0
Surveillance de la santé périnatale au Luxembourg. Évolution de 2001 à 2011. Luxembourg: Ministère de la Santé – Centre de Recherche Public de la Santé [Luxembourg]; 2013 (in French).
LUX Luxembourg 2012 2012 30.8
Surveillance de la santé périnatale au Luxembourg. 2011 – 2012 – 2013. Luxembourg: Ministère de la Santé [Luxembourg], Luxembourg Institute of Health; 2016 (in French).
LUX Luxembourg 2013 2013 30.5
Surveillance de la santé périnatale au Luxembourg. 2011 – 2012 – 2013. Luxembourg: Ministère de la Santé [Luxembourg], Luxembourg Institute of Health; 2016 (in French).
LUX Luxembourg 2014 2014 28.8
European Health Information Gateway. European Health for All database (HFA-DB). Caesarean sections per 1000 live births [online database]. World Health Organization (WHO) Regional Office for Europe; 2018 (https://gateway.euro.who.int/en/indicators/hfa_596-7060-caesarean-sections-per-1000-live-births/, accessed 14 February 2019).
LUX Luxembourg 2015 2015 32.7
European Perinatal Health Report. Core indicators of the health and care of pregnant women and babies in Europe in 2015. Euro-Peristat Project; 2018.
BMJ Publishing Group Limited (BMJ) disclaims all liability and responsibility arising from any relianceSupplemental material placed on this supplemental material which has been supplied by the author(s) BMJ Global Health
doi: 10.1136/bmjgh-2021-005671:e005671. 6 2021;BMJ Global Health, et al. Betran AP

163
ISO
Cod
e
Country
Coverag
e start
year
Covera
ge end
year
Caesare
an
section
rate (%)
References
MDG Madagascar 1987 1992 1.0
Refeno G, Rabeza V, Mboup G, Schoemaker J (Centre National de Recherches sur l'Environnement [Madagascar], Macro International). Madagascar Enquête Nationale Démographique et Sanitaire 1992. Calverton, Maryland, USA: Centre National de Recherches sur l'Environnement [Madagascar], Macro International; 1994 (in French).
MDG Madagascar 1992 1997 0.6
Direction de la Démographie et des Statistiques Sociales, Institut National de la Statistique (INSTAT) [Madagascar], Macro International Inc. Enquête Démographique et de Santé, Madagascar 1997. Calverton, Maryland, USA: INSTAT, Macro International Inc.; 1998 (in French).
MDG Madagascar 1998 2004 1.0
Institut National de la Statistique (INSTAT), ORC Macro. Enquête Démographique et de Santé de Madagascar 2003-2004. Calverton, Maryland, USA: INSTAT, ORC Macro; 2005 (in French).
MDG Madagascar 2003 2009 1.5
Institut National de la Statistique (INSTAT), ICF Macro. Enquête Démographique et de Santé de Madagascar 2008-2009. Antananarivo, Madagascar: INSTAT, ICF Macro; 2010 (in French).
MDG Madagascar 2007 2013 1.9
L’Enquête Nationale sur le Suivi des Objectifs du Millénaire pour le Développement à Madagascar 2012-2013 (ENSOMD). Madagascar: l’Institut National de la Statistique [Madagascar], l’Office National de Nutrition (ONN), Fonds des Nations Unies pour l'Enfance (UNICEF), Fonds des Nations Unies pour la Population (FNUAP/UNFPA), Programme des Nations Unies pour le développement (PNUD/UNDP); 2014 (in French).
MDG Madagascar 2016 2018 2.0
Enquête A Indicateurs Multiples MICS 2018, Snapshot. Madagascar: Institut National De La Statistique (INSTAT) [Madagascar], Fonds des Nations Unies pour l'Enfance (UNICEF); 2019 (in French).
MWI Malawi 1987 1992 3.4
National Statistical Office, Macro International Inc. Malawi Demographic and Health Survey 1992. Calverton, Maryland USA: Macro International Inc.; 1994.
MWI Malawi 1995 2000 2.8
National Statistical Office [Malawi], ORC Macro. Malawi Demographic and Health Survey 2000. Zomba, Malawi, Calverton, Maryland, USA: National Statistical Office, ORC Macro; 2001.
BMJ Publishing Group Limited (BMJ) disclaims all liability and responsibility arising from any relianceSupplemental material placed on this supplemental material which has been supplied by the author(s) BMJ Global Health
doi: 10.1136/bmjgh-2021-005671:e005671. 6 2021;BMJ Global Health, et al. Betran AP

164
ISO
Cod
e
Country
Coverag
e start
year
Covera
ge end
year
Caesare
an
section
rate (%)
References
MWI Malawi 1999 2004 3.1
National Statistical Office (NSO) [Malawi], ORC Macro. Malawi Demographic and Health Survey 2004. Calverton, Maryland, USA: NSO, ORC Macro; 2005.
MWI Malawi 2005 2010 4.6
National Statistical Office (NSO), ICF Macro. Malawi Demographic and Health Survey 2010. Zomba, Malawi, Calverton, Maryland, USA: NSO, ICF Macro; 2011.
MWI Malawi 2011 2014 5.1
National Statistical Office, United Nations Children’s Fund (UNICEF). Malawi MDG Endline Survey 2014. Zomba, Malawi: National Statistical Office, United Nations Children’s Fund (UNICEF); 2015.
MWI Malawi 2010 2016 6.1
National Statistical Office (NSO) [Malawi], ICF. Malawi Demographic and Health Survey 2015-16. Zomba, Malawi: NSO, ICF; 2017.
MYS Malaysia 2000 2000 10.5
Ravindran J. Rising Caesarean Section Rates in Public Hospitals in Malaysia 2006. Med J Malaysia. 2008;63(5):434-5.
MYS Malaysia 2001 2001 11.1
Ravindran J. Rising Caesarean Section Rates in Public Hospitals in Malaysia 2006. Med J Malaysia. 2008;63(5):434-5.
MYS Malaysia 2006 2006 15.7
Ravindran J. Rising Caesarean Section Rates in Public Hospitals in Malaysia 2006. Med J Malaysia. 2008;63(5):434-5.
MDV Maldives 2008 2008 34.1
The Maldives Health Statistics 2011. Male': Ministry of Health and Family [Republic of Maldives]; 2012.
BMJ Publishing Group Limited (BMJ) disclaims all liability and responsibility arising from any relianceSupplemental material placed on this supplemental material which has been supplied by the author(s) BMJ Global Health
doi: 10.1136/bmjgh-2021-005671:e005671. 6 2021;BMJ Global Health, et al. Betran AP

165
ISO
Cod
e
Country
Coverag
e start
year
Covera
ge end
year
Caesare
an
section
rate (%)
References
MDV Maldives 2004 2009 32.4
Ministry of Health and Family (MOHF) [Maldives], ICF Macro. Maldives Demographic and Health Survey 2009. Calverton, Maryland: MOHF, ICF Macro; 2010.
MDV Maldives 2009 2009 36.7
The Maldives Health Statistics 2011. Male': Ministry of Health and Family [Republic of Maldives]; 2012.
MDV Maldives 2010 2010 26.6
The Maldives Health Statistics 2011. Male': Ministry of Health and Family [Republic of Maldives]; 2012.
MDV Maldives 2011 2011 41.1
The Maldives Health Statistics 2012. Male': Ministry of Health [Republic of Maldives]; 2013.
MDV Maldives 2012 2012 40.8
The Maldives Health Statistics 2013. Male': Ministry of Health [Republic of Maldives]; 2014.
MDV Maldives 2011 2017 40.0
Maldives Demographic and Health Survey 2016-2017. Malé, Rockville, Maryland: Ministry of Health (MOH) [Maldives], ICF; 208.
MLI Mali 1992 1996 0.8
Coulibaly S, Dicko F, Traoré SM, Sidibé O, Seroussi M, Barrère B (Cellule de Planification et de Statistique du Ministère de la Santé, Direction Nationale de la Statistique et de l'Informatique, Macro International Inc.). Enquête Démographique et de Santé, Mali 1995-1996. Calverton, Maryland, USA: Cellule de Planification et de Statistique du Ministère de la Santé, Direction Nationale de la Statistique et de l'Informatique, Macro International Inc.; 1996 (in French).
MLI Mali 1996 2001 1.1
Cellule de Planification et de Statistique du Ministère de la Santé (CPS/MS), Direction Nationale de la Statistique et de l'Informatique (DNSI), ORC Macro. Enquête Démographique et de Santé au Mali 2001. Calverton, Maryland, USA: CPS/MS, DNSI, ORC Macro; 2002 (in French).
BMJ Publishing Group Limited (BMJ) disclaims all liability and responsibility arising from any relianceSupplemental material placed on this supplemental material which has been supplied by the author(s) BMJ Global Health
doi: 10.1136/bmjgh-2021-005671:e005671. 6 2021;BMJ Global Health, et al. Betran AP

166
ISO
Cod
e
Country
Coverag
e start
year
Covera
ge end
year
Caesare
an
section
rate (%)
References
MLI Mali 2001 2006 1.6
Cellule de Planification et de Statistique du Ministère de la Santé (CPS/MS), Direction Nationale de la Statistique et de l’Informatique du Ministère de l’Économie, de l’Industrie et du Commerce (DNSI/MEIC), Macro International Inc. Enquête Démographique et de Santé du Mali 2006. Calverton, Maryland, USA: CPS/DNSI, Macro International Inc.; 2007 (in French).
MLI Mali 2007 2013 2.7
Cellule de Planification et de Statistique (CPS/SSDSPF), Institut National de la Statistique (INSTAT/MPATP), INFO-STAT, ICF International. Enquête Démographique et de Santé au Mali 2012-2013. Rockville, Maryland, USA: CPS, INSTAT, INFO-STAT, ICF International; 2014 (in French).
MLI Mali 2013 2015 2.0
Institut national de la statistique (INSTAT), Fonds des Nations Unies pour l’enfance (UNICEF). Enquête par grappes à indicateurs multiples au Mali (MICS-Mali), 2015, Rapport final. Bamako, Mali: INSTAT; 2016 (in French).
MLI Mali 2013 2018 2.5
Sixième Enquête Démographique et de Santé au Mali 2018. Bamako, Rockville, Maryland: Institut National de la Statistique (INSTAT), Cellule de Planification et de Statistique Secteur Santé-Développement Social et Promotion de la Famille (CPS/SS-DS-PF), ICF; 2019.
MLT Malta 1995 1995 16.4
National Obstetric Information System (NOIS). National Birth Statistics in Review: 1995 to 2001. NOIS Annual Report – 2001. Malta: Department of Health Information (DHI); 2002.
MLT Malta 1996 1996 17.0
National Obstetric Information System (NOIS). National Birth Statistics in Review: 1995 to 2001. NOIS Annual Report – 2001. Malta: Department of Health Information (DHI); 2002.
MLT Malta 1997 1997 19.0
National Obstetric Information System (NOIS). National Birth Statistics in Review: 1995 to 2001. NOIS Annual Report – 2001. Malta: Department of Health Information (DHI); 2002.
MLT Malta 1998 1998 21.0
National Obstetric Information System (NOIS). National Birth Statistics in Review: 1995 to 2001. NOIS Annual Report – 2001. Malta: Department of Health Information (DHI); 2002.
BMJ Publishing Group Limited (BMJ) disclaims all liability and responsibility arising from any relianceSupplemental material placed on this supplemental material which has been supplied by the author(s) BMJ Global Health
doi: 10.1136/bmjgh-2021-005671:e005671. 6 2021;BMJ Global Health, et al. Betran AP

167
ISO
Cod
e
Country
Coverag
e start
year
Covera
ge end
year
Caesare
an
section
rate (%)
References
MLT Malta 1999 1999 22.1
National Obstetric Information System (NOIS). Annual Report – 2008. Malta: Department of Health Information and Research (DHIR); 2009.
MLT Malta 2000 2000 23.1
National Obstetric Information System (NOIS). Annual Report – 2008. Malta: Department of Health Information and Research (DHIR); 2009.
MLT Malta 2001 2001 23.6
National Obstetric Information System (NOIS). Annual Report – 2008. Malta: Department of Health Information and Research (DHIR); 2009.
MLT Malta 2002 2002 23.6
National Obstetric Information System (NOIS). Annual Report – 2008. Malta: Department of Health Information and Research (DHIR); 2009.
MLT Malta 2003 2003 26.0
National Obstetric Information System (NOIS). Annual Report – 2008. Malta: Department of Health Information and Research (DHIR); 2009.
MLT Malta 2004 2004 27.3
National Obstetric Information System (NOIS). Annual Report – 2008. Malta: Department of Health Information and Research (DHIR); 2009.
MLT Malta 2005 2005 30.6
National Obstetric Information System (NOIS). Annual Report – 2008. Malta: Department of Health Information and Research (DHIR); 2009.
MLT Malta 2006 2006 34.8
National Obstetric Information System (NOIS). Annual Report – 2008. Malta: Department of Health Information and Research (DHIR); 2009.
BMJ Publishing Group Limited (BMJ) disclaims all liability and responsibility arising from any relianceSupplemental material placed on this supplemental material which has been supplied by the author(s) BMJ Global Health
doi: 10.1136/bmjgh-2021-005671:e005671. 6 2021;BMJ Global Health, et al. Betran AP

168
ISO
Cod
e
Country
Coverag
e start
year
Covera
ge end
year
Caesare
an
section
rate (%)
References
MLT Malta 2007 2007 32.3
National Obstetric Information System (NOIS). Annual Report – 2008. Malta: Department of Health Information and Research (DHIR); 2009.
MLT Malta 2008 2008 30.4
National Obstetric Information System (NOIS). Annual Report – 2008. Malta: Department of Health Information and Research (DHIR); 2009.
MLT Malta 2009 2009 29.0
National Obstetric Information System (NOIS). Annual Report – 2009. Malta: Department of Health Information and Research (DHIR); 2010.
MLT Malta 2010 2010 31.7
National Obstetric Information System (NOIS). Annual Report – 2010. Malta: Department of Health Information and Research (DHIR); 2011.
MLT Malta 2011 2011 34.0
National Obstetric Information System (NOIS). Annual Report – 2011. Malta: Department of Health Information and Research (DHIR); 2012.
MLT Malta 2012 2012 33.7
National Obstetric Information System (NOIS). Annual Report – 2012. Malta: Department of Health Information and Research (DHIR); 2013.
MLT Malta 2013 2013 31.2
National Obstetric Information System (NOIS). Annual Report – 2013. Malta: Directorate for Health Information and Research (DHIR); 2014.
MLT Malta 2014 2014 32.0
National Obstetric Information System (NOIS). Annual Report – 2014. Malta: Directorate for Health Information and Research (DHIR); 2015.
BMJ Publishing Group Limited (BMJ) disclaims all liability and responsibility arising from any relianceSupplemental material placed on this supplemental material which has been supplied by the author(s) BMJ Global Health
doi: 10.1136/bmjgh-2021-005671:e005671. 6 2021;BMJ Global Health, et al. Betran AP

169
ISO
Cod
e
Country
Coverag
e start
year
Covera
ge end
year
Caesare
an
section
rate (%)
References
MLT Malta 2015 2015 31.0
National Obstetric Information System (NOIS). Annual Report – 2016. Malta: Directorate for Health Information and Research (DHIR); 2017.
MLT Malta 2016 2016 30.7
National Obstetric Information System (NOIS). Annual Report – 2016. Malta: Directorate for Health Information and Research (DHIR); 2017.
MLT Malta 2017 2017 30.9
National Obstetric Information System (NOIS). Annual Report – 2017. Malta: Directorate for Health Information and Research (DHIR); 2018.
MHL Marshall Islands 2002 2007 9.3
Economic Policy, Planning and Statistics Office (EPPSO) [Marshall Islands], Secretariat of the Pacific Community (SPC), Macro International Inc. Republic of the Marshall Islands Demographic and Health Survey 2007. Noumea: SPC; 2008.
MHL Marshall Islands 2015 2017 9.7
Republic of the Marshall Islands Ministry of Health and Human Services, RMI Economic, Policy Planning and Statistics Office, UNICEF. Republic of the Marshall Islands Integrated Child Health and Nutrition Survey 2017, Final Report. Majuro: Republic of the Marshall Islands Ministry of Health and Human Services, RMI Economic, Policy Planning and Statistics Office; 2017.
MRT Mauritania 1995 2001 3.2
Office National de la Statistique (ONS) [Mauritanie],ORC Macro. Enquête Démographique et de Santé Mauritanie 2000-2001. Calverton, Maryland, USA: ONS, ORC Macro; 2001 (in French).
MRT Mauritania 2009 2011 9.6
Mauritanie Enquête Par Grappes À Indicateurs Multiples MICS 2011. Rapport Final. Nouakchott: Office National De La Statistique [Mauritanie], Fonds des Nations unies pour l’enfance (UNICEF), Fonds des Nations Unies pour la Population (FNUAP/UNFPA); 2014 (in French).
MRT Mauritania 2013 2015 4.9
Mauritanie Enquête Par Grappes À Indicateurs Multiples MICS 2015. Rapport Final. Nouakchott: Ministère De l’Économie et des Finances, Office National De La Statistique [Mauritanie], Fonds des Nations unies pour l’enfance (UNICEF); 2017 (in French).
BMJ Publishing Group Limited (BMJ) disclaims all liability and responsibility arising from any relianceSupplemental material placed on this supplemental material which has been supplied by the author(s) BMJ Global Health
doi: 10.1136/bmjgh-2021-005671:e005671. 6 2021;BMJ Global Health, et al. Betran AP

170
ISO
Cod
e
Country
Coverag
e start
year
Covera
ge end
year
Caesare
an
section
rate (%)
References
MUS Mauritius 1990 1990 12.8
2000 Housing and Population Census - Republic of Mauritius. Analysis Report. Volume VI – Health and Quality of Life, Morbidity and Mortality. Port Louis: Central Statistics Office, Ministry of Finance and Economic Development; 2004.
MUS Mauritius 1991 1991 13.9
2000 Housing and Population Census - Republic of Mauritius. Analysis Report. Volume VI – Health and Quality of Life, Morbidity and Mortality. Port Louis: Central Statistics Office, Ministry of Finance and Economic Development; 2004.
MUS Mauritius 1992 1992 17.0
2000 Housing and Population Census - Republic of Mauritius. Analysis Report. Volume VI – Health and Quality of Life, Morbidity and Mortality. Port Louis: Central Statistics Office, Ministry of Finance and Economic Development; 2004.
MUS Mauritius 1993 1993 17.4
2000 Housing and Population Census - Republic of Mauritius. Analysis Report. Volume VI – Health and Quality of Life, Morbidity and Mortality. Port Louis: Central Statistics Office, Ministry of Finance and Economic Development; 2004.
MUS Mauritius 1994 1994 18.3
2000 Housing and Population Census - Republic of Mauritius. Analysis Report. Volume VI – Health and Quality of Life, Morbidity and Mortality. Port Louis: Central Statistics Office, Ministry of Finance and Economic Development; 2004.
MUS Mauritius 1995 1995 20.1
2000 Housing and Population Census - Republic of Mauritius. Analysis Report. Volume VI – Health and Quality of Life, Morbidity and Mortality. Port Louis: Central Statistics Office, Ministry of Finance and Economic Development; 2004.
MUS Mauritius 1996 1996 20.5
2000 Housing and Population Census - Republic of Mauritius. Analysis Report. Volume VI – Health and Quality of Life, Morbidity and Mortality. Port Louis: Central Statistics Office, Ministry of Finance and Economic Development; 2004.
MUS Mauritius 1997 1997 22.4
2000 Housing and Population Census - Republic of Mauritius. Analysis Report. Volume VI – Health and Quality of Life, Morbidity and Mortality. Port Louis: Central Statistics Office, Ministry of Finance and Economic Development; 2004.
BMJ Publishing Group Limited (BMJ) disclaims all liability and responsibility arising from any relianceSupplemental material placed on this supplemental material which has been supplied by the author(s) BMJ Global Health
doi: 10.1136/bmjgh-2021-005671:e005671. 6 2021;BMJ Global Health, et al. Betran AP

171
ISO
Cod
e
Country
Coverag
e start
year
Covera
ge end
year
Caesare
an
section
rate (%)
References
MUS Mauritius 1998 1998 22.7
2000 Housing and Population Census - Republic of Mauritius. Analysis Report. Volume VI – Health and Quality of Life, Morbidity and Mortality. Port Louis: Central Statistics Office, Ministry of Finance and Economic Development; 2004.
MUS Mauritius 1999 1999 25.1
2000 Housing and Population Census - Republic of Mauritius. Analysis Report. Volume VI – Health and Quality of Life, Morbidity and Mortality. Port Louis: Central Statistics Office, Ministry of Finance and Economic Development; 2004.
MUS Mauritius 2000 2000 28.0
Health Statistics Report 2014. Island of Mauritius and Island of Rodrigues. Port Louis: Health Statistics Unit, Ministry of Health and Quality of Life [Mauritius]; 2015.
MUS Mauritius 2001 2001 29.8
Health Statistics Report 2014. Island of Mauritius and Island of Rodrigues. Port Louis: Health Statistics Unit, Ministry of Health and Quality of Life [Mauritius]; 2015.
MUS Mauritius 2002 2002 30.4
Health Statistics Report 2014. Island of Mauritius and Island of Rodrigues. Port Louis: Health Statistics Unit, Ministry of Health and Quality of Life [Mauritius]; 2015.
MUS Mauritius 2003 2003 31.7
Health Statistics Report 2017. Island of Mauritius and Island of Rodrigues. Port Louis: Health Statistics Unit, Ministry of Health and Quality of Life [Mauritius]; 2018.
MUS Mauritius 2004 2004 34.7
Health Statistics Report 2017. Island of Mauritius and Island of Rodrigues. Port Louis: Health Statistics Unit, Ministry of Health and Quality of Life [Mauritius]; 2018.
MUS Mauritius 2005 2005 34.3
Health Statistics Report 2017. Island of Mauritius and Island of Rodrigues. Port Louis: Health Statistics Unit, Ministry of Health and Quality of Life [Mauritius]; 2018.
BMJ Publishing Group Limited (BMJ) disclaims all liability and responsibility arising from any relianceSupplemental material placed on this supplemental material which has been supplied by the author(s) BMJ Global Health
doi: 10.1136/bmjgh-2021-005671:e005671. 6 2021;BMJ Global Health, et al. Betran AP

172
ISO
Cod
e
Country
Coverag
e start
year
Covera
ge end
year
Caesare
an
section
rate (%)
References
MUS Mauritius 2006 2006 35.2
Health Statistics Report 2017. Island of Mauritius and Island of Rodrigues. Port Louis: Health Statistics Unit, Ministry of Health and Quality of Life [Mauritius]; 2018.
MUS Mauritius 2007 2007 39.1
Health Statistics Report 2017. Island of Mauritius and Island of Rodrigues. Port Louis: Health Statistics Unit, Ministry of Health and Quality of Life [Mauritius]; 2018.
MUS Mauritius 2008 2008 40.4
Health Statistics Report 2017. Island of Mauritius and Island of Rodrigues. Port Louis: Health Statistics Unit, Ministry of Health and Quality of Life [Mauritius]; 2018.
MUS Mauritius 2009 2009 41.6
Health Statistics Report 2017. Island of Mauritius and Island of Rodrigues. Port Louis: Health Statistics Unit, Ministry of Health and Quality of Life [Mauritius]; 2018.
MUS Mauritius 2010 2010 43.0
Health Statistics Report 2017. Island of Mauritius and Island of Rodrigues. Port Louis: Health Statistics Unit, Ministry of Health and Quality of Life [Mauritius]; 2018.
MUS Mauritius 2011 2011 43.9
Health Statistics Report 2017. Island of Mauritius and Island of Rodrigues. Port Louis: Health Statistics Unit, Ministry of Health and Quality of Life [Mauritius]; 2018.
MUS Mauritius 2012 2012 43.8
Health Statistics Report 2017. Island of Mauritius and Island of Rodrigues. Port Louis: Health Statistics Unit, Ministry of Health and Quality of Life [Mauritius]; 2018.
MUS Mauritius 2013 2013 45.3
Health Statistics Report 2017. Island of Mauritius and Island of Rodrigues. Port Louis: Health Statistics Unit, Ministry of Health and Quality of Life [Mauritius]; 2018.
BMJ Publishing Group Limited (BMJ) disclaims all liability and responsibility arising from any relianceSupplemental material placed on this supplemental material which has been supplied by the author(s) BMJ Global Health
doi: 10.1136/bmjgh-2021-005671:e005671. 6 2021;BMJ Global Health, et al. Betran AP

173
ISO
Cod
e
Country
Coverag
e start
year
Covera
ge end
year
Caesare
an
section
rate (%)
References
MUS Mauritius 2014 2014 49.2
Health Statistics Report 2017. Island of Mauritius and Island of Rodrigues. Port Louis: Health Statistics Unit, Ministry of Health and Quality of Life [Mauritius]; 2018.
MUS Mauritius 2015 2015 49.3
Health Statistics Report 2017. Island of Mauritius and Island of Rodrigues. Port Louis: Health Statistics Unit, Ministry of Health and Quality of Life [Mauritius]; 2018.
MUS Mauritius 2016 2016 48.7
Health Statistics Report 2017. Island of Mauritius and Island of Rodrigues. Port Louis: Health Statistics Unit, Ministry of Health and Quality of Life [Mauritius]; 2018.
MUS Mauritius 2017 2017 50.7
Health Statistics Report 2017. Island of Mauritius and Island of Rodrigues. Port Louis: Health Statistics Unit, Ministry of Health and Quality of Life [Mauritius]; 2018.
MEX Mexico 1996 1996 24.1
Síntesis Ejecutiva. Nacimientos por cesárea en México. México D.F.: Secretaria de Salud; 2000 (in Spanish).
MEX Mexico 1999 1999 35.4
Síntesis Ejecutiva. Nacimientos por cesárea en México. México D.F.: Secretaria de Salud; 2000 (in Spanish).
MEX Mexico 2002 2002 33.6
Sistema Nacional de Información en Salud - SINAIS. Boletín de Información Estadística. Volumen III. Servicios otorgados y Programas sustantivos. Número 22, Año 2002. México D.F.: Secretaria de Salud [Mexico]; 2003 (in Spanish).
MEX Mexico 1998 2003 33.2
La salud reproductiva en México. Análisis de la Encuesta Nacional de Salud Reproductiva 2003. México D.F.: Secretaría de Salud [Mexico], Universidad Nacional Autónoma de México - Centro Regional de Investigaciones Multidisciplinarias; 2007 (in Spanish).
BMJ Publishing Group Limited (BMJ) disclaims all liability and responsibility arising from any relianceSupplemental material placed on this supplemental material which has been supplied by the author(s) BMJ Global Health
doi: 10.1136/bmjgh-2021-005671:e005671. 6 2021;BMJ Global Health, et al. Betran AP

174
ISO
Cod
e
Country
Coverag
e start
year
Covera
ge end
year
Caesare
an
section
rate (%)
References
MEX Mexico 2005 2005 36.1
Sistema Nacional de Información en Salud - SINAIS. Boletín de Información Estadística. Volumen III. Servicios otorgados y Programas sustantivos. Número 25, Año 2005. México D.F.: Secretaria de Salud [Mexico]; 2006 (in Spanish).
MEX Mexico 2001 2006 37.6
Shamah-Levy T, Villalpando-Hernández S, Rivera-Dommarco JA (Instituto Nacional de Salud Pública [Mexico]). Resultados de Nutrición de la ENSANUT 2006. Cuernavaca: Instituto Nacional de Salud Pública; 2007 (in Spanish).
MEX Mexico 2004 2009 43.1
Encuesta Nacional de la Dinámica Demográfica 2009. Panorama sociodemográfico de México. Principales resultados. Aguascalientes: Instituto Nacional de Estadística y Geografía (INEGI) [Mexico]; 2011 (in Spanish).
MEX Mexico 2007 2012 46.2
Gutiérrez JP, Rivera-Dommarco J, Shamah-Levy T, Villalpando-Hernández S, Franco A, Cuevas-Nasu L, Romero-Martínez M, Hernández-Ávila M. (Instituto Nacional de Salud Pública [Mexico]). Encuesta Nacional de Salud y Nutrición 2012. Resultados Nacionales. Cuernavaca: Instituto Nacional de Salud Pública [Mexico]; 2012 (in Spanish).
MEX Mexico 2009 2014 46.3
Encuesta Nacional de la Dinámica Demográfica ENADID 2014. Principales resultados. Aguascalientes: Instituto Nacional de Estadística y Geografía (INEGI), Consejo Nacional de Población (CONAPO); 2015 (in Spanish).
MEX Mexico 2013 2015 40.7
Instituto Nacional de Salud Pública, Fondo de las Naciones Unidas para la Infancia (UNICEF) México. Encuesta Nacional de Niños, Niñas y Mujeres 2015 - Encuesta de Indicadores Múltiples por Conglomerados 2015, Informe Final. Ciudad de México, México: Instituto Nacional de Salud Pública, UNICEF México; 2016 (in Spanish).
FSM Micronesia
(Federated States of) 2000 2000 9.6
Statistical Yearbook Federated States of Micronesia 2008. Palikir, Pohnpei: Division of Statistics, Office of Statistics, Budget and Economic Management, Overseas Development Assistance & Compact Management (SBOC) [Federated States of Micronesia]; 2008.
FSM Micronesia
(Federated States of) 2001 2001 11.2
Statistical Yearbook Federated States of Micronesia 2008. Palikir, Pohnpei: Division of Statistics, Office of Statistics, Budget and Economic Management, Overseas Development Assistance & Compact Management (SBOC) [Federated States of Micronesia]; 2008.
BMJ Publishing Group Limited (BMJ) disclaims all liability and responsibility arising from any relianceSupplemental material placed on this supplemental material which has been supplied by the author(s) BMJ Global Health
doi: 10.1136/bmjgh-2021-005671:e005671. 6 2021;BMJ Global Health, et al. Betran AP

175
ISO
Cod
e
Country
Coverag
e start
year
Covera
ge end
year
Caesare
an
section
rate (%)
References
FSM Micronesia
(Federated States of) 2002 2002 10.9
Statistical Yearbook Federated States of Micronesia 2008. Palikir, Pohnpei: Division of Statistics, Office of Statistics, Budget and Economic Management, Overseas Development Assistance & Compact Management (SBOC) [Federated States of Micronesia]; 2008.
FSM Micronesia
(Federated States of) 2003 2003 10.5
Statistical Yearbook Federated States of Micronesia 2008. Palikir, Pohnpei: Division of Statistics, Office of Statistics, Budget and Economic Management, Overseas Development Assistance & Compact Management (SBOC) [Federated States of Micronesia]; 2008.
FSM Micronesia
(Federated States of) 2004 2004 10.5
Statistical Yearbook Federated States of Micronesia 2008. Palikir, Pohnpei: Division of Statistics, Office of Statistics, Budget and Economic Management, Overseas Development Assistance & Compact Management (SBOC) [Federated States of Micronesia]; 2008.
FSM Micronesia
(Federated States of) 2005 2005 8.4
Statistical Yearbook Federated States of Micronesia 2008. Palikir, Pohnpei: Division of Statistics, Office of Statistics, Budget and Economic Management, Overseas Development Assistance & Compact Management (SBOC) [Federated States of Micronesia]; 2008.
FSM Micronesia
(Federated States of) 2006 2006 10.5
Statistical Yearbook Federated States of Micronesia 2008. Palikir, Pohnpei: Division of Statistics, Office of Statistics, Budget and Economic Management, Overseas Development Assistance & Compact Management (SBOC) [Federated States of Micronesia]; 2008.
MCO Monaco 2012 2012 17.4
European Health for All Database (HFA-DB) [online database]. World Health Organization (WHO) Regional Office for Europe; 2016 (http://data.euro.who.int/hfadb, accessed 8 August 2016).
MCO Monaco 2015 2015 20.6
European Health for All Database (HFA-DB) [online database]. World Health Organization (WHO) Regional Office for Europe; 2016 (http://data.euro.who.int/hfadb, accessed 8 August 2016).
MCO Monaco 2016 2016 15.6
European Health Information Gateway. European Health for All database (HFA-DB). Caesarean sections per 1000 live births [online database]. World Health Organization (WHO) Regional Office for Europe; 2018 (https://gateway.euro.who.int/en/indicators/hfa_596-7060-caesarean-sections-per-1000-live-births/, accessed 14 February 2019).
BMJ Publishing Group Limited (BMJ) disclaims all liability and responsibility arising from any relianceSupplemental material placed on this supplemental material which has been supplied by the author(s) BMJ Global Health
doi: 10.1136/bmjgh-2021-005671:e005671. 6 2021;BMJ Global Health, et al. Betran AP

176
ISO
Cod
e
Country
Coverag
e start
year
Covera
ge end
year
Caesare
an
section
rate (%)
References
MNG Mongolia 1993 1998 5.1
National Statistical Office of Mongolia, Ministry of Health [Mongolia], United Nations Population Fund (UNFPA). Mongolia Reproductive Health Survey 2008. National Report. Ulaanbaatar: National Statistical Office of Mongolia; 2009.
MNG Mongolia 1998 2003 9.6
National Statistical Office of Mongolia, Ministry of Health [Mongolia], United Nations Population Fund (UNFPA). Mongolia National Report. Reproductive Health Survey 2003. Ulaanbaatar: National Statistical Office of Mongolia; 2004.
MNG Mongolia 2003 2008 17.4
National Statistical Office of Mongolia, Ministry of Health [Mongolia], United Nations Population Fund (UNFPA). Mongolia Reproductive Health Survey 2008. National Report. Ulaanbaatar: National Statistical Office of Mongolia; 2009.
MNG Mongolia 2008 2010 21.0
Mongolia "Child Development - 2010" survey. Multiple Indicator Cluster Survey - 4. Final Report. Ulaanbaatar: National Statistical Office of Mongolia, United Nations Children's Fund (UNICEF); 2013.
MNG Mongolia 2011 2013 23.4
Mongolia Social Indicator Sample Survey - 2013. Multiple Indicator Cluster Survey. Final Report. Ulaanbaatar: National Statistical Office of Mongolia, United Nations Children's Fund (UNICEF), United Nations Population Fund (UNFPA); 2015.
MNG Mongolia 2016 2018 26.2
Mongolia Social Indicator Sample Survey - 2018. (Multiple Indicator Cluster Survey). Survey Findings Report. Ulaanbaatar: National Statistical Office of Mongolia; 2019.
MNE Montenegro 1997 1997 9.0
European Health for All Database (HFA-DB) [online database]. World Health Organization (WHO) Regional Office for Europe; 2012 (http://data.euro.who.int/hfadb, accessed 20 August 2012).
MNE Montenegro 1998 1998 10.2
European Health for All Database (HFA-DB) [online database]. World Health Organization (WHO) Regional Office for Europe; 2012 (http://data.euro.who.int/hfadb, accessed 20 August 2012).
BMJ Publishing Group Limited (BMJ) disclaims all liability and responsibility arising from any relianceSupplemental material placed on this supplemental material which has been supplied by the author(s) BMJ Global Health
doi: 10.1136/bmjgh-2021-005671:e005671. 6 2021;BMJ Global Health, et al. Betran AP

177
ISO
Cod
e
Country
Coverag
e start
year
Covera
ge end
year
Caesare
an
section
rate (%)
References
MNE Montenegro 1999 1999 10.0
European Health for All Database (HFA-DB) [online database]. World Health Organization (WHO) Regional Office for Europe; 2012 (http://data.euro.who.int/hfadb, accessed 20 August 2012).
MNE Montenegro 2000 2000 9.9
European Health for All Database (HFA-DB) [online database]. World Health Organization (WHO) Regional Office for Europe; 2012 (http://data.euro.who.int/hfadb, accessed 20 August 2012).
MNE Montenegro 2001 2001 14.2
European Health for All Database (HFA-DB) [online database]. World Health Organization (WHO) Regional Office for Europe; 2012 (http://data.euro.who.int/hfadb, accessed 20 August 2012).
MNE Montenegro 2002 2002 12.8
European Health for All Database (HFA-DB) [online database]. World Health Organization (WHO) Regional Office for Europe; 2012 (http://data.euro.who.int/hfadb, accessed 20 August 2012).
MNE Montenegro 2003 2003 15.1
European Health for All Database (HFA-DB) [online database]. World Health Organization (WHO) Regional Office for Europe; 2012 (http://data.euro.who.int/hfadb, accessed 20 August 2012).
MNE Montenegro 2007 2007 12.0
Statisticki godisnjak 2007. Health Statistical Yearbook 2007 of Montenegro. Podgorica: Institut Za Javno Zdravlje [Institute of Public Health, Montenegro]; 2008.
MNE Montenegro 2008 2008 13.1
Statisticki godisnjak 2008. Health Statistical Yearbook 2008 of Montenegro. Podgorica: Institut Za Javno Zdravlje [Institute of Public Health, Montenegro]; 2009.
MNE Montenegro 2009 2009 19.3
Statisticki godisnjak 2009. Health Statistical Yearbook 2009 of Montenegro. Podgorica: Institut Za Javno Zdravlje [Institute of Public Health, Montenegro]; 2010.
BMJ Publishing Group Limited (BMJ) disclaims all liability and responsibility arising from any relianceSupplemental material placed on this supplemental material which has been supplied by the author(s) BMJ Global Health
doi: 10.1136/bmjgh-2021-005671:e005671. 6 2021;BMJ Global Health, et al. Betran AP

178
ISO
Cod
e
Country
Coverag
e start
year
Covera
ge end
year
Caesare
an
section
rate (%)
References
MNE Montenegro 2001 2010 23.6
European Health for All Database (HFA-DB) [online database]. World Health Organization (WHO) Regional Office for Europe; 2012 (http://data.euro.who.int/hfadb, accessed 20 August 2012).
MNE Montenegro 2011 2013 19.9
Statistical Office of Montenegro (MONSTAT), United Nations Children's Fund (UNICEF). 2013 Montenegro Multiple Indicator Cluster Survey and 2013 Montenegro Roma Settlements Multiple Indicator Cluster Survey, Final Report. Podgorica, Montenegro: Statistical Office of Montenegro (MONSTAT), UNICEF; 2014.
MNE Montenegro 2016 2018 24.4
2018 Montenegro Multiple Indicator Cluster Survey and 2018 Montenegro Roma Settlements Multiple Indicator Cluster Survey, Survey Fndings Report. Podgorica: Statistical Office of Montenegro (MONSTAT), UNICEF; 2019.
MAR Morocco 1987 1992 2.0
Ministère de la Santé Publique, Macro International Inc. Enquête Nationale sur la Population et la Santé (ENPS-II) 1992. Columbia, Maryland, USA: Macro International Inc.; 1993 (in French).
MAR Morocco 1990 1995 3.5
Azelmat M, Ayad M, Housni EA. Enquête de Panel sur la Population et la Santé (EPPS) 1995. Calverton, Maryland, USA: Ministère de la Santé Publique, Direction de la Planification et des Ressources Financières, Service des Etudes et de l'Information Sanitaire, Macro International Inc.; 1996 (in French).
MAR Morocco 1993 1997 3.1
Ministère de la Santé [Morocco], Service des études et de l’information sanitaire (SEIS), Ligue des États Arabes, PAPCHILD (Projet arabe pour la promotion de l’enfance). Enquête Nationale sur la Santé de la Mère et de l ’Enfant (ENSME) 1997. Rabat: Ministère de la Santé [Morocco]; 1999 (in French).
MAR Morocco 1998 2004 5.4
Ministère de la Santé [Maroc], ORC Macro, Ligue des États Arabes. Enquête sur la Population et la Santé Familiale (EPSF) 2003-2004. Calverton, Maryland, USA: Ministère de la Santé, ORC Macro; 2005 (in French).
MAR Morocco 2004 2004 3.8
Santé en chiffres 2010. Rabat: Ministère de la Santé - Direction de la Planification et des Ressources Financières/Division de la Planification et des Etudes/Service des Etudes et de l’Information Sanitaire (DPRF/DPE/SEIS); 2011 (in French).
BMJ Publishing Group Limited (BMJ) disclaims all liability and responsibility arising from any relianceSupplemental material placed on this supplemental material which has been supplied by the author(s) BMJ Global Health
doi: 10.1136/bmjgh-2021-005671:e005671. 6 2021;BMJ Global Health, et al. Betran AP

179
ISO
Cod
e
Country
Coverag
e start
year
Covera
ge end
year
Caesare
an
section
rate (%)
References
MAR Morocco 2005 2005 4.4
Santé en chiffres 2010. Rabat: Ministère de la Santé - Direction de la Planification et des Ressources Financières/Division de la Planification et des Etudes/Service des Etudes et de l’Information Sanitaire (DPRF/DPE/SEIS); 2011 (in French).
MAR Morocco 2006 2006 4.9
Santé en chiffres 2010. Rabat: Ministère de la Santé - Direction de la Planification et des Ressources Financières/Division de la Planification et des Etudes/Service des Etudes et de l’Information Sanitaire (DPRF/DPE/SEIS); 2011 (in French).
MAR Morocco 2007 2007 5.6
Santé en chiffres 2010. Rabat: Ministère de la Santé - Direction de la Planification et des Ressources Financières/Division de la Planification et des Etudes/Service des Etudes et de l’Information Sanitaire (DPRF/DPE/SEIS); 2011 (in French).
MAR Morocco 2010 2010 7.5
Santé en chiffres 2010. Rabat: Ministère de la Santé - Direction de la Planification et des Ressources Financières/Division de la Planification et des Etudes/Service des Etudes et de l’Information Sanitaire (DPRF/DPE/SEIS); 2011 (in French).
MAR Morocco 2006 2011 16.0
Enquête Nationale sur la Population et la Santé Familiale (ENPSF) 2011. Rabat, Le Caire: Ministère de la Santé [Morocco], Projet PAPFAM, Ligue des États Arabes; 2012 (in French).
MAR Morocco 2011 2011 12.3
Santé en chiffres 2011. Édition 2012. Rabat: Ministère de la Santé - Direction de la Planification et des Ressources Financières/Division de la Planification et des Etudes/Service des Etudes et de l’Information Sanitaire (DPRF/DPE/SEIS); 2012 (in French).
MAR Morocco 2012 2012 13.5
Santé en chiffres 2012. Édition 2013. Rabat: Ministère de la Santé - Direction de la Planification et des Ressources Financières/Division de la Planification et des Etudes/Service des Etudes et de l’Information Sanitaire (DPRF/DPE/SEIS); 2013 (in French).
MAR Morocco 2013 2013 13.9
Santé en chiffres 2013. Édition 2014. Rabat: Ministère de la Santé - Direction de la Planification et des Ressources Financières/Division de la Planification et des Etudes/Service des Etudes et de l’Information Sanitaire (DPRF/DPE/SEIS); 2014 (in French).
BMJ Publishing Group Limited (BMJ) disclaims all liability and responsibility arising from any relianceSupplemental material placed on this supplemental material which has been supplied by the author(s) BMJ Global Health
doi: 10.1136/bmjgh-2021-005671:e005671. 6 2021;BMJ Global Health, et al. Betran AP

180
ISO
Cod
e
Country
Coverag
e start
year
Covera
ge end
year
Caesare
an
section
rate (%)
References
MAR Morocco 2014 2014 14.2
Santé en chiffres 2014. Édition 2015. Rabat: Ministère de la Santé - Direction de la Planification et des Ressources Financières/Division de la Planification et des Etudes/Service des Etudes et de l’Information Sanitaire (DPRF/DPE/SEIS); 2015 (in French).
MAR Morocco 2012 2018 21.2
Enquête Nationale sur la Population et la Santé Familiale (ENPSF) 2018. Rapport final. Rabat: Ministère de la Santé [Morocco]; 2019 (in French).
MOZ Mozambique 1994 1997 2.7
da Costa Gaspar M, Cossa HA, Ribeiro dos Santos C, Manjate RM, Schoemaker J. Moçambique, Inquérito Demográfico e de Saúde, 1997. Calverton, Maryland, USA: Instituto Nacional de Estatística [Mozambique], Macro International; 1998 (in Portuguese).
MOZ Mozambique 1998 2003 1.9
Instituto Nacional de Estatística [Moçambique], Ministério da Saúde [Moçambique], MEASURE DHS+/ORC Macro. Moçambique Inquérito Demográfico e de Saúde 2003. Calverton, Maryland, USA: Instituto Nacional de Estatística [Moçambique], Ministério da Saúde [Moçambique], MEASURE DHS+/ORC Macro; 2005 (in Portuguese).
MOZ Mozambique 2006 2011 3.9
Ministerio da Saude (MISAU) [Mozambique], Instituto Nacional de Estatística (INE) [Mozambique], ICF International. Moçambique Inquérito Demográfico e de Saúde 2011. Calverton, Maryland, USA: MISA [Mozambique], INE [Mozambique], ICF International; 2013 (in Portuguese).
MMR Myanmar 2010 2016 17.1
Ministry of Health and Sports (MoHS), ICF. Myanmar Demographic and Health Survey 2015-16. Nay Pyi Taw, Myanmar, Rockville, Maryland USA: Ministry of Health and Sports, ICF; 2017.
NAM Namibia 2001 2007 12.7
Ministry of Health and Social Services (MoHSS) [Namibia], Macro International Inc. Namibia Demographic and Health Survey 2006-07. Windhoek, Namibia, Calverton, Maryland, USA: MoHSS, Macro International Inc.; 2008.
NAM Namibia 2008 2013 14.4
The Namibia Ministry of Health and Social Services (MoHSS), ICF International. The Namibia Demographic and Health Survey 2013. Windhoek, Namibia, Rockville, Maryland, USA: MoHSS, ICF International; 2014.
BMJ Publishing Group Limited (BMJ) disclaims all liability and responsibility arising from any relianceSupplemental material placed on this supplemental material which has been supplied by the author(s) BMJ Global Health
doi: 10.1136/bmjgh-2021-005671:e005671. 6 2021;BMJ Global Health, et al. Betran AP

181
ISO
Cod
e
Country
Coverag
e start
year
Covera
ge end
year
Caesare
an
section
rate (%)
References
NRU Nauru 2002 2007 7.5
Nauru Bureau of Statistics, Secretariat of the Pacific Community (SPC), Macro International Inc. Nauru 2007 Demographic and Health Survey. Noumea: SPC; 2009.
NPL Nepal 1993 1996 1.0
Pradha A, Aryal RH, Regmi G, Ban B, Govindasamy P. Nepal Family Health Survey 1996. Kathmandu, Nepal, Calverton, Maryland: Ministry of Health [Nepal], New ERA, Macro International Inc.; 1997.
NPL Nepal 1996 2001 0.8
Ministry of Health [Nepal], New ERA, ORC Macro. Nepal Demographic and Health Survey 2001. Calverton, Maryland, USA: Family Health Division, Ministry of Health; New ERA; ORC Macro; 2002.
NPL Nepal 2001 2006 2.7
Ministry of Health and Population (MOHP) [Nepal], New ERA, Macro International Inc. Nepal Demographic and Health Survey 2006. Kathmandu, Nepal: Ministry of Health and Population, New ERA, Macro International Inc.; 2007.
NPL Nepal 2006 2011 4.6
Ministry of Health and Population (MOHP) [Nepal], New ERA [Nepal], ICF International. Nepal Demographic and Health Survey 2011. Kathmandu, Nepal: MOHP [Nepal], New ERA [Nepal], ICF International; 2012.
NPL Nepal 2011 2016 9.0
Ministry of Health, Nepal, New ERA, ICF. Nepal Demographic and Health Survey 2016. Kathmandu, Nepal: Ministry of Health, Nepal; 2017.
NLD Netherlands 1995 1995 9.6
European Health for All Database (HFA-DB) [online database]. World Health Organization (WHO) Regional Office for Europe; 2012 (http://data.euro.who.int/hfadb, accessed 20 August 2012).
NLD Netherlands 1996 1996 10.1
European Health for All Database (HFA-DB) [online database]. World Health Organization (WHO) Regional Office for Europe; 2012 (http://data.euro.who.int/hfadb, accessed 20 August 2012).
BMJ Publishing Group Limited (BMJ) disclaims all liability and responsibility arising from any relianceSupplemental material placed on this supplemental material which has been supplied by the author(s) BMJ Global Health
doi: 10.1136/bmjgh-2021-005671:e005671. 6 2021;BMJ Global Health, et al. Betran AP

182
ISO
Cod
e
Country
Coverag
e start
year
Covera
ge end
year
Caesare
an
section
rate (%)
References
NLD Netherlands 1997 1997 10.4
European Health for All Database (HFA-DB) [online database]. World Health Organization (WHO) Regional Office for Europe; 2012 (http://data.euro.who.int/hfadb, accessed 20 August 2012).
NLD Netherlands 1998 1998 11.1
European Health for All Database (HFA-DB) [online database]. World Health Organization (WHO) Regional Office for Europe; 2012 (http://data.euro.who.int/hfadb, accessed 20 August 2012).
NLD Netherlands 1999 1999 10.8
Grote Lijnen. 10 jaar Perinatale Registratie Nederland. Utrecht: Stichting Perinatale Registratie Nederland; 2011 (in Dutch).
NLD Netherlands 2000 2000 13.0
Grote Lijnen. 10 jaar Perinatale Registratie Nederland. Utrecht: Stichting Perinatale Registratie Nederland; 2011 (in Dutch).
NLD Netherlands 2001 2001 14.7
Grote Lijnen. 10 jaar Perinatale Registratie Nederland. Utrecht: Stichting Perinatale Registratie Nederland; 2011 (in Dutch).
NLD Netherlands 2002 2002 14.4
Grote Lijnen. 10 jaar Perinatale Registratie Nederland. Utrecht: Stichting Perinatale Registratie Nederland; 2011 (in Dutch).
NLD Netherlands 2003 2003 14.4
Grote Lijnen. 10 jaar Perinatale Registratie Nederland. Utrecht: Stichting Perinatale Registratie Nederland; 2011 (in Dutch).
NLD Netherlands 2004 2004 14.6
Grote Lijnen. 10 jaar Perinatale Registratie Nederland. Utrecht: Stichting Perinatale Registratie Nederland; 2011 (in Dutch).
BMJ Publishing Group Limited (BMJ) disclaims all liability and responsibility arising from any relianceSupplemental material placed on this supplemental material which has been supplied by the author(s) BMJ Global Health
doi: 10.1136/bmjgh-2021-005671:e005671. 6 2021;BMJ Global Health, et al. Betran AP

183
ISO
Cod
e
Country
Coverag
e start
year
Covera
ge end
year
Caesare
an
section
rate (%)
References
NLD Netherlands 2005 2005 14.6
Grote Lijnen. 10 jaar Perinatale Registratie Nederland. Utrecht: Stichting Perinatale Registratie Nederland; 2011 (in Dutch).
NLD Netherlands 2006 2006 14.7
Grote Lijnen. 10 jaar Perinatale Registratie Nederland. Utrecht: Stichting Perinatale Registratie Nederland; 2011 (in Dutch).
NLD Netherlands 2007 2007 14.7
Grote Lijnen. 10 jaar Perinatale Registratie Nederland. Utrecht: Stichting Perinatale Registratie Nederland; 2011 (in Dutch).
NLD Netherlands 2008 2008 15.0
Grote Lijnen. 10 jaar Perinatale Registratie Nederland. Utrecht: Stichting Perinatale Registratie Nederland; 2011 (in Dutch).
NLD Netherlands 2010 2010 17.0
EURO-PERISTAT Project with SCPE and EUROCAT. European Perinatal Health Report. Health and Care of Pregnant Women and Babies in Europe in 2010; 2013.
NLD Netherlands 2012 2012 16.3
Perinatale Registratie Nederland. Grote Lijnen 1999-2012. Utrecht: Stichting Perinatale Registratie Nederland; 2013 (in Dutch).
NLD Netherlands 2013 2013 16.4
Perinatale Zorg in Nederland 2013. Utrecht: Stichting Perinatale Registratie Nederland; 2014 (in Dutch).
NLD Netherlands 2014 2014 16.5
Perinatale Zorg in Nederland 2014. Utrecht: Perined; 2015 (in Dutch).
BMJ Publishing Group Limited (BMJ) disclaims all liability and responsibility arising from any relianceSupplemental material placed on this supplemental material which has been supplied by the author(s) BMJ Global Health
doi: 10.1136/bmjgh-2021-005671:e005671. 6 2021;BMJ Global Health, et al. Betran AP

184
ISO
Cod
e
Country
Coverag
e start
year
Covera
ge end
year
Caesare
an
section
rate (%)
References
NLD Netherlands 2015 2015 16.6
Perinatale Zorg in Nederland 2015. Utrecht: Perined; 2016 (in Dutch).
NLD Netherlands 2016 2016 16.0
Perinatale Zorg in Nederland 2016. Utrecht: Perined; 2018 (in Dutch).
NLD Netherlands 2017 2017 15.2
Jaarboeken Zorg in Nederland. Jaarboek Zorg 2017 [website]. Utrecht: Perined; 2018 (https://www.perined.nl/producten/publicaties/jaarboeken, accessed 14 February 2019, in Dutch).
NLD Netherlands 2018 2018 14.9
Jaarboeken Zorg in Nederland. Jaarboek Zorg 2018 [website]. Utrecht: Perined; 2019 (https://www.perined.nl/producten/publicaties/jaarboeken, accessed 5 March 2020, in Dutch).
NZL New Zealand 1999 1999 20.4
Report on Maternity 1999. Wellington: Ministry of Health [New Zealand]; 2001.
NZL New Zealand 2000 2000 20.8
Report on Maternity 2000 & 2001. Wellington: Ministry of Health [New Zealand]; 2003.
NZL New Zealand 2001 2001 21.3
Maternity Factsheet 2001-2010 (provisional). Wellington: Ministry of Health [New Zealand]; 2011.
NZL New Zealand 2002 2002 21.8
Maternity Factsheet 2001-2010 (provisional). Wellington: Ministry of Health [New Zealand]; 2011.
BMJ Publishing Group Limited (BMJ) disclaims all liability and responsibility arising from any relianceSupplemental material placed on this supplemental material which has been supplied by the author(s) BMJ Global Health
doi: 10.1136/bmjgh-2021-005671:e005671. 6 2021;BMJ Global Health, et al. Betran AP

185
ISO
Cod
e
Country
Coverag
e start
year
Covera
ge end
year
Caesare
an
section
rate (%)
References
NZL New Zealand 2003 2003 22.1
Maternity Factsheet 2001-2010 (provisional). Wellington: Ministry of Health [New Zealand]; 2011.
NZL New Zealand 2004 2004 22.4
Maternity Factsheet 2001-2010 (provisional). Wellington: Ministry of Health [New Zealand]; 2011.
NZL New Zealand 2005 2005 22.8
Maternity Factsheet 2001-2010 (provisional). Wellington: Ministry of Health [New Zealand]; 2011.
NZL New Zealand 2006 2006 23.9
Maternity Factsheet 2001-2010 (provisional). Wellington: Ministry of Health [New Zealand]; 2011.
NZL New Zealand 2007 2007 23.2
Maternity Factsheet 2001-2010 (provisional). Wellington: Ministry of Health [New Zealand]; 2011.
NZL New Zealand 2008 2008 23.2
Maternity Factsheet 2001-2010 (provisional). Wellington: Ministry of Health [New Zealand]; 2011.
NZL New Zealand 2009 2009 23.7
Maternity Factsheet 2001-2010 (provisional). Wellington: Ministry of Health [New Zealand]; 2011.
NZL New Zealand 2010 2010 23.6
Maternity Factsheet 2001-2010 (provisional). Wellington: Ministry of Health [New Zealand]; 2011.
BMJ Publishing Group Limited (BMJ) disclaims all liability and responsibility arising from any relianceSupplemental material placed on this supplemental material which has been supplied by the author(s) BMJ Global Health
doi: 10.1136/bmjgh-2021-005671:e005671. 6 2021;BMJ Global Health, et al. Betran AP

186
ISO
Cod
e
Country
Coverag
e start
year
Covera
ge end
year
Caesare
an
section
rate (%)
References
NZL New Zealand 2011 2011 24.4
Report on Maternity 2014. Accompanying tables: Labour and Birth: type of birth. Table 30: Number and percentage of women giving birth, by type of birth, 2005-2014. Wellington: Ministry of Health [New Zealand]; 2015.
NZL New Zealand 2012 2012 25.3
Report on Maternity 2014. Accompanying tables: Labour and Birth: type of birth. Table 30: Number and percentage of women giving birth, by type of birth, 2005-2014. Wellington: Ministry of Health [New Zealand]; 2015.
NZL New Zealand 2013 2013 26.2
Report on Maternity 2014. Accompanying tables: Labour and Birth: type of birth. Table 30: Number and percentage of women giving birth, by type of birth, 2005-2014. Wellington: Ministry of Health [New Zealand]; 2015.
NZL New Zealand 2014 2014 25.9
Report on Maternity 2014. Accompanying tables: Labour and Birth: type of birth. Table 30: Number and percentage of women giving birth, by type of birth, 2005-2014. Wellington: Ministry of Health [New Zealand]; 2015.
NZL New Zealand 2015 2015 25.5
Report on Maternity 2015. Accompanying tables: Labour and Birth: type of birth. Table 33: Number and percentage of women giving birth, by type of birth, 2006-2015. Wellington: Ministry of Health [New Zealand]; 2017.
NZL New Zealand 2016 2016 26.5
Report on Maternity 2017. Accompanying tables: Labour and Birth: type of birth. Table 33: Number and percentage of women giving birth, by type of birth, 2008-2017. Wellington: Ministry of Health [New Zealand]; 2019.
NZL New Zealand 2017 2017 27.9
Report on Maternity 2017. Accompanying tables: Labour and Birth: type of birth. Table 33: Number and percentage of women giving birth, by type of birth, 2008-2017. Wellington: Ministry of Health [New Zealand]; 2019.
NIC Nicaragua 1987 1993 13.5
Encuesta sobre Salud Familiar Nicaragua 92-93. Managua: PROFAMILIA, Centers for Disease Control and Prevention (CDC), USAID; 1993 (in Spanish).
BMJ Publishing Group Limited (BMJ) disclaims all liability and responsibility arising from any relianceSupplemental material placed on this supplemental material which has been supplied by the author(s) BMJ Global Health
doi: 10.1136/bmjgh-2021-005671:e005671. 6 2021;BMJ Global Health, et al. Betran AP

187
ISO
Cod
e
Country
Coverag
e start
year
Covera
ge end
year
Caesare
an
section
rate (%)
References
NIC Nicaragua 1993 1998 15.4
Instituto Nacional de Estadísticas y Censos - INEC [Nicaragua], Macro International. Nicaragua Encuesta Nicaragüense de Demografía y Salud 1998. Calverton, Maryland, USA: INEC [Nicaragua], Macro International; 1999 (in Spanish).
NIC Nicaragua 1996 2001 14.7
Instituto Nacional de Estadísticas y Censos - INEC [Nicaragua], ORC Macro. Nicaragua Encuesta Nicaragüense de Demografía y Salud 2001. Calverton, Maryland, USA: INEC [Nicaragua], ORC Macro; 2002 (in Spanish).
NIC Nicaragua 2001 2007 19.6
Encuesta Nicaragüense de Demografía y Salud (ENDESA) 2006/07. Informe Final. Managua: Instituto Nacional de Información de Desarrollo (INIDE), Ministerio de Salud [Nicaragua]; 2008 (in Spanish).
NIC Nicaragua 2006 2012 29.7
Encuesta Nicaragüense de Demografía y Salud (ENDESA) 2011/12. Informe Preliminar. Managua: Instituto Nacional de Información de Desarrollo (INIDE), Ministerio de Salud [Nicaragua]; 2013 (in Spanish).
NER Niger 1987 1992 0.9
Kourguéni IA, Garba B, Barrère B (Direction de la Statistique et des Comptes Nationaux [Niger], Macro International). Niger Enquête Démographique et de Santé 1992. Columbia, Maryland, USA: Direction de la Statistique et des Comptes Nationaux [Niger], Macro International; 1993 (in French).
NER Niger 1995 1998 0.6
Attama S, Seroussi M, Kourguéni IA, Koché H, Barrère B (Care International Niger, Macro International Inc.). Enquête Démographique et de Santé, Niger 1998. Calverton, Maryland, USA: Care International Niger, Macro International Inc.; 1999 (in French).
NER Niger 2001 2006 1.0
Institut National de la Statistique (INS) [Niger], Macro International Inc. Enquête Démographique et de Santé et à Indicateurs Multiples du Niger 2006. Calverton, Maryland, USA: INS [Niger], Macro International Inc.; 2007 (in French).
NER Niger 2007 2012 1.4
Institut National de la Statistique (INS) [Niger], ICF International. Enquête Démographique et de Santé et à Indicateurs Multiples du Niger 2012. Calverton, Maryland, USA: INS [Niger], ICF International; 2013 (in French).
BMJ Publishing Group Limited (BMJ) disclaims all liability and responsibility arising from any relianceSupplemental material placed on this supplemental material which has been supplied by the author(s) BMJ Global Health
doi: 10.1136/bmjgh-2021-005671:e005671. 6 2021;BMJ Global Health, et al. Betran AP

188
ISO
Cod
e
Country
Coverag
e start
year
Covera
ge end
year
Caesare
an
section
rate (%)
References
NGA Nigeria 1985 1990 2.5
Federal Office of Statistics [Nigeria], Institute for Resource Development (IRD)/Macro International. Nigeria Demographic and Health Survey 1990. Columbia, Maryland, USA: Federal Office of Statistics [Nigeria], IRD/Macro International; 1992.
NGA Nigeria 1996 1999 3.7
National Population Commission [Nigeria]. Nigeria Demographic and Health Survey 1999. Calverton, Maryland: National Population Commission [Nigeria], ORC/Macro; 2000.
NGA Nigeria 1998 2003 1.7
National Population Commission (NPC) [Nigeria], ORC Macro. Nigeria Demographic and Health Survey 2003. Calverton, Maryland: National Population Commission, ORC Macro; 2004.
NGA Nigeria 2003 2008 1.8
National Population Commission (NPC) [Nigeria], ICF Macro. Nigeria Demographic and Health Survey 2008. Abuja, Nigeria: NPC [Nigeria], ICF Macro; 2009.
NGA Nigeria 2008 2013 2.0
National Population Commission (NPC) [Nigeria], ICF International. Nigeria Demographic and Health Survey 2013. Abuja, Nigeria, Rockville, Maryland, USA: NPC, ICF International; 2014.
NGA Nigeria 2013 2018 2.7
Nigeria Demographic and Health Survey 2018. Abuja, Rockville, Maryland, USA: National Population Commission (NPC) [Nigeria], ICF International; 2019.
NOR Norway 1990 1990 12.7
Statistikk fra Medisinsk fødselsregister [online database]. Oslo: Folkehelseinstituttet, Medisinsk fødselsregister [Norwegian Institute of Public Health (NIPH), Medical Birth Registry]; 2012 (http://www.fhi.no/eway/default.aspx?pid=233&trg=MainArea_5661&MainArea_5661=56, accessed 24 September 2012, in Norwegian).
NOR Norway 1991 1991 12.4
Statistikk fra Medisinsk fødselsregister [online database]. Oslo: Folkehelseinstituttet, Medisinsk fødselsregister [Norwegian Institute of Public Health (NIPH), Medical Birth Registry]; 2012 (http://www.fhi.no/eway/default.aspx?pid=233&trg=MainArea_5661&MainArea_5661=56, accessed 24 September 2012, in Norwegian).
BMJ Publishing Group Limited (BMJ) disclaims all liability and responsibility arising from any relianceSupplemental material placed on this supplemental material which has been supplied by the author(s) BMJ Global Health
doi: 10.1136/bmjgh-2021-005671:e005671. 6 2021;BMJ Global Health, et al. Betran AP

189
ISO
Cod
e
Country
Coverag
e start
year
Covera
ge end
year
Caesare
an
section
rate (%)
References
NOR Norway 1992 1992 12.5
Statistikk fra Medisinsk fødselsregister [online database]. Oslo: Folkehelseinstituttet, Medisinsk fødselsregister [Norwegian Institute of Public Health (NIPH), Medical Birth Registry]; 2012 (http://www.fhi.no/eway/default.aspx?pid=233&trg=MainArea_5661&MainArea_5661=56, accessed 24 September 2012, in Norwegian).
NOR Norway 1993 1993 12.4
Statistikk fra Medisinsk fødselsregister [online database]. Oslo: Folkehelseinstituttet, Medisinsk fødselsregister [Norwegian Institute of Public Health (NIPH), Medical Birth Registry]; 2012 (http://www.fhi.no/eway/default.aspx?pid=233&trg=MainArea_5661&MainArea_5661=56, accessed 24 September 2012, in Norwegian).
NOR Norway 1994 1994 12.5
Statistikk fra Medisinsk fødselsregister [online database]. Oslo: Folkehelseinstituttet, Medisinsk fødselsregister [Norwegian Institute of Public Health (NIPH), Medical Birth Registry]; 2012 (http://www.fhi.no/eway/default.aspx?pid=233&trg=MainArea_5661&MainArea_5661=56, accessed 24 September 2012, in Norwegian).
NOR Norway 1995 1995 12.6
Statistikk fra Medisinsk fødselsregister [online database]. Oslo: Folkehelseinstituttet, Medisinsk fødselsregister [Norwegian Institute of Public Health (NIPH), Medical Birth Registry]; 2012 (http://www.fhi.no/eway/default.aspx?pid=233&trg=MainArea_5661&MainArea_5661=56, accessed 24 September 2012, in Norwegian).
NOR Norway 1996 1996 12.6
Statistikk fra Medisinsk fødselsregister [online database]. Oslo: Folkehelseinstituttet, Medisinsk fødselsregister [Norwegian Institute of Public Health (NIPH), Medical Birth Registry]; 2012 (http://www.fhi.no/eway/default.aspx?pid=233&trg=MainArea_5661&MainArea_5661=56, accessed 24 September 2012, in Norwegian).
NOR Norway 1997 1997 12.8
Statistikk fra Medisinsk fødselsregister [online database]. Oslo: Folkehelseinstituttet, Medisinsk fødselsregister [Norwegian Institute of Public Health (NIPH), Medical Birth Registry]; 2012 (http://www.fhi.no/eway/default.aspx?pid=233&trg=MainArea_5661&MainArea_5661=56, accessed 24 September 2012, in Norwegian).
NOR Norway 1998 1998 13.5
Statistikk fra Medisinsk fødselsregister [online database]. Oslo: Folkehelseinstituttet, Medisinsk fødselsregister [Norwegian Institute of Public Health (NIPH), Medical Birth Registry]; 2012 (http://www.fhi.no/eway/default.aspx?pid=233&trg=MainArea_5661&MainArea_5661=56, accessed 24 September 2012, in Norwegian).
NOR Norway 1999 1999 13.4
Statistikk fra Medisinsk fødselsregister [online database]. Oslo: Folkehelseinstituttet, Medisinsk fødselsregister [Norwegian Institute of Public Health (NIPH), Medical Birth Registry]; 2012 (http://www.fhi.no/eway/default.aspx?pid=233&trg=MainArea_5661&MainArea_5661=56, accessed 24 September 2012, in Norwegian).
BMJ Publishing Group Limited (BMJ) disclaims all liability and responsibility arising from any relianceSupplemental material placed on this supplemental material which has been supplied by the author(s) BMJ Global Health
doi: 10.1136/bmjgh-2021-005671:e005671. 6 2021;BMJ Global Health, et al. Betran AP

190
ISO
Cod
e
Country
Coverag
e start
year
Covera
ge end
year
Caesare
an
section
rate (%)
References
NOR Norway 2000 2000 13.5
Statistikk fra Medisinsk fødselsregister [online database]. Oslo: Folkehelseinstituttet, Medisinsk fødselsregister [Norwegian Institute of Public Health (NIPH), Medical Birth Registry]; 2012 (http://www.fhi.no/eway/default.aspx?pid=233&trg=MainArea_5661&MainArea_5661=56, accessed 24 September 2012, in Norwegian).
NOR Norway 2001 2001 15.5
Statistikk fra Medisinsk fødselsregister [online database]. Oslo: Folkehelseinstituttet, Medisinsk fødselsregister [Norwegian Institute of Public Health (NIPH), Medical Birth Registry]; 2012 (http://www.fhi.no/eway/default.aspx?pid=233&trg=MainArea_5661&MainArea_5661=56, accessed 24 September 2012, in Norwegian).
NOR Norway 2002 2002 15.8
Statistikk fra Medisinsk fødselsregister [online database]. Oslo: Folkehelseinstituttet, Medisinsk fødselsregister [Norwegian Institute of Public Health (NIPH), Medical Birth Registry]; 2012 (http://www.fhi.no/eway/default.aspx?pid=233&trg=MainArea_5661&MainArea_5661=56, accessed 24 September 2012, in Norwegian).
NOR Norway 2003 2003 15.9
Statistikk fra Medisinsk fødselsregister [online database]. Oslo: Folkehelseinstituttet, Medisinsk fødselsregister [Norwegian Institute of Public Health (NIPH), Medical Birth Registry]; 2012 (http://www.fhi.no/eway/default.aspx?pid=233&trg=MainArea_5661&MainArea_5661=56, accessed 24 September 2012, in Norwegian).
NOR Norway 2004 2004 15.6
Statistikk fra Medisinsk fødselsregister [online database]. Oslo: Folkehelseinstituttet, Medisinsk fødselsregister [Norwegian Institute of Public Health (NIPH), Medical Birth Registry]; 2012 (http://www.fhi.no/eway/default.aspx?pid=233&trg=MainArea_5661&MainArea_5661=56, accessed 24 September 2012, in Norwegian).
NOR Norway 2005 2005 16.6
Statistikk fra Medisinsk fødselsregister [online database]. Oslo: Folkehelseinstituttet, Medisinsk fødselsregister [Norwegian Institute of Public Health (NIPH), Medical Birth Registry]; 2012 (http://www.fhi.no/eway/default.aspx?pid=233&trg=MainArea_5661&MainArea_5661=56, accessed 24 September 2012, in Norwegian).
NOR Norway 2006 2006 16.4
Statistikk fra Medisinsk fødselsregister [online database]. Oslo: Folkehelseinstituttet, Medisinsk fødselsregister [Norwegian Institute of Public Health (NIPH), Medical Birth Registry]; 2012 (http://www.fhi.no/eway/default.aspx?pid=233&trg=MainArea_5661&MainArea_5661=56, accessed 24 September 2012, in Norwegian).
NOR Norway 2007 2007 16.7
Statistikk fra Medisinsk fødselsregister [online database]. Oslo: Folkehelseinstituttet, Medisinsk fødselsregister [Norwegian Institute of Public Health (NIPH), Medical Birth Registry]; 2012 (http://www.fhi.no/eway/default.aspx?pid=233&trg=MainArea_5661&MainArea_5661=56, accessed 24 September 2012, in Norwegian).
BMJ Publishing Group Limited (BMJ) disclaims all liability and responsibility arising from any relianceSupplemental material placed on this supplemental material which has been supplied by the author(s) BMJ Global Health
doi: 10.1136/bmjgh-2021-005671:e005671. 6 2021;BMJ Global Health, et al. Betran AP

191
ISO
Cod
e
Country
Coverag
e start
year
Covera
ge end
year
Caesare
an
section
rate (%)
References
NOR Norway 2008 2008 17.1
Statistikk fra Medisinsk fødselsregister [online database]. Oslo: Folkehelseinstituttet, Medisinsk fødselsregister [Norwegian Institute of Public Health (NIPH), Medical Birth Registry]; 2012 (http://www.fhi.no/eway/default.aspx?pid=233&trg=MainArea_5661&MainArea_5661=56, accessed 24 September 2012, in Norwegian).
NOR Norway 2009 2009 16.9
Statistikk fra Medisinsk fødselsregister [online database]. Oslo: Folkehelseinstituttet, Medisinsk fødselsregister [Norwegian Institute of Public Health (NIPH), Medical Birth Registry]; 2012 (http://www.fhi.no/eway/default.aspx?pid=233&trg=MainArea_5661&MainArea_5661=56, accessed 24 September 2012, in Norwegian).
NOR Norway 2010 2010 17.1
Statistikk fra Medisinsk fødselsregister [online database]. Oslo: Folkehelseinstituttet, Medisinsk fødselsregister [Norwegian Institute of Public Health (NIPH), Medical Birth Registry]; 2012 (http://www.fhi.no/eway/default.aspx?pid=233&trg=MainArea_5661&MainArea_5661=56, accessed 24 September 2012, in Norwegian).
NOR Norway 2011 2011 17.0
Dataset: F10/I2b: Keisersnitt. 2011. [online database]. Oslo: Folkehelseinstituttet, Medisinsk fødselsregister [Norwegian Institute of Public Health (NIPH), Medical Birth Registry]; 2013 (http://www.fhi.no/helseregistre/medisinsk-fodselsregister/statistikk, accessed 28 October 2013, in Norwegian).
NOR Norway 2013 2013 16.8
Dataset: F10/I2b: Keisersnitt. 2013. [online database]. Oslo: Folkehelseinstituttet, Medisinsk fødselsregister [Norwegian Institute of Public Health (NIPH), Medical Birth Registry]; 2015 (http://www.fhi.no/helseregistre/medisinsk-fodselsregister/statistikk, accessed 13 January 2015, in Norwegian).
NOR Norway 2014 2014 16.6
Dataset: F10c-2/I2b-2: Keisersnitt utført. 2014. [online database]. Oslo: Folkehelseinstituttet, Medisinsk fødselsregister [Norwegian Institute of Public Health (NIPH), Medical Birth Registry]; 2015 (http://statistikkbank.fhi.no/mfr, in Norwegian).
NOR Norway 2015 2015 15.9
Dataset: Is4: Inngrep under fødselen. 2015. [online database]. Oslo: Folkehelseinstituttet, Medisinsk fødselsregister [Norwegian Institute of Public Health (NIPH), Medical Birth Registry]; 2016 (http://statistikkbank.fhi.no/mfr, in Norwegian).
NOR Norway 2016 2016 16.1
Dataset: F10c-2: Keisersnitt utført. 2016. [online database]. Oslo: Folkehelseinstituttet, Medisinsk fødselsregister [Norwegian Institute of Public Health (NIPH), Medical Birth Registry]; 2017 (http://statistikkbank.fhi.no/mfr, in Norwegian).
BMJ Publishing Group Limited (BMJ) disclaims all liability and responsibility arising from any relianceSupplemental material placed on this supplemental material which has been supplied by the author(s) BMJ Global Health
doi: 10.1136/bmjgh-2021-005671:e005671. 6 2021;BMJ Global Health, et al. Betran AP

192
ISO
Cod
e
Country
Coverag
e start
year
Covera
ge end
year
Caesare
an
section
rate (%)
References
NOR Norway 2017 2017 16.0
Dataset: F10c-2: Keisersnitt utført. 2017. [online database]. Oslo: Folkehelseinstituttet, Medisinsk fødselsregister [Norwegian Institute of Public Health (NIPH), Medical Birth Registry]; 2019 (http://statistikkbank.fhi.no/mfr, accessed 14 February 2019, in Norwegian).
NOR Norway 2018 2018 15.9
Dataset: F10c-2: Keisersnitt utført. 2018. [online database]. Oslo: Folkehelseinstituttet, Medisinsk fødselsregister [Norwegian Institute of Public Health (NIPH), Medical Birth Registry]; 2020 (http://statistikkbank.fhi.no/mfr, accessed 5 March 2020, in Norwegian).
OMN Oman 1990 1995 6.6
Jurdi R, Khawaja M. Caesarean section rates in the Arab region: a cross-national study. Health Policy Plan. 2004;19(2):101-10.
OMN Oman 1995 2000 11.5
National Health Survey, 2000. Volume II - Reproductive Health Study. Muscat: Ministry of Health [Oman], United Nations Children’s Fund (UNICEF), United Nations Population Fund (UNFPA); 2001.
OMN Oman 2003 2003 11.0
Annual Health Report 2003. Muscat: Ministry of Health, Department of Health Information and Statistics, Directorate General of Planning [Oman]; 2004.
OMN Oman 2004 2004 11.5
Annual Health Report 2004. Muscat: Ministry of Health, Department of Health Information and Statistics, Directorate General of Planning [Oman]; 2005.
OMN Oman 2005 2005 12.6
Annual Health Report 2005. Muscat: Ministry of Health, Department of Health Information and Statistics, Directorate General of Planning [Oman]; 2006.
OMN Oman 2006 2006 13.5
Annual Health Report 2006. Muscat: Ministry of Health, Department of Health Information and Statistics, Directorate General of Planning [Oman]; 2007.
BMJ Publishing Group Limited (BMJ) disclaims all liability and responsibility arising from any relianceSupplemental material placed on this supplemental material which has been supplied by the author(s) BMJ Global Health
doi: 10.1136/bmjgh-2021-005671:e005671. 6 2021;BMJ Global Health, et al. Betran AP

193
ISO
Cod
e
Country
Coverag
e start
year
Covera
ge end
year
Caesare
an
section
rate (%)
References
OMN Oman 2007 2007 14.1
Annual Health Report 2007. Muscat: Ministry of Health, Department of Health Information and Statistics, Directorate General of Planning [Oman]; 2008.
OMN Oman 2008 2008 14.9
Annual Health Report 2008. Muscat: Ministry of Health, Department of Health Information and Statistics, Directorate General of Planning [Oman]; 2009.
OMN Oman 2009 2009 15.7
Annual Health Report 2009. Muscat: Ministry of Health, Department of Health Information and Statistics, Directorate General of Planning [Oman]; 2010.
OMN Oman 2010 2010 16.4
Annual Health Report 2010. Muscat: Ministry of Health, Department of Health Information and Statistics, Directorate General of Planning [Oman]; 2011.
OMN Oman 2011 2011 17.0
Annual Health Report 2011. Muscat: Ministry of Health, Department of Health Information and Statistics, Directorate General of Planning [Oman]; 2012.
OMN Oman 2012 2014 19.4
National Centre for Statistics and Information, United Nations Children’s Fund (UNICEF). Multiple Indicator Cluster Survey 2014, Final Report. Muscat, Oman: National Centre for Statistics and Information; 2017 (in Arabic).
OMN Oman 2012 2012 17.5
Annual Health Report 2016. Muscat: Ministry of Health, Department of Health Information and Statistics, Directorate General of Planning [Oman]; 2017.
OMN Oman 2014 2014 19.3
Annual Health Report 2016. Muscat: Ministry of Health, Department of Health Information and Statistics, Directorate General of Planning [Oman]; 2017.
BMJ Publishing Group Limited (BMJ) disclaims all liability and responsibility arising from any relianceSupplemental material placed on this supplemental material which has been supplied by the author(s) BMJ Global Health
doi: 10.1136/bmjgh-2021-005671:e005671. 6 2021;BMJ Global Health, et al. Betran AP

194
ISO
Cod
e
Country
Coverag
e start
year
Covera
ge end
year
Caesare
an
section
rate (%)
References
OMN Oman 2015 2015 19.8
Annual Health Report 2016. Muscat: Ministry of Health, Department of Health Information and Statistics, Directorate General of Planning [Oman]; 2017.
OMN Oman 2016 2016 19.5
Annual Health Report 2016. Muscat: Ministry of Health, Department of Health Information and Statistics, Directorate General of Planning [Oman]; 2017.
OMN Oman 2017 2017 19.0
Annual Health Report 2017. Muscat: Ministry of Health, Department of Health Information and Statistics, Directorate General of Planning [Oman]; 2018.
OMN Oman 2018 2018 19.4
Annual Health Report 2018. Muscat: Ministry of Health, Department of Health Information and Statistics, Directorate General of Planning [Oman]; 2019.
PAK Pakistan 1985 1991 2.7
National Institute of Population Studies (NIPS) [Pakistan], Institute for Resource Development (IRD)/Macro International. Pakistan Demographic and Health Survey 1990/1991. Islamabad, Pakistan: NIPS [Pakistan], IRD/Macro International; 1992.
PAK Pakistan 2001 2007 7.3
National Institute of Population Studies (NIPS) [Pakistan], Macro International Inc. Pakistan Demographic and Health Survey 2006-07. Islamabad, Pakistan: NIPS, Macro International Inc.; 2008.
PAK Pakistan 2007 2013 14.1
National Institute of Population Studies (NIPS) [Pakistan], ICF International. Pakistan Demographic and Health Survey 2012-13. Islamabad, Pakistan, Calverton, Maryland, USA: NIPS [Pakistan], ICF International; 2013.
PAK Pakistan 2013 2018 22.3
National Institute of Population Studies (NIPS) [Pakistan], ICF. Pakistan Demographic and Health Survey 2017-18. Islamabad, Pakistan, and Rockville, Maryland, USA: NIPS, ICF; 2019.
BMJ Publishing Group Limited (BMJ) disclaims all liability and responsibility arising from any relianceSupplemental material placed on this supplemental material which has been supplied by the author(s) BMJ Global Health
doi: 10.1136/bmjgh-2021-005671:e005671. 6 2021;BMJ Global Health, et al. Betran AP

195
ISO
Cod
e
Country
Coverag
e start
year
Covera
ge end
year
Caesare
an
section
rate (%)
References
PAN Panama 2004 2009 20.2
De León Richardson RG, Martínez García L, Chu V EE, Mendoza Q AI, Chamorro Mojica F, Poveda C et al. Panamá Encuesta Nacional de Salud Sexual y Reproductiva 2009 (ENASSER 2009) - Informe Final. Panamá: Instituto Conmemorativo Gorgas de Estudios de la Salud; 2011 (in Spanish).
PAN Panama 2011 2013 27.7
Contraloría General de la República, Fondo de las Naciones Unidas para la Infancia (UNICEF). Encuesta de Indicadores Múltiples por Conglomerados de Panamá 2013, Resultados Principales Panamá. Panamá: Contraloría General; 2014 (in Spanish).
PNG Papua New Guinea 2011 2018 3.0
Papua New Guinea Demographic and Health Survey 2016-18. Oirt Moresby, Rockeville, Maryland: National Statistical Office (NSO) [Papua New Guinea], ICF; 2019.
PRY Paraguay 1985 1990 13.0
Centro Paraguayo de Estudios de Población, Macro Systems Inc. Encuesta Nacional de Demografía y Salud 1990. Columbia, Maryland, USA: Macro Systems Inc.; 1991 (in Spanish).
PRY Paraguay 1990 1996 15.3
Encuesta Nacional de Demografía y Salud Reproductiva 1995-1996 (ENDSR-95/96). Asunción: Centro Paraguay de Estudios de Población (CEPEP), Centros para el Control y Prevención de Enfermedades (CDC), Agencia del Gobierno de los Estados Unidos para el Desarrollo Internacional (USAID); 1997 (in Spanish).
PRY Paraguay 1995 1998 16.5
Encuesta Nacional de Salud Materno Infantil: 1998 (ENSMI-98). Informe Final. Asunción: Centro Paraguay de Estudios de Población (CEPEP), Centros para el Control y Prevención de Enfermedades (CDC), Agencia del Gobierno de los Estados Unidos para el Desarrollo Internacional (USAID); 1999 (in Spanish).
PRY Paraguay 1999 2004 26.9
Encuesta Nacional de Demografía y Salud Reproductiva (ENDSSR) 2004. Informe Final. Asunción: Centro Paraguayo de Estudios de Población (CEPEP), Agencia del Gobierno de los Estados Unidos para el Desarrollo Internacional (USAID), Centros para el Control y Prevención de Enfermedades (CDC), Fondo de Población de las Naciones Unidas (UNFPA), Federación Internacional de Planificación Familiar (IPPF); 2005 (in Spanish).
PRY Paraguay 2003 2008 33.1
Encuesta Nacional de Demografía y Salud Reproductiva (ENDSSR) 2008. Informe Final. Asunción: Centro Paraguayo de Estudios de Población (CEPEP), Agencia del Gobierno de los Estados Unidos para el Desarrollo Internacional (USAID), Centros para el Control y Prevención de Enfermedades (CDC), Fondo de las Naciones Unidas para la Infancia (UNICEF), Federación Internacional de Planificación Familiar (IPPF); 2009 (in Spanish).
BMJ Publishing Group Limited (BMJ) disclaims all liability and responsibility arising from any relianceSupplemental material placed on this supplemental material which has been supplied by the author(s) BMJ Global Health
doi: 10.1136/bmjgh-2021-005671:e005671. 6 2021;BMJ Global Health, et al. Betran AP

196
ISO
Cod
e
Country
Coverag
e start
year
Covera
ge end
year
Caesare
an
section
rate (%)
References
PRY Paraguay 2011 2011 43.6
Indicadores Básicos de Salud 2016. Asunción: Organización Panamericana de la Salud (OPS/PAHO), Organización Mundial de la Salud (OMS/WHO), Ministerio de Salud Pública y Bienestar Social [Paraguay]; 2017 (in Spanish).
PRY Paraguay 2012 2012 43.8
Indicadores Básicos de Salud 2016. Asunción: Organización Panamericana de la Salud (OPS/PAHO), Organización Mundial de la Salud (OMS/WHO), Ministerio de Salud Pública y Bienestar Social [Paraguay]; 2017 (in Spanish).
PRY Paraguay 2013 2013 47.8
Indicadores Básicos de Salud 2016. Asunción: Organización Panamericana de la Salud (OPS/PAHO), Organización Mundial de la Salud (OMS/WHO), Ministerio de Salud Pública y Bienestar Social [Paraguay]; 2017 (in Spanish).
PRY Paraguay 2014 2014 48.3
Indicadores Básicos de Salud 2016. Asunción: Organización Panamericana de la Salud (OPS/PAHO), Organización Mundial de la Salud (OMS/WHO), Ministerio de Salud Pública y Bienestar Social [Paraguay]; 2017 (in Spanish).
PRY Paraguay 2014 2016 45.9
Encuesta de Indicadores Múltiples por Conglomerados - MICS Paraguay 2016. Fernando de la Mora: Dirección General de Estadística, Encuestas y Censos, Ministerio de Salud Pública Y Bienestar Social, Ministerio de la Secretaria Técnica de Planificación del Desarrollo Económico y Social, Fondo de las Naciones Unidas para la Infancia (UNICEF), Banco Interamericano de Desarrollo (BID), ERSSAN; 2017 (in Spanish).
PRY Paraguay 2016 2016 48.5
Indicadores Básicos de Salud 2017. Asunción: Organización Panamericana de la Salud (OPS/PAHO), Organización Mundial de la Salud (OMS/WHO), Ministerio de Salud Pública y Bienestar Social [Paraguay]; 2017 (in Spanish).
PER Peru 1986 1992 10.0
Instituto Nacional de Estadística e Informática (INEI) [Perú], Asociación Benéfica PRISMA, Macro International Inc. Perú Encuesta Demográfica y de Salud Familiar - ENDES 1991-1992. Lima, Perú: INEI [Perú], Asociación Benéfica PRISMA, Macro International Inc.; 1992 (in Spanish).
PER Peru 1991 1996 8.7
Instituto Nacional de Estadística e Informática (INEI) [Perú], ORC Macro. Perú Encuesta Demográfica y de Salud Familiar - ENDES 1996. Lima, Perú: INEI [Perú], ORC Macro; 1997 (in Spanish).
BMJ Publishing Group Limited (BMJ) disclaims all liability and responsibility arising from any relianceSupplemental material placed on this supplemental material which has been supplied by the author(s) BMJ Global Health
doi: 10.1136/bmjgh-2021-005671:e005671. 6 2021;BMJ Global Health, et al. Betran AP

197
ISO
Cod
e
Country
Coverag
e start
year
Covera
ge end
year
Caesare
an
section
rate (%)
References
PER Peru 1995 2000 12.7
Instituto Nacional de Estadística e Informática (INEI) [Perú], Macro International. Perú Encuesta Demográfica y de Salud Familiar - ENDES 2000. Lima, Perú: INEI [Perú], Macro International; 2001 (in Spanish).
PER Peru 1999 2006 15.9
Instituto Nacional de Estadística e Informática (INEI) [Perú], ORC Macro. Perú Encuesta Demográfica y de Salud Familiar - ENDES 2004-2006. Lima, Perú: Instituto Nacional de Estadística e Informática (INEI) [Perú], ORC Macro; 2007 (in Spanish).
PER Peru 2002 2008 18.4
Instituto Nacional de Estadística e Informática (INEI) [Perú], ORC Macro. Perú Encuesta Demográfica y de Salud Familiar - ENDES 2007-2008. Lima, Perú: Instituto Nacional de Estadística e Informática (INEI) [Perú], ORC Macro; 2009 (in Spanish).
PER Peru 2005 2009 21.4
Instituto Nacional de Estadística e Informática (INEI) [Perú], ORC Macro. Perú Encuesta Demográfica y de Salud Familiar - ENDES Continua 2009. Lima, Perú: INEI [Perú], ORC Macro; 2010 (in Spanish).
PER Peru 2005 2010 20.4
Instituto Nacional de Estadística e Informática (INEI) [Perú], ORC Macro. Perú Encuesta Demográfica y de Salud Familiar Continua - ENDES 2010. Lima, Perú: INEI [Perú], ORC Macro; 2011 (in Spanish).
PER Peru 2006 2011 22.9
Instituto Nacional de Estadística e Informática (INEI) [Perú]. Perú Encuesta Demográfica y de Salud Familiar - ENDES 2011. Lima, Perú: INEI [Perú]; 2012 (in Spanish).
PER Peru 2007 2012 25.3
Instituto Nacional de Estadística e Informática (INEI) [Perú]. Perú Encuesta Demográfica y de Salud Familiar - ENDES 2012. Lima, Perú: INEI [Perú]; 2013 (in Spanish).
PER Peru 2009 2014 28.6
Instituto Nacional de Estadística e Informática (INEI) [Perú]. Perú Encuesta Demográfica y de Salud Familiar - ENDES 2014. Lima, Perú: INEI [Perú]; 2015 (in Spanish).
BMJ Publishing Group Limited (BMJ) disclaims all liability and responsibility arising from any relianceSupplemental material placed on this supplemental material which has been supplied by the author(s) BMJ Global Health
doi: 10.1136/bmjgh-2021-005671:e005671. 6 2021;BMJ Global Health, et al. Betran AP

198
ISO
Cod
e
Country
Coverag
e start
year
Covera
ge end
year
Caesare
an
section
rate (%)
References
PER Peru 2011 2016 31.6
Instituto Nacional de Estadística e Informática (INEI) [Perú]. Perú Encuesta Demográfica y de Salud Familiar - ENDES 2016. Nacional y Regional. Lima, Perú: INEI [Perú]; 2017 (in Spanish).
PER Peru 2012 2017 34.2
Perú Encuesta Demográfica y de Salud Familiar - ENDES 2017. Lima: Instituto Nacional de Estadística e Informática (INEI) [Perú]; 2018 (in Spanish).
PER Peru 2013 2018 34.5
Perú: Encuesta Demográfica y de Salud Familiar - ENDES 2018. Lima: Instituto Nacional de Estadística e Informática (INEI) [Perú]; 2019 (in Spanish).
PER Peru 2014 2019 33.7
Perú: Encuesta Demográfica y de Salud Familiar - ENDES 2019. Resultados Preliminares al 50% de la muestra. Lima: Instituto Nacional de Estadística e Informática (INEI) [Perú]; 2019 (in Spanish).
PHL Philippines 1989 1993 5.9
National Statistics Office (NSO) [Philippines], Macro International Inc. National Demographic Survey 1993. Calverton, Maryland: (NSO) [Philippines], Macro International Inc.; 1994.
PHL Philippines 1993 1998 5.7
National Statistics Office (NSO) [Philippines], Department of Health (DOH) [Philippines], Macro International Inc. (MI). National Demographic and Health Survey 1998. Manila: National Statistics Office (NSO) [Philippines], Department of Health (DOH) [Philippines], Macro International Inc. (MI); 1999.
PHL Philippines 1998 2003 7.3
National Statistics Office (NSO) [Philippines], ORC Macro. National Demographic and Health Survey 2003. Calverton, Maryland: NSO [Philippines], ORC Macro; 2004.
PHL Philippines 2003 2008 9.5
National Statistics Office (NSO) [Philippines], ICF Macro. National Demographic and Health Survey 2008. Calverton, Maryland: National Statistics Office, ICF Macro; 2009.
BMJ Publishing Group Limited (BMJ) disclaims all liability and responsibility arising from any relianceSupplemental material placed on this supplemental material which has been supplied by the author(s) BMJ Global Health
doi: 10.1136/bmjgh-2021-005671:e005671. 6 2021;BMJ Global Health, et al. Betran AP

199
ISO
Cod
e
Country
Coverag
e start
year
Covera
ge end
year
Caesare
an
section
rate (%)
References
PHL Philippines 2006 2011 11.1
2011 Family Health Survey (FHS). Final Report. Quezon City: National Statistics Office [Philippines], United States Agency for International Development (USAID); 2012.
PHL Philippines 2008 2013 9.3
Philippine Statistics Authority (PSA) [Philippines], ICF International. Philippines National Demographic and Health Survey 2013. Manila, Philippines, and Rockville, Maryland, USA: PSA, ICF International; 2014.
PHL Philippines 2012 2017 12.7
Philippines National Demographic and Health Survey 2017: Final Report. Quezon City, Philippines, and Rockville, Maryland, USA: Philippine Statistics Authority (PSA), ICF; 2018. .
POL Poland 1994 1994 13.8
European Health for All Database (HFA-DB) [online database]. World Health Organization (WHO) Regional Office for Europe; 2012 (http://data.euro.who.int/hfadb, accessed 20 August 2012).
POL Poland 1995 1995 15.2
European Health for All Database (HFA-DB) [online database]. World Health Organization (WHO) Regional Office for Europe; 2012 (http://data.euro.who.int/hfadb, accessed 20 August 2012).
POL Poland 1996 1996 15.6
European Health for All Database (HFA-DB) [online database]. World Health Organization (WHO) Regional Office for Europe; 2012 (http://data.euro.who.int/hfadb, accessed 20 August 2012).
POL Poland 1997 1997 16.1
European Health for All Database (HFA-DB) [online database]. World Health Organization (WHO) Regional Office for Europe; 2012 (http://data.euro.who.int/hfadb, accessed 20 August 2012).
POL Poland 2005 2005 27.2
Podstawowe dane z zakresu ochrony zdrowia w 2006 r. [Basic data on health care in 2006]. Warsaw: Główny Urząd Statystyczny [Central Statistical Office, Poland]; 2007 (in Polish).
BMJ Publishing Group Limited (BMJ) disclaims all liability and responsibility arising from any relianceSupplemental material placed on this supplemental material which has been supplied by the author(s) BMJ Global Health
doi: 10.1136/bmjgh-2021-005671:e005671. 6 2021;BMJ Global Health, et al. Betran AP

200
ISO
Cod
e
Country
Coverag
e start
year
Covera
ge end
year
Caesare
an
section
rate (%)
References
POL Poland 2006 2006 28.6
Podstawowe dane z zakresu ochrony zdrowia w 2006 r. [Basic data on health care in 2006]. Warsaw: Główny Urząd Statystyczny [Central Statistical Office, Poland]; 2007 (in Polish).
POL Poland 2007 2007 29.5
Podstawowe dane z zakresu ochrony zdrowia w 2007 r. [Basic data on health care in 2007]. Warsaw: Główny Urząd Statystyczny [Central Statistical Office, Poland]; 2008 (in Polish).
POL Poland 2008 2008 30.3
Basic data on health care in 2008. Warsaw: Central Statistical Office [Poland]; 2009.
POL Poland 2009 2009 31.9
Basic data on health care in 2009. Warsaw: Central Statistical Office [Poland]; 2010.
POL Poland 2010 2010 33.7
Health and health care in 2010. Warsaw: Central Statistical Office [Poland]; 2012.
POL Poland 2011 2011 35.2
Health and health care in 2011. Warsaw: Central Statistical Office [Poland]; 2012.
POL Poland 2012 2012 31.6
European Health for All Database (HFA-DB) [online database]. World Health Organization (WHO) Regional Office for Europe; 2016 (http://data.euro.who.int/hfadb, accessed 8 August 2016).
POL Poland 2013 2013 34.6
European Health for All Database (HFA-DB) [online database]. World Health Organization (WHO) Regional Office for Europe; 2016 (http://data.euro.who.int/hfadb, accessed 8 August 2016).
BMJ Publishing Group Limited (BMJ) disclaims all liability and responsibility arising from any relianceSupplemental material placed on this supplemental material which has been supplied by the author(s) BMJ Global Health
doi: 10.1136/bmjgh-2021-005671:e005671. 6 2021;BMJ Global Health, et al. Betran AP

201
ISO
Cod
e
Country
Coverag
e start
year
Covera
ge end
year
Caesare
an
section
rate (%)
References
POL Poland 2014 2014 35.6
European Health for All Database (HFA-DB) [online database]. World Health Organization (WHO) Regional Office for Europe; 2016 (http://data.euro.who.int/hfadb, accessed 8 August 2016).
PRT Portugal 1990 1990 18.6
European Health for All Database (HFA-DB) [online database]. World Health Organization (WHO) Regional Office for Europe; 2012 (http://data.euro.who.int/hfadb, accessed 20 August 2012).
PRT Portugal 1991 1991 20.0
European Health for All Database (HFA-DB) [online database]. World Health Organization (WHO) Regional Office for Europe; 2012 (http://data.euro.who.int/hfadb, accessed 20 August 2012).
PRT Portugal 1992 1992 21.8
European Health for All Database (HFA-DB) [online database]. World Health Organization (WHO) Regional Office for Europe; 2012 (http://data.euro.who.int/hfadb, accessed 20 August 2012).
PRT Portugal 1993 1993 22.5
European Health for All Database (HFA-DB) [online database]. World Health Organization (WHO) Regional Office for Europe; 2012 (http://data.euro.who.int/hfadb, accessed 20 August 2012).
PRT Portugal 1994 1994 23.9
European Health for All Database (HFA-DB) [online database]. World Health Organization (WHO) Regional Office for Europe; 2012 (http://data.euro.who.int/hfadb, accessed 20 August 2012).
PRT Portugal 1995 1995 24.2
European Health for All Database (HFA-DB) [online database]. World Health Organization (WHO) Regional Office for Europe; 2012 (http://data.euro.who.int/hfadb, accessed 20 August 2012).
PRT Portugal 1996 1996 24.6
European Health for All Database (HFA-DB) [online database]. World Health Organization (WHO) Regional Office for Europe; 2012 (http://data.euro.who.int/hfadb, accessed 20 August 2012).
BMJ Publishing Group Limited (BMJ) disclaims all liability and responsibility arising from any relianceSupplemental material placed on this supplemental material which has been supplied by the author(s) BMJ Global Health
doi: 10.1136/bmjgh-2021-005671:e005671. 6 2021;BMJ Global Health, et al. Betran AP

202
ISO
Cod
e
Country
Coverag
e start
year
Covera
ge end
year
Caesare
an
section
rate (%)
References
PRT Portugal 1997 1997 27.4
European Health for All Database (HFA-DB) [online database]. World Health Organization (WHO) Regional Office for Europe; 2012 (http://data.euro.who.int/hfadb, accessed 20 August 2012).
PRT Portugal 1998 1998 27.5
European Health for All Database (HFA-DB) [online database]. World Health Organization (WHO) Regional Office for Europe; 2012 (http://data.euro.who.int/hfadb, accessed 20 August 2012).
PRT Portugal 2000 2000 27.7
European Health for All Database (HFA-DB) [online database]. World Health Organization (WHO) Regional Office for Europe; 2012 (http://data.euro.who.int/hfadb, accessed 20 August 2012).
PRT Portugal 2001 2001 29.5
European Health for All Database (HFA-DB) [online database]. World Health Organization (WHO) Regional Office for Europe; 2012 (http://data.euro.who.int/hfadb, accessed 20 August 2012).
PRT Portugal 2002 2002 30.2
Caesarean deliveries performed in hospitals (No.) by Geographic localization, Annual Live births (No.) by Sex; annual [online database]. Lisbon: Instituto Nacional de Estadística (INE) [Portugal]; 2012 (http://www.ine.pt, accessed 25 September 2012).
PRT Portugal 2003 2003 31.9
Caesarean deliveries performed in hospitals (No.) by Geographic localization, Annual Live births (No.) by Sex; annual [online database]. Lisbon: Instituto Nacional de Estadística (INE) [Portugal]; 2012 (http://www.ine.pt, accessed 25 September 2012).
PRT Portugal 2004 2004 32.4
Caesarean deliveries performed in hospitals (No.) by Geographic localization, Annual Live births (No.) by Sex; annual [online database]. Lisbon: Instituto Nacional de Estadística (INE) [Portugal]; 2012 (http://www.ine.pt, accessed 25 September 2012).
PRT Portugal 2005 2005 34.0
Caesarean deliveries performed in hospitals (No.) by Geographic localization, Annual Live births (No.) by Sex; annual [online database]. Lisbon: Instituto Nacional de Estadística (INE) [Portugal]; 2012 (http://www.ine.pt, accessed 25 September 2012).
BMJ Publishing Group Limited (BMJ) disclaims all liability and responsibility arising from any relianceSupplemental material placed on this supplemental material which has been supplied by the author(s) BMJ Global Health
doi: 10.1136/bmjgh-2021-005671:e005671. 6 2021;BMJ Global Health, et al. Betran AP

203
ISO
Cod
e
Country
Coverag
e start
year
Covera
ge end
year
Caesare
an
section
rate (%)
References
PRT Portugal 2006 2006 34.7
Caesarean deliveries performed in hospitals (No.) by Geographic localization, Annual Live births (No.) by Sex; annual [online database]. Lisbon: Instituto Nacional de Estadística (INE) [Portugal]; 2012 (http://www.ine.pt, accessed 25 September 2012).
PRT Portugal 2007 2007 34.9
Caesarean deliveries performed in hospitals (No.) by Geographic localization, Annual Live births (No.) by Sex; annual [online database]. Lisbon: Instituto Nacional de Estadística (INE) [Portugal]; 2012 (http://www.ine.pt, accessed 25 September 2012).
PRT Portugal 2008 2008 35.6
Caesarean deliveries performed in hospitals (No.) by Geographic localization, Annual Live births (No.) by Sex; annual [online database]. Lisbon: Instituto Nacional de Estadística (INE) [Portugal]; 2012 (http://www.ine.pt, accessed 25 September 2012).
PRT Portugal 2009 2009 36.2
Caesarean deliveries performed in hospitals (No.) by Geographic localization, Annual Live births (No.) by Sex; annual [online database]. Lisbon: Instituto Nacional de Estadística (INE) [Portugal]; 2012 (http://www.ine.pt, accessed 25 September 2012).
PRT Portugal 2010 2010 35.8
Caesarean deliveries performed in hospitals (No.) by Geographic localization, Annual Live births (No.) by Sex; annual [online database]. Lisbon: Instituto Nacional de Estadística (INE) [Portugal]; 2012 (http://www.ine.pt, accessed 25 September 2012).
PRT Portugal 2011 2011 35.2
Caesarean deliveries performed in hospitals (No.) by Geographic localization, Annual Live births (No.) by Sex; annual [online database]. Lisbon: Instituto Nacional de Estadística (INE) [Portugal]; 2013 (http://www.ine.pt, accessed 29 October 2013).
PRT Portugal 2013 2013 35.6
Deliveries (No.) in hospitals by Geographic localization (NUTS - 2013) and type of delivery; Annual [online database]. Lisbon: Instituto Nacional de Estadística (INE) [Portugal]; 2019 (https://www.ine.pt/bddXplorer/htdocs/printable.jsp?id=0t3TbYPCjPkrRuDkjgqzV6Bh_61807&lingua_cd=EN, accessed 15 February 2019).
PRT Portugal 2014 2014 33.5
Deliveries (No.) in hospitals by Geographic localization (NUTS - 2013) and type of delivery; Annual [online database]. Lisbon: Instituto Nacional de Estadística (INE) [Portugal]; 2019 (https://www.ine.pt/bddXplorer/htdocs/printable.jsp?id=0t3TbYPCjPkrRuDkjgqzV6Bh_61807&lingua_cd=EN, accessed 15 February 2019).
BMJ Publishing Group Limited (BMJ) disclaims all liability and responsibility arising from any relianceSupplemental material placed on this supplemental material which has been supplied by the author(s) BMJ Global Health
doi: 10.1136/bmjgh-2021-005671:e005671. 6 2021;BMJ Global Health, et al. Betran AP
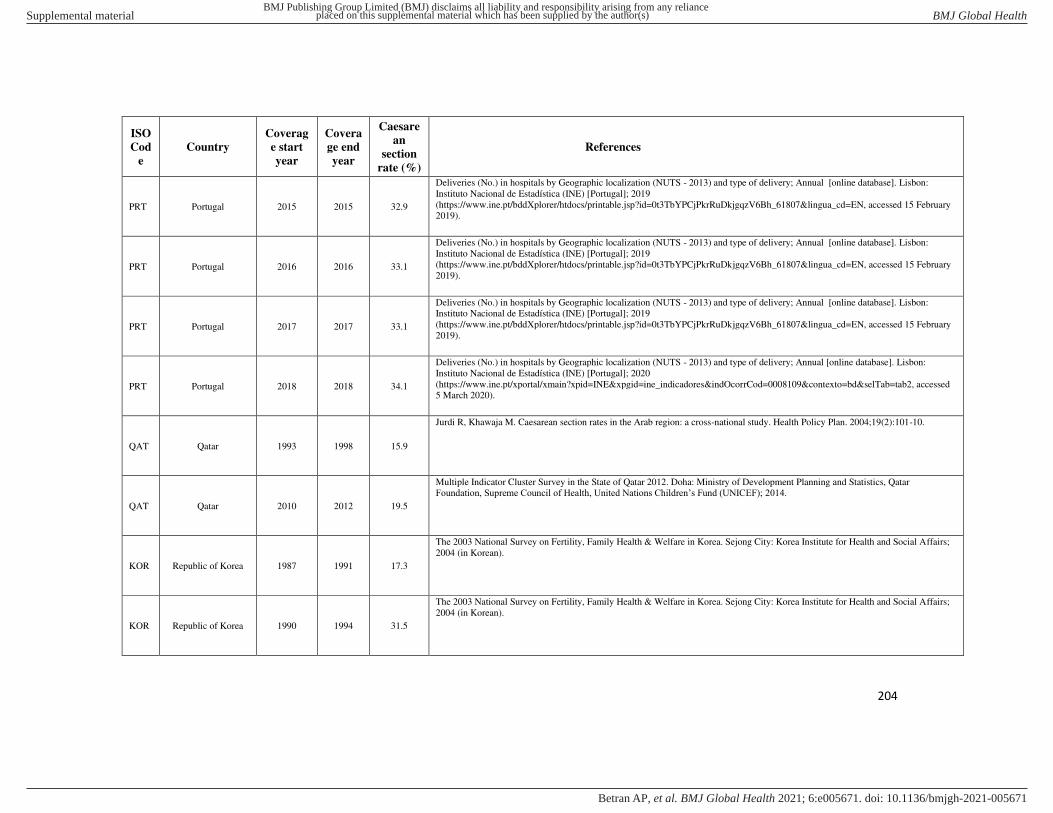
204
ISO
Cod
e
Country
Coverag
e start
year
Covera
ge end
year
Caesare
an
section
rate (%)
References
PRT Portugal 2015 2015 32.9
Deliveries (No.) in hospitals by Geographic localization (NUTS - 2013) and type of delivery; Annual [online database]. Lisbon: Instituto Nacional de Estadística (INE) [Portugal]; 2019 (https://www.ine.pt/bddXplorer/htdocs/printable.jsp?id=0t3TbYPCjPkrRuDkjgqzV6Bh_61807&lingua_cd=EN, accessed 15 February 2019).
PRT Portugal 2016 2016 33.1
Deliveries (No.) in hospitals by Geographic localization (NUTS - 2013) and type of delivery; Annual [online database]. Lisbon: Instituto Nacional de Estadística (INE) [Portugal]; 2019 (https://www.ine.pt/bddXplorer/htdocs/printable.jsp?id=0t3TbYPCjPkrRuDkjgqzV6Bh_61807&lingua_cd=EN, accessed 15 February 2019).
PRT Portugal 2017 2017 33.1
Deliveries (No.) in hospitals by Geographic localization (NUTS - 2013) and type of delivery; Annual [online database]. Lisbon: Instituto Nacional de Estadística (INE) [Portugal]; 2019 (https://www.ine.pt/bddXplorer/htdocs/printable.jsp?id=0t3TbYPCjPkrRuDkjgqzV6Bh_61807&lingua_cd=EN, accessed 15 February 2019).
PRT Portugal 2018 2018 34.1
Deliveries (No.) in hospitals by Geographic localization (NUTS - 2013) and type of delivery; Annual [online database]. Lisbon: Instituto Nacional de Estadística (INE) [Portugal]; 2020 (https://www.ine.pt/xportal/xmain?xpid=INE&xpgid=ine_indicadores&indOcorrCod=0008109&contexto=bd&selTab=tab2, accessed 5 March 2020).
QAT Qatar 1993 1998 15.9
Jurdi R, Khawaja M. Caesarean section rates in the Arab region: a cross-national study. Health Policy Plan. 2004;19(2):101-10.
QAT Qatar 2010 2012 19.5
Multiple Indicator Cluster Survey in the State of Qatar 2012. Doha: Ministry of Development Planning and Statistics, Qatar Foundation, Supreme Council of Health, United Nations Children’s Fund (UNICEF); 2014.
KOR Republic of Korea 1987 1991 17.3
The 2003 National Survey on Fertility, Family Health & Welfare in Korea. Sejong City: Korea Institute for Health and Social Affairs; 2004 (in Korean).
KOR Republic of Korea 1990 1994 31.5
The 2003 National Survey on Fertility, Family Health & Welfare in Korea. Sejong City: Korea Institute for Health and Social Affairs; 2004 (in Korean).
BMJ Publishing Group Limited (BMJ) disclaims all liability and responsibility arising from any relianceSupplemental material placed on this supplemental material which has been supplied by the author(s) BMJ Global Health
doi: 10.1136/bmjgh-2021-005671:e005671. 6 2021;BMJ Global Health, et al. Betran AP

205
ISO
Cod
e
Country
Coverag
e start
year
Covera
ge end
year
Caesare
an
section
rate (%)
References
KOR Republic of Korea 1995 1997 35.9
The 2003 National Survey on Fertility, Family Health & Welfare in Korea. Sejong City: Korea Institute for Health and Social Affairs; 2004 (in Korean).
KOR Republic of Korea 1998 2000 37.7
The 2003 National Survey on Fertility, Family Health & Welfare in Korea. Sejong City: Korea Institute for Health and Social Affairs; 2004 (in Korean).
KOR Republic of Korea 2001 2003 39.2
The 2003 National Survey on Fertility, Family Health & Welfare in Korea. Sejong City: Korea Institute for Health and Social Affairs; 2004 (in Korean).
KOR Republic of Korea 2004 2006 35.0
The 2009 National Survey on Fertility, Family Health & Welfare in Korea. Sejong City: Korea Institute for Health and Social Affairs; 2009 (in Korean).
KOR Republic of Korea 2007 2009 36.9
The 2009 National Survey on Fertility, Family Health & Welfare in Korea. Sejong City: Korea Institute for Health and Social Affairs; 2009 (in Korean).
KOR Republic of Korea 2012 2012 34.3
The 2012 National Survey on Fertility, Family Health & Welfare in Korea. Sejong City: Korea Institute for Health and Social Affairs; 2012 (in Korean).
KOR Republic of Korea 2013 2015 39.1
The 2015 National Survey on Fertility, Family Health & Welfare in Korea. Sejong City: Korea Institute for Health and Social Affairs; 2015 (in Korean).
MDA Republic of Moldova 1990 1990 5.3
European Health for All Database (HFA-DB) [online database]. World Health Organization (WHO) Regional Office for Europe; 2012 (http://data.euro.who.int/hfadb, accessed 20 August 2012).
BMJ Publishing Group Limited (BMJ) disclaims all liability and responsibility arising from any relianceSupplemental material placed on this supplemental material which has been supplied by the author(s) BMJ Global Health
doi: 10.1136/bmjgh-2021-005671:e005671. 6 2021;BMJ Global Health, et al. Betran AP

206
ISO
Cod
e
Country
Coverag
e start
year
Covera
ge end
year
Caesare
an
section
rate (%)
References
MDA Republic of Moldova 1991 1991 5.3
European Health for All Database (HFA-DB) [online database]. World Health Organization (WHO) Regional Office for Europe; 2012 (http://data.euro.who.int/hfadb, accessed 20 August 2012).
MDA Republic of Moldova 1992 1992 5.0
European Health for All Database (HFA-DB) [online database]. World Health Organization (WHO) Regional Office for Europe; 2012 (http://data.euro.who.int/hfadb, accessed 20 August 2012).
MDA Republic of Moldova 1993 1993 5.4
European Health for All Database (HFA-DB) [online database]. World Health Organization (WHO) Regional Office for Europe; 2012 (http://data.euro.who.int/hfadb, accessed 20 August 2012).
MDA Republic of Moldova 1996 1996 6.0
European Health for All Database (HFA-DB) [online database]. World Health Organization (WHO) Regional Office for Europe; 2012 (http://data.euro.who.int/hfadb, accessed 20 August 2012).
MDA Republic of Moldova 1992 1997 6.2
Moldovan Ministry of Health, Division of Reproductive Health, Centers for Disease Control and Prevention (DRH/CDC), United Nations Population Fund (UNFPA), United States Agency for International Development (USAID), United Nations Children’s Fund (UNICEF). Reproductive Health Survey Moldova, 1997. Final Report. Atlanta, Georgia: CDC; 1998.
MDA Republic of Moldova 1997 1997 6.8
European Health for All Database (HFA-DB) [online database]. World Health Organization (WHO) Regional Office for Europe; 2012 (http://data.euro.who.int/hfadb, accessed 20 August 2012).
MDA Republic of Moldova 1998 1998 7.7
European Health for All Database (HFA-DB) [online database]. World Health Organization (WHO) Regional Office for Europe; 2012 (http://data.euro.who.int/hfadb, accessed 20 August 2012).
MDA Republic of Moldova 1999 1999 5.6
Sănătatea publică in Moldova anul 2000 [Public health in Moldova 2000]. Chișinău: Ministerul Sănătății al Republicii Moldova [Ministry of Health of the Republic of Moldova], Centrul Ştiinţifico-Practic Sănătate Publică şi Management Sanitar [Scientific and Practical Center for Public Health and Sanitary Management, Moldova]; 2001 (in Romanian).
BMJ Publishing Group Limited (BMJ) disclaims all liability and responsibility arising from any relianceSupplemental material placed on this supplemental material which has been supplied by the author(s) BMJ Global Health
doi: 10.1136/bmjgh-2021-005671:e005671. 6 2021;BMJ Global Health, et al. Betran AP

207
ISO
Cod
e
Country
Coverag
e start
year
Covera
ge end
year
Caesare
an
section
rate (%)
References
MDA Republic of Moldova 2000 2000 6.4
Sănătatea publică in Moldova anul 2000 [Public health in Moldova 2000]. Chișinău: Ministerul Sănătății al Republicii Moldova [Ministry of Health of the Republic of Moldova], Centrul Ştiinţifico-Practic Sănătate Publică şi Management Sanitar [Scientific and Practical Center for Public Health and Sanitary Management, Moldova]; 2001 (in Romanian).
MDA Republic of Moldova 2001 2001 6.8
Sănătatea publică in Moldova anul 2001 [Public health in Moldova 2001]. Chișinău: Ministerul Sănătății al Republicii Moldova [Ministry of Health of the Republic of Moldova], Centrul Ştiinţifico-Practic Sănătate Publică şi Management Sanitar [Scientific and Practical Center for Public Health and Sanitary Management, Moldova]; 2002 (in Romanian).
MDA Republic of Moldova 2004 2004 9.3
Sănătatea publică in Moldova anul 2004 [Public health in Moldova 2004]. Chișinău: Ministerul Sănătății al Republicii Moldova [Ministry of Health of the Republic of Moldova], Centrul Ştiinţifico-Practic Sănătate Publică şi Management Sanitar [Scientific and Practical Center for Public Health and Sanitary Management, Moldova]; 2005 (in Romanian).
MDA Republic of Moldova 2005 2005 10.1
Sănătatea publică in Moldova anul 2005 [Public health in Moldova 2005]. Chișinău: Ministerul Sănătății al Republicii Moldova [Ministry of Health of the Republic of Moldova], Centrul Ştiinţifico-Practic Sănătate Publică şi Management Sanitar [Scientific and Practical Center for Public Health and Sanitary Management, Moldova]; 2006 (in Romanian).
MDA Republic of Moldova 2000 2005 8.5
National Scientific and Applied Center for Preventive Medicine (NCPM) [Moldova], ORC Macro. Moldova Demographic and Health Survey 2005. Calverton, Maryland: National Scientific and Applied Center for Preventive Medicine of the Ministry of Health and Social Protection, ORC Macro; 2006.
MDA Republic of Moldova 2006 2006 11.3
Sănătatea publică in Moldova anul 2006 [Public health in Moldova 2006]. Chișinău: Ministerul Sănătății al Republicii Moldova [Ministry of Health of the Republic of Moldova], Centrul Ştiinţifico-Practic Sănătate Publică şi Management Sanitar [Scientific and Practical Center for Public Health and Sanitary Management, Moldova]; 2007 (in Romanian).
MDA Republic of Moldova 2007 2007 12.1
Sănătatea publică in Moldova anul 2007 [Public health in Moldova 2007]. Chișinău: Ministerul Sănătății al Republicii Moldova [Ministry of Health of the Republic of Moldova], Centrul Național de Management în Sănătate [National Centre for Health Management, Moldova]; 2008 (in Romanian).
MDA Republic of Moldova 2008 2008 13.6
Sănătatea publică in Moldova anul 2008 [Public health in Moldova 2008]. Chișinău: Ministerul Sănătății al Republicii Moldova [Ministry of Health of the Republic of Moldova], Centrul Național de Management în Sănătate [National Centre for Health Management, Moldova]; 2009 (in Romanian).
BMJ Publishing Group Limited (BMJ) disclaims all liability and responsibility arising from any relianceSupplemental material placed on this supplemental material which has been supplied by the author(s) BMJ Global Health
doi: 10.1136/bmjgh-2021-005671:e005671. 6 2021;BMJ Global Health, et al. Betran AP

208
ISO
Cod
e
Country
Coverag
e start
year
Covera
ge end
year
Caesare
an
section
rate (%)
References
MDA Republic of Moldova 2009 2009 13.4
Sănătatea publică in Moldova anul 2009 [Public health in Moldova 2009]. Chișinău: Ministerul Sănătății al Republicii Moldova [Ministry of Health of the Republic of Moldova], Centrul Național de Management în Sănătate [National Centre for Health Management, Moldova]; 2010 (in Romanian).
MDA Republic of Moldova 2010 2010 14.1
Anuarul statistic al sistemului de sănătate din Moldova anul 2010 [Statistical yearbook of the health system in Moldova in 2010]. Chișinău: Ministerul Sănătății al Republicii Moldova [Ministry of Health of the Republic of Moldova], Centrul Național de Management în Sănătate [National Centre for Health Management, Moldova]; 2011 (in Romanian).
MDA Republic of Moldova 2010 2012 16.2
2012 Republic of Moldova Multiple Indicator Cluster Survey, Final Report. Chișinău, Republic of Moldova: National Centre of Public Health of the Ministry of Health of the Republic of Moldova, United Nations Children’s Fund (UNICEF); 2014.
MDA Republic of Moldova 2012 2012 15.6
Indicatori preliminari în format prescurtat privind sănătatea populaţiei şi activitatea instituţiilor medico-sanitare pe anii 2011-2012. Chișinău: Ministerul Sănătății al Republicii Moldova [Ministry of Health of the Republic of Moldova], Centrul Național de Management în Sănătate [National Centre for Health Management, Moldova]; 2013 (in Romanian).
MDA Republic of Moldova 2013 2013 17.0
European Health for All Database (HFA-DB) [online database]. World Health Organization (WHO) Regional Office for Europe; 2016 (http://data.euro.who.int/hfadb, accessed 8 August 2016).
MDA Republic of Moldova 2014 2014 18.4
European Health for All Database (HFA-DB) [online database]. World Health Organization (WHO) Regional Office for Europe; 2016 (http://data.euro.who.int/hfadb, accessed 8 August 2016).
MDA Republic of Moldova 2015 2015 18.5
European Health Information Gateway. European Health for All database (HFA-DB). Caesarean sections per 1000 live births [online database]. World Health Organization (WHO) Regional Office for Europe; 2018 (https://gateway.euro.who.int/en/indicators/hfa_596-7060-caesarean-sections-per-1000-live-births/, accessed 14 February 2019).
ROU Romania 1992 1992 7.2
European Health for All Database (HFA-DB) [online database]. World Health Organization (WHO) Regional Office for Europe; 2012 (http://data.euro.who.int/hfadb, accessed 20 August 2012).
BMJ Publishing Group Limited (BMJ) disclaims all liability and responsibility arising from any relianceSupplemental material placed on this supplemental material which has been supplied by the author(s) BMJ Global Health
doi: 10.1136/bmjgh-2021-005671:e005671. 6 2021;BMJ Global Health, et al. Betran AP

209
ISO
Cod
e
Country
Coverag
e start
year
Covera
ge end
year
Caesare
an
section
rate (%)
References
ROU Romania 1993 1993 8.6
European Health for All Database (HFA-DB) [online database]. World Health Organization (WHO) Regional Office for Europe; 2012 (http://data.euro.who.int/hfadb, accessed 20 August 2012).
ROU Romania 1994 1994 9.1
European Health for All Database (HFA-DB) [online database]. World Health Organization (WHO) Regional Office for Europe; 2012 (http://data.euro.who.int/hfadb, accessed 20 August 2012).
ROU Romania 1995 1995 10.1
European Health for All Database (HFA-DB) [online database]. World Health Organization (WHO) Regional Office for Europe; 2012 (http://data.euro.who.int/hfadb, accessed 20 August 2012).
ROU Romania 1998 1998 12.0
European Health for All Database (HFA-DB) [online database]. World Health Organization (WHO) Regional Office for Europe; 2012 (http://data.euro.who.int/hfadb, accessed 20 August 2012).
ROU Romania 1994 1999 11.1
Reproductive Health Survey Romania, 1999. Final Report. Atlanta, Georgia: Centers for Disease Control and Prevention (DRH/CDC), Romanian Association of Public Health and Health Management (ARSPMS), United Nations Population Fund (UNFPA), United States Agency for International Development (USAID), United Nations Children’s Fund (UNICEF); 2001.
ROU Romania 1999 1999 12.5
European Health for All Database (HFA-DB) [online database]. World Health Organization (WHO) Regional Office for Europe; 2012 (http://data.euro.who.int/hfadb, accessed 20 August 2012).
ROU Romania 2000 2000 14.1
European Health for All Database (HFA-DB) [online database]. World Health Organization (WHO) Regional Office for Europe; 2012 (http://data.euro.who.int/hfadb, accessed 20 August 2012).
ROU Romania 2003 2003 17.8
European Health for All Database (HFA-DB) [online database]. World Health Organization (WHO) Regional Office for Europe; 2012 (http://data.euro.who.int/hfadb, accessed 20 August 2012).
BMJ Publishing Group Limited (BMJ) disclaims all liability and responsibility arising from any relianceSupplemental material placed on this supplemental material which has been supplied by the author(s) BMJ Global Health
doi: 10.1136/bmjgh-2021-005671:e005671. 6 2021;BMJ Global Health, et al. Betran AP

210
ISO
Cod
e
Country
Coverag
e start
year
Covera
ge end
year
Caesare
an
section
rate (%)
References
ROU Romania 1999 2004 19.1
European Health for All Database (HFA-DB) [online database]. World Health Organization (WHO) Regional Office for Europe; 2012 (http://data.euro.who.int/hfadb, accessed 20 August 2012).
ROU Romania 2004 2004 18.9
European Health for All Database (HFA-DB) [online database]. World Health Organization (WHO) Regional Office for Europe; 2012 (http://data.euro.who.int/hfadb, accessed 20 August 2012).
ROU Romania 2005 2005 21.4
European Health for All Database (HFA-DB) [online database]. World Health Organization (WHO) Regional Office for Europe; 2012 (http://data.euro.who.int/hfadb, accessed 20 August 2012).
ROU Romania 2006 2006 21.5
European Health for All Database (HFA-DB) [online database]. World Health Organization (WHO) Regional Office for Europe; 2012 (http://data.euro.who.int/hfadb, accessed 20 August 2012).
ROU Romania 2007 2007 23.6
European Health for All Database (HFA-DB) [online database]. World Health Organization (WHO) Regional Office for Europe; 2012 (http://data.euro.who.int/hfadb, accessed 20 August 2012).
ROU Romania 2008 2008 25.8
European Health for All Database (HFA-DB) [online database]. World Health Organization (WHO) Regional Office for Europe; 2012 (http://data.euro.who.int/hfadb, accessed 20 August 2012).
ROU Romania 2009 2009 28.6
European Health for All Database (HFA-DB) [online database]. World Health Organization (WHO) Regional Office for Europe; 2012 (http://data.euro.who.int/hfadb, accessed 20 August 2012).
ROU Romania 2010 2010 33.8
European Health for All Database (HFA-DB) [online database]. World Health Organization (WHO) Regional Office for Europe; 2016 (http://data.euro.who.int/hfadb, accessed 8 August 2016).
BMJ Publishing Group Limited (BMJ) disclaims all liability and responsibility arising from any relianceSupplemental material placed on this supplemental material which has been supplied by the author(s) BMJ Global Health
doi: 10.1136/bmjgh-2021-005671:e005671. 6 2021;BMJ Global Health, et al. Betran AP

211
ISO
Cod
e
Country
Coverag
e start
year
Covera
ge end
year
Caesare
an
section
rate (%)
References
ROU Romania 2011 2011 36.3
European Health for All Database (HFA-DB) [online database]. World Health Organization (WHO) Regional Office for Europe; 2016 (http://data.euro.who.int/hfadb, accessed 8 August 2016).
ROU Romania 2012 2012 37.3
European Health for All Database (HFA-DB) [online database]. World Health Organization (WHO) Regional Office for Europe; 2016 (http://data.euro.who.int/hfadb, accessed 8 August 2016).
ROU Romania 2013 2013 38.3
European Health for All Database (HFA-DB) [online database]. World Health Organization (WHO) Regional Office for Europe; 2016 (http://data.euro.who.int/hfadb, accessed 8 August 2016).
ROU Romania 2015 2015 46.9
European Perinatal Health Report. Core indicators of the health and care of pregnant women and babies in Europe in 2015. Euro-Peristat Project; 2018.
RUS Russian Federation 1990 1990 6.7
European Health for All Database (HFA-DB) [online database]. World Health Organization (WHO) Regional Office for Europe; 2012 (http://data.euro.who.int/hfadb, accessed 20 August 2012).
RUS Russian Federation 1991 1991 7.2
European Health for All Database (HFA-DB) [online database]. World Health Organization (WHO) Regional Office for Europe; 2012 (http://data.euro.who.int/hfadb, accessed 20 August 2012).
RUS Russian Federation 1992 1992 8.1
European Health for All Database (HFA-DB) [online database]. World Health Organization (WHO) Regional Office for Europe; 2012 (http://data.euro.who.int/hfadb, accessed 20 August 2012).
RUS Russian Federation 1993 1993 9.0
European Health for All Database (HFA-DB) [online database]. World Health Organization (WHO) Regional Office for Europe; 2012 (http://data.euro.who.int/hfadb, accessed 20 August 2012).
BMJ Publishing Group Limited (BMJ) disclaims all liability and responsibility arising from any relianceSupplemental material placed on this supplemental material which has been supplied by the author(s) BMJ Global Health
doi: 10.1136/bmjgh-2021-005671:e005671. 6 2021;BMJ Global Health, et al. Betran AP

212
ISO
Cod
e
Country
Coverag
e start
year
Covera
ge end
year
Caesare
an
section
rate (%)
References
RUS Russian Federation 1994 1994 9.4
European Health for All Database (HFA-DB) [online database]. World Health Organization (WHO) Regional Office for Europe; 2012 (http://data.euro.who.int/hfadb, accessed 20 August 2012).
RUS Russian Federation 1995 1995 9.9
European Health for All Database (HFA-DB) [online database]. World Health Organization (WHO) Regional Office for Europe; 2012 (http://data.euro.who.int/hfadb, accessed 20 August 2012).
RUS Russian Federation 1996 1996 10.7
European Health for All Database (HFA-DB) [online database]. World Health Organization (WHO) Regional Office for Europe; 2012 (http://data.euro.who.int/hfadb, accessed 20 August 2012).
RUS Russian Federation 1997 1997 11.8
European Health for All Database (HFA-DB) [online database]. World Health Organization (WHO) Regional Office for Europe; 2012 (http://data.euro.who.int/hfadb, accessed 20 August 2012).
RUS Russian Federation 1998 1998 12.6
European Health for All Database (HFA-DB) [online database]. World Health Organization (WHO) Regional Office for Europe; 2012 (http://data.euro.who.int/hfadb, accessed 20 August 2012).
RUS Russian Federation 1999 1999 13.1
European Health for All Database (HFA-DB) [online database]. World Health Organization (WHO) Regional Office for Europe; 2012 (http://data.euro.who.int/hfadb, accessed 20 August 2012).
RUS Russian Federation 2000 2000 14.0
European Health for All Database (HFA-DB) [online database]. World Health Organization (WHO) Regional Office for Europe; 2012 (http://data.euro.who.int/hfadb, accessed 20 August 2012).
RUS Russian Federation 2001 2001 14.8
European Health for All Database (HFA-DB) [online database]. World Health Organization (WHO) Regional Office for Europe; 2012 (http://data.euro.who.int/hfadb, accessed 20 August 2012).
BMJ Publishing Group Limited (BMJ) disclaims all liability and responsibility arising from any relianceSupplemental material placed on this supplemental material which has been supplied by the author(s) BMJ Global Health
doi: 10.1136/bmjgh-2021-005671:e005671. 6 2021;BMJ Global Health, et al. Betran AP

213
ISO
Cod
e
Country
Coverag
e start
year
Covera
ge end
year
Caesare
an
section
rate (%)
References
RUS Russian Federation 2002 2002 15.2
European Health for All Database (HFA-DB) [online database]. World Health Organization (WHO) Regional Office for Europe; 2012 (http://data.euro.who.int/hfadb, accessed 20 August 2012).
RUS Russian Federation 2003 2003 15.7
European Health for All Database (HFA-DB) [online database]. World Health Organization (WHO) Regional Office for Europe; 2012 (http://data.euro.who.int/hfadb, accessed 20 August 2012).
RUS Russian Federation 2004 2004 16.2
European Health for All Database (HFA-DB) [online database]. World Health Organization (WHO) Regional Office for Europe; 2012 (http://data.euro.who.int/hfadb, accessed 20 August 2012).
RUS Russian Federation 2005 2005 17.2
European Health for All Database (HFA-DB) [online database]. World Health Organization (WHO) Regional Office for Europe; 2012 (http://data.euro.who.int/hfadb, accessed 20 August 2012).
RUS Russian Federation 2006 2006 18.0
European Health for All Database (HFA-DB) [online database]. World Health Organization (WHO) Regional Office for Europe; 2012 (http://data.euro.who.int/hfadb, accessed 20 August 2012).
RUS Russian Federation 2010 2010 22.1
European Health for All Database (HFA-DB) [online database]. World Health Organization (WHO) Regional Office for Europe; 2016 (http://data.euro.who.int/hfadb, accessed 8 August 2016).
RUS Russian Federation 2011 2011 22.6
European Health for All Database (HFA-DB) [online database]. World Health Organization (WHO) Regional Office for Europe; 2016 (http://data.euro.who.int/hfadb, accessed 8 August 2016).
RUS Russian Federation 2006 2011 13.0
Federal State Statistic Service (ROSSTAT), Ministry of Health of the Russian Federation, Information and Publishing Center "Statistics of Russia". Reproductive Health Survey Russia 2011. Full Report. Atlanta: United Nations Population Fund (UNFPA), Division of Reproductive Health, Centers for Disease Control and Prevention (DRH/CDC); 2012 (in Russian).
BMJ Publishing Group Limited (BMJ) disclaims all liability and responsibility arising from any relianceSupplemental material placed on this supplemental material which has been supplied by the author(s) BMJ Global Health
doi: 10.1136/bmjgh-2021-005671:e005671. 6 2021;BMJ Global Health, et al. Betran AP
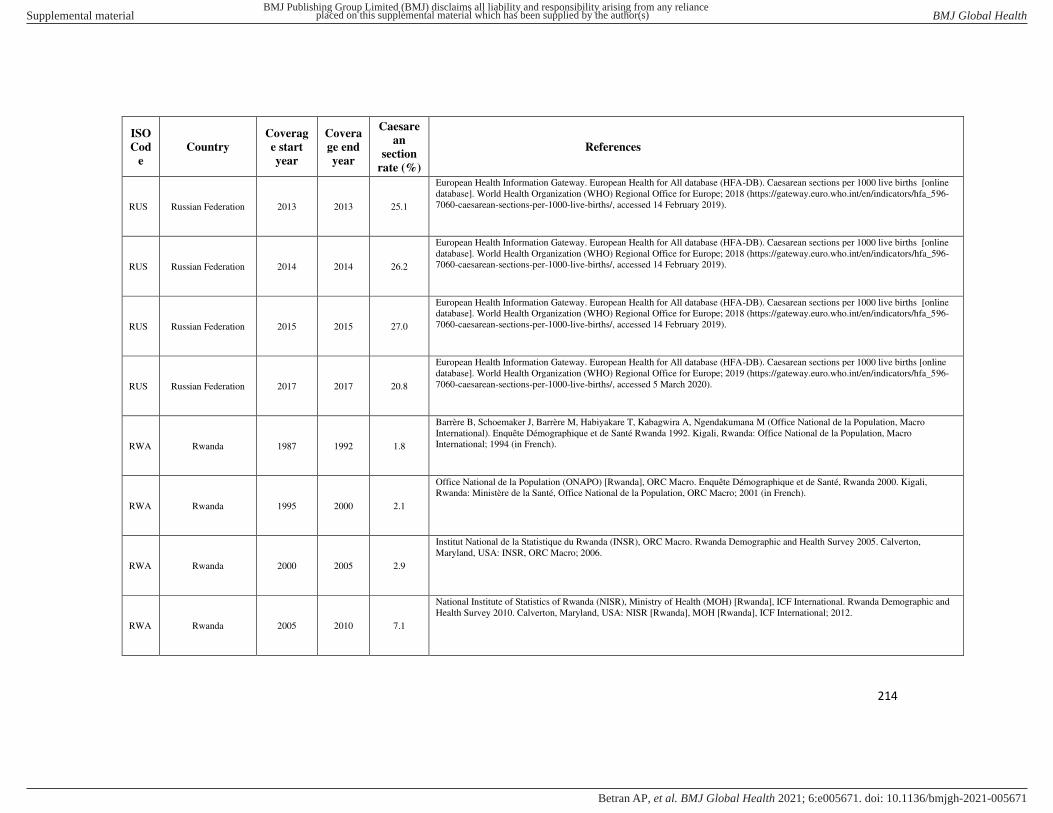
214
ISO
Cod
e
Country
Coverag
e start
year
Covera
ge end
year
Caesare
an
section
rate (%)
References
RUS Russian Federation 2013 2013 25.1
European Health Information Gateway. European Health for All database (HFA-DB). Caesarean sections per 1000 live births [online database]. World Health Organization (WHO) Regional Office for Europe; 2018 (https://gateway.euro.who.int/en/indicators/hfa_596-7060-caesarean-sections-per-1000-live-births/, accessed 14 February 2019).
RUS Russian Federation 2014 2014 26.2
European Health Information Gateway. European Health for All database (HFA-DB). Caesarean sections per 1000 live births [online database]. World Health Organization (WHO) Regional Office for Europe; 2018 (https://gateway.euro.who.int/en/indicators/hfa_596-7060-caesarean-sections-per-1000-live-births/, accessed 14 February 2019).
RUS Russian Federation 2015 2015 27.0
European Health Information Gateway. European Health for All database (HFA-DB). Caesarean sections per 1000 live births [online database]. World Health Organization (WHO) Regional Office for Europe; 2018 (https://gateway.euro.who.int/en/indicators/hfa_596-7060-caesarean-sections-per-1000-live-births/, accessed 14 February 2019).
RUS Russian Federation 2017 2017 20.8
European Health Information Gateway. European Health for All database (HFA-DB). Caesarean sections per 1000 live births [online database]. World Health Organization (WHO) Regional Office for Europe; 2019 (https://gateway.euro.who.int/en/indicators/hfa_596-7060-caesarean-sections-per-1000-live-births/, accessed 5 March 2020).
RWA Rwanda 1987 1992 1.8
Barrère B, Schoemaker J, Barrère M, Habiyakare T, Kabagwira A, Ngendakumana M (Office National de la Population, Macro International). Enquête Démographique et de Santé Rwanda 1992. Kigali, Rwanda: Office National de la Population, Macro International; 1994 (in French).
RWA Rwanda 1995 2000 2.1
Office National de la Population (ONAPO) [Rwanda], ORC Macro. Enquête Démographique et de Santé, Rwanda 2000. Kigali, Rwanda: Ministère de la Santé, Office National de la Population, ORC Macro; 2001 (in French).
RWA Rwanda 2000 2005 2.9
Institut National de la Statistique du Rwanda (INSR), ORC Macro. Rwanda Demographic and Health Survey 2005. Calverton, Maryland, USA: INSR, ORC Macro; 2006.
RWA Rwanda 2005 2010 7.1
National Institute of Statistics of Rwanda (NISR), Ministry of Health (MOH) [Rwanda], ICF International. Rwanda Demographic and Health Survey 2010. Calverton, Maryland, USA: NISR [Rwanda], MOH [Rwanda], ICF International; 2012.
BMJ Publishing Group Limited (BMJ) disclaims all liability and responsibility arising from any relianceSupplemental material placed on this supplemental material which has been supplied by the author(s) BMJ Global Health
doi: 10.1136/bmjgh-2021-005671:e005671. 6 2021;BMJ Global Health, et al. Betran AP

215
ISO
Cod
e
Country
Coverag
e start
year
Covera
ge end
year
Caesare
an
section
rate (%)
References
RWA Rwanda 2010 2015 13.0
National Institute of Statistics of Rwanda, Ministry of Finance and Economic Planning [Rwanda], Ministry of Health [Rwanda], ICF International. Rwanda Demographic and Health Survey 2014-15. Kigali, Rwanda: National Institute of Statistics of Rwanda, Ministry of Finance and Economic Planning [Rwanda], Ministry of Health [Rwanda], ICF International; 2015.
LCA Saint Lucia 2010 2012 18.5
Ministry of Social Transformation, Local Government and Community Empowerment, Central Statistics Office, United Nations Children’s Fund (UNICEF). Saint Lucia Multiple Indicator Cluster Survey 2012: Final Report. Castries, Saint Lucia: Ministry of Social Transformation, Local Government and Community Empowerment, Central Statistics Office, United Nations Children’s Fund (UNICEF); 2014.
WSM Samoa 2004 2009 12.8
Ministry of Health [Samoa], Bureau of Statistics [Samoa], ICF Macro. Samoa Demographic and Health Survey 2009. Apia, Samoa: Ministry of Health [Samoa]; 2010.
WSM Samoa 2009 2014 4.6
Census-Surveys and Demography Division, Samoa Bureau of Statistics, Ministry of Health [Samoa], United Nations Population Fund (UNFPA), United Nations Children’s Fund (UNICEF), Department of Foreign Affairs and Trade [Australia]. Samoa Demographic and Health Survey 2014. Apia: Samoa Bureau of Statistics; 2015.
SMR San Marino 2009 2009 31.4
Supplemento al Bollettino di Statistica Anno 2009. Borgo Maggiore: Ufficio Informatica, Tecnologia, Dati e Statistica [San Marino]; 2010 (in Italian).
SMR San Marino 2010 2010 33.2
Supplemento al Bollettino di Statistica Anno 2010. Borgo Maggiore: Ufficio Informatica, Tecnologia, Dati e Statistica [San Marino]; 2009 (in Italian).
SMR San Marino 2011 2011 35.4
European Health for All Database (HFA-DB) [online database]. World Health Organization (WHO) Regional Office for Europe; 2016 (http://data.euro.who.int/hfadb, accessed 8 August 2016).
SMR San Marino 2011 2011 35.4
Supplemento al Bollettino di Statistica Anno 2011. Borgo Maggiore: Ufficio Informatica, Tecnologia, Dati e Statistica [San Marino]; 2010 (in Italian).
BMJ Publishing Group Limited (BMJ) disclaims all liability and responsibility arising from any relianceSupplemental material placed on this supplemental material which has been supplied by the author(s) BMJ Global Health
doi: 10.1136/bmjgh-2021-005671:e005671. 6 2021;BMJ Global Health, et al. Betran AP

216
ISO
Cod
e
Country
Coverag
e start
year
Covera
ge end
year
Caesare
an
section
rate (%)
References
SMR San Marino 2012 2012 33.6
European Health for All Database (HFA-DB) [online database]. World Health Organization (WHO) Regional Office for Europe; 2016 (http://data.euro.who.int/hfadb, accessed 8 August 2016).
SMR San Marino 2012 2012 33.6
Supplemento al Bollettino di Statistica Anno 2012. Borgo Maggiore: Ufficio Informatica, Tecnologia, Dati e Statistica [San Marino]; 2011 (in Italian).
SMR San Marino 2013 2013 30.9
European Health for All Database (HFA-DB) [online database]. World Health Organization (WHO) Regional Office for Europe; 2016 (http://data.euro.who.int/hfadb, accessed 8 August 2016).
SMR San Marino 2013 2013 30.9
Supplemento al Bollettino di Statistica Anno 2013. Borgo Maggiore: Ufficio Informatica, Tecnologia, Dati e Statistica [San Marino]; 2014 (in Italian).
SMR San Marino 2014 2014 21.3
European Health for All Database (HFA-DB) [online database]. World Health Organization (WHO) Regional Office for Europe; 2016 (http://data.euro.who.int/hfadb, accessed 8 August 2016).
SMR San Marino 2014 2014 21.3
Supplemento al Bollettino di Statistica Anno 2015. Borgo Maggiore: Ufficio Informatica, Tecnologia, Dati e Statistica [San Marino]; 2016 (in Italian).
SMR San Marino 2015 2015 22.8
Supplemento al Bollettino di Statistica Anno 2015. Borgo Maggiore: Ufficio Informatica, Tecnologia, Dati e Statistica [San Marino]; 2016 (in Italian).
SMR San Marino 2016 2016 27.5
Supplemento al Bollettino di Statistica Anno 2016. Borgo Maggiore: Ufficio Informatica, Tecnologia, Dati e Statistica [San Marino]; 2017 (in Italian).
BMJ Publishing Group Limited (BMJ) disclaims all liability and responsibility arising from any relianceSupplemental material placed on this supplemental material which has been supplied by the author(s) BMJ Global Health
doi: 10.1136/bmjgh-2021-005671:e005671. 6 2021;BMJ Global Health, et al. Betran AP

217
ISO
Cod
e
Country
Coverag
e start
year
Covera
ge end
year
Caesare
an
section
rate (%)
References
SMR San Marino 2017 2017 23.2
European Health Information Gateway. European Health for All database (HFA-DB). Caesarean sections per 1000 live births [online database]. World Health Organization (WHO) Regional Office for Europe; 2019 (https://gateway.euro.who.int/en/indicators/hfa_596-7060-caesarean-sections-per-1000-live-births/, accessed 5 March 2020).
STP Sao Tome and
Principe 2003 2009 5.3
Instituto Nacional de Estatística (INE) [São Tomé e Príncipe], Ministério da Saúde, ICF Macro. Inquérito Demográfico e Sanitário, São Tomé e Príncipe, IDS STP, 2008-2009. Calverton, Maryland, USA: INE; 2010 (in Portuguese).
STP Sao Tome and
Principe 2012 2014 5.6
National Institute of Statistics, United Nations Children's Fund (UNICEF). Sao Tome and Principe Multiple Indicator Cluster Survey 2014, Final Report. São Tomé, São Tomé and Príncipe: National Institute of Statistics; 2016.
SAU Saudi Arabia 2006 2006 18.5
Health Statistical Year Book Kingdom of Saudi Arabia 2006 (1427). Riyadh: Ministry of Health [Saudi Arabia]; 2007.
SAU Saudi Arabia 2007 2007 19.2
Health Statistical Year Book 2007 (1428). Riyadh: Ministry of Health [Saudi Arabia]; 2008.
SAU Saudi Arabia 2008 2008 20.4
Health Statistics Book for the Year of 2008 (1429). Riyadh: Ministry of Health [Saudi Arabia]; 2009.
SAU Saudi Arabia 2009 2009 21.2
Health Statistical Year Book Kingdom of Saudi Arabia 1430/2009. Riyadh: Ministry of Health [Saudi Arabia]; 2010.
SAU Saudi Arabia 2010 2010 22.3
Health Statistical Year Book Kingdom of Saudi Arabia 1431/2010. Riyadh: Ministry of Health [Saudi Arabia]; 2011.
BMJ Publishing Group Limited (BMJ) disclaims all liability and responsibility arising from any relianceSupplemental material placed on this supplemental material which has been supplied by the author(s) BMJ Global Health
doi: 10.1136/bmjgh-2021-005671:e005671. 6 2021;BMJ Global Health, et al. Betran AP

218
ISO
Cod
e
Country
Coverag
e start
year
Covera
ge end
year
Caesare
an
section
rate (%)
References
SAU Saudi Arabia 2012 2012 22.3
Health Statistical Year Book Kingdom of Saudi Arabia 1432/2012. Riyadh: Ministry of Health [Saudi Arabia]; 2013.
SAU Saudi Arabia 2013 2013 25.2
Health Statistics Annual Book Kingdom of Saudi Arabia 2013 G/1434 H. Riyadh: Ministry of Health, General Directorate of Statistics & Information [Saudi Arabia]; 2014.
SAU Saudi Arabia 2014 2014 23.6
Statistical Year Book Kingdom of Saudi Arabia 2014 G/1435 H. Riyadh: Ministry of Health [Saudi Arabia]; 2015.
SAU Saudi Arabia 2015 2015 22.7
Statistical Year Book Kingdom of Saudi Arabia 2015 G/1436 H. Riyadh: Ministry of Health [Saudi Arabia]; 2016.
SAU Saudi Arabia 2016 2016 30.2
Statistical Year Book Kingdom of Saudi Arabia 2016 G/1437 H. Riyadh: Ministry of Health [Saudi Arabia]; 2017.
SAU Saudi Arabia 2017 2017 30.4
Statistical Year Book Kingdom of Saudi Arabia 2017 G/1438 H. Riyadh: Ministry of Health [Saudi Arabia]; 2018.
SAU Saudi Arabia 2018 2018 32.0
Statistical Year Book Kingdom of Saudi Arabia 2018 G/1439 H. Riyadh: Ministry of Health [Saudi Arabia]; 2019.
SEN Senegal 1987 1993 2.3
Salif N, Diouf PD, Ayad M (Ministère de l'Economie, des Finances et du Plan [Sénégal], Macro International). Enquête Démographique et de Santé au Sénégal (EDS-II) 1992/93. Dakar, Sénégal: Ministère de l'Economie, des Finances et du Plan [Sénégal], Macro International; 1994 (in French).
BMJ Publishing Group Limited (BMJ) disclaims all liability and responsibility arising from any relianceSupplemental material placed on this supplemental material which has been supplied by the author(s) BMJ Global Health
doi: 10.1136/bmjgh-2021-005671:e005671. 6 2021;BMJ Global Health, et al. Betran AP

219
ISO
Cod
e
Country
Coverag
e start
year
Covera
ge end
year
Caesare
an
section
rate (%)
References
SEN Senegal 2000 2005 3.3
Ndiaye S, Ayad M (Centre de Recherche pour le Développement Humain [Sénégal], ORC Macro). Enquête Démographique et de Santé au Sénégal 2005. Calverton, Maryland, USA: Centre de Recherche pour le Développement Humain [Sénégal], ORC Macro; 2006 (in French).
SEN Senegal 2005 2011 5.9
Agence Nationale de la Statistique et de la Démographie (ANSD) [Sénégal], ICF International. Enquête Démographique et de Santé à Indicateurs Multiples au Sénégal (EDS-MICS) 2010-2011. Calverton, Maryland, USA: ANSD, ICF International; 2012 (in French).
SEN Senegal 2007 2013 3.8
Agence Nationale de la Statistique et de la Démographie (ANSD) [Sénégal], ICF International. Enquête Démographique et de Santé Continue (EDS-Continue 2012-2013). Calverton, Maryland, USA: ANSD, ICF International; 2013 (in French).
SEN Senegal 2007 2014 4.4
Agence Nationale de la Statistique et de la Démographie (ANSD) [Sénégal], ICF International. Sénégal : Enquête Démographique et de Santé Continue (EDS-Continue 2014). Rockville, Maryland, USA : ANSD, ICF International; 2015 (in French).
SEN Senegal 2011 2016 5.5
Agence Nationale de la Statistique et de la Démographie (ANSD) [Sénégal], ICF. Sénégal: Enquête Démographique et de Santé Continue (EDS-Continue) 2016. Rockville, Maryland, USA: ANSD, ICF; 2017 (in French).
SEN Senegal 2012 2017 4.6
Sénégal: Enquête Démographique et de Santé Continue (EDS-Continue) 2017. Rockville, Maryland, USA: Agence Nationale de la Statistique et de la Démographie (ANSD), ICF; 2018 (in French).
SRB Serbia 2000 2000 8.0
European Health for All Database (HFA-DB) [online database]. World Health Organization (WHO) Regional Office for Europe; 2012 (http://data.euro.who.int/hfadb, accessed 20 August 2012).
SRB Serbia 2001 2001 8.6
Health Statistical Yearbook of Republic of Serbia 2005. Belgrade: Institute of Public Health of Serbia; 2006.
BMJ Publishing Group Limited (BMJ) disclaims all liability and responsibility arising from any relianceSupplemental material placed on this supplemental material which has been supplied by the author(s) BMJ Global Health
doi: 10.1136/bmjgh-2021-005671:e005671. 6 2021;BMJ Global Health, et al. Betran AP

220
ISO
Cod
e
Country
Coverag
e start
year
Covera
ge end
year
Caesare
an
section
rate (%)
References
SRB Serbia 2002 2002 7.5
Health Statistical Yearbook of Republic of Serbia 2005. Belgrade: Institute of Public Health of Serbia; 2006.
SRB Serbia 2003 2003 9.3
Health Statistical Yearbook of Republic of Serbia 2005. Belgrade: Institute of Public Health of Serbia; 2006.
SRB Serbia 2004 2004 10.8
Health Statistical Yearbook of Republic of Serbia 2005. Belgrade: Institute of Public Health of Serbia; 2006.
SRB Serbia 2005 2005 11.6
Health Statistical Yearbook of Republic of Serbia 2005. Belgrade: Institute of Public Health of Serbia; 2006.
SRB Serbia 2006 2006 16.5
European Health for All Database (HFA-DB) [online database]. World Health Organization (WHO) Regional Office for Europe; 2012 (http://data.euro.who.int/hfadb, accessed 20 August 2012).
SRB Serbia 2007 2007 18.1
European Health for All Database (HFA-DB) [online database]. World Health Organization (WHO) Regional Office for Europe; 2012 (http://data.euro.who.int/hfadb, accessed 20 August 2012).
SRB Serbia 2008 2008 19.3
European Health for All Database (HFA-DB) [online database]. World Health Organization (WHO) Regional Office for Europe; 2012 (http://data.euro.who.int/hfadb, accessed 20 August 2012).
SRB Serbia 2008 2010 24.6
Statistical Office of the Republic of Serbia, United Nations Children’s Fund (UNICEF). Republic of Serbia Multiple Indicator Cluster Survey 2010, Final Report. Belgrade, Republic of Serbia: Statistical Office of the Republic of Serbia; 2011.
BMJ Publishing Group Limited (BMJ) disclaims all liability and responsibility arising from any relianceSupplemental material placed on this supplemental material which has been supplied by the author(s) BMJ Global Health
doi: 10.1136/bmjgh-2021-005671:e005671. 6 2021;BMJ Global Health, et al. Betran AP

221
ISO
Cod
e
Country
Coverag
e start
year
Covera
ge end
year
Caesare
an
section
rate (%)
References
SRB Serbia 2010 2010 23.9
European Health for All Database (HFA-DB) [online database]. World Health Organization (WHO) Regional Office for Europe; 2016 (http://data.euro.who.int/hfadb, accessed 8 August 2016).
SRB Serbia 2011 2011 25.8
European Health for All Database (HFA-DB) [online database]. World Health Organization (WHO) Regional Office for Europe; 2016 (http://data.euro.who.int/hfadb, accessed 8 August 2016).
SRB Serbia 2012 2012 26.8
European Health for All Database (HFA-DB) [online database]. World Health Organization (WHO) Regional Office for Europe; 2016 (http://data.euro.who.int/hfadb, accessed 8 August 2016).
SRB Serbia 2014 2014 29.7
European Health for All Database (HFA-DB) [online database]. World Health Organization (WHO) Regional Office for Europe; 2016 (http://data.euro.who.int/hfadb, accessed 8 August 2016).
SRB Serbia 2012 2014 28.8
Statistical Office of the Republic of Serbia, UNICEF. Serbia Multiple Indicator Cluster Survey and Serbia Roma Settlements Multiple Indicator Cluster Survey, 2014, Final Report. Belgrade, Serbia: Statistical Office of the Republic of Serbia, UNICEF; 2014.
SYC Seychelles 2005 2005 19.2
Statistical Abstract 2009. Victoria: National Bureau of Statistics [Seychelles]; 2010.
SYC Seychelles 2006 2006 13.8
Statistical Abstract 2009. Victoria: National Bureau of Statistics [Seychelles]; 2010.
SYC Seychelles 2007 2007 19.3
Statistical Abstract 2009. Victoria: National Bureau of Statistics [Seychelles]; 2010.
BMJ Publishing Group Limited (BMJ) disclaims all liability and responsibility arising from any relianceSupplemental material placed on this supplemental material which has been supplied by the author(s) BMJ Global Health
doi: 10.1136/bmjgh-2021-005671:e005671. 6 2021;BMJ Global Health, et al. Betran AP

222
ISO
Cod
e
Country
Coverag
e start
year
Covera
ge end
year
Caesare
an
section
rate (%)
References
SYC Seychelles 2008 2008 16.0
Statistical Abstract 2009. Victoria: National Bureau of Statistics [Seychelles]; 2010.
SYC Seychelles 2009 2009 20.3
Statistical Abstract 2009. Victoria: National Bureau of Statistics [Seychelles]; 2010.
SYC Seychelles 2010 2010 22.8
Statistical Abstract 2010. Victoria: National Bureau of Statistics [Seychelles]; 2011.
SYC Seychelles 2011 2011 17.8
Statistical Abstract 2014. Victoria: National Bureau of Statistics [Seychelles]; 2015.
SYC Seychelles 2012 2012 25.3
Statistical Abstract 2014. Victoria: National Bureau of Statistics [Seychelles]; 2015.
SYC Seychelles 2013 2013 24.3
Statistical Abstract 2014. Victoria: National Bureau of Statistics [Seychelles]; 2015.
SYC Seychelles 2014 2014 24.9
Statistical Abstract 2014. Victoria: National Bureau of Statistics [Seychelles]; 2015.
SYC Seychelles 2015 2015 28.2
Statistical Abstract 2016. Victoria: National Bureau of Statistics [Seychelles]; 2017.
BMJ Publishing Group Limited (BMJ) disclaims all liability and responsibility arising from any relianceSupplemental material placed on this supplemental material which has been supplied by the author(s) BMJ Global Health
doi: 10.1136/bmjgh-2021-005671:e005671. 6 2021;BMJ Global Health, et al. Betran AP

223
ISO
Cod
e
Country
Coverag
e start
year
Covera
ge end
year
Caesare
an
section
rate (%)
References
SYC Seychelles 2016 2016 28.2
Statistical Abstract 2016. Victoria: National Bureau of Statistics [Seychelles]; 2017.
SYC Seychelles 2017 2017 33.2
Statistical Abstract 2018. Victoria: National Bureau of Statistics [Seychelles]; 2019.
SYC Seychelles 2018 2018 27.8
Statistical Abstract 2018. Victoria: National Bureau of Statistics [Seychelles]; 2019.
SLE Sierra Leone 2003 2008 1.5
Statistics Sierra Leone (SSL), ICF Macro. Sierra Leone Demographic and Health Survey 2008. Calverton, Maryland, USA: Statistics Sierra Leone (SSL), ICF Macro; 2009.
SLE Sierra Leone 2008 2010 4.5
Statistics Sierra Leone, United Nations Children's Fund (UNICEF) Sierra Leone. Sierra Leone Multiple Indicator Cluster Survey 2010, Final Report. Freetown, Sierra Leone: Statistics Sierra Leone, UNICEF Sierra Leone; 2011.
SLE Sierra Leone 2008 2013 2.9
Statistics Sierra Leone (SSL), ICF International. Sierra Leone Demographic and Health Survey 2013. Freetown, Sierra Leone and Rockville, Maryland, USA: SSL, ICF International; 2014.
SLE Sierra Leone 2012 2017 3.0
Statistics Sierra Leone, United Nations Children's Fund (UNICEF). Sierra Leone Multiple Indicator Cluster Survey 2017, Survey Findings Report. Freetown: Statistics Sierra Leone; 2018.
SGP Singapore 2001 2003 30.5
Ganesan G. MOH Information Paper: 2004/06. Deliveries in Singapore - Volume and Resources. Singapore: Ministry of Health; 2004.
BMJ Publishing Group Limited (BMJ) disclaims all liability and responsibility arising from any relianceSupplemental material placed on this supplemental material which has been supplied by the author(s) BMJ Global Health
doi: 10.1136/bmjgh-2021-005671:e005671. 6 2021;BMJ Global Health, et al. Betran AP

224
ISO
Cod
e
Country
Coverag
e start
year
Covera
ge end
year
Caesare
an
section
rate (%)
References
SVK Slovakia 1990 1990 8.7
Starostlivosť o ženu v SR 2004 (ZŠ-14/2005) [Caring for the woman in the SR 2004 (ZŠ-14/2005)]. Bratislava: Ústav zdravotníckych informácií a štatistiky [Institute of Health Information and Statistics]; 2005 (in Slovak).
SVK Slovakia 1991 1991 9.2
Starostlivosť o ženu v SR 2010 (ZŠ-14/2011) [Caring for the woman in the SR 2010 (ZŠ-14/2011)]. Bratislava: Národné centrum zdravotníckych informácií [National Health Information Centre]; 2011 (in Slovak).
SVK Slovakia 1992 1992 10.0
Starostlivosť o ženu v SR 2010 (ZŠ-14/2011) [Caring for the woman in the SR 2010 (ZŠ-14/2011)]. Bratislava: Národné centrum zdravotníckych informácií [National Health Information Centre]; 2011 (in Slovak).
SVK Slovakia 1993 1993 10.6
Starostlivosť o ženu v SR 2010 (ZŠ-14/2011) [Caring for the woman in the SR 2010 (ZŠ-14/2011)]. Bratislava: Národné centrum zdravotníckych informácií [National Health Information Centre]; 2011 (in Slovak).
SVK Slovakia 1994 1994 11.3
Starostlivosť o ženu v SR 2010 (ZŠ-14/2011) [Caring for the woman in the SR 2010 (ZŠ-14/2011)]. Bratislava: Národné centrum zdravotníckych informácií [National Health Information Centre]; 2011 (in Slovak).
SVK Slovakia 1995 1995 11.6
Starostlivosť o ženu v SR 2010 (ZŠ-14/2011) [Caring for the woman in the SR 2010 (ZŠ-14/2011)]. Bratislava: Národné centrum zdravotníckych informácií [National Health Information Centre]; 2011 (in Slovak).
SVK Slovakia 1996 1996 12.3
Starostlivosť o ženu v SR 2010 (ZŠ-14/2011) [Caring for the woman in the SR 2010 (ZŠ-14/2011)]. Bratislava: Národné centrum zdravotníckych informácií [National Health Information Centre]; 2011 (in Slovak).
SVK Slovakia 1997 1997 13.1
Starostlivosť o ženu v SR 2010 (ZŠ-14/2011) [Caring for the woman in the SR 2010 (ZŠ-14/2011)]. Bratislava: Národné centrum zdravotníckych informácií [National Health Information Centre]; 2011 (in Slovak).
BMJ Publishing Group Limited (BMJ) disclaims all liability and responsibility arising from any relianceSupplemental material placed on this supplemental material which has been supplied by the author(s) BMJ Global Health
doi: 10.1136/bmjgh-2021-005671:e005671. 6 2021;BMJ Global Health, et al. Betran AP

225
ISO
Cod
e
Country
Coverag
e start
year
Covera
ge end
year
Caesare
an
section
rate (%)
References
SVK Slovakia 1998 1998 13.4
Starostlivosť o ženu v SR 2010 (ZŠ-14/2011) [Caring for the woman in the SR 2010 (ZŠ-14/2011)]. Bratislava: Národné centrum zdravotníckych informácií [National Health Information Centre]; 2011 (in Slovak).
SVK Slovakia 1999 1999 14.0
Starostlivosť o ženu v SR 2010 (ZŠ-14/2011) [Caring for the woman in the SR 2010 (ZŠ-14/2011)]. Bratislava: Národné centrum zdravotníckych informácií [National Health Information Centre]; 2011 (in Slovak).
SVK Slovakia 2000 2000 14.9
Starostlivosť o ženu v SR 2010 (ZŠ-14/2011) [Caring for the woman in the SR 2010 (ZŠ-14/2011)]. Bratislava: Národné centrum zdravotníckych informácií [National Health Information Centre]; 2011 (in Slovak).
SVK Slovakia 2001 2001 16.8
Starostlivosť o ženu v SR 2010 (ZŠ-14/2011) [Caring for the woman in the SR 2010 (ZŠ-14/2011)]. Bratislava: Národné centrum zdravotníckych informácií [National Health Information Centre]; 2011 (in Slovak).
SVK Slovakia 2002 2002 18.1
Starostlivosť o ženu v SR 2010 (ZŠ-14/2011) [Caring for the woman in the SR 2010 (ZŠ-14/2011)]. Bratislava: Národné centrum zdravotníckych informácií [National Health Information Centre]; 2011 (in Slovak).
SVK Slovakia 2003 2003 18.7
Starostlivosť o ženu v SR 2010 (ZŠ-14/2011) [Caring for the woman in the SR 2010 (ZŠ-14/2011)]. Bratislava: Národné centrum zdravotníckych informácií [National Health Information Centre]; 2011 (in Slovak).
SVK Slovakia 2004 2004 19.4
Starostlivosť o ženu v SR 2010 (ZŠ-14/2011) [Caring for the woman in the SR 2010 (ZŠ-14/2011)]. Bratislava: Národné centrum zdravotníckych informácií [National Health Information Centre]; 2011 (in Slovak).
SVK Slovakia 2005 2005 21.0
Starostlivosť o ženu v SR 2010 (ZŠ-14/2011) [Caring for the woman in the SR 2010 (ZŠ-14/2011)]. Bratislava: Národné centrum zdravotníckych informácií [National Health Information Centre]; 2011 (in Slovak).
BMJ Publishing Group Limited (BMJ) disclaims all liability and responsibility arising from any relianceSupplemental material placed on this supplemental material which has been supplied by the author(s) BMJ Global Health
doi: 10.1136/bmjgh-2021-005671:e005671. 6 2021;BMJ Global Health, et al. Betran AP

226
ISO
Cod
e
Country
Coverag
e start
year
Covera
ge end
year
Caesare
an
section
rate (%)
References
SVK Slovakia 2006 2006 22.1
Starostlivosť o ženu v SR 2010 (ZŠ-14/2011) [Caring for the woman in the SR 2010 (ZŠ-14/2011)]. Bratislava: Národné centrum zdravotníckych informácií [National Health Information Centre]; 2011 (in Slovak).
SVK Slovakia 2007 2007 23.7
Starostlivosť o ženu v SR 2010 (ZŠ-14/2011) [Caring for the woman in the SR 2010 (ZŠ-14/2011)]. Bratislava: Národné centrum zdravotníckych informácií [National Health Information Centre]; 2011 (in Slovak).
SVK Slovakia 2008 2008 25.0
Starostlivosť o ženu v SR 2010 (ZŠ-14/2011) [Caring for the woman in the SR 2010 (ZŠ-14/2011)]. Bratislava: Národné centrum zdravotníckych informácií [National Health Information Centre]; 2011 (in Slovak).
SVK Slovakia 2009 2009 27.3
Starostlivosť o ženu v SR 2010 (ZŠ-14/2011) [Caring for the woman in the SR 2010 (ZŠ-14/2011)]. Bratislava: Národné centrum zdravotníckych informácií [National Health Information Centre]; 2011 (in Slovak).
SVK Slovakia 2010 2010 28.7
Starostlivosť o ženu v SR 2010 (ZŠ-14/2011) [Caring for the woman in the SR 2010 (ZŠ-14/2011)]. Bratislava: Národné centrum zdravotníckych informácií [National Health Information Centre]; 2011 (in Slovak).
SVK Slovakia 2011 2011 29.5
Korbel M, Kristufkova A, Dugatova M, Danis J, Nemethova B, Kascak P et al. Analýza materskej morbidity a mortality v Slovenskej republike v rokoch 2007–2012. [Analysis of maternal morbidity and mortality in Slovak Republic in the years 2007-2012]. Ceska Gynekol. 2017;82(1):6-15 (in Slovak).
SVK Slovakia 2012 2012 30.3
Korbel M, Kristufkova A, Dugatova M, Danis J, Nemethova B, Kascak P et al. Analýza materskej morbidity a mortality v Slovenskej republike v rokoch 2007–2012. [Analysis of maternal morbidity and mortality in Slovak Republic in the years 2007-2012]. Ceska Gynekol. 2017;82(1):6-15 (in Slovak).
SVK Slovakia 2015 2015 31.1
European Health Information Gateway. European Health for All database (HFA-DB). Caesarean sections per 1000 live births [online database]. World Health Organization (WHO) Regional Office for Europe; 2018 (https://gateway.euro.who.int/en/indicators/hfa_596-7060-caesarean-sections-per-1000-live-births/, accessed 14 February 2019).
BMJ Publishing Group Limited (BMJ) disclaims all liability and responsibility arising from any relianceSupplemental material placed on this supplemental material which has been supplied by the author(s) BMJ Global Health
doi: 10.1136/bmjgh-2021-005671:e005671. 6 2021;BMJ Global Health, et al. Betran AP

227
ISO
Cod
e
Country
Coverag
e start
year
Covera
ge end
year
Caesare
an
section
rate (%)
References
SVN Slovenia 1990 1990 8.6
European Health for All Database (HFA-DB) [online database]. World Health Organization (WHO) Regional Office for Europe; 2012 (http://data.euro.who.int/hfadb, accessed 20 August 2012).
SVN Slovenia 1991 1991 8.9
European Health for All Database (HFA-DB) [online database]. World Health Organization (WHO) Regional Office for Europe; 2012 (http://data.euro.who.int/hfadb, accessed 20 August 2012).
SVN Slovenia 1992 1992 9.1
European Health for All Database (HFA-DB) [online database]. World Health Organization (WHO) Regional Office for Europe; 2012 (http://data.euro.who.int/hfadb, accessed 20 August 2012).
SVN Slovenia 1993 1993 9.6
European Health for All Database (HFA-DB) [online database]. World Health Organization (WHO) Regional Office for Europe; 2012 (http://data.euro.who.int/hfadb, accessed 20 August 2012).
SVN Slovenia 1994 1994 9.4
European Health for All Database (HFA-DB) [online database]. World Health Organization (WHO) Regional Office for Europe; 2012 (http://data.euro.who.int/hfadb, accessed 20 August 2012).
SVN Slovenia 1995 1995 9.2
European Health for All Database (HFA-DB) [online database]. World Health Organization (WHO) Regional Office for Europe; 2012 (http://data.euro.who.int/hfadb, accessed 20 August 2012).
SVN Slovenia 1996 1996 10.0
European Health for All Database (HFA-DB) [online database]. World Health Organization (WHO) Regional Office for Europe; 2012 (http://data.euro.who.int/hfadb, accessed 20 August 2012).
SVN Slovenia 1997 1997 10.2
European Health for All Database (HFA-DB) [online database]. World Health Organization (WHO) Regional Office for Europe; 2012 (http://data.euro.who.int/hfadb, accessed 20 August 2012).
BMJ Publishing Group Limited (BMJ) disclaims all liability and responsibility arising from any relianceSupplemental material placed on this supplemental material which has been supplied by the author(s) BMJ Global Health
doi: 10.1136/bmjgh-2021-005671:e005671. 6 2021;BMJ Global Health, et al. Betran AP

228
ISO
Cod
e
Country
Coverag
e start
year
Covera
ge end
year
Caesare
an
section
rate (%)
References
SVN Slovenia 1998 1998 10.3
European Health for All Database (HFA-DB) [online database]. World Health Organization (WHO) Regional Office for Europe; 2012 (http://data.euro.who.int/hfadb, accessed 20 August 2012).
SVN Slovenia 1999 1999 9.7
Perinatalni informacijski sistem Slovenije. Primerjava podatkov med regijami za leto 2003 [Perinatal Information System of the Republic of Slovenia. Comparison of data between regions for the year 2003]. Ljubljana: Inštitut za varovanje zdravja Republike Slovenije [National Institute of Public Health, Republic of Slovenia]; 2004 (in Slovene).
SVN Slovenia 2000 2000 11.0
European Health for All Database (HFA-DB) [online database]. World Health Organization (WHO) Regional Office for Europe; 2012 (http://data.euro.who.int/hfadb, accessed 20 August 2012).
SVN Slovenia 2001 2001 12.5
Perinatalni informacijski sistem Slovenije. Primerjava podatkov med regijami in porodnišnicami za leto 2001 [Perinatal Information System of the Republic of Slovenia. Comparison of data between regions and nursing homes for the year 2001]. Ljubljana: Inštitut za varovanje zdravja Republike Slovenije [National Institute of Public Health, Republic of Slovenia]; 2003 (in Slovene).
SVN Slovenia 2002 2002 13.6
Perinatalni informacijski sistem Slovenije. Primerjava podatkov med regijami in porodnišnicami za leto 2002 [Perinatal Information System of the Republic of Slovenia. Comparison of data between regions and nursing homes for the year 2002]. Ljubljana: Inštitut za varovanje zdravja Republike Slovenije [National Institute of Public Health, Republic of Slovenia]; 2004 (in Slovene).
SVN Slovenia 2003 2003 13.7
Perinatalni informacijski sistem Slovenije. Primerjava podatkov med regijami za leto 2003 [Perinatal Information System of the Republic of Slovenia. Comparison of data between regions for the year 2003]. Ljubljana: Inštitut za varovanje zdravja Republike Slovenije [National Institute of Public Health, Republic of Slovenia]; 2004 (in Slovene).
SVN Slovenia 2004 2004 13.6
Perinatalni informacijski sistem Slovenije. Primerjava podatkov med regijami za leto 2004 [Perinatal Information System of the Republic of Slovenia. Comparison of data between regions for the year 2004]. Ljubljana: Inštitut za varovanje zdravja Republike Slovenije [National Institute of Public Health, Republic of Slovenia]; 2005 (in Slovene).
SVN Slovenia 2005 2005 15.5
European Health for All Database (HFA-DB) [online database]. World Health Organization (WHO) Regional Office for Europe; 2012 (http://data.euro.who.int/hfadb, accessed 20 August 2012).
BMJ Publishing Group Limited (BMJ) disclaims all liability and responsibility arising from any relianceSupplemental material placed on this supplemental material which has been supplied by the author(s) BMJ Global Health
doi: 10.1136/bmjgh-2021-005671:e005671. 6 2021;BMJ Global Health, et al. Betran AP

229
ISO
Cod
e
Country
Coverag
e start
year
Covera
ge end
year
Caesare
an
section
rate (%)
References
SVN Slovenia 2006 2006 16.4
European Health for All Database (HFA-DB) [online database]. World Health Organization (WHO) Regional Office for Europe; 2012 (http://data.euro.who.int/hfadb, accessed 20 August 2012).
SVN Slovenia 2007 2007 16.8
European Health for All Database (HFA-DB) [online database]. World Health Organization (WHO) Regional Office for Europe; 2012 (http://data.euro.who.int/hfadb, accessed 20 August 2012).
SVN Slovenia 2008 2008 18.7
European Health for All Database (HFA-DB) [online database]. World Health Organization (WHO) Regional Office for Europe; 2012 (http://data.euro.who.int/hfadb, accessed 20 August 2012).
SVN Slovenia 2009 2009 17.3
Perinatalni informacijski sistem Republike Slovenije. Primerjava podatkov med regijami za leto 2009 [Perinatal Information System of the Republic of Slovenia. Comparison of data between regions for the year 2009]. Ljubljana: Inštitut za varovanje zdravja Republike Slovenije [National Institute of Public Health, Republic of Slovenia]; 2011 (in Slovene).
SVN Slovenia 2010 2010 18.2
Perinatalni informacijski sistem Republike Slovenije. Primerjava podatkov med regijami za leto 2010 [Perinatal Information System of the Republic of Slovenia. Comparison of data between regions for the year 2010]. Ljubljana: Inštitut za varovanje zdravja Republike Slovenije [National Institute of Public Health, Republic of Slovenia]; 2012 (in Slovene).
SVN Slovenia 2011 2011 19.6
European Health for All Database (HFA-DB) [online database]. World Health Organization (WHO) Regional Office for Europe; 2016 (http://data.euro.who.int/hfadb, accessed 8 August 2016).
SVN Slovenia 2012 2012 18.9
Perinatalni informacijski sistem Republike Slovenije. Primerjava podatkov med regijami za leto 2012 [Perinatal Information System of the Republic of Slovenia. Comparison of data between regions for the year 2012]. Ljubljana: Inštitut za varovanje zdravja Republike Slovenije [National Institute of Public Health, Republic of Slovenia]; 2014 (in Slovene).
SVN Slovenia 2013 2013 20.5
European Health for All Database (HFA-DB) [online database]. World Health Organization (WHO) Regional Office for Europe; 2016 (http://data.euro.who.int/hfadb, accessed 8 August 2016).
BMJ Publishing Group Limited (BMJ) disclaims all liability and responsibility arising from any relianceSupplemental material placed on this supplemental material which has been supplied by the author(s) BMJ Global Health
doi: 10.1136/bmjgh-2021-005671:e005671. 6 2021;BMJ Global Health, et al. Betran AP

230
ISO
Cod
e
Country
Coverag
e start
year
Covera
ge end
year
Caesare
an
section
rate (%)
References
SVN Slovenia 2015 2015 21.2
European Perinatal Health Report. Core indicators of the health and care of pregnant women and babies in Europe in 2015. Euro-Peristat Project; 2018.
SLB Solomon Islands 2001 2007 6.2
National Statistics Office [Solomon Islands], Secretariat of the Pacific Community (SPC), Macro International Inc., Asian Development Bank. Solomon Islands Demographic and Health Survey 2006-2007. Noumea: SPC; 2009.
SLB Solomon Islands 2010 2015 5.9
Solomon Islands National Statistics Office, Solomon Islands Ministry of Health and Medical Services (SIMoHMS), Pacific Community (SPC), Australian Aid, United Nations Children’s Fund (UNICEF) . Solomon Islands Demographic and Health Survey 2015. Noumea: SPC; 2017.
ZAF South Africa 1993 1998 15.5
Department of Health [South Africa], Macro International. South Africa Demographic and Health Survey 1998. Pretoria, South Africa: Department of Health [South Africa]; 2002.
ZAF South Africa 1998 2003 20.6
Department of Health, Medical Research Council, ORC Macro. South Africa Demographic and Health Survey 2003. Pretoria, South Africa: Department of Health [South Africa]; 2007.
ZAF South Africa 2011 2016 24.2
National Department of Health (NDoH), Statistics South Africa (Stats SA), South African Medical Research Council (SAMRC), ICF. South Africa Demographic and Health Survey 2016: Final Report. Pretoria, South Africa and Rockville, Maryland, USA: NDoH, Stats SA, SAMRC, ICF; 2019.
SSD South Sudan 2008 2010 <1.0
The Republic of South Sudan: The Sudan Household Health Survey 2010. South Sudan: National Bureau of Statistics, Ministry of Health; 2012.
ESP Spain 1990 1990 14.2
European Health for All Database (HFA-DB) [online database]. World Health Organization (WHO) Regional Office for Europe; 2012 (http://data.euro.who.int/hfadb, accessed 20 August 2012).
BMJ Publishing Group Limited (BMJ) disclaims all liability and responsibility arising from any relianceSupplemental material placed on this supplemental material which has been supplied by the author(s) BMJ Global Health
doi: 10.1136/bmjgh-2021-005671:e005671. 6 2021;BMJ Global Health, et al. Betran AP

231
ISO
Cod
e
Country
Coverag
e start
year
Covera
ge end
year
Caesare
an
section
rate (%)
References
ESP Spain 1991 1991 15.0
European Health for All Database (HFA-DB) [online database]. World Health Organization (WHO) Regional Office for Europe; 2012 (http://data.euro.who.int/hfadb, accessed 20 August 2012).
ESP Spain 1992 1992 16.2
European Health for All Database (HFA-DB) [online database]. World Health Organization (WHO) Regional Office for Europe; 2012 (http://data.euro.who.int/hfadb, accessed 20 August 2012).
ESP Spain 1993 1993 17.3
European Health for All Database (HFA-DB) [online database]. World Health Organization (WHO) Regional Office for Europe; 2012 (http://data.euro.who.int/hfadb, accessed 20 August 2012).
ESP Spain 1994 1994 17.8
European Health for All Database (HFA-DB) [online database]. World Health Organization (WHO) Regional Office for Europe; 2012 (http://data.euro.who.int/hfadb, accessed 20 August 2012).
ESP Spain 1995 1995 18.8
European Health for All Database (HFA-DB) [online database]. World Health Organization (WHO) Regional Office for Europe; 2012 (http://data.euro.who.int/hfadb, accessed 20 August 2012).
ESP Spain 1996 1996 19.3
European Health for All Database (HFA-DB) [online database]. World Health Organization (WHO) Regional Office for Europe; 2012 (http://data.euro.who.int/hfadb, accessed 20 August 2012).
ESP Spain 1997 1997 19.8
Estadística de Establecimientos Sanitarios con Régimen de Internado. Tablas Estatales 97. 9.1 Actividad Obstétrica en los hospitales por dependencia 1997 [website]. Madrid: Ministerio de Sanidad, Servicios Sociales e Igualdad [Ministry of Health, Social Services and Equality, Spain]; 2012 (http://www.msssi.gob.es/estadEstudios/estadisticas/estHospiInternado/inforAnual/tab, accessed 8 October 2012, in Spanish).
ESP Spain 1998 1998 20.5
Estadística de Establecimientos Sanitarios con Régimen de Internado 1998. España: Ministerio de Sanidad y Consumo, Dirección General de Salud Pública; 1999 (in Spanish).
BMJ Publishing Group Limited (BMJ) disclaims all liability and responsibility arising from any relianceSupplemental material placed on this supplemental material which has been supplied by the author(s) BMJ Global Health
doi: 10.1136/bmjgh-2021-005671:e005671. 6 2021;BMJ Global Health, et al. Betran AP

232
ISO
Cod
e
Country
Coverag
e start
year
Covera
ge end
year
Caesare
an
section
rate (%)
References
ESP Spain 1999 1999 21.1
Estadística de Establecimientos Sanitarios con Régimen de Internado. Tablas Estatales 1999. 9.1 Actividad Obstétrica en los hospitales por dependencia. Año 1999 [website]. Madrid: Ministerio de Sanidad, Servicios Sociales e Igualdad [Ministry of Health, Social Services and Equality, Spain]; 2012 (http://www.msssi.gob.es/estadEstudios/estadisticas/estHospiInternado/inforAnual/tab, accessed 8 October 2012, in Spanish).
ESP Spain 2000 2000 21.7
Estadística de Establecimientos Sanitarios con Régimen de Internado. Indicadores Hospitalarios Evolución 2000-2008 (Informe resumen). Madrid: Agencia de Calidad del SNS, Instituto de Información Sanitaria [Spain]; 2010 (in Spanish).
ESP Spain 2001 2001 22.5
Estadística de Establecimientos Sanitarios con Régimen de Internado. Indicadores Hospitalarios Evolución 2000-2008 (Informe resumen). Madrid: Agencia de Calidad del SNS, Instituto de Información Sanitaria [Spain]; 2010 (in Spanish).
ESP Spain 2002 2002 23.5
Estadística de Establecimientos Sanitarios con Régimen de Internado. Indicadores Hospitalarios Evolución 2000-2008 (Informe resumen). Madrid: Agencia de Calidad del SNS, Instituto de Información Sanitaria [Spain]; 2010 (in Spanish).
ESP Spain 2003 2003 24.0
Estadística de Establecimientos Sanitarios con Régimen de Internado. Indicadores Hospitalarios Evolución 2000-2008 (Informe resumen). Madrid: Agencia de Calidad del SNS, Instituto de Información Sanitaria [Spain]; 2010 (in Spanish).
ESP Spain 2004 2004 24.3
Estadística de Establecimientos Sanitarios con Régimen de Internado. Indicadores Hospitalarios Evolución 2000-2008 (Informe resumen). Madrid: Agencia de Calidad del SNS, Instituto de Información Sanitaria [Spain]; 2010 (in Spanish).
ESP Spain 2005 2005 25.2
Estadística de Establecimientos Sanitarios con Régimen de Internado. Indicadores Hospitalarios Evolución 2000-2008 (Informe resumen). Madrid: Agencia de Calidad del SNS, Instituto de Información Sanitaria [Spain]; 2010 (in Spanish).
ESP Spain 2006 2006 26.0
Estadística de Establecimientos Sanitarios con Régimen de Internado. Indicadores Hospitalarios Evolución 2000-2008 (Informe resumen). Madrid: Agencia de Calidad del SNS, Instituto de Información Sanitaria [Spain]; 2010 (in Spanish).
BMJ Publishing Group Limited (BMJ) disclaims all liability and responsibility arising from any relianceSupplemental material placed on this supplemental material which has been supplied by the author(s) BMJ Global Health
doi: 10.1136/bmjgh-2021-005671:e005671. 6 2021;BMJ Global Health, et al. Betran AP

233
ISO
Cod
e
Country
Coverag
e start
year
Covera
ge end
year
Caesare
an
section
rate (%)
References
ESP Spain 2007 2007 25.4
Estadística de Establecimientos Sanitarios con Régimen de Internado. Indicadores Hospitalarios Evolución 2000-2008 (Informe resumen). Madrid: Agencia de Calidad del SNS, Instituto de Información Sanitaria [Spain]; 2010 (in Spanish).
ESP Spain 2008 2008 24.9
Estadística de Establecimientos Sanitarios con Régimen de Internado. Indicadores Hospitalarios Evolución 2000-2008 (Informe resumen). Madrid: Agencia de Calidad del SNS, Instituto de Información Sanitaria [Spain]; 2010 (in Spanish).
ESP Spain 2009 2009 25.3
Estadística de Establecimientos Sanitarios con Régimen de Internado (ESCRI) 2009. Tablas Nacionales. Madrid: Ministerio de Sanidad, Servicios Sociales e Igualdad [Ministry of Health, Social Services and Equality, Spain], Instituto de Información Sanitaria; 2010 (in Spanish).
ESP Spain 2010 2010 25.3
Estadística de Centros Sanitarios de atención especializada. Resultados Provisionales año 2010. Madrid: Ministerio de Sanidad, Servicios Sociales e Igualdad [Ministry of Health, Social Services and Equality, Spain], Subdirección General de Información Sanitaria e Innovación; 2011 (in Spanish).
ESP Spain 2011 2011 25.0
Estadística de Centros Sanitarios de Atención Especializada 2011. Madrid: Ministerio de Sanidad, Servicios Sociales e Igualdad [Ministry of Health, Social Services and Equality, Spain], Dirección General de Salud Pública, Calidad e Innovación, Subdirección General de Información Sanitaria e Innovación; 2013 (in Spanish).
ESP Spain 2012 2012 25.2
European Health for All Database (HFA-DB) [online database]. World Health Organization (WHO) Regional Office for Europe; 2016 (http://data.euro.who.int/hfadb, accessed 8 August 2016).
ESP Spain 2013 2013 27.3
Births. Year 2013. Births by type of delivery and order of birth [online database]. Madrid: Instituto Nacional Estadística [National Statistics Institute, Spain]; 2015 (http://www.ine.es/jaxi/tabla.do?type=pcaxis&path=/t20/e301/nacim/a2013/l1/&file=01018.px, accessed 15 January 2015).
ESP Spain 2014 2014 27.3
Nacimientos. Año 2014. Nacimientos por tipo de parto y orden del nacimiento [Births. Year 2013. Births by type of delivery and order of birth] [online database]. Madrid: Instituto Nacional Estadística [National Statistics Institute, Spain]; 2016 (http://www.ine.es/jaxi/Datos.htm?type=pcaxis&path=/t20/e301/nacim/a2014/l1/&file=01018.px, accessed 3 August 2016, in Spanish).
BMJ Publishing Group Limited (BMJ) disclaims all liability and responsibility arising from any relianceSupplemental material placed on this supplemental material which has been supplied by the author(s) BMJ Global Health
doi: 10.1136/bmjgh-2021-005671:e005671. 6 2021;BMJ Global Health, et al. Betran AP

234
ISO
Cod
e
Country
Coverag
e start
year
Covera
ge end
year
Caesare
an
section
rate (%)
References
ESP Spain 2015 2015 26.7
Nacimientos. Año 2015. Nacimientos por tipo de parto y orden del nacimiento [Births. Year 2015. Births by type of delivery and order of birth] [online database]. Madrid: Instituto Nacional Estadística [National Statistics Institute, Spain]; 2018 (http://www.ine.es/jaxi/Tabla.htm?path=/t20/e301/nacim/a2015/&file=01011.px, accessed 11 February 2019, in Spanish).
LKA Sri Lanka 2003 2003 20.0
Annual Health Statistics Sri Lanka 2003. Colombo: Medical Statistics Unit [Sri Lanka]; 2004.
LKA Sri Lanka 2005 2005 22.1
Annual Health Statistics Sri Lanka 2005. Colombo: Medical Statistics Unit [Sri Lanka]; 2006.
LKA Sri Lanka 2006 2006 23.6
Annual Health Statistics Sri Lanka 2006. Colombo: Medical Statistics Unit [Sri Lanka]; 2007.
LKA Sri Lanka 2001 2007 23.8
Department of Census and Statistics (DCS), Ministry of Healthcare and Nutrition (MOH). Sri Lanka Demographic and Health Survey 2006-07. Colombo, Sri Lanka: DCS, MOH; 2009.
LKA Sri Lanka 2007 2007 24.5
Annual Health Statistics Sri Lanka 2007. Colombo: Ministry of Healthcare and Nutrition, Department of Health Services, Medical Statistics Unit [Sri Lanka]; 2008.
LKA Sri Lanka 2008 2008 25.7
Annual Health Bulletin 2008 Sri Lanka. Colombo: Ministry of Health, Medical Statistics Unit [Sri Lanka]; 2009.
LKA Sri Lanka 2012 2012 30.5
Annual Health Bulletin 2012 Sri Lanka. Colombo: Ministry of Health, Medical Statistics Unit [Sri Lanka]; 2013.
BMJ Publishing Group Limited (BMJ) disclaims all liability and responsibility arising from any relianceSupplemental material placed on this supplemental material which has been supplied by the author(s) BMJ Global Health
doi: 10.1136/bmjgh-2021-005671:e005671. 6 2021;BMJ Global Health, et al. Betran AP

235
ISO
Cod
e
Country
Coverag
e start
year
Covera
ge end
year
Caesare
an
section
rate (%)
References
LKA Sri Lanka 2013 2013 31.3
Annual Health Bulletin 2013 Sri Lanka. Colombo: Ministry of Health, Medical Statistics Unit [Sri Lanka]; 2014.
LKA Sri Lanka 2014 2014 32.2
Annual Health Bulletin 2014 Sri Lanka. Colombo: Ministry of Health, Nutrition and Indigenous Medicine, Medical Statistics Unit [Sri Lanka]; 2016.
LKA Sri Lanka 2015 2015 33.2
Annual Health Bulletin 2015 Sri Lanka. Colombo: Ministry of Health, Nutrition and Indigenous Medicine, Medical Statistics Unit [Sri Lanka]; 2017.
LBY State of Libya 1990 1995 7.2
Jurdi R, Khawaja M. Caesarean section rates in the Arab region: a cross-national study. Health Policy Plan. 2004;19(2):101-10.
SDN Sudan 2008 2010 6.6
Sudan Household and Health Survey (SHHS2) - Round 2, 2010, National Report. Khartoum: Federal Ministry of Health, Central Bureau of Statistics; 2012.
SDN Sudan 2012 2014 9.1
Central Bureau of Statistics (CBS), United Nations Children's Fund (UNICEF) Sudan. Multiple Indicator Cluster Survey 2014 of Sudan, Final Report. Khartoum, Sudan: UNICEF, Central Bureau of Statistics (CBS); 2016.
SUR Suriname 2008 2010 19.0
Ministry of Social Affairs and Housing, General Bureau of Statistics, United Nations Children's Fund (UNICEF). Suriname Multiple Indicator Cluster Survey 2010, Final Report. Paramaribo: Ministry of Social Affairs and Housing, General Bureau of Statistics, UNICEF; 2012.
SUR Suriname 2016 2018 16.1
Suriname Multiple Indicator Cluster Survey 2018, Survey Findings Report. Paramaribo: Ministry of Social Affairs and Public Housing, United Nations Children's Fund (UNICEF); 2019.
BMJ Publishing Group Limited (BMJ) disclaims all liability and responsibility arising from any relianceSupplemental material placed on this supplemental material which has been supplied by the author(s) BMJ Global Health
doi: 10.1136/bmjgh-2021-005671:e005671. 6 2021;BMJ Global Health, et al. Betran AP

236
ISO
Cod
e
Country
Coverag
e start
year
Covera
ge end
year
Caesare
an
section
rate (%)
References
SWZ Eswatini 2001 2007 7.9
Central Statistical Office (CSO) [Swaziland], Macro International Inc. Swaziland Demographic and Health Survey 2006-07. Mbabane, Swaziland: Central Statistical Office, Macro International Inc.; 2008.
SWZ Eswatini 2008 2010 12.3
Central Statistical Office, United Nations Children's Fund (UNICEF). Swaziland Multiple Indicator Cluster Survey 2010. Final Report. Mbabane, Swaziland: Central Statistical Office, UNICEF; 2011.
SWZ Eswatini 2012 2014 11.6
Central Statistical Office, United Nations Children's Fund (UNICEF). Swaziland Multiple Indicator Cluster Survey 2014. Final Report. Mbabane, Swaziland: Central Statistical Office, UNICEF; 2016.
SWE Sweden 1990 1990 10.6
Graviditeter, förlossningar och nyfödda barn. Medicinska födelseregistret 1973-2010. Assisterad befruktning, 1991-2009. [Pregnancies, Deliveries and Newborn Infants. The Swedish Medical Birth Register 1973–2010. Assisted Reproduction, treatment 1991–2009]. Stockholm: Socialstyrelsen [The National Board of Health and Welfare, Sweden]; 2012 (in Swedish).
SWE Sweden 1991 1991 10.9
Graviditeter, förlossningar och nyfödda barn. Medicinska födelseregistret 1973-2010. Assisterad befruktning, 1991-2009. [Pregnancies, Deliveries and Newborn Infants. The Swedish Medical Birth Register 1973–2010. Assisted Reproduction, treatment 1991–2009]. Stockholm: Socialstyrelsen [The National Board of Health and Welfare, Sweden]; 2012 (in Swedish).
SWE Sweden 1992 1992 10.8
Graviditeter, förlossningar och nyfödda barn. Medicinska födelseregistret 1973-2010. Assisterad befruktning, 1991-2009. [Pregnancies, Deliveries and Newborn Infants. The Swedish Medical Birth Register 1973–2010. Assisted Reproduction, treatment 1991–2009]. Stockholm: Socialstyrelsen [The National Board of Health and Welfare, Sweden]; 2012 (in Swedish).
SWE Sweden 1993 1993 11.2
Graviditeter, förlossningar och nyfödda barn. Medicinska födelseregistret 1973-2010. Assisterad befruktning, 1991-2009. [Pregnancies, Deliveries and Newborn Infants. The Swedish Medical Birth Register 1973–2010. Assisted Reproduction, treatment 1991–2009]. Stockholm: Socialstyrelsen [The National Board of Health and Welfare, Sweden]; 2012 (in Swedish).
SWE Sweden 1994 1994 11.4
Graviditeter, förlossningar och nyfödda barn. Medicinska födelseregistret 1973-2010. Assisterad befruktning, 1991-2009. [Pregnancies, Deliveries and Newborn Infants. The Swedish Medical Birth Register 1973–2010. Assisted Reproduction, treatment 1991–2009]. Stockholm: Socialstyrelsen [The National Board of Health and Welfare, Sweden]; 2012 (in Swedish).
BMJ Publishing Group Limited (BMJ) disclaims all liability and responsibility arising from any relianceSupplemental material placed on this supplemental material which has been supplied by the author(s) BMJ Global Health
doi: 10.1136/bmjgh-2021-005671:e005671. 6 2021;BMJ Global Health, et al. Betran AP

237
ISO
Cod
e
Country
Coverag
e start
year
Covera
ge end
year
Caesare
an
section
rate (%)
References
SWE Sweden 1995 1995 11.7
Graviditeter, förlossningar och nyfödda barn. Medicinska födelseregistret 1973-2010. Assisterad befruktning, 1991-2009. [Pregnancies, Deliveries and Newborn Infants. The Swedish Medical Birth Register 1973–2010. Assisted Reproduction, treatment 1991–2009]. Stockholm: Socialstyrelsen [The National Board of Health and Welfare, Sweden]; 2012 (in Swedish).
SWE Sweden 1996 1996 12.1
Graviditeter, förlossningar och nyfödda barn. Medicinska födelseregistret 1973-2010. Assisterad befruktning, 1991-2009. [Pregnancies, Deliveries and Newborn Infants. The Swedish Medical Birth Register 1973–2010. Assisted Reproduction, treatment 1991–2009]. Stockholm: Socialstyrelsen [The National Board of Health and Welfare, Sweden]; 2012 (in Swedish).
SWE Sweden 1997 1997 12.9
Graviditeter, förlossningar och nyfödda barn. Medicinska födelseregistret 1973-2010. Assisterad befruktning, 1991-2009. [Pregnancies, Deliveries and Newborn Infants. The Swedish Medical Birth Register 1973–2010. Assisted Reproduction, treatment 1991–2009]. Stockholm: Socialstyrelsen [The National Board of Health and Welfare, Sweden]; 2012 (in Swedish).
SWE Sweden 1998 1998 13.8
Graviditeter, förlossningar och nyfödda barn. Medicinska födelseregistret 1973-2010. Assisterad befruktning, 1991-2009. [Pregnancies, Deliveries and Newborn Infants. The Swedish Medical Birth Register 1973–2010. Assisted Reproduction, treatment 1991–2009]. Stockholm: Socialstyrelsen [The National Board of Health and Welfare, Sweden]; 2012 (in Swedish).
SWE Sweden 1999 1999 14.2
Graviditeter, förlossningar och nyfödda barn. Medicinska födelseregistret 1973-2010. Assisterad befruktning, 1991-2009. [Pregnancies, Deliveries and Newborn Infants. The Swedish Medical Birth Register 1973–2010. Assisted Reproduction, treatment 1991–2009]. Stockholm: Socialstyrelsen [The National Board of Health and Welfare, Sweden]; 2012 (in Swedish).
SWE Sweden 2000 2000 14.8
Graviditeter, förlossningar och nyfödda barn. Medicinska födelseregistret 1973-2010. Assisterad befruktning, 1991-2009. [Pregnancies, Deliveries and Newborn Infants. The Swedish Medical Birth Register 1973–2010. Assisted Reproduction, treatment 1991–2009]. Stockholm: Socialstyrelsen [The National Board of Health and Welfare, Sweden]; 2012 (in Swedish).
SWE Sweden 2001 2001 16.0
Graviditeter, förlossningar och nyfödda barn. Medicinska födelseregistret 1973-2010. Assisterad befruktning, 1991-2009. [Pregnancies, Deliveries and Newborn Infants. The Swedish Medical Birth Register 1973–2010. Assisted Reproduction, treatment 1991–2009]. Stockholm: Socialstyrelsen [The National Board of Health and Welfare, Sweden]; 2012 (in Swedish).
SWE Sweden 2002 2002 16.1
Graviditeter, förlossningar och nyfödda barn. Medicinska födelseregistret 1973-2010. Assisterad befruktning, 1991-2009. [Pregnancies, Deliveries and Newborn Infants. The Swedish Medical Birth Register 1973–2010. Assisted Reproduction, treatment 1991–2009]. Stockholm: Socialstyrelsen [The National Board of Health and Welfare, Sweden]; 2012 (in Swedish).
BMJ Publishing Group Limited (BMJ) disclaims all liability and responsibility arising from any relianceSupplemental material placed on this supplemental material which has been supplied by the author(s) BMJ Global Health
doi: 10.1136/bmjgh-2021-005671:e005671. 6 2021;BMJ Global Health, et al. Betran AP

238
ISO
Cod
e
Country
Coverag
e start
year
Covera
ge end
year
Caesare
an
section
rate (%)
References
SWE Sweden 2003 2003 16.4
Graviditeter, förlossningar och nyfödda barn. Medicinska födelseregistret 1973-2010. Assisterad befruktning, 1991-2009. [Pregnancies, Deliveries and Newborn Infants. The Swedish Medical Birth Register 1973–2010. Assisted Reproduction, treatment 1991–2009]. Stockholm: Socialstyrelsen [The National Board of Health and Welfare, Sweden]; 2012 (in Swedish).
SWE Sweden 2004 2004 16.8
Graviditeter, förlossningar och nyfödda barn. Medicinska födelseregistret 1973-2010. Assisterad befruktning, 1991-2009. [Pregnancies, Deliveries and Newborn Infants. The Swedish Medical Birth Register 1973–2010. Assisted Reproduction, treatment 1991–2009]. Stockholm: Socialstyrelsen [The National Board of Health and Welfare, Sweden]; 2012 (in Swedish).
SWE Sweden 2005 2005 17.2
Graviditeter, förlossningar och nyfödda barn. Medicinska födelseregistret 1973-2010. Assisterad befruktning, 1991-2009. [Pregnancies, Deliveries and Newborn Infants. The Swedish Medical Birth Register 1973–2010. Assisted Reproduction, treatment 1991–2009]. Stockholm: Socialstyrelsen [The National Board of Health and Welfare, Sweden]; 2012 (in Swedish).
SWE Sweden 2006 2006 17.7
Graviditeter, förlossningar och nyfödda barn. Medicinska födelseregistret 1973-2010. Assisterad befruktning, 1991-2009. [Pregnancies, Deliveries and Newborn Infants. The Swedish Medical Birth Register 1973–2010. Assisted Reproduction, treatment 1991–2009]. Stockholm: Socialstyrelsen [The National Board of Health and Welfare, Sweden]; 2012 (in Swedish).
SWE Sweden 2007 2007 17.6
Graviditeter, förlossningar och nyfödda barn. Medicinska födelseregistret 1973-2010. Assisterad befruktning, 1991-2009. [Pregnancies, Deliveries and Newborn Infants. The Swedish Medical Birth Register 1973–2010. Assisted Reproduction, treatment 1991–2009]. Stockholm: Socialstyrelsen [The National Board of Health and Welfare, Sweden]; 2012 (in Swedish).
SWE Sweden 2008 2008 17.2
Graviditeter, förlossningar och nyfödda barn. Medicinska födelseregistret 1973-2010. Assisterad befruktning, 1991-2009. [Pregnancies, Deliveries and Newborn Infants. The Swedish Medical Birth Register 1973–2010. Assisted Reproduction, treatment 1991–2009]. Stockholm: Socialstyrelsen [The National Board of Health and Welfare, Sweden]; 2012 (in Swedish).
SWE Sweden 2009 2009 17.5
Graviditeter, förlossningar och nyfödda barn. Medicinska födelseregistret 1973-2010. Assisterad befruktning, 1991-2009. [Pregnancies, Deliveries and Newborn Infants. The Swedish Medical Birth Register 1973–2010. Assisted Reproduction, treatment 1991–2009]. Stockholm: Socialstyrelsen [The National Board of Health and Welfare, Sweden]; 2012 (in Swedish).
SWE Sweden 2010 2010 16.9
Graviditeter, förlossningar och nyfödda barn. Medicinska födelseregistret 1973-2010. Assisterad befruktning, 1991-2009. [Pregnancies, Deliveries and Newborn Infants. The Swedish Medical Birth Register 1973–2010. Assisted Reproduction, treatment 1991–2009]. Stockholm: Socialstyrelsen [The National Board of Health and Welfare, Sweden]; 2012 (in Swedish).
BMJ Publishing Group Limited (BMJ) disclaims all liability and responsibility arising from any relianceSupplemental material placed on this supplemental material which has been supplied by the author(s) BMJ Global Health
doi: 10.1136/bmjgh-2021-005671:e005671. 6 2021;BMJ Global Health, et al. Betran AP

239
ISO
Cod
e
Country
Coverag
e start
year
Covera
ge end
year
Caesare
an
section
rate (%)
References
SWE Sweden 2011 2011 17.0
Graviditeter, förlossningar och nyfödda barn. Medicinska födelseregistret 1973-2011. Assisterad befruktning, 1991-2010. [Pregnancies, Deliveries and Newborn Infants. The Swedish Medical Birth Register 1973–2011. Assisted Reproduction, treatment 1991–2010]. Stockholm: Socialstyrelsen [The National Board of Health and Welfare, Sweden]; 2013 (in Swedish).
SWE Sweden 2012 2012 16.3
European Health for All Database (HFA-DB) [online database]. World Health Organization (WHO) Regional Office for Europe; 2016 (http://data.euro.who.int/hfadb, accessed 8 August 2016).
SWE Sweden 2013 2013 17.3
Graviditeter, förlossningar och nyfödda barn. Medicinska födelseregistret 1973-2013. Assisterad befruktning, 1991-2012. [Pregnancies, Deliveries and Newborn Infants. The Swedish Medical Birth Register 1973–2013. Assisted Reproduction, treatment 1991–2012]. Stockholm: Socialstyrelsen [The National Board of Health and Welfare, Sweden]; 2014 (in Swedish).
SWE Sweden 2014 2014 17.7
Graviditeter, förlossningar och nyfödda barn. Medicinska födelseregistret 1973-2014. Assisterad befruktning, 1991-2013. [Pregnancies, Deliveries and Newborn Infants. The Swedish Medical Birth Register 1973–2014. Assisted Reproduction, treatment 1991–2013]. Stockholm: Socialstyrelsen [The National Board of Health and Welfare, Sweden]; 2015 (in Swedish).
SWE Sweden 2015 2015 17.4
Statistik om graviditeter, förlossningar och nyfödda barn 2015 [Statistics on Pregnancies, Deliveries and Newborn Infants 2015]. Stockholm: Socialstyrelsen [The National Board of Health and Welfare, Sweden]; 2017 (in Swedish).
SWE Sweden 2016 2016 17.6
Statistik om graviditeter, förlossningar och nyfödda barn 2016 [Statistics on Pregnancies, Deliveries and Newborn Infants 2016]. Stockholm: Socialstyrelsen [The National Board of Health and Welfare, Sweden]; 2018 (in Swedish).
SWE Sweden 2017 2017 17.3
Statistik om graviditeter, förlossningar och nyfödda barn 2017 [Statistics on Pregnancies, Deliveries and Newborn Infants 2017]. Stockholm: Socialstyrelsen [The National Board of Health and Welfare, Sweden]; 2019 (in Swedish).
SWE Sweden 2018 2018 17.3
Statistik om graviditeter, förlossningar och nyfödda barn 2018 [Statistics on Pregnancies, Deliveries and Newborn Infants 2018]. Stockholm: Socialstyrelsen [The National Board of Health and Welfare, Sweden]; 2020 (in Swedish).
BMJ Publishing Group Limited (BMJ) disclaims all liability and responsibility arising from any relianceSupplemental material placed on this supplemental material which has been supplied by the author(s) BMJ Global Health
doi: 10.1136/bmjgh-2021-005671:e005671. 6 2021;BMJ Global Health, et al. Betran AP

240
ISO
Cod
e
Country
Coverag
e start
year
Covera
ge end
year
Caesare
an
section
rate (%)
References
CHE Switzerland 1999 1999 16.8
European Health for All Database (HFA-DB) [online database]. World Health Organization (WHO) Regional Office for Europe; 2012 (http://data.euro.who.int/hfadb, accessed 20 August 2012).
CHE Switzerland 2000 2000 25.0
Gebären in Schweizer Spitälern. Spitalaufenthalte während Schwangerschaft und Entbindung. 1/2007. Neuchâtel: Bundesamt für Statistik (BFS) [Federal Statistical Office, Switzerland]; 2007 (in German).
CHE Switzerland 2001 2001 26.5
Gebären in Schweizer Spitälern. Spitalaufenthalte während Schwangerschaft und Entbindung. 1/2007. Neuchâtel: Bundesamt für Statistik (BFS) [Federal Statistical Office, Switzerland]; 2007 (in German).
CHE Switzerland 2002 2002 27.6
Gebären in Schweizer Spitälern. Spitalaufenthalte während Schwangerschaft und Entbindung. 1/2007. Neuchâtel: Bundesamt für Statistik (BFS) [Federal Statistical Office, Switzerland]; 2007 (in German).
CHE Switzerland 2003 2003 29.4
Gebären in Schweizer Spitälern. Spitalaufenthalte während Schwangerschaft und Entbindung. 1/2007. Neuchâtel: Bundesamt für Statistik (BFS) [Federal Statistical Office, Switzerland]; 2007 (in German).
CHE Switzerland 2004 2004 29.2
Gebären in Schweizer Spitälern. Spitalaufenthalte während Schwangerschaft und Entbindung. 1/2007. Neuchâtel: Bundesamt für Statistik (BFS) [Federal Statistical Office, Switzerland]; 2007 (in German).
CHE Switzerland 2005 2005 29.0
European Health for All Database (HFA-DB) [online database]. World Health Organization (WHO) Regional Office for Europe; 2012 (http://data.euro.who.int/hfadb, accessed 20 August 2012).
CHE Switzerland 2006 2006 30.7
European Health for All Database (HFA-DB) [online database]. World Health Organization (WHO) Regional Office for Europe; 2012 (http://data.euro.who.int/hfadb, accessed 20 August 2012).
BMJ Publishing Group Limited (BMJ) disclaims all liability and responsibility arising from any relianceSupplemental material placed on this supplemental material which has been supplied by the author(s) BMJ Global Health
doi: 10.1136/bmjgh-2021-005671:e005671. 6 2021;BMJ Global Health, et al. Betran AP

241
ISO
Cod
e
Country
Coverag
e start
year
Covera
ge end
year
Caesare
an
section
rate (%)
References
CHE Switzerland 2007 2007 32.2
Medizinische Statistik der Krankenhäuser. Anzahl Kaiserschnitte an Entbindungen, Erhebungsjahr 2007 [online database]. Neuchâtel: Bundesamt für Statistik (BFS) [Federal Statistical Office, Switzerland]; 2008 (http://bfs.admin.ch/bfs/portal/de/index/themen/14/04/01/data/01/05.html, accessed 7 November 2013, in German).
CHE Switzerland 2008 2008 33.0
Medizinische Statistik der Krankenhäuser. Anzahl Kaiserschnitte an Entbindungen, Erhebungsjahr 2008 [online database]. Neuchâtel: Bundesamt für Statistik (BFS) [Federal Statistical Office, Switzerland]; 2009 (http://bfs.admin.ch/bfs/portal/de/index/themen/14/04/01/data/01/05.html, accessed 7 November 2013, in German).
CHE Switzerland 2009 2009 32.8
Medizinische Statistik der Krankenhäuser. Anzahl Kaiserschnitte an Entbindungen, Erhebungsjahr 2009 [online database]. Neuchâtel: Bundesamt für Statistik (BFS) [Federal Statistical Office, Switzerland]; 2011 (http://bfs.admin.ch/bfs/portal/de/index/themen/14/04/01/data/01/05.html, accessed 7 November 2013, in German).
CHE Switzerland 2010 2010 32.8
Medizinische Statistik der Krankenhäuser. Anzahl Kaiserschnitte an Entbindungen, Erhebungsjahr 2010 [online database]. Neuchâtel: Bundesamt für Statistik (BFS) [Federal Statistical Office, Switzerland]; 2011 (http://bfs.admin.ch/bfs/portal/de/index/themen/14/04/01/data/01/05.html, accessed 7 November 2013, in German).
CHE Switzerland 2011 2011 33.3
Medizinische Statistik der Krankenhäuser. Anzahl Kaiserschnitte an Entbindungen, Erhebungsjahr 2011 [online database]. Neuchâtel: Bundesamt für Statistik (BFS) [Federal Statistical Office, Switzerland]; 2013 (http://bfs.admin.ch/bfs/portal/de, accessed 19 December 2017, in German).
CHE Switzerland 2012 2012 33.4
Medizinische Statistik der Krankenhäuser. Anzahl Kaiserschnitte an Entbindungen, Erhebungsjahr 2012 [online database]. Neuchâtel: Bundesamt für Statistik (BFS) [Federal Statistical Office, Switzerland]; 2014 (http://bfs.admin.ch/bfs/portal/de, accessed 19 December 2017, in German).
CHE Switzerland 2013 2013 33.3
Medizinische Statistik der Krankenhäuser. Anzahl Kaiserschnitte an Entbindungen, Erhebungsjahr 2013 [online database]. Neuchâtel: Bundesamt für Statistik (BFS) [Federal Statistical Office, Switzerland]; 2015 (http://bfs.admin.ch/bfs/portal/de, accessed 19 December 2017, in German).
CHE Switzerland 2014 2014 33.7
Medizinische Statistik der Krankenhäuser. Anzahl Kaiserschnitte an Entbindungen, Erhebungsjahr 2014 [online database]. Neuchâtel: Bundesamt für Statistik (BFS) [Federal Statistical Office, Switzerland]; 2015 (http://bfs.admin.ch/bfs/portal/de, accessed 19 December 2017, in German).
BMJ Publishing Group Limited (BMJ) disclaims all liability and responsibility arising from any relianceSupplemental material placed on this supplemental material which has been supplied by the author(s) BMJ Global Health
doi: 10.1136/bmjgh-2021-005671:e005671. 6 2021;BMJ Global Health, et al. Betran AP

242
ISO
Cod
e
Country
Coverag
e start
year
Covera
ge end
year
Caesare
an
section
rate (%)
References
CHE Switzerland 2015 2015 33.3
Medizinische Statistik der Krankenhäuser. Anzahl Kaiserschnitte an Entbindungen, Erhebungsjahr 2015 [online database]. Neuchâtel: Bundesamt für Statistik (BFS) [Federal Statistical Office, Switzerland]; 2017 (http://bfs.admin.ch/bfs/portal/de, accessed 19 December 2017, in German).
CHE Switzerland 2016 2016 33.2
Medizinische Statistik der Krankenhäuser. Anzahl Kaiserschnitte an Entbindungen, Erhebungsjahr 2016 [online database]. Neuchâtel: Bundesamt für Statistik (BFS) [Federal Statistical Office, Switzerland]; 2018 (https://www.bfs.admin.ch/bfs/de/home/statistiken/kataloge-datenbanken/tabellen.assetdetail.6406960.html, accessed 15 February 2019, in German).
CHE Switzerland 2017 2017 32.3
Medizinische Statistik der Krankenhäuser. Anzahl Kaiserschnitte an Entbindungen, Erhebungsjahr 2017 [online database]. Neuchâtel: Bundesamt für Statistik (BFS) [Federal Statistical Office, Switzerland]; 2018 (https://www.bfs.admin.ch/bfs/de/home/statistiken/kataloge-datenbanken/tabellen.assetdetail.6406960.html, accessed 15 February 2019, in German).
CHE Switzerland 2018 2018 32.1
Statistique médicale des hôpitaux. Nombre et taux de césariennes en fonction du nombre d'accouchements, en 2018 [online database]. Neuchâtel: Office fédéral de la statistique OFS [Federal Statistical Office, Switzerland]; 2019 (https://www.bfs.admin.ch/bfs/en/home/statistics/catalogues-databases/tables.assetdetail.10787004.html, accessed 6 March 2020, in French).
SYR Syrian Arab
Republic 1996 2001 15.0
The Family Health Survey in the Syrian Arab Republic [2001]. Syrian Arab Republic: Central Bureau of Statistics [Syrian Arab Republic], League of Arab States PAPFAM; 2002.
SYR Syrian Arab
Republic 2004 2009 26.0
Syrian Households [2009]. Syrian Arab Republic: Central Bureau of Statistics [Syrian Arab Republic], League of Arab States PAPFAM, United Nations Children’s Fund (UNICEF), United Nations Population Fund (UNFPA), World Health Organization (WHO); 2010.
TJK Tajikistan 1990 1990 1.9
European Health for All Database (HFA-DB) [online database]. World Health Organization (WHO) Regional Office for Europe; 2012 (http://data.euro.who.int/hfadb, accessed 20 August 2012).
TJK Tajikistan 1991 1991 2.1
European Health for All Database (HFA-DB) [online database]. World Health Organization (WHO) Regional Office for Europe; 2012 (http://data.euro.who.int/hfadb, accessed 20 August 2012).
BMJ Publishing Group Limited (BMJ) disclaims all liability and responsibility arising from any relianceSupplemental material placed on this supplemental material which has been supplied by the author(s) BMJ Global Health
doi: 10.1136/bmjgh-2021-005671:e005671. 6 2021;BMJ Global Health, et al. Betran AP

243
ISO
Cod
e
Country
Coverag
e start
year
Covera
ge end
year
Caesare
an
section
rate (%)
References
TJK Tajikistan 1992 1992 2.1
European Health for All Database (HFA-DB) [online database]. World Health Organization (WHO) Regional Office for Europe; 2012 (http://data.euro.who.int/hfadb, accessed 20 August 2012).
TJK Tajikistan 1993 1993 1.6
European Health for All Database (HFA-DB) [online database]. World Health Organization (WHO) Regional Office for Europe; 2012 (http://data.euro.who.int/hfadb, accessed 20 August 2012).
TJK Tajikistan 1994 1994 1.3
European Health for All Database (HFA-DB) [online database]. World Health Organization (WHO) Regional Office for Europe; 2012 (http://data.euro.who.int/hfadb, accessed 20 August 2012).
TJK Tajikistan 1995 1995 1.2
European Health for All Database (HFA-DB) [online database]. World Health Organization (WHO) Regional Office for Europe; 2012 (http://data.euro.who.int/hfadb, accessed 20 August 2012).
TJK Tajikistan 1996 1996 1.7
European Health for All Database (HFA-DB) [online database]. World Health Organization (WHO) Regional Office for Europe; 2012 (http://data.euro.who.int/hfadb, accessed 20 August 2012).
TJK Tajikistan 1997 1997 1.3
European Health for All Database (HFA-DB) [online database]. World Health Organization (WHO) Regional Office for Europe; 2012 (http://data.euro.who.int/hfadb, accessed 20 August 2012).
TJK Tajikistan 1998 1998 1.3
European Health for All Database (HFA-DB) [online database]. World Health Organization (WHO) Regional Office for Europe; 2012 (http://data.euro.who.int/hfadb, accessed 20 August 2012).
TJK Tajikistan 1999 1999 1.2
European Health for All Database (HFA-DB) [online database]. World Health Organization (WHO) Regional Office for Europe; 2012 (http://data.euro.who.int/hfadb, accessed 20 August 2012).
BMJ Publishing Group Limited (BMJ) disclaims all liability and responsibility arising from any relianceSupplemental material placed on this supplemental material which has been supplied by the author(s) BMJ Global Health
doi: 10.1136/bmjgh-2021-005671:e005671. 6 2021;BMJ Global Health, et al. Betran AP

244
ISO
Cod
e
Country
Coverag
e start
year
Covera
ge end
year
Caesare
an
section
rate (%)
References
TJK Tajikistan 2000 2000 1.5
European Health for All Database (HFA-DB) [online database]. World Health Organization (WHO) Regional Office for Europe; 2012 (http://data.euro.who.int/hfadb, accessed 20 August 2012).
TJK Tajikistan 2001 2001 1.4
European Health for All Database (HFA-DB) [online database]. World Health Organization (WHO) Regional Office for Europe; 2012 (http://data.euro.who.int/hfadb, accessed 20 August 2012).
TJK Tajikistan 2002 2002 1.6
European Health for All Database (HFA-DB) [online database]. World Health Organization (WHO) Regional Office for Europe; 2012 (http://data.euro.who.int/hfadb, accessed 20 August 2012).
TJK Tajikistan 2003 2003 1.6
European Health for All Database (HFA-DB) [online database]. World Health Organization (WHO) Regional Office for Europe; 2012 (http://data.euro.who.int/hfadb, accessed 20 August 2012).
TJK Tajikistan 2004 2004 1.9
European Health for All Database (HFA-DB) [online database]. World Health Organization (WHO) Regional Office for Europe; 2012 (http://data.euro.who.int/hfadb, accessed 20 August 2012).
TJK Tajikistan 2005 2005 2.0
European Health for All Database (HFA-DB) [online database]. World Health Organization (WHO) Regional Office for Europe; 2012 (http://data.euro.who.int/hfadb, accessed 20 August 2012).
TJK Tajikistan 2006 2006 2.1
European Health for All Database (HFA-DB) [online database]. World Health Organization (WHO) Regional Office for Europe; 2012 (http://data.euro.who.int/hfadb, accessed 20 August 2012).
TJK Tajikistan 2007 2007 2.4
European Health for All Database (HFA-DB) [online database]. World Health Organization (WHO) Regional Office for Europe; 2012 (http://data.euro.who.int/hfadb, accessed 20 August 2012).
BMJ Publishing Group Limited (BMJ) disclaims all liability and responsibility arising from any relianceSupplemental material placed on this supplemental material which has been supplied by the author(s) BMJ Global Health
doi: 10.1136/bmjgh-2021-005671:e005671. 6 2021;BMJ Global Health, et al. Betran AP

245
ISO
Cod
e
Country
Coverag
e start
year
Covera
ge end
year
Caesare
an
section
rate (%)
References
TJK Tajikistan 2008 2008 2.8
European Health for All Database (HFA-DB) [online database]. World Health Organization (WHO) Regional Office for Europe; 2012 (http://data.euro.who.int/hfadb, accessed 20 August 2012).
TJK Tajikistan 2011 2011 4.1
European Health for All Database (HFA-DB) [online database]. World Health Organization (WHO) Regional Office for Europe; 2016 (http://data.euro.who.int/hfadb, accessed 8 August 2016).
TJK Tajikistan 2012 2012 4.6
European Health for All Database (HFA-DB) [online database]. World Health Organization (WHO) Regional Office for Europe; 2016 (http://data.euro.who.int/hfadb, accessed 8 August 2016).
TJK Tajikistan 2007 2012 4.0
Statistical Agency under the President of the Republic of Tajikistan (SA), Ministry of Health [Tajikistan], ICF International. Tajikistan Demographic and Health Survey 2012. Dushanbe, Tajikistan, Calverton, Maryland, USA: SA, MOH, ICF International; 2013.
TJK Tajikistan 2013 2013 6.0
European Health for All Database (HFA-DB) [online database]. World Health Organization (WHO) Regional Office for Europe; 2016 (http://data.euro.who.int/hfadb, accessed 8 August 2016).
TJK Tajikistan 2012 2017 5.3
Tajikistan Demographic and Health Survey 2017. Rockville, Maryland, USA: Statistical Agency under the President of the Republic of Tajikistan (SA), Ministry of Health and Social Protection of Population of the Republic of Tajikistan (MOHSP), ICF; 2018.
THA Thailand 1990 1990 15.2
Hanvoravongchai P, Letiendumrong J, Teerawattananon Y, Tangcharoensathien V. Implications of Private Practice in Public Hospitals on the Cesarean Section Rate in Thailand. Human resources for health development journal: HRDJ. 2000;4:2-12.
THA Thailand 1991 1991 16.0
Hanvoravongchai P, Letiendumrong J, Teerawattananon Y, Tangcharoensathien V. Implications of Private Practice in Public Hospitals on the Cesarean Section Rate in Thailand. Human resources for health development journal: HRDJ. 2000;4:2-12.
BMJ Publishing Group Limited (BMJ) disclaims all liability and responsibility arising from any relianceSupplemental material placed on this supplemental material which has been supplied by the author(s) BMJ Global Health
doi: 10.1136/bmjgh-2021-005671:e005671. 6 2021;BMJ Global Health, et al. Betran AP

246
ISO
Cod
e
Country
Coverag
e start
year
Covera
ge end
year
Caesare
an
section
rate (%)
References
THA Thailand 1992 1992 17.0
Hanvoravongchai P, Letiendumrong J, Teerawattananon Y, Tangcharoensathien V. Implications of Private Practice in Public Hospitals on the Cesarean Section Rate in Thailand. Human resources for health development journal: HRDJ. 2000;4:2-12.
THA Thailand 1993 1993 18.4
Hanvoravongchai P, Letiendumrong J, Teerawattananon Y, Tangcharoensathien V. Implications of Private Practice in Public Hospitals on the Cesarean Section Rate in Thailand. Human resources for health development journal: HRDJ. 2000;4:2-12.
THA Thailand 1994 1994 20.0
Hanvoravongchai P, Letiendumrong J, Teerawattananon Y, Tangcharoensathien V. Implications of Private Practice in Public Hospitals on the Cesarean Section Rate in Thailand. Human resources for health development journal: HRDJ. 2000;4:2-12.
THA Thailand 1995 1995 21.1
Hanvoravongchai P, Letiendumrong J, Teerawattananon Y, Tangcharoensathien V. Implications of Private Practice in Public Hospitals on the Cesarean Section Rate in Thailand. Human resources for health development journal: HRDJ. 2000;4:2-12.
THA Thailand 1996 1996 22.4
Hanvoravongchai P, Letiendumrong J, Teerawattananon Y, Tangcharoensathien V. Implications of Private Practice in Public Hospitals on the Cesarean Section Rate in Thailand. Human resources for health development journal: HRDJ. 2000;4:2-12.
THA Thailand 2010 2012 32.0
National Statistical Office (NSO), United Nations Children's Fund (UNICEF). Thailand Multiple Indicator Cluster Survey 2012. Final Report. Bangkok: NSO, UNICEF; 2013.
THA Thailand 2013 2016 32.7
National Statistical Office (NSO), United Nations Children's Fund (UNICEF). Thailand Multiple Indicator Cluster Survey 2015-16. Final Report. Bangkok: NSO, UNICEF; 2016.
MKD The former Yugoslav
Republic of Macedonia
1995 1995 1.4
European Health for All Database (HFA-DB) [online database]. World Health Organization (WHO) Regional Office for Europe; 2012 (http://data.euro.who.int/hfadb, accessed 20 August 2012).
BMJ Publishing Group Limited (BMJ) disclaims all liability and responsibility arising from any relianceSupplemental material placed on this supplemental material which has been supplied by the author(s) BMJ Global Health
doi: 10.1136/bmjgh-2021-005671:e005671. 6 2021;BMJ Global Health, et al. Betran AP

247
ISO
Cod
e
Country
Coverag
e start
year
Covera
ge end
year
Caesare
an
section
rate (%)
References
MKD The former Yugoslav
Republic of Macedonia
1997 1997 7.8
European Health for All Database (HFA-DB) [online database]. World Health Organization (WHO) Regional Office for Europe; 2012 (http://data.euro.who.int/hfadb, accessed 20 August 2012).
MKD The former Yugoslav
Republic of Macedonia
1998 1998 8.6
European Health for All Database (HFA-DB) [online database]. World Health Organization (WHO) Regional Office for Europe; 2012 (http://data.euro.who.int/hfadb, accessed 20 August 2012).
MKD The former Yugoslav
Republic of Macedonia
1999 1999 9.8
European Health for All Database (HFA-DB) [online database]. World Health Organization (WHO) Regional Office for Europe; 2012 (http://data.euro.who.int/hfadb, accessed 20 August 2012).
MKD The former Yugoslav
Republic of Macedonia
2000 2000 9.1
European Health for All Database (HFA-DB) [online database]. World Health Organization (WHO) Regional Office for Europe; 2012 (http://data.euro.who.int/hfadb, accessed 20 August 2012).
MKD The former Yugoslav
Republic of Macedonia
2001 2001 10.2
European Health for All Database (HFA-DB) [online database]. World Health Organization (WHO) Regional Office for Europe; 2012 (http://data.euro.who.int/hfadb, accessed 20 August 2012).
MKD The former Yugoslav
Republic of Macedonia
2002 2002 10.5
European Health for All Database (HFA-DB) [online database]. World Health Organization (WHO) Regional Office for Europe; 2012 (http://data.euro.who.int/hfadb, accessed 20 August 2012).
MKD The former Yugoslav
Republic of Macedonia
2003 2003 11.4
European Health for All Database (HFA-DB) [online database]. World Health Organization (WHO) Regional Office for Europe; 2012 (http://data.euro.who.int/hfadb, accessed 20 August 2012).
MKD The former Yugoslav
Republic of Macedonia
2006 2006 16.9
European Health for All Database (HFA-DB) [online database]. World Health Organization (WHO) Regional Office for Europe; 2012 (http://data.euro.who.int/hfadb, accessed 20 August 2012).
BMJ Publishing Group Limited (BMJ) disclaims all liability and responsibility arising from any relianceSupplemental material placed on this supplemental material which has been supplied by the author(s) BMJ Global Health
doi: 10.1136/bmjgh-2021-005671:e005671. 6 2021;BMJ Global Health, et al. Betran AP

248
ISO
Cod
e
Country
Coverag
e start
year
Covera
ge end
year
Caesare
an
section
rate (%)
References
MKD The former Yugoslav
Republic of Macedonia
2007 2007 19.8
European Health for All Database (HFA-DB) [online database]. World Health Organization (WHO) Regional Office for Europe; 2012 (http://data.euro.who.int/hfadb, accessed 20 August 2012).
MKD The former Yugoslav
Republic of Macedonia
2008 2008 18.0
European Health for All Database (HFA-DB) [online database]. World Health Organization (WHO) Regional Office for Europe; 2012 (http://data.euro.who.int/hfadb, accessed 20 August 2012).
MKD The former Yugoslav
Republic of Macedonia
2009 2009 17.6
European Health for All Database (HFA-DB) [online database]. World Health Organization (WHO) Regional Office for Europe; 2012 (http://data.euro.who.int/hfadb, accessed 20 August 2012).
MKD The former Yugoslav
Republic of Macedonia
2009 2011 24.9
Macedonia Multiple Indicator Cluster Survey 2011 (MICS 2011). Republic of Macedonia: Ministry of Health, Ministry of Education and Science, Ministry of Labour and Social Policy of the Government of Republic of Macedonia, United Nations Children's Fund (UNICEF), United Nations Population Fund (UNFPA); 2014.
MKD The former Yugoslav
Republic of Macedonia
2011 2011 23.4
European Health for All Database (HFA-DB) [online database]. World Health Organization (WHO) Regional Office for Europe; 2016 (http://data.euro.who.int/hfadb, accessed 8 August 2016).
MKD The former Yugoslav
Republic of Macedonia
2012 2012 24.9
European Health for All Database (HFA-DB) [online database]. World Health Organization (WHO) Regional Office for Europe; 2016 (http://data.euro.who.int/hfadb, accessed 8 August 2016).
MKD The former Yugoslav
Republic of Macedonia
2013 2013 27.4
European Health for All Database (HFA-DB) [online database]. World Health Organization (WHO) Regional Office for Europe; 2016 (http://data.euro.who.int/hfadb, accessed 8 August 2016).
MKD The former Yugoslav
Republic of Macedonia
2014 2014 28.9
European Health for All Database (HFA-DB) [online database]. World Health Organization (WHO) Regional Office for Europe; 2016 (http://data.euro.who.int/hfadb, accessed 8 August 2016).
BMJ Publishing Group Limited (BMJ) disclaims all liability and responsibility arising from any relianceSupplemental material placed on this supplemental material which has been supplied by the author(s) BMJ Global Health
doi: 10.1136/bmjgh-2021-005671:e005671. 6 2021;BMJ Global Health, et al. Betran AP

249
ISO
Cod
e
Country
Coverag
e start
year
Covera
ge end
year
Caesare
an
section
rate (%)
References
TLS Timor-Leste 1998 2003 0.3
Ministry of Health and National Statistics Office [Timor-Leste], University of Newcastle [Australia], The Australian National University [Australia], ACIL Australia Pty Ltd [Australia]. Timor-Leste 2003 Demographic and Health Survey. Newcastle: University of Newcastle; 2004.
TLS Timor-Leste 2004 2010 1.7
National Statistics Directorate (NSD) [Timor-Leste], Ministry of Finance [Timor-Leste], ICF Macro. Timor-Leste Demographic and Health Survey 2009-10. Dili, Timor-Leste: NSD [Timor-Leste], ICF Macro; 2010.
TLS Timor-Leste 2011 2016 3.5
Timor-Leste Demographic and Health Survey 2016. Dili, Timor-Leste and Rockville, Maryland, USA: General Directorate of Statistics (GDS), ICF; 2018.
TGO Togo 1995 1998 2.0
Anipah K, Mboup G, Ouro-Gnao AM, Boukpessi B, Messan PA, Salami-Odjo R (Ministère de la Planification et du Développement Economique Direction de la Statistique, Macro International Inc). Enquête Démographique et de Santé, Togo 1998. Calverton, Maryland USA: Ministère de la Planification et du Développement Economique Direction de la Statistique, Macro International Inc.; 1999 (in French).
TGO Togo 2008 2010 8.8
Enquête par grappes à indicateurs multiples MICS Togo, 2010, Rapport final. Lomé: Direction Générale de la Statistique et de la Comptabilité Nationale (DGSCN), Fonds des Nations Unies pour l'Enfance (UNICEF); 2012 (in French).
TGO Togo 2008 2014 6.5
Ministère de la Planification, du Développement et de l’Aménagement du Territoire (MPDAT), Ministère de la Santé (MS), ICF International. Enquête Démographique et de Santé au Togo 2013-2014. Rockville, Maryland, USA : MPDAT, MS, ICF International; 2015 (in French).
TGO Togo 2015 2017 8.6
Enquête par grappes à indicateurs multiples (MICS6) Togo, 2017, Rapport final. Lomé: Institut National de la Statistique et des Etudes Economiques et Démographiques (INSEED), UNICEF; 2018 (in French).
TON Tonga 2001 2001 5.8
Report of the Minister of Health for the Year 2005. Tonga: Ministry of Health [Tonga]; 2006.
BMJ Publishing Group Limited (BMJ) disclaims all liability and responsibility arising from any relianceSupplemental material placed on this supplemental material which has been supplied by the author(s) BMJ Global Health
doi: 10.1136/bmjgh-2021-005671:e005671. 6 2021;BMJ Global Health, et al. Betran AP

250
ISO
Cod
e
Country
Coverag
e start
year
Covera
ge end
year
Caesare
an
section
rate (%)
References
TON Tonga 2002 2002 8.9
Report of the Minister of Health for the Year 2005. Tonga: Ministry of Health [Tonga]; 2006.
TON Tonga 2003 2003 8.4
Report of the Minister of Health for the Year 2005. Tonga: Ministry of Health [Tonga]; 2006.
TON Tonga 2004 2004 9.6
Report of the Minister of Health for the Year 2005. Tonga: Ministry of Health [Tonga]; 2006.
TON Tonga 2005 2005 11.1
Report of the Minister of Health for the Year 2005. Tonga: Ministry of Health [Tonga]; 2006.
TON Tonga 2007 2012 17.4
Tonga Department of Statistics and Tonga Ministry of Health, Secretariat of the Pacific Community (SPC), United Nations Population Fund (UNFPA). Tonga Demographic and Health Survey 2012. Final Report. Noumea: SPC; 2013.
TTO Trinidad and Tobago 2007 2007 18.4
Mungrue K, Nixon C, David Y, Dookwah D, Durga S, Greene K et al. Trinidadian women’s knowledge, perceptions, and preferences regarding cesarean section: How do they make choices? Int J Womens Health. 2010;2:387-91.
TUN Tunisia 1989 1995 9.9
L'Enquête Tunisienne sur la Santé de la Mère et de l'Enfant 1994-1995 (ETSME). Rapport Principal. Tunisie; Ministère de la Santé Publique; 1996 (in French).
TUN Tunisia 1999 2000 17.8
Enquête sur la Santé et le Bien-être de la Mère et l'Enfant 2000 (MICS 2). Tunis: Ministère de la Santé Publique [Tunisie], Fonds des Nations Unies pour l’Enfance (UNICEF); 2000 (in French).
BMJ Publishing Group Limited (BMJ) disclaims all liability and responsibility arising from any relianceSupplemental material placed on this supplemental material which has been supplied by the author(s) BMJ Global Health
doi: 10.1136/bmjgh-2021-005671:e005671. 6 2021;BMJ Global Health, et al. Betran AP

251
ISO
Cod
e
Country
Coverag
e start
year
Covera
ge end
year
Caesare
an
section
rate (%)
References
TUN Tunisia 2001 2006 20.5
Enquête sur la Santé et le Bien-être de la Mère et l'Enfant 2006 (MICS 3). Tunis: Ministère de la Santé Publique [Tunisie], Fonds des Nations Unies pour l’Enfance (UNICEF); 2008 (in French).
TUN Tunisia 2009 2012 26.7
Ministère du Développement et de la Coopération Internationale (MDCI), Institut National de la Statistique, Fonds des Nations Unies pour l’Enfance (UNICEF). Suivi de la situation des enfants et des femmes en Tunisie - Enquête par grappes à indicateurs multiples 2011-2012, Rapport Final. Tunisie: MDCI, Institut National de la Statistique, UNICEF; 2013 (in French).
TUN Tunisia 2016 2018 43.2
Institut National de la Statistique, UNICEF. Enquête par grappes à indicateurs multiples (MICS) 2018, Rapport Final. Tunisie: Le Ministère du Développement de l'Investissement et de la Coopération Internationale (MDICI); 2019 (in French).
TUR Turkey 1993 1998 13.9
Ministry of Health [Turkey], Hacettepe University Institute of Population Studies [Turkey], Macro International. Turkish Demographic and Health Survey 1993. Ankara, Turkey: Ministry of Health [Turkey], Hacettepe University Institute of Population Studies [Turkey], Macro International; 1994.
TUR Turkey 1998 2003 21.2
Hacettepe University Institute of Population Studies [Turkey]. Turkey Demographic and Health Survey, 2003. Ankara, Turkey: Hacettepe University Institute of Population Studies [Turkey], Ministry of Health General Directorate of Mother and Child Health and Family Planning [Turkey], State Planning Organization, European Union; 2004.
TUR Turkey 2007 2007 37.5
European Health for All Database (HFA-DB) [online database]. World Health Organization (WHO) Regional Office for Europe; 2012 (http://data.euro.who.int/hfadb, accessed 20 August 2012).
TUR Turkey 2003 2008 36.7
Hacettepe University Institute of Population Studies. Turkey Demographic and Health Survey, 2008. Ankara, Turkey: Hacettepe University Institute of Population Studies, Ministry of Health General Directorate of Mother and Child Health and Family Planning, T.R. Prime Ministry Undersecretary of State Planning Organization, TÜBİTAK; 2009.
TUR Turkey 2008 2008 40.9
European Health for All Database (HFA-DB) [online database]. World Health Organization (WHO) Regional Office for Europe; 2012 (http://data.euro.who.int/hfadb, accessed 20 August 2012).
BMJ Publishing Group Limited (BMJ) disclaims all liability and responsibility arising from any relianceSupplemental material placed on this supplemental material which has been supplied by the author(s) BMJ Global Health
doi: 10.1136/bmjgh-2021-005671:e005671. 6 2021;BMJ Global Health, et al. Betran AP

252
ISO
Cod
e
Country
Coverag
e start
year
Covera
ge end
year
Caesare
an
section
rate (%)
References
TUR Turkey 2009 2009 44.5
European Health for All Database (HFA-DB) [online database]. World Health Organization (WHO) Regional Office for Europe; 2012 (http://data.euro.who.int/hfadb, accessed 20 August 2012).
TUR Turkey 2012 2012 47.7
European Health for All Database (HFA-DB) [online database]. World Health Organization (WHO) Regional Office for Europe; 2016 (http://data.euro.who.int/hfadb, accessed 8 August 2016).
TUR Turkey 2013 2013 50.4
European Health for All Database (HFA-DB) [online database]. World Health Organization (WHO) Regional Office for Europe; 2016 (http://data.euro.who.int/hfadb, accessed 8 August 2016).
TUR Turkey 2008 2013 48.1
Hacettepe University Institute of Population Studies. 2013 Turkey Demographic and Health Survey. Ankara, Turkey: Hacettepe University Institute of Population Studies, T.R. Ministry of Development, TÜBİTAK; 2014.
TUR Turkey 2014 2014 50.8
European Health Information Gateway. European Health for All database (HFA-DB). Caesarean sections per 1000 live births [online database]. World Health Organization (WHO) Regional Office for Europe; 2018 (https://gateway.euro.who.int/en/indicators/hfa_596-7060-caesarean-sections-per-1000-live-births/, accessed 14 February 2019).
TKM Turkmenistan 1991 1991 3.0
European Health for All Database (HFA-DB) [online database]. World Health Organization (WHO) Regional Office for Europe; 2012 (http://data.euro.who.int/hfadb, accessed 20 August 2012).
TKM Turkmenistan 1992 1992 2.7
European Health for All Database (HFA-DB) [online database]. World Health Organization (WHO) Regional Office for Europe; 2012 (http://data.euro.who.int/hfadb, accessed 20 August 2012).
TKM Turkmenistan 1993 1993 2.8
European Health for All Database (HFA-DB) [online database]. World Health Organization (WHO) Regional Office for Europe; 2012 (http://data.euro.who.int/hfadb, accessed 20 August 2012).
BMJ Publishing Group Limited (BMJ) disclaims all liability and responsibility arising from any relianceSupplemental material placed on this supplemental material which has been supplied by the author(s) BMJ Global Health
doi: 10.1136/bmjgh-2021-005671:e005671. 6 2021;BMJ Global Health, et al. Betran AP

253
ISO
Cod
e
Country
Coverag
e start
year
Covera
ge end
year
Caesare
an
section
rate (%)
References
TKM Turkmenistan 1994 1994 2.5
European Health for All Database (HFA-DB) [online database]. World Health Organization (WHO) Regional Office for Europe; 2012 (http://data.euro.who.int/hfadb, accessed 20 August 2012).
TKM Turkmenistan 1995 1995 2.5
European Health for All Database (HFA-DB) [online database]. World Health Organization (WHO) Regional Office for Europe; 2012 (http://data.euro.who.int/hfadb, accessed 20 August 2012).
TKM Turkmenistan 1996 1996 2.6
European Health for All Database (HFA-DB) [online database]. World Health Organization (WHO) Regional Office for Europe; 2012 (http://data.euro.who.int/hfadb, accessed 20 August 2012).
TKM Turkmenistan 1995 2000 3.1
Gurbansoltan Eje Clinical Research Center for Maternal and Child Health (GECRCMCH), Ministry of Health and Medical Industry [Turkmenistan], ORC Macro. Turkmenistan Demographic and Health Survey 2000. Calverton, Maryland, USA: GECRCMCH, ORC Macro; 2001.
TKM Turkmenistan 2000 2000 3.2
European Health for All Database (HFA-DB) [online database]. World Health Organization (WHO) Regional Office for Europe; 2012 (http://data.euro.who.int/hfadb, accessed 20 August 2012).
TKM Turkmenistan 2001 2001 3.1
European Health for All Database (HFA-DB) [online database]. World Health Organization (WHO) Regional Office for Europe; 2012 (http://data.euro.who.int/hfadb, accessed 20 August 2012).
TKM Turkmenistan 2002 2002 3.4
European Health for All Database (HFA-DB) [online database]. World Health Organization (WHO) Regional Office for Europe; 2012 (http://data.euro.who.int/hfadb, accessed 20 August 2012).
TKM Turkmenistan 2003 2003 3.0
European Health for All Database (HFA-DB) [online database]. World Health Organization (WHO) Regional Office for Europe; 2012 (http://data.euro.who.int/hfadb, accessed 20 August 2012).
BMJ Publishing Group Limited (BMJ) disclaims all liability and responsibility arising from any relianceSupplemental material placed on this supplemental material which has been supplied by the author(s) BMJ Global Health
doi: 10.1136/bmjgh-2021-005671:e005671. 6 2021;BMJ Global Health, et al. Betran AP

254
ISO
Cod
e
Country
Coverag
e start
year
Covera
ge end
year
Caesare
an
section
rate (%)
References
TKM Turkmenistan 2004 2004 2.5
European Health for All Database (HFA-DB) [online database]. World Health Organization (WHO) Regional Office for Europe; 2012 (http://data.euro.who.int/hfadb, accessed 20 August 2012).
TKM Turkmenistan 2005 2005 3.2
European Health for All Database (HFA-DB) [online database]. World Health Organization (WHO) Regional Office for Europe; 2012 (http://data.euro.who.int/hfadb, accessed 20 August 2012).
TKM Turkmenistan 2006 2006 3.4
European Health for All Database (HFA-DB) [online database]. World Health Organization (WHO) Regional Office for Europe; 2012 (http://data.euro.who.int/hfadb, accessed 20 August 2012).
TKM Turkmenistan 2007 2007 3.8
European Health for All Database (HFA-DB) [online database]. World Health Organization (WHO) Regional Office for Europe; 2012 (http://data.euro.who.int/hfadb, accessed 20 August 2012).
TKM Turkmenistan 2008 2008 3.9
European Health for All Database (HFA-DB) [online database]. World Health Organization (WHO) Regional Office for Europe; 2012 (http://data.euro.who.int/hfadb, accessed 20 August 2012).
TKM Turkmenistan 2009 2009 4.5
European Health for All Database (HFA-DB) [online database]. World Health Organization (WHO) Regional Office for Europe; 2012 (http://data.euro.who.int/hfadb, accessed 20 August 2012).
TKM Turkmenistan 2010 2010 4.7
European Health for All Database (HFA-DB) [online database]. World Health Organization (WHO) Regional Office for Europe; 2016 (http://data.euro.who.int/hfadb, accessed 8 August 2016).
TKM Turkmenistan 2011 2011 5.9
European Health for All Database (HFA-DB) [online database]. World Health Organization (WHO) Regional Office for Europe; 2016 (http://data.euro.who.int/hfadb, accessed 8 August 2016).
BMJ Publishing Group Limited (BMJ) disclaims all liability and responsibility arising from any relianceSupplemental material placed on this supplemental material which has been supplied by the author(s) BMJ Global Health
doi: 10.1136/bmjgh-2021-005671:e005671. 6 2021;BMJ Global Health, et al. Betran AP

255
ISO
Cod
e
Country
Coverag
e start
year
Covera
ge end
year
Caesare
an
section
rate (%)
References
TKM Turkmenistan 2012 2012 6.6
European Health for All Database (HFA-DB) [online database]. World Health Organization (WHO) Regional Office for Europe; 2016 (http://data.euro.who.int/hfadb, accessed 8 August 2016).
TKM Turkmenistan 2013 2013 7.5
European Health for All Database (HFA-DB) [online database]. World Health Organization (WHO) Regional Office for Europe; 2016 (http://data.euro.who.int/hfadb, accessed 8 August 2016).
TKM Turkmenistan 2013 2016 6.3
The State Committee of Statistics of Turkmenistan, United Nations Children's Fund (UNICEF). 2015-2016 Turkmenistan Multiple Indicator Cluster Survey, Final Report. Ashgabat, Turkmenistan: The State Committee of Statistics of Turkmenistan, UNICEF; 2016.
TKM Turkmenistan 2017 2017 8.4
European Health Information Gateway. European Health for All database (HFA-DB). Caesarean sections per 1000 live births [online database]. World Health Organization (WHO) Regional Office for Europe; 2019 (https://gateway.euro.who.int/en/indicators/hfa_596-7060-caesarean-sections-per-1000-live-births/, accessed 5 March 2020).
TKM Turkmenistan 2018 2018 9.3
European Health Information Gateway. European Health for All database (HFA-DB). Caesarean sections per 1000 live births [online database]. World Health Organization (WHO) Regional Office for Europe; 2019 (https://gateway.euro.who.int/en/indicators/hfa_596-7060-caesarean-sections-per-1000-live-births/, accessed 5 March 2020).
TUV Tuvalu 2002 2007 7.1
Central Statistics Division [Tuvalu], Secretariat of the Pacific Community (SPC), Macro International Inc., Asian Development Bank. Tuvalu Demographic and Health Survey 2007. Noumea: SPC; 2009.
UGA Uganda 1990 1995 2.6
Statistics Department [Uganda], Macro International Inc. Uganda Demographic and Health Survey, 1995. Calverton, Maryland: Statistics Department [Uganda], Macro International Inc.; 1996.
UGA Uganda 1995 2001 2.5
Uganda Bureau of Statistics (UBOS), ORC Macro. Uganda Demographic and Health Survey 2000-2001. Calverton, Maryland, USA: UBOS, ORC Macro; 2001.
BMJ Publishing Group Limited (BMJ) disclaims all liability and responsibility arising from any relianceSupplemental material placed on this supplemental material which has been supplied by the author(s) BMJ Global Health
doi: 10.1136/bmjgh-2021-005671:e005671. 6 2021;BMJ Global Health, et al. Betran AP

256
ISO
Cod
e
Country
Coverag
e start
year
Covera
ge end
year
Caesare
an
section
rate (%)
References
UGA Uganda 2001 2006 3.1
Uganda Bureau of Statistics (UBOS), Macro International Inc. Uganda Demographic and Health Survey 2006. Calverton, Maryland, USA: UBOS, Macro International Inc.; 2007.
UGA Uganda 2006 2011 5.3
Uganda Bureau of Statistics (UBOS), ICF International. Uganda Demographic and Health Survey 2011. Kampala, Uganda: UBOS, ICF International; 2012.
UGA Uganda 2011 2016 6.2
Uganda Bureau of Statistics (UBOS), ICF. Uganda Demographic and Health Survey 2016. Kampala, Uganda and Rockville, Maryland, USA: UBOS, ICF; 2018.
UKR Ukraine 1990 1990 5.7
European Health for All Database (HFA-DB) [online database]. World Health Organization (WHO) Regional Office for Europe; 2012 (http://data.euro.who.int/hfadb, accessed 20 August 2012).
UKR Ukraine 1991 1991 6.2
European Health for All Database (HFA-DB) [online database]. World Health Organization (WHO) Regional Office for Europe; 2012 (http://data.euro.who.int/hfadb, accessed 20 August 2012).
UKR Ukraine 1992 1992 5.1
European Health for All Database (HFA-DB) [online database]. World Health Organization (WHO) Regional Office for Europe; 2012 (http://data.euro.who.int/hfadb, accessed 20 August 2012).
UKR Ukraine 1993 1993 7.0
European Health for All Database (HFA-DB) [online database]. World Health Organization (WHO) Regional Office for Europe; 2012 (http://data.euro.who.int/hfadb, accessed 20 August 2012).
UKR Ukraine 1994 1994 7.2
European Health for All Database (HFA-DB) [online database]. World Health Organization (WHO) Regional Office for Europe; 2012 (http://data.euro.who.int/hfadb, accessed 20 August 2012).
BMJ Publishing Group Limited (BMJ) disclaims all liability and responsibility arising from any relianceSupplemental material placed on this supplemental material which has been supplied by the author(s) BMJ Global Health
doi: 10.1136/bmjgh-2021-005671:e005671. 6 2021;BMJ Global Health, et al. Betran AP

257
ISO
Cod
e
Country
Coverag
e start
year
Covera
ge end
year
Caesare
an
section
rate (%)
References
UKR Ukraine 1995 1995 7.5
European Health for All Database (HFA-DB) [online database]. World Health Organization (WHO) Regional Office for Europe; 2012 (http://data.euro.who.int/hfadb, accessed 20 August 2012).
UKR Ukraine 1996 1996 8.1
European Health for All Database (HFA-DB) [online database]. World Health Organization (WHO) Regional Office for Europe; 2012 (http://data.euro.who.int/hfadb, accessed 20 August 2012).
UKR Ukraine 1997 1997 8.6
European Health for All Database (HFA-DB) [online database]. World Health Organization (WHO) Regional Office for Europe; 2012 (http://data.euro.who.int/hfadb, accessed 20 August 2012).
UKR Ukraine 1998 1998 9.1
European Health for All Database (HFA-DB) [online database]. World Health Organization (WHO) Regional Office for Europe; 2012 (http://data.euro.who.int/hfadb, accessed 20 August 2012).
UKR Ukraine 1999 1999 9.5
European Health for All Database (HFA-DB) [online database]. World Health Organization (WHO) Regional Office for Europe; 2012 (http://data.euro.who.int/hfadb, accessed 20 August 2012).
UKR Ukraine 2000 2000 10.4
European Health for All Database (HFA-DB) [online database]. World Health Organization (WHO) Regional Office for Europe; 2012 (http://data.euro.who.int/hfadb, accessed 20 August 2012).
UKR Ukraine 2001 2001 11.4
European Health for All Database (HFA-DB) [online database]. World Health Organization (WHO) Regional Office for Europe; 2012 (http://data.euro.who.int/hfadb, accessed 20 August 2012).
UKR Ukraine 2002 2002 12.2
European Health for All Database (HFA-DB) [online database]. World Health Organization (WHO) Regional Office for Europe; 2012 (http://data.euro.who.int/hfadb, accessed 20 August 2012).
BMJ Publishing Group Limited (BMJ) disclaims all liability and responsibility arising from any relianceSupplemental material placed on this supplemental material which has been supplied by the author(s) BMJ Global Health
doi: 10.1136/bmjgh-2021-005671:e005671. 6 2021;BMJ Global Health, et al. Betran AP

258
ISO
Cod
e
Country
Coverag
e start
year
Covera
ge end
year
Caesare
an
section
rate (%)
References
UKR Ukraine 2003 2003 12.8
European Health for All Database (HFA-DB) [online database]. World Health Organization (WHO) Regional Office for Europe; 2012 (http://data.euro.who.int/hfadb, accessed 20 August 2012).
UKR Ukraine 2004 2004 13.4
European Health for All Database (HFA-DB) [online database]. World Health Organization (WHO) Regional Office for Europe; 2012 (http://data.euro.who.int/hfadb, accessed 20 August 2012).
UKR Ukraine 2005 2005 13.7
European Health for All Database (HFA-DB) [online database]. World Health Organization (WHO) Regional Office for Europe; 2012 (http://data.euro.who.int/hfadb, accessed 20 August 2012).
UKR Ukraine 2006 2006 14.2
European Health for All Database (HFA-DB) [online database]. World Health Organization (WHO) Regional Office for Europe; 2012 (http://data.euro.who.int/hfadb, accessed 20 August 2012).
UKR Ukraine 2007 2007 15.2
European Health for All Database (HFA-DB) [online database]. World Health Organization (WHO) Regional Office for Europe; 2012 (http://data.euro.who.int/hfadb, accessed 20 August 2012).
UKR Ukraine 2008 2008 15.6
European Health for All Database (HFA-DB) [online database]. World Health Organization (WHO) Regional Office for Europe; 2012 (http://data.euro.who.int/hfadb, accessed 20 August 2012).
UKR Ukraine 2009 2009 15.9
European Health for All Database (HFA-DB) [online database]. World Health Organization (WHO) Regional Office for Europe; 2012 (http://data.euro.who.int/hfadb, accessed 20 August 2012).
UKR Ukraine 2010 2010 15.8
European Health for All Database (HFA-DB) [online database]. World Health Organization (WHO) Regional Office for Europe; 2016 (http://data.euro.who.int/hfadb, accessed 8 August 2016).
BMJ Publishing Group Limited (BMJ) disclaims all liability and responsibility arising from any relianceSupplemental material placed on this supplemental material which has been supplied by the author(s) BMJ Global Health
doi: 10.1136/bmjgh-2021-005671:e005671. 6 2021;BMJ Global Health, et al. Betran AP

259
ISO
Cod
e
Country
Coverag
e start
year
Covera
ge end
year
Caesare
an
section
rate (%)
References
UKR Ukraine 2012 2012 16.2
European Health for All Database (HFA-DB) [online database]. World Health Organization (WHO) Regional Office for Europe; 2016 (http://data.euro.who.int/hfadb, accessed 8 August 2016).
UKR Ukraine 2010 2012 12.1
State Statistics Service, Ukrainian Center for Social Reforms, United Nations Children's Fund (UNICEF). Ukraine Multiple Indicator Cluster Survey 2012, Final Report. Kiev, Ukraine: State Statistics Committee, the Ukrainian Center for Social Reforms; 2013.
UKR Ukraine 2013 2013 16.9
European Health for All Database (HFA-DB) [online database]. World Health Organization (WHO) Regional Office for Europe; 2016 (http://data.euro.who.int/hfadb, accessed 8 August 2016).
UKR Ukraine 2014 2014 16.5
European Health Information Gateway. European Health for All database (HFA-DB). Caesarean sections per 1000 live births [online database]. World Health Organization (WHO) Regional Office for Europe; 2018 (https://gateway.euro.who.int/en/indicators/hfa_596-7060-caesarean-sections-per-1000-live-births/, accessed 14 February 2019).
UKR Ukraine 2015 2015 17.9
European Health Information Gateway. European Health for All database (HFA-DB). Caesarean sections per 1000 live births [online database]. World Health Organization (WHO) Regional Office for Europe; 2018 (https://gateway.euro.who.int/en/indicators/hfa_596-7060-caesarean-sections-per-1000-live-births/, accessed 14 February 2019).
ARE United Arab
Emirates 2006 2006 18.5
Open Data: Deliveries and births by nationality, mode of delivery, condition of new born & district [2006] [website]. Abu Dhabi: Ministry of Health [UAE]; 2007 (www.http://213.42.151.126/Statistics/Statistics_2006/index-en.html, accessed 9 October 2012).
ARE United Arab
Emirates 2007 2007 20.9
Open Data: Births by nationality, mode of delivery & condition of new born [2007] [website]. Abu Dhabi: Ministry of Health [UAE]; 2008 (www.http://213.42.151.126/Statistics/Statistics_2007/index-en.html, accessed 9 October 2012).
ARE United Arab
Emirates 2013 2013 23.9
Open Data: Births by nationality, mode of delivery & condition of new born [2013] [website]. Abu Dhabi: Ministry of Health [UAE]; 2014 (www.moh.gov.ae/en/OpenData.aspx?Category=Statistics, accessed 15 January 2015).
BMJ Publishing Group Limited (BMJ) disclaims all liability and responsibility arising from any relianceSupplemental material placed on this supplemental material which has been supplied by the author(s) BMJ Global Health
doi: 10.1136/bmjgh-2021-005671:e005671. 6 2021;BMJ Global Health, et al. Betran AP

260
ISO
Cod
e
Country
Coverag
e start
year
Covera
ge end
year
Caesare
an
section
rate (%)
References
GBR United Kingdom-
England 1990 1991 12.4
NHS Maternity Statistics, 2016-17. Hospital Episode Statistics. Table 1.d: Method of delivery [website]. NHS Hospitals, England. Leeds: NHS Digital; 2017 (http://digital.nhs.uk/pubs/maternity1617, accessed 20 December 2017).
GBR United Kingdom-
England 1991 1992 12.9
NHS Maternity Statistics, 2016-17. Hospital Episode Statistics. Table 1.d: Method of delivery [website]. NHS Hospitals, England. Leeds: NHS Digital; 2017 (http://digital.nhs.uk/pubs/maternity1617, accessed 20 December 2017).
GBR United Kingdom-
England 1992 1993 13.7
NHS Maternity Statistics, 2016-17. Hospital Episode Statistics. Table 1.d: Method of delivery [website]. NHS Hospitals, England. Leeds: NHS Digital; 2017 (http://digital.nhs.uk/pubs/maternity1617, accessed 20 December 2017).
GBR United Kingdom-
England 1993 1994 15.0
NHS Maternity Statistics, 2016-17. Hospital Episode Statistics. Table 1.d: Method of delivery [website]. NHS Hospitals, England. Leeds: NHS Digital; 2017 (http://digital.nhs.uk/pubs/maternity1617, accessed 20 December 2017).
GBR United Kingdom-
England 1994 1995 15.5
NHS Maternity Statistics, 2016-17. Hospital Episode Statistics. Table 1.d: Method of delivery [website]. NHS Hospitals, England. Leeds: NHS Digital; 2017 (http://digital.nhs.uk/pubs/maternity1617, accessed 20 December 2017).
GBR United Kingdom-
England 1995 1996 16.4
NHS Maternity Statistics, 2016-17. Hospital Episode Statistics. Table 1.d: Method of delivery [website]. NHS Hospitals, England. Leeds: NHS Digital; 2017 (http://digital.nhs.uk/pubs/maternity1617, accessed 20 December 2017).
GBR United Kingdom-
England 1996 1997 17.0
NHS Maternity Statistics, 2016-17. Hospital Episode Statistics. Table 1.d: Method of delivery [website]. NHS Hospitals, England. Leeds: NHS Digital; 2017 (http://digital.nhs.uk/pubs/maternity1617, accessed 20 December 2017).
GBR United Kingdom-
England 1997 1998 18.3
NHS Maternity Statistics, 2016-17. Hospital Episode Statistics. Table 1.d: Method of delivery [website]. NHS Hospitals, England. Leeds: NHS Digital; 2017 (http://digital.nhs.uk/pubs/maternity1617, accessed 20 December 2017).
BMJ Publishing Group Limited (BMJ) disclaims all liability and responsibility arising from any relianceSupplemental material placed on this supplemental material which has been supplied by the author(s) BMJ Global Health
doi: 10.1136/bmjgh-2021-005671:e005671. 6 2021;BMJ Global Health, et al. Betran AP

261
ISO
Cod
e
Country
Coverag
e start
year
Covera
ge end
year
Caesare
an
section
rate (%)
References
GBR United Kingdom-
England 1998 1999 19.1
NHS Maternity Statistics, 2016-17. Hospital Episode Statistics. Table 1.d: Method of delivery [website]. NHS Hospitals, England. Leeds: NHS Digital; 2017 (http://digital.nhs.uk/pubs/maternity1617, accessed 20 December 2017).
GBR United Kingdom-
England 1999 2000 20.6
NHS Maternity Statistics, 2016-17. Hospital Episode Statistics. Table 1.d: Method of delivery [website]. NHS Hospitals, England. Leeds: NHS Digital; 2017 (http://digital.nhs.uk/pubs/maternity1617, accessed 20 December 2017).
GBR United Kingdom-
England 2000 2001 21.5
NHS Maternity Statistics, 2016-17. Hospital Episode Statistics. Table 1.d: Method of delivery [website]. NHS Hospitals, England. Leeds: NHS Digital; 2017 (http://digital.nhs.uk/pubs/maternity1617, accessed 20 December 2017).
GBR United Kingdom-
England 2001 2002 22.0
NHS Maternity Statistics, 2016-17. Hospital Episode Statistics. Table 1.d: Method of delivery [website]. NHS Hospitals, England. Leeds: NHS Digital; 2017 (http://digital.nhs.uk/pubs/maternity1617, accessed 20 December 2017).
GBR United Kingdom-
England 2002 2003 22.0
NHS Maternity Statistics, 2016-17. Hospital Episode Statistics. Table 1.d: Method of delivery [website]. NHS Hospitals, England. Leeds: NHS Digital; 2017 (http://digital.nhs.uk/pubs/maternity1617, accessed 20 December 2017).
GBR United Kingdom-
England 2003 2004 22.7
NHS Maternity Statistics, 2016-17. Hospital Episode Statistics. Table 1.d: Method of delivery [website]. NHS Hospitals, England. Leeds: NHS Digital; 2017 (http://digital.nhs.uk/pubs/maternity1617, accessed 20 December 2017).
GBR United Kingdom-
England 2004 2005 23.0
NHS Maternity Statistics, 2016-17. Hospital Episode Statistics. Table 1.d: Method of delivery [website]. NHS Hospitals, England. Leeds: NHS Digital; 2017 (http://digital.nhs.uk/pubs/maternity1617, accessed 20 December 2017).
GBR United Kingdom-
England 2005 2006 24.1
NHS Maternity Statistics, 2016-17. Hospital Episode Statistics. Table 1.d: Method of delivery [website]. NHS Hospitals, England. Leeds: NHS Digital; 2017 (http://digital.nhs.uk/pubs/maternity1617, accessed 20 December 2017).
BMJ Publishing Group Limited (BMJ) disclaims all liability and responsibility arising from any relianceSupplemental material placed on this supplemental material which has been supplied by the author(s) BMJ Global Health
doi: 10.1136/bmjgh-2021-005671:e005671. 6 2021;BMJ Global Health, et al. Betran AP

262
ISO
Cod
e
Country
Coverag
e start
year
Covera
ge end
year
Caesare
an
section
rate (%)
References
GBR United Kingdom-
England 2006 2007 24.2
NHS Maternity Statistics, 2016-17. Hospital Episode Statistics. Table 1.d: Method of delivery [website]. NHS Hospitals, England. Leeds: NHS Digital; 2017 (http://digital.nhs.uk/pubs/maternity1617, accessed 20 December 2017).
GBR United Kingdom-
England 2007 2008 24.6
NHS Maternity Statistics, 2016-17. Hospital Episode Statistics. Table 1.d: Method of delivery [website]. NHS Hospitals, England. Leeds: NHS Digital; 2017 (http://digital.nhs.uk/pubs/maternity1617, accessed 20 December 2017).
GBR United Kingdom-
England 2008 2009 24.6
NHS Maternity Statistics, 2016-17. Hospital Episode Statistics. Table 1.d: Method of delivery [website]. NHS Hospitals, England. Leeds: NHS Digital; 2017 (http://digital.nhs.uk/pubs/maternity1617, accessed 20 December 2017).
GBR United Kingdom-
England 2009 2010 24.8
NHS Maternity Statistics, 2016-17. Hospital Episode Statistics. Table 1.d: Method of delivery [website]. NHS Hospitals, England. Leeds: NHS Digital; 2017 (http://digital.nhs.uk/pubs/maternity1617, accessed 20 December 2017).
GBR United Kingdom-
England 2010 2011 24.9
NHS Maternity Statistics, 2016-17. Hospital Episode Statistics. Table 1.d: Method of delivery [website]. NHS Hospitals, England. Leeds: NHS Digital; 2017 (http://digital.nhs.uk/pubs/maternity1617, accessed 20 December 2017).
GBR United Kingdom-
England 2011 2012 25.0
NHS Maternity Statistics, 2016-17. Hospital Episode Statistics. Table 1.d: Method of delivery [website]. NHS Hospitals, England. Leeds: NHS Digital; 2017 (http://digital.nhs.uk/pubs/maternity1617, accessed 20 December 2017).
GBR United Kingdom-
England 2012 2013 25.5
NHS Maternity Statistics, 2016-17. Hospital Episode Statistics. Table 1.d: Method of delivery [website]. NHS Hospitals, England. Leeds: NHS Digital; 2017 (http://digital.nhs.uk/pubs/maternity1617, accessed 20 December 2017).
GBR United Kingdom-
England 2013 2014 26.2
NHS Maternity Statistics, 2016-17. Hospital Episode Statistics. Table 1.d: Method of delivery [website]. NHS Hospitals, England. Leeds: NHS Digital; 2017 (http://digital.nhs.uk/pubs/maternity1617, accessed 20 December 2017).
BMJ Publishing Group Limited (BMJ) disclaims all liability and responsibility arising from any relianceSupplemental material placed on this supplemental material which has been supplied by the author(s) BMJ Global Health
doi: 10.1136/bmjgh-2021-005671:e005671. 6 2021;BMJ Global Health, et al. Betran AP

263
ISO
Cod
e
Country
Coverag
e start
year
Covera
ge end
year
Caesare
an
section
rate (%)
References
GBR United Kingdom-
England 2014 2015 26.5
NHS Maternity Statistics, 2016-17. Hospital Episode Statistics. Table 1.d: Method of delivery [website]. NHS Hospitals, England. Leeds: NHS Digital; 2017 (http://digital.nhs.uk/pubs/maternity1617, accessed 20 December 2017).
GBR United Kingdom-
England 2015 2016 27.1
NHS Maternity Statistics, 2016-17. Hospital Episode Statistics. Table 1.d: Method of delivery [website]. NHS Hospitals, England. Leeds: NHS Digital; 2017 (http://digital.nhs.uk/pubs/maternity1617, accessed 20 December 2017).
GBR United Kingdom-
England 2016 2017 27.8
NHS Maternity Statistics, 2016-17. Hospital Episode Statistics. Table 1.d: Method of delivery [website]. NHS Hospitals, England. Leeds: NHS Digital; 2017 (http://digital.nhs.uk/pubs/maternity1617, accessed 20 December 2017).
GBR United Kingdom-
England 2017 2018 28.4
NHS Maternity Statistics, 2017-18. Summary report 5: Proportion of deliveries by method of delivery and age of mother, 2017-18 (HES) [website]. NHS Hospitals, England. Leeds: NHS Digital; 2018 (https://digital.nhs.uk/data-and-information/publications/statistical/nhs-maternity-statistics/2017-18, accessed 6 March 2020).
GBR United Kingdom-Northern Ireland
2011 2012 28.4
Northern Ireland Hospital Statistics: Inpatient and Day Case Activity Statistics 2011/12. Belfast: Information & Analysis Directorate, Department of Health, Social Services & Public Safety [Northern Ireland]; 2012.
GBR United Kingdom-Northern Ireland
2012 2013 29.8
Northern Ireland Hospital Statistics: Inpatient and Day Case Activity Statistics 2012/13. Belfast: Information & Analysis Directorate, Department of Health, Social Services & Public Safety [Northern Ireland]; 2013.
GBR United Kingdom-Northern Ireland
2013 2014 29.1
Hospital Statistics: Inpatient and Day Case Activity Statistics 2013/14. Belfast: Information & Analysis Directorate, Department of Health, Social Services & Public Safety [Northern Ireland]; 2014.
GBR United Kingdom-Northern Ireland
2014 2015 29.0
Hospital Statistics: Inpatient and Day Case Activity Statistics 2014/15. Belfast: Information & Analysis Directorate, Department of Health, Social Services & Public Safety [Northern Ireland]; 2015.
BMJ Publishing Group Limited (BMJ) disclaims all liability and responsibility arising from any relianceSupplemental material placed on this supplemental material which has been supplied by the author(s) BMJ Global Health
doi: 10.1136/bmjgh-2021-005671:e005671. 6 2021;BMJ Global Health, et al. Betran AP

264
ISO
Cod
e
Country
Coverag
e start
year
Covera
ge end
year
Caesare
an
section
rate (%)
References
GBR United Kingdom-Northern Ireland
2015 2016 29.9
Hospital Statistics: Inpatient and Day Case Activity Statistics 2015/16. Belfast: Information & Analysis Directorate, Department of Health (DoH) [Northern Ireland]; 2016.
GBR United Kingdom-Northern Ireland
2015 2015 30.2
Birth NI: A Survey of Women’s Experience of Maternity Care in Northern Ireland. Belfast: School of Nursing and Midwifery, Queen’s University of Belfast; 2016.
GBR United Kingdom-
Scotland 1990 1991 14.1
Births in Scottish Hospitals. Year ending 31 March 2017. Table 6.1: Method of delivery in Scotland. Edinburgh and Glasgow: Information Services Division, National Services Scotland (NHS); 2017.
GBR United Kingdom-
Scotland 1991 1992 14.6
Births in Scottish Hospitals. Year ending 31 March 2017. Table 6.1: Method of delivery in Scotland. Edinburgh and Glasgow: Information Services Division, National Services Scotland (NHS); 2017.
GBR United Kingdom-
Scotland 1992 1993 14.6
Births in Scottish Hospitals. Year ending 31 March 2017. Table 6.1: Method of delivery in Scotland. Edinburgh and Glasgow: Information Services Division, National Services Scotland (NHS); 2017.
GBR United Kingdom-
Scotland 1993 1994 15.2
Births in Scottish Hospitals. Year ending 31 March 2017. Table 6.1: Method of delivery in Scotland. Edinburgh and Glasgow: Information Services Division, National Services Scotland (NHS); 2017.
GBR United Kingdom-
Scotland 1994 1995 15.4
Births in Scottish Hospitals. Year ending 31 March 2017. Table 6.1: Method of delivery in Scotland. Edinburgh and Glasgow: Information Services Division, National Services Scotland (NHS); 2017.
GBR United Kingdom-
Scotland 1995 1996 15.9
Births in Scottish Hospitals. Year ending 31 March 2017. Table 6.1: Method of delivery in Scotland. Edinburgh and Glasgow: Information Services Division, National Services Scotland (NHS); 2017.
BMJ Publishing Group Limited (BMJ) disclaims all liability and responsibility arising from any relianceSupplemental material placed on this supplemental material which has been supplied by the author(s) BMJ Global Health
doi: 10.1136/bmjgh-2021-005671:e005671. 6 2021;BMJ Global Health, et al. Betran AP

265
ISO
Cod
e
Country
Coverag
e start
year
Covera
ge end
year
Caesare
an
section
rate (%)
References
GBR United Kingdom-
Scotland 1996 1997 16.0
Births in Scottish Hospitals. Year ending 31 March 2017. Table 6.1: Method of delivery in Scotland. Edinburgh and Glasgow: Information Services Division, National Services Scotland (NHS); 2017.
GBR United Kingdom-
Scotland 1997 1998 16.6
Births in Scottish Hospitals. Year ending 31 March 2017. Table 6.1: Method of delivery in Scotland. Edinburgh and Glasgow: Information Services Division, National Services Scotland (NHS); 2017.
GBR United Kingdom-
Scotland 1998 1999 17.7
Births in Scottish Hospitals. Year ending 31 March 2017. Table 6.1: Method of delivery in Scotland. Edinburgh and Glasgow: Information Services Division, National Services Scotland (NHS); 2017.
GBR United Kingdom-
Scotland 1999 2000 18.9
Births in Scottish Hospitals. Year ending 31 March 2017. Table 6.1: Method of delivery in Scotland. Edinburgh and Glasgow: Information Services Division, National Services Scotland (NHS); 2017.
GBR United Kingdom-
Scotland 2000 2001 19.9
Births in Scottish Hospitals. Year ending 31 March 2017. Table 6.1: Method of delivery in Scotland. Edinburgh and Glasgow: Information Services Division, National Services Scotland (NHS); 2017.
GBR United Kingdom-
Scotland 2001 2002 21.1
Births in Scottish Hospitals. Year ending 31 March 2017. Table 6.1: Method of delivery in Scotland. Edinburgh and Glasgow: Information Services Division, National Services Scotland (NHS); 2017.
GBR United Kingdom-
Scotland 2002 2003 22.4
Births in Scottish Hospitals. Year ending 31 March 2017. Table 6.1: Method of delivery in Scotland. Edinburgh and Glasgow: Information Services Division, National Services Scotland (NHS); 2017.
GBR United Kingdom-
Scotland 2003 2004 23.2
Births in Scottish Hospitals. Year ending 31 March 2017. Table 6.1: Method of delivery in Scotland. Edinburgh and Glasgow: Information Services Division, National Services Scotland (NHS); 2017.
BMJ Publishing Group Limited (BMJ) disclaims all liability and responsibility arising from any relianceSupplemental material placed on this supplemental material which has been supplied by the author(s) BMJ Global Health
doi: 10.1136/bmjgh-2021-005671:e005671. 6 2021;BMJ Global Health, et al. Betran AP

266
ISO
Cod
e
Country
Coverag
e start
year
Covera
ge end
year
Caesare
an
section
rate (%)
References
GBR United Kingdom-
Scotland 2004 2005 23.4
Births in Scottish Hospitals. Year ending 31 March 2017. Table 6.1: Method of delivery in Scotland. Edinburgh and Glasgow: Information Services Division, National Services Scotland (NHS); 2017.
GBR United Kingdom-
Scotland 2005 2006 23.9
Births in Scottish Hospitals. Year ending 31 March 2017. Table 6.1: Method of delivery in Scotland. Edinburgh and Glasgow: Information Services Division, National Services Scotland (NHS); 2017.
GBR United Kingdom-
Scotland 2006 2007 24.5
Births in Scottish Hospitals. Year ending 31 March 2017. Table 6.1: Method of delivery in Scotland. Edinburgh and Glasgow: Information Services Division, National Services Scotland (NHS); 2017.
GBR United Kingdom-
Scotland 2007 2008 24.7
Births in Scottish Hospitals. Year ending 31 March 2017. Table 6.1: Method of delivery in Scotland. Edinburgh and Glasgow: Information Services Division, National Services Scotland (NHS); 2017.
GBR United Kingdom-
Scotland 2008 2009 24.7
Births in Scottish Hospitals. Year ending 31 March 2017. Table 6.1: Method of delivery in Scotland. Edinburgh and Glasgow: Information Services Division, National Services Scotland (NHS); 2017.
GBR United Kingdom-
Scotland 2009 2010 24.9
Births in Scottish Hospitals. Year ending 31 March 2017. Table 6.1: Method of delivery in Scotland. Edinburgh and Glasgow: Information Services Division, National Services Scotland (NHS); 2017.
GBR United Kingdom-
Scotland 2010 2011 25.3
Births in Scottish Hospitals. Year ending 31 March 2017. Table 6.1: Method of delivery in Scotland. Edinburgh and Glasgow: Information Services Division, National Services Scotland (NHS); 2017.
GBR United Kingdom-
Scotland 2011 2012 26.5
Births in Scottish Hospitals. Year ending 31 March 2017. Table 6.1: Method of delivery in Scotland. Edinburgh and Glasgow: Information Services Division, National Services Scotland (NHS); 2017.
BMJ Publishing Group Limited (BMJ) disclaims all liability and responsibility arising from any relianceSupplemental material placed on this supplemental material which has been supplied by the author(s) BMJ Global Health
doi: 10.1136/bmjgh-2021-005671:e005671. 6 2021;BMJ Global Health, et al. Betran AP

267
ISO
Cod
e
Country
Coverag
e start
year
Covera
ge end
year
Caesare
an
section
rate (%)
References
GBR United Kingdom-
Scotland 2012 2013 27.7
Births in Scottish Hospitals. Year ending 31 March 2017. Table 6.1: Method of delivery in Scotland. Edinburgh and Glasgow: Information Services Division, National Services Scotland (NHS); 2017.
GBR United Kingdom-
Scotland 2013 2014 27.3
Births in Scottish Hospitals. Year ending 31 March 2017. Table 6.1: Method of delivery in Scotland. Edinburgh and Glasgow: Information Services Division, National Services Scotland (NHS); 2017.
GBR United Kingdom-
Scotland 2014 2015 29.2
Births in Scottish Hospitals. Year ending 31 March 2017. Table 6.1: Method of delivery in Scotland. Edinburgh and Glasgow: Information Services Division, National Services Scotland (NHS); 2017.
GBR United Kingdom-
Scotland 2015 2016 30.1
Births in Scottish Hospitals. Year ending 31 March 2017. Table 6.1: Method of delivery in Scotland. Edinburgh and Glasgow: Information Services Division, National Services Scotland (NHS); 2017.
GBR United Kingdom-
Scotland 2016 2017 31.2
Births in Scottish Hospitals. Year ending 31 March 2017. Table 6.1: Method of delivery in Scotland. Edinburgh and Glasgow: Information Services Division, National Services Scotland (NHS); 2017.
GBR United Kingdom-
Scotland 2017 2018 32.5
Births in Scottish Hospitals. Year ending 31 March 2019. Table 6.1: Method of delivery in Scotland. Edinburgh and Glasgow: Information Services Division, National Services Scotland (NHS); 2019.
GBR United Kingdom-
Wales 1995 1996 19.1
Number of deliveries in Wales by delivery method, year and length of stay [online database]. Cardiff: Maternity data, Patient Episode Database for Wales, NHS Wales Informatics Service (NWIS), Welsh Government; 2009 (http://gov.wales/statistics-and-research, accessed 5 February 2018).
GBR United Kingdom-
Wales 1996 1997 19.1
Number of deliveries in Wales by delivery method, year and length of stay [online database]. Cardiff: Maternity data, Patient Episode Database for Wales, NHS Wales Informatics Service (NWIS), Welsh Government; 2009 (http://gov.wales/statistics-and-research, accessed 5 February 2018).
BMJ Publishing Group Limited (BMJ) disclaims all liability and responsibility arising from any relianceSupplemental material placed on this supplemental material which has been supplied by the author(s) BMJ Global Health
doi: 10.1136/bmjgh-2021-005671:e005671. 6 2021;BMJ Global Health, et al. Betran AP

268
ISO
Cod
e
Country
Coverag
e start
year
Covera
ge end
year
Caesare
an
section
rate (%)
References
GBR United Kingdom-
Wales 1997 1998 20.2
Number of deliveries in Wales by delivery method, year and length of stay [online database]. Cardiff: Maternity data, Patient Episode Database for Wales, NHS Wales Informatics Service (NWIS), Welsh Government; 2009 (http://gov.wales/statistics-and-research, accessed 5 February 2018).
GBR United Kingdom-
Wales 1998 1999 21.3
Number of deliveries in Wales by delivery method, year and length of stay [online database]. Cardiff: Maternity data, Patient Episode Database for Wales, NHS Wales Informatics Service (NWIS), Welsh Government; 2009 (http://gov.wales/statistics-and-research, accessed 5 February 2018).
GBR United Kingdom-
Wales 1999 2000 22.9
Number of deliveries in Wales by delivery method, year and length of stay [online database]. Cardiff: Maternity data, Patient Episode Database for Wales, NHS Wales Informatics Service (NWIS), Welsh Government; 2009 (http://gov.wales/statistics-and-research, accessed 5 February 2018).
GBR United Kingdom-
Wales 2000 2001 23.8
Number of deliveries in Wales by delivery method, year and length of stay [online database]. Cardiff: Maternity data, Patient Episode Database for Wales, NHS Wales Informatics Service (NWIS), Welsh Government; 2009 (http://gov.wales/statistics-and-research, accessed 5 February 2018).
GBR United Kingdom-
Wales 2001 2002 24.5
Number of deliveries in Wales by delivery method, year and length of stay [online database]. Cardiff: Maternity data, Patient Episode Database for Wales, NHS Wales Informatics Service (NWIS), Welsh Government; 2009 (http://gov.wales/statistics-and-research, accessed 5 February 2018).
GBR United Kingdom-
Wales 2002 2003 24.4
Number of deliveries in Wales by delivery method, year and length of stay [online database]. Cardiff: Maternity data, Patient Episode Database for Wales, NHS Wales Informatics Service (NWIS), Welsh Government; 2009 (http://gov.wales/statistics-and-research, accessed 5 February 2018).
GBR United Kingdom-
Wales 2003 2004 23.8
Number of deliveries in Wales by delivery method, year and length of stay [online database]. Cardiff: Maternity data, Patient Episode Database for Wales, NHS Wales Informatics Service (NWIS), Welsh Government; 2009 (http://gov.wales/statistics-and-research, accessed 5 February 2018).
GBR United Kingdom-
Wales 2004 2005 24.5
Number of deliveries in Wales by delivery method, year and length of stay [online database]. Cardiff: Maternity data, Patient Episode Database for Wales, NHS Wales Informatics Service (NWIS), Welsh Government; 2009 (http://gov.wales/statistics-and-research, accessed 5 February 2018).
BMJ Publishing Group Limited (BMJ) disclaims all liability and responsibility arising from any relianceSupplemental material placed on this supplemental material which has been supplied by the author(s) BMJ Global Health
doi: 10.1136/bmjgh-2021-005671:e005671. 6 2021;BMJ Global Health, et al. Betran AP

269
ISO
Cod
e
Country
Coverag
e start
year
Covera
ge end
year
Caesare
an
section
rate (%)
References
GBR United Kingdom-
Wales 2005 2006 26.2
Number of deliveries in Wales by delivery method, year and length of stay [online database]. Cardiff: Maternity data, Patient Episode Database for Wales, NHS Wales Informatics Service (NWIS), Welsh Government; 2009 (http://gov.wales/statistics-and-research, accessed 5 February 2018).
GBR United Kingdom-
Wales 2006 2007 26.9
Number of deliveries in Wales by delivery method, year and length of stay [online database]. Cardiff: Maternity data, Patient Episode Database for Wales, NHS Wales Informatics Service (NWIS), Welsh Government; 2009 (http://gov.wales/statistics-and-research, accessed 5 February 2018).
GBR United Kingdom-
Wales 2007 2008 26.1
Number of deliveries in Wales by delivery method, year and length of stay [online database]. Cardiff: Maternity data, Patient Episode Database for Wales, NHS Wales Informatics Service (NWIS), Welsh Government; 2009 (http://gov.wales/statistics-and-research, accessed 5 February 2018).
GBR United Kingdom-
Wales 2008 2009 26.6
Maternity Statistics, Wales: Method of Delivery, 2000-2010. Cardiff: Statistical Directorate, Welsh Assembly Government; 2011.
GBR United Kingdom-
Wales 2009 2010 26.6
Maternity data, Patient Episode Database for Wales: Delivery by type in each LHB in Wales [online database]. Cardiff: Maternity data, Patient Episode Database for Wales, NHS Wales Informatics Service (NWIS), Welsh Government; 2015 (http://gov.wales/statistics-and-research/maternity-method-delivery/?lang=en, accessed 5 February 2018).
GBR United Kingdom-
Wales 2010 2011 26.0
Maternity data, Patient Episode Database for Wales: Delivery by type in each LHB in Wales [online database]. Cardiff: Maternity data, Patient Episode Database for Wales, NHS Wales Informatics Service (NWIS), Welsh Government; 2015 (http://gov.wales/statistics-and-research/maternity-method-delivery/?lang=en, accessed 5 February 2018).
GBR United Kingdom-
Wales 2011 2012 25.7
Maternity data, Patient Episode Database for Wales: Delivery by type in each LHB in Wales [online database]. Cardiff: Maternity data, Patient Episode Database for Wales, NHS Wales Informatics Service (NWIS), Welsh Government; 2015 (http://gov.wales/statistics-and-research/maternity-method-delivery/?lang=en, accessed 5 February 2018).
GBR United Kingdom-
Wales 2012 2013 27.5
Maternity data, Patient Episode Database for Wales: Delivery by type in each LHB in Wales [online database]. Cardiff: Maternity data, Patient Episode Database for Wales, NHS Wales Informatics Service (NWIS), Welsh Government; 2015 (http://gov.wales/statistics-and-research/maternity-method-delivery/?lang=en, accessed 5 February 2018).
BMJ Publishing Group Limited (BMJ) disclaims all liability and responsibility arising from any relianceSupplemental material placed on this supplemental material which has been supplied by the author(s) BMJ Global Health
doi: 10.1136/bmjgh-2021-005671:e005671. 6 2021;BMJ Global Health, et al. Betran AP

270
ISO
Cod
e
Country
Coverag
e start
year
Covera
ge end
year
Caesare
an
section
rate (%)
References
GBR United Kingdom-
Wales 2013 2014 26.9
Maternity data, Patient Episode Database for Wales: Delivery by type in each LHB in Wales [online database]. Cardiff: Maternity data, Patient Episode Database for Wales, NHS Wales Informatics Service (NWIS), Welsh Government; 2015 (http://gov.wales/statistics-and-research/maternity-method-delivery/?lang=en, accessed 5 February 2018).
GBR United Kingdom-
Wales 2014 2015 26.3
Maternity data, Patient Episode Database for Wales: Delivery by type in each LHB in Wales [online database]. Cardiff: Maternity data, Patient Episode Database for Wales, NHS Wales Informatics Service (NWIS), Welsh Government; 2015 (http://gov.wales/statistics-and-research/maternity-method-delivery/?lang=en, accessed 5 February 2018).
GBR United Kingdom-
Wales 2015 2016 25.6
Maternity Statistics, Wales, 2015-16 (Experimental Statistics). Wales: Statistics for Wales, Welsh Government; 2017.
TZA United Republic of
Tanzania 1991 1996 2.1
Bureau of Statistics [Tanzania], Macro International Inc. Tanzania Demographic and Health Survey 1996. Calverton, Maryland: Bureau of Statistics, Macro International; 1997.
TZA United Republic of
Tanzania 1994 1999 2.9
National Bureau of Statistics [Tanzania], Macro International Inc. Tanzania Reproductive and Child Health Survey 1999. Calverton, Maryland, USA: National Bureau of Statistics, Macro International Inc.; 2000.
TZA United Republic of
Tanzania 1999 2005 3.2
National Bureau of Statistics (NBS) [Tanzania], ORC Macro. Tanzania Demographic and Health Survey 2004-05. Dar es Salaam, Tanzania: National Bureau of Statistics, ORC Macro; 2005.
TZA United Republic of
Tanzania 2005 2010 4.5
National Bureau of Statistics (NBS) [Tanzania], ICF Macro. Tanzania Demographic and Health Survey 2010. Dar es Salaam, Tanzania: NBS, ICF Macro; 2011.
TZA United Republic of
Tanzania 2010 2016 5.9
Ministry of Health, Community Development, Gender, Elderly and Children (MoHCDGEC) [Tanzania], Ministry of Health (MoH) [Zanzibar], National Bureau of Statistics (NBS) [Tanzania], Office of Chief Government Statistician (OCGS) [Zanzibar], ICF. Tanzania Demographic and Health Survey and Malaria Indicator Survey (TDHS-MIS) 2015-16. Dar es Salaam, Tanzania: MoHCDGEC, MoH, NBS, OCGS, ICF; 2016.
BMJ Publishing Group Limited (BMJ) disclaims all liability and responsibility arising from any relianceSupplemental material placed on this supplemental material which has been supplied by the author(s) BMJ Global Health
doi: 10.1136/bmjgh-2021-005671:e005671. 6 2021;BMJ Global Health, et al. Betran AP

271
ISO
Cod
e
Country
Coverag
e start
year
Covera
ge end
year
Caesare
an
section
rate (%)
References
USA United States of
America 1990 1990 22.7
Martin JA, Hamilton BE, Sutton PD, Ventura SJ, Osterman MJK, Mathews TJ. Births: Final Data for 2008. National Vital Statistics Reports; vol. 59, no.1. Hyattsville, MD: National Center for Health Statistics; 2010.
USA United States of
America 1991 1991 22.6
Martin JA, Hamilton BE, Sutton PD, Ventura SJ, Osterman MJK, Mathews TJ. Births: Final Data for 2008. National Vital Statistics Reports; vol. 59, no.1. Hyattsville, MD: National Center for Health Statistics; 2010.
USA United States of
America 1992 1992 22.3
Martin JA, Hamilton BE, Sutton PD, Ventura SJ, Osterman MJK, Mathews TJ. Births: Final Data for 2008. National Vital Statistics Reports; vol. 59, no.1. Hyattsville, MD: National Center for Health Statistics; 2010.
USA United States of
America 1993 1993 21.8
Martin JA, Hamilton BE, Sutton PD, Ventura SJ, Osterman MJK, Mathews TJ. Births: Final Data for 2008. National Vital Statistics Reports; vol. 59, no.1. Hyattsville, MD: National Center for Health Statistics; 2010.
USA United States of
America 1994 1994 21.2
Martin JA, Hamilton BE, Sutton PD, Ventura SJ, Osterman MJK, Mathews TJ. Births: Final Data for 2008. National Vital Statistics Reports; vol. 59, no.1. Hyattsville, MD: National Center for Health Statistics; 2010.
USA United States of
America 1995 1995 20.8
Martin JA, Hamilton BE, Sutton PD, Ventura SJ, Osterman MJK, Mathews TJ. Births: Final Data for 2008. National Vital Statistics Reports; vol. 59, no.1. Hyattsville, MD: National Center for Health Statistics; 2010.
USA United States of
America 1996 1996 20.7
Martin JA, Hamilton BE, Sutton PD, Ventura SJ, Osterman MJK, Mathews TJ. Births: Final Data for 2008. National Vital Statistics Reports; vol. 59, no.1. Hyattsville, MD: National Center for Health Statistics; 2010.
USA United States of
America 1997 1997 20.8
Ventura SJ, Martin JA, Curtin SC, Mathews TJ. Births: Final Data for 1997. National Vital Statistics Reports; vol. 47, no. 18. Hyattsville, Maryland: National Center for Health Statistics; 1999.
BMJ Publishing Group Limited (BMJ) disclaims all liability and responsibility arising from any relianceSupplemental material placed on this supplemental material which has been supplied by the author(s) BMJ Global Health
doi: 10.1136/bmjgh-2021-005671:e005671. 6 2021;BMJ Global Health, et al. Betran AP

272
ISO
Cod
e
Country
Coverag
e start
year
Covera
ge end
year
Caesare
an
section
rate (%)
References
USA United States of
America 1998 1998 21.2
Ventura SJ, Martin JA, Curtin SC, Mathews TJ, Park MM. Births: Final data for 1998. National vital statistics reports; vol. 48, no. 3. Hyattsville, Maryland: National Center for Health Statistics; 2000.
USA United States of
America 1999 1999 22.0
Ventura SJ, Martin JA, Curtin SC, Menacker F, Hamilton BE. Births: Final data for 1999. National Vital Statistics Reports; vol. 49, no. 1. Hyattsville, Maryland: National Center for Health Statistics; 2001.
USA United States of
America 2000 2000 22.9
Martin JA, Hamilton BE, Ventura SJ, Menacker F, Park MM. Births: Final data for 2000. National Vital Statistics Reports; vol. 50, no. 5. Hyattsville, Maryland: National Center for Health Statistics; 2002.
USA United States of
America 2001 2001 24.4
Martin JA, Hamilton BE, Ventura SJ, Menacker F, Park MM, Sutton PD. Births: Final data for 2001. National Vital Statistics Reports; vol. 51, no. 2. Hyattsville, Maryland: National Center for Health Statistics; 2002.
USA United States of
America 2002 2002 26.1
Martin JA, Hamilton BE, Sutton PD, Ventura SJ, Menacker F, Munson ML. Births: Final data for 2002. National Vital Statistics Reports; vol. 52, no. 10. Hyattsville, Maryland: National Center for Health Statistics; 2003.
USA United States of
America 2003 2003 27.5
Martin JA, Hamilton BE, Sutton PD, Ventura SJ, Menacker F, Munson ML. Births: Final data for 2003. National Vital Statistics Reports; vol. 54, no. 2. Hyattsville, MD: National Center for Health Statistics; 2005.
USA United States of
America 2004 2004 29.1
Martin JA, Hamilton BE, Sutton PD, Ventura SJ, Menacker F, Kirmeyer S. Births: Final data for 2004. National Vital Statistics Reports; vol. 55, no. 1. Hyattsville, MD: National Center for Health Statistics; 2006.
USA United States of
America 2005 2005 30.3
Martin JA, Hamilton BE, Sutton PD, Ventura SJ, Menacker F, Kirmeyer S et al. Births: Final data for 2005. National Vital Statistics Reports; vol. 56, no. 6. Hyattsville, MD: National Center for Health Statistics; 2007.
BMJ Publishing Group Limited (BMJ) disclaims all liability and responsibility arising from any relianceSupplemental material placed on this supplemental material which has been supplied by the author(s) BMJ Global Health
doi: 10.1136/bmjgh-2021-005671:e005671. 6 2021;BMJ Global Health, et al. Betran AP

273
ISO
Cod
e
Country
Coverag
e start
year
Covera
ge end
year
Caesare
an
section
rate (%)
References
USA United States of
America 2006 2006 31.1
Martin JA, Hamilton BE, Sutton PD, Ventura SJ, Menacker F, Kirmeyer S et al. Births: Final data for 2006. National Vital Statistics Reports; vol.57, no. 7. Hyattsville, MD: National Center for Health Statistics; 2009.
USA United States of
America 2007 2007 31.8
Martin JA, Hamilton BE, Sutton PD, Ventura SJ, Mathews TJ, Kirmeyer S et al. Births: Final Data for 2007. National Vital Statistics Reports; vol. 58, no.24. Hyattsville, MD: National Center for Health Statistics; 2010.
USA United States of
America 2008 2008 32.3
Martin JA, Hamilton BE, Sutton PD, Ventura SJ, Mathews TJ, Osterman MJK. Births: Final Data for 2008. National Vital Statistics Reports; vol. 59, no.1. Hyattsville, MD: National Center for Health Statistics; 2010.
USA United States of
America 2009 2009 32.9
Martin JA, Hamilton BE, Ventura SJ, Osterman MJK, Kirmeyer S, Mathews TJ et al. Births: Final Data for 2009. National Vital Statistics Reports; vol. 60, no.1. Hyattsville, MD: National Center for Health Statistics; 2011.
USA United States of
America 2010 2010 32.8
Martin JA, Hamilton BE, Ventura SJ, Osterman MJK, Wilson EC, Mathews TJ. Births: Final Data for 2010. National Vital Statistics Reports; vol. 61, no. 1. Hyattsville, MD: National Center for Health Statistics; 2012.
USA United States of
America 2011 2011 32.8
Martin JA, Hamilton BE, Ventura SJ, Osterman MJK, Mathews TJ. Births: Final data for 2011. National Vital Statistics Reports; vol 62, no 1. Hyattsville, MD: National Center for Health Statistics; 2013.
USA United States of
America 2012 2012 32.8
Martin JA, Hamilton BE, Osterman MJK, Curtin SC, Mathews TJ. Births: Final data for 2012. National Vital Statistics Reports; vol 62, no 9. Hyattsville, MD: National Center for Health Statistics; 2013.
USA United States of
America 2013 2013 32.7
Martin JA, Hamilton BE, Osterman MJK, Curtin SC, Mathews TJ. Births: Final data for 2013. National Vital Statistics Reports; vol 64, no 1. Hyattsville, MD: National Center for Health Statistics; 2015.
BMJ Publishing Group Limited (BMJ) disclaims all liability and responsibility arising from any relianceSupplemental material placed on this supplemental material which has been supplied by the author(s) BMJ Global Health
doi: 10.1136/bmjgh-2021-005671:e005671. 6 2021;BMJ Global Health, et al. Betran AP

274
ISO
Cod
e
Country
Coverag
e start
year
Covera
ge end
year
Caesare
an
section
rate (%)
References
USA United States of
America 2014 2014 32.2
Hamilton BE, Martin JA, Osterman MJK, Curtin SC, Mathews TJ. Births: Final Data for 2014. National Vital Statistics Reports; vol 64, no 12. Hyattsville, MD: National Center for Health Statistics; 2015.
USA United States of
America 2015 2015 32.0
Martin JA, Hamilton BE, Osterman MJK, Driscoll AK, Mathews TJ. Births: Final Data for 2015. National Vital Statistics Reports; vol 66, no 1. Hyattsville, MD: National Center for Health Statistics; 2017.
USA United States of
America 2016 2016 31.9
Martin JA, Hamilton BE, Osterman MJK, Driscoll AK, Drake P. Births: Final Data for 2016. National Vital Statistics Reports; vol 67, no 1. Hyattsville, MD: National Center for Health Statistics; 2018.
USA United States of
America 2017 2017 32.0
Martin JA, Hamilton BE, Osterman MJK, Driscoll AK, Drake P. Births: Final Data for 2017. National Vital Statistics Reports; vol 67, no 8. Hyattsville, MD: National Center for Health Statistics; 2018.
USA United States of
America 2018 2018 31.9
Martin JA, Hamilton BE, Osterman MJK, Driscoll AK. Births: Final Data for 2018. National Vital Statistics Reports; vol 68, no 13. Hyattsville, MD: National Center for Health Statistics; 2019.
URY Uruguay 1993 1993 23.9
Cuadros Estadísticos. Montevideo: Instituto Nacional de Estadística (INE); 2001 (in Spanish).
URY Uruguay 1996 1996 22.0
Estadísticas Vitales. Natalidad 1996. Forma de terminación del embarazo [website]. Montevideo: Ministerio de Salud Pública [Ministry of Public Health, Uruguay]; 1997 (http://www.msp.gub.uy/subcategorias_19_1.html, accessed 10 October 2012, in Spanish).
URY Uruguay 1997 1997 21.6
Estadísticas Vitales. Natalidad 1997. Forma de terminación del embarazo [website]. Montevideo: Ministerio de Salud Pública [Ministry of Public Health, Uruguay]; 1998 (http://www.msp.gub.uy/subcategorias_19_1.html, accessed 10 October 2012, in Spanish).
BMJ Publishing Group Limited (BMJ) disclaims all liability and responsibility arising from any relianceSupplemental material placed on this supplemental material which has been supplied by the author(s) BMJ Global Health
doi: 10.1136/bmjgh-2021-005671:e005671. 6 2021;BMJ Global Health, et al. Betran AP

275
ISO
Cod
e
Country
Coverag
e start
year
Covera
ge end
year
Caesare
an
section
rate (%)
References
URY Uruguay 1999 1999 22.4
Estadísticas Vitales. Natalidad 1999. Forma de terminación del embarazo [website]. Montevideo: Ministerio de Salud Pública [Ministry of Public Health, Uruguay]; 2000 (http://www.msp.gub.uy/subcategorias_19_1.html, accessed 10 October 2012, in Spanish).
URY Uruguay 2000 2000 23.1
Estadísticas Vitales. Natalidad 2000. Forma de terminación del embarazo [website]. Montevideo: Ministerio de Salud Pública [Ministry of Public Health, Uruguay]; 2001 (http://www.msp.gub.uy/subcategorias_19_1.html, accessed 10 October 2012, in Spanish).
URY Uruguay 2001 2001 25.7
Estadísticas Vitales. Natalidad 2001. Forma de terminación del embarazo [website]. Montevideo: Ministerio de Salud Pública [Ministry of Public Health, Uruguay]; 2002 (http://www.msp.gub.uy/subcategorias_19_1.html, accessed 10 October 2012, in Spanish).
URY Uruguay 2002 2002 25.8
Estadísticas Vitales. Natalidad 2002. Forma de terminación del embarazo [website]. Montevideo: Ministerio de Salud Pública [Ministry of Public Health, Uruguay]; 2003 (http://www.msp.gub.uy/subcategorias_19_1.html, accessed 10 October 2012, in Spanish).
URY Uruguay 2003 2003 26.6
Estadísticas Vitales. Natalidad 2003. Forma de terminación del embarazo [website]. Montevideo: Ministerio de Salud Pública [Ministry of Public Health, Uruguay]; 2004 (http://www.msp.gub.uy/subcategorias_19_1.html, accessed 10 October 2012, in Spanish).
URY Uruguay 2004 2004 28.9
Estadísticas Vitales. Natalidad 2004. Forma de terminación del embarazo [website]. Montevideo: Ministerio de Salud Pública [Ministry of Public Health, Uruguay]; 2005 (http://www.msp.gub.uy/subcategorias_19_1.html, accessed 10 October 2012, in Spanish).
URY Uruguay 2005 2005 31.0
Estadísticas Vitales. Natalidad 2005. Forma de terminación del embarazo [website]. Montevideo: Ministerio de Salud Pública [Ministry of Public Health, Uruguay]; 2006 (http://www.msp.gub.uy/subcategorias_19_1.html, accessed 10 October 2012, in Spanish).
URY Uruguay 2006 2006 31.2
Estadísticas Vitales. Natalidad 2006. Forma de terminación del embarazo [website]. Montevideo: Ministerio de Salud Pública [Ministry of Public Health, Uruguay]; 2007 (http://www.msp.gub.uy/subcategorias_19_1.html, accessed 10 October 2012, in Spanish).
BMJ Publishing Group Limited (BMJ) disclaims all liability and responsibility arising from any relianceSupplemental material placed on this supplemental material which has been supplied by the author(s) BMJ Global Health
doi: 10.1136/bmjgh-2021-005671:e005671. 6 2021;BMJ Global Health, et al. Betran AP

276
ISO
Cod
e
Country
Coverag
e start
year
Covera
ge end
year
Caesare
an
section
rate (%)
References
URY Uruguay 2007 2007 33.0
Estadísticas Vitales. Natalidad 2007. Forma de terminación del embarazo [website]. Montevideo: Ministerio de Salud Pública [Ministry of Public Health, Uruguay]; 2008 (http://www.msp.gub.uy/subcategorias_19_1.html, accessed 10 October 2012, in Spanish).
URY Uruguay 2011 2011 40.1
República Oriental del Uruguay - Estadísticas Vitales - Natalidad 2011-2015, Certificado de Nacido Vivo de Uruguay. Natalidad 2011_p: Tipo de cesárea (tipoces) [website]. Montevideo: Ministerio de Salud Pública [Ministry of Public Health, Uruguay]; 2016 (http://estadisticas.msp.gub.uy/index.php/catalog/20/data_dictionary#page=F10&tab=data-dictionary, accessed 4 August 2016, in Spanish).
URY Uruguay 2012 2012 39.9
Estadísticas Vitales. Nacimientos ocurridos y registrados según tipo de parto y grupo de edad materna. Uruguay 1996-2012. Montevideo: Ministerio de Salud Pública [Ministry of Public Health, Uruguay]; 2014 (in Spanish).
URY Uruguay 2013 2013 41.0
República Oriental del Uruguay - Estadísticas Vitales - Natalidad 2011-2015, Certificado de Nacido Vivo de Uruguay. Natalidad 2013_p: Tipo de cesárea (tipoces) [website]. Montevideo: Ministerio de Salud Pública [Ministry of Public Health, Uruguay]; 2016 (http://estadisticas.msp.gub.uy/index.php/catalog/20/data_dictionary#page=F14&tab=data-dictionary, accessed 4 August 2016, in Spanish).
URY Uruguay 2014 2014 39.5
República Oriental del Uruguay - Estadísticas Vitales - Natalidad 2011-2015, Certificado de Nacido Vivo de Uruguay. Natalidad 2014_p: Tipo de cesárea (tipoces) [website]. Montevideo: Ministerio de Salud Pública [Ministry of Public Health, Uruguay]; 2016 (http://estadisticas.msp.gub.uy/index.php/catalog/20/data_dictionary#page=F16&tab=data-dictionary, accessed 4 August 2016, in Spanish).
URY Uruguay 2015 2015 39.4
República Oriental del Uruguay - Estadísticas Vitales - Natalidad 2011-2015, Certificado de Nacido Vivo de Uruguay. Natalidad 2015_p: Tipo de cesárea (tipoces) [website]. Montevideo: Ministerio de Salud Pública [Ministry of Public Health, Uruguay]; 2016 (http://estadisticas.msp.gub.uy/index.php/catalog/20/data_dictionary#page=F9&tab=data-dictionary, accessed 4 August 2016, in Spanish).
UZB Uzbekistan 1993 1996 3.0
Institute of Obstetrics and Gynecology Ministry of Health [Uzbekistan], Macro International Inc. Uzbekistan Demographic and Health Survey, 1996. Calverton, Maryland: Macro International Inc.; 1997.
UZB Uzbekistan 1996 1996 2.2
European Health for All Database (HFA-DB) [online database]. World Health Organization (WHO) Regional Office for Europe; 2012 (http://data.euro.who.int/hfadb, accessed 20 August 2012).
BMJ Publishing Group Limited (BMJ) disclaims all liability and responsibility arising from any relianceSupplemental material placed on this supplemental material which has been supplied by the author(s) BMJ Global Health
doi: 10.1136/bmjgh-2021-005671:e005671. 6 2021;BMJ Global Health, et al. Betran AP

277
ISO
Cod
e
Country
Coverag
e start
year
Covera
ge end
year
Caesare
an
section
rate (%)
References
UZB Uzbekistan 1997 1997 2.3
European Health for All Database (HFA-DB) [online database]. World Health Organization (WHO) Regional Office for Europe; 2012 (http://data.euro.who.int/hfadb, accessed 20 August 2012).
UZB Uzbekistan 1998 1998 2.4
European Health for All Database (HFA-DB) [online database]. World Health Organization (WHO) Regional Office for Europe; 2012 (http://data.euro.who.int/hfadb, accessed 20 August 2012).
UZB Uzbekistan 1999 1999 2.7
European Health for All Database (HFA-DB) [online database]. World Health Organization (WHO) Regional Office for Europe; 2012 (http://data.euro.who.int/hfadb, accessed 20 August 2012).
UZB Uzbekistan 2000 2000 3.1
European Health for All Database (HFA-DB) [online database]. World Health Organization (WHO) Regional Office for Europe; 2012 (http://data.euro.who.int/hfadb, accessed 20 August 2012).
UZB Uzbekistan 2001 2001 3.3
European Health for All Database (HFA-DB) [online database]. World Health Organization (WHO) Regional Office for Europe; 2012 (http://data.euro.who.int/hfadb, accessed 20 August 2012).
UZB Uzbekistan 2002 2002 3.6
European Health for All Database (HFA-DB) [online database]. World Health Organization (WHO) Regional Office for Europe; 2012 (http://data.euro.who.int/hfadb, accessed 20 August 2012).
UZB Uzbekistan 2003 2003 3.8
European Health for All Database (HFA-DB) [online database]. World Health Organization (WHO) Regional Office for Europe; 2012 (http://data.euro.who.int/hfadb, accessed 20 August 2012).
UZB Uzbekistan 2004 2004 4.4
European Health for All Database (HFA-DB) [online database]. World Health Organization (WHO) Regional Office for Europe; 2012 (http://data.euro.who.int/hfadb, accessed 20 August 2012).
BMJ Publishing Group Limited (BMJ) disclaims all liability and responsibility arising from any relianceSupplemental material placed on this supplemental material which has been supplied by the author(s) BMJ Global Health
doi: 10.1136/bmjgh-2021-005671:e005671. 6 2021;BMJ Global Health, et al. Betran AP

278
ISO
Cod
e
Country
Coverag
e start
year
Covera
ge end
year
Caesare
an
section
rate (%)
References
UZB Uzbekistan 2005 2005 4.9
European Health for All Database (HFA-DB) [online database]. World Health Organization (WHO) Regional Office for Europe; 2012 (http://data.euro.who.int/hfadb, accessed 20 August 2012).
UZB Uzbekistan 2006 2006 6.1
European Health for All Database (HFA-DB) [online database]. World Health Organization (WHO) Regional Office for Europe; 2012 (http://data.euro.who.int/hfadb, accessed 20 August 2012).
UZB Uzbekistan 2007 2007 6.3
European Health for All Database (HFA-DB) [online database]. World Health Organization (WHO) Regional Office for Europe; 2012 (http://data.euro.who.int/hfadb, accessed 20 August 2012).
UZB Uzbekistan 2008 2008 6.7
European Health for All Database (HFA-DB) [online database]. World Health Organization (WHO) Regional Office for Europe; 2012 (http://data.euro.who.int/hfadb, accessed 20 August 2012).
UZB Uzbekistan 2009 2009 7.7
European Health for All Database (HFA-DB) [online database]. World Health Organization (WHO) Regional Office for Europe; 2012 (http://data.euro.who.int/hfadb, accessed 20 August 2012).
UZB Uzbekistan 2010 2010 8.6
European Health for All Database (HFA-DB) [online database]. World Health Organization (WHO) Regional Office for Europe; 2016 (http://data.euro.who.int/hfadb, accessed 8 August 2016).
UZB Uzbekistan 2011 2011 9.0
European Health for All Database (HFA-DB) [online database]. World Health Organization (WHO) Regional Office for Europe; 2016 (http://data.euro.who.int/hfadb, accessed 8 August 2016).
UZB Uzbekistan 2012 2012 10.5
European Health for All Database (HFA-DB) [online database]. World Health Organization (WHO) Regional Office for Europe; 2016 (http://data.euro.who.int/hfadb, accessed 8 August 2016).
BMJ Publishing Group Limited (BMJ) disclaims all liability and responsibility arising from any relianceSupplemental material placed on this supplemental material which has been supplied by the author(s) BMJ Global Health
doi: 10.1136/bmjgh-2021-005671:e005671. 6 2021;BMJ Global Health, et al. Betran AP

279
ISO
Cod
e
Country
Coverag
e start
year
Covera
ge end
year
Caesare
an
section
rate (%)
References
UZB Uzbekistan 2013 2013 11.1
European Health for All Database (HFA-DB) [online database]. World Health Organization (WHO) Regional Office for Europe; 2016 (http://data.euro.who.int/hfadb, accessed 8 August 2016).
UZB Uzbekistan 2014 2014 11.8
European Health for All Database (HFA-DB) [online database]. World Health Organization (WHO) Regional Office for Europe; 2016 (http://data.euro.who.int/hfadb, accessed 8 August 2016).
UZB Uzbekistan 2015 2015 13.6
UNICEF CRING: Uzbekistan; 2015.
VUT Vanuatu 2008 2013 11.9
Vanuatu Ministry of Health, Vanuatu National Statistics Office, Secretariat of the Pacific Community (SPC). Vanuatu Demographic and Health Survey 2013. Final Report. Noumea: SPC; 2014.
VEN Venezuela
(Bolivarian Republic of)
2009 2009 32.2
Anuario Estadístico 2009. Indicadores de redes de servicios y programas de salud. Caracas: Ministerio del Poder Popular para la Salud (MPPS) [Venezuela]; 2010 (in Spanish).
VNM Viet Nam 1994 1997 3.4
National Committee for Population and Family Planning. Viet Nam Demographic and Health Survey 1997. Ha Noi, Viet Nam: National Committee for Population and Family Planning; 1999.
VNM Viet Nam 1999 2002 9.9
Committee for Population, Family and Children [Vietnam], ORC Macro. Vietnam Demographic and Health Survey 2002. Calverton, Maryland, USA: Committee for Population, Family and Children, ORC Macro; 2003.
VNM Viet Nam 2009 2011 20.0
General Statistics Office (GSO), United Nations Children's Fund (UNICEF), United Nations Population Fund (UNFPA). Viet Nam Multiple Indicator Cluster Survey - Final Report, 2011. Ha Noi: General Statistical Office (GSO), UNICEF, UNFPA; 2011.
BMJ Publishing Group Limited (BMJ) disclaims all liability and responsibility arising from any relianceSupplemental material placed on this supplemental material which has been supplied by the author(s) BMJ Global Health
doi: 10.1136/bmjgh-2021-005671:e005671. 6 2021;BMJ Global Health, et al. Betran AP

280
ISO
Cod
e
Country
Coverag
e start
year
Covera
ge end
year
Caesare
an
section
rate (%)
References
VNM Viet Nam 2011 2014 27.5
General Statistics Office (GSO), United Nations Children's Fund (UNICEF). Viet Nam Multiple Indicator Cluster Survey 2014, Final Report. Ha Noi: General Statistics Office, UNICEF; 2015.
YEM Yemen 1992 1997 1.4
Central Statistical Organization (CSO) [Yemen], Macro International Inc. (Ml). Yemen Demographic and Maternal and Child Health Survey 1997. Calverton, Maryland, USA: CSO, MI; 1998.
YEM Yemen 1998 2003 8.6
The Yemen Family Health Survey: Principal Report. Cairo: Ministry of Health and Population [Yemen], Central Statistical Organization [Yemen], League of Arab States; 2004.
YEM Yemen 2009 2009 6.5
Annual Statistical Health Report 2009. Sana'a: Ministry of Health and Population [Yemen], 2010 (in Arabic).
YEM Yemen 2008 2013 4.8
Ministry of Public Health and Population (MOPHP) [Yemen], Central Statistical Organization (CSO) [Yemen], Pan Arab Program for Family Health (PAPFAM), ICF International. Yemen National Health and Demographic Survey 2013. Rockville, Maryland, USA: MOPHP, CSO, PAPFAM, ICF International; 2015.
ZMB Zambia 1987 1992 2.6
Gaisie K, Cross AR, Nsemukila G (University of Zambia, Central Statistical Office [Zambia], Macro International). Zambia Demographic and Health Survey 1992. Columbia, Maryland, USA: University of Zambia, Central Statistical Office [Zambia], Macro International; 1992.
ZMB Zambia 1991 1996 1.9
Central Statistical Office Ministry of Health [Zambia], Macro International Inc. Zambia Demographic and Health Survey, 1996. Calverton, Maryland: Central Statistical Office [Zambia], Macro International Inc.; 1997.
ZMB Zambia 1996 2002 2.1
Central Statistical Office [Zambia], Central Board of Health [Zambia], ORC Macro. Zambia Demographic and Health Survey 2001-2002. Calverton, Maryland, USA: Central Statistical Office [Zambia], Central Board of Health [Zambia], ORC Macro; 2003.
BMJ Publishing Group Limited (BMJ) disclaims all liability and responsibility arising from any relianceSupplemental material placed on this supplemental material which has been supplied by the author(s) BMJ Global Health
doi: 10.1136/bmjgh-2021-005671:e005671. 6 2021;BMJ Global Health, et al. Betran AP

281
ISO
Cod
e
Country
Coverag
e start
year
Covera
ge end
year
Caesare
an
section
rate (%)
References
ZMB Zambia 2003 2003 6.9
Annual Health Statistical Bulletin 2003. Lusaka: Central Board of Health [Zambia]; 2004.
ZMB Zambia 2002 2007 3.0
Central Statistical Office (CSO), Ministry of Health (MOH), Tropical Diseases Research Centre (TDRC), University of Zambia, Macro International Inc. Zambia Demographic and Health Survey 2007. Calverton, Maryland, USA: CSO, Macro International Inc.; 2009.
ZMB Zambia 2008 2014 4.4
Central Statistical Office (CSO) [Zambia], Ministry of Health (MOH) [Zambia], ICF International. Zambia Demographic and Health Survey 2013-14. Rockville, Maryland, USA: Central Statistical Office, Ministry of Health, ICF International; 2015.
ZMB Zambia 2014 2019 5.0
Zambia Demographic and Health Survey 2018. Lusaka, Rockville, Maryland, USA: Zambia Statistics Agency, Ministry of Health (MOH) [Zambia], ICF; 2019.
ZWE Zimbabwe 1989 1994 6.0
Central Statistical Office [Zimbabwe], Macro International Inc. Zimbabwe Demographic and Health Survey, 1994. Calverton, Maryland, USA: Central Statistical Office [Zimbabwe], Macro International Inc.; 1995.
ZWE Zimbabwe 1994 1999 6.7
Central Statistical Office [Zimbabwe], Macro International Inc. Zimbabwe Demographic and Health Survey 1999. Calverton, Maryland, USA: Central Statistical Office [Zimbabwe], Macro International Inc.; 2000.
ZWE Zimbabwe 2000 2006 4.8
Central Statistical Office (CSO) [Zimbabwe], Macro International Inc. Zimbabwe Demographic and Health Survey 2005-06. Calverton, Maryland, USA: CSO [Zimbabwe], Macro International Inc.; 2007.
ZWE Zimbabwe 2005 2011 4.5
Zimbabwe National Statistics Agency (ZIMSTAT), ICF International. Zimbabwe Demographic and Health Survey 2010-11. Calverton, Maryland: ZIMSTAT, ICF International Inc.; 2012.
BMJ Publishing Group Limited (BMJ) disclaims all liability and responsibility arising from any relianceSupplemental material placed on this supplemental material which has been supplied by the author(s) BMJ Global Health
doi: 10.1136/bmjgh-2021-005671:e005671. 6 2021;BMJ Global Health, et al. Betran AP

282
ISO
Cod
e
Country
Coverag
e start
year
Covera
ge end
year
Caesare
an
section
rate (%)
References
ZWE Zimbabwe 2010 2015 5.8
Zimbabwe National Statistics Agency, ICF International. Zimbabwe Demographic and Health Survey 2015: Final Report. Rockville, Maryland, USA: Zimbabwe National Statistics Agency (ZIMSTAT), ICF International; 2016.
ZWE Zimbabwe 2017 2019 9.0
Zimbabwe Multiple Indicator Cluster Survey 2019, Snapshots of Key Findings. Harare: Zimbabwe National Statistics Agency (ZIMSTAT), United Nations Children's Fund (UNICEF); 2019.
BMJ Publishing Group Limited (BMJ) disclaims all liability and responsibility arising from any relianceSupplemental material placed on this supplemental material which has been supplied by the author(s) BMJ Global Health
doi: 10.1136/bmjgh-2021-005671:e005671. 6 2021;BMJ Global Health, et al. Betran AP