trees on farm: global extent and socio-ecological characteristics and the contribution of...
TRANSCRIPT

Land
Robert Zomer, Antonio Trabucco, Jianchu Xu, Mingcheng WangFrank Place, Rick Coe, Henry Neufeldt, Deborah Bossio,
Miene van Noordwyk, Antje Ahrends
Center for Mountain Ecosystem StudiesKunming Insitute of Botany /
World Agroforestry Centre – East and Central Asia RegionKunming, Yunnan Province, China
Sept 5, 2016ICRAF Science Week
Nairobi, Kenya
Global Tree Cover and Biomass Carbon on Agricultural Land:
Trees on Farm: Global Extent and Socio-Ecological Characteristicsand the
Contribution of Agroforestry to Global and National Carbon Budgets

How much agroforestry is there? Where is it?

Agroforestry is Globally Important• Increasingly cited in sustainable development, adaptation and
mitigation strategies and policies, in all regions, biomes
• Estimates needed to ensure realistic policy attention
“During preparation of the IAAST report, USA referees said that everyone knew there were only 50,000 ha of agroforestry in the world and that they were a failure”
• Global estimates based on expert opinion
“…we propose that 20% of the arable and permanent cropped area and 15% of the pasture lands in the world is under silvopastoral combination…” Nair , Kumar and Nair (2009)

Issue: What is agroforestryLanduse Category• Many definitions of AF,
– systems, typologies, technologies
• Many types of AF systems – spatial and temporal scales
• Plot to landscape, • Short-rotations to historic• Cropping - Livestock Based
Key mapping problem: • Not easily categorized or classified within traditional agriculture /
forestry typologies, as used in remote sensing and landuse mapping
• Small holder farming systems are not easily mapped using RS
The result: Partial area estimates for some systems

Agroforestry defined as trees in agricultural landscapes
Use remote sensed estimates of:• Location of agricultural land
– GLC 2000 Dataset– 1 km resolution – Year: 2000
• Tree cover % – VCF - Hanson et al 2003 – 500m MODIS data – Year: 2000
Add:• Population Density
• (CIESIN 2004) – GRUMP v1
• Bioclimate – Aridity Wetness Index• (Zomer et al 2007)

The 1 km x 1 km scale of analysisExample – a few km from here.- classified as ‘agricultural’- 10% tree cover- 400 people
One observation in the global database of 22 million
1 km
1 km
Statistical analysis:counting pixels in different categories

Disclaimers and Sources of Uncertainity
• A global analysis showing large scale patterns, not predictions of specific localities.– Base layers are imperfect
• Uncertainity associated with remote sensing data– No info on configuration of trees and agric land in each
pixel – No info on population interaction with the land and trees– Estimates of tree crown cover only, not of number of
trees• Land not classified as ‘Agricultural’ is excluded
– Tree crops– Agroforests

Agricultural land and tree cover
0 3 6 9 12 15 18 21 24 27 30 33 36 39 42 45 48 51 54 57 60 63 66 69 72 75 78 81 84 87 90 93 96 990
500000
1000000
1500000
2000000
2500000
% tree cover
area
of a
gric
land
(km
2)

Agricultural land and tree cover
0 10 20 30 40 50 60 70 80 90 1000
5
10
15
20
0
20
40
60
80
100
tree cover %
cum
ulat
ive
area
(mill
ion
km2)
% a
gric
ulur
al a
rea
46% of global agric land (gal)= 10.1 Million km2 has more than 10% tree cover
46% gal (10.1 M km2) has > 10% tree cover27% gal ( 6.0 M km2) has > 20% tree cover18% gal ( 3.9 M km2) has > 30% tree cover 8% gal ( 1.7 M km2) has > 50% tree cover

Tree cover varies by region
0 8 16 24 32 40 48 56 64 72 80 88 960
20
40
60
80
100
Central AmericaSouth AmericaEast AsiaSouth AsiaSouthEast AsiaSub-Saharan Africa
% tree cover
cum
ulati
ve %
agr
ic la
nd

People in agric land with tree cover
0 10 20 30 40 50 60 70 80 90 1000
300
600
900
1200
1500
1800
0
20
40
60
80
100
Tree cover %
cum
ulat
ive
popu
latio
n (m
illio
ns)
% p
opul
atio
n
Of 1.8 billion people in agric land…31% (558 M) have > 10% tree cover18% (330 M) have > 20% tree cover10% (187 M) have > 30% tree cover

Global pattern of trees and people in agricultural land
1.Every combination of +/- tree cover and +/- populationoccurs 2. There are large scale patterns

Aridity is a biophysical determinant
05
101520253035404550
Central AmericaSouth AmericaAfricaSouth AsiaEast AsiaSouthEast AsiaGlobal
Aridity Wetness Index
Aver
age
tree
cov
er (%
)
dry wet


Tree cover on agricultural land in sub-saharan Africa varies

Feasible tree cover = observed on top 20% of land with that population and climate

Difference = observed - feasible

Key messages - 2009• Tree cover is a common feature on agricultural land
– Must be recognized by all involved in agricultural production, planning and policy development.
• There is large variation at every scale from continental to 1 km2
• Tree cover increases with humidity – but with many exceptions.
• There is no general tradeoff in agricultural landscapes between people and trees.
• Large scale tree cover patterns cannot be fully explained by humidity, population density or region

• Improved Data– 250 m MODIS– Improved accuracy
• Temporal Analysis– Annual Data – 2000 to 2010
• Change Analysis– Avg 2000-2002– Avg 2008-2010
• Global estimate of land under at least 10% tree cover in 2000 revised to 40% from 46%
Update and Re-analysis - 2014

Change in Amount of AgriculturalArea with Tree Cover
From 2000 to 2010
• Globally, percent of land under at least 10% tree cover increased from 40% to 43%, > 1 billion ha
• Almost all regions increased the amount of land with at least 10% tree cover
• South America showed the largest increase
• Only North and Central Asia decreased area
• South Asia increased from 21% to 28%, East Asia from 43% to 48%
• Central America increased to 96% of all agricultural land with at least 10% tree cover

Change in Population of Agricultural Area with Tree Cover
From 2000 to 2010
• Globally, percent of population under at least 10% tree cover increased from 41% to 46%, increasing by 90 million, to more than 900 million persons
• Almost all regions increased the population living with at least 10% tree cover
• South Asia showed the largest increase, 44 million more people, to 34% of all persons in ag area
• Only North and Central Asia decreased population
• Central America increased to 95% of all population in agricultural land having at least 10% tree cover

Above and Below Ground Biomass Carbon on Agricultural Land
Estimating The Contribution of Agroforestry to Global, Regional, and National Carbon Accounting
• IPCC Tier-1 Global Biomass Carbon Map • Ruesch and Gibbs (2008)
• World stratified into 124 carbon zones by eco-floristic/ bio-climatic region
• Each landuse type in the GLC2000 dataset (which we also used), within each carbon zone, has a carbon estimate specific for that landuse within that carbon zone
• However, globally, all agricultural land was estimated with one relatively low value of 5 tC / ha
• Tree cover (agroforestry) component missing from this map, and from global and national carbon budgets and carbon accounting generally

Above and Below Ground Biomass Carbon on Agricultural Land
Adding the missing trees !!
Combine Tree Cover Analysis with the CDIAC Biomass Carbon Map
Assumptions:• If agric. land had 0% tree cover,
then: biomass = 5 tC/ha • (IPCC Tier-1 default value)
• If agric. land had 100% tree cover, then:
• biomass = mixed forest type • Biomass carbon increases linearly
from 0 to 100 % tree cover• i.e., from 5 tC/ha to value of
mixed forest

Total Global Biomass Carbon on Agricultural Land• IPCC Default Value: 11.08 PgC• 2000 : 45.30 PgC 2010 : 47.37 PgC Increase : 2.07 PgC
• Increase of 4.6 % in total global biomass carbon on agricultural land
Average Biomass Carbon on Agricultural Land• IPCC Default Value: 5 tC/ha• 2000 : 28.0 tC/ha 2010 : 29.0 tC/ha Increase : 0.95 tC/ha
Above and Below Ground Biomass Carbon on Agricultural Land
The Contribution of Agroforestry to Global, Regional, and National Carbon Accounting
CO2 emissions from deforestation and other land-use change were 0.9±0.5 PgC on average during 2005-2014, accounting for about 9% of all emissions from human activity (fossil fuel, cement, land use change).
Source: Carbon Project

Biomass Carbon on Agricultural Land Total Biomass Carbon Average Biomass Carbon
Total Agricultural Area (km2)
Pg C Increase as % of Total C
t C / ha
Region 2000 2010 Change 2000 2010 Change Australia/Pacific 2.11 2.28 0.17 8.06 26.7 28.9 2.2 790,658 Central America 1.42 1.52 0.09 6.45 52.9 56.3 3.4 269,235 Central Asia 0.48 0.47 0.00 -1.04 5.7 5.7 -0.1 830,949 East Asia 2.37 2.53 0.16 6.95 13.2 14.1 0.9 1,795,893 Eastern and Southern Africa 2.31 2.30 0.00 -0.17 14.7 14.6 -0.0 1,573,527 Europe 2.13 2.15 0.02 0.96 9.3 9.4 0.1 2,299,766 North Africa 0.11 0.11 0.00 -0.01 7.3 7.3 -0.0 155,948 North America 3.31 3.40 0.09 2.68 16.0 16.4 0.4 2,073,033 Russia 1.07 1.07 0.00 0.02 6.4 6.4 0.0 1,669,166
South America 11.34 12.13 0.79 6.95 29.2 31.2 2.0 3,888,792 South Asia 2.30 2.48 0.18 7.85 12.6 13.6 1.0 1,827,025
South East Asia 10.03 10.69 0.66 6.59 60.8 64.8 4.0 1,648,268 West and Central Africa 5.57 5.45 -0.12 -2.18 23.3 22.8 -0.5 2,390,980 Western Asia 0.75 0.79 0.04 4.72 7.9 8.2 0.4 955,689
Global 45.30 47.37 2.07 4.57 28.0 29.0 0.95 22,168,929
Agricultural Baseline 11.08 11.08 5.0 5.0
Contribution by Trees 34.22 36.29 2.07 4.57 23.03 23.97 0.95
Above and Below Ground Biomass Carbon on Agricultural Land
The Contribution of Agroforestry to Global, Regional, and National Carbon Accounting

Above and Below Ground Biomass Carbon on Agricultural Land
The Contribution of Agroforestry to
National Carbon Accounting
• Brazil, the greatest total amount, 6.8 PgC in 2000, increased by 14% to 7.7 PgC by 2010.
• Indonesia (5.5 PgC) increased more than 9%.
• 60 countries have < 10t C/ha • 26 countries have > 50t C/ha• Chile, New Zealand, Ghana, and
Bangladesh’s stocks all showed increases near or in excess of 20%.
• 23 countries declined more than 1%, • Sierra Leone (25%), Argentina
(20%), Guinea (14%), and Myanmar (10%).

• Brazil increasing by 14%
• Argentina’s stocks showed the largest total decline decreasing 20%, (0.18 PgC)
• On a per hectare basis, Agentina’s decrease from 17.8 to 14.2 tC/ha represents a 3.6% decrease biomass carbon over nearly a half million km2 of agricultural land.
• ”Hot spots” of biomass loss are evident along the coast of Ecuador, northeast Brazil
Above and Below Ground Biomass Carbon on Agricultural
Land
The Contribution of Agroforestry to
National Carbon Accounting

• Hot spot of of biomass carbon loss along NW coast of Myanmar
• Decreases southern Vietnam, central Laos, northeast Thailand, parts of northern Malaysia, northern Vietnam
• Increases in southern
China, Thailand, Malaysia
Above and Below Ground Biomass Carbon on Agricultural
Land
The Contribution of Agroforestry to
National Carbon Accounting
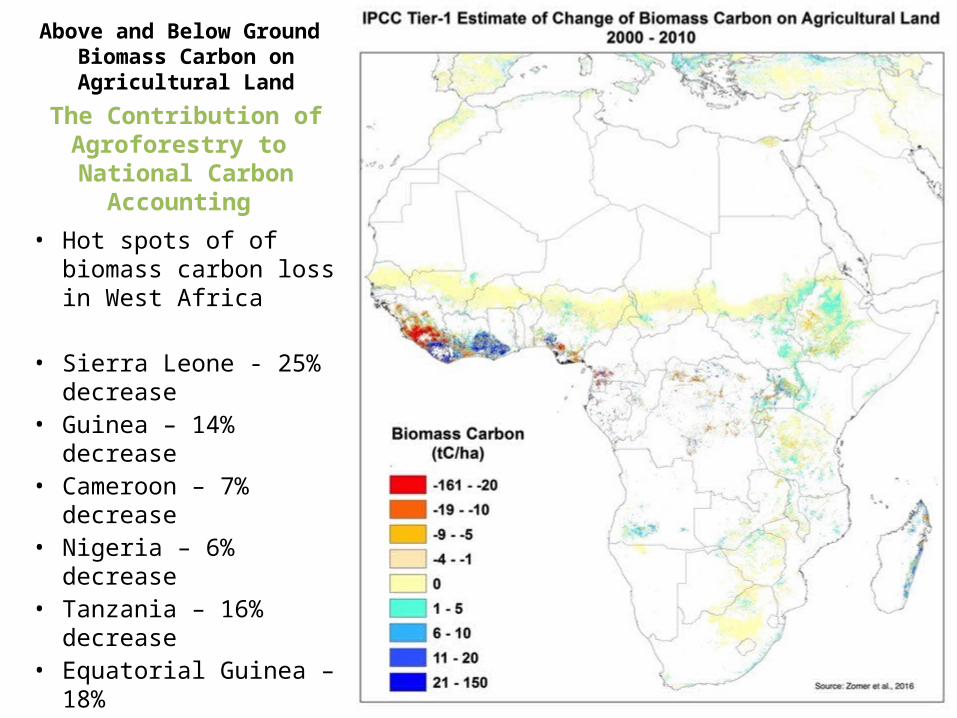
• Hot spots of of biomass carbon loss in West Africa
• Sierra Leone - 25% decrease• Guinea – 14% decrease• Cameroon – 7% decrease• Nigeria – 6% decrease• Tanzania – 16% decrease• Equatorial Guinea – 18%
• Cote de Ivoire – 7% increase• Ghana – 23% increase• Madagascar – 24% increase
Above and Below Ground Biomass Carbon on Agricultural
Land
The Contribution of Agroforestry to
National Carbon Accounting

Above and Below Ground Biomass Carbon on Agricultural Land
The Contribution of Agroforestry to National Carbon Accounting
Increase in biomass carbon stock: Bangaldesh 20% - Indonesia 9 %– Malaysia 10 % - China 8% India 7%– Thailand 6% - Papua New Guinea 4%

• Approximately 43% of agricultural land in 2010 had >10% tree cover
• Nearly one-billion hectares supporting more than 900 million persons
• IPCC default value of 5t C/ha of biomass for agric land is a gross under-estimate
• Off by a factor of 4 - 75% of biomass on agricultural land is tree-based
• Agroforestry provides not just adaptation, but also mitigation benefits
• Amount of carbon is significant, .. enough that it should be accounted for !!!
• Current focus is on delivering the (I)NDCs, countries are looking for evidence/analyses, practical solutions and increased capacities to include, or not, tree-based solutions.
• This type of analysis can provide a basis for targeting, guiding adaptation strategies and policy development.
• Can provide insight to impact of enabling environments and national policy context
• This is a rich set of spatial data available for understanding broad geographic patterns of agroforestry and the implications of national policy environments.
Key messages - 2016

http://www.worldagroforestry.org/global-tree-cover/
Global Tree Cover and Biomass Carbon on Agricultural Land Website
Thank You !!Robert Zomer