trecvid 2010 – an overview of the goals, tasks, data
TRANSCRIPT

TRECVID 2010 – An Overview of the Goals, Tasks, Data,
Evaluation Mechanisms, and Metrics
Paul Over {[email protected]}George Awad {[email protected]}
Jon Fiscus {[email protected]}Brian Antonishek {[email protected]}
Information Access DivisionNational Institute of Standards and Technology
Gaithersburg, MD 20899-8940, USA
Martial MichelSystems Plus
One Research Court, Suite 360Rockville, MD 20850
Alan F. Smeaton {[email protected]}CLARITY: Centre for Sensor Web Technologies
School of ComputingDublin City University
Glasnevin, Dublin 9, Ireland
Wessel Kraaij {[email protected]}TNO Information and Communication Technology
Delft, the NetherlandsRadboud University Nijmegen
Nijmegen, the Netherlands
Georges Quenot {[email protected]}UJF-Grenoble 1 / UPMF-Grenoble 2 / Grenoble INP /
CNRS, LIG UMR 5217, Grenoble, F-38041 France
April 15, 2011
1 Introduction
The Text Retrieval Conference’s (TREC’s) Video Re-trieval Evaluation (TRECVID) 2010 was a TREC-style video analysis and retrieval evaluation, the goalof which remains to promote progress in content-based exploitation of digital video via open, metrics-based evaluation. Over the last 10 years this ef-fort has yielded a better understanding of how sys-tems can effectively accomplish such processing andhow one can reliably benchmark their performance.
TRECVID is funded by the National Institute ofStandards and Technology (NIST) and other US gov-ernment agencies. Many organizations and individ-uals worldwide also contribute significant time andeffort.
In 2010, TRECVID turned to new and differentdata and to some new tasks. 73 teams (see Table 1)from various research organizations — 27 from Eu-rope, 32 from Asia, 12 from North America, 1 fromAfrica, and 1 from South America — completed oneor more of six tasks:
1
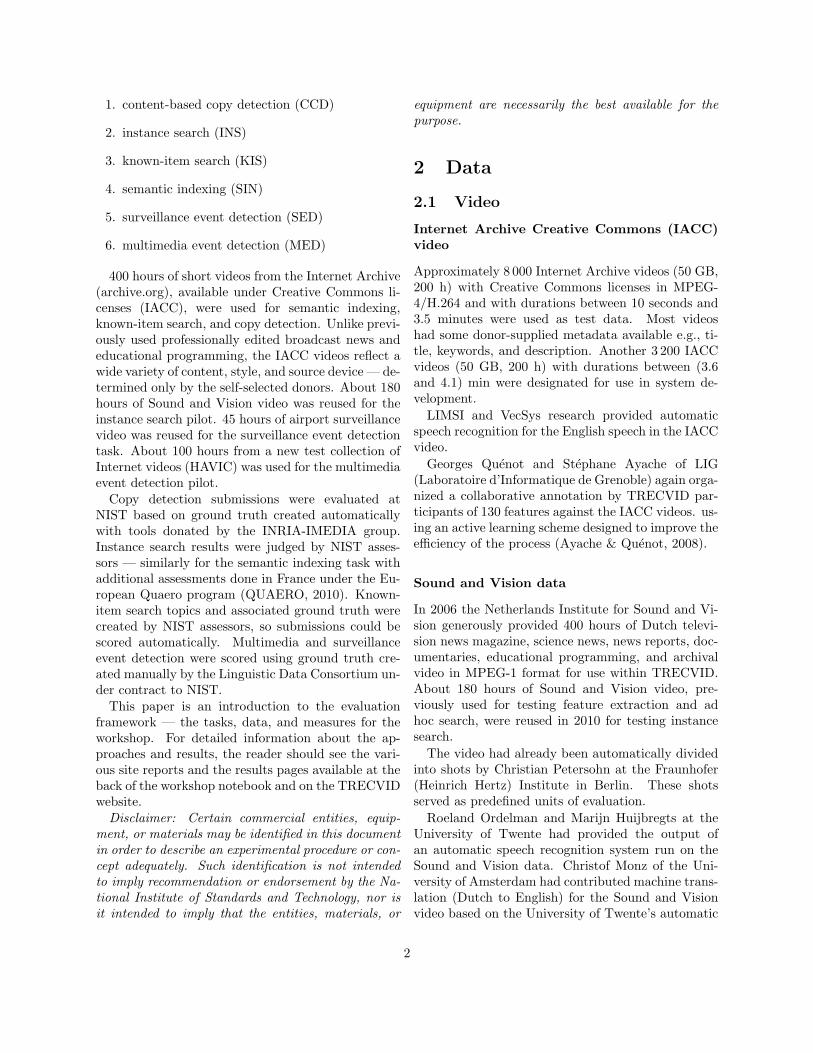
1. content-based copy detection (CCD)
2. instance search (INS)
3. known-item search (KIS)
4. semantic indexing (SIN)
5. surveillance event detection (SED)
6. multimedia event detection (MED)
400 hours of short videos from the Internet Archive(archive.org), available under Creative Commons li-censes (IACC), were used for semantic indexing,known-item search, and copy detection. Unlike previ-ously used professionally edited broadcast news andeducational programming, the IACC videos reflect awide variety of content, style, and source device — de-termined only by the self-selected donors. About 180hours of Sound and Vision video was reused for theinstance search pilot. 45 hours of airport surveillancevideo was reused for the surveillance event detectiontask. About 100 hours from a new test collection ofInternet videos (HAVIC) was used for the multimediaevent detection pilot.
Copy detection submissions were evaluated atNIST based on ground truth created automaticallywith tools donated by the INRIA-IMEDIA group.Instance search results were judged by NIST asses-sors — similarly for the semantic indexing task withadditional assessments done in France under the Eu-ropean Quaero program (QUAERO, 2010). Known-item search topics and associated ground truth werecreated by NIST assessors, so submissions could bescored automatically. Multimedia and surveillanceevent detection were scored using ground truth cre-ated manually by the Linguistic Data Consortium un-der contract to NIST.
This paper is an introduction to the evaluationframework — the tasks, data, and measures for theworkshop. For detailed information about the ap-proaches and results, the reader should see the vari-ous site reports and the results pages available at theback of the workshop notebook and on the TRECVIDwebsite.
Disclaimer: Certain commercial entities, equip-ment, or materials may be identified in this documentin order to describe an experimental procedure or con-cept adequately. Such identification is not intendedto imply recommendation or endorsement by the Na-tional Institute of Standards and Technology, nor isit intended to imply that the entities, materials, or
equipment are necessarily the best available for thepurpose.
2 Data
2.1 Video
Internet Archive Creative Commons (IACC)video
Approximately 8 000 Internet Archive videos (50 GB,200 h) with Creative Commons licenses in MPEG-4/H.264 and with durations between 10 seconds and3.5 minutes were used as test data. Most videoshad some donor-supplied metadata available e.g., ti-tle, keywords, and description. Another 3 200 IACCvideos (50 GB, 200 h) with durations between (3.6and 4.1) min were designated for use in system de-velopment.
LIMSI and VecSys research provided automaticspeech recognition for the English speech in the IACCvideo.
Georges Quenot and Stephane Ayache of LIG(Laboratoire d’Informatique de Grenoble) again orga-nized a collaborative annotation by TRECVID par-ticipants of 130 features against the IACC videos. us-ing an active learning scheme designed to improve theefficiency of the process (Ayache & Quenot, 2008).
Sound and Vision data
In 2006 the Netherlands Institute for Sound and Vi-sion generously provided 400 hours of Dutch televi-sion news magazine, science news, news reports, doc-umentaries, educational programming, and archivalvideo in MPEG-1 format for use within TRECVID.About 180 hours of Sound and Vision video, pre-viously used for testing feature extraction and adhoc search, were reused in 2010 for testing instancesearch.
The video had already been automatically dividedinto shots by Christian Petersohn at the Fraunhofer(Heinrich Hertz) Institute in Berlin. These shotsserved as predefined units of evaluation.
Roeland Ordelman and Marijn Huijbregts at theUniversity of Twente had provided the output ofan automatic speech recognition system run on theSound and Vision data. Christof Monz of the Uni-versity of Amsterdam had contributed machine trans-lation (Dutch to English) for the Sound and Visionvideo based on the University of Twente’s automatic
2

speech recognition (ASR). The LIMSI Spoken Lan-guage Processing Group had produced a speech tran-scription for the TRECVID 2007-2009 Sound and Vi-sion data using its recently developed Dutch recog-nizer.
iLIDS Multiple Camera Tracking Data
The iLIDS Multiple Camera Tracking data consistedof ≈150 hours of indoor airport surveillance video col-lected in a busy airport environment by the UnitedKingdom (UK) Home Office Scientific DevelopmentBranch (HOSDB). The dataset utilized 5 frame-synchronized cameras.
The training video consisted of the ≈100 hoursof data used for SED 2008 evaluation. The evalu-ation video consisted of an additional ≈50 hours ofdata from Imagery Library for Intelligent DetectionSystem’s (iLIDS) multiple camera tracking scenario(UKHO-CPNI, 2007 (accessed June 30, 2009)).
One third of the evaluation video was annotated bythe Linguistic Data Consortium using a triple-passannotation procedure. Seven of the ten annotatedevents were used for the 2010 evaluation.
Heterogeneous Audio Visual Internet(HAVIC) Corpus
The Heterogeneous Audio Visual Internet (HAVIC)Corpus is a new, large corpus of Internet multime-dia files collected by the Linguistic Data Consor-tium. The corpus contained ≈3 400 video clips con-sists of ≈114 hours of MPEG-4 (MPEG-4, 2010) for-matted files containing H.264 (H.264, 2010) encodedvideo and MPEG-4’s Advanced Audio Coding (ACC)(ACC, 2010) encoded audio. The data was collectedto specifically contain 100 instances of three events:“Assembling a Shelter”, “Batting in a run”, “Makinga Cake”. The data was evenly divided up into a ≈57hour development set and a ≈57 hour evaluation set– each set containing ≈50 instances per event.
3 Semantic indexing
A potentially important asset to help videosearch/navigation is the ability to automaticallyidentify the occurrence of various semantic fea-tures/concepts such as “Indoor/Outdoor”, “People”,“Speech” etc., which occur frequently in video infor-mation. The ability to detect features is an interest-ing challenge by itself but takes on added importance
Figure 1: xinfAP by run (cat. C) - Full
Figure 2: xinfAP by run (cat. D) - Full
3
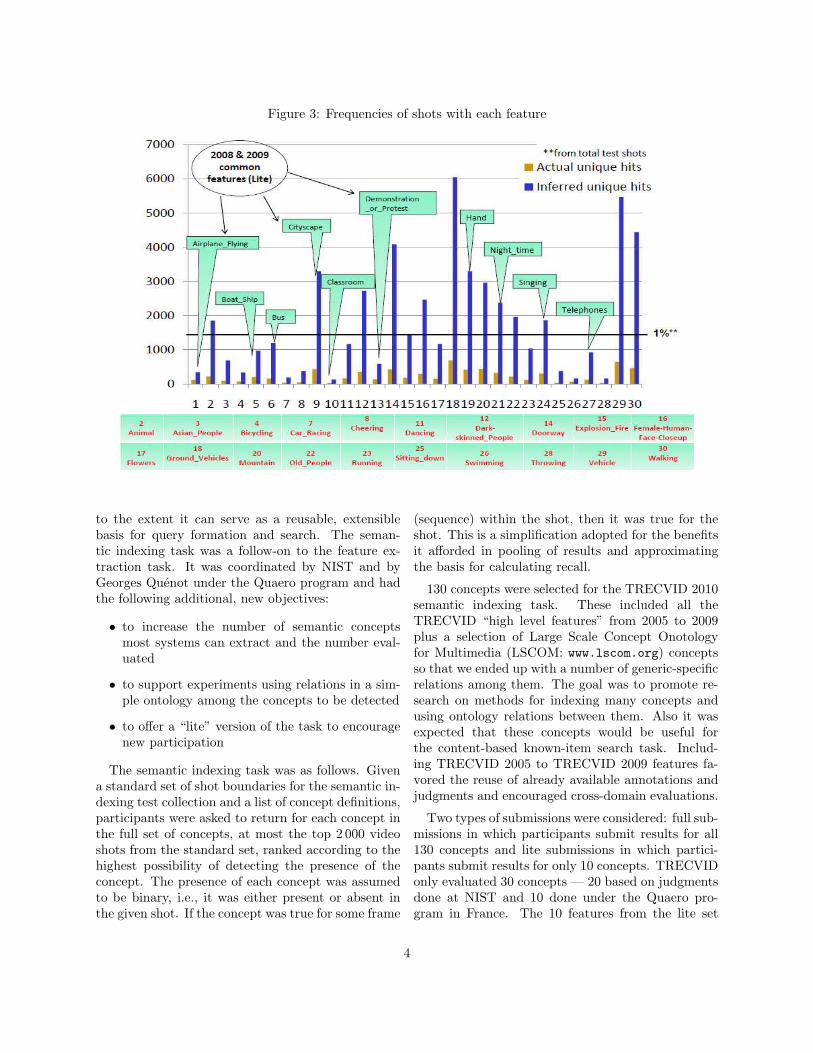
Figure 3: Frequencies of shots with each feature
to the extent it can serve as a reusable, extensiblebasis for query formation and search. The seman-tic indexing task was a follow-on to the feature ex-traction task. It was coordinated by NIST and byGeorges Quenot under the Quaero program and hadthe following additional, new objectives:
• to increase the number of semantic conceptsmost systems can extract and the number eval-uated
• to support experiments using relations in a sim-ple ontology among the concepts to be detected
• to offer a “lite” version of the task to encouragenew participation
The semantic indexing task was as follows. Givena standard set of shot boundaries for the semantic in-dexing test collection and a list of concept definitions,participants were asked to return for each concept inthe full set of concepts, at most the top 2 000 videoshots from the standard set, ranked according to thehighest possibility of detecting the presence of theconcept. The presence of each concept was assumedto be binary, i.e., it was either present or absent inthe given shot. If the concept was true for some frame
(sequence) within the shot, then it was true for theshot. This is a simplification adopted for the benefitsit afforded in pooling of results and approximatingthe basis for calculating recall.
130 concepts were selected for the TRECVID 2010semantic indexing task. These included all theTRECVID “high level features” from 2005 to 2009plus a selection of Large Scale Concept Onotologyfor Multimedia (LSCOM: www.lscom.org) conceptsso that we ended up with a number of generic-specificrelations among them. The goal was to promote re-search on methods for indexing many concepts andusing ontology relations between them. Also it wasexpected that these concepts would be useful forthe content-based known-item search task. Includ-ing TRECVID 2005 to TRECVID 2009 features fa-vored the reuse of already available annotations andjudgments and encouraged cross-domain evaluations.
Two types of submissions were considered: full sub-missions in which participants submit results for all130 concepts and lite submissions in which partici-pants submit results for only 10 concepts. TRECVIDonly evaluated 30 concepts — 20 based on judgmentsdone at NIST and 10 done under the Quaero pro-gram in France. The 10 features from the lite set
4

Figure 4: xinfAP by run (cat. A) - Full Figure 5: xinfAP by run (cat. A) - Lite
5
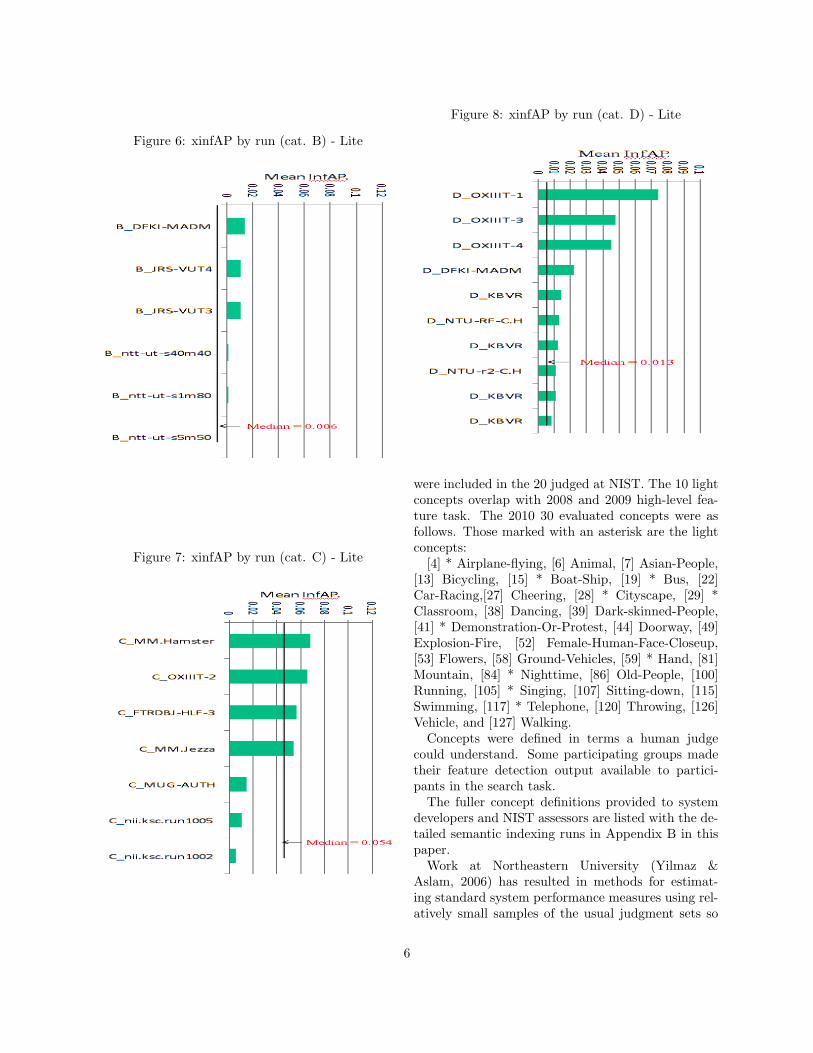
Figure 6: xinfAP by run (cat. B) - Lite
Figure 7: xinfAP by run (cat. C) - Lite
Figure 8: xinfAP by run (cat. D) - Lite
were included in the 20 judged at NIST. The 10 lightconcepts overlap with 2008 and 2009 high-level fea-ture task. The 2010 30 evaluated concepts were asfollows. Those marked with an asterisk are the lightconcepts:
[4] * Airplane-flying, [6] Animal, [7] Asian-People,[13] Bicycling, [15] * Boat-Ship, [19] * Bus, [22]Car-Racing,[27] Cheering, [28] * Cityscape, [29] *Classroom, [38] Dancing, [39] Dark-skinned-People,[41] * Demonstration-Or-Protest, [44] Doorway, [49]Explosion-Fire, [52] Female-Human-Face-Closeup,[53] Flowers, [58] Ground-Vehicles, [59] * Hand, [81]Mountain, [84] * Nighttime, [86] Old-People, [100]Running, [105] * Singing, [107] Sitting-down, [115]Swimming, [117] * Telephone, [120] Throwing, [126]Vehicle, and [127] Walking.
Concepts were defined in terms a human judgecould understand. Some participating groups madetheir feature detection output available to partici-pants in the search task.
The fuller concept definitions provided to systemdevelopers and NIST assessors are listed with the de-tailed semantic indexing runs in Appendix B in thispaper.
Work at Northeastern University (Yilmaz &Aslam, 2006) has resulted in methods for estimat-ing standard system performance measures using rel-atively small samples of the usual judgment sets so
6

Figure 9: Top 10 runs (xinfAP) by feature - Full
Figure 10: Top 10 runs (xinfAP) by feature - Full + Lite
7
that larger numbers of features can be evaluated us-ing the same amount of judging effort. Tests on pastdata showed the new measure (inferred average pre-cision) to be a good estimator of average precision(Over, Ianeva, Kraaij, & Smeaton, 2006). This yearmean extended inferred average precision (mean xin-fAP) was used, which permited sampling density tovary (Yilmaz, Kanoulas, & Aslam, 2008). This al-lowed the evaluation to be more sensitive to shotsreturned below the lowest rank (≈100) previouslypooled and judged. It also allowed adjustment ofthe sampling density to be greater among the highestranked items,which contribute more to average pre-cision than those ranked lower.
3.1 Data
As mentioned earlier, the IACC test collection con-tained approximately 8 000 files/videos in MPEG-4/H.264 format and 146 788 shots. Developmentdata contained 3200 files/videos and approx. 119 685shots. Testing concept detection and known itemsearch on the same data offered the opportunity toassess the quality of concepts being used in search.
3.2 Evaluation
Each group was allowed to submit up to 4 runs and infact 39 groups submitted a total of 150 runs including100 full runs and 50 “lite” runs.
For each concept, 3 pools of shots were created asfollows for use with sample eval. The sample evalevaluation tool is discussed below under “Measures”.
1. The top pool comprised all unique shots ranked1-10 in any submission. The medium pool in-cluded all unique shots 11-100 in any submissionand not in the top pool The bottom pool held allunique shots ranked 101-2000 in any submissionand not in the top or medium pools.
2. Each pool was then partitioned into a judged andan unjudged part using random sampling. Thefollowing fractions of each pool were marked forjudgment: 100 % of the top pool, 20 % of middlepool, and 5 % of the bottom pool.
3. The part to be judged, (top, middle and bot-tom combined and randomly ordered) was pre-sented to humans for judgment. The shots inthe unjudged part were marked unjudged. Afterthe human judgments were recorded, the unionof the judged and unjudged parts made up the
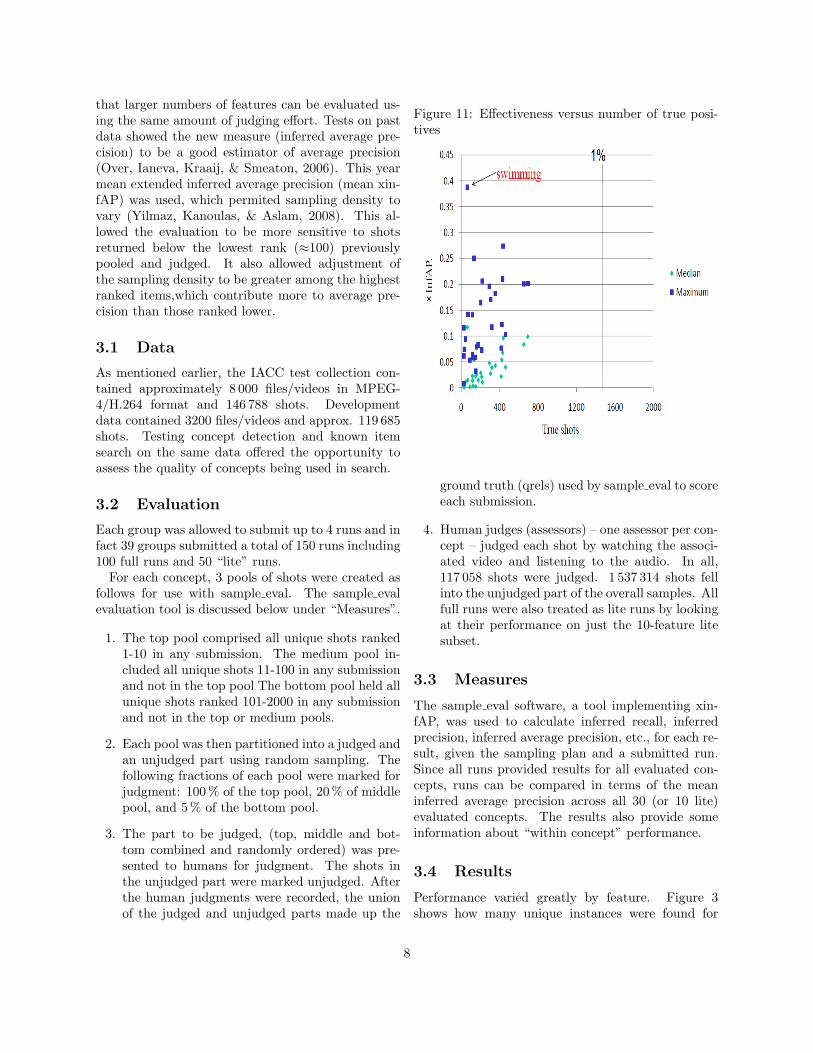
Figure 11: Effectiveness versus number of true posi-tives
ground truth (qrels) used by sample eval to scoreeach submission.
4. Human judges (assessors) – one assessor per con-cept – judged each shot by watching the associ-ated video and listening to the audio. In all,117 058 shots were judged. 1 537 314 shots fellinto the unjudged part of the overall samples. Allfull runs were also treated as lite runs by lookingat their performance on just the 10-feature litesubset.
3.3 Measures
The sample eval software, a tool implementing xin-fAP, was used to calculate inferred recall, inferredprecision, inferred average precision, etc., for each re-sult, given the sampling plan and a submitted run.Since all runs provided results for all evaluated con-cepts, runs can be compared in terms of the meaninferred average precision across all 30 (or 10 lite)evaluated concepts. The results also provide someinformation about “within concept” performance.
3.4 Results
Performance varied greatly by feature. Figure 3shows how many unique instances were found for
8
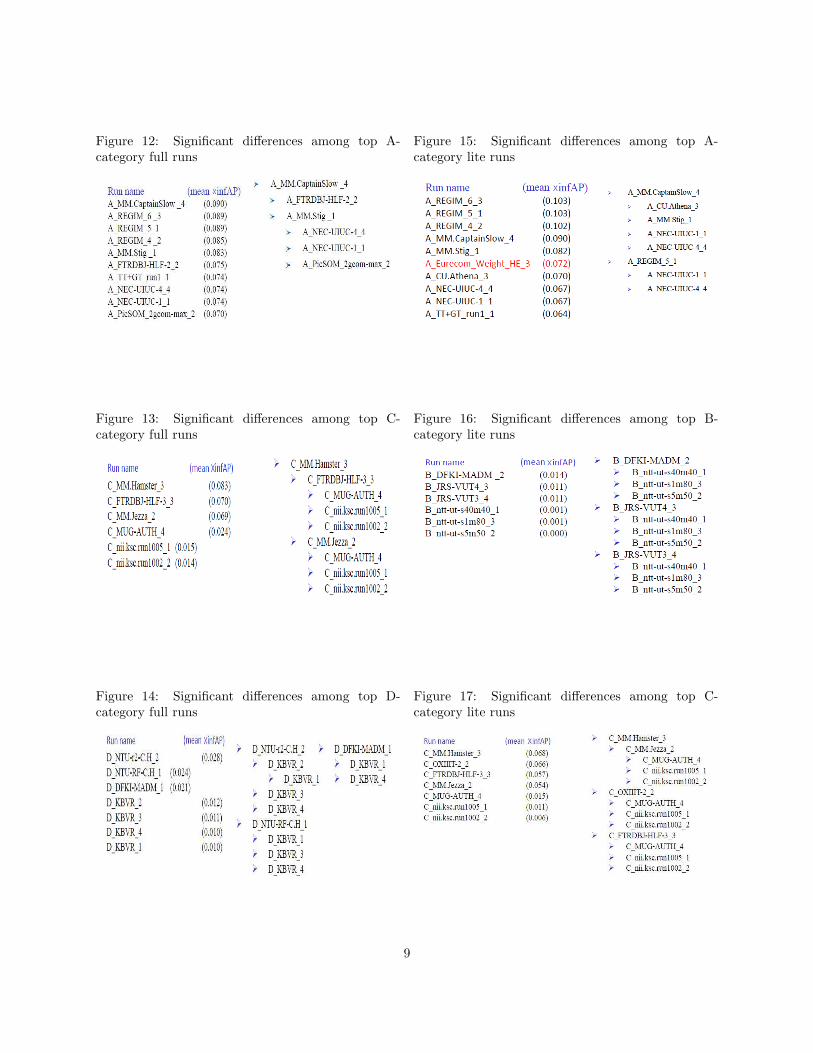
Figure 12: Significant differences among top A-category full runs
Figure 13: Significant differences among top C-category full runs
Figure 14: Significant differences among top D-category full runs
Figure 15: Significant differences among top A-category lite runs
Figure 16: Significant differences among top B-category lite runs
Figure 17: Significant differences among top C-category lite runs
9
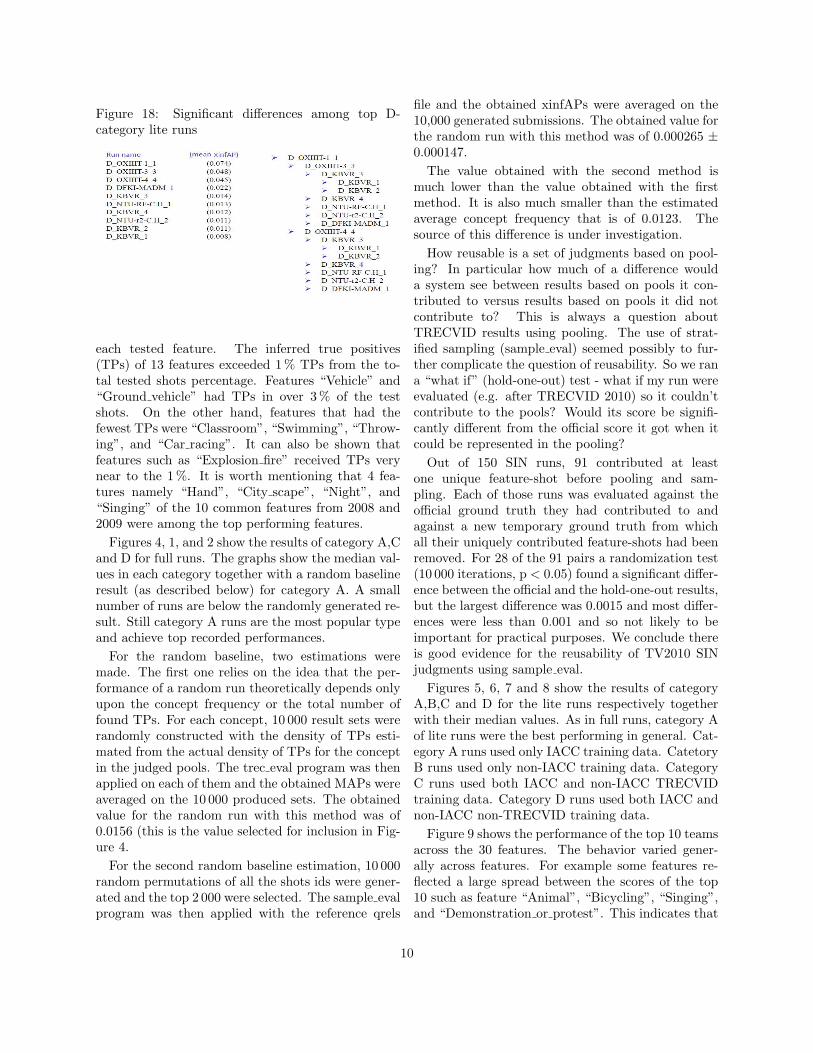
Figure 18: Significant differences among top D-category lite runs
each tested feature. The inferred true positives(TPs) of 13 features exceeded 1% TPs from the to-tal tested shots percentage. Features “Vehicle” and“Ground vehicle” had TPs in over 3 % of the testshots. On the other hand, features that had thefewest TPs were “Classroom”, “Swimming”, “Throw-ing”, and “Car racing”. It can also be shown thatfeatures such as “Explosion fire” received TPs verynear to the 1 %. It is worth mentioning that 4 fea-tures namely “Hand”, “City scape”, “Night”, and“Singing” of the 10 common features from 2008 and2009 were among the top performing features.
Figures 4, 1, and 2 show the results of category A,Cand D for full runs. The graphs show the median val-ues in each category together with a random baselineresult (as described below) for category A. A smallnumber of runs are below the randomly generated re-sult. Still category A runs are the most popular typeand achieve top recorded performances.
For the random baseline, two estimations weremade. The first one relies on the idea that the per-formance of a random run theoretically depends onlyupon the concept frequency or the total number offound TPs. For each concept, 10 000 result sets wererandomly constructed with the density of TPs esti-mated from the actual density of TPs for the conceptin the judged pools. The trec eval program was thenapplied on each of them and the obtained MAPs wereaveraged on the 10 000 produced sets. The obtainedvalue for the random run with this method was of0.0156 (this is the value selected for inclusion in Fig-ure 4.
For the second random baseline estimation, 10 000random permutations of all the shots ids were gener-ated and the top 2 000 were selected. The sample evalprogram was then applied with the reference qrels
file and the obtained xinfAPs were averaged on the10,000 generated submissions. The obtained value forthe random run with this method was of 0.000265 ±0.000147.
The value obtained with the second method ismuch lower than the value obtained with the firstmethod. It is also much smaller than the estimatedaverage concept frequency that is of 0.0123. Thesource of this difference is under investigation.
How reusable is a set of judgments based on pool-ing? In particular how much of a difference woulda system see between results based on pools it con-tributed to versus results based on pools it did notcontribute to? This is always a question aboutTRECVID results using pooling. The use of strat-ified sampling (sample eval) seemed possibly to fur-ther complicate the question of reusability. So we rana “what if” (hold-one-out) test - what if my run wereevaluated (e.g. after TRECVID 2010) so it couldn’tcontribute to the pools? Would its score be signifi-cantly different from the official score it got when itcould be represented in the pooling?
Out of 150 SIN runs, 91 contributed at leastone unique feature-shot before pooling and sam-pling. Each of those runs was evaluated against theofficial ground truth they had contributed to andagainst a new temporary ground truth from whichall their uniquely contributed feature-shots had beenremoved. For 28 of the 91 pairs a randomization test(10 000 iterations, p < 0.05) found a significant differ-ence between the official and the hold-one-out results,but the largest difference was 0.0015 and most differ-ences were less than 0.001 and so not likely to beimportant for practical purposes. We conclude thereis good evidence for the reusability of TV2010 SINjudgments using sample eval.
Figures 5, 6, 7 and 8 show the results of categoryA,B,C and D for the lite runs respectively togetherwith their median values. As in full runs, category Aof lite runs were the best performing in general. Cat-egory A runs used only IACC training data. CatetoryB runs used only non-IACC training data. CategoryC runs used both IACC and non-IACC TRECVIDtraining data. Category D runs used both IACC andnon-IACC non-TRECVID training data.
Figure 9 shows the performance of the top 10 teamsacross the 30 features. The behavior varied gener-ally across features. For example some features re-flected a large spread between the scores of the top10 such as feature “Animal”, “Bicycling”, “Singing”,and “Demonstration or protest”. This indicates that
10
there is still room for further improvement, whileother features had a tight spread of scores amongthe top 10 such as feature “Sitting down”,“Dancing”,“Flowers”, and “Running”. In general, the medianscores ranged between 0.001 (feature “Sitting down”)and 0.117 (feature Swimming). As a general observa-tion, feature “Sitting down” had the minimum spreadacross the top 10 and at the same time the minimummedian score across all systems, which demonstrateshow difficult this feature is for the systems to detect.Also, it can be shown on the graph that the mediancurve was above the random baseline run generatedby NIST except for 8 features, for which the randomand median values were very close and in general werefrom the low performance features.
A similar graph for the 10 common features isFigure 10 which shows the performance of the top10 teams for both the lite and full runs. Featuresthat reflected a large spread between the scores ofthe top 10 are “Hand”, “Classroom”, “Demonstra-tion or protest”, and “singing”. While the lowestperforming feature was “Bus”. As a general obser-vation, the top 10 performance for the majority ofthe common features were less than the top 10 scoresfor 2009. This was probably due to the high varia-tion between this year’s data and the last 3 years’.More research is needed toward developing systemsthat generalize well among different datasets.
Figure 11 shows the relation between the xinfAPand number of true shots detected by systems interms of their median and maximum values for the30 features. A positive correlation between number ofTPs and accuracy can be in general concluded. Thereare a few features (e.g “Swimming”) where relativelysmall number of TPs produced high xinfAP scores.It can also be shown that the maximum TPs for afeature didn’t exceed ≈ 0.5 % of the number of testshots.
To test if there were significant differences betweenthe systems performance, we applied a randomiza-tion test (Manly, 1997) on the top 10 runs for eachrun type and training category as shown in Figures12 through 14 for full runs and Figures 15 through 18for lite runs. The left half indicates the sorted top 10runs, while the right half indicates the order by whichthe runs are significant according to the randomiza-tion test. Different levels of indentation signifies asignificant difference according to the test. Runs atthe same level of indentation are indistinguishable interms of the test. In all tests except one (Figure 15)the top ranked run was significantly better than other
Figure 19: Mean inverted rank versus mean elapsedtime for automatic runs
runs.Based on site reports, some general observations
on approaches can be made. Experiments involvedfocusing on robustness, merging many different rep-resentations, use of spatial pyramids, sophisticatedfusion strategies, efficiency improvements (e.g. use ofgraphics processing units), analysis of multi keyframeper shot, audio analysis, using temporal context in-formation and less highlighting on motion informa-tion, metadata or ASR. Some usage of training datafrom YouTube were utilized. As in previous years,most runs were in training category A (i.e less ex-ternal data). The most common features used wereScale-invariant feature transforms (SIFT), color, andedge histograms and their variations. Audio featureswere mainly based on mel-frequency cepstral coeffi-cients (MFCC). Still the most common classifier usedis support vector machines (SVM). Readers shouldsee the notebook papers posted on the TRECVIDwebsite (trecvid.nist.gov) for details about each par-ticipant’s experiments and results.
4 Known-item search
The known-item search task models the situation inwhich someone knows of a video, has seen it before,believes it is contained in a collection, but doesn’t
11
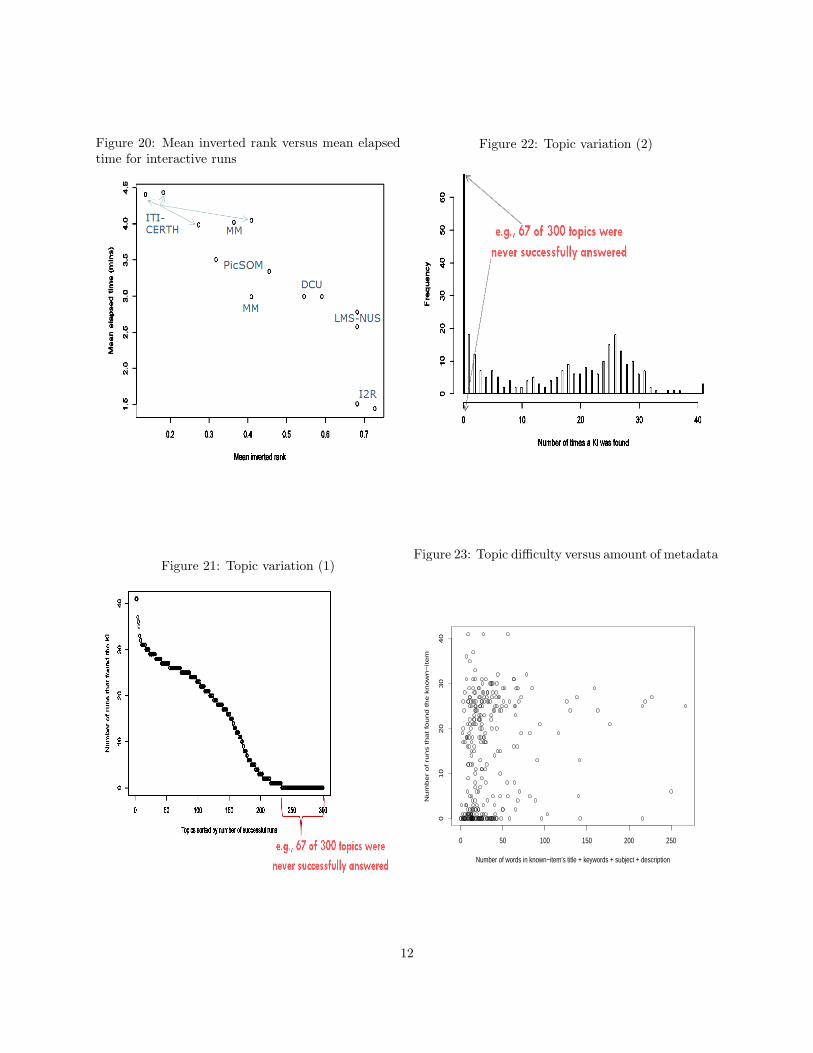
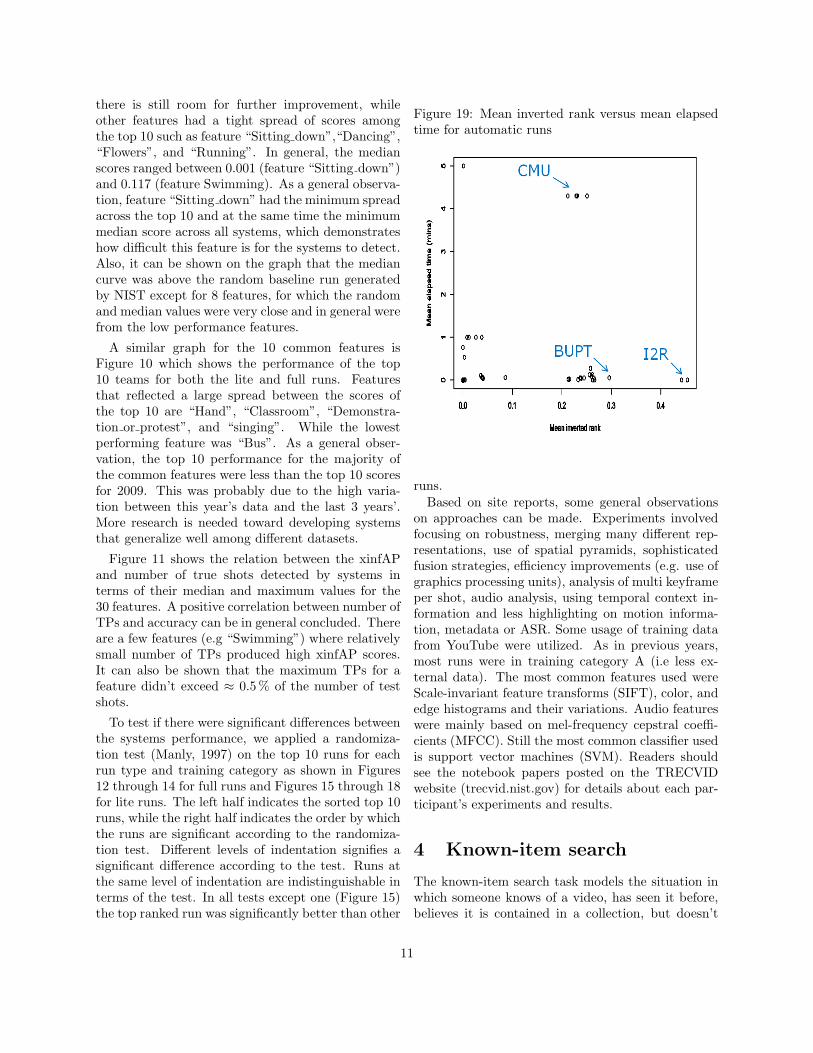
Figure 20: Mean inverted rank versus mean elapsedtime for interactive runs
Figure 21: Topic variation (1)
Figure 22: Topic variation (2)
Figure 23: Topic difficulty versus amount of metadata
0 50 100 150 200 250
01
02
03
04
0
Number of words in known−item’s title + keywords + subject + description
Nu
mb
er
of ru
ns th
at fo
un
d th
e k
now
n−
ite
m
12
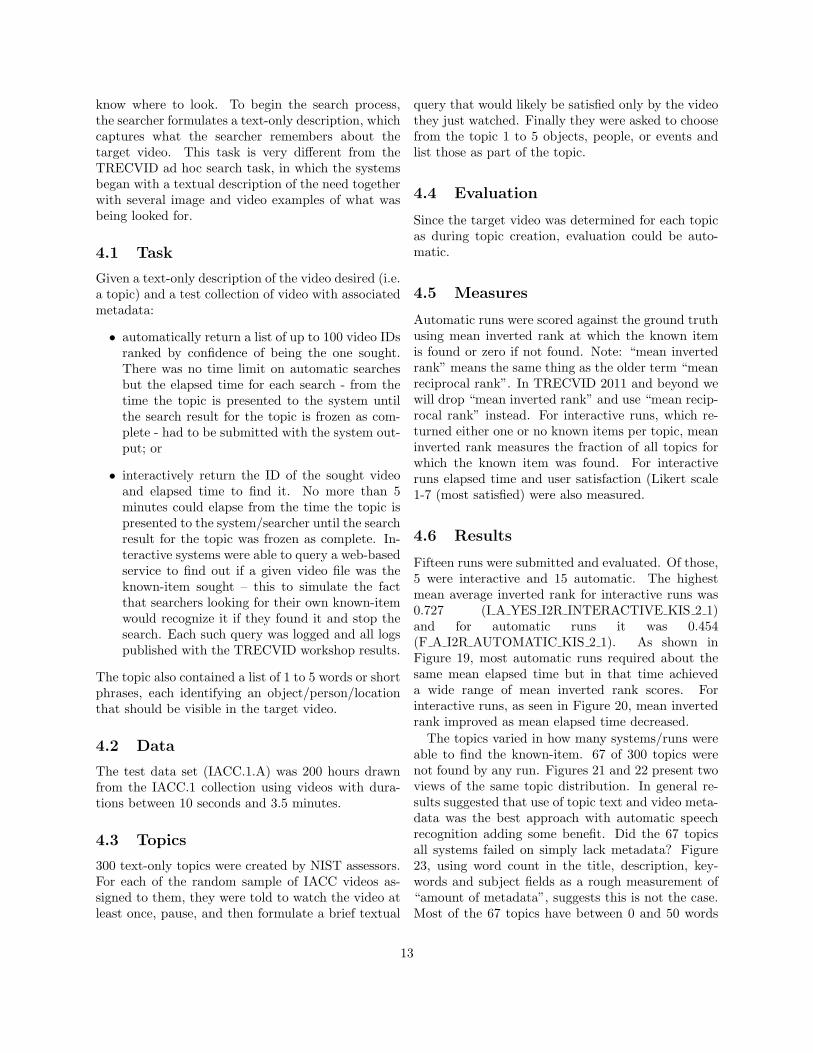
know where to look. To begin the search process,the searcher formulates a text-only description, whichcaptures what the searcher remembers about thetarget video. This task is very different from theTRECVID ad hoc search task, in which the systemsbegan with a textual description of the need togetherwith several image and video examples of what wasbeing looked for.
4.1 Task
Given a text-only description of the video desired (i.e.a topic) and a test collection of video with associatedmetadata:
• automatically return a list of up to 100 video IDsranked by confidence of being the one sought.There was no time limit on automatic searchesbut the elapsed time for each search - from thetime the topic is presented to the system untilthe search result for the topic is frozen as com-plete - had to be submitted with the system out-put; or
• interactively return the ID of the sought videoand elapsed time to find it. No more than 5minutes could elapse from the time the topic ispresented to the system/searcher until the searchresult for the topic was frozen as complete. In-teractive systems were able to query a web-basedservice to find out if a given video file was theknown-item sought – this to simulate the factthat searchers looking for their own known-itemwould recognize it if they found it and stop thesearch. Each such query was logged and all logspublished with the TRECVID workshop results.
The topic also contained a list of 1 to 5 words or shortphrases, each identifying an object/person/locationthat should be visible in the target video.
4.2 Data
The test data set (IACC.1.A) was 200 hours drawnfrom the IACC.1 collection using videos with dura-tions between 10 seconds and 3.5 minutes.
4.3 Topics
300 text-only topics were created by NIST assessors.For each of the random sample of IACC videos as-signed to them, they were told to watch the video atleast once, pause, and then formulate a brief textual
query that would likely be satisfied only by the videothey just watched. Finally they were asked to choosefrom the topic 1 to 5 objects, people, or events andlist those as part of the topic.
4.4 Evaluation
Since the target video was determined for each topicas during topic creation, evaluation could be auto-matic.
4.5 Measures
Automatic runs were scored against the ground truthusing mean inverted rank at which the known itemis found or zero if not found. Note: “mean invertedrank” means the same thing as the older term “meanreciprocal rank”. In TRECVID 2011 and beyond wewill drop “mean inverted rank” and use “mean recip-rocal rank” instead. For interactive runs, which re-turned either one or no known items per topic, meaninverted rank measures the fraction of all topics forwhich the known item was found. For interactiveruns elapsed time and user satisfaction (Likert scale1-7 (most satisfied) were also measured.
4.6 Results
Fifteen runs were submitted and evaluated. Of those,5 were interactive and 15 automatic. The highestmean average inverted rank for interactive runs was0.727 (I A YES I2R INTERACTIVE KIS 2 1)and for automatic runs it was 0.454(F A I2R AUTOMATIC KIS 2 1). As shown inFigure 19, most automatic runs required about thesame mean elapsed time but in that time achieveda wide range of mean inverted rank scores. Forinteractive runs, as seen in Figure 20, mean invertedrank improved as mean elapsed time decreased.
The topics varied in how many systems/runs wereable to find the known-item. 67 of 300 topics werenot found by any run. Figures 21 and 22 present twoviews of the same topic distribution. In general re-sults suggested that use of topic text and video meta-data was the best approach with automatic speechrecognition adding some benefit. Did the 67 topicsall systems failed on simply lack metadata? Figure23, using word count in the title, description, key-words and subject fields as a rough measurement of“amount of metadata”, suggests this is not the case.Most of the 67 topics have between 0 and 50 words
13

Figure 24: Average precision for automatic runs bytopic/type
of metadata, but so do many topics which multiplesystems handled successfully.
To investigate if a topic had actually two duplicatetrue answers we conducted a small experiment werewe counted all the submitted pairs of [topic, video] byall runs. Then we checked manually the sorted list ofcounts from the highest count for the pairs that doesnot match the ground truth. In theory, if many runsagree on a specific video for a topic then there is abig chance that it could be a duplicate for the trueknown item video in the ground truth. Our resultsrevealed a duplicate video for topic 92 and 250. Also,for topic 250 (John Kerry and text about him) manyruns returned videos very similar to the true knownitem video which may indicate that either this topicwas not a good candidate or the language used todescribe the topic needed to be more specific and lessgeneral.
For details about approaches and results the readeris referred to the notebook papers on the TRECVIDwebsite: www-nlpir.nist.gov/projects/tvpubs/
tv.pubs.org.html.
5 Instance search pilot
An important need in many situations involvingvideo collections (archive video search/reuse, per-
Figure 25: Average precision for interactive runs bytopic/topic
Figure 26: Example character targets
14
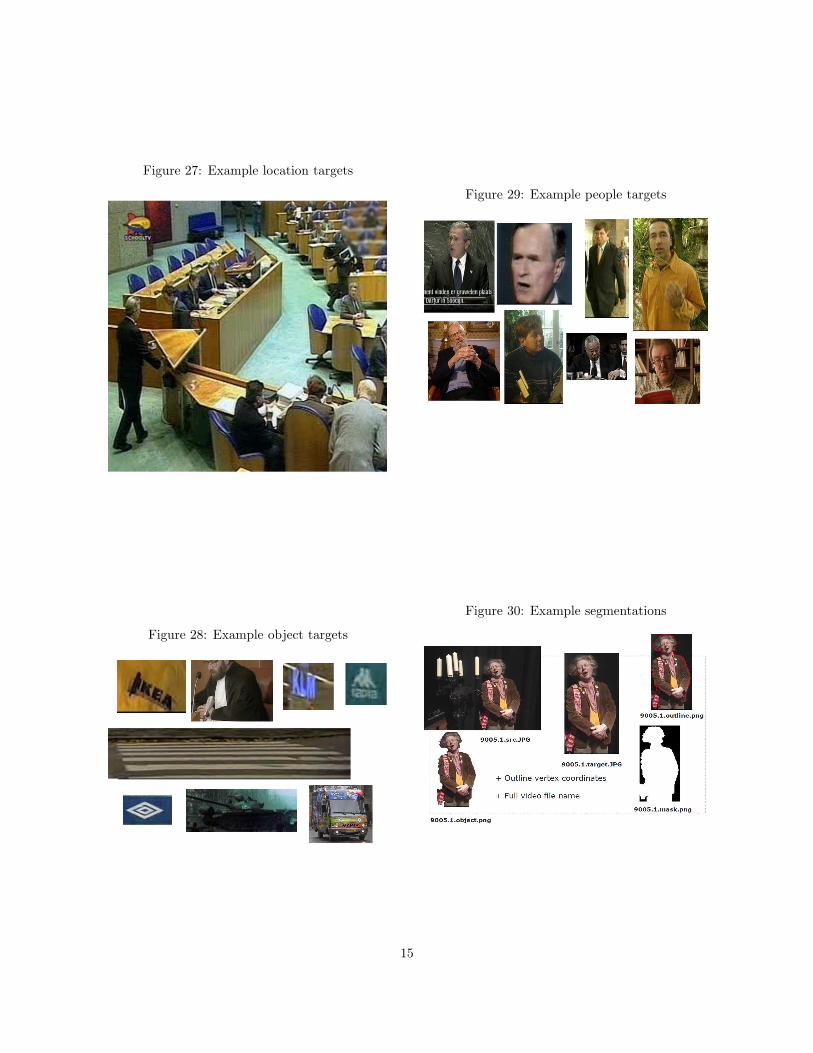
Figure 27: Example location targets
Figure 28: Example object targets
Figure 29: Example people targets
Figure 30: Example segmentations
15

sonal video organization/search, surveillance, law en-forcement, protection of brand/logo use) is to findmore video segments of a certain specific person, ob-ject, or place, given one or more visual examples ofthe specific item.
In 2010 this was a pilot task — evaluated by NISTbut intended mainly to explore task definition andevaluation issues using data and an evaluation frame-work in hand. The task was a first approximation tothe desired full task using a smaller number of top-ics, a simpler identification of the target entity, andless accuracy in locating the instance than would bedesirable in a full evaluation of the task.
5.1 Task
The instance search task for the systems was as fol-lows. Given a collection of test videos, a master shotreference, and a collection of queries that delimit aperson, object, or place entity in some example video,locate for each query the 1000 shots most likely tocontain a recognizable instance of the entity. Eachquery consisted of a set of...
• 5 or so example frame images drawn at intervalsfrom a video containing the item of interest. Foreach frame image:
– the rectangular region within the frame im-age, containing the item of interest
– a binary mask of an inner region of interestwithin the rectangle
– the inner region against a gray background
– the frame image with the inner region re-gion outlined in red
– a list of vertices for the inner region region
• the video from which the images were selected
• an indication of the target type taken from thisset of strings (PERSON, CHARACTER, LOCA-TION, OBJECT)
5.2 Data
Test data: Sound and Vision data from TRECVID2007-2009 (tv9.sv.test).
5.3 Topics
In a first approximation to the full task, most querieswere created by NIST and targeted actors that ap-peared as themselves or as characters in Sound and
Vision programs – in different clothes, costumes, set-tings, etc. In a few cases objects (including logos)and locations were targeted. Figures 26-29 show im-ages of all search targets from topics. Figure 30 showsthe various segmentations of an example target imageprovided to systems as part of the topic.
As this was a pilot task, participants were en-couraged to help by examining the test data andcontributing up to 5 topics per team with non-person/character targets. Several teams did so. SeeAppendix A for a listing of the topics.
5.4 Evaluation, Measures
This pilot version of the task was treated as a formof search and evaluated accordingly with average pre-cision for each query in each run and per-run meanaverage precision over all queries. While speed andlocation accuracy were also definitely of interest here,of these two, only speed was measured in the pilot.
For each topic, the runs were pooled and presentedto the human judges in the order the shots wereranked by the systems. The depth to which eachtopic’s pool was judged depended in part on howmany true positives were found as the depth of theshots being judged increased. See Table 3 for detailson the pooling and judging.
5.5 Results
15 research teams submitted runs. Although not partof the official task design, NIST allowed the ITI-CERTH team to run an interactive version of the taskto provide additional context for the results. The tophalf of the automatic runs had mean average precision(MAP) scores ranging from 0.01 to 0.033. The twoITI-CERTH interactive runs achieved much higherMAP scores: 0.524 and 0.534.
There was considerable difference in performancefrom topic to topic. Figure 24 depicts the distributionof scores by topic for the people, character, and objecttypes. Figure 25 does the same for the much smallernumber of interactive runs.
During the TRECVID 2010 Workshop there wasa panel discussion out of which came the sugges-tion that if we continue to use small targets, thenwe should use better quality video.
Results this year were of a very preliminary nature.For details about approaches and results the readeris referred to the notebook papers on the TRECVIDwebsite: www-nlpir.nist.gov/projects/tvpubs/
tv.pubs.org.html.
16
6 Multimedia event detectionpilot
The 2010 Multimedia Event Detection (MED) pi-lot evaluation was the first evaluation of technologiesthat search multimedia video clips for events of inter-est to a user. An event for MED:
• is a complex activity occurring at a specific placeand time;
• involves people interacting with other peopleand/or objects;
• consists of a number of human actions, processes,and activities that are loosely or tightly orga-nized and that have significant temporal and se-mantic relationships to the overarching activity;
• is directly observable.
A user searching for events in multimedia mate-rial may be interested in a wide variety of potentialevents. Since it is an intractable task to build specialpurpose detectors for each event a priori, a technol-ogy is needed that can take as input a human-centricdefinition of an event that developers (and eventu-ally systems) can use to build a search query. Theevents for MED were defined via an event kit whichconsisted of:
• An event name which is an mnemonic title forthe event.
• An event definition which is a textual definitionof the event.
• An evidential description which is a textual list-ing of the attributes that are indicative of anevent instance. The evidential description pro-vides a notion of some potential types of visualand acoustic evidence indicating the event’s ex-istence but it is not an exhaustive list nor is itto be interpreted as required evidence.
• A set of illustrative video examples each contain-ing an instance of the event. The examples areillustrative in the sense they help form the defini-tion of the event but they do not demonstrate allthe inherent variability or potential realizations.
The 2010 MED evaluation was a pilot for two mainreasons. First, only three events, Assembling a Shel-ter, Batting in a run, and Making a cake, were used
for the evaluation. Future evaluations will involveten events and new events will be tested each year.Second, the data resources were small on the orderof 100 hours as opposed to 1000s of hours for futureevaluations.
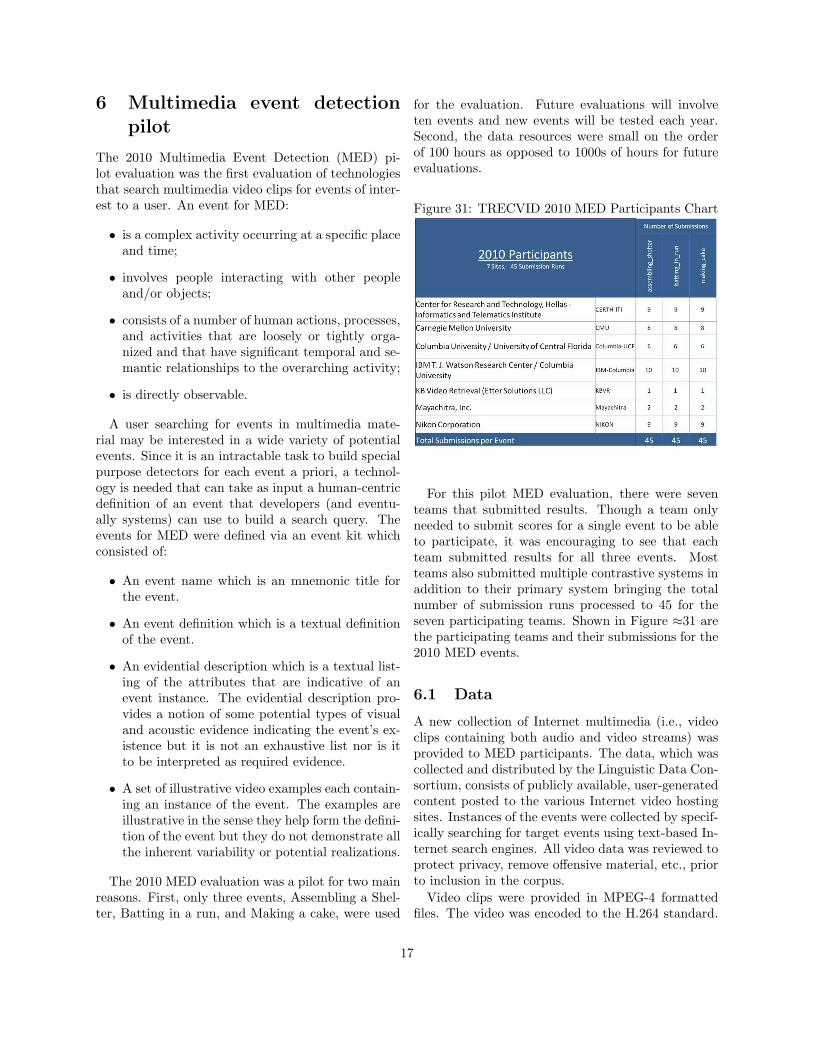
Figure 31: TRECVID 2010 MED Participants Chart
For this pilot MED evaluation, there were seventeams that submitted results. Though a team onlyneeded to submit scores for a single event to be ableto participate, it was encouraging to see that eachteam submitted results for all three events. Mostteams also submitted multiple contrastive systems inaddition to their primary system bringing the totalnumber of submission runs processed to 45 for theseven participating teams. Shown in Figure ≈31 arethe participating teams and their submissions for the2010 MED events.
6.1 Data
A new collection of Internet multimedia (i.e., videoclips containing both audio and video streams) wasprovided to MED participants. The data, which wascollected and distributed by the Linguistic Data Con-sortium, consists of publicly available, user-generatedcontent posted to the various Internet video hostingsites. Instances of the events were collected by specif-ically searching for target events using text-based In-ternet search engines. All video data was reviewed toprotect privacy, remove offensive material, etc., priorto inclusion in the corpus.
Video clips were provided in MPEG-4 formattedfiles. The video was encoded to the H.264 standard.
17
The audio was encoded using MPEG-4’s AdvancedAudio Coding (AAC) standard.
The video data collection was divided into two datasets:
• Development data consisted of 1746 total clips(c. 56 hours). The development data set in-cluded nominally 50 instances of each of thethree MED events and the rest of the clips werenot on any of the three MED events.
• Evaluation data consisted of 1742 total clips (c.59 hours). The evaluation data set included nor-mally 50 instances per event.
6.2 Evaluation
Sites submitted system outputs for any combinationof the three events. Outputs included a detectionscore which expresses the strength of evidence sup-porting the existence of the event and detection de-cision (yes/no) for each event observation.
Submission performance was computed using theFramework for Detection Evaluation (F4DE) toolkit.Groups were required to submit a primary run, whichwas the run they expect to be their best perform-ing system and optionally allowed to submit multipleruns with contrastive conditions.
6.3 Measures
Since detection system performance is a tradeoff be-tween probability of miss and false alarms, this taskused the Normalized Detection Cost (NDC) mea-sure for evaluating system performance. NDC is aweighted linear combination of the system’s MissedDetection Probability and False Alarm Probability.NDC is defined in terms of the system (S) and a par-ticular event (E) as follows:
PMiss = Nmiss(S,E)NT arget(E)
PFalseAlarm = NF alseAlarm(S,E)NNonT arget(E)
NDC(S,E) =CostMiss×Nmiss(S,E)+CostF alseAlarm×NF alseAlarm(S,E)
MINIMUM(CostMiss∗PT arget,CostF alseAlarm∗(1−PT arget))
Where the event detection constants were assignedthese values: CostMiss = 80, CostFA = 1 andPTarget = 0.001.
A perfect NDC score is 0. NDC is scaled so thatan NDC of 1.0 would be the cost of a system with no
output (no false alarms and all misses). NDC mayexceed 1.0.
Using the submitted decision scores allowed us tocompute Decision Error Tradeoff (DET) curves forthe systems. Participants were provided with a graphof the DET curve plotting PMissvs.PFalseAlarm foreach event their system participated in.
6.4 Results
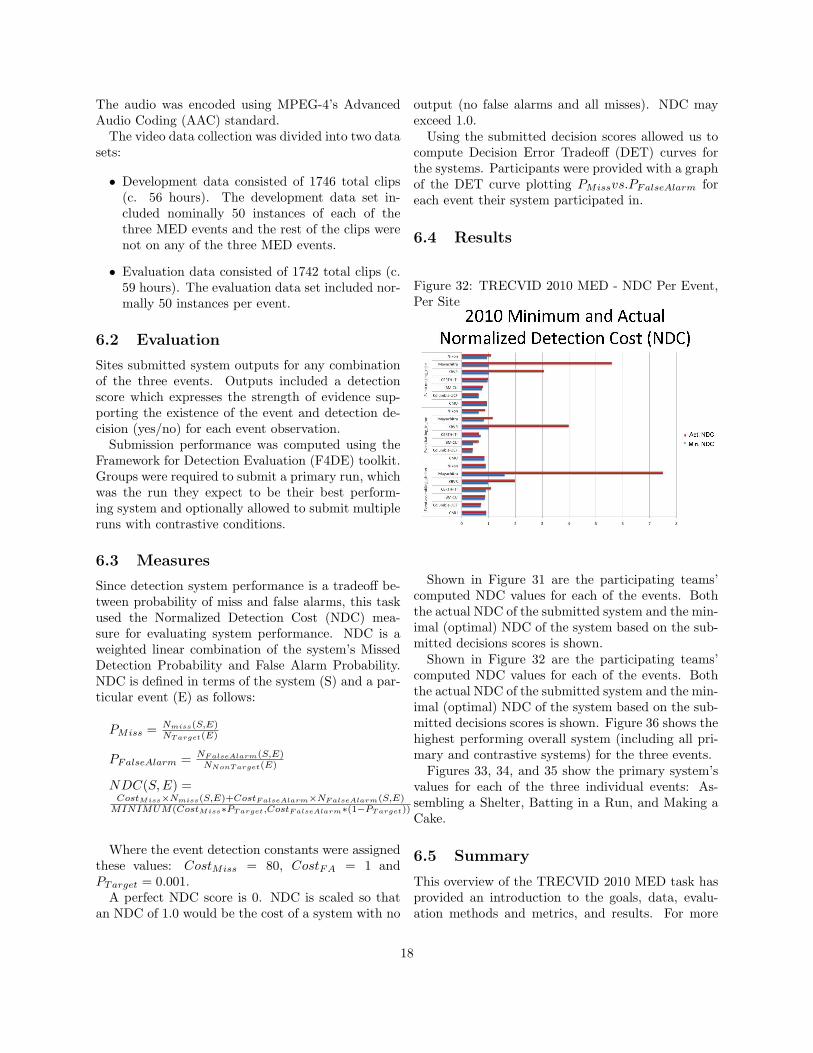
Figure 32: TRECVID 2010 MED - NDC Per Event,Per Site
Shown in Figure 31 are the participating teams’computed NDC values for each of the events. Boththe actual NDC of the submitted system and the min-imal (optimal) NDC of the system based on the sub-mitted decisions scores is shown.
Shown in Figure 32 are the participating teams’computed NDC values for each of the events. Boththe actual NDC of the submitted system and the min-imal (optimal) NDC of the system based on the sub-mitted decisions scores is shown. Figure 36 shows thehighest performing overall system (including all pri-mary and contrastive systems) for the three events.
Figures 33, 34, and 35 show the primary system’svalues for each of the three individual events: As-sembling a Shelter, Batting in a Run, and Making aCake.
6.5 Summary
This overview of the TRECVID 2010 MED task hasprovided an introduction to the goals, data, evalu-ation methods and metrics, and results. For more
18

Figure 33: TRECVID 2010 MED - Each Team’s Pri-mary System for “Assembling a Shelter” Event
Figure 34: TRECVID 2010 MED - Each Team’s Pri-mary System for “Batting in a Run” Event
Figure 35: TRECVID 2010 MED - Each Team’s Pri-mary System for “Making a Cake” Event
Figure 36: TRECVID 2010 MED - Best Systems foreach Event
19

in-depth information, or detailed approaches and re-sults of individual participants, the reader is re-ferred to the notebook papers on the TRECVIDwebsite: www-nlpir.nist.gov/projects/tvpubs/
tv.pubs.org.html.
7 Copy detection
As used here, a copy is a segment of video de-rived from another video, usually by means of var-ious transformations such as addition, deletion, mod-ification (of aspect, color, contrast, encoding, ...),camcording, etc. Detecting copies is important forcopyright control, business intelligence, advertise-ment tracking, law enforcement investigations, etc.Content-based copy detection offers an alternative towatermarking.
As the audio plays an important role in detectingcopied videos, this year systems were required to sub-mit runs for only one required query type task (video+ audio queries). Systems had the option to individu-ally evaluate video-only and audio-only query types.Two application profiles were required to be simu-lated. One that required a balanced cost for missesand false alarms and one that required no false alarms(thus very high cost for false alarms). Systems wererequired to submit a decision score threshold believedto correspond to the best performance for the run.
The required system task was as follows: given atest collection of videos and a set of 11 256 queries,determine for each query the place, if any, that somepart of the query occurs, with possible transforma-tions, in the test collection. Two thirds of the queriescontained copies.
A set of 8 possible video transformations was se-lected to reflect actually occurring video transforma-tions and applied to each of 201 untransformed (base)queries using tools developed by IMEDIA to includesome randomization at various decision points in theconstruction of the query set. In total 1608 video-onlyqueries were constructed. For each query, the toolstook a segment from the test collection, optionallytransformed it, embedded it in some video segmentwhich did not occur in the test collection, and thenfinally applied one or more transformations to the en-tire query segment. Some queries contained no testsegment; others were composed entirely of the testsegment. Video transformations included camcordingsimulation, picture-in-picture, insertion of patterns,reencoding, change of gamma, decreasing the quality,and post production alterations. Video transforma-
tions used were documented in detail as part of theTRECVID Guidelines.
1407 audio-only queries were generated by Dan El-lis at Columbia University along the same lines as thevideo-only queries: an audio-only version of the set of201 base queries was transformed by seven techniquesthat were intended to be typical of those that wouldoccur in real reuse scenarios: (1) bandwidth limita-tion (2) other coding-related distortion (e.g. subbandquantization noise) (3) variable mixing with unre-lated audio content.
A script to construct 11 256 audio + video querieswas provided by NIST. These queries comprised allthe combinations of transformed audio(7) and trans-formed video (8) from a given base audio+videoquery (201).
7.1 Data
The new Internet Archive video collection was used asa source for reference and non-reference videos. Thisyear’s testing and development videos (11 200 files) of400 hours and duration less than 4.1 min were used asa source from which the test query generation toolschose reference video. While the non-reference videocollection was selected from a set of 12 480 videos withtotal duration of 4000 hours and duration between10-30 min.
7.2 Evaluation
In total in 2010, 22 participant teams submitted 78runs for evaluation. 41 runs were submitted as bal-anced runs and 37 as no false alarms. Copy detectionsubmissions were evaluated separately for each trans-formation, according to:
• How many queries they find the reference datafor or correctly tell us there is none to find
• When a copy is detected, how accurately the runlocates the reference data in the test data.
• How much elapsed time is required for query pro-cessing
After creating the query set, it was found that 5base queries have to be dropped from evaluation be-cause there exist multiple answers for them in thereference set or because some were taken from origi-nal corrupted videos.
20
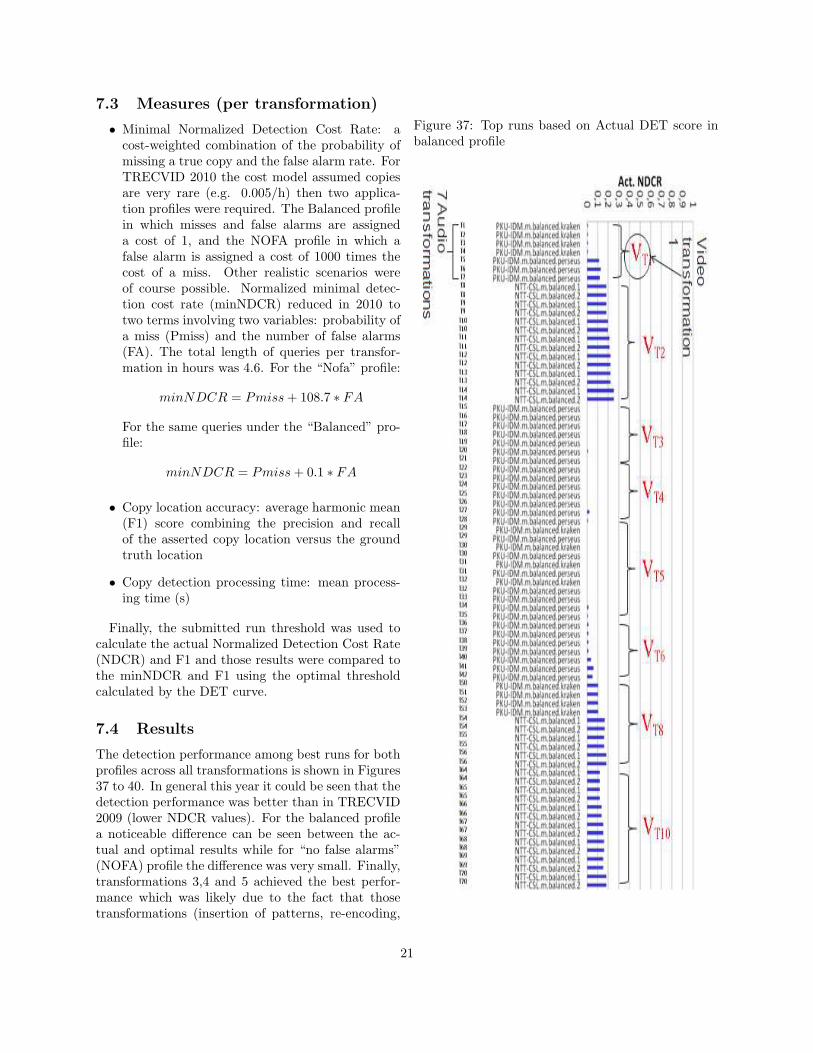
7.3 Measures (per transformation)
• Minimal Normalized Detection Cost Rate: acost-weighted combination of the probability ofmissing a true copy and the false alarm rate. ForTRECVID 2010 the cost model assumed copiesare very rare (e.g. 0.005/h) then two applica-tion profiles were required. The Balanced profilein which misses and false alarms are assigneda cost of 1, and the NOFA profile in which afalse alarm is assigned a cost of 1000 times thecost of a miss. Other realistic scenarios wereof course possible. Normalized minimal detec-tion cost rate (minNDCR) reduced in 2010 totwo terms involving two variables: probability ofa miss (Pmiss) and the number of false alarms(FA). The total length of queries per transfor-mation in hours was 4.6. For the “Nofa” profile:
minNDCR = Pmiss + 108.7 ∗ FA
For the same queries under the “Balanced” pro-file:
minNDCR = Pmiss + 0.1 ∗ FA
• Copy location accuracy: average harmonic mean(F1) score combining the precision and recallof the asserted copy location versus the groundtruth location
• Copy detection processing time: mean process-ing time (s)
Finally, the submitted run threshold was used tocalculate the actual Normalized Detection Cost Rate(NDCR) and F1 and those results were compared tothe minNDCR and F1 using the optimal thresholdcalculated by the DET curve.
7.4 Results
The detection performance among best runs for bothprofiles across all transformations is shown in Figures37 to 40. In general this year it could be seen that thedetection performance was better than in TRECVID2009 (lower NDCR values). For the balanced profilea noticeable difference can be seen between the ac-tual and optimal results while for “no false alarms”(NOFA) profile the difference was very small. Finally,transformations 3,4 and 5 achieved the best perfor-mance which was likely due to the fact that thosetransformations (insertion of patterns, re-encoding,
Figure 37: Top runs based on Actual DET score inbalanced profile
21
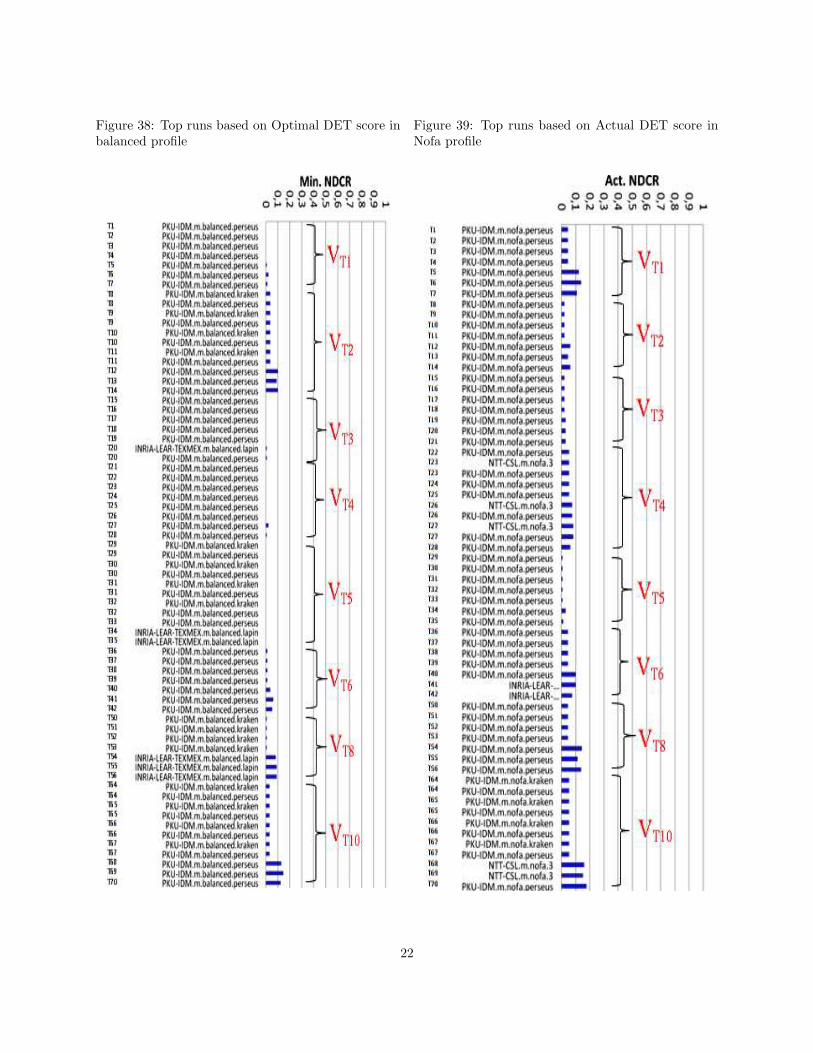
Figure 38: Top runs based on Optimal DET score inbalanced profile
Figure 39: Top runs based on Actual DET score inNofa profile
22
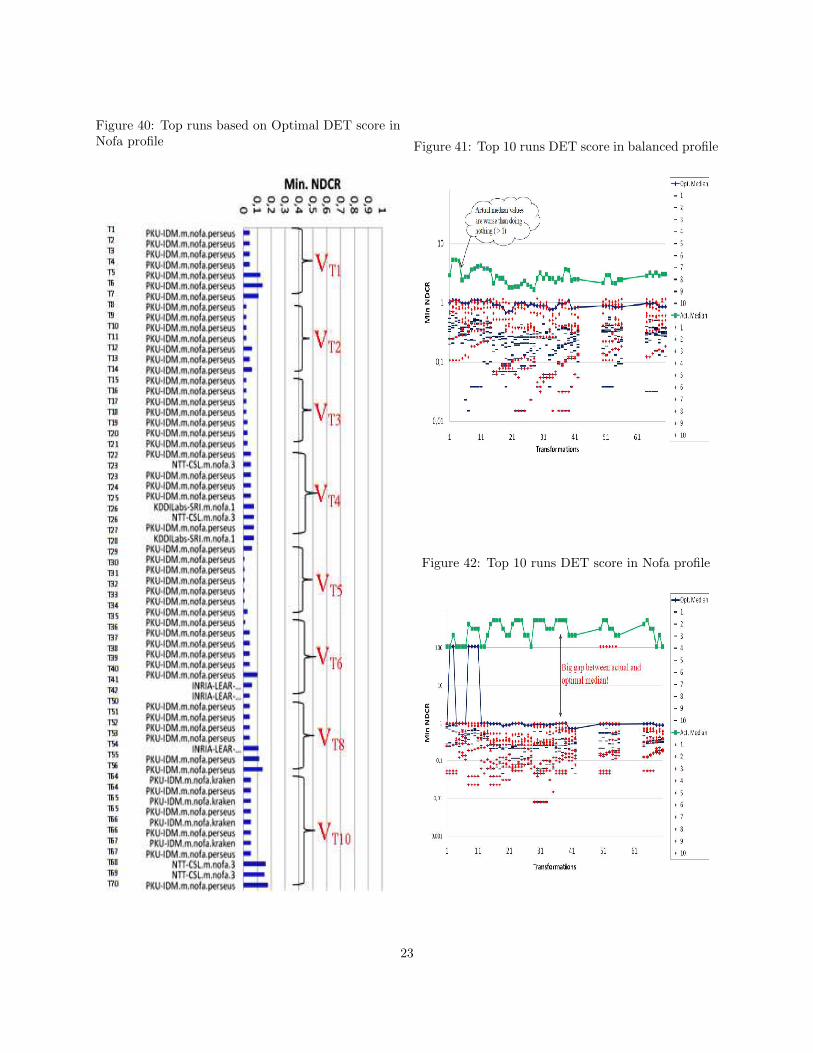
Figure 40: Top runs based on Optimal DET score inNofa profile Figure 41: Top 10 runs DET score in balanced profile
Figure 42: Top 10 runs DET score in Nofa profile
23

Figure 43: Top 10 runs localization in balanced pro-file
Figure 44: Top 10 runs localization in Nofa profile
Figure 45: Top 10 runs efficiency in both profiles
and change of gamma) are simpler than the otherswith combined transformations.
A comparison among the detection of the top 10runs only for both profiles is shown in Figures 41 and42. The gap between the actual median line and op-timal median line shows that there is still space formore system improvements. This gap in the Nofaprofile was much bigger compared to the balancedprofile. Although the top 10 runs achieved better re-sults than in TRECVID 2009, the actual and optimalmedians were worse than in 2009. A similar compar-ison based on the localization is shown in Figures 43and 44. The top 10 runs performed almost equally(and very good) in localization and better comparedto 2009 results. We notice that the optimal medianwas better than the actual median for most of thetransformations except few ones. In terms of effi-ciency, Figure 45 shows the top 10 processing timeperformance. Even though the best runs could de-tect copies in seconds, the majority of other systemswere still far from real-time detection.
The audio transformations 5, 6, and 7 are harderthan the other transformations as they include mix-ing with external speech. This effect is obvious inFigure 46 which compares only the best runs in bothprofiles based on actual and optimal values. The redcircles on the graph show the video transformationsthat were mixed with audio transformations 5, 6, and
24
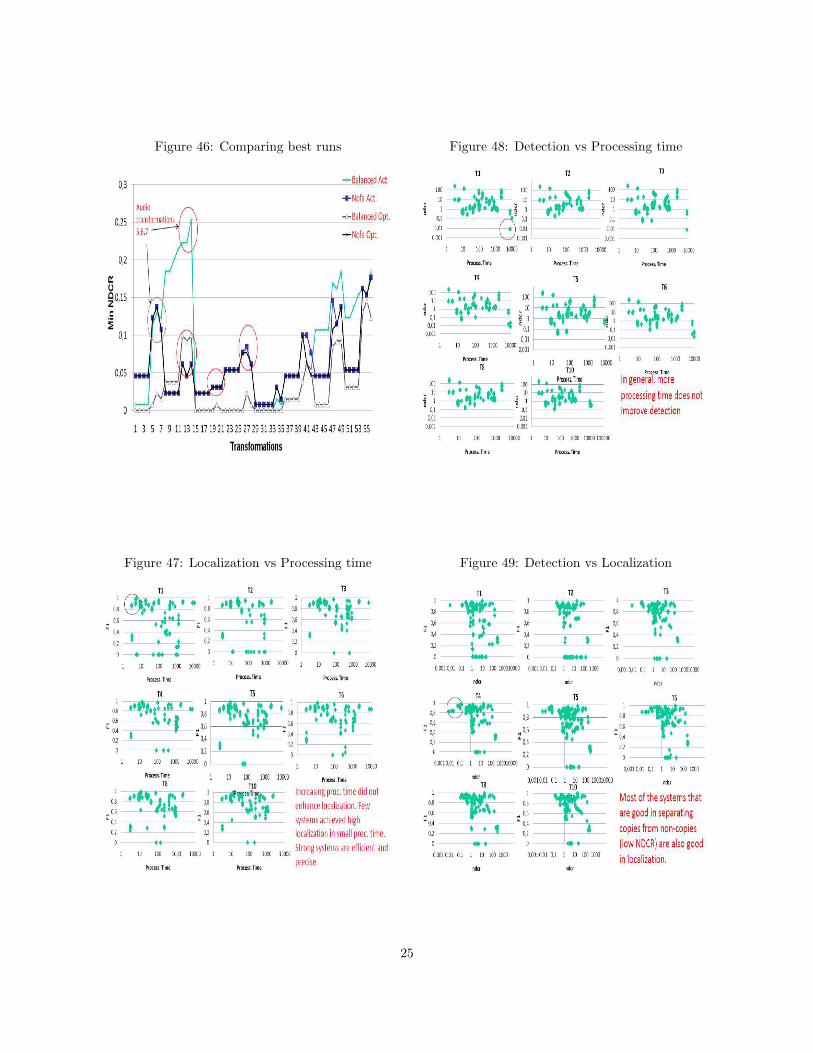
Figure 46: Comparing best runs
Figure 47: Localization vs Processing time
Figure 48: Detection vs Processing time
Figure 49: Detection vs Localization
25

7. In order to study the relation between the threemain measures we plotted each two for all trans-formations in Figures 47, 48, and 49. In general,few systems achieved high localization in short pro-cessing time, and most systems which increased theprocessing time did not gain much in both localiza-tion and detection. On the other hand, systems thatwere good in detection were also good in localization.These observations are true for both application pro-files.
Finally, we can draw some general observationsfrom this year’s task: Some systems (including first-timers) achieved very good results, while the taskwas difficult for many others. There was substan-tial room for improvement available for the balancedprofile indicated by difference between actual andoptimal results and difference across top runs. De-termining the optimal threshold was still a majorhurdle. Some systems achieved better NDCR scorescompared to 2009. However the median values werehigher as the 2010 dataset is very different. Mostof the systems were still far from real-time detec-tion while good detecting systems were also goodin localization. Complex transformations (audio orvideo) were indeed more difficult. Camcording wasa difficult transformation for some systems. Somesubmissions were using only the video modality (e.g.IBM, Nanjing University, National Taiwan NormalUniversity, Univ. of Chile, City University of HongKong) while audio modality helped to reduce thefalse alarm rate for picture-in-picture video transfor-mations. Most teams fused audio and video at thedecision level. Queries with short copied segmentstend to be missed. In regard to the used techniques,the most popular features used were SIFT, speededup robust features (SURF), direction-adaptive resid-ual transforms (DART), color, texture, and edge his-tograms for video and MFCC and weighted advancedstability feature (WASF) for audio features. Bagof visual words based techniques are the most pop-ular approaches reported. Readers should see thenotebook papers posted on the TRECVID website(trecvid.nist.gov) for details about each partici-pant’s experiments and results.
8 Surveillance event detection
The 2010 Surveillance Event Detection (SED) evalu-ation was the third evaluation focused on event de-tection in the surveillance video domain. The firstsuch evaluation was conducted as part of the 2008
Figure 50: TRECVID 2010 SED Participants Chart
TRECVID conference series (Over et al., 2008; Rose,Fiscus, Over, Garofolo, & Michel, 2009) followed thenext year as part of the 2009 TRECVID (Over et al.,2009). The goal of the evaluation track was to sup-port the development of technologies to detect vi-sual events (people engaged in particular activities)in a large collection of video data. It was designedto move computer vision technology towards robust-ness and scalability while increasing core competencyin detecting human activities within video. The ap-proach used was to employ real surveillance data, or-ders of magnitude larger than previous computer vi-sion tests, and multiple, synchronized camera views.
The 2009 evaluation supported the same two evalu-ation tasks as the 2008 evaluation, retrospective eventdetection and freestyle analysis, and the same set often events were used. In the 2010 evaluation, thelist of events was reduced to seven, as three eventswere removed from the list of evaluated upon events:ElevatorNoEntry, OpposingFlow, and TakePicture.While freestyle analysis was supported in 2010, nosite participated in the task.
Retrospective event detection was defined as fol-lows: given a set of video sequences, detect as manyevent observations as possible in each sequence. Forthis evaluation, a single-camera condition was used asthe required condition (multiple-camera input was al-lowed as a contrastive condition). Furthermore, sys-tems could perform multiple passes over the videoprior to outputting a list of putative events observa-tions (i.e. the task was retrospective).
In 2010, eleven teams participated in the retrospec-tive task. Figure 50 presents the list of participantsand the number of experiments they provided for each
26
event.The 2010 evaluation tasks used the same data that
was distributed in 2009, used in the following ways:
1. The 2008 Event Detection development and eval-uation data sets were both designated as devel-opment resources thus expanding the develop-ment material to 100 camera-hours.
2. The 2009 evaluation data set was reused for the2010 evaluation.
8.1 Event Annotation
For this evaluation, we define an event to be an ob-servable state change, either in the movement or in-teraction of people with other people or objects. Assuch, the evidence for an event depends directly onwhat can be seen in the video and does not requirehigher level inference. Annotation guidelines were de-veloped to express the requirements for each event.To determine if the observed action is a tagable event,a reasonable interpretation rule was used. The rulewas, “if according to a reasonable interpretation ofthe video the event must have occurred, then it is atagable event”. Importantly, the annotation guide-lines were designed to capture events that can bedetected by human observers, such that the groundtruth would contain observations that would be rele-vant to an operator/analyst. In what follows we dis-tinguish between event types (e.g. parcel passed fromone person to another), event instance (an example ofan event type that takes place at a specific time andplace), and an event observation (event instance cap-tured by a specific camera). Videos selected for theevaluation were annotated using the Video Perfor-mance Evaluation Resource (ViPER) tool by the Lin-guistic Data Consortium (LDC). Events were repre-sented in ViPER format using an annotation schemathat specified each event observation’s time interval.
8.2 Data
The development data consisted of the full 100 hoursdata set used for the 2008 Event Detection evaluation.The video for the evaluation corpus came from the45-hour Home Office Scientific Development Branch(HOSDB)’s Image Library for Intelligent DetectionSystems (iLIDS) Multi Camera Tracking Training(MCTTR) data set. The evaluation systems pro-cessed the full data set however systems were scoredon a four-day subset of recordings consisting of ap-proximately fifteen-hours of video data. Both data
sets were collected in the same busy airport environ-ment with the same video cameras. The entire videocorpus was distributed as MPEG-2 in de-interlaced,Phase Alternating Line (PAL) format (resolution 720x 576), 25 frames/s, either via hard drive or Internetdownload.
8.3 Evaluation
Sites submitted system outputs for the detectionof possible events. Outputs included the tempo-ral extent as well as a decision score (indicatingthe strength of evidence supporting the observation’sexistence) and detection decision (yes/no) for eachevent observation. Developers were advised to targeta low miss, high false alarm scenario via the scoringmetrics in order to maximize the number of eventobservations. A dry run was carried out for one dayof collection from the development data in order totest the system’s ability to generate compliant systemoutputs capable of being scored by the evaluation in-frastructure.
8.4 Measures of Performance
Since detection system performance is a tradeoff be-tween probability of miss vs. rate of false alarms,this task used the Normalized Detection Cost Rate(NDCR) measure for evaluating system performanceas described in the evaluation plan (Fiscus & Michel,2010).
NDCR is a weighted linear combination of the sys-tem’s Missed Detection Probability and False AlarmRate (measured per unit time).
NDCR = Pmiss + β × RFA
where:PMiss = Nmisses/NRef
RFA = NfalseAlarms/NCamHrs
β = CostF A
CostMiss×RT arget
here: CMiss = 10, CFA = 1 and RTarget =20/hour, therefore β = 0.05.
For this task NDCR is normalized to have the rangeof [0,+∞) where 0 would be for perfect performance,1 would be the cost of a system that provides nooutput, and +∞ is possible because false alarms areincluded in the measure.
The inclusion of decision scores in the system out-put permits the computation of Decision Error Trade-off (DET) curves. DET curves plot Pmiss vs. RFA forall thresholds applied to the system’s decision scores.These plots graphically show the tradeoff between thetwo error types for the system.
27
8.5 Results
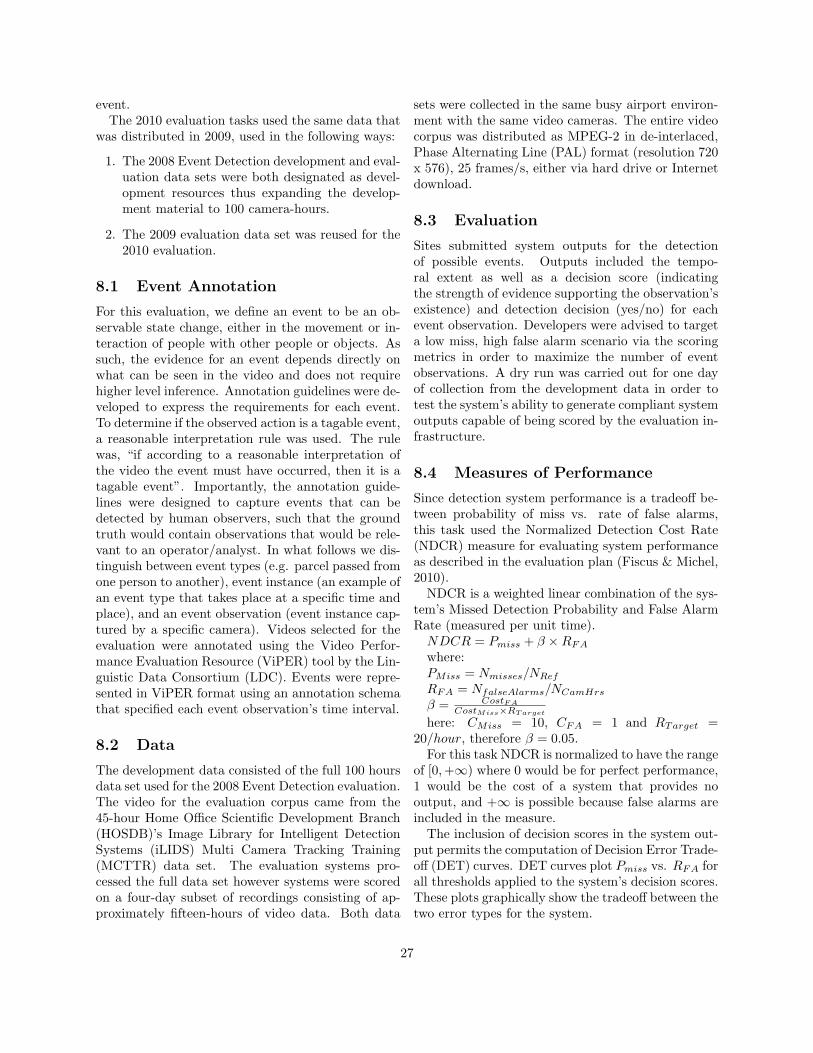
Figure 51: TRECVID 2010 SED - NDCR Per Event,Best Run Per Site
The NDCRs for the submitted event runs can befound in Figure 51 and contains two NDCR valuesfor each submission: the Actual NDCR which is theNDCR based on the binary decisions produced bythe system and the Minimum NDCR which is thelowest NDCR possible based on the decision scoresproduced by the system. The difference between theActual and Minimum NDCRs indicates how well thesystem-identified decision score threshold (via the bi-nary decisions) was tuned to the NDCR function.
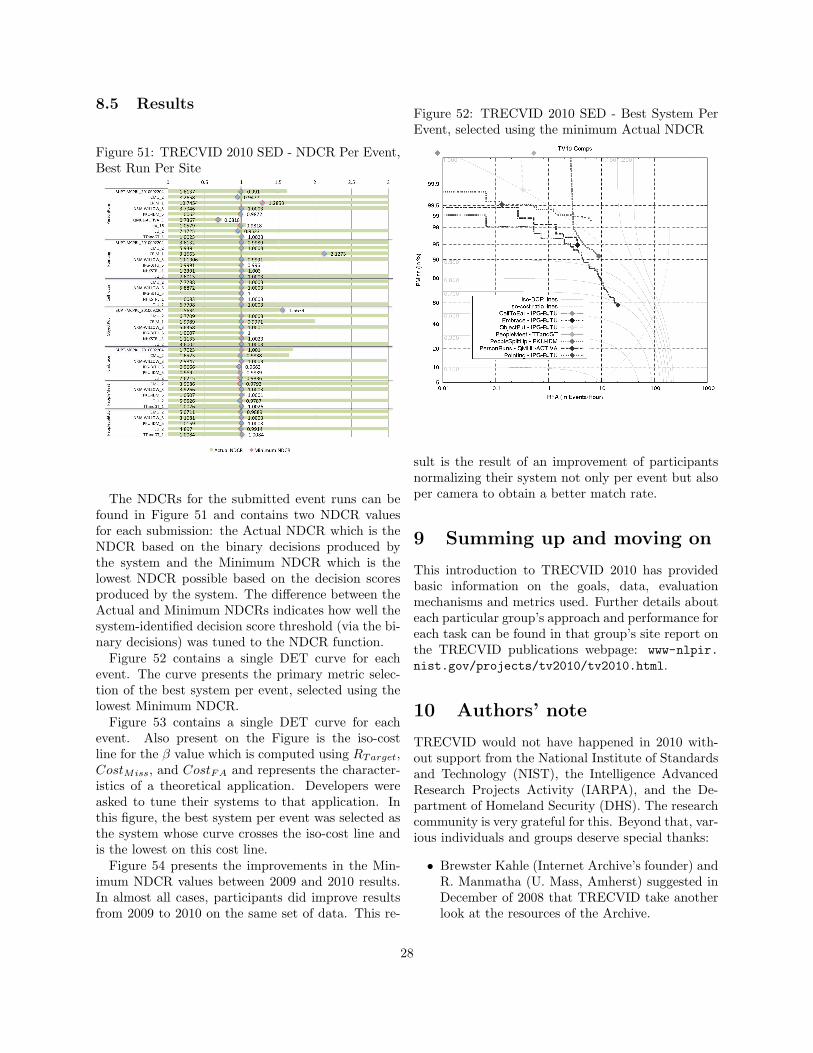
Figure 52 contains a single DET curve for eachevent. The curve presents the primary metric selec-tion of the best system per event, selected using thelowest Minimum NDCR.
Figure 53 contains a single DET curve for eachevent. Also present on the Figure is the iso-costline for the β value which is computed using RTarget,CostMiss, and CostFA and represents the character-istics of a theoretical application. Developers wereasked to tune their systems to that application. Inthis figure, the best system per event was selected asthe system whose curve crosses the iso-cost line andis the lowest on this cost line.
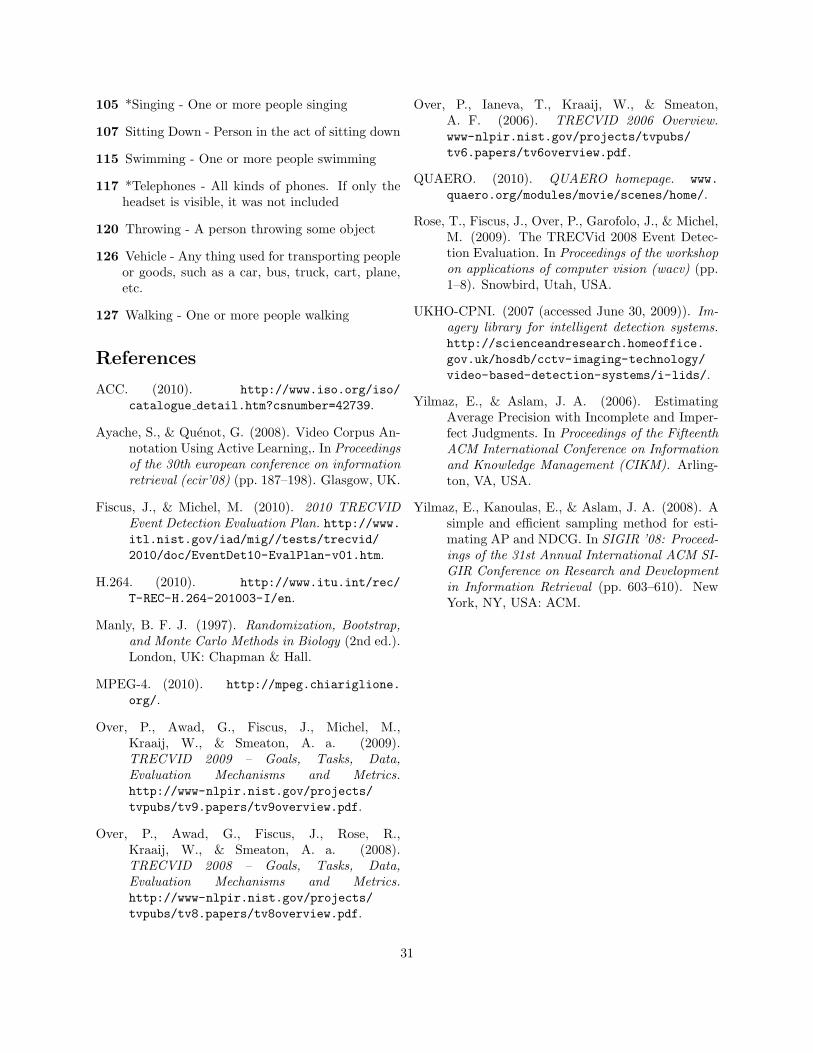
Figure 54 presents the improvements in the Min-imum NDCR values between 2009 and 2010 results.In almost all cases, participants did improve resultsfrom 2009 to 2010 on the same set of data. This re-
Figure 52: TRECVID 2010 SED - Best System PerEvent, selected using the minimum Actual NDCR
sult is the result of an improvement of participantsnormalizing their system not only per event but alsoper camera to obtain a better match rate.
9 Summing up and moving on
This introduction to TRECVID 2010 has providedbasic information on the goals, data, evaluationmechanisms and metrics used. Further details abouteach particular group’s approach and performance foreach task can be found in that group’s site report onthe TRECVID publications webpage: www-nlpir.
nist.gov/projects/tv2010/tv2010.html.
10 Authors’ note
TRECVID would not have happened in 2010 with-out support from the National Institute of Standardsand Technology (NIST), the Intelligence AdvancedResearch Projects Activity (IARPA), and the De-partment of Homeland Security (DHS). The researchcommunity is very grateful for this. Beyond that, var-ious individuals and groups deserve special thanks:
• Brewster Kahle (Internet Archive’s founder) andR. Manmatha (U. Mass, Amherst) suggested inDecember of 2008 that TRECVID take anotherlook at the resources of the Archive.
28
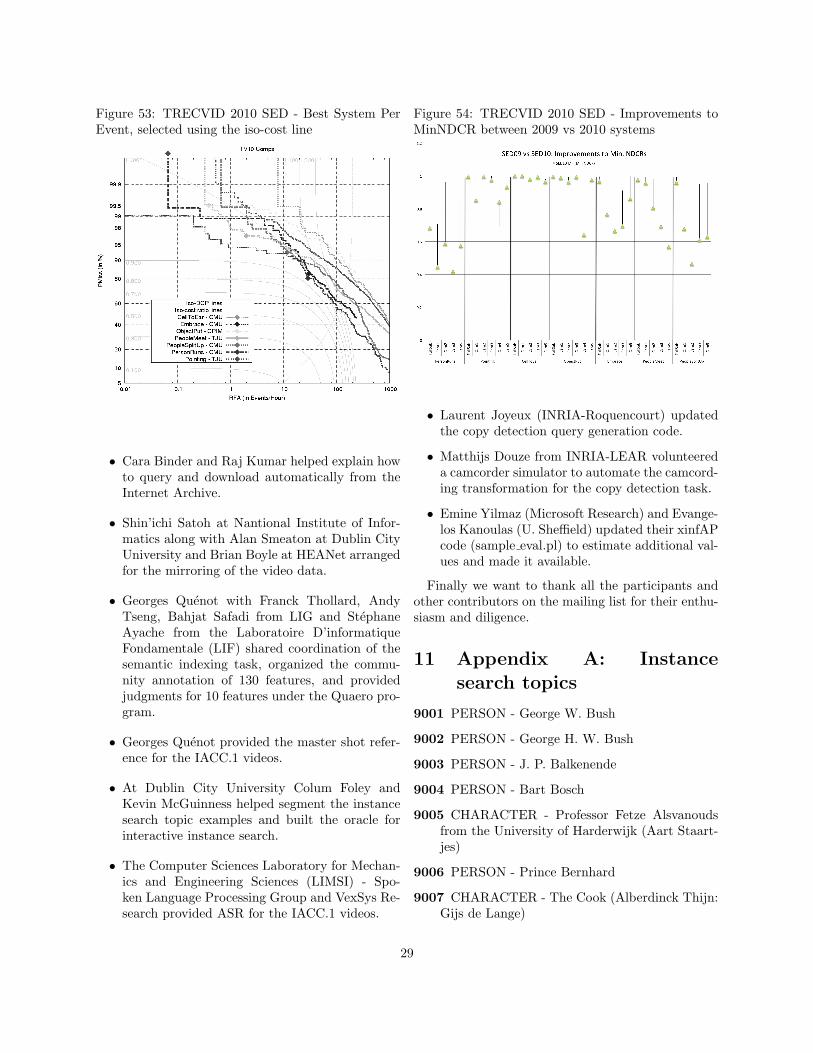
Figure 53: TRECVID 2010 SED - Best System PerEvent, selected using the iso-cost line
• Cara Binder and Raj Kumar helped explain howto query and download automatically from theInternet Archive.
• Shin’ichi Satoh at Nantional Institute of Infor-matics along with Alan Smeaton at Dublin CityUniversity and Brian Boyle at HEANet arrangedfor the mirroring of the video data.
• Georges Quenot with Franck Thollard, AndyTseng, Bahjat Safadi from LIG and StephaneAyache from the Laboratoire D’informatiqueFondamentale (LIF) shared coordination of thesemantic indexing task, organized the commu-nity annotation of 130 features, and providedjudgments for 10 features under the Quaero pro-gram.
• Georges Quenot provided the master shot refer-ence for the IACC.1 videos.
• At Dublin City University Colum Foley andKevin McGuinness helped segment the instancesearch topic examples and built the oracle forinteractive instance search.
• The Computer Sciences Laboratory for Mechan-ics and Engineering Sciences (LIMSI) - Spo-ken Language Processing Group and VexSys Re-search provided ASR for the IACC.1 videos.
Figure 54: TRECVID 2010 SED - Improvements toMinNDCR between 2009 vs 2010 systems
• Laurent Joyeux (INRIA-Roquencourt) updatedthe copy detection query generation code.
• Matthijs Douze from INRIA-LEAR volunteereda camcorder simulator to automate the camcord-ing transformation for the copy detection task.
• Emine Yilmaz (Microsoft Research) and Evange-los Kanoulas (U. Sheffield) updated their xinfAPcode (sample eval.pl) to estimate additional val-ues and made it available.
Finally we want to thank all the participants andother contributors on the mailing list for their enthu-siasm and diligence.
11 Appendix A: Instancesearch topics
9001 PERSON - George W. Bush
9002 PERSON - George H. W. Bush
9003 PERSON - J. P. Balkenende
9004 PERSON - Bart Bosch
9005 CHARACTER - Professor Fetze Alsvanoudsfrom the University of Harderwijk (Aart Staart-jes)
9006 PERSON - Prince Bernhard
9007 CHARACTER - The Cook (Alberdinck Thijn:Gijs de Lange)
29

9008 PERSON - Jeroen Kramer
9009 CHARACTER - Two old ladies, Ta en To
9010 CHARACTER - one of two officeworkers(Kwelder of Benema en Kwelder: Harry van Ri-jthoven)
9011 PERSON - Colin Powell
9012 PERSON - Midas Dekkers
9013 OBJECT - IKEA logo on clothing
9014 CHARACTER - Boy Zonderman (actor inleopard tights and mesh top: Frank Groothof)
9015 OBJECT - black robes with white bibs wornby Dutch judges and lawyers
9016 OBJECT - zebra stripes on pedestrian crossing
9017 OBJECT - KLM Logo
9018 LOCATION - interior of the Dutch parliament
9019 OBJECT - Kappa logo
9020 OBJECT - Umbro logo
9021 OBJECT - tank
9022 OBJECT - Willem Wever van
12 Appendix B: Con-cepts/Features
The features labeled with an asterisk comprise the“lite” subset.
004 *Airplane Flying - An airplane flying in the sky
006 Animal - Shots depicting an animal (no humans)
007 Asian People - People of Asian ethnicity
013 Bicycling - A person riding a bicycle
015 *Boat-Ship - Shots of a boat or ship
019 *Bus - Shots of a bus
022 Car Racing - Shot of scenes at car races
027 Cheering - One or more people cheering or ap-plauding
028 *Cityscape - View of a large urban setting,showing skylines and building tops. (Not juststreet-level views of urban life)
029 *Classroom - Images of school or university styleclassroom scenes
038 Dancing - one or more, not necessarily with ea-chother
039 Dark-skinned People - People who are darkskinned due to African or African/American de-scent (ethnicity)
041 *Demonstration or Protest - One or more peo-ple protesting. May or may not have banners orsigns
044 Doorway - An opening you can walk throughinto a room or building
049 Explosion Fire - Shots of an explosion or a fire
052 Female-Human-Face-Closeup - Closeup of a fe-male human’s face (face must clearly fill morethan 1/2 of height or width of a frame but canbe from any angle and need not be completelyvisible)
053 Flowers - Pictures of flowers
058 Ground vehicles - Vehicles refers to ground ve-hicles, which includes any of the following: Agri-cultural vehicle (tractor,combine), Armored ve-hicle, Automobile, Bicycle, Bus, Constructionvehicle, Emergency vehicle, Limousine, Live-stock carrier, Motor Scooter, Motorcycle, Truck,Box truck, Pickup truck, RV, bulldozer, quads.Excludes interior of cars, vehicles badly de-stroyed
059 *Hand - A close-up view of one or more humanhands, where the hand is the primary focus ofthe shot
081 Mountain - Shots depicting a mountain ormountain range with the slopes visible
084 *Nighttime - Shots that take place (outdoors)at night. Included is the continuation of story ifambiguous (if a story starts at night, it probablyends at night). Excluded are sports events underlights
086 Old People - Seniors or elderly people
100 Running - One or more people running
30
105 *Singing - One or more people singing
107 Sitting Down - Person in the act of sitting down
115 Swimming - One or more people swimming
117 *Telephones - All kinds of phones. If only theheadset is visible, it was not included
120 Throwing - A person throwing some object
126 Vehicle - Any thing used for transporting peopleor goods, such as a car, bus, truck, cart, plane,etc.
127 Walking - One or more people walking
References
ACC. (2010). http://www.iso.org/iso/
catalogue detail.htm?csnumber=42739.
Ayache, S., & Quenot, G. (2008). Video Corpus An-notation Using Active Learning,. In Proceedingsof the 30th european conference on informationretrieval (ecir’08) (pp. 187–198). Glasgow, UK.
Fiscus, J., & Michel, M. (2010). 2010 TRECVIDEvent Detection Evaluation Plan. http://www.itl.nist.gov/iad/mig//tests/trecvid/
2010/doc/EventDet10-EvalPlan-v01.htm.
H.264. (2010). http://www.itu.int/rec/
T-REC-H.264-201003-I/en.
Manly, B. F. J. (1997). Randomization, Bootstrap,and Monte Carlo Methods in Biology (2nd ed.).London, UK: Chapman & Hall.
MPEG-4. (2010). http://mpeg.chiariglione.
org/.
Over, P., Awad, G., Fiscus, J., Michel, M.,Kraaij, W., & Smeaton, A. a. (2009).TRECVID 2009 – Goals, Tasks, Data,Evaluation Mechanisms and Metrics.http://www-nlpir.nist.gov/projects/
tvpubs/tv9.papers/tv9overview.pdf.
Over, P., Awad, G., Fiscus, J., Rose, R.,Kraaij, W., & Smeaton, A. a. (2008).TRECVID 2008 – Goals, Tasks, Data,Evaluation Mechanisms and Metrics.http://www-nlpir.nist.gov/projects/
tvpubs/tv8.papers/tv8overview.pdf.
Over, P., Ianeva, T., Kraaij, W., & Smeaton,A. F. (2006). TRECVID 2006 Overview.www-nlpir.nist.gov/projects/tvpubs/
tv6.papers/tv6overview.pdf.
QUAERO. (2010). QUAERO homepage. www.
quaero.org/modules/movie/scenes/home/.
Rose, T., Fiscus, J., Over, P., Garofolo, J., & Michel,M. (2009). The TRECVid 2008 Event Detec-tion Evaluation. In Proceedings of the workshopon applications of computer vision (wacv) (pp.1–8). Snowbird, Utah, USA.
UKHO-CPNI. (2007 (accessed June 30, 2009)). Im-agery library for intelligent detection systems.http://scienceandresearch.homeoffice.
gov.uk/hosdb/cctv-imaging-technology/
video-based-detection-systems/i-lids/.
Yilmaz, E., & Aslam, J. A. (2006). EstimatingAverage Precision with Incomplete and Imper-fect Judgments. In Proceedings of the FifteenthACM International Conference on Informationand Knowledge Management (CIKM). Arling-ton, VA, USA.
Yilmaz, E., Kanoulas, E., & Aslam, J. A. (2008). Asimple and efficient sampling method for esti-mating AP and NDCG. In SIGIR ’08: Proceed-ings of the 31st Annual International ACM SI-GIR Conference on Research and Developmentin Information Retrieval (pp. 603–610). NewYork, NY, USA: ACM.
31
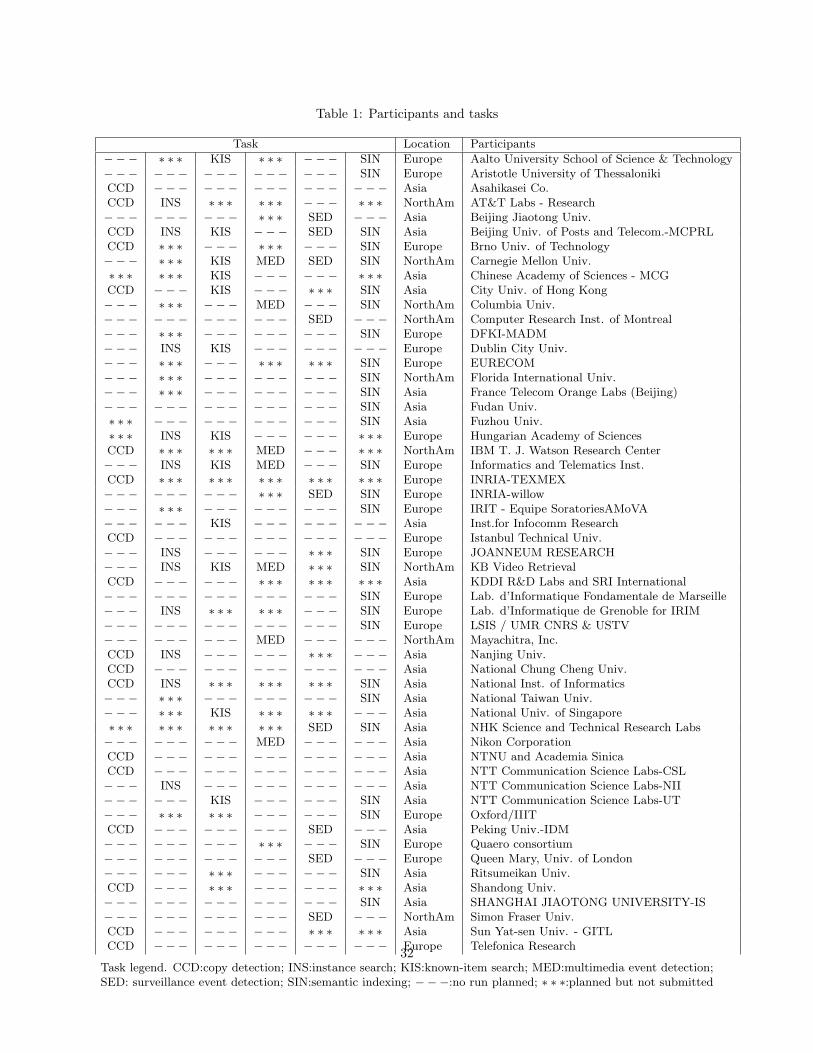
Table 1: Participants and tasks
Task Location Participants
−−− ∗ ∗ ∗ KIS ∗ ∗ ∗ − −− SIN Europe Aalto University School of Science & Technology−−− −−− −−− −−− −−− SIN Europe Aristotle University of ThessalonikiCCD −−− −−− −−− −−− −−− Asia Asahikasei Co.CCD INS ∗ ∗ ∗ ∗ ∗ ∗ − −− ∗ ∗ ∗ NorthAm AT&T Labs - Research−−− −−− −−− ∗ ∗ ∗ SED −−− Asia Beijing Jiaotong Univ.CCD INS KIS −−− SED SIN Asia Beijing Univ. of Posts and Telecom.-MCPRLCCD ∗ ∗ ∗ − −− ∗ ∗ ∗ − −− SIN Europe Brno Univ. of Technology−−− ∗ ∗ ∗ KIS MED SED SIN NorthAm Carnegie Mellon Univ.∗ ∗ ∗ ∗ ∗ ∗ KIS −−− −−− ∗ ∗ ∗ Asia Chinese Academy of Sciences - MCGCCD −−− KIS −−− ∗ ∗ ∗ SIN Asia City Univ. of Hong Kong−−− ∗ ∗ ∗ − −− MED −−− SIN NorthAm Columbia Univ.−−− −−− −−− −−− SED −−− NorthAm Computer Research Inst. of Montreal−−− ∗ ∗ ∗ − −− −−− −−− SIN Europe DFKI-MADM−−− INS KIS −−− −−− −−− Europe Dublin City Univ.−−− ∗ ∗ ∗ − −− ∗ ∗ ∗ ∗ ∗ ∗ SIN Europe EURECOM−−− ∗ ∗ ∗ − −− −−− −−− SIN NorthAm Florida International Univ.−−− ∗ ∗ ∗ − −− −−− −−− SIN Asia France Telecom Orange Labs (Beijing)−−− −−− −−− −−− −−− SIN Asia Fudan Univ.∗ ∗ ∗ − −− −−− −−− −−− SIN Asia Fuzhou Univ.∗ ∗ ∗ INS KIS −−− −−− ∗ ∗ ∗ Europe Hungarian Academy of SciencesCCD ∗ ∗ ∗ ∗ ∗ ∗ MED −−− ∗ ∗ ∗ NorthAm IBM T. J. Watson Research Center−−− INS KIS MED −−− SIN Europe Informatics and Telematics Inst.CCD ∗ ∗ ∗ ∗ ∗ ∗ ∗ ∗ ∗ ∗ ∗ ∗ ∗ ∗ ∗ Europe INRIA-TEXMEX−−− −−− −−− ∗ ∗ ∗ SED SIN Europe INRIA-willow−−− ∗ ∗ ∗ − −− −−− −−− SIN Europe IRIT - Equipe SoratoriesAMoVA−−− −−− KIS −−− −−− −−− Asia Inst.for Infocomm ResearchCCD −−− −−− −−− −−− −−− Europe Istanbul Technical Univ.−−− INS −−− −−− ∗ ∗ ∗ SIN Europe JOANNEUM RESEARCH−−− INS KIS MED ∗ ∗ ∗ SIN NorthAm KB Video RetrievalCCD −−− −−− ∗ ∗ ∗ ∗ ∗ ∗ ∗ ∗ ∗ Asia KDDI R&D Labs and SRI International−−− −−− −−− −−− −−− SIN Europe Lab. d’Informatique Fondamentale de Marseille−−− INS ∗ ∗ ∗ ∗ ∗ ∗ − −− SIN Europe Lab. d’Informatique de Grenoble for IRIM−−− −−− −−− −−− −−− SIN Europe LSIS / UMR CNRS & USTV−−− −−− −−− MED −−− −−− NorthAm Mayachitra, Inc.CCD INS −−− −−− ∗ ∗ ∗ − −− Asia Nanjing Univ.CCD −−− −−− −−− −−− −−− Asia National Chung Cheng Univ.CCD INS ∗ ∗ ∗ ∗ ∗ ∗ ∗ ∗ ∗ SIN Asia National Inst. of Informatics−−− ∗ ∗ ∗ − −− −−− −−− SIN Asia National Taiwan Univ.−−− ∗ ∗ ∗ KIS ∗ ∗ ∗ ∗ ∗ ∗ − −− Asia National Univ. of Singapore∗ ∗ ∗ ∗ ∗ ∗ ∗ ∗ ∗ ∗ ∗ ∗ SED SIN Asia NHK Science and Technical Research Labs−−− −−− −−− MED −−− −−− Asia Nikon CorporationCCD −−− −−− −−− −−− −−− Asia NTNU and Academia SinicaCCD −−− −−− −−− −−− −−− Asia NTT Communication Science Labs-CSL−−− INS −−− −−− −−− −−− Asia NTT Communication Science Labs-NII−−− −−− KIS −−− −−− SIN Asia NTT Communication Science Labs-UT−−− ∗ ∗ ∗ ∗ ∗ ∗ − −− −−− SIN Europe Oxford/IIITCCD −−− −−− −−− SED −−− Asia Peking Univ.-IDM−−− −−− −−− ∗ ∗ ∗ − −− SIN Europe Quaero consortium−−− −−− −−− −−− SED −−− Europe Queen Mary, Univ. of London−−− −−− ∗ ∗ ∗ − −− −−− SIN Asia Ritsumeikan Univ.CCD −−− ∗ ∗ ∗ − −− −−− ∗ ∗ ∗ Asia Shandong Univ.−−− −−− −−− −−− −−− SIN Asia SHANGHAI JIAOTONG UNIVERSITY-IS−−− −−− −−− −−− SED −−− NorthAm Simon Fraser Univ.CCD −−− −−− −−− ∗ ∗ ∗ ∗ ∗ ∗ Asia Sun Yat-sen Univ. - GITLCCD −−− −−− −−− −−− −−− Europe Telefonica Research
Task legend. CCD:copy detection; INS:instance search; KIS:known-item search; MED:multimedia event detection;SED: surveillance event detection; SIN:semantic indexing; −−−:no run planned; ∗ ∗ ∗:planned but not submitted
32
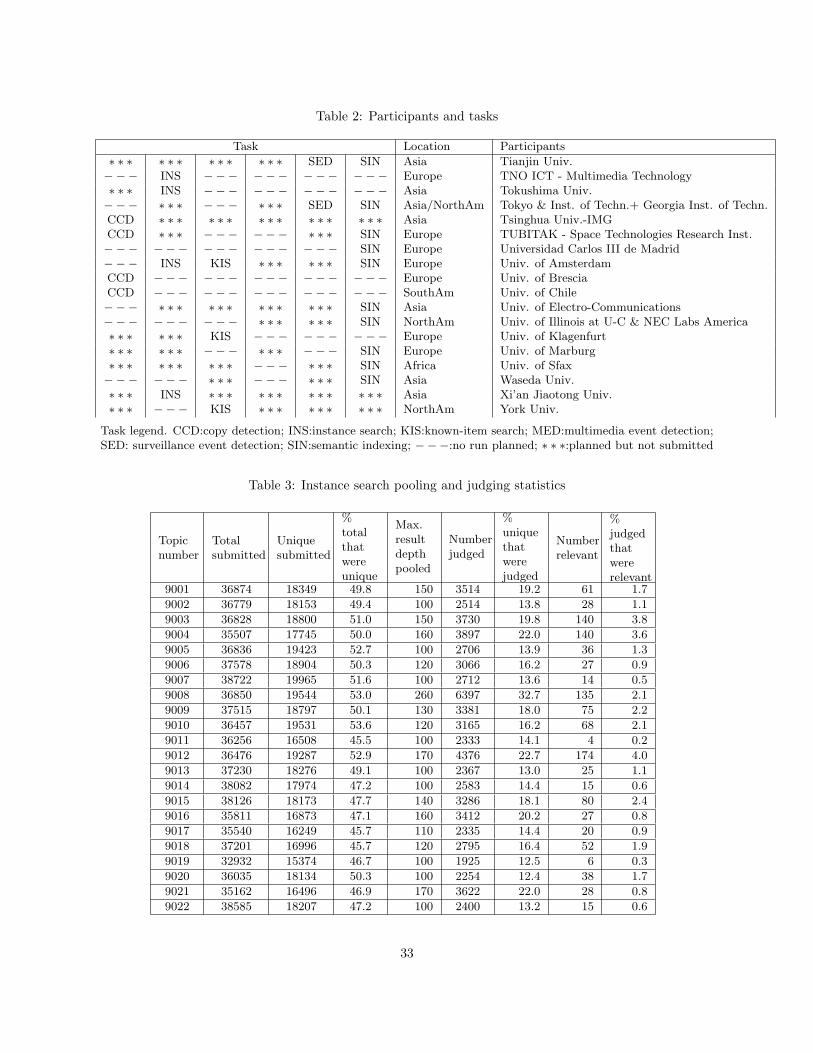
Table 2: Participants and tasks
Task Location Participants
∗ ∗ ∗ ∗ ∗ ∗ ∗ ∗ ∗ ∗ ∗ ∗ SED SIN Asia Tianjin Univ.−−− INS −−− −−− −−− −−− Europe TNO ICT - Multimedia Technology∗ ∗ ∗ INS −−− −−− −−− −−− Asia Tokushima Univ.−−− ∗ ∗ ∗ − −− ∗ ∗ ∗ SED SIN Asia/NorthAm Tokyo & Inst. of Techn.+ Georgia Inst. of Techn.CCD ∗ ∗ ∗ ∗ ∗ ∗ ∗ ∗ ∗ ∗ ∗ ∗ ∗ ∗ ∗ Asia Tsinghua Univ.-IMGCCD ∗ ∗ ∗ − −− −−− ∗ ∗ ∗ SIN Europe TUBITAK - Space Technologies Research Inst.−−− −−− −−− −−− −−− SIN Europe Universidad Carlos III de Madrid−−− INS KIS ∗ ∗ ∗ ∗ ∗ ∗ SIN Europe Univ. of AmsterdamCCD −−− −−− −−− −−− −−− Europe Univ. of BresciaCCD −−− −−− −−− −−− −−− SouthAm Univ. of Chile−−− ∗ ∗ ∗ ∗ ∗ ∗ ∗ ∗ ∗ ∗ ∗ ∗ SIN Asia Univ. of Electro-Communications−−− −−− −−− ∗ ∗ ∗ ∗ ∗ ∗ SIN NorthAm Univ. of Illinois at U-C & NEC Labs America∗ ∗ ∗ ∗ ∗ ∗ KIS −−− −−− −−− Europe Univ. of Klagenfurt∗ ∗ ∗ ∗ ∗ ∗ − −− ∗ ∗ ∗ − −− SIN Europe Univ. of Marburg∗ ∗ ∗ ∗ ∗ ∗ ∗ ∗ ∗ − −− ∗ ∗ ∗ SIN Africa Univ. of Sfax−−− −−− ∗ ∗ ∗ − −− ∗ ∗ ∗ SIN Asia Waseda Univ.∗ ∗ ∗ INS ∗ ∗ ∗ ∗ ∗ ∗ ∗ ∗ ∗ ∗ ∗ ∗ Asia Xi’an Jiaotong Univ.∗ ∗ ∗ − −− KIS ∗ ∗ ∗ ∗ ∗ ∗ ∗ ∗ ∗ NorthAm York Univ.
Task legend. CCD:copy detection; INS:instance search; KIS:known-item search; MED:multimedia event detection;SED: surveillance event detection; SIN:semantic indexing; −−−:no run planned; ∗ ∗ ∗:planned but not submitted
Table 3: Instance search pooling and judging statistics
Topicnumber
Totalsubmitted
Uniquesubmitted
%totalthatwereunique
Max.resultdepthpooled
Numberjudged
%uniquethatwerejudged
Numberrelevant
%judgedthatwererelevant
9001 36874 18349 49.8 150 3514 19.2 61 1.7
9002 36779 18153 49.4 100 2514 13.8 28 1.1
9003 36828 18800 51.0 150 3730 19.8 140 3.8
9004 35507 17745 50.0 160 3897 22.0 140 3.6
9005 36836 19423 52.7 100 2706 13.9 36 1.3
9006 37578 18904 50.3 120 3066 16.2 27 0.9
9007 38722 19965 51.6 100 2712 13.6 14 0.5
9008 36850 19544 53.0 260 6397 32.7 135 2.1
9009 37515 18797 50.1 130 3381 18.0 75 2.2
9010 36457 19531 53.6 120 3165 16.2 68 2.1
9011 36256 16508 45.5 100 2333 14.1 4 0.2
9012 36476 19287 52.9 170 4376 22.7 174 4.0
9013 37230 18276 49.1 100 2367 13.0 25 1.1
9014 38082 17974 47.2 100 2583 14.4 15 0.6
9015 38126 18173 47.7 140 3286 18.1 80 2.4
9016 35811 16873 47.1 160 3412 20.2 27 0.8
9017 35540 16249 45.7 110 2335 14.4 20 0.9
9018 37201 16996 45.7 120 2795 16.4 52 1.9
9019 32932 15374 46.7 100 1925 12.5 6 0.3
9020 36035 18134 50.3 100 2254 12.4 38 1.7
9021 35162 16496 46.9 170 3622 22.0 28 0.8
9022 38585 18207 47.2 100 2400 13.2 15 0.6
33

Table 4: 2010 Participants not submitting any runs
Task Location Participants
−−− −−− −−− −−− −−− ∗ ∗ ∗ NorthAm AKiiRA Media Systems Inc.−−− −−− −−− ∗ ∗ ∗ ∗ ∗ ∗ − −− Asia Beijing University of Post-Telecom.-MCU∗ ∗ ∗ ∗ ∗ ∗ ∗ ∗ ∗ ∗ ∗ ∗ ∗ ∗ ∗ ∗ ∗ ∗ NorthAm Binatix Inc.−−− −−− ∗ ∗ ∗ ∗ ∗ ∗ ∗ ∗ ∗ − −− Asia Chinese Academy of Sciences - AIBT∗ ∗ ∗ − −− −−− −−− −−− −−− NorthAm CMART Systems−−− ∗ ∗ ∗ ∗ ∗ ∗ − −− −−− ∗ ∗ ∗ Europe Commissariat a l’Energie Atomique, LIST−−− ∗ ∗ ∗ ∗ ∗ ∗ ∗ ∗ ∗ ∗ ∗ ∗ ∗ ∗ ∗ NorthAm CompuSensor Technology Corporation Address−−− −−− ∗ ∗ ∗ ∗ ∗ ∗ ∗ ∗ ∗ ∗ ∗ ∗ Europe Consorzio Milano Ricerche∗ ∗ ∗ ∗ ∗ ∗ ∗ ∗ ∗ ∗ ∗ ∗ ∗ ∗ ∗ − −− NorthAm Florida Atlantic University−−− ∗ ∗ ∗ ∗ ∗ ∗ ∗ ∗ ∗ − −− −−− NorthAm Harvard∗ ∗ ∗ − −− −−− −−− ∗ ∗ ∗ − −− Asia Hong Kong Polytechnic University−−− ∗ ∗ ∗ − −− −−− ∗ ∗ ∗ − −− Europe Imagelab - University of Modena and Reggio Emilia−−− ∗ ∗ ∗ − −− −−− ∗ ∗ ∗ ∗ ∗ ∗ NorthAm ITT Geospatial Systems−−− ∗ ∗ ∗ ∗ ∗ ∗ − −− −−− ∗ ∗ ∗ Asia Kobe University∗ ∗ ∗ − −− −−− −−− −−− −−− Asia Korea Advanced Institute of Science and Technology−−− ∗ ∗ ∗ ∗ ∗ ∗ ∗ ∗ ∗ ∗ ∗ ∗ ∗ ∗ ∗ Asia Mangalore University−−− −−− −−− −−− −−− ∗ ∗ ∗ Asia National Cheng Kung University−−− ∗ ∗ ∗ ∗ ∗ ∗ − −− −−− ∗ ∗ ∗ Europe Open University∗ ∗ ∗ ∗ ∗ ∗ ∗ ∗ ∗ ∗ ∗ ∗ ∗ ∗ ∗ ∗ ∗ ∗ Asia Peking University-ICST−−− −−− ∗ ∗ ∗ ∗ ∗ ∗ − −− −−− Europe Politecnico Di Milano−−− ∗ ∗ ∗ − −− −−− −−− −−− Austrail RMIT University School of CS&IT∗ ∗ ∗ ∗ ∗ ∗ ∗ ∗ ∗ ∗ ∗ ∗ ∗ ∗ ∗ ∗ ∗ ∗ Asia Shanghai Jiao Tong Univresity-IICIP−−− −−− ∗ ∗ ∗ − −− −−− −−− Asia Sichuan University of China∗ ∗ ∗ − −− −−− −−− −−− −−− Asia Sun Yat-sen University - IST−−− ∗ ∗ ∗ − −− −−− −−− −−− Asia Tsinghua University-THEEIE−−− −−− −−− −−− ∗ ∗ ∗ ∗ ∗ ∗ Europe Universidad Autnoma de Madrid−−− −−− −−− −−− ∗ ∗ ∗ − −− SouthAm Universidade Federal do Paran−−− −−− ∗ ∗ ∗ − −− −−− −−− NorthAm University of South Carolina∗ ∗ ∗ ∗ ∗ ∗ ∗ ∗ ∗ ∗ ∗ ∗ ∗ ∗ ∗ ∗ ∗ ∗ Europe University of Ioannina−−− −−− ∗ ∗ ∗ − −− −−− −−− Asia University of Malaya−−− −−− ∗ ∗ ∗ − −− −−− ∗ ∗ ∗ NorthAm University of Maryland∗ ∗ ∗ ∗ ∗ ∗ − −− ∗ ∗ ∗ − −− −−− NorthAm University of Ottawa∗ ∗ ∗ ∗ ∗ ∗ ∗ ∗ ∗ − −− −−− ∗ ∗ ∗ SouthAm University of Sao Paulo−−− −−− −−− ∗ ∗ ∗ − −− ∗ ∗ ∗ Europe University of Sheffield∗ ∗ ∗ − −− −−− −−− −−− ∗ ∗ ∗ Europe University of Surrey∗ ∗ ∗ ∗ ∗ ∗ − −− ∗ ∗ ∗ − −− ∗ ∗ ∗ Asia Zhejiang University
Task legend. CCD:copy detection; INS:instance search; KIS:known-item search; MED:multimedia event detection;SED: surveillance event detection; SIN:semantic indexing; −−−:no run planned; ∗ ∗ ∗:planned but not submitted
34