treatment of trace organic contaminants and nutrients in ... · wetlands were considered, including...
TRANSCRIPT

Treatment of Trace Organic Contaminants and Nutrients in
Open-Water Unit Process Wetlands
By
Justin Thomas Jasper
A dissertation submitted in partial satisfaction of
the requirements for the degree of
Doctor of Philosophy
in
Engineering - Civil and Environmental Engineering
in the
Graduate Division
of the
University of California, Berkeley
Committee in charge:
Professor David L. Sedlak, Chair
Professor Kara L. Nelson
Professor John Coates
Fall 2014

Treatment of Trace Organic Contaminants and Nutrients in Open-
Water Unit Process Wetlands
© 2014
Justin Thomas Jasper
1
Abstract
Treatment of Trace Organic Contaminants and Nutrients in Open-Water Unit Process Wetlands
by
Justin Thomas Jasper
Doctor of Philosophy in Engineering - Civil and Environmental Engineering
University of California, Berkeley
Professor David L. Sedlak, Chair
Treatment wetlands are becoming an increasing popular approach for nutrient removal
from municipal wastewater effluent due to their low cost and energy requirements, as well as the
ancillary benefits they provide. Recently, they have also been considered as a means of
removing wastewater-derived trace organic contaminants. Initial studies of the removal of trace
organic contaminants in treatment wetlands indicate that removal is often insignificant and is
highly variable among systems. Efforts to improve wetland treatment efficiency have been
hampered by a limited understanding of trace organic contaminant removal mechanisms. In this
research, a novel type of wetland, consisting of a shallow cell lined with geotextile fabric to
prevent the growth of emergent macrophytes, is considered for the removal of wastewater-
derived trace organic contaminants and nutrients. When combined with other types of wetland
cells in a unit process fashion (i.e., wetland cells designed to remove specific contaminants are
arranged in series), open-water unit process wetlands may provide a basis for using treatment
wetlands to remove a wide range of trace organic contaminants from municipal wastewater
effluent.
To understand how open-water treatment wetlands could be integrated with other types of
wetland cells in unit process wetlands, the treatment wetland literature was critically reviewed
(Chapter 2). Removal mechanisms of trace organic contaminants and pathogens in treatment
wetlands were considered, including sorption, biotransformation, photolysis, sedimentation,
predation, and photoinactivation. Methods of enhancing these mechanisms in unit process
wetland cells were also identified, both in commonly employed vegetated cells and through the
development of novel wetland configurations, such as open-water cells. To further optimize unit
process wetlands, the arrangement of wetland cells was evaluated. The application of the unit
process concept to a wide range of wastewater contaminants has the potential to make treatment
wetlands a more attractive component of urban water infrastructure.
To assess the ability of open-water cells to exploit sunlight photolysis to remove trace
organic contaminants from municipal wastewater effluent, a photochemical model was calibrated
using measured photolysis rates for atenolol, carbamazepine, propranolol, and sulfamethoxazole
in wetland water under representative conditions (Chapter 3). Contaminant transformation by
hydroxyl radical and carbonate radical were predicted from steady-state radical concentrations

2
measured at pH values between 8 and 10. Direct photolysis rates and the effects of light
screening by dissolved organic matter on photolysis rates were estimated using solar irradiance
data, contaminant quantum yields, and light screening factors. The model was applied to predict
the land area required to achieve 90% removal of a suite of wastewater-derived organic
contaminants by sunlight-induced reactions under a variety of conditions. Results suggest that
during summer, open-water cells that receive a million gallons per day of nitrified wastewater
effluent can remove 90% of most compounds in an area comparable to existing full-scale
wetland systems.
The bottoms of open-water wetland cells are rapidly colonized by a biomat consisting of
an assemblage of photosynthetic and heterotrophic microorganisms. To assess the contribution
of biotransformation in this system to the overall attenuation of trace organic contaminants,
transformation rates of test compounds measured in microcosms were compared with attenuation
rates measured in a pilot-scale system (Chapter 4). Biotransformation was the dominant removal
mechanism in the pilot-scale system for atenolol, metoprolol, and trimethoprim, while
sulfamethoxazole and propranolol were attenuated mainly via photolysis. In microcosm
experiments, biotransformation rates increased for metoprolol and propranolol when algal
photosynthesis was supported by irradiation with visible light. Biotransformation rates increased
for trimethoprim and sulfamethoxazole in the dark, when microbial respiration depleted
dissolved oxygen concentrations within the biomat. These observations are consistent with
previous studies in wastewater treatment plants and wetlands at different dissolved oxygen
concentrations. During summer, atenolol, metoprolol, and propranolol were rapidly attenuated
in the pilot-scale system (t1/2 < 0.5 d), trimethoprim and sulfamethoxazole were transformed
more slowly (t1/2 ≈ 1.5–2 d), and carbamazepine was recalcitrant (t1/2>30 d). The combination of
biotransformation and photolysis resulted in overall transformation rates that were 10 to 100
times faster than those previously measured in vegetated wetlands.
In addition to removing trace organic contaminants, the diffuse biomat formed on the
bottom of open-water wetland cells provides conditions conducive to NO3- removal via microbial
denitrification, as well as anaerobic ammonium oxidation (anammox). To assess this process,
nitrogen cycling was evaluated over a 3-year period in an open-water wetland cell (Chapter 5).
Approximately two-thirds of the NO3- entering the cell was removed on an annual basis.
Microcosm studies indicated that NO3- removal was mainly attributable to denitrification within
the diffuse biomat (i.e., 80±20%), with accretion of assimilated nitrogen accounting for less than
3% of the NO3- removed. The importance of denitrification to NO3
- removal was supported by
the presence of denitrifying genes (nirS and nirK) within the biomat. While modest when
compared to the presence of denitrifying genes, the anammox-specific gene hydrazine synthase
(hzs) was detected at higher concentrations near the biomat bottom. This observation, along with
the simultaneous presence of ammonium and nitrate in the biomat, suggested that anammox may
have been responsible for some of the NO3- removal. The annual temperature-corrected areal
first-order NO3- removal rate (k20=59.4±6.2 m yr-1) was higher than values reported for more
than 75% of vegetated wetlands treating effluent where NO3- served as the main nitrogen species
(e.g., nitrified secondary wastewater effluent and agricultural runoff). Inclusion of shallow,
open-water cells in unit-process wetland systems has the potential to provide simultaneous
removal of trace organic contaminants (Chapters 3 and 4) and pathogens, in addition to NO3-, in
land areas similar to those occupied by existing full-scale treatment wetlands.

i

ii
TABLE OF CONTENTS
TABLE OF CONTENTS .................................................................................................................................. II
LIST OF FIGURES ......................................................................................................................................... IV
LIST OF TABLES ........................................................................................................................................... VI
ACKNOWLEDGMENTS .............................................................................................................................. VII
CHAPTER 1. INTRODUCTION ...................................................................................................................... 1 1.1 WASTEWATER-DERIVED TRACE ORGANIC CONTAMINANTS .............................................................. 2
1.2 TREATMENT WETLANDS ..................................................................................................................... 5
1.3 MOTIVATION AND RESEARCH OBJECTIVES ......................................................................................... 6
1.3.1 Motivation ...................................................................................................................................... 6
1.3.2 Objective 1: Review of Trace Organic Contaminant Removal in Treatment Wetlands ................. 7
1.3.3 Objective 2: Photolysis of Trace Organic Contaminants in Open-Water Cells ............................. 8
1.3.4 Objective 3: Biotransformation of Trace Organic Contaminants in Open-Water Cells ................ 8
1.3.5 Objective 4: Evaluate Nitrate Removal in Open-Water Wetlands ................................................. 8
CHAPTER 2. UNIT PROCESS WETLANDS FOR REMOVAL OF TRACE ORGANIC
CONTAMINANTS AND PATHOGENS FROM MUNICIPAL WASTEWATER EFFLUENTS. ............ 9 2.1 BACKGROUND ........................................................................................................................................... 10
2.2 HYDRAULICS OF SURFACE FLOW WETLANDS .......................................................................................... 12
2.3 CONTAMINANTS OF CONCERN .................................................................................................................. 13
2.3.1 Trace Organic Contaminants ........................................................................................................... 13
2.3.2 Waterborne Pathogens ..................................................................................................................... 14
2.4 REMOVAL MECHANISMS OF TRACE ORGANIC CONTAMINANTS ............................................................... 17
2.4.1 Sorption............................................................................................................................................. 17
2.4.2 Biotransformation ............................................................................................................................. 18
2.4.3 Photolysis .......................................................................................................................................... 20
2.5 REMOVAL OF WATERBORNE PATHOGENS ................................................................................................ 21
2.5.1 Attachment and Sedimentation ......................................................................................................... 21
2.5.2 Predation .......................................................................................................................................... 21
2.5.3 Photoinactivation .............................................................................................................................. 22
2.6 NOVEL UNIT PROCESS WETLANDS FOR REMOVAL OF TRACE ORGANIC CONTAMINANTS AND PATHOGENS
........................................................................................................................................................................ 23
2.6.1 Shallow, Open-Water Cells ............................................................................................................... 24
2.6.2 Macrophyte-Dominated Wetland Cells ............................................................................................. 26
2.6.3 Bivalve Filtration Wetland Cells ...................................................................................................... 27
2.7 CONCLUSIONS ........................................................................................................................................... 29
CHAPTER 3. PHOTOTRANSFORMATION OF WASTEWATER-DERIVED TRACE ORGANIC
CONTAMINANTS IN OPEN-WATER UNIT PROCESS TREATMENT WETLANDS ......................... 30 3.1 INTRODUCTION ......................................................................................................................................... 31
3.2 PHOTOLYSIS MODEL ................................................................................................................................. 31
3.3 MATERIALS AND METHODS ...................................................................................................................... 40
3.3.1 Materials ........................................................................................................................................... 40
3.3.2 Wetland Water and Conditions ......................................................................................................... 40
3.3.3 Reaction Rate Constants for Carbonate Radical .............................................................................. 43
3.3.4 Reaction Rate Constants for Hydroxyl Radical and Carbonate Radical with DOM ........................ 43
3.3.5 Photolysis of Representative Compounds in Wetland Water ............................................................ 44
3.3.6 Predicting Photolysis Rates in Unit Process Wetlands .................................................................... 44
3.3.7 Analytical methods ............................................................................................................................ 45
3.4 RESULTS AND DISCUSSION ....................................................................................................................... 47
3.4.1 Carbonate Radical Reactions with Contaminants ............................................................................ 47

iii
3.4.2 Reaction of Hydroxyl Radical and Carbonate Radical with Wetland DOM .................................... 49
3.4.3 Photolysis of Test Compounds in Wetland Water ............................................................................ 52
3.4.4 Photolysis Model Validation and Predictions .................................................................................. 54
3.4.5 Estimation of Wetland Area Necessary for Contaminant Photolysis ................................................ 55
3.4.6 Comparison of Photolysis Cells and Existing Wetlands ................................................................... 60
3.4.7 Application to Wetland Design ......................................................................................................... 61
CHAPTER 4. BIOTRANSFORMATION OF TRACE ORGANIC CONTAMINANTS IN OPEN-
WATER UNIT PROCESS TREATMENT WETLANDS............................................................................. 62 4.1 INTRODUCTION ......................................................................................................................................... 63
4.2 MATERIALS AND METHODS ...................................................................................................................... 64
4.2.1 Materials ........................................................................................................................................... 64
4.2.2 Monitoring of the Pilot-Scale Wetland. ............................................................................................ 64
4.2.3 Microcosms ....................................................................................................................................... 69
4.2.4 Determination of Biotransformation Products ................................................................................. 70
4.2.5 Photolysis Rate Prediction ................................................................................................................ 71
4.2.6 Correcting for Evaporation in the Pilot-Scale Cell .......................................................................... 71
4.2.7 Microbial Community Characterization ........................................................................................... 73
4.2.8 Analytical Methods ........................................................................................................................... 74
4.3 RESULTS AND DISCUSSION ....................................................................................................................... 74
4.3.1 Characterization of Wetland Biomat ................................................................................................ 74
4.3.2 Biotransformation in Microcosms .................................................................................................... 78
4.3.3 Biotransformation Products ............................................................................................................. 82
4.3.4 Compound Attenuation in the Pilot-Scale Open-Water Wetland ...................................................... 84
4.3.5 Evaluation of Attenuation Mechanisms in the Pilot-Scale Open-Water Wetland ............................. 87
4.3.6 Application to Full-Scale Wetland Design........................................................................................ 92
CHAPTER 5. NITROGEN REMOVAL IN SHALLOW, OPEN-WATER TREATMENT WETLANDS
............................................................................................................................................................................ 95 5.1 INTRODUCTION ......................................................................................................................................... 96
5.2 MATERIALS AND METHODS ...................................................................................................................... 97
5.2.1 Materials ........................................................................................................................................... 97
5.2.2 Pilot-Scale Wetland Monitoring ....................................................................................................... 97
5.2.3 Primary Productivity Calculations ................................................................................................... 98
5.2.4 Acetylene Block Microcosms ............................................................................................................ 98
5.2.5 Nutrient Mass Balance...................................................................................................................... 98
5.2.6 Measurement of Gene Abundances ................................................................................................... 99
5.2.7 Analytical Methods ........................................................................................................................... 99
5.3 RESULTS AND DISCUSSION ..................................................................................................................... 100
5.3.1 NO3- Removal Rates ........................................................................................................................ 100
5.3.2 NO3- Removal Mechanisms ............................................................................................................. 110
5.3.3 Implications for Design of Open-Water Cells................................................................................. 119
CHAPTER 6. CONCLUSIONS .................................................................................................................... 121 6.1 SUMMARY ............................................................................................................................................... 122
6.2 REMOVAL OF TRACE ORGANIC CONTAMINANTS IN OPEN-WATER WETLANDS ..................................... 122
6.3 REMOVAL OF NITRATE IN OPEN-WATER WETLANDS ............................................................................. 123
6.4 FUTURE RESEARCH ................................................................................................................................. 124
REFERENCES................................................................................................................................................ 127

iv
LIST OF FIGURES
Figure 1.1. Box plot comparing trace organic contaminant removal efficiencies ............................................... 4
Figure 1.2: Comparison of trace organic contaminant removal efficiencies in wetlands and WWTPs ................ 6
Figure 2.1: Averages pharmaceutical and personal care product removal efficiencies in treatment wetlands. .. 15
Figure 2.2: Averages pathogen removal efficiencies in surface flow wetlands .................................................. 16
Figure 2.3: Example of unit process wetland treatment train ............................................................................. 24
Figure 2.4: Discovery Bay pilot-scale open-water wetland cell. ........................................................................ 25
Figure 2.5: Schematic of bivalve uptake and removal mechanisms of organic contaminants and pathogens. ... 28
Figure 3.1: Predicted irradiance under clear skies at sea level (Z(24 h, λ)) ........................................................ 33
Figure 3.2: Molar absorption coefficient (ε) of test compounds as a function of wavelength.. .......................... 34
Figure 3.3: Absorbance at 310 nm (α(310)) of wetland water ............................................................................ 35
Figure 3.4: Typical absorbance of wetland water with 8 mg L-1-C DOM ......................................................... 41
Figure 3.5: Inlet and outlet pH values in the shallow, open-water wetland cell ................................................. 42
Figure 3.6: Typical results from competition kinetics experiment used to measure k · CO3−, cont. ................. 46
Figure 3.7. Measured [•OH]ss and [•CO3-]ss in irradiated Discovery Bay wetland water ................................... 49
Figure 3.8: Pseudo first-order photolysis rates for test compounds in amended wetland waters ....................... 50
Figure 3.9: Pseudo first-order photolysis rates for test compounds in buffered wetland waters ........................ 51
Figure 3.10: Predicted and measured pseudo first-order photolysis rates for test compounds ........................... 52
Figure 3.11: Predicted contributions of photolysis mechanisms to kphot ............................................................. 53
Figure 3.12: Area predicted to provide 90% removal of contaminants .............................................................. 57
Figure 3.13: Area needed to provide 1-log removal of contaminants from 1 MGD with different [NO3-] ........ 58
Figure 4.1: Photograph of the pilot-scale open-water unit process cell .............................................................. 64
Figure 4.2: Breakthrough curve of rhodamine-WT in a tracer test in the pilot-scale open-water cell. ............... 66
Figure 4.3: Spectrum of the red lamp used in microcosm experiments .............................................................. 67
Figure 4.4: Percent mass recovery of test compounds amended to wetland microcosms ................................... 68
Figure 4.5: Average Cl- concentrations throughout pilot-scale open-water cell ................................................. 72
Figure 4.6: Dissolved oxygen profiles in microcosms and at the pilot-scale open-water cell ............................ 75
Figure 4.7: Fluorescent imagery, electron microscopy, and illumina sequencing of microcosm biomass ........ 76
Figure 4.8: Scanning electron microscopy of wetland biomat ............................................................................ 77

v
Figure 4.9: Fraction of test compound masses remaining in microcosms ......................................................... 79
Figure 4.10: Formation of the biotransformation product metoprolol acid in amended microcosms ................. 83
Figure 4.11: Removal of test compounds in pilot-scale open-water wetland ..................................................... 85
Figure 4.12: Seasonal pseudo first-order attenuation rates of test compounds in the open-water cell .............. 86
Figure 4.13: Comparison of measured or predicted removal rate constants of test compounds ......................... 89
Figure 4.14: Comparison of measured or predicted removal of test compounds corrected for evaporation. . .. 91
Figure 4.15: Area predicted to provide 90% removal of contaminants in open-water treatment cells ............... 94
Figure 5.1: Percent evaporation between inlet and outlet of pilot-scale wetland cell ...................................... 101
Figure 5.2: NO3- removal along flow-path in Discovery Bay pilot-scale open-water wetland cell ................. 102
Figure 5.3: Average NO3- removal rates in the Discovery Bay pilot-scale open-water wetland by season...... 103
Figure 5.4: Average inlet and outlet concentrations of nitrogen species ......................................................... 104
Figure 5.5: Natural log of first-order NO3- removal rates versus average wetland water temperature ............ 106
Figure 5.6: Typical profile of aqueous species in middle of Discovery Bay open-water pilot scale wetland . 107
Figure 5.7: Organic carbon, nitrogen, and phosphorus mass balance ............................................................... 108
Figure 5.8: Conversion of NO3- to N2O in anoxic microcosms amended with acetylene ................................. 109
Figure 5.9: Abundances of genes involved in denitrification (nirK and nirS) and anammox (hzs) .................. 112
Figure 5.10: Example of dissolved oxygen profiles used to calculate primary productivity and respiration ... 113
Figure 5.11: Average biomat thickness measured throughout the pilot-scale open-water wetland .................. 114
Figure 5.12: Percent phosphorus, nitrogen, and organic content by mass in wetland biomat .......................... 116
Figure 5.13: Concentrations of nitrogen species in amended anoxic microcosms ........................................... 117
Figure 5.14: Mean area predicted to provide 90% removal of NO3- in open-water and vegetated wetlands ... 120

vi
LIST OF TABLES
Table 1.1: Typical Concentrations of Trace Organic Contaminants in WWTP Effluents ................................... 2
Table 1.2: Potential Ecological Risk of Pharmaceuticals in Environmental Compartments ............................... 3
Table 2.1: Examples of Large, Full-Scale Treatment Wetlands in the United States. ........................................ 11
Table 3.1: Compound Properties Used in Photolysis Model ............................................................................. 36
Table 3.2: Parameters Used to Calculate Wetland Water Absorbance .............................................................. 37
Table 3.3: Conditions Employed in Photolysis Model ...................................................................................... 39
Table 3.4: Second-Order Rate Constants for the Reaction of ·CO3- with Test Compounds .............................. 47
Table 4.1: Compound-Specific Mass Spectrometry Parameters ......................................................................... 70
Table 4.2: Test Compound First-Order Transformation Rates ........................................................................... 81
Table 4.3: Average Test Compound Concentrations of Trace Organic Compounds in Open-Water Cell ........ 82
Table 4.4: Wetland Temperatures ....................................................................................................................... 87
Table 4.5: Sorbed Test Compound Concentrations in Open-Water Wetland ..................................................... 90
Table 5.1: QPCR Primers and Thermal Profiles ............................................................................................... 100
Table 5.2: Typical Open-Water Cell Influent Water Quality Parameters ........................................................ 105

vii
ACKNOWLEDGMENTS
David Sedlak was an excellent thesis advisor, allowing me to explore my own ideas
while ensuring that my work was relevant and rigorous. Kara Nelson, Jim Hunt, Josh Sharpe,
John Coates, Gary Sposito, and Lisa Alverez-Cohen all provided valuable comments and
suggestions on my work throughout my time at Berkeley.
This project would not have been possible without Alex Horne’s creative genius, who
designed the Discovery Bay wetlands and contributed to my work throughout the project. Virgil
Koehne, the town manager of Discovery Bay, advocated for the use of treatment wetlands to
provide sustainable wastewater treatment, in addition to keeping the wetlands running and in
good shape.
I learned a great deal from fellow graduate students and post-doctoral researchers,
including but not limited to, Anh Pham, Scott Mansell, Eva Agus, Patrick Ulrich, Erika Houtz,
Amanda Greenleaf, Ekrem Karpuzcu, Haizhou Liu, Christy Keenan Remucal, Joonseon Jeong,
Jannis Wenk, Tom Bruton, Janel Grebel, Tom Hennebel, Sun Bohit, James Barazesh, Jean Van
Buren, Joe Charbonnet, Carsten Prasse, Katie Harding, Andy Torkelson, Shan Yi, Wei Yi, Will
Tarpeh, and Aidan Cecchetti. Mi Nguyen and Samantha Bear deserve a special shout out for
their long hours spent collecting field samples and maintaining the Discovery Bay wetlands.
Zack Jones contributed his insight and ideas into microbiological aspects of all of my work.
My parents, sister, and friends have encouraged me constantly, and I am forever grateful
to them.
Marisa, my wife, has been a source of inspiration since the day I met her. I am thankful
to have had her support during my time at Berkeley and to have it for the rest of our life together.

1
CHAPTER 1. Introduction
1
2

2
1.1 Wastewater-Derived Trace Organic Contaminants
Municipal wastewater effluent contains thousands of trace organic contaminants at 3 concentrations ranging from 10-9 to 10-6 grams-per-liter (Table 1.1). Many of these compounds 4 are classified as pharmaceuticals and personal care products, a family of compounds that can 5 elicit biological responses at relatively low concentrations. During conventional activated 6 sludge treatment, these compounds are typically only partially removed via sorption and 7 biotransformation, due to their relatively low affinity for organic-rich particles and resistance to 8 biotransformation (Daughton and Ternes, 1999; Ternes et al., 2004a). Due to the limited 9 removal of trace organic contaminants during wastewater treatment, wastewater-derived trace 10 organic contaminants are frequently detected in surface waters that receive wastewater effluent 11 (Kolpin et al., 2002; Kim et al., 2007; Kasprzyk-Hordern et al., 2008). 12
13 Table 1.1: Typical Concentrations of Selected Trace Organic Contaminants in Wastewater
Treatment Plant Effluentsa
Compound name Concentration (µg L-1) Reference
Benzafibrate 0.02-0.07
<0.25-4.6
(Metcalfe et al., 2003)
(Thomas, 1998)
Diclofenac 0.289
0.03-0.07
0.01-0.56
(Roberts and Thomas, 2006)
(Metcalfe et al., 2003)
(Heberer et al., 2001)
Ibuprofen 2.97
0.03
<0.005-0.01
<0.05-1.43
0.002-0.081
0.22±0.15
(Roberts and Thomas, 2006)
(Lin et al., 2005)
(Metcalfe et al., 2003)
(Gans et al., 2002)
(Buser et al., 1999)
(Khan and Ongerth, 2002)
Naproxen 0.017
0.02-0.30
0.35±0.12
<LOD-0.12
>0.05-0.52
(Lin et al., 2005)
(Metcalfe et al., 2003)
(Khan and Ongerth, 2002)
(Heberer et al., 2001)
(Thomas, 1998)
Metoprolol >0.025-2.2 (Hirsch et al., 1996; Thomas,
1998)
Carbamazepine 0.042
0.28-1.11
>0.05-6.3
(Lin et al., 2005)
(Metcalfe et al., 2003)
(Thomas, 1998)
Triclosan 0.01-0.02
0.2-2.7
(Boyd et al., 2003)
(McAvoy et al., 2002) aAdapted from Nikolaou et al. (2007) 14
Acute toxicity tests often fail to detect the subtle effects of trace organic contaminants on 15 aquatic organisms (Daughton and Ternes, 1999; Webb, 2004). More sensitive approaches, 16 while applied less frequently for toxicity assessments, suggest that certain wastewater-derived 17 trace organic contaminants can detrimentally affect aquatic organisms at environmentally- 18 relevant concentrations. For example, steroid hormones such as ethinyl estradiol, one of the 19 active ingredients in birth control, cause feminization of certain fish species at nanogram-per- 20

3
liter concentrations (Purdom et al., 1994). Exposure to microgram-per-liter concentrations of 21 pharmaceuticals, such as metoprolol and carbamazepine, can result in ultrastructural damage to 22 fish organs (Triebskorn et al., 2007). Pharmaceuticals may also cause more subtle effects, such 23 as altering fish feeding and social behavior (Brodin et al., 2013). In the environment, trace 24 organic contaminants are present as a mixture of compounds, which may have an additive effect 25 on aquatic organisms (Schnell et al., 2009). Environmental risk assessments in rivers generally 26 predict significant risk to aquatic organisms downstream of wastewater treatment plants (e.g., 27 Table 1.2), supporting the assertion that trace organic contaminants in wastewater effluent are 28 detrimental to aquatic ecosystems (Jones et al., 2002; Hernando et al., 2006; Ginebreda et al., 29 2010). 30
31 Table 1.2: Potential Ecological Risk of Pharmaceuticals in Environmental Compartmentsa
Therapeutic
Group
Pharmaceutical Ecological Riskb
Group Wastewater Surface Water Sediment
Antibiotics Erythromycin High
Oxytetracycline Medium
Flumequine Medium
Analgesics Ibuprofen High High
Diclofenac High High
Naproxen High High
Ketoprofen High High
Lipid
regulators
Gemfibrozil High
Clofibric acid High
β-Blockers Propranolol High Medium
Metoprolol High
Antiepileptics Carbamazepine High High aAdapted from Hernando et al. (2006). bEcological risk is calculated by the ratio of the measured 32 environmental concentration of a pharmaceutical to its predicted no-effect concentration. Compounds 33 with ratios of <0.1 are considered low risk; ratios of 0.1-1 are considered medium risk; ratios >1 are 34 considered high risk. 35
Humans may be exposed to wastewater-derived trace organic contaminants via 36 consumption of drinking water from a source that is subjected to upstream effluent discharge or 37 fish from effluent-impacted surface waters. Thus far, risk assessments have suggested that 38 human pharmaceuticals in drinking waters pose no appreciable health risks to humans (Schwab 39 et al., 2005; Cunningham et al., 2009). However, other wastewater-derived trace organic 40 compounds could be present at concentrations that pose health risks. For example, the 41 carcinogen nitrosodimethylamine (NDMA) is often present in wastewater effluent at 42 concentrations that exceed health guidelines for drinking water (Mitch et al., 2003). The 43 presence of wastewater-derived trace organic contaminants is a particular concern for potable 44 water reuse projects, because the presence of these compounds can cast doubt on their safety 45 (Snyder et al., 2003; Toze, 2006; National Research Council, 2012). 46
47

4
Conventional secondary wastewater treatment (i.e., activated sludge) typically results in 48 less than 50% removal of trace organic contaminants (Figure 1.1). A variety of methods 49 designed to be applied after conventional municipal wastewater treatment can remove 50 wastewater-derived trace organic contaminants, but these treatments are often energy intensive 51 and produce significant amounts of greenhouse gases (Jones et al., 2007). In addition, they may 52 generate disinfection by-products or solid waste that requires disposal For example, ozone 53 doses similar to those used for disinfection can remove more than 80% of most trace organic 54 contaminants from wastewater effluent (Ternes et al., 2003; Snyder et al., 2006; Hollender et 55 al., 2009). However, the use of ozone requires expensive upgrades to wastewater treatment 56 plant infrastructure, and may result in the formation of by-products such as bromate (von 57 Gunten and Hoigne, 1994). Activated carbon can also remove many trace organic contaminants 58 from wastewater effluent (Snyder et al., 2007), but the sorption capacity of activated carbon is 59 quickly saturated, requiring disposal or energy for regeneration (Suárez et al., 2008). Treatment 60 wetlands have been suggested as an alternative approach for removing trace organic 61 contaminants from wastewater effluent, due to their low operating costs and energy 62 requirements. However, trace organic contaminant removal mechanisms in wetlands are 63 currently not well understood, and most wetlands are not designed to treat trace organic 64 contaminants (see Chapter 2.2). 65
66
67
Figure 1.1. Box plot comparing trace organic contaminant removal efficiencies of wastewater
treatment technologies (whiskers, 10th-90th percentile; boxes 25th-75th percentile; solid line,
median). MBR=Membrane bioreactor. Adapted from Oulton et al. (2010).
68
69
70
71

5
1.2 Treatment Wetlands
Treatment wetlands have been used to treat wastewater or wastewater effluent for over 72 50 years (Vymazal, 2010). Due to their long hydraulic residence times (~3-7 days), high 73 productivity, and diverse microbial communities, treatment wetlands can remove a wide range of 74 contaminants from wastewater effluent. Historically, treatment wetlands were used to remove 75 organic matter (i.e., biological oxygen demand), metals, and nutrients from wastewater effluent. 76 Treatment wetlands also offer a number of ancillary benefits including green space for 77 recreational opportunities, wildlife viewing, and habitat creation (Fleming-Singer and Horne, 78 2006). 79
80 Commonly employed wetland designs include free water surface wetlands and subsurface 81
flow wetlands. Subsurface flow wetlands are advantageous in situations in which there is a need 82 to limit access of humans or animals to the water, as when the wastewater has only been partially 83 treated. However, the cost of the additional material necessary to fill the wetland (e.g., gravel) 84 limits the practical size of subsurface flow wetlands. Thus, free-surface flow wetlands are often 85 preferred for large projects (Kadlec, 2009). 86
87 Free water surface wetlands are typically planted with emergent macrophytes which 88
provide a carbon source for microbial communities. Macrophyte choice may affect removal 89 rates of certain contaminants. For example, plants with high acid soluble carbon contents may 90 enhance denitrification (e.g., Typha sp.) (Bachand and Horne, 2000), while plants rich in lignin 91 may be better suited for sorption of contaminants (e.g., Scripus sp.) (Horne and Fleming-Singer, 92 2005). In addition to macrophyte choice, wetland hydraulics are critical to free water surface 93 wetland treatment efficiency. Preferential flow paths through vegetation can lead to hydraulic 94 short-circuiting, which can drastically reduce wetland performance (See Chapter 2.2). 95
96 In the United States, treatment wetlands are commonly employed for the removal of 97
nutrients from wastewater effluent. Nitrate is removed mainly via microbial denitrification in 98 anaerobic zones within wetlands. Phosphate may be removed via sorption, precipitation, or 99 uptake, although in most cases the phosphate removal capacity of a wetland is quickly saturated, 100 and thus wetlands are not typically a sustainable approach for phosphate removal (Vymazal, 101 2007). Treatment wetlands are also capable of removing many other contaminants from 102 wastewater effluent, including metals via precipitation of metal sulfides (Kadlec and Wallace, 103 2009), and pathogens (see Chapter 2). In addition to treating wastewater effluent, wetlands are 104 sometimes used to treat primary or secondary wastewater, reducing biological oxygen demand, 105 in addition to removing other contaminants (Solano et al., 2004). 106
107 Treatment wetlands have also been considered for the removal of trace organic 108
contaminants from wastewater. Wetlands receiving wastewater effluent have been reported to 109 remove more than 70% of certain trace organic contaminants (Li et al., 2014; Verlicchi and 110 Zambello, 2014). In some situations wetlands can achieve higher trace organic contaminant 111 removal efficiencies than conventional wastewater treatment plants (Figure 1.2). However, trace 112 organic contaminant removal efficiencies differ drastically among wetland systems (see Chapter 113 2), because wetlands often are not optimized for trace organic contaminant removal. Trace 114 organic contaminant removal in treatment wetlands is typically ascribed to sorption, uptake by 115 plants, biotransformation, and in wetlands with open-water sections, photolysis. However, the 116

6
relative importance of these mechanisms is often unknown. Of these mechanisms, only 117 biotransformation and photolysis are sustainable, since sorption and uptake capacities will 118 quickly be saturated if not coupled to biotransformation. Each of these mechanisms is 119 considered in detail in Chapter 2. 120
121
Figure 1.2: Comparison of trace organic contaminant removal efficiencies in treatment wetlands
and conventional wastewater treatment plants (WWTPs). Adapted from Li et al. (2014).
122 1.3 Motivation and Research Objectives
1.3.1 Motivation
Treatment wetlands are an attractive option for removing nutrients from wastewater 123 effluent, due to their low cost and energy requirements. In addition, they offer ancillary benefits, 124 such as the creation of wildlife habitat and recreational opportunities. When properly designed, 125 treatment wetlands also may remove wastewater-derived trace organic contaminants. However, 126 wetlands are currently not designed to exploit many potential trace organic contaminant removal 127 mechanisms, such as photolysis and biotransformation. 128
129 Photolysis is an important removal mechanism for many trace organic contaminants in 130
lakes and shallow streams. However, in vegetated wetlands, photolysis is ineffective due to 131 shading of the water column by emergent vegetation and deep water. In addition, many trace 132 organic contaminants undergo biotransformation at enhanced rates under aerobic conditions, for 133 example during certain wastewater treatment processes, as compared to under anaerobic 134

7
conditions. Vegetated wetlands, however, are typically designed to be dominated by anaerobic 135 zones, which may limit the biotransformation rates of trace organic contaminants. 136
137 In order to enhance trace organic contaminant removal, treatment wetlands can be 138
designed as a series of unit process wetland cells, with each cell optimized to remove 139 contaminants via specific mechanisms. In this manner, vegetated wetlands that allow for 140 contaminant removal under anaerobic conditions (e.g., via denitrification) can be put in series 141 with novel wetland cells that enhance other removal mechanisms, such as photolysis and aerobic 142 biotransformation. The resulting unit process wetland can provide more efficient and reliable 143 removal of a wider range of contaminants than a single type of wetland, or than a wetland 144 constructed following “natural design”. 145
146 Open-water wetland cells are a novel type of treatment wetland that could provide an 147
effective means of removing trace organic compounds by exploiting photolysis and aerobic 148 biotransformation. These wetland cells consist of shallow basins lined with a geotextile fabric to 149 prevent the growth of emergent macrophytes, allowing sunlight to penetrate the shallow water 150 column. Sunlight transforms trace organic contaminants via photolysis, and it enables the 151 growth of a diffuse photosynthetic biomat on the wetland bottom. Trace organic contaminants 152 can be transformed via biotransformation within the biomat, and transformation rates may be 153 enhanced by the oxic conditions produced by photosynthesis. In addition, nutrients may be 154 removed in the wetland biomat. Incorporation of open-water wetlands into unit process wetlands 155 has the potential to enhance the removal efficiency of trace organic contaminants as well as 156 nutrients in treatment wetlands. 157
1.3.2 Objective 1: Critically Review Literature on Trace Organic Contaminant Removal in
Treatment Wetlands
To provide a foundation for identifying the best approach for removal of trace organic 158 contaminants, a critical review of the literature on treatment wetlands was undertaken. Trace 159 organic contaminants could be broadly categorized as easily removed regardless of treatment 160 wetland design (>60% removal), moderately removed in most studies (40-60% removal), or 161 recalcitrant to removal regardless of wetland design (<40% removal). Possible trace organic 162 contaminant removal mechanisms were evaluated, including sorption, biotransformation, and 163 photolysis. Sorption was found to provide only limited removal of trace organic contaminants, 164 since the sorptive capacity of wetlands is quickly saturated. Biotransformation was determined 165 to be the most important removal mechanism for trace organic contaminants in vegetated 166 wetlands. Nonetheless, removal rates of many contaminants were enhanced under aerobic 167 conditions, as opposed to the anaerobic conditions typical of vegetated wetlands. Due to shading 168 by emergent vegetation, removal of trace organic contaminants and pathogens via reaction with 169 sunlight in vegetated wetlands was found to be insignificant. However, photolysis is known to 170 remove certain photo-labile trace organic contaminants and pathogens in shallow streams or 171 open-water bodies. Based on these conclusions, methods to enhance trace organic contaminant 172 removal efficiencies in wetlands were suggested, including through the development of novel 173 wetland cells, such as open-water cells. 174
175

8
1.3.3 Objective 2: Evaluate Photolysis of Trace Organic Contaminants in Open-Water Wetland
Cells
To determine design parameters for open-water cells, photolysis of a suite of trace 176 organic contaminants in open-water wetland cells was evaluated. A model for trace organic 177 contaminant photolysis in wetlands was developed using values from the literature and from 178 laboratory experiments, and this model was validated using a solar simulator. Model parameters, 179 such as wetland depth, pH, dissolved organic carbon content, and nitrate concentration, were 180 then varied to determine the optimal conditions for the removal of trace organic contaminants 181 through photolysis in open-water wetlands. Using this information, the wetland area necessary 182 to achieve efficient removal of trace organic contaminants (i.e., 90% removal from 1 million 183 gallons per day (MGD) of wastewater effluent: A90
1 ) was estimated and compared to the size of 184 existing full-scale wetlands. 185
1.3.4 Objective 3: Evaluate Biotransformation of Trace Organic Contaminants in Open-Water
Wetland Cells
Trace organic contaminants may be removed by microbial transformation in the diffuse 186 biomat that forms on the bottoms of open-water wetland cells. To evaluate the extent of 187 biotransformation, removal rates of a suite of trace organic contaminants were measured in 188 laboratory microcosms, as well as in a pilot-scale open-water wetland cell. By illuminating 189 microcosms with visible light at wavelengths that did not cause photolysis, it was possible to 190 evaluate the effect of photosynthesis on the biotransformation and sorption of trace organic 191 contaminants. Comparison of removal rates of ambient trace organic contaminants in the pilot- 192 scale wetland to removal rates predicted by microcosm experiments and a photolysis model 193 verified predictions of the removal mechanisms of each test compound. Removal rates in open- 194 water wetlands were compared to rates in vegetated wetland cells, and the area necessary for 195 efficient removal of test compounds (A90
1 ) was estimated. 196
1.3.5 Objective 4: Evaluate Nitrate Removal in Open-Water Wetlands
Nitrate removal is one of the primary objectives of many treatment wetlands. Although 197 open-water wetlands were designed to maximize trace organic contaminant and pathogen 198 removal, the removal of nitrate would enable them to be included in unit process wetland 199 systems without sacrificing nitrate removal. To evaluate the potential for nitrate removal in 200 open-water cells, nutrient fluxes were monitored in a pilot-scale system over a 3-year period. 201 Seasonal nitrate removal rates were calculated and their temperature dependence was 202 determined. Microcosm experiments, in addition to mass balances on carbon, nitrogen, and 203 phosphorus, provided a means of calculating the importance of sedimentation, microbial 204 denitrification, and anammox to nitrate removal. The wetland size necessary for efficient 205 wetland removal (A90
1 ) of nitrate was estimated and compared to A901 values for vegetated 206
wetland systems. 207
208

9
CHAPTER 2. Unit process wetlands for removal of trace organic
contaminants and pathogens from municipal wastewater effluents.
Reproduced with permission from Jasper, J.T.; Nguyen, M.T.; Jones, Z.L.; Ismail, N. S.; Sedlak,
D.L.; Sharp, J.O.; Luthy, R.G.; Horne, A.J.; Nelson, K.L. Unit process wetlands for removal of
trace organic contaminants and pathogens from municipal wastewater effluents. Environ. Eng.
Sci. 2013, 30, 421-436.
© 2013 Mary Ann Liebert, Inc. publishers.
209 210 211 212 213 214 215 216 217 218 219 220 221 222 223 224 225 226 227 228 229 230 231 232 233 234 235 236 237 238 239 240 241

10
2.1 Background
Attempts by scientists to estimate the value of ecosystem services provided by natural 242 wetlands rank them among the most valuable land on earth (Costanza et al., 1997). They have 243 been called “nature’s filters”, and the role that natural wetlands play in water purification is part 244 of the justification for their protection and restoration. In an attempt to harness these properties, 245 treatment wetlands have been built for a wide range of applications to improve water quality, 246 including treatment of industrial and municipal wastewater, as well as stormwater, agricultural 247 runoff, and acid mine drainage (EPA, 1993; Vymazal, 2009; Malaviya and Singh, 2012). 248 Wetlands are becoming an increasingly popular option with water agencies because of their low 249 operation cost, energy consumption, and environmental impact (Gearheart, 1999; Fuchs et al., 250 2011). In addition, wetlands provide ancillary benefits, such as the creation of aesthetically 251 appealing green spaces and wildlife habitat (Fleming-Singer and Horne, 2006). Wetlands 252 specifically designed for treatment of municipal wastewater effluent have been used for at least 253 five decades for the removal of suspended solids, biochemical oxygen demand (BOD), nutrients, 254 metals, and pathogens (Mitsch and Gosselink, 2007; Kadlec and Wallace, 2009; Vymazal, 2010). 255
256 Many of the treatment wetlands built in the second half of the 20th century consisted of 257
relatively small plots of land, typically less than 5 hectares (EPA, 2000b; Kadlec, 2012). More 258 recently, the size of treatment wetlands has expanded with systems covering as much as 259 475 hectares and treating up to 2.5x10⁵ m3d-1 (60 MGD) of wastewater effluent, or effluent- 260 dominated river water (Table 2.1). The main purpose of these large wetland systems is typically 261 a combination of nutrient removal and habitat creation. Increasingly, the removal of trace 262 organic contaminants and pathogens is also invoked as a benefit. This new trend, coupled with 263 the continued construction of smaller treatment wetlands, indicates that treatment wetlands are 264 becoming an important part of urban water infrastructure. Despite their increasing popularity, 265 many barriers still prevent them from realizing their full potential for improving water quality 266 and enhancing aquatic habitat. 267
268 One of the most significant barriers to the use of treatment wetlands is the difficulty of 269
designing wetlands with predictable performance. Compared to mechanical unit treatment 270 processes, the ecological, transport, and transformation processes occurring in treatment 271 wetlands are even more complex and are not fully understood. For some constituents researchers 272 have made progress understanding the detailed transformation mechanisms, including models 273 that account for the complexity (e.g., Wang and Mitsch, 2000; Howell et al., 2005). However, 274 such complex models cannot be used for design purposes because they are too difficult to 275 parameterize. Nonetheless, the insights provided by mechanistic research can provide the 276 foundation for designing unit process treatment wetlands, with each unit process tailored to the 277 treatment of a specific set of contaminants, by identifying the most important parameters 278 controlling performance. This unit process approach is not meant to undervalue the complexity 279 of wetland ecosystems. Rather, by optimizing specific transformation mechanisms in unit 280 process cells, they can be more easily integrated with other mechanical or natural treatment 281 systems to provide treatment trains with predictable performance. 282
283 For example, mechanistic research coupled with studies of full-scale systems has led to 284
robust design approaches for unit process wetlands for denitrification (Kadlec, 2012). Such 285 denitrification wetlands can be used to treat nitrified effluent from mechanical wastewater 286

11
treatment plants (e.g., Table 2.1), or they can be staged after shallow aerobic nitrification 287 wetlands (Hammer and Knight, 1994; Vymazal, 2007). Similarly, hybrid wetlands comprised of 288 a vertical flow cell and a cell with calcite media have been shown to be effective at removing 289 both BOD and phosphorus from wastewater (Arias et al., 2003). In addition, deep detention 290 ponds for particle removal and anaerobic digestion of solids prior to vegetated wetlands and slow 291 sand filters have been suggested to provide efficient treatment of municipal wastewater (Horne 292 and Fleming-Singer, 2005). 293
294 Table 2.1: Examples of Large, Full-Scale Treatment Wetlands in the United States.
Wetland
Name
Location
Year Started
Size
(ha)
Flow
(m3/d)
Stated Purpose
Easterly1 Orlando, FL
1987
475 8x10⁴ Nutrient removal from wastewater
before release to the sensitive St.
Johns River; wildlife habitat
Prado2 Riverside, CA
1992
200 2.5x10⁵ Nitrate removal from effluent-
dominated Santa Ana River prior to
Prado dam, which is used for
aquifer recharge; wildlife habitat
George
W.
Shannon3
Tarrant
County, TX
2002
180 4x10⁵ Suspended solid and nutrient
removal from effluent-dominated
Trinity River prior to reservoirs;
wildlife habitat; education
1 http://www.trwd.com/Wetlandsoverview.aspx 295 2 http://www.ocwd.com/Prado-Wetlands/ca-28.aspx 296 3 http://www.dep.state.fl.us/water/wastewater/dom/oreastwet.htm 297 298
299 Despite the increasing use of unit process wetlands for nutrient and BOD removal, 300
current understanding of removal mechanisms in wetlands for certain classes of contaminants 301 has not yet been translated into the design of unit process wetlands. This critical review focuses 302 on the application of surface flow unit process wetlands to the removal of two such classes of 303 contaminants, trace organic compounds and pathogens, from wastewater effluent and effluent- 304 dominated river water. Trace organic contaminants are an emerging concern, due to their 305 negative effects on aquatic ecosystems and the inability of conventional wastewater treatment 306 plants to provide adequate removal. Pathogens and indicator organisms, on the other hand, are 307 an historical concern, but removal by wetlands is often poor. 308
309 This paper starts with a review of hydraulics in surface flow constructed wetlands, given 310
their central role in treatment performance. Next, the reported removals of trace organic 311 contaminants and pathogens in wetlands is summarized, followed by a review of the main 312 removal mechanisms such as sorption and sedimentation, biotransformation and predation, and 313 photolysis and photoinactivation. Gaps in knowledge are identified for future research that can 314 lead to identifying the controlling factors so that effective unit process wetlands and treatment 315

12
trains can be developed. The final section provides suggestions for how these treatment 316 mechanisms can be enhanced in commonly employed unit process wetland cells or how they 317 might be harnessed in novel unit process cells. It is hoped that the application of the unit process 318 concept to a wider range of contaminants will lead to more widespread application of wetland 319 treatment trains as components of urban water infrastructure in the United States and around the 320 globe. 321 322 2.2 Hydraulics of Surface Flow Wetlands
Inefficiencies in hydraulics are a major barrier to optimizing the removal of contaminants 323 in treatment wetlands, including trace organics and pathogens. Theoretically, the most effective 324 wetland design would employ plug flow conditions to ensure that all water receives an equal 325 amount of time for treatment. However in practice, plant growth rapidly results in conditions 326 that deviate from ideal. In particular, hydraulic short-circuiting can dramatically decrease the 327 overall performance of a wetland cell. Because this limitation to wetland treatment has been 328 recognized for decades, models have been developed to account for the effects of dispersion due 329 to vegetation, wind, and wetland boundaries (Kadlec, 1994). While these models are an 330 improvement over ideal reactor models and offer insight into flow patterns in wetlands, the 331 complex effects of heterogeneous and dynamic flow patterns are more difficult to model 332 accurately. 333
334 Short-circuiting is the result of preferential flow paths through a wetland, which are 335
caused primarily by uneven plant distribution and channelized flow (Kjellin et al., 2007; 336 Lightbody et al., 2008). Short-circuiting results in water having a range of residence times in a 337 wetland, reducing the wetland’s treatment efficiency (Keefe et al., 2004; Wörman and Kronnäs, 338 2005). This is especially detrimental for wetlands designed to remove waterborne pathogens, 339 which require reductions in concentration of several orders of magnitude to provide effective 340 treatment and thus are severely compromised by even a modest amount of short-circuiting. To 341 demonstrate this point, consider a wetland that is designed to provide 4-log removal (99.99%) of 342 a pathogen under ideal, plug flow conditions. If just 20% of the flow has one-eighth of the 343 nominal residence time, as observed by Lightbody et al. (2008) in a recently constructed 344 wetland, the actual removal will only be about 1-log (90%). 345
346 The degree of short-circuiting in full-scale wetlands is usually evaluated with tracer 347
studies (Martinez and Wise, 2003; Lin et al., 2003). While tracer studies provide an 348 understanding of how far the system deviates from ideal, more complicated models are necessary 349 to predict contaminant treatment efficiency, as water flowing via different paths may be 350 subjected to diverse biogeochemical conditions, resulting in variable treatment (Kadlec, 2000; 351 Harvey et al., 2005). For example, Keefe et al. (2004) modeled the reactive transport of 352 rhodamine WT in three wetlands using a solute transport model with transient storage. Results 353 showed that rhodamine WT loss rates via photolysis and sorption differed in storage and main 354 channel zones, with sorption mass transfer rates being a factor of two higher in storage zones 355 than in the main channel, and photolysis rates in the storage zones being almost an order of 356 magnitude lower than those occurring in the main channel. Thus, an understanding of both the 357 flow distributions and the removal processes at work in these different wetland zones was 358 necessary to accurately interpret tracer test results. 359

13
Although short-circuiting cannot be eliminated, it can be reduced by proper wetland 360 design. Consideration of soil conditions prior to wetland construction, such as filling ditches that 361 would channelize flow (Martinez and Wise, 2003), can reduce short-circuiting. Baffles can also 362 be used to increase the wetland’s length-to-width ratio (aspect ratio), thereby reducing short- 363 circuiting and encouraging plug flow conditions at a lower cost than building long, narrow 364 wetlands (Reed et al., 1995; Persson, 2000; Shilton and Harrison, 2003). Knight (1987) 365 calculated that an aspect ratio of 2:1 would maximize wetland performance while minimizing 366 construction costs. However, other aspect ratios may be appropriate when there is a need to 367 significantly reduce contaminant concentrations (e.g., in the case of pathogens) and further 368 research is needed to determine the optimal aspect ratio in these cases. The use of a subsurface 369 berm or island placed in front of the wetland inlet also may reduce short-circuiting and improve 370 hydraulic performance (Persson, 2000). 371
372 Despite careful wetland design, flow irregularities will still develop over time as plants 373
grow. Flow irregularities may be minimized by using deep transverse mixing zones and other 374 structures to break wetlands into multiple smaller cells. These zones improve wetland 375 performance by mixing water that has traveled through different flow paths, as well as by 376 reducing the likelihood that fast flow paths will be aligned (Lightbody et al., 2007, 2009). 377 Breaking a wetland into multiple cells has a similar effect, disrupting high-speed flow paths and 378 ensuring that water is well mixed between cells (Kadlec, 2000; Horne and Fleming-Singer, 379 2005). 380
381 Periodic maintenance can also be used to control short-circuiting. For example, at the 382
Prado Treatment Wetlands in Southern California, emergent plants are removed during 383 maintenance activities (Scott Nygren, Orange County Water District, personal communication, 384 March 13, 2012). This process involves draining the cell, allowing it to dry for several weeks 385 and using a mower designed for brush removal to cut the plants near the ground surface. At the 386 Easterly Wetlands in Central Florida, wetland plants are occasionally burned to thin the density 387 of accumulated plants. 388
389 Incorporating multiple wetland cells is a fundamental component of the unit process 390
wetland design. By linking unit process wetland cells in series, designing cells to have deep 391 zones and baffles, considering the effects of inlet and outlet structures, and providing adequate 392 maintenance, inefficiencies introduced by hydraulic short-circuiting can be minimized. Further 393 research is needed to identify cost-effective maintenance practices that will minimize hydraulic 394 short-circuiting. 395
396 2.3 Contaminants of Concern
2.3.1 Trace Organic Contaminants
Municipal wastewater effluent typically contains relatively low levels of organic matter 397 (i.e., most wastewater treatment plants achieve BOD <10 mg L-1). In addition to the 398 biopolymers and residual organic waste that make up the bulk of the biodegradable organic 399 matter, wastewater effluent also contains an assortment of trace organic contaminants, such as 400 pharmaceuticals and personal care products (Kolpin et al., 2002; Ternes et al., 2004b). Trace 401 organic contaminants in wastewater effluent are an issue of concern due to their potential to 402

14
cause adverse impacts to aquatic organisms at low concentrations (Daughton and Ternes, 1999; 403 Suárez et al., 2008) as well as their potential to contaminate downstream drinking water supplies 404 (Snyder et al., 2003). 405
406 The ability of constructed wetlands to remove trace organic contaminants from 407
wastewater effluent has received growing attention recently (Matamoros and Bayona, 2008). 408 Removal efficiencies for some pharmaceuticals and personal care products in treatment wetlands 409 (Figure 2.1) suggest that trace organic contaminants generally fall into to one of three groups of 410 removal efficiency. The first group of compounds is removed efficiently (i.e., > 60% removal) 411 regardless of wetland design and includes substances such as caffeine and naproxen. The second 412 group, which includes the majority of the compounds in Figure 2.1, exhibits partial removal with 413 varying efficiencies depending on wetland design and hydraulic residence times. The final group 414 of compounds, which includes carbamazepine and clofibric acid, are more recalcitrant and 415 exhibit limited removal (i.e., typically < 40% removal) irrespective of wetland design. Note that 416 some values were determined from studies in subsurface wetlands, but they are included here 417 because data from surface flow wetlands has not been reported. Optimization of treatment 418 wetlands has the highest potential for enhancing the removal of the compounds in the second 419 group. 420
2.3.2 Waterborne Pathogens
Wastewater effluent contains potentially infectious microorganisms, including viruses, 421 bacteria, protozoan (oo)cysts, and helminth eggs. Removal or inactivation of pathogens is 422 therefore necessary before treated effluent is discharged or reused. Treatment wetlands that 423 receive wastewater that has already been disinfected may provide additional treatment of 424 pathogens that are resistant to disinfection (e.g., Cryptosporidium oocysts for chlorine or 425 adenovirus for UV). In this case, a wetland may be used to reduce the chemical disinfection 426 requirements and provide an additional treatment barrier. Alternatively, treatment wetlands that 427 receive wastewater effluent that has not been disinfected can play a primary role in pathogen 428 attenuation. In this context, Gersberg et al. (1989) suggested that treatment wetlands with 429 hydraulic residence times of 3 to 6 days may be as effective as conventional water treatment 430 systems employing disinfection for the removal of pathogenic bacteria and viruses. Reliance on 431 polishing wetlands for disinfection has the advantage over chlorination of avoiding the 432 production of disinfection byproducts (Buth et al., 2009, 2010). 433
Most studies on the removal of pathogens in treatment wetlands have measured fecal 434 indicator bacteria rather than actual pathogens. The reported removal efficiency of fecal 435 coliforms by surface wetlands is around 1-log removal (Vymazal, 2005; Kadlec and Wallace, 436 2009). The few studies that have been conducted with actual pathogens (Figure 2.2) show 437 removal efficiencies up to 2-log, with average values around 1-log. The dominant removal 438 mechanisms vary dramatically among pathogen groups. A better understanding of pathogen 439 removal mechanisms, including attachment and sedimentation, predation, and photoinactivation, 440 and their effectiveness for different pathogen groups is needed to improve the ability to design 441 unit process wetlands for disinfection. 442
443 444

15
445
Figure 2.1: Averages pharmaceutical and personal care product removal efficiencies in
treatment wetlands. Error bars represent ± one standard deviation. n=3-16. References: a (Gray
and Sedlak, 2005); b (Song et al., 2011); c (Breitholtz et al., 2012); d (Park et al., 2009); e
(Camacho-Muñoz et al., 2012); f (Hijosa-Valsero et al., 2011); g (Matamoros and Bayona,
2006); h (Matamoros et al., 2007); i (Matamoros et al., 2009); j (Llorens et al., 2009); k
(Matamoros et al., 2005); l (Matamoros et al., 2008b); m (Waltman et al., 2006).
446
447

16
448
Figure 2.2: Averages with standard deviations of pathogen removal efficiencies in surface flow
wetlands receiving non-disinfected influent. References: a (Mandi et al., 1996); b (Mandi et al.,
1998); c (Reinoso et al., 2008); d (Falabi et al., 2002); e (Gerba et al., 1999); f (Quiñónez-Díaz
et al., 2001); g (Herskowitz, 1986); h (Hill and Sobsey, 2001); i (Song et al., 2010); j (Karpiscak
et al., 2001); k (Kadlec and Wallace, 2009).
449

17
2.4 Removal Mechanisms of Trace Organic Contaminants
2.4.1 Sorption
Sorption of trace organic contaminants encompasses two distinct processes. Adsorption 450 involves the interaction of a compound with a surface, typically via ion exchange or surface 451 complexation, while absorption entails partitioning into a particle-associated organic phase. 452 Sediments and biofilms in treatment wetlands provide numerous surfaces that may be capable of 453 sorbing trace organic contaminants. If the contaminants exhibit a high affinity for a surface, they 454 will eventually be buried as decaying plant litter accumulates in the wetland. If the sorbent does 455 not degrade, the contaminants will remain in the litter layer until it is removed as part of wetland 456 maintenance activities. If the contaminants are weakly associated with the sorbent, or if the 457 sorbent (e.g., plant litter) degrades, the process may simply slow the movement of contaminants 458 through a wetland, providing more time for other transformation processes to occur. 459
460 Although sorption is assumed to be important to trace organic contaminant fate in 461
treatment wetlands (Imfeld et al., 2009), few studies have investigated it specifically. In these 462 studies log Kow, a measure of a contaminant’s hydrophobicity, generally predicts which 463 contaminants are most susceptible to absorption. For example, in a bulrush-dominated surface 464 flow wetland with a 30 cm deep gravel bed, the hydrophobic phthalate esters and fragrance 465 molecules (log Kow>4) were absorbed to organic matter in the gravel bed as well as suspended 466 particles (Reyes-Contreras et al., 2011). Absorption was also found to slow the movement of 467 two steroid hormones (log Kow≈ 4) relative to a conservative tracer in a densely vegetated surface 468 flow wetland (Gray and Sedlak, 2005). 469
470 Removal of chemical contaminants by absorption may be more important in subsurface 471
flow wetlands, where flowing water encounters higher densities of particulate organic matter. 472 For example, partial removal of the recalcitrant contaminant carbamazepine (log Kow≈2.5) by 473 absorption and negligible sorptive removal of less hydrophobic contaminants was observed in a 474 study of a subsurface flow treatment wetland (Matamoros et al., 2005). 475
476 Studies of pesticide sorption in agricultural wetlands show a similar dependence on 477
contaminant hydrophobicity (Kruger et al., 1996; Moore et al., 2002; Reichenberger et al., 478 2007). For example, sorption of the herbicide atrazine (log Kow=2.75) to soil, litter, peat, and 479 sediments from three Midwest wetlands was well described for all sorbents by an organic 480 carbon-normalized distribution coefficient (KOC=760 L kg-1 OC) (Alvord and Kadlec, 1995). 481 Given this distribution coefficient, a wetland with about 2 kg m2 litter, containing about 40% 482 organic carbon (Alvord and Kadlec, 1995), and a depth of 40 cm, would be capable of absorbing 483 more than 60% of atrazine from the aqueous phase. This suggests that absorption in wetlands 484 could be significant for compounds with a log Kow greater than about 2.5, provided that the 485 system is designed properly. For comparison, absorption of trace organic contaminants in 486 activated sludge treatment plants is usually unimportant for compounds with log Kow values less 487 than about 4 (Ternes et al., 2004a; Wick et al., 2009). 488
489 Less hydrophobic compounds have been found to adsorb via specific ionic interactions 490
with activated sludge in treatment plants (Stuer-Lauridsen et al., 2000; Golet et al., 2003) and 491 soils (Tolls, 2001). In wetlands, the relatively hydrophilic fluorescent dye, rhodamine WT, sorbs 492

18
significantly to plants and sediments (Lin et al., 2003; Keefe et al., 2004). At neutral pH values, 493 rhodamine WT contains both positively and negatively charged functional groups and is thus 494 likely to be adsorbed via specific interactions with charged functional groups on the sorbents 495 (Kasanavia et al., 1999). Therefore, adsorption of ionic trace organic contaminants in treatment 496 wetlands may be an important loss mechanism for certain compounds. However, additional 497 research is needed to assess the overall importance of this phenomenon and ways in which it 498 could be enhanced through wetland design. 499
500 Certain types of wetland vegetation may increase the removal of trace organic 501
contaminants by sorption. For example, it has been suggested that wetlands dominated by 502 bulrush (e.g., Scripus spp.) are conducive to sorption of trace organic contaminants due to the 503 large amounts of spongy peat formed by decomposing plants (Horne and Fleming-Singer, 2005). 504 Duckweed (Lemna spp.), a floating macrophyte often present in open waters in treatment 505 wetlands, sorbs trace organic contaminants such as halogenated phenols (Tront et al., 2007) and 506 pharmaceuticals and personal care products, including fluoxetine, ibuprofen, and triclosan 507 (Reinhold et al., 2010). However, duckweed grows in a thin layer near the water surface and the 508 relatively small mass of the plant in wetlands likely precludes it from removing a significant 509 fraction of the trace organic contaminants as water passes through a wetland. 510
511 Water chemistry also affects sorption of chemical contaminants in constructed wetlands 512
(Hussain and Prasher, 2011). In particular, the pH of wetland water will affect the sorption of 513 contaminants by changing their speciation. This phenomenon has been observed in wastewater 514 treatment plant sludge for the acidic pharmaceuticals diclofenac (pKa=4.6) and ibuprofen 515 (pKa=3.5), which absorbed to primary sludge to a greater extent than to secondary sludge, 516 because a greater fraction of the pharmaceuticals were in their uncharged form at the lower pH 517 value (pH=6.6 in primary versus pH=7.5 in secondary) (Ternes et al., 2004a). Basic 518 contaminants, such as those containing amine functional groups (e.g., the β-blockers), have pKa 519 values near 9 and are positively charged at neutral pH values. Consequently, their sorption is 520 likely controlled by specific interactions, as was observed in a study by Yamamoto et al. (2009). 521 Increasing the pH of wetland water could increase the fraction of the uncharged forms of the 522 compounds, resulting in enhanced sorption by hydrophobic interactions. Further research is 523 needed to determine the potential for enhancing sorption in treatment wetlands through the use of 524 natural processes to alter pH values (i.e., photosynthesis and microbial respiration). 525 526 2.4.2 Biotransformation
Microorganisms play a prominent role in the attenuation of trace organic contaminants in 527 constructed wetlands (Matamoros et al., 2008b; Hijosa-Valsero et al., 2010b) due to the diversity 528 of microorganisms and enzymatic activities present (D’Angelo, 2003). In surface flow wetlands, 529 biofilms found on roots, stalks, and detritus are more important to biotransformation than 530 planktonic microorganisms (Gagnon et al., 2007; Truu et al., 2009). Thus it is not surprising that 531 properties affecting biofilm growth, such as the attachment matrix, hydraulic conditions, and 532 composition of the wastewater effluent, can strongly influence microbial ecology and 533 contaminant transformation rates in these systems (Truu et al., 2009). 534
535 In vegetated treatment wetlands, the density and type of plants affect microbial 536
community dynamics (Ibekwe et al., 2006; Calheiros et al., 2009) by providing labile forms of 537

19
organic carbon, surfaces for biofilm growth, and oxygen gradients (Reddy and D’Angelo, 1997). 538 The ability of decaying plants to create anoxic zones in surface and subsurface flow constructed 539 wetlands is important to the transformation of trace organic contaminants because some 540 compounds are more readily transformed under aerobic conditions (e.g., ibuprofen) while others 541 (e.g., tonalide and galaxolide) are more readily transformed under anaerobic conditions (Hijosa- 542 Valsero et al., 2010b). Further, anoxic, nitrogen-reducing surface flow wetlands have been 543 shown to be capable of transforming certain trace organic contaminates, including atenolol, 544 naproxen, and triclosan, possibly through amide hydrolysis and reductive dehalogenation (Park 545 et al., 2009). 546
547 Plant biomass and DOC from plant litter, and to a lesser degree, residual organic carbon 548
from wastewater effluent, provide an important energy source and create selective pressure for 549 microbial community structure and function in wetland systems (Shackle et al., 2000; Gutknecht 550 et al., 2006). Biotransformation of pharmaceuticals in wastewater effluent can be affected by 551 both the abundance and source of organic carbon derived from decaying aquatic plants. For 552 example, gemfibrozil and sulfamethoxazole, two compounds that are poorly removed in 553 wastewater treatment plants, showed better removal in the presence of labile organic carbon 554 derived from wetland plants than in the presence of the labile dissolved organic carbon in 555 wastewater effluent (Lim et al., 2008). Other macrophyte characteristics, such as surface area 556 and litter properties, can also affect microbial density (Bastviken et al., 2005), which may 557 correlate with trace organic contaminant removal rates. 558
559 The rhizosphere associated with wetland plants hosts a unique community of 560
microorganisms within aerobic microzones, due to the release of oxygen and nutrient-rich 561 exudates (Brix, 1997; Kyambadde et al., 2004; Münch et al., 2007; Gagnon et al., 2007). 562 Microbially-mediated iron and manganese oxides formed in this region also have the potential 563 for indirect oxidation or enhanced sorption of trace organic contaminants (Mendelssohn et al., 564 1995; Emerson et al., 1999). Rhizosphere-associated transformation appears to be an important 565 process for trace organic contaminants in subsurface flow wetlands (Zhang et al., 2012). 566 However, the rhizosphere may be less important in surface flow wetlands due to limited contact 567 between the rhizosphere and flowing waters. 568
569 Bacteria and fungi transform macromolecules, such as cellulose and lignin, into lower 570
molecular weight compounds through the excretion of extracellular enzymes. Enzyme 571 expression studies in constructed wetlands have provided insight into the importance of 572 extracellular enzyme activity to the processing of these recalcitrant forms of organic carbon 573 (Shackle et al., 2000; Wright and Reddy, 2001; Hill et al., 2006; Francoeur et al., 2006; Rier et 574 al., 2007). Many of the extracellular enzymes used to transform cellulose and lignin (e.g., 575 laccases, phenol oxidases, and peroxidases) also can transform recalcitrant trace organic 576 contaminants (Gianfreda and Rao, 2004; Lu et al., 2009). By modifying the quantity and type of 577 carbon sources in constructed wetlands, it may be possible to increase the activity of 578 extracellular enzymes. Because most extracellular enzymes utilize oxygen or hydrogen peroxide 579 as terminal electron acceptors, their activity is expected to be higher in aerobic environments 580 (Sinsabaugh, 2010; Porter, 2011). 581
582 583

20
2.4.3 Photolysis
In natural waters, photolysis of trace organic contaminants can occur via direct and 584 indirect mechanisms (Schwarzenbach et al., 2003). Direct photolysis occurs when a contaminant 585 absorbs sunlight and undergoes a transformation reaction. Indirect photolysis involves other 586 chemicals, most often NO3
- and colored dissolved organic matter (CDOM), which absorb light 587 and produce reactive intermediates that subsequently react with contaminants. With respect to 588 the transformation of organic contaminants, important reactive intermediates include hydroxyl 589 radical (•OH) (Zepp et al., 1987; Brezonik and Fulkerson-Brekken, 1998), singlet oxygen (1O2) 590 (Zepp et al., 1977), excited triplet state DOM (3DOM*) (Canonica et al., 1995; Boreen et al., 591 2004), organoperoxy radicals, and carbonate radical (•CO3
-) (Lam et al., 2003; Canonica et al., 592 2005). 593
594 Treatment wetlands may be conducive to indirect photolysis due to the presence of NO3
- 595 in nitrified wastewater effluent, which produces •OH via the reaction: 596
597 NO3
- + H2O + hνNO2 + •OH + OH- (2.1) 598 599
CDOM derived from wastewater effluent and decaying plants may also promote indirect 600 photolysis through a variety of mechanisms. For example, CDOM was significant to the 601 removal of the pesticides alachlor and carbaryl in wetland waters via indirect photolysis (Miller 602 and Chin, 2002, 2005). For those reactions where CDOM served as a source of •OH, rates of 603 photolysis were not strongly affected by DOM concentrations because it acted as both a source 604 of CDOM and a •OH scavenger. In addition to generating •OH, CDOM can also serve as a 605 source of the selective oxidants 1O2 and 3DOM*, which have been found to be important to the 606 indirect photolysis of certain trace organic chemicals in the environment (Gerecke et al., 2001; 607 Latch et al., 2003b). 608
609 Most constructed wetlands are not designed to include shallow open water zones. As a 610
result, few investigators have studied the role of photolysis in trace organic contaminant removal 611 in treatment wetlands. Matamoros et al. (2008b) attributed the nearly complete removal of 612 ketoprofen in an engineered treatment wetland with deep (1.5 m) open water zones and a long 613 hydraulic residence time (30 days) to photolysis. While this study demonstrated that photolysis 614 in deep, open ponds can significantly attenuate organic compounds that are particularly 615 susceptible to direct photolysis (ketoprofen has a half-life of 2.5 minutes under near-surface 616 summer-noon conditions (Lin and Reinhard, 2005)), removal efficiencies would be significantly 617 lower for compounds with longer direct photolysis half-lives. For example, consider 618 sulfamethoxazole, a compound that is relatively susceptible to direct photolysis (half-life of 619 about 2 hours under near-surface summer-noon conditions (Lam and Mabury, 2005)), in a 1 m 620 deep wetland with the EPA (2000a) recommended hydraulic residence time of 3 days for open 621 water zones. Given a typical beam attenuation coefficient (α) of 6 m-1 at 330 nm, and ideal plug 622 flow conditions, sulfamethoxazole would exhibit a decrease in concentration of only about 10% 623 due to direct photolysis under daily-averaged mid-summer conditions at 40° latitude 624 (Schwarzenbach et al., 2003). 625
626 627

21
2.5 Removal of Waterborne Pathogens
2.5.1 Attachment and Sedimentation
Some pathogens, like helminth eggs, have settling velocities high enough to be removed 628 by sedimentation in treatment wetlands (e.g., about 0.1 mm s-1; Sengupta et al., 2011). The 629 presence of rhizomes and macrophyte stalks can further enhance sedimentation (Mandi et al., 630 1996). However, protozoan (oo)cysts and bacteria have much lower settling velocities (e.g., less 631 than 0.001 mm s-1 for Giardia cysts (Dai and Boll, 2006)), and viruses are stable in suspension. 632 These organisms will only be removed by sedimentation if they are attached to larger particles. 633 As a result, the removal of cysts such as Giardia in some cases has been correlated with particle 634 removal (Quiñónez-Díaz et al., 2001). However, particle association is not always conducive to 635 pathogen removal. For example, in a study conducted by Boutilier et al. (2009), the association 636 of E. coli with particles appeared to decrease their removal compared to free-floating bacteria. 637 This was because particles with diameters less than 80 μm had settling velocities too low to be 638 removed by sedimentation. 639
In addition to attaching to settling particles, pathogens can be removed by attachment to 640 other surfaces in treatment wetlands. However, the contribution of this mechanism to overall 641 removal is not known. For example, in vegetated surface flow wetlands, viruses were removed 642 by attachment to the biofilm layer of rhizomes and submerged stalks of emergent plants 643 (Gersberg et al., 1987). Biofilms have also been shown to increase the removal of pathogen 644 surrogates (0.1-, 1.0-, and 4.5-µm latex microspheres) in microcosm experiments using surface 645 flow wetland water (Stott and Tanner, 2005). A better understanding of the processes that affect 646 the association of pathogens with particles and surfaces, as well as the size distribution of 647 particles in treatment wetlands, may provide insight into means for enhancing pathogen removal 648 via sedimentation and attachment. 649
Pathogenic helminth eggs, protozoan (oo)cysts, and viruses that accumulate on wetland 650 surfaces and in sediments will become inactivated over time. In contrast, indicator and 651 pathogenic bacteria have the potential to grow under certain environmental conditions (Ksoll et 652 al., 2007; Ishii et al., 2010), although there is no evidence of growth occurring in treatment 653 wetlands. It should be noted that sloughing or resuspension of sediments has the potential to 654 remobilize viable organisms. In addition, wetland vegetation or sediments that are removed 655 during maintenance activities may contain viable pathogens, which could complicate efforts to 656 reuse the material (e.g., as a soil amendment). 657
2.5.2 Predation
Predation has the potential to be an important removal mechanism for bacteria and 658 protozoan (oo)cysts in treatment wetlands (Stott et al., 2001; Song et al., 2008), but much less is 659 known about viruses. Grazing of particles in the size range of individual viruses is typically 660 inefficient (Hahn and Höfle, 2001), although viruses attached to larger particles have the 661 potential to be removed by predation. Potential predators of pathogens in treatment wetlands 662 include nematodes, copepods, rotifers, and protozoa (Decamp and Warren, 1998). For example, 663 grazing rates for the ciliated protozoa Paramecium were measured to be 664 111 E. coli (ciliate-hour)-1 and 170 Cryptosporidium parvum oocysts (ciliate-hour)-1 in lab 665 experiments (Decamp and Warren, 1998; Stott et al., 2001)). Hence a population of 666

22
2x10⁴ Paramecium per liter (Decamp and Warren, 1998) would have the potential to achieve 667 greater than 6-log removal of E. coli or oocysts in one hour, if these were the only particles in the 668 water. Grazing rates in an actual wetland are expected to be significantly lower because 669 pathogens would represent a small fraction of the total particles. 670
In addition to ciliated protozoa, rotifers may play an important role in the removal of 671 pathogens via grazing due to their dominance in the total zooplankton population in shallow 672 wetlands (Beaver et al., 1998; Fayer et al., 2000; Trout et al., 2002; Proakis, 2003). For example, 673 the rotifer Brachionus plicatilist rapidly removed E. coli from water under laboratory conditions, 674 with an average feeding rate of almost 700 E. coli (rotifer-hr)-1 (Proakis, 2003). Rotifers from 675 six different genera were also found to ingest Giardia cysts and Cryptosporidium oocysts in 676 simple laboratory experiments (Fayer et al., 2000; Trout et al., 2002). However, ingestion rates 677 in actual wetlands have not been measured, and conditions that promote predation in treatment 678 wetlands are not sufficiently understood. 679
While predation may provide an effective means for removing indicator organisms and 680 pathogens from water, the viability of the organisms following ingestion is uncertain. In 681 general, protozoan grazing is a major mechanism of bacterial population control (Hahn and 682 Höfle, 2001). However, there is evidence that some pathogenic bacteria are not inactivated as a 683 result of ingestion by protozoan grazers, such as ciliates and amoebas (Barker and Brown, 1994; 684 Meltz Steinberg and Levin, 2007). Indeed, pathogenic bacteria like Legionella actually colonize 685 free-living amoeba to protect themselves from unfavorable environmental conditions (Thomas et 686 al., 2010). More research is needed on inactivation of the wide range of pathogens of concern in 687 wastewater by the different types of grazers in treatment wetlands. 688
2.5.3 Photoinactivation
Sunlight-mediated inactivation is one of the most important disinfection mechanisms in 689 waste stabilization ponds (Davies-Colley et al., 2000; Davies-Colley, 2005), suggesting that 690 open water zones are promising for the removal of pathogens in treatment wetlands. There are 691 three main mechanisms of sunlight-mediated inactivation of microorganisms (Davies-Colley et 692 al., 1999). Analogous to direct photolysis of chemical contaminants, the absorption of UVB 693 radiation (280-320 nm) by DNA causes direct damage to cellular DNA, primarily by pyrimidine 694 dimer formation (Jagger, 1985). Similar to indirect photolysis of chemical contaminants, there 695 are also indirect disinfection mechanisms, in which sensitizers absorb light and produce reactive 696 species that damage organisms. Indirect damage may occur due to absorption of sunlight by cell 697 constituents (endogenous sensitizers) (Davies-Colley et al., 1999; Bosshard et al., 2010) or by 698 sensitizers in water (exogenous sensitizers), such as CDOM. 1O2 has been shown to be the most 699 important reactive species produced by exogenous sensitizers during the sunlight-mediated 700 inactivation of MS2 coliphage, which is a model for human enteric viruses (Kohn and Nelson, 701 2007). 702
Exogenous inactivation initiated by sensitizers that absorb longer wavelengths, such as 703 CDOM, may be more important than endogenous mechanisms because the UV wavelengths that 704 contribute to endogenous inactivation (direct and indirect) are readily absorbed in wetland water 705 (i.e., λ=280 to 400 nm). However, not all organisms appear to be susceptible to this mechanism 706 (Davies-Colley et al., 1999). Photoinactivation can also be enhanced by high dissolved oxygen 707 and elevated pH (e.g., greater than pH 9) that result from algal photosynthesis (Curtis et al., 708

23
1992; Davies-Colley et al., 1999; Ansa et al., 2011). 709
The importance of sunlight-mediated disinfection in surface flow treatment wetlands was 710 illustrated when E. coli concentrations declined significantly after a thick bed of floating 711 duckweed (Lemna spp.) was removed from a newly constructed surface flow wetland (MacIntyre 712 et al., 2006). A better understanding of the sunlight-mediated inactivation mechanisms and their 713 roles in pathogen removal is needed to optimize the design and enable prediction of the fate of 714 pathogens in surface flow treatment wetlands. 715 716 2.6 Novel unit process wetlands for removal of trace organic contaminants and pathogens
A growing understanding of wetland hydraulics and contaminant attenuation mechanisms 717 in treatment wetlands provides an opportunity to optimize the design and operation of wetlands 718 to remove trace organic contaminants and pathogens in a sequence of unit process cells. The 719 individual unit processes incorporated into a wetland treatment train will depend on a variety of 720 considerations, including influent water quality, contaminants of concern, point of discharge, 721 regulations on effluent water quality, and space constraints. Different unit processes will be 722 needed to address the wide range of trace organic contaminants and pathogens, which are 723 removed by different removal mechanisms. Based on the review of removal mechanisms in 724 Sections 2.4 and 2.5, in this section we further explore several novel designs for unit process 725 cells that target removal of trace organics and wetlands: a shallow, open-water cell, vegetated 726 wetlands that optimize specific enzymes and biodegradation pathways, and a cell incorporating 727 filter-feeding bivalves. 728
729 An example of how unit processes could be combined in a treatment train for nitrified 730
wastewater effluent is provided in Figure 2.3. In this example, the first cell provides treatment of 731 trace organics through direct photolysis, indirect photolysis (including •OH produced from 732 NO3
-), and sorption and biotransformation in the thick biofilm layer that forms on the cell’s 733 bottom. Inactivation of pathogens also occurs through direct and indirect photoinactivation. 734 Next, in the cattail cell, labile organic matter produced by cattails fuels denitrification as well as 735 biodegradation of trace organics, the anaerobic conditions promote precipitation of metal 736 sulfides, and quiescent conditions promote further settling of particle-associated pathogens. 737 Next, in the bulrush cell, non-labile organic carbon accumulates and serves as a sorbent for trace 738 organic contaminants. Finally, in the bivalve cell, particle-associated trace organic contaminants 739 and pathogens are ingested, and transformed or inactivated. 740
741 A deeper understanding of the specific mechanisms at play will allow the individual cells 742
to be optimized, as well as their sequential order. For example, if DOM produced by vegetated 743 cells is found to be effective at sensitizing the degradation of specific chemicals or pathogens, 744 then the photolysis cell could be placed after the vegetated cell. The potential for each of these 745 unit processes is explored in greater detail in subsequent sections. 746
747

24
748 Figure 2.3: Example of unit process wetland treatment train, along with key processes occurring
in each unit process cell.
749 2.6.1 Shallow, Open-Water Cells
Shallow, open-water wetland cells (Figure 2.4) represent a new approach for integrating 750 photochemical processes and aerobic microbes into a unit process wetland. While photolysis can 751 provide a means of removing contaminants, it is difficult to design treatment wetlands for 752 photolysis because emergent macrophytes and floating plants (e.g., duckweed) shade the water. 753 Furthermore, chromophores in wastewater effluent and wetland water strongly absorb sunlight, 754 especially in the important UV region of the solar spectrum, greatly slowing photochemical 755 reactions at depths of more than about 0.5 meters. To circumvent these problems, a shallow, 756 open-water wetland cell can be used. In these cells, concrete or geotextile liners are used on the 757 bottom of the cell to prevent emergent macrophyte growth. Under these conditions, the bottom 758 of the basin is rapidly colonized by a biomat, which is composed of a consortium of organisms 759 dominated by algae, aerobic bacteria, and other eukaryotes (Wetzel, 1983). 760
761 A pilot-scale wetland of this design (Figure 2.4) allows sunlight to penetrate throughout 762
the water column, which is typically around 20 cm. The growth of periphyton on the bottom of 763 the cell, rather than suspended in the water column as is the case with high rate algal ponds, 764 prevents shading of the water by algae and the use of relatively high water velocities prevents the 765 accumulation of duckweed on the surface. Inexpensive materials (i.e., wooden boards) are used 766 as baffles to minimize hydraulic short-circuiting. 767
768 Photolysis in a shallow, open-water cell with a hydraulic residence time of at least 769
24 hours would likely result in removal of chemical contaminants that are susceptible to direct 770 photolysis, such as NDMA, ketoprofen, and diclofenac. The shallow cell might also be 771 conducive to removal of certain chemical contaminants by indirect photolysis. Given NO3
- 772 concentrations of 20 mg N L-1 and DOC concentrations of 10 mg L-1, which are typical of 773 secondary wastewater effluent, a daily-averaged •OH steady-state concentration of about 4x10- 774 16 M would be expected in 20 cm of water during mid-summer at 40˚ latitude (Zepp et al., 1987; 775 Schwarzenbach et al., 2003). For a typical organic contaminant, which reacts with •OH at near 776

25
diffusion-controlled rates (i.e., about 7x10⁹ M-1s-1), approximately 50% removal would be 777 expected after 3 days in the wetland. 778
779 The water in periphyton-containing wetland cells exhibits diurnal cycles in which 780
dissolved oxygen concentrations and pH values increase during the day due to photosynthesis 781 (Fletcher and Marshall, 1982; Pollard, 2010). In the pilot-scale wetland shown in Figure 1.4, the 782 pH typically increases to values of between 9 and 10 within 50 meters of the inlet. The alkaline 783 pH conditions in the shallow, open-water cell may affect the rate of direct photolysis of chemical 784 contaminants by changing contaminant speciation (Boreen et al., 2004). Indirect photolysis rates 785 will also be affected by changes in water pH because •OH is scavenged by inorganic carbon 786 under alkaline conditions forming •CO3
-, which may then react with contaminants (Lam et al., 787 2003). This shift in radical formation could lead to selective oxidation of sulfur-containing 788 compounds, which often exhibit elevated reaction rates with •CO3
- (Huang and Mabury, 2000c). 789 High concentrations of dissolved oxygen could alter other indirect photolysis pathways, either by 790 quenching intermediate triplet states (Ryan et al., 2011) or by enhancing production of 1O2 791 (Latch et al., 2003b). 792
793
794 Figure 2.4: Discovery Bay pilot-scale open-water wetland cell. The cell is about 20 cm deep,
400 m2, and has a hydraulic residence time of about 1-3 days.
795 Pathogens would also be inactivated in a shallow wetland cell, both by direct and indirect 796
mechanisms. Indirect mechanisms would be especially important due to the high 1O2 797 concentrations produced by DOM present in wastewater. For example, a daily-averaged steady- 798 state 1O2 concentration of about 2x10-14 M would be expected during mid-summer at 40˚ latitude 799 in 20 cm of water (Haag and Hoigné, 1986; Schwarzenbach et al., 2003). Over a 3 day residence 800 time this would result in almost 3-log inactivation of MS2 coliphage, which was reported to be 801 inactivated by 1O2 with a second-order rate of 1.3x10⁹ M-1s-1 (Kohn and Nelson, 2007). 802
803

26
In addition to modifying overlying water chemistry, a biomat could remove chemical 804 contaminants and pathogens through sorption, biotransformation, and predation. For example, 805 researchers have found that biomats present in streams are capable of sorbing, and in some cases 806 transforming, trace organic contaminants such as steroid hormones, alkylphenols, non-steroidal 807 anti-inflammatory drugs, and the cyanotoxin microcystin-RR (Wu et al., 2010; Writer et al., 808 2011b; Dobor et al., 2012). Biotransformation of chemicals may be encouraged by the aerobic 809 conditions encountered at the top of the biomat. In addition, the labile carbon provided by 810 periphyton, which has been shown to enhance denitrification rates in anoxic wetlands (Sirivedhin 811 and Gray, 2006), and the increased activity of extracellular enzymes, such as the phenol oxidases 812 which are associated with photosynthesis (Romani et al., 2004; Francoeur et al., 2006; Rier et 813 al., 2007), might also be important. Pathogens have been found to attach to periphyton as well, 814 although detachment at a later time is possible (Ksoll et al., 2007). 815
816 Maintenance activities in a shallow, open-water wetland cell may include removing 817
floating vegetation as well as detritus which accumulates in the periphyton mat. Floating 818 vegetation, such as duckweed, is capable of quickly covering a wetland, limiting the 819 effectiveness of photolysis and potentially altering the microbial community in the periphyton 820 mat. The growth of floating vegetation can be limited by ensuring that hydraulic residence times 821 are less than about three days (EPA 2000a) and that the outlet structure allows floating 822 vegetation to leave with the outflow. If floating vegetation does grow, the wetland can be 823 periodically flushed by increasing the flow rate into the wetland to wash the floating vegetation 824 out. The slow buildup of particulate matter and detritus from decomposing biomat will also need 825 to be removed regularly, as over a few years it may slowly fill in the wetland. This can be 826 accomplished by draining the wetland and removing the dried periphyton mat with a bulldozer. 827 After the old mat is removed, a new biomat will re-grow within weeks on the wetland bottom. 828
829 2.6.2 Macrophyte-Dominated Wetland Cells
To enhance contaminant attenuation, vegetated wetland zones can be designed and 830 managed to select for microorganism communities with specific and complimentary composition 831 and functionality. Enhanced attenuation can be achieved through a unit process approach in 832 which different cells are optimized for specific purposes. For example, cells containing cattails 833 provide biomass that is more readily decomposed while bulrush cells would be expected to 834 exhibit higher activities of extracellular enzymes needed to break down the lignin-rich plants 835 (Horne and Fleming-Singer, 2005). 836
The linking of microbial community dynamics with factors such as plant substrates, 837 temperature, nutrient loading, and dissolved oxygen will allow for wetlands to be actively 838 managed based on environmental indicators. Nutrient availability can also affect microbial 839 community structure and enzyme expression. For example, an abundance of phosphorus can 840 reduce microbial diversity (Ahn et al., 2007) and potentially metabolic diversity. To increase 841 microbial activity or select for reducing conditions, plant biomass harvested during routine 842 maintenance activities can be added back to specific wetland cells. Vegetated wetlands can also 843 be designed to include deep zones to limit plant growth. Other strategies have been suggested, 844 such as raising the water level after plants have senesced to provide additional carbon from the 845 previously un-submerged plant detritus in the winter (Thullen et al., 2005). 846

27
Through an increased understanding of wetland microbial communities and the ability to 847 monitor their composition and activity, it may be possible to optimize the performance of unit 848 process cells. Past studies have relied on culture-dependent methods to discern metabolic 849 potential with inherent and often artificial selective pressures (Fortin et al., 2000; Truu et al., 850 2009) as well as fingerprinting techniques to track spatial and temporal variations in dominant 851 microbes in these systems (Boon et al., 1996; Faulwetter et al., 2009). However, little has been 852 done to thoroughly understand microbial ecology and enzymatic regulation in engineered 853 wetlands. This understanding is necessary to more effectively manage microbial transformation 854 of contaminants and develop enhanced design and monitoring tools for future engineered 855 wetlands. A suite of culture-independent molecular-based methods such as fluorescent in situ 856 hybridization , quantitative PCR (DeJournett et al., 2007; Bacchetti De Gregoris et al., 2011) and 857 high throughput pyrosequencing for phylogenetic analysis and the generation of metagenomes 858 (Jiang et al., 2011), hold immense promise for future studies. Collectively, these molecular tools 859 can further elucidate the microbial structure and function in constructed wetland systems. 860 Studies that characterize enzyme expression in concert with phylogenetic characterization are 861 important to more effectively track these complimentary but not always synonymous variables 862 (Vilchez-Vargas et al., 2010). 863
2.6.3 Bivalve Filtration Wetland Cells
As a compliment to contaminant attenuation in shallow, open-water wetlands and 864 macrophyte-dominated wetlands, wetland cells can be built to provide a habitat for organisms 865 that remove contaminants through filter feeding, as shown in Figure 2.5. Studies have shown 866 that bivalves such as mussels and clams filter large volumes of water and remove organic 867 particulate matter from the water column (Winter, 1978; Møhlenberg and Riisgård, 1979; Kryger 868 and Riisgård, 1988; Riisgård, 2001). While bivalves occur at low densities in habitats such as 869 coastal estuaries, rivers, and littoral zones of lakes, large populations may be supported in 870 systems with short hydraulic residence times and high primary productivity. Thus, it may be 871 possible to support high densities of filter feeding organisms in a constructed wetland cell where 872 significant concentrations of wastewater- or macrophyte-derived organic matter are available. 873
While bivalves have not yet been applied for water quality improvement in unit process 874 wetlands, they have been considered for a variety of applications including drinking water 875 treatment (McIvor, 2004), algae and suspended particulate matter removal from river water (Li et 876 al., 2010), and clarification of secondary municipal wastewater effluent (Haines, 1979). 877 Bivalves have also been considered as a means of removing nutrients from aquaculture 878 wastewater (Buttner, 1986; Shpigel et al., 1997) and more recently to remediate surface waters 879 polluted by excessive nutrients in New York City (Cotroneo et al., 2011; NOAA, 2011). 880

28
881
Figure 2.5: Schematic of bivalve uptake and removal mechanisms of organic contaminants and
pathogens.
In the process of removing particulate matter, bivalves can also accumulate and in some 882 cases transform particle-associated trace organic contaminants. For example, biotransformation 883 of polybrominated diphenyl ethers (PBDEs) and polycyclic aromatic hydrocarbons (PAHs) by a 884 freshwater mussel (Elliptio complanata) was observed following exposure through contaminated 885 algae (O’Rourke et al., 2004; Drouillard et al., 2007). In addition, the transformation of crude 886 oil was accelerated more than ten times in the presence of the mussel Mytilus edilus (Gudimov, 887 2002). However, recalcitrant contaminants may not be transformed after ingestion and may 888 instead accumulate in the bivalve tissue (Verrengia Guerrero et al., 2002; Drouillard et al., 889 2007). These contaminants may then be released through the excretion of pseudofeces and feces 890 (Haven and Morales-Alamo, 1966; Hull et al., 2011). Depending on the affinity of the 891 compound for the (pseudo)feces, the contaminants may then desorb and reenter the water 892 column, be consumed by benthic organisms, or be transformed by microbes. Further research is 893 needed to determine whether particle-associated trace organic contaminants commonly present in 894 wastewater effluent, such as the musk fragrances, are effectively removed and transformed by 895 bivalves in a wetland cell. 896
Bivalves are also capable of ingesting a wide variety of pathogens (Silverman et al., 897 1995; Graczyk et al., 2003, 2006; Proakis, 2003; Nappier et al., 2008). Given their ability to 898 efficiently remove particles greater than 0.4 µm in diameter from water, bivalves may filter 899 individual bacteria (0.5-2 µm) and protozoan (oo)cysts (2-15 µm), although not individual 900 viruses (20-100 nm). For example, the zebra mussel (Dreissena polymorpha) was found to 901 remove E. coli and other bacteria from pond water at a clearance rate of about 902 6 L (g dry tissue)-1 hr-1 (Silverman et al., 1995). Given this rate, a density of 130 mussels L-1 903 (approximately 16 mg dry weight (mussel)-1) would result in 90% clearance of bacteria (1-log 904 removal) over a 3 day residence time. Further research is needed, however, to determine 905 whether bivalve grazing results in pathogen inactivation or just accumulation. Limited studies 906

29
have shown recovery of viable Giardia spp. and infectious C. parvum oocysts in Macoma spp. 907 and oysters, respectively (Fayer et al., 1998; Graczyk et al., 1999). 908
Within a unit process wetland, bivalves could be implemented in shallow, open-water 909 cells. Periphyton-derived organic matter or organic matter from wastewater or previous wetland 910 cells would provide sufficient particulate matter for ingestion, and bivalves would enhance 911 contaminant and pathogen removal within the cell. Bivalves could be kept in cages to protect 912 them from predators. Cages would also allow bivalves saturated with recalcitrant contaminants 913 to be easily removed and depurated by exposure to clean water at regular intervals if necessary 914 (Burns and Smith, 1981; Pruell et al., 1986; Peven et al., 1996). Native species should be 915 employed in these wetland cells to avoid invasive species entering receiving surface waters. 916 While further research is necessary to determine appropriate bivalve species, densities, and 917 configurations to maximize treatment efficiency in a unit process wetland, implementation of 918 such a wetland cell could significantly increase attenuation of certain trace organic contaminants 919 and pathogens not effectively removed in other wetland cells, such as particle-associated trace 920 organic contaminants and pathogens that are too small to be removed by sedimentation and that 921 are not susceptible to photoinactivation. 922
923 2.7 Conclusions
There is growing interest in integrating large-scale treatment wetlands into urban water 924 infrastructure to improve water quality. Treatment wetlands for polishing effluents may offer 925 advantages over mechanical treatment systems due to their low operating cost and potential to 926 remove a variety of difficult-to-treat contaminants. In addition, treatment wetlands offer 927 aesthetic and habitat benefits in urban spaces. However, a better understanding of how to design 928 these natural barriers to provide predictable treatment of target contaminants is needed. 929
930 Applying the unit process approach to wetland design has the potential to contribute to 931
more flexible and predictable treatment. It also provides a framework for applying a mechanistic 932 understanding to system optimization. Nonetheless, there are major challenges associated with 933 harmonizing regulations and avoiding unintended consequences associated with large wetland 934 systems. Active management of treatment wetlands and a better understanding of attenuation 935 processes will be required. After we understand what this encompasses, we will have a better 936 idea of how the technology compares with other options. 937
938
939

30
CHAPTER 3. Phototransformation of wastewater-derived trace
organic contaminants in open-water unit process treatment
wetlands
Reproduced with permission from Jasper, J.T.; Sedlak, D.L. Phototransformation of wastewater-
derived trace organic contaminants in open-water unit process treatment wetlands. Environ. Sci.
Technol. 2013, 47, 10781-10790.
© 2013 American Chemical Society.

31
3.1 Introduction
Due to their incomplete removal during biological wastewater treatment, a variety of 940 trace organic contaminants are frequently detected in municipal wastewater effluent (Heberer, 941 2002; Ternes et al., 2004b). In the absence of significant dilution, some of these contaminants 942 pose risks to aquatic biota (Purdom et al., 1994; Triebskorn et al., 2007) and are an issue of 943 concern for downstream drinking water supplies (Snyder et al., 2003; National Research 944 Council, 2012). While reverse osmosis, ozonation, and granular activated carbon can remove 945 many wastewater-derived trace organic contaminants (Huber et al., 2003; Snyder et al., 2007), 946 this additional treatment is expensive and often produces wastes that require disposal. Chemical 947 oxidation can also produce disinfection byproducts of concern. 948
949 Constructed wetlands have been used since the 1970s to remove nitrate and phosphate 950
from municipal wastewater effluent (Kadlec and Wallace, 2009). More recently, researchers 951 have considered using them to remove trace organic contaminants (Chapter 2). In vegetated 952 wetlands, microbes associated with plant surfaces remove many of the trace organic 953 contaminants that are susceptible to biotransformation during activated sludge treatment 954 (Matamoros et al., 2008b). However, rates of biotransformation are often slower in wetlands 955 than in treatment plants. 956
957 Sunlight photolysis can transform many wastewater-derived trace organic contaminants 958
detected in wastewater effluent (Andreozzi et al., 2003; Lin and Reinhard, 2005; Fono et al., 959 2006). This process is usually unimportant in wetlands because shading of the water surface by 960 emergent macrophytes and floating vegetation reduces light penetration. While integration of 961 open waters is often desirable in treatment wetlands as waterfowl habitat (Fleming-Singer and 962 Horne, 2006) and as a means of enhancing mixing (Lightbody et al., 2007), sunlight photolysis 963 in deep, open waters is generally slow (Matamoros et al., 2008b). Alternatively, wetlands 964 constructed in a unit process fashion, with individual cells exhibiting distinctly different 965 characteristics, can integrate shallow, open-water cells that exploit photolysis as a means of 966 removing trace organic contaminants (Chapter 2). 967
968 To evaluate the potential of open-water unit process cells to transform trace organic
contaminants, a photochemical model was developed and validated under representative
conditions using compounds that undergo photolysis by different mechanisms. Using previously
published data, the model was used to predict the removal of cimetidine, diuron, NDMA, and
17β-estradiol. The model was also used to estimate the area needed to reduce the concentration
of trace organic contaminants produced by a 1 million gallon per day (MGD) nitrifying
wastewater treatment plant by 90%.
3.2 Photolysis Model
The first-order photolysis rate constant for trace organic contaminants (kphot) includes 969 transformation via direct photolysis in addition to indirect photolysis via reaction with hydroxyl 970 radical (·OH) (Zepp et al., 1987; Brezonik and Fulkerson-Brekken, 1998), singlet oxygen (1O2) 971 (Zepp et al., 1977; Latch et al., 2003b), excited triplet state dissolved organic matter (3DOM*) 972 (Canonica et al., 1995; Gerecke et al., 2001; Boreen et al., 2004), and carbonate radical (·CO3
-) 973 (Huang and Mabury, 2000c; Canonica et al., 2005), giving: 974

32
975 kphoto = kdirect + k·OH,cont[· OH]ss + k·CO3
−,cont[· CO3−]ss + k O2,cont1 [ O2
1 ]ss + k DOM∗3 ,cont (3.1) 976
977 where kdirect is the first-order direct photolysis rate constant k·OH,cont, k·CO3
−,cont, and k O2,cont1 978
are the second-order rates constants between contaminants and ·OH, ·CO3-, and 1O2 respectively; 979
k DOM∗3 ,cont is the pseudo first-order rate constant for reaction of 3DOM* with a contaminant; and 980
[·OH]ss, [·CO3-]ss, and [1O2]ss are the steady-state concentrations of each species. For 981
contaminants with relevant pKa values, kphoto is a function of pH, given the quantum yield and 982 reaction rates with reactive species for the protonated and unprotonated contaminant, and the 983 fraction of the contaminant protonated and deprotonated (f) (e.g., 984 kdirect=fdeprotonatedkdirect,deprotonated+fprotonatedkdirect,protonated). 985
986 kdirect can be calculated from daily-averaged solar irradiance (Z(24 hr, λ)) for conditions at 987
40° N latitude (Figure 3.1) (Gueymard, 2003); the molar absorption coefficient (ε(λ)) (Figure 988 3.2); and the quantum yield (Φ; see Table 3.1) (Schwarzenbach et al., 2003): 989
990 kdirect = 2.3 Φ ∑ S(λ)Z(24 hr, λ)ε(λ)λ (3.2) 991
992 993 S(λ) is a light-screening factor, which accounts for light absorption in a well-mixed body of 994 water and is calculated by (Schwarzenbach et al., 2003): 995 996
S(λ) =1−10−1.2 α(λ)z
(2.3)(1.2)α(λ)z (3.3) 997
998 where α(λ) is the beam attenuation coefficient and z is the well-mixed depth of the water column. 999 α(λ) is estimated by assuming it is related linearly to the concentration of dissolved organic 1000 carbon: 1001 1002
α(λ) = m(λ)[DOC] + b(λ) (3.4) 1003 1004
Values for m(λ) and b(λ) (Table 3.2) were obtained using UV/Vis spectra of pilot-scale wetland 1005 water taken at dissolved organic carbon concentrations ranging from 5 to 11 mg L-1-C (see 1006 Figure 3.3 for sample plot). The obtained relationship has a non-zero y-intercept (i.e., b(λ)>0), 1007 most likely due to differences in types of dissolved organic carbon in different samples (e.g., 1008 variations in the fractions of protein-derived organic carbon and humic substances present in the 1009 wetland water). 1010 1011 1012 1013 1014

33
1015
Figure 3.1: Predicted irradiance under clear skies at sea level (Z(24 h, λ)) of June 21st sunlight at
40°N latitude (—) (Gueymard, 2003); irradiance of solar simulator (Z(λ)) with atmospheric filter
(); and irradiance of 500 W medium-pressure mercury lamp (•••), measured with a
Stellarnet spectroradiometer (EPP2000C-SR-100 with CR2 cosine receptor).
1016
0.0
0.1
0.2
0.3
0.4
0.5
0.6
0.7
0.8
300 350 400 450
λ (nm)
Z (
mE
icm
-2d
-1)

34
1017
Figure 3.2: Molar absorption coefficient (ε) of test compounds as a function of wavelength. Left
axis: atenolol, NDMA, diuron, and sulfamethoxazole; right axis: carbamazepine and propranolol.
1018
1019
0
2000
4000
6000
8000
10000
0
200
400
600
800
1000
300 320 340 360 380
λ (nm)
ε(M
-1cm
-1)
NDMA
carbamazepine(right axis)
sulfamethoxazole
propranolol(right axis)
diuron
atenolol
ε(M
-1cm
-1)
estradiol

35
1020
Figure 3.3: Absorbance at 310 nm (α(310)) of wetland water collected at different days
throughout the wetland with varying concentrations of DOC. Slope and intercept are m(310 nm)
and b(310 nm) respectively, which are tabulated in Table 3.2.
1021
1022 1023
y = 0.0072x + 0.037R² = 0.749
0
0.04
0.08
0.12
0.16
0 5 10 15
α(c
m-1
)
DOC (mg of C L-1)

36
1024 1025
1026 T
ab
le 3
.1:
Co
mp
ou
nd
Pro
per
ties
Use
d i
n P
ho
toly
sis
Mo
del
com
po
un
d
pro
per
tya
pK
a
𝚽
pro
ton
ate
d
d
epro
ton
ate
d
𝐤·𝐎
𝐇,𝐜
𝐨𝐧
𝐭b
(M-1
s-1)
𝐤·𝐂
𝐎𝟑−
,𝐜𝐨
𝐧𝐭
(M-1
s-1)
pro
ton
ate
d
d
epro
ton
ate
d
𝐤𝐎
𝟐,𝐜
𝐨𝐧
𝐭𝟏
(M
-1s-1
)
proto
nate
d d
ep
roto
nate
d
f(λ)
(10
3 L
Ei-1
)
aten
olo
l 9
.6 re
f a
1.1
x1
0-2
ref
b
1.1
x1
0-2
c
7.5
x1
09 r
ef c
,d
9(±
4)x
10
6 d
5
.9(±
1.6
)x1
07 d
8.5
x1
03 r
ef e
n.d
.e n.d
.
pro
pra
no
lol
9.5
ref
a
5.2
x1
0-3
ref
f
5.2
x1
0-3
c
1.1
x1
010 r
ef c
7.8
(±5
.6)x
10
7 d 4
.6(±
0.7
)x1
08 d
9.2
x1
06 r
ef g
n.d
. (1
6e-0
.02λ) d
sulf
am
etho
xaz
ole
5
.7 re
f h
5x1
0-1
ref
h
9x1
0-2
ref
h
5.9
x1
09
ref
h
n.a
.f 4
.4(±
1.2
)x1
08 d
n.d
. 2
x1
04 r
ef h
n.d
.
carb
amaz
epin
e
13
.9 re
f i
1.3
x1
0-4
ref
j
n.a
. 9
.1x1
09 r
ef j
,k
2.3
(±0
.5)x
10
6 d
n.a
. n.d
. n.d
. n.d
.
com
po
un
ds
use
d o
nly
in
pre
dic
tiv
e m
od
el
ND
MA
8
.5 g
; re
f l
3.1
x1
0-1
ref
l
8 x
10
-2 r
ef l
3.4
x1
08 r
ef m
n.d
. n.d
. n.d
. n.d
. n.d
.
diu
ron
n.a
. 1
.4 x
10
-2 r
ef n
n.a
. 4
.6x1
09 r
ef o
8x1
06 r
ef n
8x1
06 r
ef n
n.d
. n.d
. (3
.5e-0
.02λ)
ref
n
cim
etid
ine
7.1
ref
p
n.d
. n.d
. 6
.5x1
09 r
ef p
n.d
. n.d
. 3
.3x1
07 r
ef p
2.5
x1
08 r
ef p
n.d
.
17
β-e
stra
dio
l 1
0.4
ref
k
4.8
x1
0-3
ref
f
4.8
x1
0-3
c
9.8
x1
09 r
ef k
2.2
x1
07 h
4.8
x1
08 i
1.9
x1
07 j
6.4
x1
08 j
n.d
.
aC
om
po
un
d m
ola
r ab
sorp
tion
co
effi
cien
ts s
ho
wn i
n F
igu
re 3
.2. b
Aver
age
of
mu
ltip
le v
alu
es, w
hen
avai
lab
le.
c Val
ue
for
pro
ton
ated
sp
ecie
s u
sed
.
dM
easu
red
in
th
is s
tud
y.
e n.d
. m
ean
s n
o d
ata
avai
lab
le.
f n.a
. m
ean
s n
ot
app
lica
ble
. gA
pp
aren
t p
Ka
of
ph
oto
exci
ted
sta
te. h
Aver
age
val
ue
for
ph
eno
l u
sed
(Net
a et
al.
, 1
998
). i C
alcu
late
d w
ith
qu
anti
tati
ve
stru
ctu
re a
ctiv
ity r
elat
ion
ship
fo
r ph
eno
ls u
sing m
eta
and
par
a C
H2C
H2C
H2C
H3 s
ub
stit
uen
t co
nst
ants
(Can
on
ica
et a
l., 2
00
5).
j C
alcu
late
d w
ith
qu
anti
tati
ve
stru
ctu
re a
ctiv
ity r
elat
ion
ship
fo
r ph
eno
ls u
sin
g m
eta
and
par
a C
H2C
H2C
H2C
H3 s
ub
stit
uen
t co
nst
ants
(Tra
tnyek a
nd
Ho
ign
é, 1
99
1).
R
efer
ence
s:
a: (
Sh
iga
et a
l.,
199
3);
b:
(Yam
amo
to e
t al
. 20
09
); c
: (S
on
g e
t al
., 2
008
); d
: (B
enner
et
al.,
20
08
); e
: (W
ang e
t al
.,
20
12
); f
: (L
in a
nd
Rei
nh
ard
t, 2
00
3);
g:
(Ch
en e
t al
., 2
00
9);
h:
(Bo
reen
et
al.,
20
04
); i
: (Z
iegm
ann
an
d F
rim
mel
, 2
01
0);
j:
(Lam
an
d M
ayb
ury
, 2
00
5);
k:
(Hu
ber
et
al.,
200
3);
l:
(Lee
et
al.
, 2
00
5);
m:
(Bu
xto
n e
t al
., 1
988
); n
: (G
erec
ke
et a
l.,
20
01
); o
: (d
e L
aat
et
al.,
19
96
); p
: (L
atch
et
al.,
200
3).

37
Table 3.2: Parameters Used to Calculate Wetland Water Absorbance (α(λ))a
λ
center
m(λ)
(cm-1(mg L-1-C)-1)
b(λ)
(cm-1)
297.5 9.2x10⁻³ 4.2x10⁻²
300 8.6x10⁻³ 4.2x10⁻²
302.5 8.1x10⁻³ 4.1x10⁻²
305 7.8x10⁻³ 4.0x10⁻²
307.5 7.5x10⁻³ 3.8x10⁻²
310 7.2x10⁻³ 3.7x10⁻²
312.5 7.0x10⁻³ 3.5x10⁻²
315 6.9x10⁻³ 3.3x10⁻²
317.5 6.6x10⁻³ 3.0x10⁻²
320 6.5x10⁻³ 2.8x10⁻²
323.1 6.3x10⁻³ 2.6x10⁻²
330 6.1x10⁻³ 2.0x10⁻²
340 5.3x10⁻³ 1.6x10⁻²
350 4.6x10⁻³ 1.4x10⁻²
360 4.1x10⁻³ 1.1x10⁻²
370 3.5x10⁻³ 9.7x10⁻³
380 3.0x10⁻³ 8.1x10⁻³
390 2.6x10⁻³ 7.2x10⁻³
400 2.3x10⁻³ 6.1x10⁻³
420 1.7x10⁻³ 4.4x10⁻³
450 1.2x10⁻³ 3.5x10⁻³
480 8.2x10⁻⁴ 2.3x10⁻³
a a(λ)=m(λ)[DOM]+b(λ). 1027
1028 1029

38
·OH may be formed through the photolysis of colored dissolved organic matter (CDOM) 1030 or NO3
-. ·OH is scavenged in natural waters by DOM, HCO3-, and CO3
2-. Thus [·OH]ss can be 1031 calculated by: 1032
[∙ OH]ss =Rform,∙OH,NO3
−+Rform,∙OH,DOM
k∙OH,HCO3−[HCO3
−]+k∙OH,CO3
2−[CO32−]+k∙OH,DOM[DOM]
(3.5) 1033
1034 where k∙OH,HCO3
−, k∙OH,CO32−, and k∙OH,DOM are the second-order reaction rates between ·OH and 1035
water constituents (see Table 3.3 for values). Rform,∙OH,NO3− and Rform,∙OH,DOM are the formation 1036
rates (M s-1) of ·OH from NO3- and DOM, which may be calculated using: 1037
1038
Rform,∙OH,NO3− = ΦNO3
−,∙OH[NO3−] ∑ 2.3 S(λ)εNO3
−(λ)Z(λ)λ (3.6) 1039
1040
Rform,∙OH,DOM = ΦDOM,∙OH ∑ Z(λ)1−10−1.2 α(λ)z
1.2 α(λ)λ (3.7) 1041
1042 ΦNO3
−,∙OH and ΦDOM,∙OH are the quantum efficiencies for the production of ·OH from NO3- and 1043
DOM and were selected from the range of previously reported values to give the best 1044 agreement between predicted photolysis rates for test compounds and those measured with a 1045 solar simulator (see Table 3.3 for values). It should be noted that in calculating Rform,∙OH,DOM it 1046 is assumed that DOM is primarily responsible for α(λ) and the fraction in the equation 1047 represents the proportion of light absorbed by DOM (Schwarzenbach et al., 2003). 1048 1049
·CO3- is produced through the reaction of ·OH with HCO3
- and CO32- and reacts 1050
primarily with DOM, so that: 1051 1052
[∙ CO3−]ss =
k∙OH,HCO3−[HCO3
−][∙OH]ss+k∙OH,CO3
2−[CO32−][∙OH]ss
k∙CO3−,DOM[DOM]
(3.8) 1053
1054 k∙CO3
−,DOM is the second-order reaction rate between ·CO3- and DOM (see Table 3.3 for values). 1055
1056 [1O2]ss is approximated by correcting near-surface summer-noon values of [1O2]ss per mg 1057
of effluent organic matter (~1x10-14 M (mg of C)-1), for screening and light intensity (Haag and 1058 Hoigné, 1986): 1059
1060
[ O21 ]ss = 1x10⁻¹⁴ S(410 nm)
Z(410 nm)
Zsurface,summer−noon(410 nm) (3.9) 1061
1062 Corrections are made at 410 nm, since this wavelength was previously determined to give the 1063 best approximation of [1O2]ss (Haag and Hoigné, 1986). Zsurface, summer-noon (410 nm) is 1064 approximately 0.82 mEi cm-2d-1 (Gueymard, 2003). 1065 1066
Reaction rates of DOM with trace organic contaminants (k DOM∗3 ,cont) can be estimated 1067
using a wavelength-dependent quantum yield coefficient, f(λ) (Ei-1L), which accounts for the 1068 efficiency of DOM light absorption leading to transformation of a contaminant (Canonica et al., 1069 1995; Gerecke et al., 2001): 1070

39
1071
k DOM∗3 ,cont = ∑ f(λ)Z(λ)1−10−1.2 α(λ)z
1.2 α(λ)λ (3.10) 1072
1073 Although f(λ) values are not available for most contaminants, and variation between different
DOM sources may be significant (Gerecke et al., 2001), this formulation provides a method to
account for changes in water depth and DOM light absorption given a known k DOM∗3 ,cont value.
Table 3.3: Conditions Employed in Photolysis Model
parameter value(s)
depth (cm) 0-50
pH 7-10
[NO3-] (mg L-1-N) 0-20
[DOC] (mg L-1-C) 1-15
[DIC] (mg L-1-C)a 60
Z(24 hr, λ) (mEi cm-2d-1)b throughout year
ΦNO3−,∙OH c 1.6x10⁻²
ΦDOM,∙OH c 3.7x10⁻⁵
[1O2]ss, near-surface,noon (M (mg L-1-C)-1) d 1x10-14
k∙OH,DOM ((mg L-1-C)-1s-1) e 1.7x10⁴
k∙CO3−,DOM ((mg L-1-C)-1s-1) e 3.7x10²
k∙OH,HCO3− (M-1s-1) ref a 8.5x10⁶
k∙OH,CO32− (M-1s-1) ref a 3.9x10⁸
α(λ) f m(λ)[DOC] + b(λ)
aDissolved inorganic carbon. b24 hour-averaged solar intensity at 40˚ N latitude under clear skies on the 1074 21st day of each month (Gueymard, 2003). cQuantum yields for formation of •OH from DOM and NO3
-. 1075 Values were selected from the range available in the literature (i.e., ΦNO3
−,∙OH=0.010-0.017; ΦDOM,∙OH= 1076 3.0-9.8x10⁻⁵) (Zepp et al., 1987; Dong and Rosario-Ortiz, 2012) to give the best agreement between 1077 model predictions and solar simulator measurements. dAverage value for previously studied wastewaters 1078 (Haag and Hoigné, 1986). eDetermined in this study. fLight absorption by wetland water estimated by 1079 assuming a linear relationship between dissolved organic carbon ([DOC]) and α(λ). Values for m(λ) and 1080 b(λ) are given in Table 3.2. References: a: (Buxton et al., 1988). 1081

40
3.3 Materials and Methods
3.3.1 Materials
All reagents were purchased from Fisher Scientific (Fairlawn, NJ) at the highest available 1082 purity. Isotopically-labeled internal standards were purchased from CDN Isotopes (Quebec, 1083 Canada), except for sulfamethoxazole-d4, which was purchased from Toronto Research 1084 Chemicals, Inc. (Ontario, Canada). All solutions were prepared using Milli-Q water from a 1085 Millipore system. 1086 1087
3.3.2 Wetland Water and Conditions
Photolysis experiments were conducted in water collected from a pilot-scale open-water 1088 unit process wetland located in Discovery Bay, CA. The open-water cell received about 1089 10,000 gallons per day (4.4x10⁻⁴ m3s-1) of nitrified wastewater effluent from the adjacent 1090 municipal wastewater treatment plant. The 400 m2 cell was approximately 20 cm deep and 1091 divided with 3 baffles to give nearly plug-flow hydraulics, with a hydraulic residence time 1092 ranging from 1 to 3 days. The bottom of the cell was lined with concrete or geotextile fabric to 1093 prevent the growth of emergent macrophytes. 2- to 5-cm of organic-matter-rich sediments with 1094 large numbers of photosynthetic organisms accumulated on the cell bottom. 1095
1096 Wetland water collected from the Discovery Bay open-water pilot-scale wetland 1097
contained on average 10-20 mg L-1-N NO3-, 5-10 mg L-1-C DOC, and 60-80 mg L-1-C dissolved 1098
inorganic carbon (HCO3- and CO3
2-). This variation in dissolved inorganic carbon 1099 concentrations was not predicted to affect photolysis rates significantly. The conductivity of 1100 wetland water was typically around 1800 μS cm-1. A typical UV/Vis spectrum of the wetland 1101 water (α(λ)) is given in Figure 3.4. The pH in the wetland exhibited diurnal changes (Figure 1102 3.5), varying between values of about 8.5 and 10, due to production and consumption of CO2. 1103
1104 Water samples used in this study were collected in clean, amber glass bottles from the 1105
mid-point of the wetland, filtered through a 1-μm glass fiber filter, and stored at 5˚ C prior to 1106 experiments. 1107
1108 1109 1110 1111 1112 1113 1114

41
1115
Figure 3.4: Typical absorbance of wetland water with 8 mg L-1-C DOM, calculated with
α(λ)=m(λ)[DOM]+b(λ), using values found in Table 3.2 (left axis, —) and molar absorption
coefficient (ε) of NO3- (right axis, ).
1116 1117
0
1
2
3
4
5
6
7
8
0
0.01
0.02
0.03
0.04
0.05
0.06
0.07
0.08
0.09
0.1
300 350 400 450
λ (nm)
α(c
m-1
)ε
(M-1c
m-1)

42
1118
Figure 3.5: Inlet (—) and outlet () pH values in the shallow, open-water wetland cell at
the Discovery Bay wetlands.
1119
1120
1121
1122
1123
1124
7
8
9
10
11
2/20/2012 2/21/2012 2/22/2012 2/23/2012
pH

43
3.3.3 Reaction Rate Constants for Carbonate Radical
Second-order rate constants for the reaction of test compounds with carbonate radical 1125 (•CO3
-) were measured using photosensitizer based competition kinetics methods (Canonica et 1126 al., 2005). Briefly, test compounds (~2.5 nM) were irradiated in capped, 10-mL borosilicate test 1127 tubes with a path length of 1-cm, using a merry-go-round reactor equipped with a 500-W 1128 medium-pressure mercury lamp at 25˚ C. Solutions contained isoproturon as a reference 1129 compound (k∙CO3
−,isoproturon=3x10⁷ M-1s-1) (Canonica et al., 2005), along with 1130
4-carboxybenzophone (CBBP) or duroquinone (DQ) as a photosensitizer (5 μM). Solution pH 1131 was adjusted by varying the concentrations of sodium carbonate and sodium bicarbonate buffer 1132 solutions (total dissolved inorganic carbon=0.5-1 M). pH values higher than those typically 1133 encountered in sunlit surface waters were used in laboratory experiments to minimize side 1134 reactions with sensitizers and to ensure that amine functional groups were predominantly 1135 deprotonated. Samples were collected sacrificially at regular intervals. Assuming that losses of 1136 test compounds and isoproturon were due only to reaction with •CO3
-, the following equation 1137 could be used to estimate the rate of reaction of a compound with •CO3
- (k∙CO3−,compound): 1138
1139
ln [[compound]t
[compound]o] =
k∙CO3−,compound
k∙CO3−,isoproturon
ln [[isoproturon]t
[isoproturon]o] (3.11) 1140
1141
The rate constant was obtained from a linear regression of ln [[compound]t
[compound]o] versus 1142
ln [[isoproturon]t
[isoproturon]o]. 1143
1144 3.3.4 Reaction Rate Constants for Hydroxyl Radical and Carbonate Radical with Wetland
Dissolved Organic Matter
Steady-state concentrations of •OH and •CO3- were calculated from the disappearance 1145
rates of probe compounds irradiated as described above in wetland water buffered with sodium 1146 borate buffer (10 mM) at pH values ranging from 8 to 10. Under these conditions, disappearance 1147 of probe compounds exhibited pseudo-first order kinetics (r2>0.97). Hydroxyl radical steady- 1148 state concentration ([•OH]ss) was measured using para-chlorobenzoic acid (pCBA) as a probe 1149 ([pCBA]o≈5 μM; k•OH ,pCBA =5x10⁹ M-1 s-1) (Buxton et al., 1988). [•CO3
-]ss was measured using 1150 N,N-dimethylaniline (DMA) as a probe ([DMA]o≈5 μM; k∙CO3
−,DMA=1.8x10⁹ M-1 s-1) (Neta et al., 1151
1988; Huang and Mabury, 2000a). Data were corrected for direct photolysis of DMA and loss of 1152 DMA by reaction with •OH (k∙OH,DMA=1.4x10¹⁰ M-1s-1) (Buxton et al., 1988) using measured 1153 [•OH]ss. 1154
1155 Estimates of the rate constants for the reaction of radicals with wetland dissolved organic 1156
matter (i.e., k∙OH,DOM and k∙CO3−,DOM) were made by fitting measured steady-state radical 1157
concentrations at four or more pH values to the following equations: 1158 1159
[ O• H]ss =Rform,∙OH,NO3
−+Rform,∙OH,DOM
k∙OH,HCO3−[HCO3
−]+k∙OH,CO3
2−[CO32−]+k∙OH,DOM[DOM]
(3.12) 1160
1161

44
and 1162 1163
[ C• O3−]ss =
k∙OH,HCO3−[HCO3
−][∙OH]ss+k∙OH,CO3
2−[CO32−][∙OH]ss
k∙CO3−,DOM[DOM]
(3.13) 1164
1165 1166
where Rform,∙OH,NO3− and Rform,∙OH,DOM are the formation rates of •OH from photolysis of NO3
-
and dissolved organic matter, respectively, and k∙OH,HCO3−, k∙OH,CO3
2−, k∙OH,DOM, and k∙CO3−,DOM
are second-order reaction rates between radical species and dissolved carbon species. Previously
measured values of k∙OH,HCO3− and k∙OH,CO3
2− were used (Table 3.3). The formation rate of •OH
from NO3- and DOM when irradiated with a medium-pressure mercury lamp (Rform,∙OH,NO3
− +
Rform,∙OH,DOM) was calculated by measuring the formation rate of phenol from a solution of
benzene in wetland water, given a reaction yield of 0.85 moles of phenol per mole of benzene
that reacts with •OH (Dong and Rosario-Ortiz, 2012). The concentration of benzene employed
(i.e., ~3 mM) was calculated to scavenge greater than 99% of the •OH formed. The method of
least squares was used to determine the remaining unknown parameters, k∙OH,DOM and
k∙CO3−,DOM.
3.3.5 Photolysis of Representative Compounds in Wetland Water
The contribution of different photolysis mechanisms to contaminant removal in wetland 1167 water was investigated by irradiating wetland water as described above. Air-saturated solutions 1168 were amended with approximately 50 nM of each of four compounds (i.e., atenolol, propranolol, 1169 sulfamethoxazole, and carbamazepine) from a concentrated aqueous stock solution prior to 1170 irradiation. Solutions were modified to isolate the contributions of different reactive species: 1% 1171 isopropanol (IPA) was used to quench •OH reactions (Packer et al., 2003); 0.1% isoprene was 1172 used to quench 3DOM* (Boreen et al., 2008); sparging with nitrogen gas (N2) was used to 1173 evaluate the importance of 1O2 and 3DOM* (Ryan et al., 2011); and adjustment of pH to values 1174 between 8 and 10.5 was used to evaluate the effects of pH on photolysis. 1175
1176 3.3.6 Predicting Photolysis Rates in Unit Process Wetlands
Predictions of photolysis rates of trace organic contaminants in open-water unit process 1177 cells (kphoto) included contributions from direct photolysis, in addition to indirect photolysis via 1178 reactions with •OH, •CO3
-, 1O2, and 3DOM*. The conditions employed in the model calculations 1179 are summarized in Table 3.3. Properties of contaminants necessary for the estimation of 1180 photolysis rates at a given pH value were calculated from experimental data or obtained from 1181 previous publications (see Table 3.1). 1182
1183 As described above, direct photolysis rates were calculated using measured molar 1184
absorption coefficients and 24-hour averaged solar irradiances for clear skies at 40° N latitude 1185 (Z(24 hr, λ)) (Gueymard, 2003) and were corrected for light screening and depth using a 1186 screening factor (Schwarzenbach et al., 2003). Steady-state •OH and •CO3
- concentrations were 1187 calculated using Equations 3.12 and 3.13. The formation rates of •OH from NO3
- (Rform,∙OH,NO3−) 1188
and dissolved organic matter (Rform,∙OH,DOM) were calculated using •OH formation quantum 1189

45
yields from NO3- and DOM and were corrected for depth (Zepp et al., 1987; Dong and Rosario- 1190
Ortiz, 2012). 1O2 steady-state concentrations were estimated based on previously measured 1191 values from irradiated wastewater effluent (Haag and Hoigné, 1986). Pseudo-first order reaction 1192 rates of 3DOM* with trace organic contaminants were estimated using a wavelength-dependent 1193 quantum yield coefficient (f(λ) (L Ei-1)), that accounted for the efficiency of light absorption by 1194 DOM leading to transformation of a contaminant (Gerecke et al., 2001). A quantum yield 1195 coefficient for the reaction of 3DOM* with propranolol was used to account for differences 1196 between model predictions and rates measured with a solar simulator. 1197
1198 To evaluate the applicability of the photochemical model, predicted rates were compared 1199
to photolysis rates of test compounds measured in a solar simulator (Oriel). Test compound 1200 photolysis rates were measured in uncovered 1-L borosilicate beakers containing 20 cm of 1201 wetland water amended with approximately 50 nM of test compounds. Solutions were irradiated 1202 from above with a collimated beam (20 x 20 cm) generated by a 1000-W Xe lamp screened with 1203 an atmospheric attenuation filter (typical spectrum shown in Figure 3.1). The solution 1204 temperature was maintained at 15°C to minimize evaporation using a recirculating water bath. 1205 1-mL samples were collected at regular intervals for analysis. 1206
1207 3.3.7 Analytical methods
Dissolved organic carbon and dissolved inorganic carbon were measured using a 1208 Shimadzu TOC-V analyzer (Standard Method 5310 B) (American Public Health Association, 1209 1995). NO3
- was analyzed using a Dionex DX-120 ion chromatograph (Standard Method 4500- 1210 NO3
- C) (American Public Health Association, 1995). UV/Vis absorption spectra (ε(λ)) and 1211 wetland water beam attenuation spectra (α(λ)) were measured using a Perkin Elmer Lambda 35 1212 spectrometer. pCBA , DMA, and phenol were separated using an HPLC equipped with a 4.6 1213 mm x 250 mm supelcosil LC-18 5µm column. pCBA was detected at 240 nm, with a mobile 1214 phase of 60% acetonitrile and 40% 5mM sulfuric acid. DMA was detected at 252 nm, with a 1215 mobile phase of 70% acetonitrile and 30% 5 mM ammonium acetate adjusted to pH 8. Phenol 1216 was detected at 270 nm, with a mobile phase of 60% acetonitrile and 40% 10 mM formic acid. 1217 A flow rate of 1 mL min-1 was used for all analytes. 1218
1219 Pharmaceuticals and isoproturon were separated using a 2.1 mm x 30 mm Zorbax SB- 1220
C18 3.5 μm column, eluted with at 0.5 mL min-1 acetonitrile and 0.1% acetic acid in water with 1221 the following gradient: 0 minutes, 5% acetonitrile; 5.5 minutes 55% acetonitrile; 6 minutes, 1222 100% acetonitrile; 9 minutes, 100% acetonitrile; 10 minutes, 5% acetonitrile. All compounds 1223 were detected using electrospray ionization (ESI) with a 60-100 ms dwell time and a gas 1224 temperature of 350° C, a gas flow rate of 11 L/min at 50 psi, and a capillary voltage of 3600 V. 1225 Compound-specific parameters are given in Table 4.1, although only atenolol, propranolol, 1226 carbamazepine, and sulfamethoxazole were analyzed for photolysis studies described in this 1227 Chapter. 1228
1229 1230 1231

46
1232
Figure 3.6: Typical results from competition kinetics experiment used to measure k·CO3−,cont.
Samples were irradiated in a merry-go-round reactor equipped with a 500 W medium-pressure
mercury lamp. pH=11.4; [isoproturon]o≈2.5 nM; [propranolol]o≈2.5 nM; [CBBP] ≈5 μM;
[CO32-]≈0.5 M.
1233
1234
1235
1236
1237
y = 17.681x - 0.1931R² = 0.9304
0
1
2
3
4
5
6
7
8
0 0.1 0.2 0.3 0.4
-ln([isoproturon]t/[isoproturon]o)
-ln([
pro
pra
no
lol]
t/[p
rop
rano
lol]
o)

47
3.4 Results and Discussion
Wetland water contains chromophores that serve as sources of reactive oxygen species 1238 and triplet state species. As a result, photolysis rates of some compounds increased in wetland 1239 waters relative to those measured in deionized water. For other compounds, photolysis rates 1240 decreased in the presence of chromophores due to light screening. Experiments with probe 1241 compounds provided a basis for predicting the magnitude of these effects over a range of 1242 conditions. 1243
3.4.1 Carbonate Radical Reactions with Contaminants
The competition kinetics method used to determine second-order •CO3- reaction rates 1244
with test compounds exhibited pseudo first-order kinetics as indicated by the linearity of data 1245 plotted according to Equation 3.11 (r2>0.9; see Figure 3.6). Dark controls indicated that none of 1246 the compounds underwent hydrolysis at appreciable rates relative to photolysis. Both CBBP and 1247 DQ were used as sensitizers to evaluate the possibility of a side reaction between the sensitizer 1248 and the test compound. The observed agreement between rate constants measured with the two 1249 sensitizers indicated that side reactions were not important at pH 11.4 (see Table 3.4). 1250
1251 Table 3.4: Second-Order Rate Constants for the Reaction of ·CO3
- with Test Compoundsa
sensitizerb (107 M-1s-1)
compound
CBBP DQ
pH 8.2 pH 11.4 pH 8.2 pH 11.4
atenolol 0.9 (±0.4) 5.9 (±1.6) 0.3 (±0.2) 5.4 (±0.9)
propranololc 7.8 (±5.6) 46.3 (±6.8) 7.6 (±4.5) 42.9 (±5.1)
sulfamethoxazolec 12.9 44.4 (±12.4) 17.9 32.4
carbamazepine 0.2 (±0.1) 0.23 (±0.05) 0.5 (±0.2) 0.32 (±0.03)
a k·CO3−,cont.
b Errors when available are ± one standard deviation. c Rates corrected for direct photolysis. 1252
The rate constants for reactions of test compounds with •CO3- at pH 11.4 varied over 1253
more than two orders of magnitude (Table 3.4), reflecting the selectivity of •CO3-. Changes in 1254
ionic strength did not significantly affect measured rate constants. As expected, •CO3- reacted 1255
rapidly with sulfur-containing functional groups on sulfamethoxazole (Chen and Hoffman, 1975; 1256 Huang and Mabury, 2000b). •CO3
- also reacted rapidly with the deprotonated amines atenolol 1257 and propranolol. 1258
1259 To assess the role of compound speciation on reaction rates with •CO3
-, experiments were
performed at pH 8.2 and 11.4 for atenolol (pKa=9.6) and propranolol (pKa=9.5). Attempts to
measure k∙CO3− at pH 8.2 were complicated by side reactions between sensitizers and test
compounds, as evidenced by differences in second-order rate constants measured using the two
sensitizers (Table 3.4). In both cases, measured values for k∙CO3− were approximately an order of

48
magnitude lower for the deprotonated β-blockers relative to the protonated species (Table 3.4).
As expected, •CO3- reaction rates with carbamazepine did not vary significantly with pH (Table
3.4). Although the protonation state of sulfamethoxazole does not change significantly between
pH 8.2 and pH 11.4, measured k∙CO3− values varied by approximately a factor of 2.5. This change
may have been due to side reactions with sensitizers at pH 8.2. Therefore, k∙CO3− values
measured at pH 11.4 were used for sulfamethoxazole in subsequent model calculations.
3.4.2 Reaction of Hydroxyl Radical and Carbonate Radical with Wetland Dissolved Organic
Matter
Measured [•OH]ss and [•CO3-]ss were strongly affected by pH, with an 80% decrease in 1260
[•OH]ss and a greater than 100% increase in [•CO3-]ss as pH increased from 8 to 10 (Figure 3.7). 1261
The observed shift in concentrations of radicals was attributed to the faster reaction rate of •OH 1262 with CO3
2- relative to HCO3- (Buxton et al., 1988). This was especially relevant in open-water 1263
wetlands, where photosynthesis resulted in pH values as high as 10 (see Figure 3.5). 1264
To assess the relative importance of dissolved organic matter and dissolved inorganic 1265 carbon as sinks for radicals, [•OH]ss and [•CO3
-]ss were modeled using equations 3.12 and 3.13. 1266 The measured formation rate of •OH in wetland water when irradiated with a medium-pressure 1267 mercury lamp ((Rform,∙OH,NO3
− + Rform,∙OH,DOM)=4.3x10⁻¹⁰ ± 0.2 M s-1; data not shown) was 1268
similar to previously measured rates (Dong and Rosario-Ortiz, 2012). Steady-state radical 1269 concentrations were calculated by fitting the adjustable parameters k∙OH,DOM and k∙CO3
−,DOM to 1270
equations 3.12 and 3.13 using a least-square model (Figure 3.7). The best-fit value of k∙OH,DOM 1271 (i.e., 1.7x10⁴ (mg L-1-C)-1s-1) was approximately 30% lower than values reported for reactions of 1272 •OH with DOM in natural waters (i.e., 2.3x10⁴ (mg L-1-C)-1s-1) (Brezonik and Fulkerson- 1273 Brekken, 1998) and 80% lower than values for municipal wastewater effluent (i.e., 1274 7.2x10⁴ (mg L-1-C)-1s-1) (Rosario-Ortiz et al., 2008). The best-fit value for k∙CO3
−,DOM (i.e., 1275
370 (mg L-1-C)-1s-1) was approximately 30% higher than previously reported values for a 1276 hydrophobic Suwannee River fulvic acid extract (i.e., 280 (mg L-1-C)-1s-1) (Canonica et al., 1277 2005) and more than 9 times higher than a Suwannee River dissolved organic matter extract (i.e., 1278 40 (mg L-1-C)-1s-1) (Larson and Zepp, 1988). The relatively high reactivity of the natural organic 1279 matter in this study may be attributed to its source—namely wastewater effluent and the algae, 1280 diatoms, and bacteria on the bottom of the cell. Previous research has shown that effluent 1281 organic matter may contain abundant reactive moieties associated with soluble microbial 1282 products (Dong et al., 2010). Presumably the organisms present in the open-water-cell biofilm 1283 released similar reactive compounds. 1284
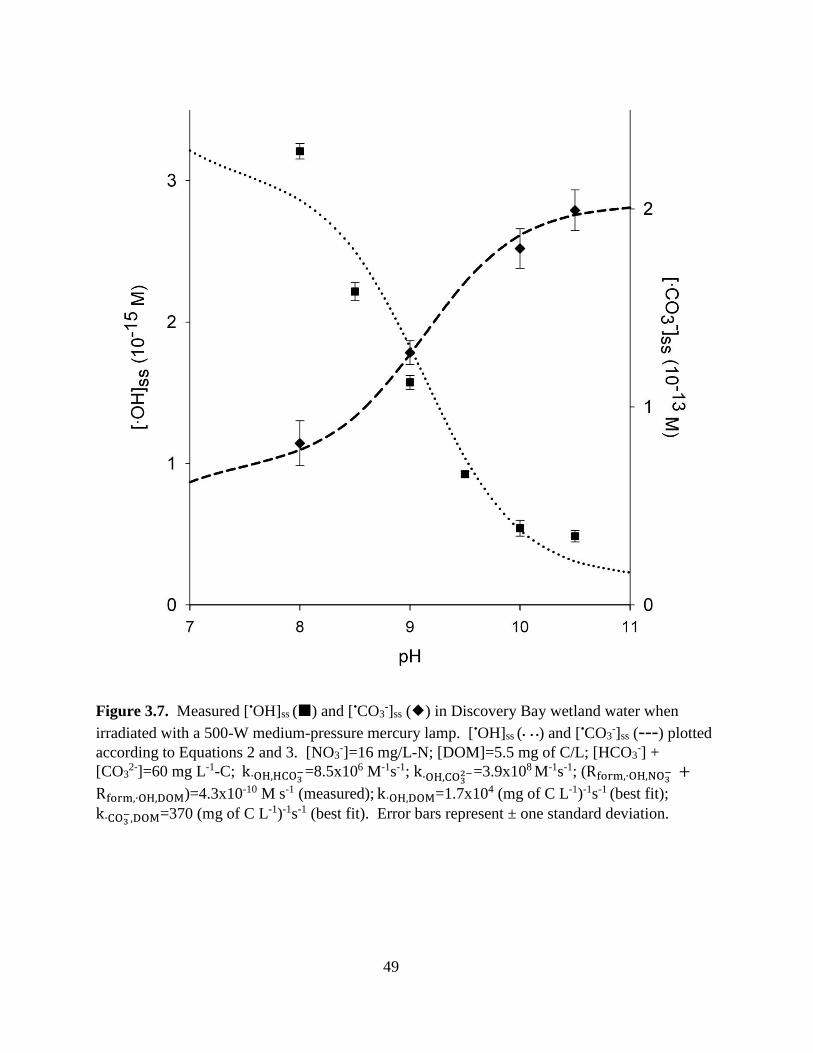
49
1285
Figure 3.7. Measured [•OH]ss () and [•CO3-]ss () in Discovery Bay wetland water when
irradiated with a 500-W medium-pressure mercury lamp. [•OH]ss (• • •) and [•CO3-]ss (---) plotted
according to Equations 2 and 3. [NO3-]=16 mg/L-N; [DOM]=5.5 mg of C/L; [HCO3
-] +
[CO32-]=60 mg L-1-C; k∙OH,HCO3
−=8.5x10⁶ M-1s-1; k∙OH,CO32−=3.9x10⁸ M-1s-1; (Rform,∙OH,NO3
− +
Rform,∙OH,DOM)=4.3x10⁻¹⁰ M s-1 (measured); k∙OH,DOM=1.7x10⁴ (mg of C L-1)-1s-1 (best fit);
k∙CO3−,DOM=370 (mg of C L-1)-1s-1 (best fit). Error bars represent ± one standard deviation.

50
1286
Figure 3.8: Pseudo first-order photolysis rates for test compounds in wetland water, wetland
water sparged with N2, wetland water spiked with 1% IPA, wetland water spiked with 1% IPA
and 0.1% isoprene, and deionized water. All solutions were buffered at pH 8.5. Rates were
measured in a merry-go-round reactor with a 500-W medium-pressure mercury lamp. Error bars
represent ± one standard deviation.
1287

51
1288
Figure 3.9: Pseudo first-order photolysis rates for test compounds in wetland water buffered at
pH 8 and 10.5. Rates were measured in a merry-go-round reactor with a 500-W medium-
pressure mercury lamp. Error bars represent ± one standard deviation.
1289 1290 1291 1292 1293 1294 1295 1296 1297 1298

52
1299
Figure 3.10: Predicted and measured pseudo first-order photolysis rates for test compounds in
20 cm deep wetland water buffered at pH 9 and 10 under a solar simulator. [DOC]=8 mg L-1-C;
[NO3-]=16 mg L-1-N; depth=20 cm; [HCO3
-]+[CO32-]=60 mg L-1-C. Error bars represent ± one
standard deviation.
1300 1301

53
1302
Figure 3.11: Predicted contributions of photolysis mechanisms to kphot at pH values of 8 and 10.
[DOC]=8 mg L-1-C; [NO3-]=20 mg L-1-N; depth=30 cm; [HCO3
-]+[CO32-]=60 mg L-1-C; solar
intensity (Z(24 hr, λ)) of June 21st under clear skies at 40°N latitude.
1303
1304
1305
1306
1307

54
3.4.3 Photolysis of Test Compounds in Wetland Water
Each probe compound exhibited different behavior with respect to the relative 1308 contributions of different photolysis mechanisms when irradiated with a medium-pressure 1309 mercury lamp. Among the compounds studied (atenolol, propranolol, sulfamethoxazole, and 1310 carbamazepine), only sulfamethoxazole and propranolol underwent direct photolysis at 1311 appreciable rates in deionized water (Figure 3.8), which was consistent with previous findings 1312 (Andreozzi et al., 2003; Lin and Reinhard, 2005; Lam and Mabury, 2005). In wetland water at 1313 pH 8.5, •OH accounted for much of the loss of carbamazepine and atenolol, as evidenced by the 1314 80% decreases in transformation rates observed upon addition of IPA (Figure 3.8). 1315
1316 Photosensitized reactions involving 3DOM* were important to the loss of propranolol. 1317
When wetland water was sparged with N2 to remove O2, a triplet quencher, the rate of loss 1318 almost doubled, while addition of the triplet quencher isoprene reduced the rate of propranolol 1319 loss by approximately 50% (Figure 3.8). These observations were consistent with previous 1320 studies of propranolol photolysis in the presence of humic substances (Chen et al., 2009). The 1321 rate of transformation of atenolol, sulfamethoxazole, and carbamazepine increased slightly under 1322 N2-sparged conditions and decreased slightly but not significantly upon addition of isoprene, 1323 implying a small contribution of 3DOM* to the photolysis of these compounds. Results from 1324 other studies suggest that 3DOM* contributes to the photolysis of sulfamethoxazole in municipal 1325 wastewater effluent (i.e., 16% of total photolysis rate) (Ryan et al., 2011) and the photolysis of 1326 atenolol increases in the presence of fulvic acid isolates (i.e., greater than 50% of the total 1327 photolysis rate with 20 mg L-1-C DOM) (Wang et al., 2012). The smaller contribution of 1328 3DOM* observed in this study may have been due to differences in experimental conditions or 1329 variations in the properties of 3DOM* from different sources, such as antioxidative properties 1330 (Canonica and Laubscher, 2008; Wenk et al., 2011). In addition, formation of •OH and •CO3
- 1331 from the high concentration of NO3
- in the nitrified wastewater effluent reduced the relative 1332 importance of reactions with 3DOM*. 1333
1334 To assess the impacts of pH on photolysis rates, experiments were repeated in wetland
water buffered at pH 10.5 (Figure 3.9). Atenolol and carbamazepine, which were transformed
mainly by •OH at pH 8.5, exhibited different behavior at pH 10.5 due to the conversion of •OH to •CO3
-. The rate of loss of carbamazepine decreased by approximately 70% due to its low
reactivity with •CO3-, while the rate of loss was almost unchanged for atenolol due to its
relatively high rate of reaction with •CO3-. As expected, the rate of loss of both sulfamethoxazole
and propranolol increased at high pH values, due to relatively fast rates of reaction of these
compounds with •CO3-.
3.4.4 Photolysis Model Validation and Predictions
Photolysis experiments conducted with a medium-pressure mercury lamp provided a 1335 means of obtaining precise data within a period of several hours. However, the conditions used 1336 in those experiments were different from conditions encountered in sunlit waters. To assess the 1337 potential for artifacts associated with differences in the spectral qualities and light intensity, 1338 photolysis rates were measured using a solar simulator and water depth comparable to that of the 1339 pilot-scale open-water unit process cell. Comparison of measured photolysis rates of test 1340 compounds in the solar simulator agreed within approximately 10% with rates predicted by the 1341

55
photolysis model at pH values bounding the range typically observed in the pilot-scale system 1342 (Figure 3.10). 1343
1344 Due to the large contribution of 3DOM* to the indirect photolysis rate of propranolol 1345
(e.g., see Figure 3.8), it was necessary to estimate a quantum yield coefficient (fpropranolol(λ)) for 1346 the reaction of 3DOM* with propranolol. fpropranolol(λ) was assumed to have a similar exponential 1347 dependence on wavelength as f(λ) values obtained for other organic compounds (i.e., 1348 f(λ)=A*e-0.02*λ L Ei-1, where A is a compound-dependent parameter) (Gerecke et al., 2001). The 1349 parameter A was estimated for propranolol by minimizing the differences between model 1350 predictions and photolysis rates measured using a solar simulator. The obtained value for 1351 Apropranolol was about 5 times larger than the reported value for diuron (i.e., Adiuron=3.5; 1352 Apropranolol=16) (Gerecke et al., 2001). 1353
1354 The photochemical model was used to predict the contributions of different photolysis 1355
pathways to the overall photolysis rates of the test compounds and two additional compounds for 1356 which appropriate data were available (i.e., NDMA and 17β-estradiol). The predicted 1357 contributions of each photolysis mechanism to overall photolysis rates of test compounds were 1358 similar to those observed using quenchers and the mercury lamp (Figure 3.8). For compounds 1359 that reacted mainly with •OH and •CO3
- (i.e., atenolol and carbamazepine), predicted half-lives 1360 exceeded 3 days at pH 8 and 5 days at pH 10 (Figure 3.11). Propranolol and sulfamethoxazole 1361 were predicted to have half-lives of 0.5 to 1 days, with higher rates expected at pH 10 due to 1362 reactions involving •CO3
-. 1363 1364 Literature data was used to predict the removal of NDMA and 17β-estradiol in the open- 1365
water cell. NDMA was predicted to exhibit half-lives of less than 8 hours at pH 8 due to direct 1366 photolysis, with a half-life almost twice as long at pH 10 due to the lower quantum yield of the 1367 compound above pH 8.5 (Lee et al., 2005). Predicted half-lives for 17β-estradiol were about 1368 2.5 days at pH 8 and 1 day at pH 10, due to increased reaction rates of 1O2 and •CO3
- with the 1369 deprotonated species at alkaline pH values. 1370
1371 3.4.5 Estimation of Wetland Area Necessary for Contaminant Photolysis
To assess the merits of open-water unit process wetlands as a means of removing 1372 chemical contaminants via photolysis it is useful to consider the area necessary to achieve a 1373 desired level of treatment. For many wastewater-derived organic contaminants, a 90% decrease 1374 in concentration will result in concentrations below a threshold for ecological or human health 1375 concerns. For example, a 90% reduction of typical propranolol concentrations in municipal 1376 wastewater effluent (i.e., 0.1-0.5 μg L-1) (Sedlak and Pinkston, 2001; Huggett et al., 2003) would 1377 result in concentrations that are about an order of magnitude lower than the concentration at 1378 which reproductive effects in aquatic organisms have been observed (Huggett et al., 2002). 1379 Similarly, a 90% reduction would reduce NDMA concentrations in most wastewater effluent 1380 samples below the 10 ng L-1 notification level set by the California Department of Health 1381 Services (Mitch et al., 2003). In addition, a tenfold decrease in concentration of wastewater- 1382 derived trace organic contaminant concentrations would result in concentrations in effluent- 1383 dominated waters that are comparable to levels typically detected in surface waters (i.e., many 1384 surface waters in the United States consist of around 10% wastewater under low-flow 1385 conditions) (National Research Council, 2012). 1386

56
For the purpose of assessing the land required for treatment, it is useful to consider the 1387 area needed to achieve 90% reduction in concentration for 1 MGD of wastewater effluent. This 1388 provides a simple basis for estimating land areas in different locations (i.e., to estimate the land 1389 needed to treat 10 MGD the value is multiplied by 10). This value, which we refer to as A90
1 , is 1390 calculated as follows: 1391
1392 We first calculate the nominal hydraulic residence time (HRT) of the system and convert 1393
it to units of hectares per MGD (ha MGD-1): 1394 1395
HRT =z(m) A(m2)
Q(m3d−1)=
z(m)A(ha)10,000 m2
1 ha
Q(MGD)3785 m
3d
⁄
1 MGD
= 2.64(MGD d m−1ha−1)z(m)A(ha)
Q(MGD) (A3.14) 1396
1397 Where A is the wetland area, Q is the volumetric flow rate, and z is the depth. Since photolysis 1398 obeys pseudo-first order kinetics, the time necessary for 90% removal of a contaminant can be 1399 replaced by HRT in the equation for first-order degradation: 1400 1401
C
Co= 0.1 = e−kphoto t = e−kphoto HRT (3.15) 1402
1403 By taking the natural logarithm of both sides of Equation 3.15, substituting in Equation 3.14 for 1404 HRT, and rearranging yields: 1405 1406
A(ha) =− ln(0.1)
2.64 (MGD d ha−1m−1)
Q (MGD)
z(m)kphoto(d−1)= 0.87(MGD−1d−1m ha)
Q (MGD)
z(m)kphoto(d−1) (3.16) 1407
1408 Using a volumetric flow rate of 1 MGD yields: 1409 1410
A901 (ha) =
0.87 (MGD−1d−1ha m)
z(m) kphoto(d−1) (3.17) 1411
1412 Wetland area is an important design criterion for wetland projects because they are often 1413
limited by available space, and capital costs for wetland construction increase approximately 1414 linearly with wetland area (Kadlec, 2009). To assess the impact of design parameters on wetland 1415 performance, the model was used to predict A90
1 for a suite of representative contaminants. 1416 1417
Effect of Depth on Treatment Efficiency. A901 decreased with increasing depth for all 1418
compounds, with the most significant decreases occurring between 0 and 20 cm (Figure 3.12a). 1419 Deeper open-water cells were predicted to be more effective because decreases in photolysis 1420 rates due to light screening were compensated for by increases in wetland hydraulic residence 1421 times. 1422
1423 Wetland depths beyond 50 cm may be impractical for open-water cells because deeper 1424
wetlands result in longer hydraulic residence times that are conducive to the growth of floating 1425 aquatic plants, such as duckweed (EPA, 2000a). Furthermore, deep photolysis wetlands will 1426 exhibit less growth of photosynthetic organisms at the sediment-water interface—a location 1427 where additional contaminant removal occurs via sorption and biotransformation (Chapter 4). 1428

57
1429
Figure 3.12: Area predicted to provide 90% removal of contaminants from 1 MGD of
wastewater effluent in open-water treatment wetlands (𝐀𝟗𝟎𝟏 ) under varying: (a) depth; (b) [DOC];
(c) pH; and (d) season. If not varied, pH=8; [DOC]=8 mg L-1-C; [NO3-]=20 mg L-1-N; depth=30
cm; [HCO3-]+[CO3
2-]=60 mg L-1-C; solar intensity (Z(24 hr, λ) of June 21st under clear skies at
40°N latitude. Dashed lines show the area per MGD of existing full-scale wetland systems and
the typical size of wetlands designed for nitrate removal.
1430

58
1431
Figure 3.13: Area needed to provide 1-log removal of contaminants from 1 MGD with different
[NO3-] under clear skies at 40° N latitude summer sunlight (Z(24 hr, λ)). [DOC]=8 mg L-1-C;
depth=30 cm; [HCO3-]+[CO3
2-]=60 mg L-1-C; pH=8. Dashed lines show the area per MGD of
existing full-scale wetland systems.
1432 1433 1434 1435 1436 1437 1438 1439 1440
0
10
20
30
0 5 10 15 20
A901
(ha
MG
D-1
)
[NO3-] (mg L-1-N)
carbamazepine
atenolol
sulfamethoxazole
propranolol
NDMA
Easterly wetlands
Prado wetlands
size forNO3
-
removal

59
Effect of Nitrate on Treatment Efficiency. Nitrate is expected to be important to the 1441 removal of compounds that react with •OH and •CO3
-, such as atenolol and carbamazepine. As a 1442 result, removal of these compounds from nitrified wastewater effluent, which typically contains 1443 5 to 20 mg L-1-N NO3
- (Pocernich and Litke, 1997), is predicted to require an area that is about 1444 half as large as what would be required if the wastewater had been denitrified prior to treatment 1445 (Figure 3.13). 1446
1447 Effect of Dissolved Organic Carbon on Treatment Efficiency. Dissolved organic carbon 1448
had a strong effect on A901 for most compounds, mainly due to its ability to screen sunlight and 1449
scavenge •OH and •CO3- (Figure 3.12b). For compounds that are removed primarily by reaction 1450
with •OH and •CO3-, such as carbamazepine, atenolol, and sulfamethoxazole, A90
1 increased by 1451 approximately 50% when dissolved organic carbon concentration increased from 5 to 10 mg L-1. 1452 Compounds that react rapidly with 3DOM*, such as diuron, showed the most significant 1453 differences in A90
1 at very low concentrations of dissolved organic carbon. This may also be true 1454 for compounds such as 17β-estradiol if reaction with 3DOM* were included in model predictions 1455 (Leech et al., 2009). Unfortunately, rate constants for reactions of 3DOM* with many 1456 compounds are not available, which is a topic that requires further research. 1457
1458 1O2
steady-state concentrations were predicted to increase with increasing concentrations 1459 of dissolved organic matter. Thus, compounds that react rapidly with 1O2, such as cimetidine, 1460 exhibited little change in A90
1 as dissolved organic carbon concentrations increased, despite 1461 increased light screening at higher dissolved organic carbon concentrations. It should be noted 1462 that the supersaturated dissolved oxygen concentrations created by photosynthetic organisms on 1463 the bottom of open water cells could have increased the importance of 1O2 relative to 3DOM*, 1464 due to the scavenging of 3DOM* by O2. Additional research would be needed to quantify the 1465 magnitude of this effect. 1466
1467 Effect of pH on Treatment Efficiency. Open-water unit process cells exhibit wide 1468
variations in pH that are determined by the alkalinity, depth, and mixing of the wastewater 1469 effluent, in addition to the activity of photosynthetic organisms at the sediment-water interface. 1470 For example, in the pilot-scale cell employed in this study, pH increased from values of 8 to 10 1471 as water passed through the system over a two-day residence time (Figure 3.5). In the early 1472 morning, or before the photosynthetic organisms were established, pH values remained below 9 1473 throughout the cell. 1474
1475 Changes in wetland pH affected the area needed to remove most contaminants via 1476
photolysis (Figure 3.12c). Insight into these trends can be gained by considering dominant 1477 photolysis mechanisms for test compounds at pH values of 8 and 10 (Figure 3.11). One 1478 important pH-dependent change was the conversion of •OH to •CO3
- (Figure 3.7). As a result of 1479 this phenomenon, compounds that react slowly with •CO3
- under alkaline conditions (i.e., 1480 k∙CO3
−<108 M-1s-1), such as atenolol and carbamazepine, are predicted to require larger areas for 1481
treatment at higher pH values. Conversely, compounds that react with •CO3- at rates above 1482
108 M-1s-1 (e.g., sulfamethoxazole and propranolol) should require the same or slightly smaller 1483 areas at elevated pH values. 1484
1485

60
Phenolic compounds (e.g., 17β-estradiol) should need less area for treatment at elevated 1486 pH values because their deprotonated forms react with 1O2 and •CO3
- at rates that are over an 1487 order of magnitude faster than their protonated forms (Neta et al., 1988; Tratnyek and Hoigné, 1488 1991). 1489
1490 Direct photolysis rates were also affected by pH due to changes in molar absorption 1491
coefficients or quantum yields of different forms of the compounds (Boreen et al., 2004). For 1492 example, the rate of direct photolysis of NDMA was predicted to decrease by approximately 1493 75% between pH 7 and 10 (Figure 3.11) due to the effect of protonation of an excited photo- 1494 intermediate on the reaction quantum yield (Lee et al., 2005). For NDMA, this effect translated 1495 to more than doubling A90
1 as pH increased from 8 to 10. 1496 1497 Effect of Season on Treatment Efficiency. Seasonal variations in solar intensity should 1498
also affect A901 . For all modeled compounds, A90
1 values were predicted to increase by a factor of 1499 3 to 4 between summer and winter conditions (Figure 3.12d). 1500
1501 Seasonal variation in treatment efficiency is a common challenge for treatment wetlands. 1502
For example, microbial denitrification rates slow significantly under cold winter conditions 1503 (Bachand and Horne, 2000). In some locations, the summertime period when open-water cells 1504 exhibit their best performance will coincide with times of low flow in receiving waters (Loraine 1505 and Pettigrove, 2005). The design of open-water unit process cells will need to account for 1506 seasonal variations in dilution and conditions in these receiving waters. 1507
1508 3.4.6 Comparison of Photolysis Cells and Existing Wetlands
To gain insight into the feasibility of building open-water unit process cells, it is useful to 1509 compare predicted A90
1 values for photolysis with the areas occupied by existing wetlands 1510 designed to remove nutrients or to provide wildlife habitat (dashed lines in Figure 3.12). The 1511 Prado wetlands in Orange County, California occupy approximately 200 ha. They currently 1512 receive up to 65 MGD of water from the effluent-dominated Santa Ana River, yielding a 1513 footprint of about 3 ha MGD-1 (Orange County Water District, 2008). The Easterly Wetlands, 1514 located near Orlando, Florida, receive approximately 20 MGD of wastewater effluent in 475 ha, 1515 yielding a footprint of about 22 ha MGD-1 (Florida Department of Environmental Protection, 1516 2012). Wetland footprints of between 6 and 14 ha MGD-1 have been recommended for the 1517 removal of nitrate in surface flow constructed wetlands (Horne, 1995). 1518 1519
Comparison of predicted values of A901 with areas of existing full-scale wetlands suggests 1520
that open-water cells can provide efficient year-round treatment of photo-labile compounds, such 1521 as NDMA and propranolol. During spring and summer, the cells would also provide substantial 1522 removal of less reactive compounds, such as 17β-estradiol and sulfamethoxazole. The least 1523 photo-reactive compounds, such as carbamazepine and atenolol, would only be removed to a 1524 significant extent through photolysis in relatively large photolysis wetlands during summer 1525 months. In practice, A90
1 values may be considerably lower because microbes at the sediment- 1526 water interface will remove contaminants by biotransformation (Chapter 4). 1527
1528 1529

61
3.4.7 Application to Wetland Design
The model described above may also be used to assess the role of photolysis in wetlands 1530 that were built without open-water zones designed to enhance photolysis. Many wetlands 1531 include open water sections for mixing or waterfowl habitat. In these wetlands, A90
1 values can 1532 be estimated by accounting for the fraction of open water (Fopen) in partially vegetated or shaded 1533 wetlands: 1534
1535 A90,vegetated
1 = FopenA901 (3.18) 1536
1537 For example, the Tarrant Regional Water District’s treatment wetlands, located south of Dallas- 1538 Ft. Worth, Texas, consist of about 50% open water intermixed with emergent vegetation (Kadlec 1539 et al., 2011). The wetland has a footprint of about 8 ha MGD-1, making approximately 1540 4 ha MGD-1 available for photolysis. Thus, according to model predictions depicted in Figure 1541 3.12, photolysis may be remove many photo-labile contaminants in this system. 1542
1543 Ideally, however, open-water unit process cells will be designed as part of a unit process 1544
wetland with different types of wetland cells combined in series to maximize treatment 1545 efficiency and reliability (Chapter 2). Due to the effect of NO3
- on the production of •OH and 1546 •CO3
-, an open-water cell would likely be most effective for removal of trace organic 1547 contaminants as the first process in the treatment wetland. However, additional research is 1548 needed to determine if wetland-derived dissolved organic carbon is more photoreactive than 1549 wastewater-derived dissolved organic carbon, which could result in increased photolysis rates for 1550 certain compounds in open-water unit process cells situated downstream of vegetated wetland 1551 cells (Pinney et al., 2000). 1552
1553 It is also important to note that most trace organic contaminants will be transformed, and 1554
not mineralized, in photolysis wetlands. Although many photo-products will lack the specificity 1555 of their parent compounds with respect to biological receptors, further research is needed to 1556 determine if additional risks are posed by photo-products. It is also possible that photo-products 1557 produced are more amenable to biotransformation in subsequent unit process cells than their 1558 parent compounds. 1559

62
CHAPTER 4. Biotransformation of Trace Organic Contaminants in
Open-Water Unit Process Treatment Wetlands
Reprinted with permission from Jasper, J.T.; Jones, Z.L.; Sharp, J.O.; Sedlak, D.L.
Biotransformation of trace organic contaminants in open-water unit process treatment wetlands.
Environ. Sci. Technol. 2014, 48, 5136-5144.
© 2014 American Chemical Society.

63
4.1 Introduction
Engineered treatment wetlands are commonly employed as polishing steps for municipal 1560 wastewater effluent to remove nutrients and metals that would otherwise require costly upgrades 1561 to wastewater treatment plants (Kadlec and Wallace, 2009; Vymazal, 2010). Increasingly, 1562 treatment wetlands are also being considered as a cost-effective and sustainable means of 1563 removing trace organic contaminants (e.g., pharmaceuticals and personal care products) from 1564 municipal wastewater effluent (Oulton et al., 2010; Hijosa-Valsero et al., 2010a; Chapter 2). 1565
1566 Effective trace organic contaminant removal in treatment wetlands is commonly hindered 1567
by hydraulic inefficiencies, such as short-circuiting, in addition to a limited understanding of 1568 how wetlands can be designed to optimize trace organic contaminant removal. The result is 1569 drastic variations in trace organic contaminant removal efficiencies among vegetated wetland 1570 systems (Chaper 2; Li et al., 2014). The application of unit process design (e.g., connecting 1571 wetland cells optimized for the treatment of specific contaminants in series) could provide more 1572 effective removal of contaminants, while reducing hydraulic inefficiencies. However, successful 1573 implementation of this design strategy requires both a mechanistic understanding of removal 1574 processes in wetland cells as well as the development of novel wetland cells designed 1575 specifically for the removal of target contaminants. 1576
1577 As part of an effort to develop new unit process wetland cells, we recently described an 1578
open-water cell capable of removing photo-labile trace organic compounds (Chapter 2). 1579 Preliminary monitoring studies at the pilot-scale open-water cell indicated that the removal of 1580 several trace organic contaminants could not be explained by photolysis alone. As a result, we 1581 hypothesized that algae and associated microbes that formed a 2-7 cm thick biomat on the 1582 wetland bottom were responsible for some of the contaminant attenuation. Previous studies of 1583 algae and bacteria in streams receiving wastewater effluent indicate that microbial communities 1584 at the water-sediment interface are capable of removing trace organic contaminants such as 1585 17β-estradiol, 4-nonylphenol, ibuprofen, and microcystin-RR. In many cases, these biofilms are 1586 more important to contaminant attenuation than suspended microorganisms (Winkler et al., 1587 2001; Wu et al., 2010; Writer et al., 2011a, 2011b). 1588
1589 The microbial community that grows in shallow, open-water cells receiving municipal 1590
wastewater effluent may be more effective at transforming trace organic contaminants than 1591 communities in shallow streams, because high nutrient inputs and low water velocities lead to 1592 accumulation of more biomass. Furthermore, continuous exposure to wastewater effluent may 1593 lead to selection for organisms capable of metabolizing wastewater-derived contaminants. 1594
1595 The biomat may also be able to transform certain compounds more efficiently than the 1596
microbes in wastewater treatment plants. Carbon availability and cycling in this mixed 1597 autotrophic/heterotrophic assemblage results in a gradient with respect to electron acceptors and 1598 labile carbon compounds that is different from the conditions encountered in a conventional 1599 wastewater treatment plant. For example, during the day algal photosynthesis leads to 1600 supersaturated dissolved oxygen concentrations, which can enhance the rate of biotransformation 1601 of certain compounds (Matamoros et al., 2005; Hijosa-Valsero et al., 2010a, 2010b), while 1602 anoxic zones formed by microbial respiration at night or within the biomat may enhance 1603 biotransformation of other compounds (Xue et al., 2010; Khunjar et al., 2011). 1604

64
The purpose of this study was to evaluate the ability of a surface-flow open-water 1605 wetland cell receiving fully nitrified wastewater effluent to remove a suite of wastewater-derived 1606 trace organic contaminants through sorption and biotransformation. To provide insight into the 1607 microbiology of the biomat, the community present on the wetland bottom was characterized by 1608 both phylogenetic 16S rRNA gene sequencing and microscopic approaches. Biotransformation 1609 rates and sorption capacities were assessed in microcosms utilizing biomass from the pilot-scale 1610 wetland and were compared to removal rates of test compounds in a pilot-scale open-water 1611 wetland cell. 1612
1613 4.2 Materials and Methods
4.2.1 Materials
All reagents were purchased from Fisher Scientific (Fairlawn, NJ) at the highest available 1614 purity. Isotopically-labeled internal standards were purchased from CDN Isotopes (Quebec, 1615 Canada), except for sulfamethoxazole-d4 which was purchased from Toronto Research 1616 Chemicals, Inc. (Ontario, Canada). All solutions were prepared using 18 MΩ Milli-Q water 1617 from a Millipore system. 1618
1619
1620
Figure 4.1: Photograph of the pilot-scale open-water unit process cell, located in Discovery Bay,
CA (37.9˚N, 121.6˚W). Arrows indicate flow direct and X indicates sampling location.
1621 1622
4.2.2 Monitoring of the Pilot-Scale Wetland.
Ambient test compound concentrations and water quality parameters were monitored in a 1623 shallow (20 cm deep), pilot-scale open-water wetland (area=0.04 ha) in Discovery Bay, 1624 California that had been operating for 3 years (Figure 4.1). The cell was lined with a non- 1625 permeable geotextile fabric to prevent the growth of emergent macrophytes. The bottom of the 1626 cell was colonized by a diffuse (90±5% water by volume) biomat consisting of algae, associated 1627

65
microorganisms, and detritus. The biomat was approximately 7 cm thick near the cell inlet and 1628 tapered in thickness along the flow path of the wetland to 2 cm near the cell outlet, occupying 1629 about 20% of the cell volume and corresponding to a total dry mass of approximately 1000 kg. 1630 Although the biomat was not firmly attached to the wetland bottom, it was not disturbed at the 1631 low flow rates employed. Photosynthesis resulted in daytime dissolved oxygen concentrations as 1632 high as 25 mg L-1 during the summer. 1633
1634 The wetland cell received approximately 7x10⁻³ to 2x10⁻² million gallons per day (MGD) 1635
(i.e., 2.6x10⁻² to 7.6x10⁻² ML d-1 (MLD)) of un-disinfected, nitrified wastewater effluent from 1636 the adjacent oxidation ditch treatment plant. The hydraulic residence time in the cell ranged 1637 from 1 to 3 days. Relatively short hydraulic residence times were employed to prevent the 1638 growth of floating vegetation (EPA, 2000a). Baffles installed across the cell ensured 1639 approximately plug-flow conditions, as indicated by Rhodamine-WT tracer tests (Figure 4.2). 1640
1641 Aqueous samples were collected at the influent, effluent, and at the end of each of the 1642
three baffles over a 3-year period (Figure 4.1). Aqueous samples were collected in 1 L, baked 1643 amber glass bottles, filtered through 1 μm glass fiber filters and refrigerated prior to analysis. 1644 400 mL samples were amended with approximately 10 ng of isotopically-labeled internal 1645 standards and extracted via SPE, as described above, prior to analysis. In some cases, 1 mL 1646 samples were amended with 2.5 ng of isotopically-labeled internal standards, and analyzed by 1647 HPLC-MS/MS with direct injection of either 100 μL or 800 μL sample aliquots. Samples were 1648 analyzed within 3 days of collection. 1649
1650 Test compounds were extracted from biomat samples collected throughout the pilot-scale 1651
wetland using methanol, as described below. 1652 1653 Compound attenuation rates were calculated by fitting concentrations measured 1654
throughout the wetland to pseudo first-order kinetics (r2>0.8) assuming plug-flow hydraulics: 1655 1656
C = Coe−kpilotV/Q (4.1) 1657 1658
where C is the compound concentration; Co is the compound concentration at the influent; kpilot is 1659 the pseudo first-order attenuation constant (d-1); V is the cell volume (i.e., 8x10⁴ L); and Q is the 1660 flow rate measured at the wetland inlet (i.e., 2.6x10⁻² to 7.6 x10⁻² MLD). 1661

66
1662
Figure 4.2: Breakthrough curve of rhodamine-WT in a tracer test in the pilot-scale open-water
cell. Rhodamine-WT was injected at cell inlet at 0 hours and samples were collected at the cell
outlet and analyzed by fluorometry (Turner TD 700). The center of mass was calculated to be 27
hours. The flow into the cell was 1.9x10⁻² MGD (8.1x10⁻⁴ m3 s-1).
1663
0
500
1000
1500
0 25 50 75
Flu
ore
scene (
Arb
itra
ry u
nits)
Time (hr)

67
1664
Figure 4.3: Spectrum of the red lamp used in microcosm experiments measured with a
spectroradiometer (Stellarnet).
1665
0.0
0.2
0.4
0.6
0.8
1.0
300 350 400 450 500 550 600 650 700 750 800
Irra
dia
nce (
W c
m-2
)
Wavelength (nm)

68
1666
Figure 4.4: Percent mass recovery of test compounds amended to reactors containing autoclaved
wetland biomass (13 g L-1) maintained at pH 8.7 (black) and pH 10.0 (gray) by buffering with 20
mM borate. Reactors were gently mixed in triplicate on a rotisserie for 2 hours at 4˚C in the dark
prior to extraction. Error bars represent ± one standard deviation.
1667
1668
1669
1670
1671
0%
20%
40%
60%
80%
100%
120%
% R
ecovery

69
1672 4.2.3 Microcosms
Experiments to assess test compound sorption and biotransformation were conducted in 1673 triplicate in uncovered microcosms containing 1 L of 1-µm filtered water collected from the 1674 midpoint of the Discovery Bay open-water cell ([DOC]≈8 mg C L-1; [NO3
-]≈10 mg N L-1), and 1675 freshly collected biomass from the cell bottom (approximately 8 g dry mass). Microcosms were 1676 amended with a mixture of six test compounds at a concentration of 5 μg L-1 each. Microcosms 1677 were incubated at room temperature (25-30°C) in the dark or under monochromatic visible light 1678 (635 nm; 13.5 W red light, GenCom). The light supported photosynthesis without transforming 1679 the test compounds via photolysis (see Figure 4.3 for lamp spectrum). Dark microcosms were 1680 gently agitated from above using stir bars suspended on nylon strings to mimic the effects of 1681 mixing in wetlands while minimizing perturbation of the biomat. Illuminated microcosms were 1682 mixed via bubbles produced by photosynthesis in the biomat. Dark microcosms exhibited a 1683 stable pH value of approximately 8.5. In illuminated microcosms, irradiation with visible light 1684 increased the pH value to approximately 10 within 24 hours. 1685
1686 1 mL aqueous samples were collected throughout microcosm experiments, and were 1687
filtered through 1 μm glass-fiber Acrodisc syringe filters (Pall Corporation), amended with about 1688 2.5 ng of each isotopically-labeled internal standard, and refrigerated until analysis (within 1 1689 week). Test compounds were extracted from dewatered (centrifuged at 5,000 RPM, 10 minutes), 1690 wet biomat samples (about 0.1 g dry weight). Samples were agitated for approximately 8 hours 1691 on a rotisserie in 15 mL of methanol amended with about 2.5 ng of each isotopically-labeled 1692 internal standard. Methanol extracts were filtered (1 μm glass-fiber; Millipore, Bellerica, MA) 1693 and diluted to 1 L with deionized water prior to clean-up and concentration via solid phase 1694 extraction (SPE). The SPE media consisted of 50 mg Waters Oasis hydrophilic-lipophilic 1695 balance (HLB) in cartridges pretreated with 10 mL of methanol, followed by 10 mL of Milli-Q 1696 water. Cartridges were eluted with 12 mL of methanol, dried under a gentle nitrogen stream, and 1697 re-suspended in 1 mL of Milli-Q water prior to analysis via HPLC-MS-MS. 90 to 120% 1698 recoveries of analytes from autoclaved biomat samples were achieved Figure 4.4. 1699 1700
1701
1702
1703
1704
1705
1706
1707
1708
1709

70
Table 4.1: Compound-Specific Mass Spectrometry Parametersa compound precursor
ion
(amu)
fragmentor
voltage
(V)
product
ions (amu)
collision
energy
(V)
cell
accelerator
(V)
ionization
mode
1-naphthoxy acetic
acid
201 80 143
115
15
45
0
5
negativeb
4-OH-propranolol 276 115 173
116
15
15
5
5
positivec
Atenolol 267
130
145
190
24
16
7
positive
Atenolol-d7 274 130 145 24 7 positive
Carbamazepine 237 120 179
194
35
15
7 positive
Carbamazepine-d10 247 120 204 20 7 positive
Metoprolol 268 130 159
116
17
14
7 positive
Metoprolol-d7 275 130 123
159
14
17
7 positive
Metoprolol-α-OH 284 130 116
74
15
15
7 positive
Metoprolol-α-OH-d5 289 135 121 15 5 positive
Metoprolol acid
268 130 191
145
17
25
7 positive
Metoprolol acid-d5 273 130 196 17 7 positive
Nor propranolol 218 100 155
127
15
45
5 positive
Nor propranolol-d7 255 100 189 12 5 positive
Propranolol 260 98 116
183
13
12
7 positive
Propranolol-d7 267 98 116 13 7 positive
Sulfamethoxazole 254 110 92
156
25
10
7 positive
Sulfamethoxazole-d4 258 110 96 25 7 positive
Trimethoprim 291 140 123
261
20
17
7 positive
Trimethoprim-d3 294 140 123 20 7 positive
aAll compounds were analyzed using a drying gas temperature of 350˚ C, a gas flow of 12 L min-1, a nebulizer 1710
pressure of 60 psi, a sheath gas temperature of 400 ˚ C, a sheath gas flow of 12 L min-1, and a nozzle voltage of 300 1711 V.
bCompounds analyzed by positive ionization used a capillary voltage of 3600 V.
cCompounds analyzed by 1712
negative ionization used a capillary voltage of 4500 V. 1713
1714
4.2.4 Determination of Biotransformation Products
Test compound biotransformation products were identified in microcosms amended 1715 with a relatively high concentration of a single test compound (i.e., 100 mg L-1). 1716 Biotransformation products were identified by high performance liquid chromatography-mass 1717 spectrometry (HPLC-MS) in full scan mode from 100-400 amu, in both positive and negative 1718 ionization modes. MS conditions were the same as those used for analytes (Table 4.1). 1719 Biotransformation products were verified with commercial analytical standards. Methods 1720 were subsequently developed for quantification of biotransformation products in microcosms 1721 (Table 4.1). 1722
1723 1724 1725

71
4.2.5 Photolysis Rate Prediction
The contribution of photolysis to the attenuation of test compounds in the pilot-scale 1726 system was assessed by extending a previously developed model for photolysis in shallow, open- 1727 water wetlands to include trimethoprim and metoprolol (Chapter 3). Briefly, pseudo first-order 1728 photolysis rates were calculated for direct and indirect photolysis using solar irradiance values 1729 predicted by the Simple Model of the Atmospheric Radiative Transfer of Sunshine (SMARTS) 1730 (Gueymard, 2003). Indirect photolysis rates were calculated using predicted steady-state 1731 concentrations of hydroxyl radical, carbonate radical, singlet oxygen, and triplet dissolved 1732 organic matter, in conjunction with second-order reaction rates of these reactive intermediates 1733 with test compounds. Average measured water quality parameters at the middle of the 1734 Discovery Bay open-water wetland used for the estimates were as follows: [NO3
-]=10 mg L-1-N 1735 in the summer and 15 mg L-1-N during the remainder of the year; pH=9; [DOC]=8 mg L-1-C; and 1736 [HCO3
-]+[CO32-]=60 mg L-1-C. 1737
1738 4.2.6 Correcting for Evaporation in the Pilot-Scale Cell
The effect of evaporation in the open-water cell was estimated by including an extra term 1739 in the calculation of the first-order rate constant, k, according to: 1740
1741
ln (F C
Co) = −kt (4.2) 1742
1743 where C and Co are the concentration at time t and the initial concentration, respectively, and F is 1744 the fraction of water remaining after evaporation (F<1). This equation may be rearranged to 1745 give: 1746 1747
k = −ln(F)
t−
ln( CCo
)
t= −
ln(F)
t+ kobs (4.3) 1748
1749 where kobs is the pseudo first-order removal rate of a compound observed in the wetland. Thus, 1750 1751
kobs = k +ln(F)
t (4.4) 1752
1753
where ln(F)
t<0 and corrects for evaporation. Approximately 10% evaporation (i.e., F=0.9), 1754
quantified using increases in chloride concentrations, was typical during summer between the 1755
cell inlet and outlet (Figure 4.5). Based on a residence time of 1.5 days, ln(F)
t=-0.07 d-1. 1756
1757 1758 1759 1760 1761

72
1762
Figure 4.5: Average Cl- concentrations throughout pilot-scale open-water cell during summer
2013. Error bars represent ± standard error of the mean.
1763
1764
1765
1766
1767
1768
1769
300
325
350
375
400
425
0 0.5 1 1.5
[Cl- ]
(m
g L
-1)
Residence time (d)
Inlet Middle Outlet

73
4.2.7 Microbial Community Characterization
Pilot-scale wetland biomat samples (250 µL) for fluorescent microscopy were washed 1770 twice by centrifuging and re-suspending in phosphate buffer solution, before incubating in 1771 SYBR Green (stock solution diluted by a factor of 25,000) for 1.5 hours. Fluorescent images 1772 were generated using exciting/emission wavelengths of 473/490-540 nm for SYBR Green and 1773 645/664 nm for autofluorescence of chloroplasts (Olympus Fluoview FV10i). Scanning electron 1774 microscopy (Hitachi TM-1000 Tabletop Microscope) was conducted on fresh biomass samples 1775 dried overnight on foil and placed on carbon tape. 1776
1777 Approximately 1 g of biomass was sampled from dark microcosms and microcosms 1778
illuminated with visible light (635 nm) at the beginning, middle, and end of biotransformation 1779 microcosm experiments. Samples were shipped overnight on dry ice and stored at -80° C prior 1780 to extraction. DNA was extracted from 0.25g of sample using the Mo Bio PowerBiofilm DNA 1781 Isolation Kit per manufacturer’s protocol. Extracted DNA was amplified in triplicate 25 µl 1782 reactions without Illumina adaptors or primers pads on a Roche LightCycler 480II. A portion of 1783 the 16S rRNA gene was amplified using Phusion Master Mix (New England BioLabs, Inc), 3% 1784 final volume DMSO, 0.4x final concentration SYBR Green, 200nM 515F 1785 (5’GTGYCAGCMGCCGCGGTAA 3’) (Hamady et al., 2008), and 12bp Golay barcoded 806R 1786 (5’XXXXXXXXXXXXCCGGACTACHVGGGTWTCTAAT 3’) (Caporaso et al., 2012). The 1787 amplification program was: 94°C 3 min; 94°C 45 sec , 50°C 10 sec, 72°C 90 sec. The program 1788 was stopped after all samples had amplified. Triplicates were pooled and purified using 1789 Agencourt AMPure XP and quantified using a Life Sciences Qubit 2.0 Flurometer. Normalized 1790 amplicons were sequenced on the Illumina MiSeq platform using NEBNext Ultra DNA Library 1791 Prep Kit and a MiSeq Reagent Kits v2 2x250 500 cycle kit. 1792 1793
The sets of 250 bp sequences were stitched together using ea-utils (Aronesty, 2011) fastq- 1794 join with a minimum base pair overlap of 100. Stitched sequences were reverse complimented 1795 with the fastx toolkit (Pearson et al., 1997) in order to account for sequences that were sequenced 1796 in the reverse direction. The resulting sequences were processed in QIIME 1.7 dev (Caporaso et 1797 al., 2010) starting with sl_prep_fastq.py to create a barcode .fastq file. The resulting sequence 1798 and barcode file were demultiplexed using split_libraries_fastq.py with default parameters, 1799 except for “--barcode 12”, to negate error correcting of barcodes, as any sequences with errors 1800 would have been filtered out by sl_prep_fastq.py. Otus were piked de novo using Usearch 6.1 1801 (Edgar, 2010) and chimeras were filtered out using the Greengenes gold database (DeSantis et 1802 al., 2006). Representative sequences were aligned using PyNAST (Caporaso et al., 2009) and 1803 greengenes 13_5 aligned reference database. Taxonomy was assigned using the RDP classifier 1804 and greengenes 13_5 97 otu taxonomy database and the otu table was then rarified to 5050 1805 sequences before further analysis. All phyla with less than 1% relative abundance were filtered 1806 out. 1807 1808
DNA for the 23S rRNA gene algal clone library was extracted in the same way as the 1809 microcosm samples and amplified with p23SrV_f1 and p23SrV_r1, GGA CAG AAA GAC CCT 1810 ATG AA, and TCA GCC TGT TAT CCC TAG AG, respectively, with the published 1811 amplification protocol (Sherwood and Presting, 2007). Amplicon was purified via gel 1812 electrophoresis using the E. Z. N. A. gel extraction kit (Omega). Purified amplicon was then 1813 transformed into electro-competent E. coli cells using the TOPO TA Cloning kit (Invitrogen) per 1814

74
manufacture’s instruction. Individual clones were Sanger sequenced by Wyzer Biosciences, Inc 1815 (Cambridge, MA). Sequences were analyzed in Geneious v6.0 and trimmed using default 1816 quality settings. After trimming any sequences with <90% high quality base scores were 1817 excluded from alignment. High quality sequences (16 out of 23) were aligned using the multiple 1818 alignment tool with default settings. 1819
1820 4.2.8 Analytical Methods
DOC was measured using a Shimadzu TOC-V analyzer. NO3-, Cl-, and SO4
2- were 1821 analyzed using a Dionex DX-120 ion chromatograph (American Public Health Association, 1822 1995). The UV/Vis spectra of wetland water samples were measured using a PerkinElmer 1823 Lambda 35 spectrometer. 1824
1825 Trace organic compounds were separated by an Agilent 1200 HPLC using a 1826
2.1 mm x 30 mm Zorbax SB-C18 3.5 μm column, eluted with 0.5 mL min-1 acetonitrile and 1827 0.1% acetic acid in water with the following gradient: 0 minutes, 5% acetonitrile; 5.5 minutes 1828 55% acetonitrile; 6 minutes, 100% acetonitrile; 9 minutes, 100% acetonitrile; 10 minutes, 5% 1829 acetonitrile. Compounds were quantified in multiple reaction monitoring (MRM) mode using 1830 isotope dilution with an Agilent 6460 MS-MS using electrospray ionization (ESI) with a gas 1831 temperature of 350°C, a sheath gas temperature of 400°C, a gas flow rate of 11 L/min at 50 psi, 1832 and a capillary voltage of 3600 V. Compound-specific parameters are given in Table 4.1. 1833
1834 4.3 Results and Discussion
4.3.1 Characterization of Wetland Biomat
Redox conditions in the wetland varied with depth, ranging from super-saturated with 1835 oxygen in the water column during the daytime and approximately 1 cm into the wetland biomat 1836 (Figure 4.6), to nitrate-reducing within the biomat, and sulfate-reducing at the bottom of the 1837 biomat, based on measurements of nitrate and sulfate (Chapter 5). At night, microbial 1838 respiration lowered dissolved oxygen concentrations in the water column to saturation or to as 1839 low as 5 mg L-1, depending on the season. 1840
1841 The microbial community within the biomat consisted of an interspersed assemblage of 1842
photosynthetic and heterotrophic microorganisms dominated by a single species of diatom, as 1843 evidenced by scanning electron microscopy (Figure 4.7 A&B and Figure 4.8) and similarity of 1844 high-quality 23S clone library sequences (i.e., 98.8% similar when aligned after trimming). The 1845 diatom species was tentatively identified as Staurosira construens var. venter based on valve 1846 morphology (Hamilton et al., 1992) and 16S rRNA gene sequence analysis (as Stramenopiles). 1847 Illumina 16S rRNA gene sequencing indicated that in addition to diatoms (30±3%), the 1848 associated sequences were dominated by Proteobacteria (37±4%; primarily of the β and γ 1849 superclasses), Bacteroidetes (7±1%), and Verrucomicrobia (6±1%) (Figure 4.7.1 C). Remaining 1850 phyla accounted for less than 15% of the total community. 1851
1852 1853

75
1854
Figure 4.6: Dissolved oxygen profiles in microcosms and at the pilot-scale open-water cell
(4-17-13) measured with a micro dissolved oxygen probe (Lazar Research Laboratories). Error
bars represent ± one standard deviation.
1855
0
5
10
15
20
0 5 10 15 20 25 30
dark microcosm(pH=8.5)
red light microcosm(pH=10.0)
wetland, noon(pH>9)
[O2] (mg L-1)
water-
biomat
interface
Dis
tance fro
m b
ottom
(cm
)

76
1856
Figure 4.7: A) Fluorescent imagery of fresh biomass showed co-localization of diatoms (red)
and bacteria (green). B) Scanning electron microscopy illustrated the presence of filamentous
diatoms Staurosira construens. C) Illumina sequencing of microcosm biomass fresh from the
wetland (Day 0), and after incubation in the dark (Day 6, dark) or incubation under 635 nm
visible light (Day 6, red). Note that Stramenopiles is the phylum of the Staurosira diatom.

77
1857
Figure 4.8: Scanning electron microscopy of wetland biomat at 180X (top), 600X (middle), and
1200X (bottom) magnification.

78
4.3.2 Biotransformation in Microcosms
Microcosms were incubated under visible light to simulate daytime conditions (i.e., 1858 pH>9, super-saturated with dissolved oxygen) or in the dark to simulate nighttime conditions 1859 (i.e., pH≈8.5, dissolved oxygen below saturation; see Figure 4.6 for dissolved oxygen profiles). 1860 As evidenced by 16S-based phylogenic analysis, microbial community profiles did not change 1861 significantly during the course of the experiments, suggesting that the microbes present remained 1862 representative of the assemblage in the pilot-scale system (Figure 4.7C). Test compound 1863 transformation rates in illuminated microcosms without added biomass were negligible (triangles 1864 in Figure 4.9), demonstrating that illumination with red light did not cause transformation of test 1865 compounds via photolysis, and that biotransformation in the aqueous phase was negligible. 1866
1867 Sorption to microcosm biomass was important to the removal of propranolol from the 1868
aqueous phase, consistent with its relatively high hydrophobicity (log Kow=3.4) (Betageri and 1869 Rogers, 1987; Balon et al., 1999). Overall, sorption accounted for up to 60% of the removal of 1870 propranolol from the dissolved phase (Figure 4.9). The moderately hydrophobic test compounds 1871 carbamazepine (log Kow=2.5) (SRC, 2012) and metoprolol (log Kow=1.9-2.3) (Betageri and 1872 Rogers, 1987; SRC, 2012) were sorbed to microcosm biomass to a lesser extent. Sorption 1873 accounted for up to 100% of the observed removal of carbamazepine and 20% of the total 1874 removal of metoprolol. Sorption of carbamazepine has previously been observed in subsurface 1875 flow wetlands, but did not represent a permanent sink after the solids equilibrated with the 1876 wetland water (Matamoros et al., 2008a). Sorption accounted for less than 5% of the observed 1877 removal of the relatively hydrophilic test compounds atenolol (log Kow=0.2-0.5) (Balon et al., 1878 1999; SRC, 2012), trimethoprim (log Kow=0. 9) (SRC, 2012), and sulfamethoxazole (log 1879 Kow=0.9) (SRC, 2012). 1880
1881 Based on the results of the microcosm experiments, test compounds could be categorized 1882
as undergoing rapid biotransformation (i.e., the β-blockers atenolol, metoprolol, and propranolol; 1883 t1/2<1 day), moderately amenable to biotransformation (i.e., trimethoprim and sulfamethoxazole; 1884 t1/2=2-20 days), or recalcitrant (i.e., carbamazepine; t1/2>40 days). This classification agreed well 1885 with biotransformation rates previously measured in microcosms inoculated with activated 1886 sludge from wastewater treatment plants, but the overall rates differed (Table 4.2). For the 1887 β-blockers, biotransformation rates in the dark microcosms were approximately an order of 1888 magnitude slower than those observed in microcosms inoculated with activated sludge. The 1889 lower rates may have been partially attributable to enhanced mass transfer rates of oxygen and 1890 trace organic compounds between the aqueous and sludge phases in well-mixed activated sludge 1891 microcosms. β-blocker biotransformation rates in microcosms inoculated with biomass from 1892 open-water wetlands incubated in the dark increased by approximately a factor of 5 when the 1893 biomass was completely mixed into the water column, compared to microcosms that were gently 1894 agitated from above (data not shown). 1895
1896 1897 1898 1899 1900 1901 1902

79
1903 1904
1905
Figure 4.9: Fraction of test compound masses (M/Mo) remaining in microcosms that were:
illuminated by visible light (635 nm) without added biomass (); in the dark with added
biomass (aqueous phase: ; biomat phase: ); and illuminated by visible light (635 nm) with
added biomass (aqueous phase: ; biomat phase: ). Mo≈6 µg. Error bars represent ± one
standard deviation.
1906 1907 1908 1909 1910 1911 1912

80
Metoprolol and propranolol biotransformation rates increased by approximately 4 to 8 1913 times in illuminated microcosms compared to dark microcosms. This enhancement may have 1914 been attributable to higher concentrations of dissolved oxygen within the biomass: dissolved 1915 oxygen concentrations in the irradiated microcosms remained above 15 mg L-1 in the top 1 cm of 1916 the biomat, compared to dissolved oxygen concentrations ranging from about 5 mg L-1 at the 1917 water-biomat interface to less than 1 mg L-1 deeper than 1 cm in the biomat in the dark 1918 microcosms (Figure 4.9 and Table 4.2; see Figure 4.6 for dissolved oxygen profiles). Previous 1919 studies have shown that the rates of oxidation of some trace organic compounds were enhanced 1920 under aerobic conditions in wetlands (Hijosa-Valsero et al., 2010b) and in activated sludge 1921 wastewater treatment systems (Plósz et al., 2010; Xue et al., 2010). For example, 1922 biotransformation of metoprolol was up to 5 times faster under aerobic conditions relative to 1923 anoxic conditions in full-scale wastewater treatment plants (i.e., kaerobic≈1.2 d-1 versus 1924 kanoxic≈0.24 d-1) (Xue et al., 2010). Biotransformation rates may also have increased upon 1925 illumination with visible light due to enhanced microbial activity caused by the release of 1926 organic compounds by autotrophic diatoms during photosynthesis (Cole, 1982), although these 1927 effects could not be separated from the effects of dissolved oxygen production by the diatoms. 1928
1929 In contrast, rates of biotransformation of trimethoprim and sulfamethoxazole were more 1930
than 5 and 2 times faster, respectively, in the dark microcosms, relative to the illuminated 1931 microcosms. This difference in biotransformation rates may have been due to a community 1932 metabolic shift caused by anoxic conditions or induced by the absence of primary productivity 1933 (Sharp et al., 2007; Patrauchan et al., 2012). Enhanced rates of biotransformation of 1934 trimethoprim have been reported at dissolved oxygen conditions below 0.5 mg L-1 in microcosms 1935 inoculated with activated sludge (Xue et al., 2010). Furthermore, the biotransformation of 1936 trimethoprim has been suggested to involve certain heterotrophic microorganisms with minimal 1937 oxygenase activity, which may be inhibited by high dissolved oxygen concentrations (Khunjar et 1938 al., 2011). 1939
1940 These results highlight the potential importance of the terminal electron acceptor to rates 1941
of transformation of trace organic contaminants. Open-water wetlands exhibit a diurnal 1942 fluctuation in redox conditions as well as variations through the vertical profile of the biomat 1943 (i.e., oxygen-reducing at the water-biomat interface to sulfate-reducing at the bottom of the 1944 biomat), enabling the biotransformation of compounds across terminal electron acceptor 1945 gradients. For the removal of compounds that are mainly transformed under anoxic conditions, 1946 the use of wetlands with larger anoxic zones (e.g., wetlands with dense macrophytes or 1947 subsurface flow wetlands) may be a more effective treatment strategy. 1948
1949 1950

81
1951 1952 1953 1954 1955 1956 1957 1958 1959 1960 1961
1962
Tab
le 4
.2:
Tes
t C
om
pound F
irst
-Ord
er T
ransf
orm
atio
n R
ates
(d
-1)
Co
mp
ou
nd
D
ark
mic
roco
smsa
Illu
min
ate
d
mic
roco
smsa
Op
en-
wate
r
wet
lan
d,
sum
mer
a
Act
ivate
d
slu
dge
mic
roco
sms
Su
rface
flo
w
trea
tmen
t
wet
lan
ds
Su
rface
wate
rs
Ate
nolo
l 0.8
0±
0.0
3
0.5
9±
0.0
1
1.3
4±
0.6
0
6b re
f a,
b,c
0.0
5-0
.1re
f d
0.2
ref
e , 0.2
3re
f f ,
0.3
0re
f f
Met
opro
lol
0.2
2±
0.0
5
0.8
2±
0.0
7
1.1
0±
0.3
1.5
ref
a , 2.6
b
ref
c , 1.2
ref
g
0.0
3re
f d
0.0
24
ref
f , 0.0
39
ref
f , 0.1
3re
f h,0
ref
i
Pro
pra
nolo
l 0.1
1±
0.0
2c
0.8
6±
0.0
2
1.1
5±
0.5
3
1.7
b r
ef a
0.0
9re
f j
0.0
21
ref
f , 0.0
7re
f f
Tri
met
hopri
m
0.2
9±
0.0
5
0.0
56±
0.0
04
0.3
6±
0.2
3
0.2
d r
ef k
, 0.4
d
ref
l 0.0
4-0
.2re
f d
0, 0.2
ref
e
Sulf
amet
hox
azole
0.0
8±
0.0
1
0.0
34±
0.0
01
0.4
5±
0.4
9
0.0
9re
f d,
0.2
6re
f m
0-0
.02
ref
d
0.0
5re
f e ,
0.0
4re
f n
Car
bam
azep
ine
0.0
16±
0.0
04
0.0
16±
0.0
03
0.0
2±
0.0
5
<0.4
b r
ef a
0-0
.04
ref
d,
0.0
2re
f o,
0.0
1-0
.02
ref
p
0.0
07
ref
q, 0.0
1re
f
r , 0.8
ref
s
a M
easu
red i
n t
his
stu
dy.
bC
alcu
late
d a
ssum
ing a
tota
l su
spen
ded
soli
ds
conce
ntr
atio
n o
f 4 g
L-1
. c E
stim
ated
fro
m
the
linea
r port
ion o
f re
moval
curv
e, a
fter
so
rpti
on h
ad r
each
ed e
quil
ibri
um
. d
Mea
sure
d w
ith
nit
rify
ing a
ctiv
ated
sludge.
N
egli
gib
le l
oss
of
trim
ethopri
m h
as b
een o
bse
rved
in n
on
-nit
rify
ing a
ctiv
ated
slu
dge
(Ram
il e
t al
., 2
009).
Ref
eren
ces:
a:
(Wic
k e
t al
. 2009
); b
: (H
elbli
ng e
t al
., 2
010
); c
: (K
ern e
t al
., 2
010
); d
: (B
reit
holt
z et
al.
, 2012
); e
:
(Lim
et
al., 2
008
); f
: (R
amil
et
al., 2
009
); g
: (X
ue
et a
l., 2010
); h
: (F
ono e
t al
., 2
006
); i
: (K
unkel
and
Rad
ke,
2011
);
j: (
Fono a
nd S
edla
k, 200
5);
k:
(Bat
t et
al.
, 2006
); l
: (P
érez
et
al., 2
005
); m
: (L
i an
d Z
han
g, 2010
); n
: (R
adke
et a
l.,
2009);
o:
(Llo
rens
et a
l.,
2009
); p
: (M
atam
oro
s et
al.
, 2008
b);
q:
(Cal
za e
t al
., 2
013
); r
: (T
ixie
r et
al.
, 2003
); s
:
(Wri
ter
et a
l., 2013
).

82
4.3.3 Biotransformation Products
Biotransformation products of the β-blockers atenolol, metoprolol, and propranolol were 1963 detected in the microcosms. Atenolol was hydrolyzed at the amide group nearly 1964 stoichiometrically to form metoprolol acid, a transformation product that has previously been 1965 observed in microcosms inoculated with activated sludge (Figure 4.10) (Radjenović et al., 2008; 1966 Kern et al., 2010). Metoprolol acid did not undergo further biotransformation. Metoprolol acid 1967 was also formed from metoprolol in microcosms, where it accounted for approximately 25% of 1968 the metoprolol transformed, which was comparable to the yield observed in microcosms 1969 inoculated with activated sludge (Kern et al., 2010). In addition, oxidation of metoprolol 1970 produced low concentrations (i.e., <0.1 µg L-1) of α-hydroxy-metoprolol, a known human 1971 metabolite (Fang et al., 2004). Metoprolol acid is less toxic to mammals than metoprolol (Borg 1972 et al., 1975). However, its high stability may warrant further investigation. 1973
1974 The propranolol oxidation product and human metabolite, 4-hydroxy-propranolol 1975
(Nałęcz-Jawecki et al., 2008), was detected in microcosms amended with high concentrations of 1976 propranolol. 4-hydroxy-propranolol accounted for up to 1% of the propranolol transformed. No 1977 biotransformation products were detected in microcosms with high concentrations of 1978 trimethoprim, sulfamethoxazole, or carbamazepine (data not shown). 1979
1980 1981
Table 4.3: Average Aqueous Test Compound Concentrations of Trace Organic Compounds in
the Pilot-Scale Open-Water Cell
Compound Concentration (ng L-1)a
Inlet Point 1 Middle Point 3 Outlet
Atenolol 100±10 31±4 19±3 7.7±1.6 3.3±0.9
Metoprolol 58±3 38±3 30±3 20±3 8.6±0.9
Propranolol 41±2 23±3 16±2 10±1 4.5±0.6
Trimethoprim 8.4±0.9 7.8±0.8 6.3±0.3 5.1±0.7 4.7±0.7
Sulfamethoxazole 810±20 750±20 730±10 750±10 710±20
Carbamazepine 110±10 110±10 120±10 110±10 110±10 aAverage ± standard error of the mean of 10 samples measured at each sample location in the wetland during the 1982 week of August, 20th 2012. See Figure 4.11 for plot of data. 1983
1984 1985 1986 1987

83
1988
Figure 4.10: Formation of the biotransformation product metoprolol acid () in dark (left) and
illuminated (635 nm visible light; right) microcosms amended with either atenolol (top; ) or
metoprolol (bottom; ). The sum of the concentrations of the parent products and the
transformation products are also shown (). Sorption accounted for loss of less than 1% of the
initial mass of atenolol and from 5% (illuminated microcosm) to 20% (dark microcosm) of the
initial concentration of metoprolol.
1989 1990
1991
1992

84
4.3.4 Compound Attenuation in the Pilot-Scale Open-Water Wetland
Wetland influent concentrations of test compounds typically ranged from 40 to 1993 100 ng L-1 for the β-blockers, 8 to 15 ng L-1 for trimethoprim, 800 to 1000 ng L-1 for 1994 sulfamethoxazole, and 90 to 120 ng L-1 for carbamazepine (Table 4.3). Metoprolol acid, the 1995 biotransformation product of atenolol and metoprolol, was typically present at influent 1996 concentrations that were about an order of magnitude higher than atenolol (i.e., 300-1000 ng L-1). 1997 This precluded the observation of the transformation of atenolol to metoprolol acid within the 1998 wetland cell. Influent test compound concentrations typically varied by less than 30% based on 1999 hourly samples, and removal through the wetland cell typically followed first-order kinetics 2000 (r2>0.8), except for carbamazepine, which did not exhibit significant removal (see Figure 4.11). 2001 2002
Summer and fall test compound attenuation rate constants in the pilot-scale open-water 2003 wetland ranged from greater than 1.4 d-1 for the β-blockers to less than 0.5 d-1 for trimethoprim 2004 and sulfamethoxazole, which corresponded to half-lives of 0.5 to 1.5 days (Figure 4.12). These 2005 attenuation rates were comparable to rates measured in activated sludge systems, with the 2006 exception of atenolol, which was removed at faster rates in treatment plants (Table 4.2). 2007 Attenuation rates of all test compounds except carbamazepine were 10 to 100 times faster in the 2008 open-water cell than rates previously measured in vegetated surface flow wetlands and surface 2009 waters (Table 4.2). Carbamazepine behaved conservatively in the open-water cell, in agreement 2010 with previous research showing the compound’s stability with respect to photolysis (Chapter 3) 2011 and its resistance to biotransformation in activated sludge and surface waters (Tixier et al., 2003; 2012 Wick et al., 2009). 2013
2014 Test compound attenuation rate constants decreased by more than 50% for all test 2015
compounds during the winter months. Lower attenuation rates of compounds amenable to 2016 biotransformation were likely due to reduced microbial activity at colder temperatures. 2017 Corrections for the temperature dependence of biotransformation rates of trace organic 2018 contaminants were estimated using a modified form of the Arrhenius equation: 2019
2020 2021
kT = kT,ref e−κ(Tref−T) (4.5) 2022
2023 2024
where kT and kT, ref are the biotransformation rates at a given temperature (T) and at a reference 2025 temperature (Tref), respectively, and κ is the temperature coefficient, which is typically between 2026 0.03 and 0.09 K-1 for trace organic contaminants (Clara et al., 2005; Li et al., 2005; Joss et al., 2027 2006; Wick et al., 2009). Using these values for κ, trace organic biotransformation rates should 2028 have decreased by approximately 40-80% during winter (i.e., winter temperatures of 9±2.5˚ C 2029 versus summer temperatures of 22±5˚ C; see Table 4.4), which agreed well with reductions in 2030 rate constants observed in the field. Similarly, attenuation rates of compounds amenable to 2031 photolysis should have been reduced by up to approximately 75% during the winter due to lower 2032 sunlight intensity and shorter days (Chapter 3). 2033
2034 2035

85
2036
Figure 4.11: Removal of test compounds in pilot-scale open-water wetland during August 2012.
Error bars represent ± standard error of the mean (n=10).
2037
-3
-2
-1
0
0 0.5 1 1.5
log
(C
/Co)
residence time (days)
atenolol
metoprolol
propranolol
trimethoprim
sulfamethoxazole
carbamazepine
Inlet OutletMiddle

86
2038
Figure 4.12: Seasonal pseudo first-order attenuation rates of test compounds in the pilot-scale
open-water cell. Error bars represent ± standard error of the mean for measurements made
approximately monthly over a 3 year period (n=5-12). Negative removal rates are due to water
loss via evaporation.
2039
2040
2041
2042
2043
2044

87
2045 Table 4.4: Wetland Temperaturesa
Month Average Temperature (˚C)
January 8.6±0.4
February 9.8±0.3
March 11.9±0.3
April 14.4±1.0
May 16.8±0.7
June 20.0±0.3
July 22.0±0.2
August 22.3±0.4
September 21.7±0.5
October 17.5±0.3
November 12.4±0.5
December 9.3±0.3
a Average monthly temperatures reported in Livermore, CA from 2007-2012 ± standard error of the mean (Metar, 2046 2013). 2047
2048 4.3.5 Evaluation of Attenuation Mechanisms in the Pilot-Scale Open-Water Wetland
For non-volatile trace organic compounds, potential attenuation mechanisms in surface- 2049 flow open-water wetlands included sorption to the wetland biomat, biotransformation, and 2050 photolysis. Each of these mechanisms was evaluated to inform open-water wetland design and 2051 to predict the area necessary to removal of trace organic contaminants. 2052
2053 Sorption. The concentrations of test compounds sorbed to the biomat in the open-water 2054
cell were less than about 10 μg kg-1, except for propranolol, which was detected at concentrations 2055 as high as approximately 70 μg kg-1 (Table 4.5). These concentrations were 10 to 100 times 2056 lower than those measured in activated sludge, except for propranolol, which was observed at 2057 similar concentrations in activated sludge (Radjenović et al., 2009). Sorbed concentrations 2058 corresponded to a mass of approximately 10 mg ha-1 for atenolol and up to approximately 1000 2059 mg ha-1 for propranolol. Over the 3-year period in which the pilot-scale system operated, this 2060 corresponded to less than 2% of the mass of propranolol removed and less than 0.1% of the mass 2061 of the other test compounds, indicating that sorption is not a significant removal mechanism for 2062 the test compounds if it is not coupled to biotransformation. 2063
2064 2065

88
2066 Sorption was not an important removal mechanism because aqueous test compound 2067
concentrations were limited by equilibrium partitioning with the biomat phase. In other words, 2068 measured aqueous test compound concentrations were similar to aqueous concentrations 2069 predicted by organic carbon-normalized biomat concentrations and log KOC values measured 2070 with autoclaved wetland biomass (i.e., measured values were within a factor of 2 of predicted 2071 values, except for propranolol which was present at concentrations up to 7 times higher in the 2072 biomat phase than predicted; Tables 4.3 and 4.5). Thus, sorption in open-water wetlands may 2073 serve as a short-term sink for a pulse of elevated concentrations of trace organic contaminants, 2074 which may occur diurnally (Nelson et al., 2011). However, accumulation of fresh biomass was 2075 not rapid enough for appreciable attenuation of the test compounds studied. 2076
2077 Photolysis. Photolysis accounted for most of the removal of the photo-labile compounds 2078
propranolol and sulfamethoxazole in the pilot-scale wetland during the summer (Figure 4.13). 2079 Photolysis has also been suggested to be the dominant removal mechanism for these compounds 2080 in lake and river systems (Alder et al., 2010; Bonvin et al., 2011). In contrast, photolysis 2081 accounted for only about 10% of the removal of atenolol and metoprolol and less than 40% of 2082 the removal of trimethoprim. 2083
2084 The photolysis model over-predicted the removal rate of carbamazepine by about 0.1 d-1, 2085
which may be explained by a number of factors. Evaporation in the pilot-scale system resulted 2086 in loss of up to 10% of water entering the wetland in summer, as evidenced by increases in 2087 chloride concentrations through the wetland (Figure 4.5). Correcting for a water loss of this 2088 magnitude yielded a carbamazepine transformation rate of 0.07±0.03 d-1 during summer (i.e., 2089 evaporation accounted for approximately 70% of the difference between the photolysis model 2090 and field measurements for carbamazepine). Photolysis in the field-scale system may also have 2091 been reduced slightly by shading of water passing through the diffuse biomat layer at the wetland 2092 bottom, which would have reduced photolysis rates by about 10%. Light screening by floating 2093 vegetation and detritus may also have reduced photolysis rates in the pilot-scale wetland as 2094 compared to model predictions. 2095
2096 After adjusting photolysis rates for evaporation and the flow of water through the biomat, 2097
photolysis accounted for only a small portion of the removal of atenolol (<5%), metoprolol 2098 (<5%), and trimethoprim (<20%) in the pilot-scale system (Figure 4.14). Thus, photolysis will 2099 only be an important removal mechanism for relatively photo-labile compounds in open-water 2100 wetlands (i.e., those compounds with photolysis rates >0.25 d-1), unless the influent wastewater 2101 has very high concentrations of NO3
- (e.g., >30 mg L-1), or low concentrations of DOC 2102 (e.g., <2 mg C L-1) for compounds that are transformed by direct photolysis (Chapter 3). 2103
2104

89
2105
Figure 4.13: Comparison of measured or predicted removal rate constants for test compounds to
removal rate constants observed in the Discovery Bay pilot-scale open-water cell during
summer. Microcosm removal rates are the average of illuminated and dark microcosms. Error
bars represent ± one standard deviation for photolysis model and microcosms and ± standard
error of the mean for pilot-scale wetland.
2106
2107
2108
2109 2110

90
Table 4.5: Sorbed Test Compound Concentrations in Open-Water Wetlanda Compound Concentration sorbed
(μg kg-1)
Concentration sorbed
(μg (kg organic carbon)-1)b
Predicted aqueous
concentration (ng L-1)c
Inlet Middle Outlet Inlet Middle Outlet Inlet Middle Outlet Atenolol 0.2±0.1 0.6±0.1 0.5±0.0 2.9±1.0 1.9±0.3 1.6±0.1 22±8 12±3 12±1
Metoprolol 1.9±0.4 11.3±0.9 6.6±0.7 34±16 37±3 24±3 85±40 83±11 59±10
Propranolol 14±6 69±13 38±12 210±40 230±50 140±50 57±12 52±13 37±14
Trimethoprim 0.2±0.2 1.4±1.3 0.5±0.1 5.1±3.5 4.7±4.4 1.8±0.3 24±17 20±21 8.5±1.5
Sulfamethoxazole 1.8±0.9 2.2±0.8 5.7±1.2 25±3 7.4±2.5 20±5 1220±190 620±140 980±250
Carbamazepine 0.7±0.3 3.0±1.0 2.3±0.1 10±1 10±3 8.1±0.7 130±20 130±40 100±10
a Average ± one standard deviation. bNormalized based on percent organic carbon contents: inlet 7.2±3.7% organic 2111 carbon; inlet 30.2±0.2% organic carbon; inlet 28.3±1.3% organic carbon. cAqueous concentration predicted based 2112 on organic carbon-normalized concentrations and log Koc values measured in autoclaved test tubes containing 2113 wetland biomass (see Figure 4.4) according to: Caq=Csorb/Koc. 2114
2115 Biotransformation. To evaluate the contribution of biotransformation to test compound 2116
attenuation in the pilot-scale open-water cell, biotransformation rates measured in dark and 2117 illuminated microcosms were averaged to approximate the effects of diurnal fluctuations on 2118 biotransformation rates. Biotransformation rates measured in bench-scale microcosms accounted 2119 for approximately 50% of the average removal rates measured in the pilot-scale wetland for 2120 atenolol, metoprolol, and trimethoprim (Figure 4.13; Table 4.2). Biotransformation accounted 2121 for approximately 40% of the removal of propranolol and only 10% of the removal of 2122 sulfamethoxazole. 2123
2124 Although conditions representative of the pilot-scale system were used to design the 2125
microcosms, it is difficult to extrapolate biotransformation rates measured under laboratory 2126 conditions to field conditions. Variations in water temperature, biomat thickness, and redox 2127 conditions not fully captured in the microcosms affect biotransformation rates. For example, 2128 daytime water temperatures in excess of 30˚C were common during summer months at the field 2129 site and would have likely increased biotransformation rates relative to rates measured in 2130 laboratory microcosms. Nonetheless, results from the microcosms suggested that 2131 biotransformation was the dominant attenuation mechanism for atenolol, metoprolol, and 2132 trimethoprim in the pilot-scale system. Thus, the combination of biotransformation and 2133 photolysis accounted for the majority of the observed removal of the test compounds during the 2134 summer (Figure 4.13). 2135

91
2136
Figure 4.14: Comparison of measured or predicted removal rates of test compounds to removal
rates observed in the Discovery Bay pilot-scale open-water wetland during summer, corrected
for evaporation. Photolysis rates were corrected assuming 25% of the hydraulic residence time
was spent in the biomat and that 7% of the water evaporated per day (see Figure 4.5). Error bars
represent ± one standard deviation for photolysis model and microcosms and ± standard error of
the mean for pilot-scale wetland.
2137
2138
2139
2140

92
4.3.6 Application to Full-Scale Wetland Design
The wetland area necessary to achieve 90% removal of a contaminant from 1 MGD or 2141 1 MLD of wastewater effluent (A90
1 ) is a useful metric to evaluate the feasibility of employing 2142 open-water cells to remove trace organic compounds (Chapter 3). A one order of magnitude 2143 decrease in concentration is a useful metric because it will result in concentrations below the 2144 observable effects level for most aquatic organisms (Huggett et al., 2002). Furthermore, many 2145 surface waters around the world already consist of 10% wastewater effluent (National Research 2146 Council, 2012). Test compound transformation rates were estimated throughout the year using 2147 predicted solar irradiances to estimate kphoto values (Chapter 3) and the Arrhenius equation to 2148 estimate kbio values (Equation 4.5; a mean value of κ=0.06 K-1 was used; see Table 4.4 for 2149 average wetland temperatures). 2150
2151 Comparison of A90
1 values of open-water wetlands in temperate climates (i.e., water 2152 temperatures of 9-23˚C) at 40 N˚ latitude to existing full-scale wetland systems suggested that 2153 test compounds most amenable to biotransformation (i.e., atenolol, metoprolol, propranolol, and 2154 trimethoprim) could be removed efficiently in wetlands of a size typically employed for 2155 denitrification of wastewater effluent throughout the entire year (Figure 4.15). Open-water 2156 wetlands of this size would also result in 90% reductions in the concentration of 2157 sulfamethoxazole through most of the year. Of the compounds studied, only carbamazepine 2158 would require open-water wetland cells larger than 20 ha MGD-1 (~5 ha MLD-1). Thus, the 2159 combination of photolysis and biotransformation mechanisms in open-water wetlands allows for 2160 the effective removal of a broader range of trace organic contaminants than can be achieved 2161 solely by conventional wastewater treatment plants or vegetated wetlands (i.e., removal of both 2162 photo-labile compounds, such as sulfamethoxazole, and compounds amenable to 2163 biotransformation, such as atenolol and metoprolol). However, in regions with colder climates, 2164 open-water wetland cells would freeze during the winter, limiting their applicability. 2165
2166 The primary factors to consider for the operation and maintenance of full-scale open- 2167
water wetlands cells include water depth and the thickness of the biomat on the wetland bottom. 2168 Open-water wetland depths of 20-30 cm will maximize photolysis rates (Chapter 3), while 2169 ensuring that adequate sunlight reaches the water-biomat interface to support photosynthesis. 2170 Pathogen inactivation will also be maximized in open-water cells shallower than 30 cm (Nguyen 2171 et al., 2014). At the pilot-scale facility, the biomat accumulated at a rate of approximately 2172 1 cm yr-1 (Chapter 5), which will take up half of the volume of the cell after 10 years of 2173 operation, reducing the efficacy of photolysis. To maintain efficient photolysis rates and prevent 2174 clogging, sedimentary detritus will need to be removed periodically (e.g., every 5-10 years). 2175 This could potentially be accomplished by draining the wetland and removing the dried detritus 2176 mechanically, using a pump to suck out the diffuse biomat, or by temporarily increasing flow 2177 rates to wash the diffuse biomat out of the system. Removed waste material could be land 2178 applied or digested anaerobically. Wetland photolysis rates will also be reduced by the growth 2179 of floating vegetation, such as duckweed (Lemna sp.) (Chapter 3). Floating vegetation growth 2180 may be prevented by keeping hydraulic residence times low enough to ensure that it is washed 2181 out (i.e., less than 3 days) (EPA, 2000a), as well as by periodically flushing the wetland with 2182 high flows. 2183

93
Influent water quality may also affect trace organic contaminant attenuation in open- 2184 water wetlands. In this study, fully nitrified influent was used to ensure survival of mosquitofish 2185 (Gambusia), which are needed to control mosquito larvae (Horne and Fleming-Singer, 2005). 2186 Influent containing ammonium may affect both the growth of the biomat and the microbial 2187 community within the biomat, resulting in changes in trace organic contaminant transformation 2188 rates. For example, ammonium removal in wastewater treatment plants is often associated with 2189 faster removal of certain trace organic contaminants (Helbling et al., 2012). Photolysis rates are 2190 also affected by influent water quality, due to differences in nitrate concentration, pH, and DOC 2191 concentration (Chapter 3). 2192
2193 Removing the open-water cell biomat periodically would increase photolysis rates of 2194
trace organic contaminants because more of the water column would be illuminated (see 2195 Photolysis section above). Conversely, biotransformation rates of trace organic contaminants 2196 would be reduced due to the reduced contact between the water and the biomat. 2197 Biotransformation of compounds that are preferentially transformed in anaerobic zones, such as 2198 trimethoprim and sulfamethoxazole, may be especially affected by biomat removal due to a 2199 reduced anaerobic zone size. Attenuation of these compounds may be more effective in 2200 anaerobic wetland cells (e.g., vegetated cells or subsurface wetland cells) used in series with oxic 2201 open-water cells, although further research is necessary to assess the efficiency of different 2202 wetland configurations. 2203

94
2204
Figure 4.15: Area predicted to provide 90% removal of contaminants from 1 MGD (left axis) or
1 MLD (right axis) of wastewater effluent in open-water treatment cells (𝐀𝟗𝟎𝟏 ) via
biotransformation and photolysis throughout the year. Biotransformation rates were calculated
using Equation 4.5 assuming water temperatures ranging from about 9˚ C in the winter to 23˚ C
in the summer (Table 4.4). Dashed lines show the area per flow rate of existing full-scale
wetland systems (Orange County Water District, 2008; Florida Department of Environmental
Protection, 2012). Wetland depth=30 cm, pH=9, [NO3-]=20 mg-N L-1, [DOC]=8 mg-C L-1,
[HCO3-]+[CO3
2-]=60 mg L-1-C.
2205
2206

95
CHAPTER 5. Nitrogen Removal in Shallow, Open-Water
Treatment Wetlands
Reprinted with permission from Jasper, J.T.; Jones, Z.L.; Sharp, J.O.; Sedlak, D.L. Nitrogen
removal in shallow, open-water unit process treatment wetlands. Environ. Sci. Technol. 2014 (in
review).
© 2014 American Chemical Society.

96
5.1 Introduction
The discharge of effluent from nitrifying wastewater treatment plants (Carey and
Migliaccio, 2009) and agricultural runoff (Spalding and Exner, 1993) result in nitrate (NO3-)
pollution of surface and ground waters. To protect public health the US Environmental
Protection Agency and the World Health Organization have established maximum contaminant
levels of 10 mg L-1-N (0.7 mM) for drinking water (Pontius, 1993; Chilton, 1996). NO3- also
contributes to the eutrophication of surface waters, in some cases leading to large-scale hypoxia
(Diaz, 1995).
Mechanical systems are capable of removing NO3- from municipal wastewater, but these
systems have high capital costs, and may require energy and substrate inputs (Metcalf & Eddy,
2003). Treatment wetlands offer a low-cost alternative for NO3- removal, in addition to
removing a range of other contaminants (e.g., metals, pathogens, and trace organic contaminants)
(Kadlec and Wallace, 2009). Wetlands are also valued by communities because they provide
wildlife habitat and recreational opportunities (Fleming-Singer and Horne, 2006). However,
wetland treatment efficiency is often hindered by inconsistent or incomplete removal of
contaminants, as well as hydraulic short-circuiting via preferential flow paths. Designing
wetlands as a series of unit-process cells optimized to treat specific contaminants (i.e., unit
process wetlands) provides a means of enhancing treatment efficiency while reducing the
potential for short-circuiting by ensuring water is mixed between cells (Chapter 2).
Nitrate removal in vegetated wetlands is predominantly ascribed to bacterial
denitrification, although in wetlands where ammonium (NH4+) accumulates from anaerobic
decay of organic matter, anaerobic ammonium oxidation (i.e., anammox) can contribute to NO3-
removal (Zhu et al., 2011). Uptake of NO3- by plants and subsequent accretion as sediments
typically accounts for only a small fraction of total NO3- removal in these systems (Vymazal,
2007).
Wetlands designed for NO3- removal are typically planted with emergent vegetation to
provide a carbon source and to create conditions where NO3- is the most energetically-favorable
terminal electron acceptor. Mature vegetated wetlands with a layer of leaf litter and fine, porous
sediments typically have higher NO3- removal rates than wetlands with only a peat or clay
bottom due to close contact between NO3--containing water and active microbes (Horne, 2000;
Fleming-Singer and Horne, 2002). The microbial community associated with attached algal
communities grown on benthic nets in freshwater aquatic systems also are capable of
denitrification (Ishida et al., 2008).
Shallow (<30 cm), open-water cells designed for photolysis of trace organic contaminants
(Chapter 3) and sunlight inactivation of pathogens (Nguyen et al., 2014; Silverman et al., 2014)
produce a thick (up to 10 cm), porous, diffuse biomat composed of algae (primarily diatoms),
associated heterotrophic microbes, and detritus (Chapter 4). During the daytime, the water
column above the biomat is supersaturated with oxygen due to photosynthesis occurring at the
biomat surface. Diffusion of oxygen into the biomat may therefore limit denitrification near the
water-biomat interface (Risgaard-Petersen et al., 1994). Deeper within the biomat, dissolved
oxygen concentrations quickly drop, providing conditions suitable for denitrification (Chapter 4).

97
Shallow, open-water wetlands differ substantially from open-water treatment ponds,
where denitrification rates are typically slower than those observed in vegetated systems
(Kadlec, 2012). In treatment ponds, deep water (e.g., >1 m) often limits the interaction between
nitrate-containing water and anoxic zones where denitrification occurs, due to thermal
stratification. Shallow, open-water wetlands also differ from streams, which usually do not have
thick biomats, due to relatively high water velocities (i.e., much greater than ~0.06 cm s-1, the
velocity typically employed in shallow, open-water wetlands).
The purpose of this study was to evaluate the potential for using open-water treatment
wetlands to remove NO3- from municipal wastewater effluent or effluent-dominated streams.
NO3- removal rates were quantified over a three-year period in a pilot-scale wetland and
compared with vegetated treatment wetlands. NO3- removal mechanisms, including
denitrification, accretion, and anammox, were assessed via a combination of microcosm
experiments, functional gene abundance characterization, and field monitoring. Results were
used to construct a nutrient mass balance for the pilot-scale cell and to predict wetland areas
necessary to ensure removal of NO3- from wastewater effluent.
5.2 Materials and Methods
5.2.1 Materials
All reagents were purchased from Fisher Scientific (Fairlawn, NJ) at the highest available
purity. Solutions were prepared using 18 MΩ Milli-Q water from a Millipore system.
5.2.2 Pilot-Scale Wetland Monitoring
Ambient concentrations of nitrogen species (NO3-, NO2
-, NH4+, and dissolved organic
nitrogen), phosphate, total phosphorus, SO42-, and dissolved organic carbon (DOC) were
monitored throughout a pilot-scale (400 m2), shallow (20 cm), open-water wetland cell located in
Discovery Bay, CA—a system that has been described previously (Chapter 4). The cell was
lined with a geotextile fabric to prevent the growth of emergent macrophytes. During the study,
a 2-10 cm layer of algae and diffuse biomat comprised of algae, associated heterotrophic
microbes, and detritus (~1500 kg dry weight) was present on top of the liner. The cell received
nitrified, non-disinfected wastewater effluent from the adjacent municipal wastewater treatment
plant, with a flow rate controlled at 7x10⁻³ to 2x10⁻² million gallons per day (MGD) (i.e.,
2.6x10⁻² to 7.6x10⁻² ML d-1 (MLD)). The resulting hydraulic residence time varied from 1±0.1
to 3±0.3 days.
Aqueous samples were collected at the inlet, outlet, and three intermediate points along
the flow path of the cell throughout the three-year study period. Samples were stored on ice
during transport and were analyzed within 24 hrs. The rate constant for NO3- removal was
calculated based on the tanks-in-series model (Kadlec and Wallace, 2009):
Cout
Cin= (1 +
kτ
Nh)
−N
(5.1)
where Cout is the outlet NO3
- concentration, Cin is the inlet NO3- concentration, k is the areal

98
removal rate (m yr-1), τ is the nominal detention time (yr), h is the water depth (m), and N is the
number of tanks-in-series used to describe the cell hydraulics (6.4 based on Rhodamine-WT
tracer tests) (Chapter 4). Dissolved oxygen and pH values were monitored near the wetland
outlet every 10 minutes.
Biomat samples from the water-biomat interface to the geotextile fabric liner were
collected using an acrylic coring device. Samples were analyzed for organic carbon, nitrogen,
and phosphorus species. Aqueous samples from within the biomat were collected using a 30 mL
pipette. Water was separated from biomat solids by centrifuging at 5000 RPM for 10 minutes.
Reported values represent the mean ± the standard error of the mean.
5.2.3 Primary Productivity Calculations
Primary productivity was calculated using dissolved oxygen concentrations measured
near the wetland outlet during 3 days of each season during 2013. Single curve analysis was
used, with the gas transfer coefficient estimated based on dissolved oxygen concentrations
measured before sunrise and after sunset. Respiration was estimated from the observed
consumption of oxygen at night (Odum, 1956). Respiration and primary productivity rates were
calculated as the averages of 3 measurements per season, which were then averaged to provide
annual estimates.
5.2.4 Acetylene Block Microcosms
Denitrification rates were measured using the acetylene-block method in stoppered serum
bottles (160 mL) amended with acetylene (5 mL) to prevent the conversion of N2O to N2 during
microbial denitrification (Groffman et al., 1999). Microcosms containing wetland biomass
(~1.4 g dry weight) and water (~85 mL) under a nitrogen headspace at a ratio representative of
the pilot-scale wetland (~17 g L-1) and were maintained in the dark at 25±3° C. After addition of
NO3- (~45 umol), NO3
-, NH4+, NO2
-, and N2O were measured over a five-day period.
Denitrification rate constants were calculated from observed first-order NO3- removal kinetics.
Experiments were conducted in triplicate.
5.2.5 Nutrient Mass Balance
To evaluate the contributions of individual NO3- removal mechanisms to overall NO3
-
removal, a mass balance was constructed for nitrogen, phosphorus, and carbon. Annually
averaged element concentrations were used for the wetland cell influent and effluent. Outlet
mass loads were corrected for an average annual evaporation rate of 7.3±1.1% (Figure 5.1)
observed between the inlet and outlet of the wetland cell as determined by Cl- concentrations.
Element losses due to accretion were based on measurements of the wetland biomat thickness,
made approximately twice annually, in conjunction with the measured elemental composition of
the biomat. Carbon fluxes from the atmosphere were calculated based on primary productivity
and oxic respiration rates, as described above. Losses of N2 and CO2 gas due to denitrification
were calculated based on denitrification rates measured in microcosms, as described above.
Carbon requirements for denitrification were calculated assuming that carbon contained in
wetland organic matter exhibited a similar composition to that of algae (i.e., C106H263O110N16).

99
This assumption was consistent with measurements of the chemical oxygen demand of the
wetland water.
5.2.6 Measurement of Gene Abundances
DNA was extracted from 0.025 g of freeze-dried biomat using Mo Bio PowerBiofilm
DNA Isolation Kit according to the manufacturer’s instructions. Extracted DNA was quantified
on a NanoDrop Lite and diluted by a factor of 10 prior to amplification, resulting in
concentrations ranging from 10-30 ng µL-1.
Amplifications for quantitative PCR were performed on a Roche Light Cycler 480 II
using Quanta Biosciences PerfeCTa SYBR Green Super Mix in 25 µl reactions using 2 µl of
template DNA. Primer sequences and PCR conditions for nirS, nirK, hzs, and 16S rRNA genes
can be found in Table 5.1. Each sample was amplified in triplicate with non-template and
negative extraction controls. Standards were generated from amplicons that were purified using
Agencourt AMPure XP magnetic beads and quantified using an Invitrogen Qbit 2.0. No
nonspecific amplicon bands were observed when run on an Agilent Bioanalyzer 2100. Standard
curves were generated from triplicate 1:10 serial dilutions of their pur ified standards. Each
functional gene was normalized by the total number of 16S gene copies.
5.2.7 Analytical Methods
DOC and total dissolved nitrogen were measured using a TOC/TN-V analyzer
(Shimadzu) with 1-µm filtered samples. Particulate organic carbon and organic nitrogen content
were measured in unfiltered samples. Chemical oxygen demand was determined using standard
methods (5220 D).(American Public Health Association, 1995) NO3-, Cl-, phosphate, and SO4
2-
were analyzed by ion chromatography (Dionex DX-120). NH4+ and NO2
- were determined using
1-µm filtered samples by standard methods (4500-NH3 C and 4500-NO2- B) (American Public
Health Association, 1995). Dissolved organic nitrogen was calculated as the difference between
total nitrogen and the sum of NO3-, NH4
+, and NO2-. Aqueous phosphate concentrations were
measured using unfiltered water samples by alkaline persulfate digestion (Patton and Kryskalla,
2003), followed by colorimetry (method 4500-P C) (American Public Health Association, 1995).
Dissolved oxygen and pH measurements were collected with a Manta multi-probe (Eureka
Environmental).
Biomat organic content was measured by ashing dried wetland biomass at 550° C
(method 2540 E) (American Public Health Association, 1995). Biomat samples were dried,
ground, sieved (300 µm), and sent to the UC Davis Analytical Laboratory for elemental analyses.
Total nitrogen and carbon content were measured by flash combustion coupled to gas
chromatography with thermal conductivity (AOAC, 1997). Organic carbon content was
distinguished from total carbon by acid fumigation (Harris et al., 2001). Total phosphorus and
iron content of the biomat were measured by nitric acid/hydrogen peroxide closed vessel
microwave digestion, followed by coupled plasma atomic emission spectrometry (Sah and
Miller, 1992).

100
N2O was separated by gas chromatography (GC; Varian 3800) with a packed column
(Alltech HayeSep Q 80/100 mesh, 6’) held at 50° C, using nitrogen as a carrier gas
(20 mL min-1). An electron capture detector (ECD) was used for N2O detection.
Table 5.1: QPCR Primers and Thermal Profiles
Primer
Name
Primer
Sequence 5'-3'
[Primer ]
(nM)
Amplicon
Size
Target
Gene
Thermal
Profile Ref.
cd3aF GTSAACGTSAA
GGARACSGG 500
425 nirS
95°C 10 min, 6 touchdown cycles
[95°C 15 s, 63–58°C
(−1°C per cycle) 30 s, 72°C 30 s,] then 35
cycles (95°C 15 s,
58°C 30 s, 72°C 30 s)
(Throbäck
et al.,
2004) R3cd
GASTTCGGRTGS
GTCTTGA 500
nirK876 ATYGGCGGVAY
GGCGA 500
164 nirK
95°C 10 min, 6 touchdown cycles
[95°C 15 s, 63–58°C
(−1°C per cycle) 30 s, 72°C 30 s,] then 35
cycles (95°C 15 s,
58°C 30 s, 72°C 30 s)
(Henry et
al., 2004)
nirK1040 GCCTCGATCAG
RTTRTGGTT 500
hzsA1597F WTYGGKTATCA
RTATGTAG 400
260 hzs 95°C 3min, 40 cycles
(95°C 30 s, 55°C 30 s , 72°C 30 s)
(Harhangi
et al.,
2012) hzsA1857R
AAABGGYGAAT
CATARTGGC 400
EUB338 ACTCCTACGGG
AGGCAGCAG 1000
180 16S 95°C 3min, 40 cycles
(95°C 60 s, 53°C 30 s , 72°C 60 s)
(Fierer et
al., 2005)
EUB518 ATTACCGCGGC
TGCTGG 1000
5.3 Results and Discussion
5.3.1 NO3- Removal Rates
Nitrogen species were monitored throughout the pilot-scale open-water wetland to
determine removal efficiencies. The average inlet NO3- concentration was 1.48±0.05 mM
throughout the year, which accounted for more than 95% of the nitrogen entering the wetland, as
expected for this nitrifying wastewater treatment plant (Table 5.2). On an annual basis, more
than 60% of the NO3- entering the wetland was removed (i.e., 18±4 out of 28±3 kmol yr-1). As
typically observed in treatment wetlands, NO3- removal exhibited first-order kinetics
(r2=0.8-0.99; Figure 5.2) (Kadlec, 2012) and showed a significant seasonal dependence (Stein
and Hook, 2005; Hernandez and Mitsch, 2007). Removal rates ranged from 18±3 m yr-1 during
winter (~30% removal) to 117±14 m yr-1 during summer (>95% removal) (Figure 5.3). NO2-,
NH4+, and organic nitrogen concentrations did not change appreciably in the cell (p>0.1; Figure
5.4). Particulate organic nitrogen concentrations in unfiltered samples did not differ from
organic nitrogen concentrations in filtered samples.

101
Figure 5.1: Percent evaporation between inlet and outlet of pilot-scale wetland cell throughout
the year, calculated based on Cl- concentrations.

102
Figure 5.2: Semi-log plot of NO3- removal along flow-path in Discovery Bay pilot-scale open-
water wetland cell. For clarity, a limited data set is plotted. Other data exhibited similar
kinetics.

103
Figure 5.3: Average NO3- removal rates in the Discovery Bay pilot-scale open-water wetland by
season. Percent removal calculated based on a 1.5 day hydraulic residence time. Error bars
represent standard error of the mean (n=9-14).

104
Figure 5.4: Average inlet and outlet concentrations of nitrogen species ± standard error of the
mean (n=3-5).
0
0.02
0.04
0.06
0.08
0.1
0.12
0.14
Inlet Outlet Inlet Outlet Inlet Outlet
NH4+ NO2- ON
Concentr
atio
n (
mM
N)
NH4+ NO2
- Organic nitrogen

105
Table 5.2: Typical Open-Water Cell Influent Water Quality Parameters
Parameter Valuea
[NO3-] (mM) 1.48±0.05
[NO2-] (mM) 0.011±0.005
[NH4+] (mM) 0.045±0.023
[Organic N] (mM-N) 0.093±0.025
TOC (mg L-1-C) 5.9±0.3
[SO42-] (mM) 1.5±0.1
[Cl-] (mM) 10.1±0.2
[Total P] (mM) 0.122±0.008
pH 8.6±0.2
aAverage ± standard error of the mean.
The observed seasonal dependence of NO3- removal rates was consistent with the effect
of water temperature on denitrification rates, as predicted by the modified Arrhenius equation
(Kadlec, 2012):
k = k20θ(T−20) (5.2)
where θ is the temperature coefficient, k20 is the first-order removal rate at 20° C (m yr-1), and T
is the water temperature (°C) (Figure 5.5). The obtained θ value agreed with data from surface
flow wetlands (i.e., 1.12±0.02 in this study vs. 1.11±0.01 in previous studies) (Kadlec, 2012).
The system-specific parameter k20 provided a means of comparing the Discovery Bay
open-water wetland performance with other free-water surface flow constructed wetlands. The
calculated value (k20=59.4±6.2 m yr-1) was higher than over 75% of the rates compiled in a
review of 44 surface flow wetlands (range of 5-168 m yr-1; median of 25±8 m yr-1) (Kadlec,
2012), demonstrating that the open-water wetland cell provided relatively efficient NO3-
removal.
NO3- concentrations dropped significantly from the top to the bottom of the biomat (i.e.,
from 0.5 mM at water-biomat interface to <0.05 mM at the wetland bottom; Figure 5.6),
demonstrating that NO3- was attenuated in the diffuse biomat layer. Dissolved oxygen
concentrations exhibited a similar profile, ranging from super-saturated in the water column, to
anoxic within the biomat. SO42- was also depleted within the biomat (Figure 5.6).

106
Figure 5.5: Natural log of first-order NO3- areal removal rates (k; m yr-1) in the Discovery Bay
pilot-scale open-water wetland versus average wetland water temperature above 20° C. Dotted
line represents the best-fit line (r2=0.63; slope=0.116 °C-1; y-intercept=4.08).

107
Figure 5.6: Typical profile of aqueous species in middle of Discovery Bay open-water pilot
scale wetland, collected on April 2014 at 3:00 PM. Error bars represent ± standard error of the
mean (n=3).

108
Figure 5.7: Organic carbon (C), nitrogen (N), and phosphorus (P) mass balance (average ±
standard error of the mean; kmol yr-1 for fluxes, kmol for biomat) for Discovery Bay open-water
wetland during 2012-2013. Accretion fluxes are based on measured biomat elemental
composition (32±1% organics) and measured accumulation rate. Photosynthesis and aerobic
respiration fluxes are based on diurnal oxygen profiles. Denitrification fluxes calculated using
rates measured in acetylene-block microcosms, corrected and averaged by monthly average
temperatures and Equation 5.2.

109
Figure 5.8: Conversion of NO3- to N2O via partial denitrification in anoxic microcosms amended
with acetylene gas (5 mL; ~10% v/v). Experiment conducted at 22°C. Error bars represent ±
one standard deviation (n=3).

110
5.3.2 NO3- Removal Mechanisms
Potential NO3- removal mechanisms in the open-water wetland included denitrification,
assimilatory uptake, and anammox (Burgin and Hamilton, 2007). Although NH4+ was formed
within the wetland biomat (Figure 5.6), NH4+ was not detected in the water column. Therefore,
NH4+ most likely contributed only to localized cycling of nitrogen. In other words, NH4
+
produced at the wetland bottom was assimilated, converted to nitrogen gas via anammox, or
oxidized to NO3- at the biomat-water interface.
To elucidate the contribution of each removal mechanism to the overall loss of NO3-, a
mass balance was calculated for nitrogen, phosphorus, and carbon in the wetland cell (Figure
5.7). Changes in element concentrations were accounted for by measured denitrification rates,
calculations of primary productivity and oxic respiration rates, as well as the accumulation rate
and composition of the biomat on the wetland bottom.
Denitrification. In contrast to relatively thin periphyton layers in streams and rivers (i.e.,
<1 cm thick) where photosynthetic oxygen production slows denitrification rates during the
daytime (Risgaard-Petersen et al., 1994), the anoxic conditions necessary for denitrification
existed within much of the thick, diffuse biomat layer of the open-water cell throughout the day
(Figure 5.6).
To verify that denitrification occurred in the wetland biomat, the final step of
denitrification (conversion of N2O to N2) was inhibited in microcosms by introducing acetylene.
Inorganic nitrogen species were measured during 5-day incubations. Denitrification was the
primary loss mechanism of NO3-, with greater than 95% of the added NO3
- recovered as N2O
(Figure 5.8). Denitrification rates in anoxic microcosms, adjusted to 20°C using Equation 2,
agreed well with rates measured in the pilot-scale system (k20,microcosm=58.7±5.4 m yr-1;
k20,pilot=59.4±6.2 m yr-1). Annual denitrification rates based on this measured k20 value and
average monthly temperatures (Table 4.4) (Metar, 2013) accounted for the NO3- removed from
the pilot-scale open-water wetland, within uncertainty (83±22%; Figure 5.7). N2O formation in
anoxic microcosms not amended with acetylene accounted for less than 1% of the NO3- lost and
occurred at rates similar to those previously observed in vegetated constructed wetlands (~7
mmol m-2 d-1 in this study, versus -0.1 to 140 mmol m-2 d-1 in previous study) (Søvik et al.,
2006).
Further evidence for the importance of denitrification to NO3- removal was provided by
the presence of the nitrite reduction genes nirS and nirK near the inlet of the open-water cell
(Figure 5.9). Normalized gene abundances were similar to those previously observed in
vegetated free surface-flow treatment wetlands (Ligi et al., n.d.; Chon et al., 2011). As expected,
the normalized abundance of nirS was higher than that of nirK (0.01-0.02 copies nirS per copy
16S gene copy, versus ~0.005 copies nirK per copy 16S gene copy), because nirS is more widely
distributed among denitrifiers (Braker et al., 1998), and is typically in higher abundance than
nirK in surface waters (Jones and Hallin, 2010).
Denitrification requires an organic carbon substrate at a stoichiometric ratio of
approximately one carbon per nitrate (given an organic carbon source such wastewater-derived
organic matter or algae). At lower carbon-to-nitrate ratios, denitrification may be incomplete

111
(U.S. Environmental Protection Agency, 1993). In wetland systems, organic carbon is typically
derived either from influent wastewater or from decaying biomass (i.e., emergent plants and/or
algae).
In the pilot-scale open-water cell, 17±4 kmol yr-1 of organic carbon (with a composition
similar to algae) would have been necessary to denitrify the 15±3 kmol yr-1 NO3- removed.
Average annual primary productivity estimates, calculated based on dissolved oxygen
measurements (see Figure 5.10 for example dissolved oxygen profiles), were 38±2 kmol yr-1.
Furthermore, based on measured oxygen consumption rates, 23±5 kmol yr-1 of organic carbon
was calculated to be consumed via aerobic respiration. These values were within the range
reported for autotrophic communities in flowing water (Odum, 1956), and the primary
productivity estimate was similar to the highest rates reported in wetlands (i.e., 1.1 kg m-2 yr-1 C,
which corresponds to 37 kmol yr-1 C in the 400 m2 pilot-scale open-water cell) (Azim et al.,
2005). A total of 2±1 kmol yr-1 of organic carbon was predicted to accumulate in the bottom of
the cell, based on biomat elemental composition and mass accumulation rates (see below),
leaving 12±5 kmol yr-1 of organic carbon remaining, which is within the range necessary to drive
denitrification (Figure 5.7). Thus, microbial denitrification in anoxic regions of the biomat,
fueled by algal-derived organic carbon, was the predominant NO3- loss mechanism in the
Discovery Bay open-water cell.
Modest amounts of NO3- may also have been lost by autotrophic denitrification driven by
the oxidation of sulfide, which was formed by SO42- reduction at the bottom of the biomat
(Figure 5.6) (Shao et al., 2010). However, this process would not affect the overall carbon mass
balance, because an equivalent amount of carbon would have been required for SO42- reduction
prior to sulfide oxidation by NO3- as was necessary for heterotrophic denitrification.
Furthermore, sulfur was not appreciably removed from the system (e.g., via volatilization of
H2S), since SO42- concentrations at the wetland outlet were similar to those measured at the
wetland inlet.

112
Figure 5.9: Abundances of genes involved in denitrification (nirK and nirS) and anammox (hzs)
near the inlet of the open-water wetland cell, normalized to 16S gene copies. Measurements
were taken near the biomat-water interface (Biomat top) and at the bottom of the biomat (Biomat
bottom). Error bars represent ± average of the absolute deviation of duplicate measurements.

113
Figure 5.10: Example of dissolved oxygen (DO) profiles used to calculate annual primary
productivity and respiration rates. Data shown from April 8th, 2013 at outlet of pilot-scale
wetland (Manta MultiProbe, Eureka Environmental, Austin, TX). Diffusion was based on [DO]
before sunrise and after sunset; respiration was based on consumption of DO during night;
Primary productivity=Change in [DO]+Respiration-Diffusion of DO (Odum, 1956).

114
Figure 5.11: Average biomat thickness measured throughout the pilot-scale open-water wetland
throughout the study period. Slope=1.2±0.5 cm yr-1. r2=0.55.
Accretion. In vegetated wetlands, NO3- uptake by plants and subsequent burial of plant
material can account for up to 10% of the observed NO3- removal (Vymazal, 2007). Accretion is
typically more important in systems with low nitrogen loadings (Kadlec and Wallace, 2009).
Attached algae can be grown and harvested as a means of removing NO3- from wastewater
effluent (Craggs et al., 1996) and from NO3--contaminated drinking water (Sládečková et al.,
1983). In open-water cells, the majority of NO3- assimilated by algal and microbial growth will
likely be released upon decomposition as organic nitrogen and NH4+ within the biomat. Much of
the organic nitrogen and NH4+ will subsequently be recycled as fresh biomass, re-oxidized to
NO3-, or converted to N2 via anammox (see below). Small amounts of biomat could be sloughed
off, but this loss was negligible due to the low flow rates employed. Detritus that accumulates as
wetland sediments will eventually fill the wetland cell. Permanent nitrogen removal would
therefore require periodic sediment removal and disposal (Chapter 2).
The biomat accumulated in the pilot-scale open-water cell at a rate of 1.2±0.5 cm yr-1
during the 3-year study period (Figure 5.11), which is slightly higher than rates reported for
vegetated surface flow wetlands (i.e., 0.1-0.9 cm yr-1) (Kadlec and Wallace, 2009). The organic
matter content (32±1%), organic carbon content (12.7±0.3%), and nitrogen content (2.0±0.1% )
of the wetland biomat were within the range typically observed for vegetated wetland sediments
(i.e., 20-35% organic matter; 12-20% organic carbon; 1-3% nitrogen) (Kadlec and Wallace,
2009). The biomat composition did not vary significantly throughout the wetland (Figure 5.12).
0
2
4
6
8
10
12
11/2011 5/2012 12/2012 7/2013 1/2014
Bio
ma
t th
ick
ne
ss
(c
m)

115
The phosphorus content of the biomat was almost 3 times higher than expected based on
the Redfield N:P ratio of 16:1 (i.e., 0.8±0.1%; N:P=5.4) (Redfield, 1934; Redfield et al., 1963).
While N:P ratios in freshwaters often deviate from values obtained in marine systems, they are
commonly enriched with respect to N (i.e., N:P>16:1) (Hecky et al., 1993). Therefore, processes
other than assimilation may have contributed to phosphorus accumulation in the biomat, such as
adsorption or precipitation of phosphate-containing minerals (Vymazal, 2007). For example,
phosphate may adsorb to carbonate- or iron-containing minerals (Ann et al., 1999), both of
which were present in the biomat (3% CO3--C and 1% Fe by mass). Phosphate may also
precipitate in a variety of minerals (Prochaska and Zouboulis, 2006). For example, the water at
the bottom of the biomat was supersaturated with respect to struvite (NH4MgPO4·6H2O)
(Rahaman et al., 2006) at the pH values typical of the wetland (i.e., 8.5-9.5). To assure
permanent removal of phosphate from the system, the biomat would need to be harvested
periodically, as discussed below.
On the basis of the biomat accumulation rate and its nitrogen content, accretion
accounted for only about 2% of the yearly NO3- removal observed in the open-water wetland
(0.4±0.2 kmol yr-1 N; Figure 5.7). NO3- uptake may have been inhibited by the presence of
NH4+, which was present at concentrations higher than those known to suppress NO3
- uptake by
phytoplankton throughout the wetland cell (i.e., ~30 µM versus 0.5-1.0 µM to suppress NO3-
uptake) (Vymazal, 1995).
Effluent total suspended solids concentrations were 4.7±0.7 mg L-1. Assuming the
suspended solids consisted of material from the biomat, this corresponded to less than 1% of the
total nitrogen lost in the wetland (i.e., 0.12±0.02 kmol yr-1 N). Further, total nitrogen
concentrations in unfiltered samples did not differ from those in filtered samples, indicating that
particulate nitrogen was not present at significant concentrations. Therefore, export of
particulate nitrogen was not a significant nitrogen loss route in the pilot-scale cell.

116
Figure 5.12: Percent phosphorus, nitrogen, and organic content by mass in wetland biomat at the
inlet, middle, and outlet of open-water wetland on a dry weight basis. Remainder consisted of
non-volatile organic matter (i.e., minerals).

117
Figure 5.13: Concentrations of nitrogen species in anoxic microcosms amended with A: NH4+
and NO3-; B: NH4
+ and NO2-; C: NH4
+; D: NO3-. Experiment conducted at 22±2°C. Error bars
represent ± one standard deviation (n=3). NH4+ concentrations from the control experiment
(NH4+ alone; C) are plotted as dashed lines in graphs A and B to emphasize differences.

118
Anammox. Anammox couples the oxidation of NH4+ to the reduction of nitrite under
anaerobic conditions (Jetten et al., 2005):
NH4+ + NO2
− → N2 + 2H2O (5.3)
Anammox bacteria have been identified in wetland sediments (Shipin et al., 2005; Dong
and Sun, 2007) and have been shown to account for up to 24% of the N2 production in surface-
flow wetlands receiving partially nitrified wastewater effluent (Davison et al., 2006; Erler et al.,
2008) and 78% of the N2 production in vegetated wetland microcosms receiving high
concentrations of NH4+ and NO3
- (i.e., 2-20 mM) (Tao et al., 2007). Anammox accounted for up
to 33% of the N2 production in vertical-flow wetland microcosms inoculated with activated
sludge and conditioned at elevated NH4+ concentrations (i.e., 0.7 mM) (Zhu et al., 2011). In
wetlands receiving high concentrations of NH4+ (e.g., >0.7 mM), nitration coupled to anammox
may enhance NH4+ removal by reducing the amount of oxygen required to oxidize NH4
+ to N2 by
more than half compared to nitrification followed by denitrification (Tao et al., 2012). In
wetlands designed to treat municipal wastewater effluent, such as the Discovery Bay wetlands,
low concentrations of NH3 are required to avoid toxicity to mosquitofish (Gambusia) used for
vector control (Horne and Fleming-Singer, 2005). Under these conditions, anammox could
occur following dissimilatory nitrate reduction to ammonia, or if NH4+ is released from decaying
organic matter via ammonification.
In the Discovery Bay open-water cell biomat, conditions suitable for anammox were
observed in locations where NH4+ released at the cell bottom met NO3
- from the water column,
assuming that NO3- was partially reduced to transient NO2
- (Figure 5.6). The presence of hzs
confirmed that anammox organisms were present within the wetland biomat (Figure 5.9)
(Harhangi et al., 2012). Normalized hzs abundance was slightly elevated near the bottom of the
wetland where the most anoxic conditions existed and NH4+ concentrations were highest,
although the difference was not statistically significant (p>0.25; Figure 5.6). The normalized
abundance of hzs was similar to the normalized abundances measured in lake riparian zones (up
to about 0.0007 copies hzs per 16S gene copy), where anammox accounted for up to 20% of N2
production (Zhu et al., 2013).
Further evidence of the possiblitiy of anammox activity in the open-water cell biomat
was provided by NH4+ loss in anoxic microcosms containing wetland biomass. In microcosms
amended with NH4+ and either NO3
- or NO2-, NH4
+ concentrations decreased (up to 12±6 µmol
NH4+ lost; Figure 5.13, A&B), corresponding to 30-40% of total nitrogen lost, possibly due to
anammox. In contrast, NH4+ concentrations did not change significantly in microcosms that
were not amended with NO3- or NO2
- (Figure 5.13, C), demonstrating that volatilization,
adsorption, or assimilation were not responsible for NH4+ loss. In microcosms amended with
only NO3-, NH4
+ concentrations increased by up to 13±1 µmol, possibly due to ammonification
or dissimilatory nitrate reduction to ammonia (Figure 5.13, D). Further experiments using
isotopically-labeled nitrogen species would be necessary to verify and better estimate the
contribution of anammox to nitrogen removal in the open-water cell (Thamdrup and Dalsgaard,
2002).

119
5.3.3 Implications for Design of Open-Water Cells
Due to space constraints and construction costs, wetland area is one of the primary
considerations for wetland design (Kadlec, 2009). The wetland area needed to remove 90% of
NO3- from 1 MGD or 1 MLD (A90
1 ) provides a useful metric for wetland design (Chapter 3), as
this ensures a similar level of NO3- treatment as that achieved by the highest technically feasible
treatment of municipal wastewater (i.e., effluent concentrations of <3 mg L-1 N, given influent
[NO3-]<30 mg L-1) (U.S. Environmental Protection Agency, 2010; The Department of the
Environment, Maryland, 2014).
A901 values calculated based on monthly average temperatures using Equation 2 were
smaller for open-water wetlands than those calculated based on k20 values for the majority of
free-water surface flow vegetated treatment wetlands (Figure 5.14) (Kadlec, 2012). Therefore,
wetland operators could convert portions of existing vegetated wetlands to shallow, open-water
wetlands to enhance removal of trace organic contaminants (Chapters 3,4) and pathogens
(Nguyen et al., 2014; Silverman et al., 2014) without sacrificing NO3- removal. Shallow, open-
water wetlands are also less prone to hydraulic short-circuiting caused by preferential flow-paths
in vegetated wetlands (Lightbody et al., 2008), because there is no emergent vegetation to
constrict water flow or create channels.
The design and operation of open water cells for NO3- removal is relatively simple and
requires a shallow cell that is lined to prevent the growth of emergent macrophytes. Shallow
water (<30 cm deep) and low linear flow rates (0.1 cm s-1) are necessary to ensure that the
diffuse biomat on the wetland bottom receives sufficient sunlight to support photosynthesis and
is not washed out of the system. The biomat thickness will increase over time and will likely
provide optimal NO3- removal when it is between 4 and 8 cm thick. With deeper biomat
thicknesses it is possible that NO3- removal via anammox will be enhanced. To prevent
clogging, the biomat eventually needs to be harvested (Chapter 4). After removal, the nutrient-
rich biomat may be useful as a fertilizer.
In addition to treating nitrified municipal wastewater effluent, shallow, open-water
wetlands may be used to treat other NO3--rich waters. The use of shallow, open-water wetland
cells to remove NO3-, pathogens, and trace organic contaminants, from an effluent-dominated
river is currently being investigated in the Prado wetlands in Southern California (Orange
County Water District, 2008). Open-water cells could also be applied to treat agricultural run-off
containing NO3-.

120
Figure 5.14: Mean area predicted to provide 90% removal of NO3- from 1 MGD or 1 MLD of
wastewater effluent in open-water (solid line) and vegetated (dashed line) (Kadlec, 2012)
treatment wetlands throughout the year (A901 ). Nitrate removal rates were calculated using
Equation 2 using average water temperatures in Discovery Bay, CA (i.e., from 10˚ C in the
winter to 23˚ C in the summer; Table 4.4). Gray area indicates ± standard error of the mean.
Dashed lines show the area per MGD of existing full-scale treatment wetlands (Orange County
Water District, 2008; Florida Department of Environmental Protection, 2012) and A901 required
for trace organic contaminants (atenolol, metoprolol, propranolol, trimethoprim, and
sulfamethoxazole) during the summer (Chapter 4).

121
CHAPTER 6. Conclusions

122
6.1 Summary
The ability of open-water wetland cells to remove trace organic contaminants and nitrate
from wastewater effluent was evaluated in a series of experiments conducted in the laboratory
and at a pilot-scale facility. Open-water wetlands are shallow (20-30 cm) cells that are lined
with a geotextile fabric to prevent the growth of emergent macrophytes. The unshaded water is
well-suited to contaminant removal via photolysis. In addition, a diffuse algal biomat on the
wetland bottom supports microorganisms capable of transforming wastewater-derived
contaminants and nitrate. To evaluate the ability of open-water wetland cells to treat trace
organic contaminants and nutrients, a pilot-scale system receiving nitrified, non-disinfected
municipal wastewater effluent was monitored over a 3-year period. To gain further insight into
the system, microcosm experiments were conducted using water and biomat samples from the
pilot-scale system. The removal of trace organic contaminants via photolysis in open-water
wetlands was assessed with a photolysis model based on experiments using simulated sunlight.
Results suggested that photolysis could be optimized in shallow water (i.e., ~30 cm) and that
photolysis could be enhanced by controlling nitrate concentrations, dissolved organic carbon
concentrations, and pH. Monitoring of the pilot-scale system demonstrated that
biotransformation in the wetland biomat was also an important removal mechanism for trace
organic contaminants. In conjunction with photolysis, this allowed for efficient (>90%) removal
of most of the trace organic contaminants studied, in wetland areas similar to existing full-scale
wetland systems. In addition to trace organic contaminant removal, the pilot-scale open-water
wetland achieved more than 60% removal of nitrate annually, primarily via microbial
denitrification. The observed nitrate removal rates were higher than rates typically observed for
vegetated wetland systems.
6.2 Removal of Trace Organic Contaminants in Open-Water Wetlands
In Chapter 2, previous studies evaluating the removal of trace organic contaminants in
vegetated and subsurface flow treatment wetlands were critically reviewed. The results of this
analysis indicated efficient removal of numerous compounds in existing wetlands, but it also
revealed a great deal of variability in removal rates among studies. Trace organic contaminant
removal in previous studies was typically ascribed to sorption, biotransformation, and in
wetlands with open-water zones, photolysis. In most cases, however, trace organic contaminant
removal mechanisms were not quantified under carefully controlled conditions, making
generalization of results challenging, and limiting their usefulness in optimizing wetland design.
Nonetheless, analysis of data in Chapter 2 led to the hypothesis that by designing wetlands in a
unit process fashion, with individual wetland cells optimized to remove specific contaminants
connected in series, wetland efficiency and reliability could be increased, as compared to a
“natural design” approach. In addition, the review indicated that shallow, open-water systems
and aerobic conditions would be more likely to result in rapid removal of trace organic
contaminants. To assess the unit process concept, novel wetland cells were described, including
an open-water wetland cell that exploits photolysis and photosynthesis.
To evaluate the ability of open-water wetlands to remove trace organic contaminants via
photolysis, a photolysis model was developed in Chapter 3 based on experiments using simulated
sunlight. The model was used to estimate trace organic contaminants photolysis rates under
different wetland conditions (e.g., depth, pH, dissolved organic carbon concentration, and nitrate

123
concentration). The model was also used to determine the wetland area necessary for efficient
(i.e., 90%) removal of contaminants. The results indicated that open-water wetland depths of
about 30 cm maximize photolysis rates while minimizing the potential for growth of floating
vegetation. Further, the model results suggested that photolysis rates were enhanced at high
nitrate concentrations, due to the photochemical formation of hydroxyl radical. Dissolved
organic carbon reduced photolysis rates for most compounds, but the effect was not as drastic for
compounds susceptible to reaction with triplet dissolved organic matter (e.g., diuron and
propranolol). Wetland pH affected photolysis rates of test compounds because hydroxyl radical
was converted to carbonate radical via reaction with carbonate at alkaline pH values (i.e., >9).
Therefore, the photolysis rates of compounds that react rapidly with carbonate radical (e.g.,
sulfamethoxazole and propranolol) were enhanced at elevated pH values, while the photolysis
rates of compounds that react slowly with carbonate radical (e.g., atenolol and carbamazepine)
were reduced. Overall, the results of Chapter 3 suggested that most compounds studied could be
removed efficiently via photolysis in wetland areas similar to existing systems during summer,
and for some compounds, during the spring and fall.
Monitoring of ambient concentrations of trace organic contaminants in a pilot-scale open-
water wetland cell indicated that photolysis could not entirely account for the observed removal
of trace organic contaminants. To explain this discrepancy, the removal of trace organic
contaminants via sorption and biotransformation in the open-water wetland biomat was assessed
in Chapter 4. While sorption served as a temporary sink for hydrophobic compounds (e.g.,
propranolol), the sorption capacity of the biomat was quickly saturated. Therefore, sorption was
not a sustainable removal mechanism. Biotransformation rates of trace organic contaminants
measured in microcosm experiments displayed differences between illuminated and dark
conditions. Certain compounds (e.g., trimethoprim and sulfamethoxazole) were transformed
more rapidly under dark conditions (i.e., pH≈8.5; [O2] ≈ 5 mg L-1) and other compounds (e.g.,
β-blockers) were transformed more rapidly under illuminated conditions, when algal
photosynthesis elevated pH values and dissolved oxygen concentrations (i.e., pH≈9.5;
[O2]>20 mg L-1). Measured biotransformation rates were typically about an order of magnitude
higher than rates previously measured in vegetated wetlands and surface waters. Predictions for
removal of trace organic contaminants in open-water cells via photolysis and biotransformation
suggested that efficient removal (i.e., >90%) could be achieved in wetland areas similar to those
occupied by existing full-scale systems throughout most of the year.
6.3 Removal of Nitrate in Open-Water Wetlands
Because wetlands are commonly employed for nutrient removal, the ability of open-water
wetlands to remove nitrate was evaluated (Chapter 5). On an annual basis, greater than 60% of
the nitrate entering the pilot-scale open-water cell was removed. As often observed in vegetated
wetlands, nitrate removal was more efficient during warm months and slowed during the cool
months, due to changes in microbial activity. Temperature-corrected nitrate removal rates in the
pilot-scale open-water cell were higher than values reported for more than 75% of vegetated
wetlands (k20=59.4±6.2 m yr-1).
To ensure that nitrate removal in the open-water wetland was sustainable, potential
nitrate removal mechanisms were evaluated. Microbial denitrification rates were measured in
anoxic microcosms containing water and biomass from the pilot-scale cell. On the basis of
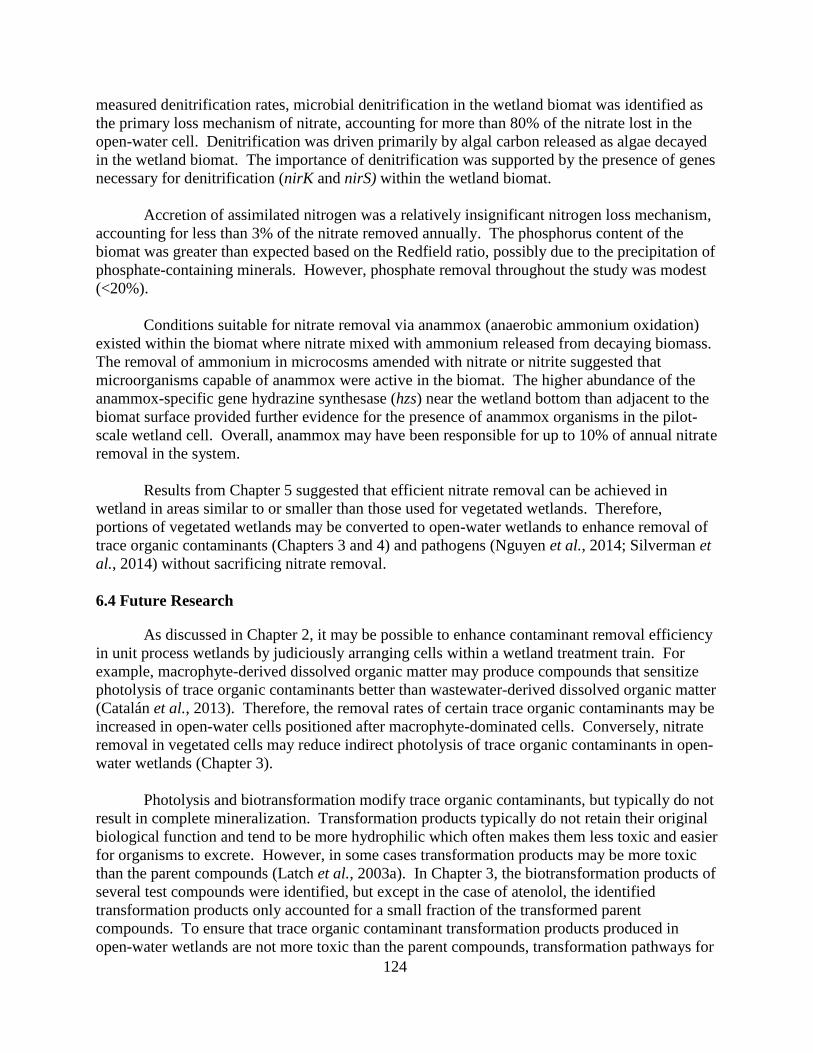
124
measured denitrification rates, microbial denitrification in the wetland biomat was identified as
the primary loss mechanism of nitrate, accounting for more than 80% of the nitrate lost in the
open-water cell. Denitrification was driven primarily by algal carbon released as algae decayed
in the wetland biomat. The importance of denitrification was supported by the presence of genes
necessary for denitrification (nirK and nirS) within the wetland biomat.
Accretion of assimilated nitrogen was a relatively insignificant nitrogen loss mechanism,
accounting for less than 3% of the nitrate removed annually. The phosphorus content of the
biomat was greater than expected based on the Redfield ratio, possibly due to the precipitation of
phosphate-containing minerals. However, phosphate removal throughout the study was modest
(<20%).
Conditions suitable for nitrate removal via anammox (anaerobic ammonium oxidation)
existed within the biomat where nitrate mixed with ammonium released from decaying biomass.
The removal of ammonium in microcosms amended with nitrate or nitrite suggested that
microorganisms capable of anammox were active in the biomat. The higher abundance of the
anammox-specific gene hydrazine synthesase (hzs) near the wetland bottom than adjacent to the
biomat surface provided further evidence for the presence of anammox organisms in the pilot-
scale wetland cell. Overall, anammox may have been responsible for up to 10% of annual nitrate
removal in the system.
Results from Chapter 5 suggested that efficient nitrate removal can be achieved in
wetland in areas similar to or smaller than those used for vegetated wetlands. Therefore,
portions of vegetated wetlands may be converted to open-water wetlands to enhance removal of
trace organic contaminants (Chapters 3 and 4) and pathogens (Nguyen et al., 2014; Silverman et
al., 2014) without sacrificing nitrate removal.
6.4 Future Research
As discussed in Chapter 2, it may be possible to enhance contaminant removal efficiency
in unit process wetlands by judiciously arranging cells within a wetland treatment train. For
example, macrophyte-derived dissolved organic matter may produce compounds that sensitize
photolysis of trace organic contaminants better than wastewater-derived dissolved organic matter
(Catalán et al., 2013). Therefore, the removal rates of certain trace organic contaminants may be
increased in open-water cells positioned after macrophyte-dominated cells. Conversely, nitrate
removal in vegetated cells may reduce indirect photolysis of trace organic contaminants in open-
water wetlands (Chapter 3).
Photolysis and biotransformation modify trace organic contaminants, but typically do not
result in complete mineralization. Transformation products typically do not retain their original
biological function and tend to be more hydrophilic which often makes them less toxic and easier
for organisms to excrete. However, in some cases transformation products may be more toxic
than the parent compounds (Latch et al., 2003a). In Chapter 3, the biotransformation products of
several test compounds were identified, but except in the case of atenolol, the identified
transformation products only accounted for a small fraction of the transformed parent
compounds. To ensure that trace organic contaminant transformation products produced in
open-water wetlands are not more toxic than the parent compounds, transformation pathways for

125
more test compounds should be elucidated. In some cases, this may require the use of 14C-labeled compounds and collection of labeled CO2 to evaluate the extent of mineralization.
While it is not possible to identify the transformation products of all wastewater-derived trace
organic contaminants in open-water cells, generalizations may be possible for chemical classes
and specific functional groups. Bioassays may also provide guidance as to which test
compounds’ transformation products are likely to retain biological activity.
Biotransformation rates of certain test compounds were found to differ in illuminated and
dark microcosms. As discussed in Chapter 4, it was expected that trace organic contaminant
oxidation would be enhanced under the high dissolved oxygen concentrations produced by
photosynthesis at the top of the biomat, which was observed for metoprolol and propranolol.
Further research is necessary to explain the enhanced rates of transformation of trimethoprim and
sulfamethoxazole observed in dark microcosms. Insight into this process may be gained by
inhibiting specific types of bacteria, or by adding easily-utilized carbon sources to stimulate
bacteria. For example, addition of allylthiourea to microcosms can inhibit nitrifying
microorganisms that may be more active when ammonium is released via ammonification in
dark microcosms (Batt et al., 2006). The addition of acetate to microcosms could be used to
mimic the effect of the release of labile compounds during photosynthesis.
In Chapter 5, nitrogen cycling and removal in open-water wetlands was assessed. While
nitrate was primarily removed by denitrification, microcosm incubations and microbial analysis
suggested that some nitrate loss may be attributed to anammox. To quantify the importance of
anammox in open-water wetlands, studies employing isotopically labeled nitrogen species could
be employed (Thamdrup and Dalsgaard, 2002). Understanding the contribution of anammox to
nitrogen removal would help inform the management open-water wetland systems. For example,
removal of nitrogen via anammox may be enhanced as the wetland biomat thickens, implying
that nitrogen removal would be optimized in thicker biomats than predicted based only on nitrate
removal via denitrification.
In addition to wastewater-derived contaminants, open-water wetlands may also be
capable of removing contaminants present in other wastewaters, such as agricultural runoff and
industrial wastewater. Agricultural runoff contains pesticides, which in some cases are removed
in vegetated wetlands (Kruger et al., 1996; Moore et al., 2000, 2002). Certain pesticides are
photo-labile (Zeng and Arnold, 2012; Remucal, 2014), and their removal may be enhanced via
photolysis in open-water wetland cells. Removal of other pesticides via biotransformation may
be enhanced under the oxic conditions of open-water wetlands, as compared to in predominantly
anaerobic vegetated wetlands. Trace organic contaminants present in industrial wastewater may
be removed in vegetated wetlands (Knight et al., 1999; Lin et al., 2006), but their removal in
open-water wetlands has not been assessed. Open-water wetlands may also be employed to
remove nitrate from agricultural runoff.
Research described in Chapters 2-5 utilized microcosm-scale experiments to gain insight
into trace organic contaminant and nitrate removal in the Discovery Bay pilot-scale wetland.
Scaling up open-water unit process cells from the pilot- to the demonstration-scale would
provide wetland operators and agencies interested in building treatment with further evidence of
the utility and feasibility of these systems. It also could help to identify maintenance

126
requirements and factors affecting wetland performance. To this end, demonstration-scale open-
water cells have been built in the Prado Wetlands in Southern California (Orange County Water
District, 2008). Three parallel open-water cells, each about 20 times larger than the Discovery
Bay pilot-scale cell (i.e., ~0.75 ha) receive approximately 0.3 MGD (~1 MLD) of water from the
adjacent, effluent-dominated Santa Ana River. By monitoring the removal of trace organic
contaminants, nutrients, and pathogens in these cells, the performance of open-water cells can be
assessed under a range of operating conditions. The feasibility of maintenance activities, such as
removing floating vegetation and periodically removing the biomat, can also be evaluated.

127
References
Ahn, C., Gillevet, P. M., and Sikaroodi, M. (2007). Molecular characterization of microbial communities in treatment
microcosm wetlands as influenced by macrophytes and phosphorus loading. Ecol. Indic. 7, 852.
Alder, A. C., Schaffner, C., Majewsky, M., Klasmeier, J., and Fenner, K. (2010). Fate of beta-blocker human
pharmaceuticals in surface water. Water Res. 44, 936.
Alvord, H. H., and Kadlec, R. H. (1995). The interaction of atrazine with wetland sorbents. Ecol. Eng. 5, 469.
American Public Health Association. (1995). Standard Methods for the Examination of Water and Wastewater, 19th
edition. Washington, DC: American Public Health Association,, A. W. W. A., Water Environment Federation.
Andreozzi, R., Raffaele, M., and Nicklas, P. (2003). Pharmaceuticals in STP effluents and their solar
photodegradation in aquatic environment. Chemosphere 50, 1319.
Ann, Y., Reddy, K. R., and Delfino, J. J. (1999). Influence of chemical amendments on phosphorus immobilization
in soils from a constructed wetland. Ecol. Eng. 14, 157.
Ansa, E. D. O., Lubberding, H. J., Ampofo, J. A., and Gijzen, H. J. (2011). The role of algae in the removal of
Escherichia coli in a tropical eutrophic lake. Ecol. Eng. 37, 317.
AOAC. (1997). Microchemical determinatino of carbon, hydrogen, and nitrogen, automated method. Official
Methods of Analysis of AOAC International, 16th edition. Arlington, VA: AOAC International, p. 5.
Arias, C., Brix, H., and Johansen, N. H. (2003). Phosphorus removal from municipal wastewater in an experimental
two-stage vertical flow constructed wetland system equipped with a calcite filter. Water Sci. Technol. 48, 51.
Aronesty, E. (2011). ea-utils: Command-line tools for processing biological sequencing data.
Azim, M. E., Verdegem, M. C. J., Van Dam, A. A., and Beveridge, M. C. M. (Eds.). (2005). Periphyton: Ecology,
exploitation, and management, 1st edition. Oxfordshire, UK: CABI.
Bacchetti De Gregoris, T., Aldred, N., Clare, A. S., and Burgess, J. G. (2011). Improvement of phylum- and class-
specific primers for real-time PCR quantification of bacterial taxa. J. Microbiol. Methods 86, 351.
Bachand, P. A. M., and Horne, A. J. (2000). Denitrification in constructed free-water surface wetlands. Ecol. Eng.
14, 17.
Balon, K., Riebesehl, B. U., and Müller, B. W. (1999). Drug liposome partitioning as a tool for the prediction of
human passive intestinal absorption. Pharm. Res. 16, 882.
Barker, J., and Brown, M. (1994). Trojan horses of the microbial world. Microbiology 140, 1253.
Bastviken, S. K., Eriksson, P. G., Premrov, A., and Tonderski, K. (2005). Potential denitrification in wetland
sediments with different plant species detritus. Ecol. Eng. 25, 183.
Batt, A. L., Kim, S., and Aga, D. S. (2006). Enhanced biodegradation of iopromide and trimethoprim in nitrifying
activated sludge. Env. Sci Technol 40, 7367.
Beaver, J., Miller-Lemke, A., and Acton, J. (1998). Midsummer zooplankton assemblages in four types of wetlands
in the Upper Midwest, USA. Hydrobiologia 380, 209.

128
Benner, J., Salhi, E., Ternes, T., and Von Gunten, U. (2008). Ozonation of reverse osmosis concentrate. Water Res.
42, 3003.
Betageri, G. V., and Rogers, J. A. (1987). Thermodynamics of partitioning of β-blockers in the n-octanol- buffer and
liposome systems. Int. J. Pharm. 36, 165.
Bonvin, F., Rutler, R., Chèvre, N., Halder, J., and Kohn, T. (2011). Spatial and temporal presence of a wastewater-
derived micropollutant plume in Lake Geneva. Environ. Sci. Technol. 45, 4702.
Boon, P., Virtue, P., and Nichols, P. (1996). Microbial consortia in wetland sediments. Mar. Freshw. Res. 47, 27.
Boreen, A. L., Arnold, W. A., and McNeill, K. (2004). Photochemical fate of sulfa drugs in the aquatic environment:
Sulfa drugs containing five-membered heterocyclic groups. Environ. Sci. Technol. 38, 3933.
Boreen, A. L., Edhlund, B. L., Cotner, J. B., and McNeill, K. (2008). Indirect photodegradation of dissolved free
amino acids: The contribution of singlet oxygen and the differential reactivity of DOM from various sources. Env.
Sci Technol 42, 5492.
Borg, K. O., Carlsson, E., Hoffmann, K.-J., Jönsson, T.-E., Thorin, H., and Wallin, B. (1975). Act Pharmacol. Toxicol.
Acta Pharmacol. Toxicol. (Copenh.) 36, 125.
Bosshard, F., Bucheli, M., Meur, Y., and Egli, T. (2010). The respiratory chain is the cell’s Achilles’ heel during
UVA inactivation in Escherichia coli. Microbiology 156, 2006.
Boyd, G. R., Reemtsma, H., Grimm, D. A., and Mitra, S. (2003). Pharmaceuticals and personal care products (PPCPs)
in surface and treated waters of Louisiana, USA and Ontario, Canada. Sci. Total Environ. 311, 135.
Braker, G., Fesefeldt, A., and Witzel, K.-P. (1998). Development of PCR primer systems for amplification of nitrite
reductase genes (nirK and nirS) to detect denitrifying bacteria in environmental samples. Appl. Environ. Microbiol.
64, 3769.
Breitholtz, M., Näslund, M., Stråe, D., Borg, H., Grabic, R., and Fick, J. (2012). An evaluation of free water surface
wetlands as tertiary sewage water treatment of micro-pollutants. Ecotoxicol. Environ. Saf. 78, 63.
Brezonik, P. L., and Fulkerson-Brekken, J. (1998). Nitrate-induced photolysis in natural waters: Controls on
concentrations of hydroxyl radical photo-intermediates by natural scavenging agents. Env. Sci Technol 32, 3004.
Brix, H. (1997). Do macrophytes play a role in constructed treatment wetlands? Water Sci. Technol. 35, 11.
Brodin, T., Fick, J., Jonsson, M., and Klaminder, J. (2013). Dilute concentrations of a psychiatric drug alter behavior
of fish from natural populations. Science 339, 814.
Burgin, A. J., and Hamilton, S. K. (2007). Have we overemphasized the role of denitrification in aquatic ecosystems?
Front. Ecol. Environ. 5, 89.
Burns, K. A., and Smith, J. L. (1981). Biological monitoring of ambient water quality: The case for using bivalves as
sentinel organisms for monitoring petroleum pollution in coastal waters. Estuar. Coast. Shelf Sci. 13, 433.
Buser, H.-R., Poiger, T., and Müller, M. D. (1999). Occurrence and environmental behavior of the chiral
pharmaceutical drug ibuprofen in surface waters and in wastewater. Environ. Sci. Technol. 33, 2529.
Buth, J. M., Grandbois, M., Vikesland, P. J., McNeill, K., and Arnold, W. A. (2009). Aquatic photochemistry of
chlorinated triclosan derivatives. Environ. Toxicol. Chem. 28, 2555.

129
Buth, J. M., Steen, P. O., Sueper, C., Blumentritt, D., Vikesland, P. J., Arnold, W. A., and McNeill, K. (2010). Dioxin
photoproducts of triclosan and its chlorinated derivatives in sediment cores. Env. Sci Technol 44, 4545.
Buttner, J. K. (1986). Corbicula as a biological filter and polyculture organism in catfish rearing ponds. Progress.
Fish-Cult. 48, 136.
Buxton, G. V., Greenstock, C. L., Helman, W. P., and Ross, A. B. (1988). Critical review of rate constants for
reactions of hydrated electrons, hydrogen atoms and hydroxyl radicals (·OH/·O-) in aqueous solutions. J Phys Chem
Ref Data 17, 513.
Calheiros, C. S. C., Duque, A. F., Moura, A., Henriques, I. S., Correia, A., Rangel, A. O. S. S., and Castro, P. M. L.
(2009). Changes in the bacterial community structure in two-stage constructed wetlands with different plants for
industrial wastewater treatment. Bioresour. Technol. 100, 3228.
Calza, P., Medana, C., Padovano, E., Giancotti, V., and Minero, C. (2013). Fate of selected pharmaceuticals in river
waters. Environ. Sci. Pollut. Res. 20, 2262.
Camacho-Muñoz, D., Martín, J., Santos, J., Aparicio, I., and Alonso, E. (2012). Effectiveness of conventional and
low-cost wastewater treatments in the removal of pharmaceutically active compounds. Water. Air. Soil Pollut. 223,
2611.
Canonica, S., Jans, U., Stemmler, K., and Hoigné, J. (1995). Transformation kinetics of phenols in water:
Photosensitization by dissolved natural organic material and aromatic ketones. Env. Sci Technol 29, 1822.
Canonica, S., Kohn, T., Mac, M., Real, F. J., Wirz, J., and Von Gunten, U. (2005). Photosensitizer method to
determine rate constants for the reaction of carbonate radical with organic compounds. Env. Sci Technol 39, 9182.
Canonica, S., and Laubscher, H.-U. (2008). Inhibitory effect of dissolved organic matter on triplet-induced oxidation
of aquatic contaminants. Photochem. Photobiol. Sci. 7, 547.
Caporaso, J. G., Bittinger, K., Bushman, F. D., DeSantis, T. Z., Andersen, G. L., and Knight, R. (2009). PyNAST.
Bioinformatics 26, 266.
Caporaso, J. G., Kuczynski, J., Stombaugh, J., Bittinger, K., Bushman, F. D., Costello, E. K., Fierer, N., Peña, A. G.,
Goodrich, J. K., Gordon, J. I., Huttley, G. A., Kelley, S. T., Knights, D., Koenig, J. E., Ley, R. E., Lozupone, C. A.,
McDonald, D., Muegge, B. D., Pirrung, M., Reeder, J., Sevinsky, J. R., Turnbaugh, P. J., Walters, W. A., Widmann,
J., Yatsunenko, T., Zaneveld, J., and Knight, R. (2010). QIIME allows analysis of high-throughput community
sequencing data. Nat. Methods 7, 335.
Caporaso, J. G., Lauber, C. L., Walters, W. A., Berg-Lyons, D., Huntley, J., Fierer, N., Owens, S. M., Betley, J.,
Fraser, L., Bauer, M., Gormley, N., Gilbert, J. A., Smith, G., and Knight, R. (2012). Ultra-high-throughput microbial
community analysis on the Illumina HiSeq and MiSeq platforms. ISME J. 6, 1621.
Carey, R. O., and Migliaccio, K. W. (2009). Contribution of Wastewater Treatment Plant Effluents to Nutrient
Dynamics in Aquatic Systems. Environ. Manage. 44, 205.
Catalán, N., Obrador, B., Felip, M., and Pretus, J. L. (2013). Higher reactivity of allochthonous vs. autochthonous
DOC sources in a shallow lake. Aquat. Sci. 75, 581.
Chen, S., and Hoffman, M. Z. (1975). Effect of pH on the reactivity of the carbonate radical in aqueous solution.
Radiat. Res. 62, 18.
Chen, Y., Hu, C., Hu, X., and Qu, J. (2009). Indirect photodegradation of amine drugs in aqueous solution under
simulated sunlight. Env. Sci Technol 43, 2760.

130
Chilton, J. (1996). Groundwater. In D. V. Chapman, Ed., Water quality assessments: a guide to the use of biota,
sediments and water in environmental monitoring, London. E & Fn Spon, p. 413.
Chon, K., Chang, J.-S., Lee, E., Lee, J., Ryu, J., and Cho, J. (2011). Abundance of denitrifying genes coding for
nitrate (narG), nitrite (nirS), and nitrous oxide (nosZ) reductases in estuarine versus wastewater effluent-fed
constructed wetlands. Ecol. Eng. 37, 64.
Clara, M., Kreuzinger, N., Strenn, B., Gans, O., and Kroiss, H. (2005). The solids retention time—a suitable design
parameter to evaluate the capacity of wastewater treatment plants to remove micropollutants. Water Res. 39, 97.
Cole, J. J. (1982). Interactions between bacteria and algae in aquatic ecosystems. Annu. Rev. Ecol. Syst. 13, 291.
Costanza, R., D’ Arge, R., De Groot, R., Farber, S., Grasso, M., Hannon, B., Limburg, K., Naeem, S., O’Neill, R. V.,
Paruelo, J., Raskin, R. G., Sutton, P., and Van den Belt, M. (1997). The value of the world’s ecosystem services and
natural capital. Nature 387, 253.
Cotroneo, C., Csoboth, L., Yozzo, D. J., Doss, T., Will, B., and McLaughlin, J. (2011). Working toward nutrient
reduction in a eutrophic urban estuary: Ribbed mussel biofiltration in Jamaica Bay, presented at the 4th National
Conference on Ecosystem Restoration, Baltimore, MD.
Craggs, R. J., Adey, W. H., Jessup, B. K., and Oswald, W. J. (1996). A controlled stream mesocosm for tertiary
treatment of sewage. Ecol. Eng. 6, 149.
Cunningham, V. L., Binks, S. P., and Olson, M. J. (2009). Human health risk assessment from the presence of human
pharmaceuticals in the aquatic environment. Regul. Toxicol. Pharmacol. 53, 39.
Curtis, T. P., Mara, D. D., and Silva, S. A. (1992). Influence of pH, oxygen, and humic substances on ability of
sunlight To damage fecal coliforms in waste stabilization pond water. Appl. Environ. Microbiol. 58, 1335.
D’Angelo, E. (2003). Wetlands: Biodegradation of Organic Pollutants. In G. Bitton, Ed., Encyclopedia of
Environmental Microbiology. New York, USA: John Wiley & Sons, Inc, p. 3401.
Dai, X., and Boll, J. (2006). Settling velocity of Cryptosporidium parvum and Giardia lamblia. Water Res. 40, 1321.
Daughton, C. G., and Ternes, T. A. (1999). Pharmaceuticals and personal care products in the environment: Agents
of subtle change? Environ. Health Perspect. 107, 907.
Davies-Colley, R. J. (2005). Pond disinfection. In A. Shilton, Ed., Pond treatment technology. London, UK: IWA
Publishing, p. 101.
Davies-Colley, R. J., Donnison, A. M., and Speed, D. J. (2000). Towards a mechanistic understanding of pond
disinfection. Water Sci. Technol. 42, 149.
Davies-Colley, R. J., Donnison, A. M., Speed, D. J., Ross, C. M., and Nagels, J. W. (1999). Inactivation of faecal
indicator micro-organisms in waste stabilisation ponds. Water Res. 33, 1220.
Davison, L., Pont, D., Bolton, K., and Headley, T. (2006). Dealing with nitrogen in subtropical Australia. Ecol. Eng.
28, 213.
Decamp, O., and Warren, A. (1998). Bacterivory in ciliates isolated from constructed wetlands (reed beds) used for
wastewater treatment. Water Res. 32, 1989.
DeJournett, T. D., Arnold, W. A., and LaPara, T. M. (2007). The characterization and quantification of
methanotrophic bacterial populations in constructed wetland sediments using PCR targeting 16S rRNA gene
fragments. Appl. Soil Ecol. 35, 648.

131
DeSantis, T. Z., Hugenholtz, P., Larsen, N., Rojas, M., Brodie, E. L., Keller, K., Huber, T., Dalevi, D., Hu, P., and
Andersen, G. L. (2006). Greengenes, a Chimera-Checked 16S rRNA Gene Database and Workbench Compatible
with ARB. Appl. Environ. Microbiol. 72, 5069.
Diaz, R. R. (1995). Marine benthic hypoxia. Oceanogr. Mar. Biol. Annu. Rev. 33, 245.
Dobor, J., Varga, M., and Záray, G. (2012). Biofilm controlled sorption of selected acidic drugs on river sediments
characterized by different organic carbon content. Chemosphere 87, 105.
Dong, M. M., Mezyk, S. P., and Rosario-Ortiz, F. L. (2010). Reactivity of effluent organic matter (EfOM) with
hydroxyl radical as a function of molecular weight. Environ. Sci. Technol. 44, 5714.
Dong, M. M., and Rosario-Ortiz, F. L. (2012). Photochemical formation of hydroxyl radical from effluent organic
matter. Env. Sci Technol 46, 3788.
Dong, Z., and Sun, T. (2007). A potential new process for improving nitrogen removal in constructed wetlands—
Promoting coexistence of partial-nitrification and ANAMMOX. Ecol. Eng. 31, 69.
Drouillard, K. G., Chan, S., O’Rourke, S., G. Douglas, H., and Letcher, R. J. (2007). Elimination of 10 polybrominated
diphenyl ether (PBDE) congeners and selected polychlorinated biphenyls (PCBs) from the freshwater mussel, Elliptio
complanata. Chemosphere 69, 362.
Edgar, R. C. (2010). Search and clustering orders of magnitude faster than BLAST. Bioinformatics 26, 2460.
Emerson, D., Weiss, J. V., and Megonigal, J. P. (1999). Iron-oxidizing bacteria are associated with ferric hydroxide
precipitates (Fe-plaque) on the roots of wetland plants. Appl. Environ. Microbiol. 65, 2758.
EPA. (1993). Subsurface Flow Constructed Wetlands For Waste Water Treatment. EPA, Cincinnati, Ohio.
EPA. (2000a, September). Constructed Wetlands Treatment of Municipal Wastewaters. EPA, Cincinnati, Ohio.
EPA. (2000b, October). Guiding Principles for Constructed Treatment Wetlands: Providing for Water Quality and
Wildlife Habitat. EPA, Cincinnati, Ohio.
Erler, D. V., Eyre, B. D., and Davison, L. (2008). The contribution of anammox and denitrification to sediment N2
production in a surface flow constructed wetland. Environ. Sci. Technol. 42, 9144.
Falabi, J. a., Gerba, C. p., and Karpiscak, M. m. (2002). Giardia and Cryptosporidium removal from waste-water by
a duckweed (Lemna gibba L.) covered pond. Lett. Appl. Microbiol. 34, 384.
Fang, J., Semple, H. A., and Song, J. (2004). Determination of metoprolol, and its four metabolites in dog plasma. J.
Chromatogr. B 809, 9.
Faulwetter, J. L., Gagnon, V., Sundberg, C., Chazarenc, F., Burr, M. D., Brisson, J., Camper, A. K., and Stein, O. R.
(2009). Microbial processes influencing performance of treatment wetlands: A review. Ecol. Eng. 35, 987.
Fayer, R., Graczyk, T. K., Lewis, E. J., Trout, J. M., and Farley, C. A. (1998). Survival of infectious Cryptosporidium
parvum oocysts in seawater and Eastern Oysters (Crassostrea virginica) in the Chesapeake Bay. Appl. Environ.
Microbiol. 64, 1070.
Fayer, R., Trout, J. M., Walsh, E., and Cole, R. (2000). Rotifers ingest oocysts of Cryptosporidium parvum. J.
Eukaryot. Microbiol. 47, 161.
Fierer, N., Jackson, J. A., Vilgalys, R., and Jackson, R. B. (2005). Assessment of soil microbial community structure
by use of taxon-specific quantitative PCR Assays. Appl. Environ. Microbiol. 71, 4117.

132
Fleming-Singer, M. S., and Horne, A. J. (2002). Enhanced nitrate removal efficiency in wetland microcosms using
an episediment layer for denitrification. Environ. Sci. Technol. 36, 1231.
Fleming-Singer, M. S., and Horne, A. J. (2006). Balancing wildlife needs and nitrate removal in constructed wetlands.
Ecol. Eng. 26, 147.
Fletcher, M., and Marshall, K. (1982). Are solid surfaces of ecological significance to aquatic bacteria? Adv. Microb.
Ecol. 6, 199.
Florida Department of Environmental Protection. (2012). Orlando Easterly Wetlands.
Fono, L. J., Kolodziej, E. P., and Sedlak, D. L. (2006). Attenuation of wastewater-derived contaminants in an effluent-
dominated river. Env. Sci Technol 40, 7257.
Fono, L. J., and Sedlak, D. L. (2005). Use of the chiral pharmaceutical propranolol to identify sewage discharges into
surface waters. Env. Sci Technol 39, 9244.
Fortin, D., Goulet, R., and Roy, M. (2000). Seasonal cycling of Fe and S in a constructed wetland: The role of sulfate-
reducing bacteria. Geomicrobiol. J. 17, 221.
Francoeur, S. N., Schaecher, M., Neely, R. K., and Kuehn, K. A. (2006). Periphytic photosynthetic stimulation of
extracellular enzyme activity in aquatic microbial communities associated with decaying Typha litter. Microb. Ecol.
52, 662.
Fuchs, V. J., Mihelcic, J. R., and Gierke, J. S. (2011). Life cycle assessment of vertical and horizontal flow constructed
wetlands for wastewater treatment considering nitrogen and carbon greenhouse gas emissions. Water Res. 45, 2073.
Gagnon, V., Chazarenc, F., Comeau, Y., and Brisson, J. (2007). Influence of macrophyte species on microbial density
and activity in constructed wetlands. Water Sci. Technol. 56, 249.
Gans, O., Sattelberger, R., and Scharf, S. (2002). Ausgewählte Arzneimittelwirkstoffe in Zu- und Abläufen
kommunaler österreichischer Kläranlagen. Vom Wasser 98, 165.
Gearheart, R. A. (1999). The use of free surface constructed wetland as an alternative process treatment train to meet
unrestricted water reclamation standards. Water Sci. Technol. 40, 375.
Gerba, C. P., Thurston, J. A., Falabi, J. A., Watt, P. M., and Karpiscak, M. M. (1999). Optimization of artificial
wetland design for removal of indicator microorganisms and pathogenic protozoa. Water Sci. Technol. 40, 363.
Gerecke, A. C., Canonica, S., Müller, S. R., Schärer, M., and Schwarzenbach, R. P. (2001). Quantification of
dissolved natural organic matter (DOM) mediated phototransformation of phenylurea herbicides in lakes. Env. Sci
Technol 35, 3915.
Gersberg, R. M., Gearheart, R. A., and Ives, M. (1989). Pathogen removal in constructed wetlands. In D. A. Hammer,
Ed., Constructed Wetlands for Wastewater Treatment; Municipal, Industrial and Agricultural. Chelsea, MI: Lewis,
p. 431.
Gersberg, R. M., Lyon, S. R., Brenner, R., and Elkins, B. V. (1987). Fate of viruses in artificial wetlands. Appl.
Environ. Microbiol. 53, 731.
Gianfreda, L., and Rao, M. A. (2004). Potential of extra cellular enzymes in remediation of polluted soils. Enzyme
Microb. Technol. 35, 339.
Ginebreda, A., Muñoz, I., De Alda, M. L., Brix, R., López-Doval, J., and Barceló, D. (2010). Environmental risk
assessment of pharmaceuticals in rivers. Environ. Int. 36, 153.

133
Golet, E. M., Xifra, I., Siegrist, H., Alder, A. C., and Giger, W. (2003). Environmental exposure assessment of
fluoroquinolone antibacterial agents from sewage to soil. Env. Sci Technol 37, 3243.
Graczyk, T. K., Conn, D. C., Marcogliese, D. M., Graczyk, H. G., and De Lafontaine, Y. (2003). Accumulation of
human waterborne parasites by zebra mussels (Dreissena polymorpha) and Asian freshwater clams (Corbicula
fluminea). Parasitol. Res. 89, 107.
Graczyk, T. K., Girouard, A. S., Tamang, L., Nappier, S. P., and Schwab, K. J. (2006). Recovery, bioaccumulation,
and inactivation of human waterborne pathogens by the Chesapeake Bay Nonnative oyster, Crassostrea ariakensis.
Appl. Environ. Microbiol. 72, 3390.
Graczyk, T. K., Thompson, R. C., Fayer, R., Adams, P., Morgan, U. M., and Lewis, E. J. (1999). Giardia duodenalis
cysts of genotype A recovered from clams in the Chesapeake Bay subestuary, Rhode River. Am. J. Trop. Med. Hyg.
61, 526.
Gray, J. L., and Sedlak, D. L. (2005). The fate of estrogenic hormones in an engineered treatment wetland with dense
macrophytes. Water Environ. Res. 77, 24.
Groffman, P. ., Holland, E. A., Myrold, D. ., Robertson, G. P., and Zou. (1999). Denitrification. In G. P. Robertson,
D. C. Coleman, C. S. Bledsoe, and P. Sollins, Eds., Standard soil methods for long-term ecological research. New
York: Oxford University Press, p. 272.
Gudimov, A. V. (2002). Zooremediation, a new biotechnology solution for shoreline protection and cleanup,
presented at the Environment Canada Arctic and Marine Oil Spill Program Technical Seminar (AMOP) Proceedings,
Ottawa, Canada.
Gueymard, C. A. (2003). SMARTS: Simple Model of the Atmospheric Radiative Transfer of Sunshine. Solar
Consulting Services.
Von Gunten, U., and Hoigne, J. (1994). Bromate Formation during Ozonization of Bromide-Containing Waters.
Environ. Sci. Technol. 28, 1234.
Gutknecht, J. L. M., Goodman, R. M., and Balser, T. C. (2006). Linking soil process and microbial ecology in
freshwater wetland ecosystems. Plant Soil 289, 17.
Haag, W. R., and Hoigné, J. (1986). Singlet oxygen in surface waters. 3. Photochemical formation and steady-state
concentrations in various types of waters. Env. Sci Technol 20, 341.
Hahn, M. W., and Höfle, M. G. (2001). Grazing of protozoa and its effect on populations of aquatic bacteria. FEMS
Microbiol. Ecol. 35, 113.
Haines, K. C. (1979). The use of Corbicula as a clarifying agent in experimental tertiary sewage treatment process
on St. Croix, US Virgin Islands, presented at the Proc. 1st International Corbicula symposium, Texas Christian Univ.
Res. Found.
Hamady, M., Walker, J. J., Harris, J. K., Gold, N. J., and Knight, R. (2008). Error-correcting barcoded primers for
pyrosequencing hundreds of samples in multiplex. Nat. Methods 5, 235.
Hamilton, P. B., Poulin, M., Chariest, D. F., and Angell, M. (1992). Americanarum Diatomarum Exsiccata. Diatom
Res. 7, 25.
Hammer, D. A., and Knight, R. L. (1994). Designing constructed wetlands for nitrogen removal. Water Sci. Technol.
29, 15.

134
Harhangi, H. R., Roy, M. L., Alen, T. Van, Hu, B., Groen, J., Kartal, B., Tringe, S. G., Quan, Z.-X., Jetten, M. S. M.,
and Camp, H. J. M. O. Den. (2012). Hydrazine synthase, a unique phylomarker with which to study the presence and
biodiversity of anammox bacteria. Appl. Environ. Microbiol. 78, 752.
Harris, D., Horwáth, W. R., and Van Kessel, C. (2001). Acid fumigation of soils to remove carbonates prior to total
organic carbon or carbon-13 isotopic analysis. Soil Sci. Soc. Am. J. 65, 1853.
Harvey, J. W., Saiers, J. W., and Newlin, J. T. (2005). Solute transport and storage mechanisms in wetlands of the
Everglades, south Florida. Water Resour. Res. 41.
Haven, D. S., and Morales-Alamo, R. (1966). Aspects of biodeposition by oysters and other invertebrate filter feeders.
Limnol Ocean. 11, 487.
Heberer, T. (2002). Occurrence, fate, and removal of pharmaceutical residues in the aquatic environment. Toxicol.
Lett. 131, 5.
Heberer, T., B., B., Schmidt-Baumler, K., Tsipi, D., V., and Hiskia, A. (2001). Occurrence of Pharmaceutical
Residues in Sewage, River, Ground, and Drinking Water in Greece and Berlin (Germany). Pharmaceuticals and Care
Products in the Environment. American Chemical Society, p. 70.
Hecky, R., Campbell, P., and Hendzel, L. (1993). The stoichiometry of carbon, nitrogen, and phosphorus in particulate
matter of lakes and oceans. Limnol. Oceanogr. 38, 709.
Helbling, D. E., Hollender, J., Kohler, H.-P. E., Singer, H., and Fenner, K. (2010). High-throughput identification of
microbial transformation products of organic micropollutants. Environ. Sci. Technol. 44, 6621.
Helbling, D. E., Johnson, D. R., Honti, M., and Fenner, K. (2012). Micropollutant biotransformation kinetics associate
with WWTP process parameters and microbial community characteristics. Environ. Sci. Technol. 46, 10579.
Henry, S., Baudoin, E., López-Gutiérrez, J. C., Martin-Laurent, F., Brauman, A., and Philippot, L. (2004).
Quantification of denitrifying bacteria in soils by nirK gene targeted real-time PCR. J. Microbiol. Methods 59, 327.
Hernandez, M. E., and Mitsch, W. J. (2007). Denitrification in created riverine wetlands. Ecol. Eng. 30, 78.
Hernando, M. D., Mezcua, M., Fernández-Alba, A. R., and Barceló, D. (2006). Environmental risk assessment of
pharmaceutical residues in wastewater effluents, surface waters and sediments. Talanta 69, 334.
Herskowitz, J. (1986). Town of Listowel Artificial Marsh Project. Toronto: Ontario Ministry of the Environment.
Hijosa-Valsero, M., Matamoros, V., Martín-Villacorta, J., Bécares, E., and Bayona, J. M. (2010a). Assessment of
full-scale natural systems for the removal of PPCPs from wastewater in small communities. Water Res. 44, 1429.
Hijosa-Valsero, M., Matamoros, V., Pedescoll, A., Martín-Villacorta, J., Bécares, E., García, J., and Bayona, J. M.
(2011). Evaluation of primary treatment and loading regimes in the removal of pharmaceuticals and personal care
products from urban wastewaters by subsurface-flow constructed wetlands. Int. J. Environ. Anal. Chem. 91, 632.
Hijosa-Valsero, M., Matamoros, V., Sidrach-Cardona, R., Martín-Villacorta, J., Bécares, E., and Bayona, J. M.
(2010b). Comprehensive assessment of the design configuration of constructed wetlands for the removal of
pharmaceuticals and personal care products from urban wastewaters. Water Res. 44, 3669.
Hill, B. H., Elonen, C. M., Jicha, T. M., Cotter, A. M., Trebitz, A. S., and Danz, N. P. (2006). Sediment microbial
enzyme activity as an indicator of nutrient limitation in Great Lakes coastal wetlands. Freshw. Biol. 51, 1670.
Hill, V. R., and Sobsey, M. D. (2001). Removal of Salmonella and microbial indicators in constructed wetlands
treating swine wastewater. Water Sci. Technol. 44, 215.

135
Hirsch, R., Ternes, T. A., Haberer, K., and Kratz, K. (1996). Determination of betablockers and B-sympathomimetrics
in the aquatic environment. Vom Wasser 87, 263.
Hollender, J., Zimmermann, S. G., Koepke, S., Krauss, M., McArdell, C. S., Ort, C., Singer, H., Von Gunten, U., and
Siegrist, H. (2009). Elimination of organic micropollutants in a municipal wastewater treatment plant upgraded with
a full-scale post-ozonation followed by sand filtration. Environ. Sci. Technol. 43, 7862.
Horne, A. (2000). Phytoremediation by constructed wetlands. In N. Terry and G. Bañuelos, Eds., Phytoremediation
of Contaminated Soil and Water. Boca Raton, Fl: CRC Press,.
Horne, A. J. (1995). Nitrogen removal from waste treatment pond or activated sludge plant effluents with free-surface
wetlands. Water Sci. Technol. 31, 341.
Horne, A. J., and Fleming-Singer, M. S. (2005). Phytoremediation using constructed treatment wetlands: An
overview. In M. Fingerman and R. Nagabhushanam, Eds., Bioremediation of Aquatic and Terrestrial Ecosystems.
Enfield, NH: Science Publishers, p. 329.
Howell, C. J., Crohn, D. M., and Omary, M. (2005). Simulating nutrient cycling and removal through treatment
wetlands in arid/semiarid environments. Ecol. Eng. 25, 25.
Huang, J., and Mabury, S. A. (2000a). Steady-state concentrations of carbonate radicals in field waters. Environ.
Toxicol. Chem. 19, 2181.
Huang, J., and Mabury, S. A. (2000b). A new method for measuring carbonate radical reactivity toward pesticides.
Environ. Toxicol. Chem. 19, 1501.
Huang, J., and Mabury, S. A. (2000c). The role of carbonate radical in limiting the persistence of sulfur-containing
chemicals in sunlit natural waters. Chemosphere 41, 1775.
Huber, M. M., Canonica, S., Park, G.-Y., and Von Gunten, U. (2003). Oxidation of pharmaceuticals during ozonation
and advanced oxidation processes. Env. Sci Technol 37, 1016.
Huggett, D. ., Khan, I. ., Foran, C. ., and Schlenk, D. (2003). Determination of beta-adrenergic receptor blocking
pharmaceuticals in United States wastewater effluent. Environ. Pollut. 121, 199.
Huggett, D. B., Brooks, B. W., Peterson, B., Foran, C. M., and Schlenk, D. (2002). Toxicity of select beta adrenergic
receptor-blocking pharmaceuticals (β-blockers) on aquatic organisms. Arch. Environ. Contam. Toxicol. 43, 229.
Hull, M. S., Chaurand, P., Rose, J., Auffan, M., Bottero, J.-Y., Jones, J. C., Schultz, I. R., and Vikesland, P. J. (2011).
Filter-feeding bivalves store and biodeposit colloidally stable gold nanoparticles. Environ. Sci. Technol. 45, 6592.
Hussain, S., and Prasher, S. (2011). Understanding the sorption of ionophoric pharmaceuticals in a treatment wetland.
Wetlands 31, 563.
Ibekwe, A. M., Lyon, S. R., Leddy, M., and Jacobson-Meyers, M. (2006). Impact of plant density and microbial
composition on water quality from a free water surface constructed wetland. J. Appl. Microbiol. 102, 921.
Imfeld, G., Braeckevelt, M., Kuschk, P., and Richnow, H. H. (2009). Monitoring and assessing processes of organic
chemicals removal in constructed wetlands. Chemosphere 74, 349.
Ishida, C. K., Arnon, S., Peterson, C. G., Kelly, J. J., and Gray, K. A. (2008). Influence of algal community structure
on denitrification rates in periphyton cultivated on artificial substrata. Microb. Ecol. 56, 140.
Ishii, S., Yan, T., Vu, H., Hansen, D. L., Hicks, R. E., and Sadowsky, M. J. (2010). Factors controlling long-term
survival and growth of naturalized Escherichia coli populations in temperate field soils. Microbes Environ. 25, 8.

136
Jagger, J. (1985). Solar-UV actions on living cells. New York, NY: Praeger.
Jasper, J. T., Jones, Z. L., Sharp, J. O., and Sedlak, D. L. (2014a). Biotransformation of wastewater-derived trace
organic contaminants in open-water unit process treatment wetlands. Environ. Sci. Technol. 48, 5136.
Jasper, J. T., Jones, Z. L., Sharp, J. O., and Sedlak, D. L. (2014b). Nitrate removal in shallow, open-water treatment
wetlands. Environ. Sci. Technol. Submitted.
Jasper, J. T., Nguyen, M. T., Jones, Z. L., Ismail, N. S., Sedlak, D. L., Sharp, J. O., Luthy, R. G., Horne, A. J., and
Nelson, K. L. (2013). Unit process wetlands for removal of trace organic contaminants and pathogens from municipal
wastewater effluents. Environ. Eng. Sci. 30, 421.
Jasper, J. T., and Sedlak, D. L. (2013). Phototransformation of wastewater-derived trace organic contaminants in
open-water unit process treatment wetlands. Environ. Sci. Technol. 47, 10781.
Jetten, M. S. M., Cirpus, I., Kartal, B., Van Niftrik, L., Van de Pas-Schoonen, K. T., Sliekers, O., Haaijer, S., Van der
Star, W., Schmid, M., Van de Vossenberg, J., Schmidt, I., Harhangi, H., Van Loosdrecht, M., Gijs Kuenen, J., Op den
Camp, H., and Strous, M. (2005). 1994-2004. Biochem. Soc. Trans. 33, 119.
Jiang, C., Li, S.-X., Luo, F.-F., Jin, K., Wang, Q., Hao, Z.-Y., Wu, L.-L., Zhao, G.-C., Ma, G.-F., Shen, P.-H., Tang,
X.-L., and Wu, B. (2011). Biochemical characterization of two novel β-glucosidase genes by metagenome expression
cloning. Bioresour. Technol. 102, 3272.
Jones, C. M., and Hallin, S. (2010). Ecological and evolutionary factors underlying global and local assembly of
denitrifier communities. ISME J. 4, 633.
Jones, O. A. H., Green, P. G., Voulvoulis, N., and Lester, J. N. (2007). Questioning the excessive use of advanced
treatment to remove organic micropollutants from wastewater. Env. Sci Technol 41, 5085.
Jones, O. A. H., Voulvoulis, N., and Lester, J. N. (2002). Aquatic environmental assessment of the top 25 English
prescription pharmaceuticals. Water Res. 36, 5013.
Joss, A., Carballa, M., Kreuzinger, N., Siegrist, H., and Zabczynski, S. (2006). Chapter 6-Wastewater treatment. In
T. A. Ternes and A. Joss, Eds., Human Pharmaceuticals, Hormones And Fragrances: The Challenge of
Micropollutants in Urban Water Management. London: IWA Publishing, p. 243.
Kadlec, R. H. (1994). Detention and mixing in free water wetlands. Ecol. Eng. 3, 345.
Kadlec, R. H. (2000). The inadequacy of first-order treatment wetland models. Ecol. Eng. 15, 105.
Kadlec, R. H. (2009). Comparison of free water and horizontal subsurface treatment wetlands. Ecol. Eng. 35, 159.
Kadlec, R. H. (2012). Constructed marshes for nitrate removal. Crit. Rev. Environ. Sci. Technol. 42, 934.
Kadlec, R. H., Bays, J. S., Mokry, L. E., Andrews, D., and Ernst, M. R. (2011). Performance analysis of the Richland-
Chambers treatment wetlands. Ecol. Eng. 37, 176.
Kadlec, R. H., and Wallace, S. (2009). Treatment Wetlands, 2nd edition. Boca Raton: CRC Press.
Karpiscak, M. M., Sanchez, L. R., Freitas, R. J., and Gerba, C. P. (2001). Removal of bacterial indicators and
pathogens from dairy wastewater by a multi-component treatment system. Water Sci. Technol. 44, 813.
Kasanavia, T., Vu, D., and Sabatini, D. A. (1999). Fluorescent dye and media properties affecting sorption and tracer
selection. Ground Water 37, 376.

137
Kasprzyk-Hordern, B., Dinsdale, R. M., and Guwy, A. J. (2008). The occurrence of pharmaceuticals, personal care
products, endocrine disruptors and illicit drugs in surface water in South Wales, UK. Water Res. 42, 3498.
Keefe, S. H., Barber, L. B., Runkel, R. L., Ryan, J. N., McKnight, D. M., and Wass, R. D. (2004). Conservative and
reactive solute transport in constructed wetlands. Water Resour. Res. 40, W01201.
Kern, S., Baumgartner, R., Helbling, D. E., Hollender, J., Singer, H., Loos, M. J., Schwarzenbach, R. P., and Fenner,
K. (2010). A tiered procedure for assessing the formation of biotransformation products of pharmaceuticals and
biocides during activated sludge treatment. J. Environ. Monit. 12, 2100.
Khan, S., and Ongerth, J. (2002). Estimation of pharmaceutical residues in primary and secondary sewage sludge
based on quantities of use and fugacity modelling. Water Sci. Technol. 46, 105.
Khunjar, W. O., Mackintosh, S. A., Skotnicka-Pitak, J., Baik, S., Aga, D. S., and Love, N. G. (2011). Elucidating the
relative roles of ammonia oxidizing and heterotrophic bacteria during the biotransformation of 17α-ethinylestradiol
and trimethoprim. Environ. Sci. Technol. 45, 3605.
Kim, S. D., Cho, J., Kim, I. S., Vanderford, B. J., and Snyder, S. A. (2007). Occurrence and removal of
pharmaceuticals and endocrine disruptors in South Korean surface, drinking, and waste waters. Water Res. 41, 1013.
Kjellin, J., Worman, A., Johansson, H., and Lindahl, A. (2007). Controlling factors for water residence time and flow
patterns in Ekeby treatment wetland, Sweden. Adv. Water Resour. 30, 838.
Knight, R. L. (1987). Effuent distribution and basin design for enhanced pollutant assimilation by freshwater
wetlands. In K. R. Reddy and W. H. Smith, Eds., Aquatic plants for water treatment and resource recovery. Orland,
FL, USA: Magnolia Publishing Company, p. 913.
Knight, R. L., Kadlec, R. H., and Ohlendorf, H. M. (1999). The use of treatment wetlands for petroleum industry
effluents. Environ. Sci. Technol. 33, 973.
Kohn, T., and Nelson, K. L. (2007). Sunlight-mediated inactivation of MS2 coliphage via exogenous singlet oxygen
produced by sensitizers in natural waters. Environ. Sci. Technol. 41, 192.
Kolpin, D. W., Furlong, E. T., Meyer, M. T., Thurman, E. M., Zaugg, S. D., Barber, L. B., and Buxton, H. T. (2002).
Pharmaceuticals, hormones, and other organic wastewater contaminants in U.S. streams, 1999−2000: A national
reconnaissance. Env. Sci Technol 36, 1202.
Kruger, E. L., Coats, J. R., and Zhu, B. E. (1996). Relative mobilities of atrazine, five atrazine degradates, metolachlor,
and simazine in soils of Iowa. Environ. Toxicol. Chem. 15, 691.
Kryger, J., and Riisgård, H. U. (1988). Filtration rate capacities in 6 species of European freshwater bivalves.
Oecologia 77, 34.
Ksoll, W. B., Ishii, S., Sadowsky, M. J., and Hicks, R. E. (2007). Presence and sources of fecal coliform bacteria in
epilithic periphyton communities of Lake Superior. Appl. Environ. Microbiol. 73, 3771.
Kunkel, U., and Radke, M. (2011). Reactive tracer test to evaluate the fate of pharmaceuticals in rivers. Env. Sci
Technol 45, 6296.
Kyambadde, J., Kansiime, F., Gumaelius, L., and Dalhammar, G. (2004). A comparative study of Cyperus papyrus
and Miscanthidium violaceum-based constructed wetlands for wastewater treatment in a tropical climate. Water Res.
38, 475.
De Laat, J., Maouala-Makata, P., and Dore, M. (1996). Rate constants for reactions of ozone and hydroxyl radicals
with several phenyl-ureas and acetamides. Environ. Technol. 17, 707.

138
Lam, M. W., and Mabury, S. A. (2005). Photodegradation of the pharmaceuticals atorvastatin, carbamazepine,
levofloxacin, and sulfamethoxazole in natural waters. Aquat. Sci. 67, 177.
Lam, M. W., Tantuco, K., and Mabury, S. A. (2003). PhotoFate: A new approach in accounting for the contribution
of indirect photolysis of pesticides and pharmaceuticals in surface waters. Env. Sci Technol 37, 899.
Larson, R. A., and Zepp, R. G. (1988). Reactivity of the carbonate radical with aniline derivatives. Environ. Toxicol.
Chem. 7, 265.
Latch, D. E., Packer, J. L., Arnold, W. A., and McNeill, K. (2003a). Photochemical conversion of triclosan to 2,8-
dichlorodibenzo-p-dioxin in aqueous solution. J. Photochem. Photobiol. Chem. 158, 63.
Latch, D. E., Stender, B. L., Packer, J. L., Arnold, W. A., and McNeill, K. (2003b). Photochemical fate of
pharmaceuticals in the environment: Cimetidine and ranitidine. Env. Sci Technol 37, 3342.
Lee, C., Choi, W., and Yoon, J. (2005). UV Photolytic Mechanism of N-Nitrosodimethylamine in Water. Env. Sci
Technol 39, 9702.
Leech, D. M., Snyder, M. T., and Wetzel, R. G. (2009). Natural organic matter and sunlight accelerate the degradation
of 17ß-estradiol in water. Sci. Total Environ. 407, 2087.
Li, F., Yuasa, A., Obara, A., and Mathews, A. P. (2005). Aerobic batch degradation of 17-β estradiol (E2) by activated
sludge. Water Res. 39, 2065.
Li, X.-N., Song, H.-L., Li, W., Lu, X.-W., and Nishimura, O. (2010). An integrated ecological floating-bed employing
plant, freshwater clam and biofilm carrier for purification of eutrophic water. Ecol. Eng. 36, 382.
Li, Y., Zhu, G., Ng, W. J., and Tan, S. K. (2014). A review on removing pharmaceutical contaminants from
wastewater by constructed wetlands. Sci. Total Environ. 468–469, 908.
Lightbody, A. F., Avener, M. E., and Nepf, H. M. (2008). Observations of short-circuiting flow paths within a free-
surface wetland in Augusta, Georgia, USA. Limnol. Oceanogr. 53, 1040.
Lightbody, A. F., Nepf, H. M., and Bays, J. S. (2007). Mixing in deep zones within constructed treatment wetlands.
Ecol. Eng. 29, 209.
Lightbody, A. F., Nepf, H. M., and Bays, J. S. (2009). Modeling the hydraulic effect of transverse deep zones on the
performance of short-circuiting constructed treatment wetlands. Ecol. Eng. 35, 754.
Ligi, T., Truu, M., Truu, J., Nõlvak, H., Kaasik, A., Mitsch, W. J., and Mander, Ü. (n.d.). Effects of soil chemical
characteristics and water regime on denitrification genes (nirS, nirK, and nosZ) abundances in a created riverine
wetland complex. Ecol. Eng.
Lim, M.-H., Snyder, S. A., and Sedlak, D. L. (2008). Use of biodegradable dissolved organic carbon (BDOC) to
assess the potential for transformation of wastewater-derived contaminants in surface waters. Water Res. 42, 2943.
Lin, A. Y.-C., Debroux, J.-F., Cunningham, J. A., and Reinhard, M. (2003). Comparison of rhodamine WT and
bromide in the determination of hydraulic characteristics of constructed wetlands. Ecol. Eng. 20, 75.
Lin, A. Y.-C., Plumlee, M. H., and Reinhard, M. (2006). Natural attenuation of pharmaceuticals and alkylphenol
polyethoxylate metabolites during river transport: Photochemical and biological transformation. Environ. Toxicol.
Chem. 25, 1458.
Lin, A. Y.-C., and Reinhard, M. (2005). Photodegradation of common environmental pharmaceuticals and estrogens
in river water. Environ. Toxicol. Chem. 24, 1303.

139
Lin, W.-C., Chen, H.-C., and Ding, W.-H. (2005). Determination of pharmaceutical residues in waters by solid-phase
extraction and large-volume on-line derivatization with gas chromatography–mass spectrometry. J. Chromatogr. A
1065, 279.
Llorens, E., Matamoros, V., Domingo, V., Bayona, J. M., and García, J. (2009). Water quality improvement in a full-
scale tertiary constructed wetland: Effects on conventional and specific organic contaminants. Sci. Total Environ.
407, 2517.
Loraine, G. A., and Pettigrove, M. E. (2005). Seasonal variations in concentrations of pharmaceuticals and personal
care products in drinking water and reclaimed wastewater in Southern California. Environ. Sci. Technol. 40, 687.
Lu, J., Huang, Q., and Mao, L. (2009). Removal of acetaminophen using enzyme-mediated oxidative coupling
processes: I. Reaction rates and pathways. Environ. Sci. Technol. 43, 7062.
MacIntyre, M. E., Warner, B. G., and Slawson, R. M. (2006). Escherichia coli control in a surface flow treatment
wetland. J. Water Health 4, 211.
Malaviya, P., and Singh, A. (2012). Constructed wetlands for management of urban stormwater runoff. Crit. Rev.
Environ. Sci. Technol. 42, 2153.
Mandi, L., Bouhoum, K., and Ouazzani, N. (1998). Application of constructed wetlands for domestic wastewater
treatment in an arid climate. Water Sci. Technol. 38, 379.
Mandi, L., Houhoum, B., Asmama, S., and Schwartzbrod, J. (1996). Wastewater treatment by reed beds. Water Res.
30, 2009.
Martinez, C. J., and Wise, W. R. (2003). Hydraulic analysis of Orlando Easterly wetland. J. Environ. Eng. 129, 553.
Matamoros, V., Arias, C., Brix, H., and Bayona, J. M. (2007). Removal of Pharmaceuticals and Personal Care
Products (PPCPs) from urban wastewater in a pilot vertical flow constructed wetland and a sand filter. Env. Sci
Technol 41, 8171.
Matamoros, V., Arias, C., Brix, H., and Bayona, J. M. (2009). Preliminary screening of small-scale domestic
wastewater treatment systems for removal of pharmaceutical and personal care products. Water Res. 43, 55.
Matamoros, V., and Bayona, J. M. (2006). Elimination of Pharmaceuticals and Personal Care Products in Subsurface
Flow Constructed Wetlands. Env. Sci Technol 40, 5811.
Matamoros, V., and Bayona, J. M. (2008). Behavior of emerging pollutants in constructed wetlands. In D. Barceló
and M. Petrovic, Eds., Emerging Contaminants from Industrial and Municipal Waste. Springer Berlin/Heidelberg, p.
199.
Matamoros, V., Caselles-Osorio, A., García, J., and Bayona, J. M. (2008a). Behaviour of pharmaceutical products
and biodegradation intermediates in horizontal subsurface flow constructed wetland. A microcosm experiment. Sci.
Total Environ. 394, 171.
Matamoros, V., García, J., and Bayona, J. M. (2005). Behavior of selected pharmaceuticals in subsurface flow
constructed wetlands: A pilot-scale study. Env. Sci Technol 39, 5449.
Matamoros, V., García, J., and Bayona, J. M. (2008b). Organic micropollutant removal in a full-scale surface flow
constructed wetland fed with secondary effluent. Water Res. 42, 653.
McAvoy, D. C., Schatowitz, B., Jacob, M., Hauk, A., and Eckhoff, W. S. (2002). Measurement of triclosan in
wastewater treatment systems. Environ. Toxicol. Chem. 21, 1323.

140
McIvor, A. L. (2004). Freshwater mussels as biofilters. Doctoral. United Kingdom: Pembroke College.
Meltz Steinberg, K., and Levin, B. R. (2007). Grazing protozoa and the evolution of the Escherichia coli O157. Proc.
R. Soc. B Biol. Sci. 274, 1921.
Mendelssohn, I. A., Kleiss, B. A., and Wakeley, J. S. (1995). Factors controlling the formation of oxidized root
channels. Wetlands 15, 37.
Metar. (2013). Weather history for Livermore, CA.
Metcalf & Eddy. (2003). Wastewater Engineering: Treatment and Reuse, 4th edition. Crawfordsville, IN: McGraw-
Hill.
Metcalfe, C. D., Miao, X.-S., Koenig, B. G., and Struger, J. (2003). Distribution of acidic and neutral drugs in surface
waters near sewage treatment plants in the lower Great Lakes, Canada. Environ. Toxicol. Chem. 22, 2881.
Miller, P. L., and Chin, Y.-P. (2002). Photoinduced degradation of carbaryl in a wetland surface water. J Agric Food
Chem 50, 6758.
Miller, P. L., and Chin, Y.-P. (2005). Indirect photolysis promoted by natural and engineered wetland water
constituents: Processes leading to alachlor degradation. Env. Sci Technol 39, 4454.
Mitch, W. A., Sharp, J. O., Trussell, R. R., Valentine, R. L., Alvarez-Cohen, L., and Sedlak, D. L. (2003). N-
nitrosodimethylamine (NDMA) as a drinking water contaminant: A review. Environ. Eng. Sci. 20, 389.
Mitsch, W. J., and Gosselink, J. G. (2007). Wetlands, 4th edition. New York: John Wiley & Sons, Inc.
Møhlenberg, F., and Riisgård, H. U. (1979). Filtration rate, using a new indirect technique, in thirteen species of
suspension-feeding bivalves. Mar. Biol. 54, 143.
Moore, M. T., Rodgers Jr., J. H., Cooper, C. M., and Smith Jr., S. (2000). Constructed wetlands for mitigation of
atrazine-associated agricultural runoff. Environ. Pollut. 110, 393.
Moore, M. T., Schulz, R., Cooper, C. M., Smith Jr., S., and Rodgers Jr., J. H. (2002). Mitigation of chlorpyrifos runoff
using constructed wetlands. Chemosphere 46, 827.
Münch, C., Neu, T., Kuschk, P., and Röske, I. (2007). The root surface as the definitive detail for microbial
transformation processes in constructed wetlands--a biofilm characteristic. Water Sci. Technol. 56, 271.
Nałęcz-Jawecki, G., Wójcik, T., and Sawicki, J. (2008). Evaluation of in vitro biotransformation of propranolol with
HPLC, MS/MS, and two bioassays. Environ. Toxicol. 23, 52.
Nappier, S. P., Graczyk, T. K., and Schwab, K. J. (2008). Bioaccumulation, retention, and depuration of enteric
viruses by Crassostrea virginica and Crassostrea ariakensis oysters. Appl. Environ. Microbiol. 74, 6825.
National Research Council. (2012). Water Reuse. Washington, D.C.: The National Academies Press.
Nelson, E. D., Do, H., Lewis, R. S., and Carr, S. A. (2011). Diurnal variability of pharmaceutical, personal care
product, estrogen and alkylphenol concentrations in effluent from a tertiary wastewater treatment facility. Environ.
Sci. Technol. 45, 1228.
Neta, P., Huie, R. E., and Ross, A. B. (1988). Rate constants for reactions of inorganic radicals in aqueous solution.
J. Phys. Chem. Ref. Data 17, 1027.

141
Nguyen, M. T., Jasper, J. T., and Nelson, K. L. (2014). Photoinactivation of bacterial indicator organisms in open-
water treatment wetlands In preparation.
Nikolaou, A., Meric, S., and Fatta, D. (2007). Occurrence patterns of pharmaceuticals in water and wastewater
environments. Anal. Bioanal. Chem. 387, 1225.
NOAA. (2011). Ribbed mussels offer possible natural way to improve urban water quality.
O’Rourke, S., Drouillard, K. G., and Haffner, G. D. (2004). Determination of laboratory and field elimination rates
of polychlorinated biphenyls (PCBs) in the freshwater mussel, Elliptio complanata. Arch. Environ. Contam. Toxicol.
47, 74.
Odum, H. T. (1956). Primary production in flowing waters. Limnol. Oceanogr. 1, 102.
Orange County Water District. (2008). Prado Wetlands.
Oulton, R. L., Kohn, T., and Cwiertny, D. M. (2010). Pharmaceuticals and personal care products in effluent matrices.
J. Environ. Monit. 12, 1956.
Packer, J. L., Werner, J. J., Latch, D. E., McNeill, K., and Arnold, W. A. (2003). Photochemical fate of
pharmaceuticals in the environment: Naproxen, diclofenac, clofibric acid, and ibuprofen. Aquat. Sci. 65, 342.
Park, N., Vanderford, B. J., Snyder, S. A., Sarp, S., Kim, S. D., and Cho, J. (2009). Effective controls of
micropollutants included in wastewater effluent using constructed wetlands under anoxic condition. Ecol. Eng. 35,
418.
Patrauchan, M. A., Miyazawa, D., LeBlanc, J. C., Aiga, C., Florizone, C., Dosanjh, M., Davies, J., Eltis, L. D., and
Mohn, W. W. (2012). Proteomic analysis of survival of Rhodococcus jostii RHA1 during carbon starvation. Appl.
Environ. Microbiol. 78, 6714.
Patton, C. J., and Kryskalla, J. R. (2003). Evaluation of alkaline persulfate digestion as an alternative to Kjeldahl
digestion for determination of total and dissolved nitrogen and phosphorus in water. Water-Resources Investigations
Report. U.S. Geological Survey.
Pearson, W. R., Wood, T., Zhang, Z., and Miller, W. (1997). Comparison of DNA sequences with protein sequences.
Genomics 46, 24.
Pérez, S., Eichhorn, P., and Aga, D. S. (2005). Evaluating the biodegradability of sulfamethazine, sulfamethoxazole,
sulfathiazole, and trimethoprim at different stages of sewage treatment. Environ. Toxicol. Chem. 24, 1361.
Persson, J. (2000). The hydraulic performance of ponds of various layouts. Urban Water 2, 243.
Peven, C. S., Uhler, A. D., and Querzoli, F. J. (1996). Caged mussels and semipermeable membrane devices as
indicators of organic contaminant uptake in dorchester and duxbury bays. Environ. Toxicol. Chem. 15, 144.
Pinney, M. L., Westerhoff, P. K., and Baker, L. (2000). Transformations in dissolved organic carbon through
constructed wetlands. Water Res. 34, 1897.
Plósz, B. G., Leknes, H., and Thomas, K. V. (2010). Impacts of competitive inhibition, parent compound formation
and partitioning behavior on the removal of antibiotics in municipal wastewater treatment. Environ. Sci. Technol. 44,
734.
Pocernich, M., and Litke, D. W. (1997). Nutrient concentrations in wastewater treatment plant effluents, South Platte
River basin. J. Am. Water Resour. Assoc. 33, 205.

142
Pollard, P. C. (2010). Bacterial activity in plant (Schoenoplectus validus) biofilms of constructed wetlands. Water
Res. 44, 5939.
Pontius, F. W. (1993). Legislation/Regulation -- Nitrate and Cancer. J. Am. Water Works Assoc. 85.
Porter, A. J. (2011). Microbial community function in freshwater wetland soils: Using extracellular enzyme analysis
to study the effect of moisture and vegetation. Masters. Richmond, Virginia: Virginia Commonwealth University.
Proakis, E. (2003). Pathogen removal in constructed wetlands focusing on biological predation and marine
recreational water quality. Proc. Water Environ. Fed. 31-40, 310.
Prochaska, C. A., and Zouboulis, A. I. (2006). Removal of phosphates by pilot vertical-flow constructed wetlands
using a mixture of sand and dolomite as substrate. Ecol. Eng. 26, 293.
Pruell, R. J., Lake, J. L., Davis, W. R., and Quinn, J. G. (1986). Uptake and depuration of organic contaminants by
blue mussels (Mytilus edulis) exposed to environmentally contaminated sediment. Mar. Biol. 91, 497.
Purdom, C. E., Hardiman, P. A., Bye, V. V. J., Eno, N. C., Tyler, C. R., and Sumpter, J. P. (1994). Estrogenic effects
of effluents from sewage treatment works. Chem. Ecol. 8, 275.
Quiñónez-Díaz, M. J., Karpiscak, M. M., Ellman, E. D., and Gerba, C. P. (2001). Removal of pathogenic and indicator
microorganisms by a constructed wetland receiving untreated domestic wastewater. J. Environ. Sci. Health Part A
Tox. Hazard. Subst. Environ. Eng. 36, 1311.
Radjenović, J., Pérez, S., Petrović, M., and Barceló, D. (2008). Identification and structural characterization of
biodegradation products of atenolol and glibenclamide by liquid chromatography coupled to hybrid quadrupole time-
of-flight and quadrupole ion trap mass spectrometry. J. Chromatogr. A 1210, 142.
Radjenović, J., Petrović, M., and Barceló, D. (2009). Fate and distribution of pharmaceuticals in wastewater and
sewage sludge of the conventional activated sludge (CAS) and advanced membrane bioreactor (MBR) treatment.
Water Res. 43, 831.
Radke, M., Lauwigi, C., Heinkele, G., Mürdter, T. E., and Letzel, M. (2009). Fate of the antibiotic sulfamethoxazole
and its two major human metabolites in a water sediment test. Environ. Sci. Technol. 43, 3135.
Rahaman, M. S., Mavinic, D. S., Bhuiyan, M. I. H., and Koch, F. A. (2006). Exploring the determination of struvite
solubility product from analytical results. Environ. Technol. 27, 951.
Ramil, M., El Aref, T., Fink, G., Scheurer, M., and Ternes, T. A. (2009). Fate of beta blockers in aquatic-sediment
systems: Sorption and biotransformation. Env. Sci Technol 44, 962.
Reddy, K. R., and D’Angelo, E. M. (1997). Biogeochemical indicators to evaluate pollutant removal efficiency in
constructed wetlands. Water Sci. Technol. 35, 1.
Redfield, A. C. (1934). On the proportions of organic derivatives in sea water and their relation to the composition
of plankton. University Press of Liverpool.
Redfield, A. C., Ketchum, B. H., and Richards, F. A. (1963). The influence of organisms on the composition of
seawater. In M. N. Hill, Ed., The Sea Volume 2. New York: Inter Science Publishers, p. 26.
Reed, S. H., Crites, R. W., and Middlebrooks, E. J. (1995). Natural systems for waste management and treatment,
2nd edition. New York: McGraw-Hill.
Reichenberger, S., Bach, M., Skitschak, A., and Frede, H.-G. (2007). Mitigation strategies to reduce pesticide inputs
into ground- and surface water and their effectiveness; A review. Sci. Total Environ. 384, 1.

143
Reinhold, D. M., Vishwanathan, S., Park, J. J., Oh, D., and Michael Saunders, F. (2010). Assessment of plant-driven
removal of emerging organic pollutants by duckweed. Chemosphere 80, 687.
Reinoso, R., Torres, L. A., and Bécares, E. (2008). Efficiency of natural systems for removal of bacteria and
pathogenic parasites from wastewater. Sci. Total Environ. 395, 80.
Remucal, C. K. (2014). The role of indirect photochemical degradation in the environmental fate of pesticides: A
review. Environ. Sci. Process. Impacts.
Reyes-Contreras, C., Matamoros, V., Ruiz, I., Soto, M., and Bayona, J. M. (2011). Evaluation of PPCPs removal in
a combined anaerobic digester-constructed wetland pilot plant treating urban wastewater. Chemosphere 84, 1200.
Rier, S. T., Kuehn, K. A., and Francoeur, S. N. (2007). Algal regulation of extracellular enzyme activity in stream
microbial communities associated with inert substrata and detritus. J. North Am. Benthol. Soc. 26, 439.
Riisgård, H. U. (2001). On measurement of filtration rates in bivalves--the stony road to reliable data: Review and
interpretation. Mar. Ecol. Prog. Ser. 211, 275.
Risgaard-Petersen, N., Rysgaard, S., Nielsen, L. P., and Revsbech, N. P. (1994). Diurnal variation of denitrification
and nitrification in sediments colonized by benthic microphytes. Limnol. Oceanogr. 39, 573.
Roberts, P. H., and Thomas, K. V. (2006). The occurrence of selected pharmaceuticals in wastewater effluent and
surface waters of the lower Tyne catchment. Sci. Total Environ. 356, 143.
Romani, A. M., Guasch, H., Muñoz, I., Ruana, J., Vilalta, E., Schwartz, T., Emtiazi, F., and Sabater, S. (2004). Biofilm
structure and function and possible implications for riverine DOC dynamics. Microb. Ecol. 47, 316.
Rosario-Ortiz, F. L., Mezyk, S. P., Doud, D. F. R., and Snyder, S. A. (2008). Quantitative correlation of absolute
hydroxyl radical rate constants with non-isolated effluent organic matter bulk properties in water. Env. Sci Technol
42, 5924.
Ryan, C. C., Tan, D. T., and Arnold, W. A. (2011). Direct and indirect photolysis of sulfamethoxazole and
trimethoprim in wastewater treatment plant effluent. Water Res. 45, 1280.
Sah, R. N., and Miller, R. O. (1992). Spontaneous reaction for acid dissolution of biological tissues in closed vessels.
Anal. Chem. 64, 230.
Schnell, S., Bols, N. C., Barata, C., and Porte, C. (2009). Single and combined toxicity of pharmaceuticals and
personal care products (PPCPs) on the rainbow trout liver cell line RTL-W1. Aquat. Toxicol. 93, 244.
Schwab, B. W., Hayes, E. P., Fiori, J. M., Mastrocco, F. J., Roden, N. M., Cragin, D., Meyerhoff, R. D., D’Aco, V.
J., and Anderson, P. D. (2005). Human pharmaceuticals in US surface waters: A human health risk assessment. Regul.
Toxicol. Pharmacol. 42, 296.
Schwarzenbach, R. P., Gschwend, P. M., and Imboden, D. M. (2003). Environmental Organic Chemistry, 2nd edition.
Hoboken, NJ: Wiley.
Sedlak, D. L., and Pinkston, K. E. (2001). Factors affecting the concentrations of pharmaceuticals released to the
aquatic environment. Water Resour. Update, 55.
Sengupta, M. E., Thamsborg, S. M., Andersen, T. J., Olsen, A., and Dalsgaard, A. (2011). Sedimentation of helminth
eggs in water. Water Res. 45, 4651.
Shackle, V. J., Freeman, C., and Reynolds, B. (2000). Carbon supply and the regulation of enzyme activity in
constructed wetlands. Soil Biol. Biochem. 32, 1935.

144
Shao, M.-F., Zhang, T., and Fang, H. H.-P. (2010). Sulfur-driven autotrophic denitrification. Appl. Microbiol.
Biotechnol. 88, 1027.
Sharp, J. O., Sales, C. M., LeBlanc, J. C., Liu, J., Wood, T. K., Eltis, L. D., Mohn, W. W., and Alvarez-Cohen, L.
(2007). An inducible propane monooxygenase is responsible for N-nitrosodimethylamine degradation by
Rhodococcus sp. strain RHA1. Appl. Environ. Microbiol. 73, 6930.
Sherwood, A. R., and Presting, G. G. (2007). Universal primers amplify a 23S rDNA plastid marker in eukaryotic
algae and cyanobateria. J. Phycol. 43, 605.
Shiga, T., Fujimura, A., Tateishi, T., Ohashi, K., and Ebihara, A. (1993). Differences of chronopharmacokinetic
profiles between propranolol and atenolol in hypertensive subjects. J. Clin. Pharmacol. 33, 756.
Shilton, A., and Harrison, J. (2003). Guidelines for the hydraulic design of waste stabilisation ponds website. Massey
University, New Zealand.
Shipin, O., Koottatep, T., Khanh, N. T. T., and Polprasert, C. (2005). Integrated natural treatment systems for
developing communities. Water Sci. Technol. 51, 299.
Shpigel, M., Gasith, A., and Kimmel, E. (1997). A biomechanical filter for treating fish-pond effluents. Aquaculture
152, 103.
Silverman, A. I., Nguyen, M. T., Schilling, I., Wenk, J., and Nelson, K. L. (2014). Sunlight inactivation of viruses in
an open-water natural wastewater treatment system: Modeling endogenous and exogenous inactivation rates in the
presence of light-attenuating compounds and photosensitizers In preparation.
Silverman, H., Achberger, E. C., Lynn, J. W., and Dietz, T. H. (1995). Filtration and utilization of laboratory-cultured
bacteria by Dreissena polymorpha, Corbicula fluminea, and Carunculina texasensis. Biol. Bull. 189, 308.
Sinsabaugh, R. L. (2010). Phenol oxidase, peroxidase and organic matter dynamics of soil. Soil Biol. Biochem. 42,
391.
Sirivedhin, T., and Gray, K. A. (2006). Factors affecting denitrification rates in experimental wetlands. Ecol. Eng.
26, 167.
Sládečková, A., Marvan, P., and Vymazal, J. (1983). The utilization of periphyton in waterworks pre-treatment for
nutrient removal from enriched influents. In R. G. Wetzel, Ed., Periphyton of Freshwater Ecosystems. Springer
Netherlands, p. 299.
Snyder, S. A., Adham, S., Redding, A. M., Cannon, F. S., DeCarolis, J., Oppenheimer, J., Wert, E. C., and Yoon, Y.
(2007). Role of membranes and activated carbon in the removal of endocrine disruptors and pharmaceuticals.
Desalination 202, 156.
Snyder, S. A., Wert, E. C., Rexing, D. J., Zegers, R. E., and Drury, D. D. (2006). Ozone-Sci. Eng. Ozone Sci. Amp
Eng. 28, 445.
Snyder, S. A., Westerhoff, P., Yoon, Y., and Sedlak, D. L. (2003). Pharmaceuticals, personal care products, and
endocrine disruptors in water: Implications for the water industry. Environ. Eng. Sci. 20, 449.
Solano, M. L., Soriano, P., and Ciria, M. P. (2004). Constructed wetlands as a sustainable solution for wastewater
treatment in small villages. Biosyst. Eng. 87, 109.
Song, H.-L., Yang, X.-L., Nakano, K., Nomura, M., Nishimura, O., and Li, X.-N. (2011). Elimination of estrogens
and estrogenic activity from sewage treatment works effluents in subsurface and surface flow constructed wetlands.
Int. J. Environ. Anal. Chem. 91, 600.

145
Song, Z., Sun, Q., Yu, M., Zhou, Y., Kong, X., and Zhao, Y. (2010). Seasonal variation and correlation of Escherichia
coli and Salmonellae in a full-scale constructed wetland for wastewater treatment in China, presented at the 2010 4th
International Conference on Bioinformatics and Biomedical Engineering (iCBBE).
Song, Z. W., Wu, L., Yang, G., Xu, M., and Wen, S. P. (2008). Indicator microorganisms and pathogens removal
function performed by copepods in constructed wetlands. Bull. Environ. Contam. Toxicol. 81, 459.
Søvik, A. K., Augustin, J., Heikkinen, K., Huttunen, J. T., Necki, J. M., Karjalainen, S. M., Kløve, B., Liikanen, A.,
Mander, ü., Puustinen, M., Teiter, S., and Wachniew, P. (2006). Emission of the greenhouse gases nitrous oxide and
methane from constructed wetlands in Europe. J. Environ. Qual. 35, 2360.
Spalding, R. F., and Exner, M. E. (1993). Occurrence of nitrate in groundwater—A review. J. Environ. Qual. 22,
392.
SRC. (2012). Interactive PhysProp Database.
Stein, O. R., and Hook, P. B. (2005). Temperature, Plants, and Oxygen. J. Environ. Sci. Health Part A 40, 1331.
Stott, R., May, E., Matsushita, E., and Warren, A. (2001). Protozoan predation as a mechanism for the removal of
cryptosporidium oocysts from wastewaters in constructed wetlands. Water Sci. Technol. 44, 191.
Stott, R., and Tanner, C. C. (2005). Influence of biofilm on removal of surrogate faecal microbes in a constructed
wetland and maturation pond. Water Sci. Technol. 51, 315.
Stuer-Lauridsen, F., Birkved, M., Hansen, L. P., Holten Lützhøft, H.-C., and Halling-Sørensen, B. (2000).
Environmental risk assessment of human pharmaceuticals in Denmark after normal therapeutic use. Chemosphere
40, 783.
Suárez, S., Carballa, M., Omil, F., and Lema, J. (2008). How are pharmaceutical and personal care products (PPCPs)
removed from urban wastewaters? Rev. Environ. Sci. Biotechnol. 7, 125.
Tao, W., Hall, K. J., and Ramey, W. (2007). Effects of influent strength on microorganisms in surface flow mesocosm
wetlands. Water Res. 41, 4557.
Tao, W., Wen, J., Han, Y., and Huchzermeier, M. (2012). Nitrogen removal in constructed wetlands using
nitritation/anammox and nitrification/ denitrification. Water Environ. Res. 84, 2099.
Ternes, T. A., Herrmann, N., Bonerz, M., Knacker, T., Siegrist, H., and Joss, A. (2004a). A rapid method to measure
the solid–water distribution coefficient (Kd) for pharmaceuticals and musk fragrances in sewage sludge. Water Res.
38, 4075.
Ternes, T. A., Joss, A., and Siegrist, H. (2004b). Peer reviewed: Scrutinizing pharmaceuticals and personal care
products in wastewater treatment. Env. Sci Technol 38, 392A.
Ternes, T. A., Stüber, J., Herrmann, N., McDowell, D., Ried, A., Kampmann, M., and Teiser, B. (2003). Ozonation.
Water Res. 37, 1976.
Thamdrup, B., and Dalsgaard, T. (2002). Production of N2 through anaerobic ammonium oxidation coupled to nitrate
reduction in marine sediments. Appl. Environ. Microbiol. 68, 1312.
The Department of the Environment, Maryland. (2014). The Evolution to Enhanced Nutrient Removal Technology.
Thomas, T. (1998). Occurrence of drugs in German sewage treatment plants and rivers. Water Res. 32, 3245.

146
Thomas, V., McDonnell, G., Denyer, S. P., and Maillard, J. (2010). Free‐living amoebae and their intracellular
pathogenic microorganisms. FEMS Microbiol. Rev. 34, 231.
Throbäck, I. N., Enwall, K., Jarvis, Å., and Hallin, S. (2004). Reassessing PCR primers targeting nirS, nirK and nosZ
genes for community surveys of denitrifying bacteria with DGGE. FEMS Microbiol. Ecol. 49, 401.
Thullen, J. S., Sartoris, J. J., and Nelson, S. M. (2005). Managing vegetation in surface-flow wastewater-treatment
wetlands for optimal treatment performance. Ecol. Eng. 25, 583.
Tixier, C., Singer, H. P., Oellers, S., and Müller, S. R. (2003). Occurrence and fate of carbamazepine, clofibric acid,
diclofenac, ibuprofen, ketoprofen, and naproxen in surface waters. Environ. Sci. Technol. 37, 1061.
Tolls, J. (2001). Sorption of veterinary pharmaceuticals in soils: A review. Env. Sci Technol 35, 3397.
Toze, S. (2006). Water reuse and health risks — real vs. perceived. Desalination 187, 41.
Tratnyek, P. G., and Hoigné, J. (1991). Oxidation of substituted phenols in the environment. Env. Sci Technol 25,
1596.
Triebskorn, R., Casper, H., Scheil, V., and Schwaiger, J. (2007). Ultrastructural effects of pharmaceuticals
(carbamazepine, clofibric acid, metoprolol, diclofenac) in rainbow trout (Oncorhynchus mykiss) and common carp
(Cyprinus carpio). Anal. Bioanal. Chem. 387, 1405.
Tront, J. M., Reinhold, D. M., Bragg, A. W., and Saunders, F. M. (2007). Uptake of halogenated phenols by aquatic
plants. J. Environ. Eng. 133, 955.
Trout, J. M., Walsh, E. J., and Fayer, R. (2002). Rotifers ingest giardia cysts. J. Parasitol. 88, 1038.
Truu, M., Juhanson, J., and Truu, J. (2009). Microbial biomass, activity and community composition in constructed
wetlands. Sci. Total Environ. 407, 3958.
U.S. Environmental Protection Agency. (1993). Nitrogen Control Manual. Office of Research and Development
EPA/625/R-93/010.
U.S. Environmental Protection Agency. (2010). Chesapeake Bay Total Maximum Daily Load for Nitrogen,
Phosphorus and Sediment. Section 6. Establishing the Allocations for the Basin-Jurisdictions.
Verlicchi, P., and Zambello, E. (2014). How efficient are constructed wetlands in removing pharmaceuticals from
untreated and treated urban wastewaters? Sci. Total Environ. 470–471, 1281.
Verrengia Guerrero, N. R., Taylor, M. G., Davies, N. A., Lawrence, M. A. M., Edwards, P. A., Simkiss, K., and Wider,
E. A. (2002). Evidence of differences in the biotransformation of organic contaminants in three species of freshwater
invertebrates. Environ. Pollut. 117, 523.
Vilchez-Vargas, R., Junca, H., and Pieper, D. H. (2010). Metabolic networks, microbial ecology and ‘omics’
technologies. Environ. Microbiol. 12, 3089.
Vymazal, J. (1995). Algae and Element Cycling in Wetlands. Boca Raton, Fl: CRC Press.
Vymazal, J. (2005). Removal of enteric bacteria in constructed treatment wetlands with emergent macrophytes: A
review. J. Environ. Sci. Health Part A Tox. Hazard. Subst. Environ. Eng. 40, 1355.
Vymazal, J. (2007). Removal of nutrients in various types of constructed wetlands. Sci. Total Environ. 380, 48.

147
Vymazal, J. (2009). The use constructed wetlands with horizontal sub-surface flow for various types of wastewater.
Ecol. Eng. 35, 1.
Vymazal, J. (2010). Constructed wetlands for wastewater treatment: Five decades of experience. Env. Sci Technol
45, 61.
Waltman, E. L., Venables, B. J., and Waller, W. T. (2006). Triclosan in a North Texas wastewater treatment plant
and the influent and effluent of an experimental constructed wetland. Environ. Toxicol. Chem. 25, 367.
Wang, L., Xu, H., Cooper, W. J., and Song, W. (2012). Photochemical fate of beta-blockers in NOM enriched waters.
Sci. Total Environ. 426, 289.
Wang, N., and Mitsch, W. J. (2000). A detailed ecosystem model of phosphorus dynamics in created riparian
wetlands. Ecol. Model. 126, 101.
Webb, S. F. (2004). A Data-based Perspective on the Environmental Risk Assessment of Human Pharmaceuticals I
— Collation of Available Ecotoxicity Data. In A. P. D. K. Kümmerer, Ed., Pharmaceuticals in the Environment.
Springer Berlin Heidelberg, p. 317.
Wenk, J., Von Gunten, U., and Canonica, S. (2011). Effect of dissolved organic matter on the transformation of
contaminants induced by excited triplet states and the hydroxyl radical. Environ. Sci. Technol. 45, 1334.
Wetzel, R. G. (1983). Periphyton of freshwater ecosystems. The Hague: Dr W. Junk Publishers.
Wick, A., Fink, G., Joss, A., Siegrist, H., and Ternes, T. A. (2009). Fate of beta blockers and psycho-active drugs in
conventional wastewater treatment. Water Res. 43, 1060.
Winkler, M., Lawrence, J. R., and Neu, T. R. (2001). Selective degradation of ibuprofen and clofibric acid in two
model river biofilm systems. Water Res. 35, 3197.
Winter, J. E. (1978). A review on the knowledge of suspension-feeding in lamellibranchiate bivalves, with special
reference to artificial aquaculture systems. Aquaculture 13, 1.
Wörman, A., and Kronnäs, V. (2005). Effect of pond shape and vegetation heterogeneity on flow and treatment
performance of constructed wetlands. J. Hydrol. 301, 123.
Wright, A. L., and Reddy, K. R. (2001). Phosphorous loading effects on extracellular enzyme activity in everglades
wetland soils. Soil Sci. Soc. Am. Jounral 65, 588.
Writer, J. H., Antweiler, R. C., Ferrer, I., Ryan, J. N., and Thurman, E. M. (2013). In-stream attenuation of neuro-
active pharmaceuticals and their metabolites. Environ. Sci. Technol.
Writer, J. H., Barber, L. B., Ryan, J. N., and Bradley, P. M. (2011a). Biodegradation and attenuation of steroidal
hormones and alkylphenols by stream biofilms and sediments. Env. Sci Technol 45, 4370.
Writer, J. H., Ryan, J. N., and Barber, L. B. (2011b). Role of biofilms in sorptive removal of steroidal hormones and
4-nonylphenol compounds from streams. Env. Sci Technol 45, 7275.
Wu, Y., He, J., and Yang, L. (2010). Evaluating adsorption and biodegradation mechanisms during the removal of
microcystin-RR by periphyton. Environ. Sci. Technol. 44, 6319.
Xue, W., Wu, C., Xiao, K., Huang, X., Zhou, H., Tsuno, H., and Tanaka, H. (2010). Elimination and fate of selected
micro-organic pollutants in a full-scale anaerobic/anoxic/aerobic process combined with membrane bioreactor for
municipal wastewater reclamation. Water Res. 44, 5999.

148
Yamamoto, H., Nakamura, Y., Moriguchi, S., Nakamura, Y., Honda, Y., Tamura, I., Hirata, Y., Hayashi, A., and
Sekizawa, J. (2009). Persistence and partitioning of eight selected pharmaceuticals in the aquatic environment:
Laboratory photolysis, biodegradation, and sorption experiments. Water Res. 43, 351.
Zeng, T., and Arnold, W. A. (2012). Pesticide Photolysis in Prairie Potholes. Environ. Sci. Technol.
Zepp, R. G., Hoigné, J., and Bader, H. (1987). Nitrate-induced photooxidation of trace organic chemicals in water.
Env. Sci Technol 21, 443.
Zepp, R. G., Wolfe, N. L., Baughman, G. L., and Hollis, R. C. (1977). Singlet oxygen in natural waters. Nature 267,
421.
Zhang, D. Q., Gersberg, R. M., Hua, T., Zhu, J., Tuan, N. A., and Tan, S. K. (2012). Pharmaceutical removal in
tropical subsurface flow constructed wetlands at varying hydraulic loading rates. Chemosphere 87, 273.
Zhu, G., Wang, S., Feng, X., Fan, G., Jetten, M. S. M., and Yin, C. (2011). Anammox bacterial abundance,
biodiversity and activity in a constructed wetland. Environ. Sci. Technol. 45, 9951.
Zhu, G., Wang, S., Wang, W., Wang, Y., Zhou, L., Jiang, B., Op den Camp, H. J. M., Risgaard-Petersen, N., Schwark,
L., Peng, Y., Hefting, M. M., Jetten, M. S. M., and Yin, C. (2013). Hotspots of anaerobic ammonium oxidation at
land-freshwater interfaces. Nat. Geosci. 6, 103.
Ziegmann, M., and Frimmel, F. H. (2010). Photocatalytic degradation of clofibric acid, carbamazepine and iomeprol
using conglomerated TiO2 and activated carbon in aqueous suspension. Water Sci. Technol. 61, 273.