treatment goals in ms
TRANSCRIPT

Treat to Target: Defining treatment goals for patients with MS
Gavin Giovannoni
Barts and The London
This meeting has been organised and funded by Biogen.BI-GBR-0638e Date of Preparation: September 2015
Disclosures
Professor Giovannoni has received personal compensation for participating on AdvisoryBoards in relation to clinical trial design, trial steering committees and data and safetymonitoring committees from: Abbvie, Bayer-Schering Healthcare, Biogen-Idec, Canbex,Eisai, Elan, Fiveprime, Genzyme, Genentech, GSK, GW Pharma, Ironwood, Merck-Serono,Novartis, Pfizer, Roche, Sanofi-Aventis, Synthon BV, Teva, UCB Pharma and VertexPharmaceuticals.
Regarding www.ms-res.org survey results in this presentation: please note that nopersonal identifiers were collected as part of these surveys and that by completing thesurveys participants consented for their anonymous data to be analysed and presented byProfessor Giovannoni.
Professor Giovannoni would like to acknowledge several companies and colleagues formaking available data slides for this presentation.
Professor Giovannoni’s trip to Keele has been sponsored by Biogen.

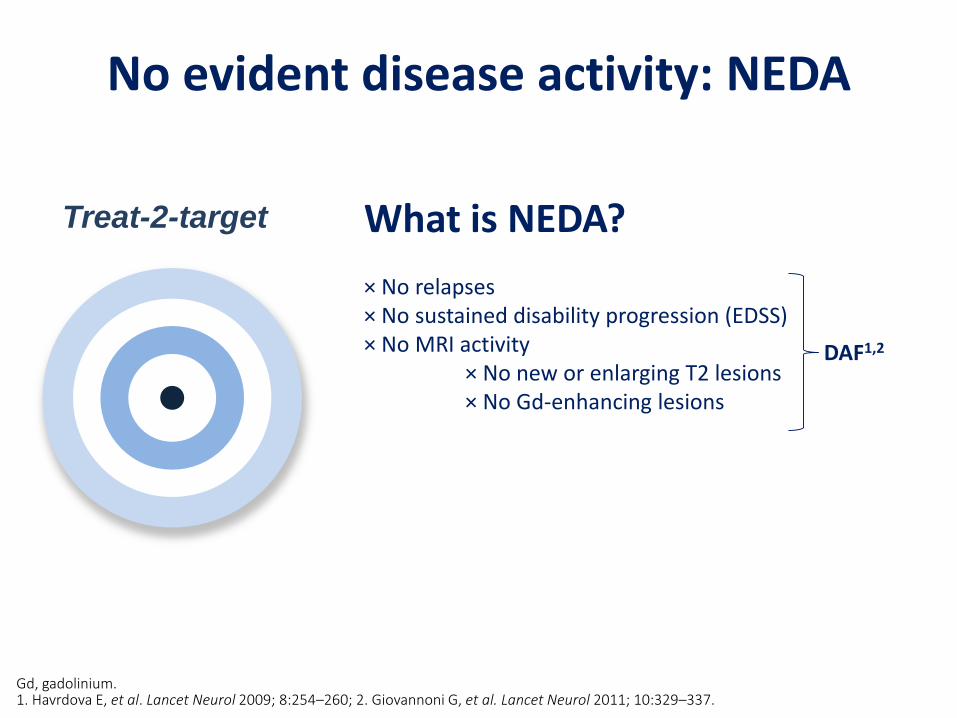
No evident disease activity: NEDA
Gd, gadolinium.1. Havrdova E, et al. Lancet Neurol 2009; 8:254–260; 2. Giovannoni G, et al. Lancet Neurol 2011; 10:329–337.
Treat-2-target What is NEDA?
× No relapses× No sustained disability progression (EDSS)× No MRI activity
× No new or enlarging T2 lesions× No Gd-enhancing lesions
DAF1,2

Evidence

Weinshenker et al. Brain. 1989 Dec;112 ( Pt 6):1419-28.

Predictors of long-term outcome in MSers treated with interferon beta-1a
Bermel et al. Ann Neuol 2012.

Bermel et al. Ann Neuol 2012.
Predictors of long-term outcome in MSers treated with IM interferon beta-1a
Treatment vs. Natural History* Disease activity during the 2-year trial was defined as: 2 or more Gd-enhancing lesions (cumulative) on year 1 and/or year 2 MRI; 3 or more new T2 lesions on year 2 MRI compared to baseline; and 2 or more relapses over two years.

Relapse on IFNβ1a/1b Therapy Increases Risk of Sustained Disability Progression
Bosca et al. Mult Scler. 2008;14:636-639.
HR SE P Value 95% CI
No relapses (reference=1) 1
One relapse 3.41 1.47 0.005 1.46–7.98
Two or more relapses 4.37 1.74 0.000 1.90–9.57
HR of EDSS Increase in Patients with No Relapses, 1 Relapse, and 2 or More Relapses During the First 2 Years of IFN Treatment
0 20 40 60 80
0
0.25
0.50
0.75
Analysis Time (Months)
No RelapsesOne RelapseTwo or More Relapses
1.00
EDSS
Pro
gres
sio
nSu
rviv
al P
rob
abili
ty
HR=hazard ratio; SE=standard error

Relapses and residual deficits
Lublin FD et al. Neurology. 2003;61:1528-1532.
2729 30
4244
41
0
5
10
15
20
25
30
35
40
45
50
30–59 60–89 ≥90
Pat
ien
ts (
%)
Days after exacerbation
Patients with a Change in EDSS Score of ≥1.0 or ≥0.5 After Relapse ≥1.0 EDSS Point
≥0.5 EDSS Point

Bermel et al. Ann Neuol 2012.
Predictors of long-term outcome in MSers treated with interferon beta-1a
* Disease activity during the 2-year trial was defined as: 2 or more Gd-enhancing lesions (cumulative) on year 1 and/or year 2 MRI; 3 or more new T2 lesions on year 2 MRI compared to baseline; and 2 or more relapses over two years.

MRI to monitor treatment response to IFNβ1a/1b: a meta-analysis
Dobson et al. Neurology 2013 and data on file QMUL.
Study or SubgroupOdds Ratio
IV, Random, 95% CI
Kinkel 2008
Prosperini 2009
Total (95% CI) 9.86 (2.33, 41.70)
Study or SubgroupOdds Ratio
IV, Random, 95% CI
Kinkel 2008
Pozzilli 2005
Prosperini 2009
Sormani 2011
Total (95% CI) 2.69 (0.72, 10.04)
0.01 0.1 1 10 100Disease Less Likely Disease More Likely
One New T2 Lesion
Favors Experimental Favors Control
1001010.10.01
Two or More New T2 Lesions

Study or SubgroupOdds Ratio
IV, Random, 95% CI
Kinkel 2008
Rio 2008
Total (95% CI) 5.46 (2.48, 12.04)
MRI to monitor treatment response to IFNβ1a/1b: a meta-analysis
Study or SubgroupOdds Ratio
IV, Random, 95% CI
Kinkel 2008
Pozzilli 2005
Tomassini 2006
Total (95% CI) 3.34 (1.36, 8.22)
0.01 0.1 1 10 100Disease Less Likely Disease More Likely
One New Gd+ Lesion
0.01 0.1 1 10 100
Disease Less Likely Disease More Likely
Two or More New Gd+ Lesions
Dobson et al. Neurology 2013 and data on file QMUL.

Strongest predictor of disability progression on IFNβ therapy is progression itself
Disease activity during 2 years of treatment and prediction of disability progression* at 6 years
GroupSensitivity (%)
(CI)Specificity (%)
(CI)
A. An increase of at least one EDSS step confirmed at 6 months 85 (64–95) 93 (86–97)
B. Occurrence of any relapse 80 (58–92) 51 (41–61)
C. Occurrence of two or more relapses 45 (26–66) 81 (72–82)
D. A decrease in relapse rate less than 30% compared with 2 years before therapy
40 (22–61) 86 (77–91)
E. A decrease in relapse rate less than 50% compared with 2 years before therapy
40 (–61) 81 (72–88)
F. No decrease or identical relapse rate compared with 2 years before therapy
35 (18–57) 88 (79–93)
G. Definition A or B 90 (70–97) 48 (38–58)
H. Definition A or E 85 (64–95) 76 (66–83)
I. Definition A and B 75 (53–89) 97 (91–99)
J. Definition A and E 40 (22–61) 99 (94–99)
*EDSS score ≥6.0 or increase in at least 3 EDSS steps.
Río J et al. Ann Neurol. 2006;59:344-352.

Relationship between early clinical characteristics and long term disability outcomes: 16 year cohort study (follow-up) of the pivotal interferon-beta-1b trial
Goodin et al. J Neurol Neurosurg Psychiatry. 2012 Mar;83(3):282-7.
No evident disease activity: NEDA
Gd, gadolinium.1. Havrdova E, et al. Lancet Neurol 2009; 8:254–260; 2. Giovannoni G, et al. Lancet Neurol 2011; 10:329–337.
Treat-2-target What is NEDA?
× No relapses× No sustained disability progression (EDSS)× No MRI activity
× No new or enlarging T2 lesions× No Gd-enhancing lesions
DAF1,2

Treatment Goals
•
•
•
•
•
•
•
•
•
• β
•
•
•
•
•
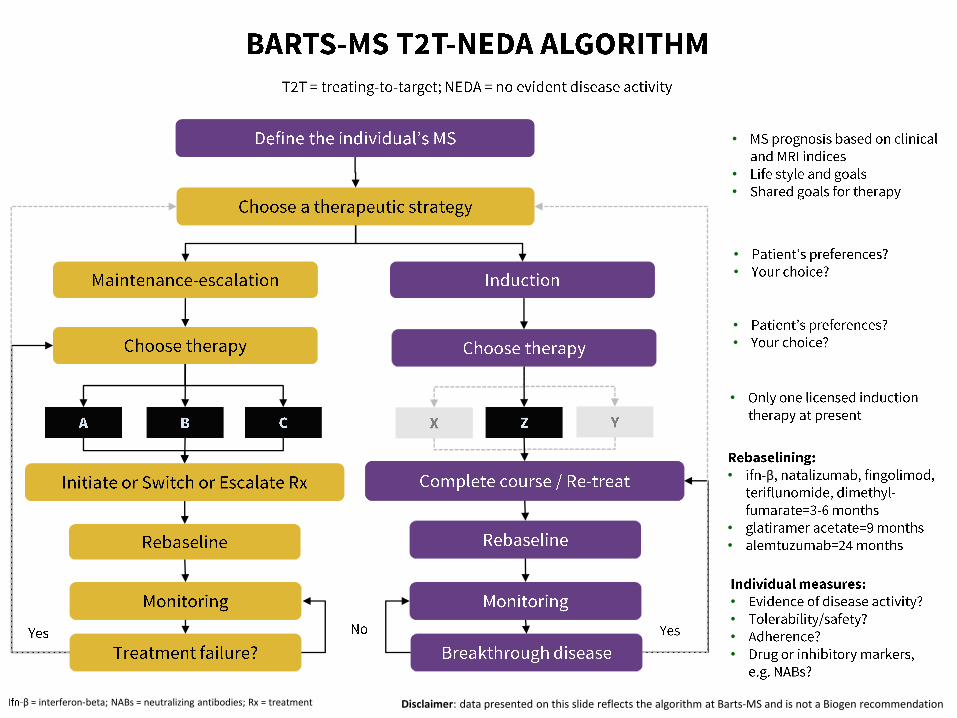
β = interferon-beta; NABs = neutralizing antibodies; Rx = treatment Disclaimer: data presented on this slide reflects the algorithm at Barts-MS and is not a Biogen recommendation

Pros and cons of maintenance vs. induction therapies
Maintenance therapies
• Continuous treatment
• Low to very high efficacy
• Reversible mode of action
• Tend to have low-risk adverse events
• Examples• GA, IFN-beta, teriflunomide, DMF, fingolimod,
natalizumab
• Breakthrough disease• Suboptimal or failure to respond
• NEDA used as a metric for efficacy
• Rebound activity**• Likely
• Pregnancy• Contra-indicated for most treatments
• No potential for a cure• Rebound
• SPMS & progressive brain atrophy
Induction therapies
• Short-courses or pulsed therapy
• Very high efficacy
• Mode of action prolonged
• Tend to have high-risk adverse events
• Examples• Mitoxantrone*, cladribine*, alemtuzumab, anti-
CD20 (?)*, BMT/HSCT*
• Breakthrough disease• Marker for retreatment
• NEDA not suitable to assess efficacy
• Rebound activity**• Less likely
• Pregnancy• Likely to be safe after drug out of system
• Potentially curative• 15-20 year experiment
• BMT/HSCT*, alemtuzumab, cladribine*
* Unlicensed indications** recrudescence of disease activity after washout, or wearing off the therapeutic action, of the DMT concerned

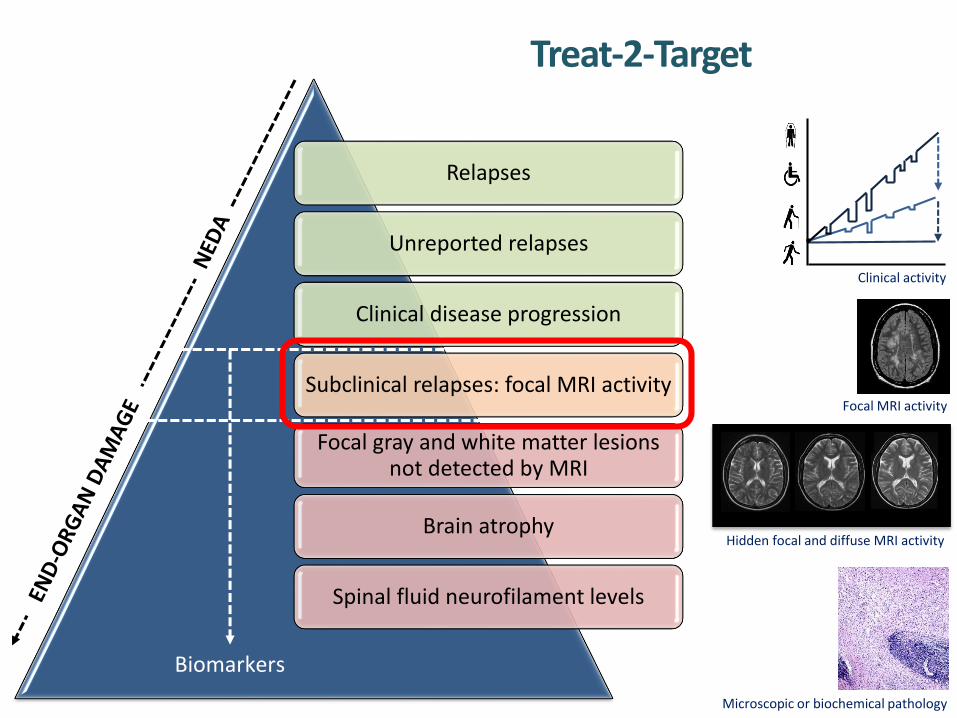
Relapses
Unreported relapses
Clinical disease progression
Subclinical relapses: focal MRI activity
Focal gray and white matter lesions not detected by MRI
Brain atrophy
Spinal fluid neurofilament levels
Treat-2-Target
Clinical activity
Focal MRI activity
Hidden focal and diffuse MRI activity
Microscopic or biochemical pathology
Biomarkers

Yes, 72
No, 28
Relapse reporting
• Most common reasons for not reporting their most recent relapse to a specialist MS team were: • ‘Mild relapse so not felt necessary’ 5/28 (18%)• ‘Saw or spoke to their GP’ 4/28 (14%)
• Most common reasons for not seeking healthcare support were:• ‘Felt I could manage’/mild relapse 18/42 (43%) • ‘Nothing that they can do to help’ 8/42 (19%)
Duddy M, et al. ECTRIMS 2013. P590.
N = 101
Yes, 46
No, 54
N = 102
Patients who have everexperienced an MS relapse and
not contacted a healthcare professional
Patients reporting most recentrelapse to a specialist MS team


Relapses
Unreported relapses
Clinical disease progression
Subclinical relapses: focal MRI activity
Focal gray and white matter lesions not detected by MRI
Brain atrophy
Spinal fluid neurofilament levels
Treat-2-Target
Clinical activity
Focal MRI activity
Hidden focal and diffuse MRI activity
Microscopic or biochemical pathology
Biomarkers

Normalneurological examination
No disability
Minimaldisability
Moderatedisability
Relativelyseveredisability
Disabilityprecludesfull daily activities
Assistancerequiredto walk Restricted
to a wheelchair
Restricted to bed orchair Confined
to bed
Death
0.0 1.0 2.0 3.0 4.0 5.0 6.0 7.0 8.0 9.0 10.0
EDSS
Adapted from http://www.msdecisions.org.uk/. Accessed 15 April 2014. Previously adapted from Kurtzke JF. Rating neurologic impairment in multiple sclerosis: an expanded disability status scale (EDSS).
Neurology 1983; 33:1444–1452.

Yes – I do an EDSS whenever I see a patient 14 25%
Yes – I do an EDSS annually 10 18%
Yes – I occasionally do an EDSS 20 36%
No – I never do an EDSS 3 5%
Other 9 16%Yes – I do an EDSS whenever I see a
patient [14]Yes – I do an EDSS
annually [10]
Yes – I occasionally do an EDSS [20]
No – I never do an EDSS [3]
Other [9]
Survey of UK MSologists
Schmierer K, et al. ABN 2014; Unpublished.
Clinical – In your routine MS clinical practice, do you use the EDSS?
Clinical – If you do an EDSS in your routine clinical practice, do you walk the patients to assess their walking distance?
Yes [9]
No [20]
Sometimes [22]
Other [5] Yes 9 16%
No 20 36%
Sometimes 22 39%
Other 5 9%

Validating a novel web-based method to capture disease progression outcomes in MS
P-EDSS, physician or actual EDSS.The midpoint of the diamonds is the mean difference between the two EDSS scores, the upper and lower lines within the diamonds are the 95% CI. The width of the diamond indicates the sample size, the dots the actual values. The horizontal line at 0.46 indicates the mean difference between the two scores. The graph indicates the greater variation at lower EDSS scores, with greater agreement at scores > 5. Leddy S, et al. J Neurol 2013; 260:2505–2510.
ORIGINAL COMMUNICATION
we
b-
EDSS
–P
-ED
SS s
core
P-EDSS score
–4
–3
–2
–1
0
1
2
3
4
0 1 1.5 2 2.5 3 3.5 4 4.5 5.5 6 6.5 7 8
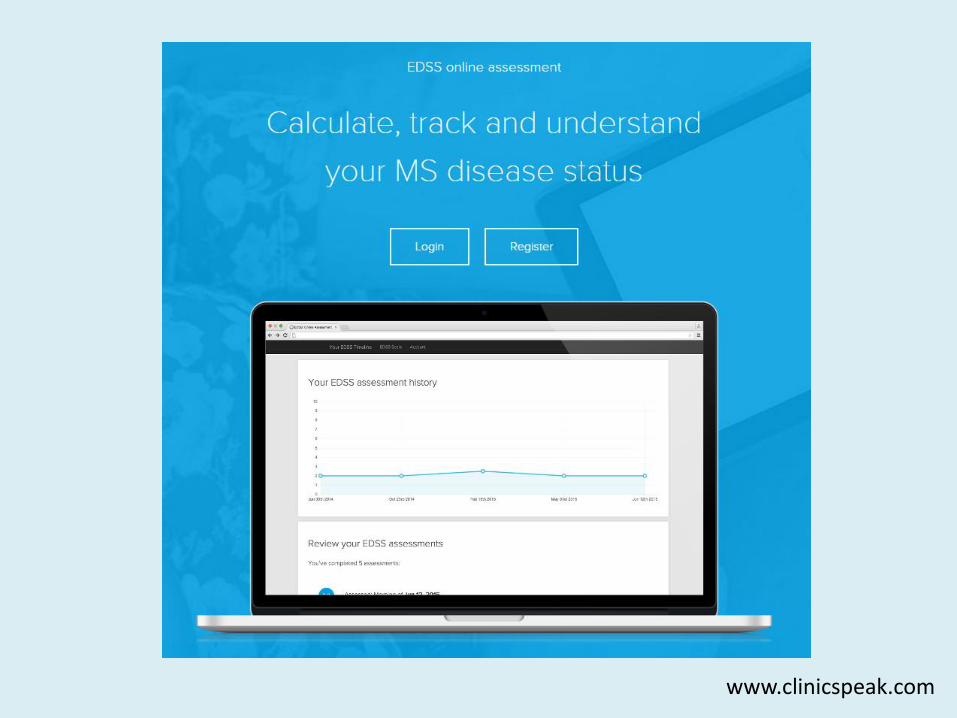
www.clinicspeak.com

Monitoring your own disease


Activity monitoring in Multiple Sclerosis
R2 = 0.26
0.0
0.5
1.0
1.5
2.0
2.5
3.0
3.5
4.0
4.5
0.0 1.0 2.0 3.0 4.0 5.0 6.0 7.0 8.0
Expanded Disability Status Score
Act
iWat
ch M
easu
rem
ent
(/1
06 )
Maria Espasandin & Gavin Giovannoni, ECTRIMS 2012


Relapses
Unreported relapses
Clinical disease progression
Subclinical relapses: focal MRI activity
Focal gray and white matter lesions not detected by MRI
Brain atrophy
Spinal fluid neurofilament levels
Treat-2-Target
Clinical activity
Focal MRI activity
Hidden focal and diffuse MRI activity
Microscopic or biochemical pathology
Biomarkers

Beyond NEDA-3

Relapses
Unreported relapses
Clinical disease progression
Subclinical relapses: focal MRI activity
Focal gray and white matter lesions not detected by MRI
Brain atrophy
Spinal fluid neurofilament levels
Treat-2-Target
Clinical activity
Focal MRI activity
Hidden focal and diffuse MRI activity
Microscopic or biochemical pathology
Biomarkers

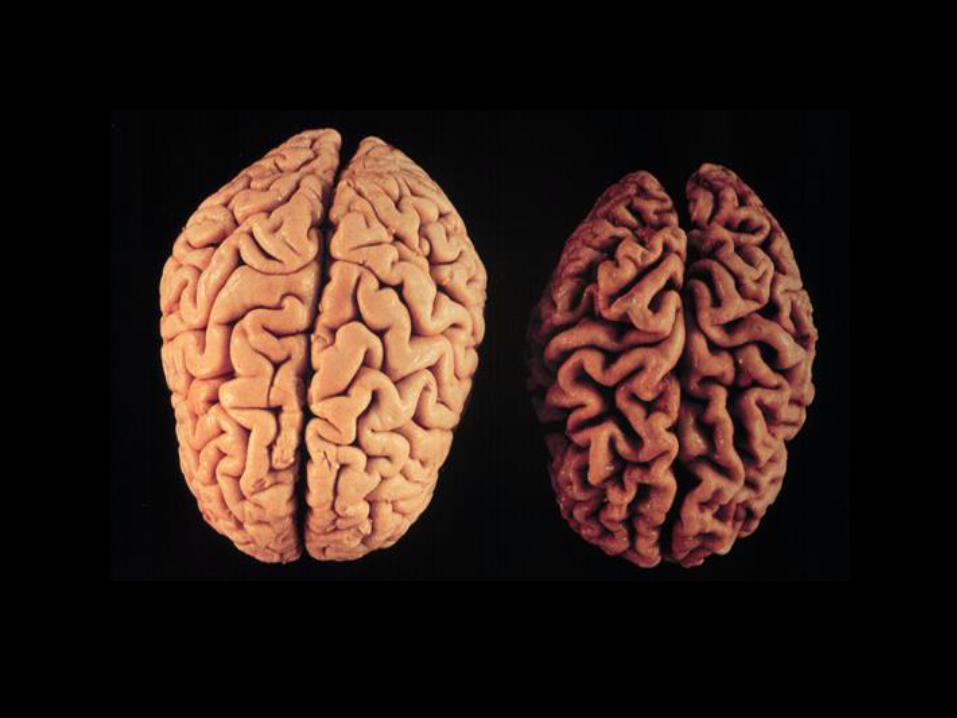
Brain atrophy occurs across all stages of the disease
De Stefano, et al. Neurology 2010
n= 963 MSers

Treatment effect on disability predicted by effect on T2-lesion load and brain atrophy
Meta-analysis of treatment effect on EDSS worsening (y) vs effects on MRI lesions
and brain atrophy, individually or combined, in 13 placebo-controlled RRMS trials
(13,500 patients)
Sormani MP et al. Ann Neurol. 2014;75:43-49.
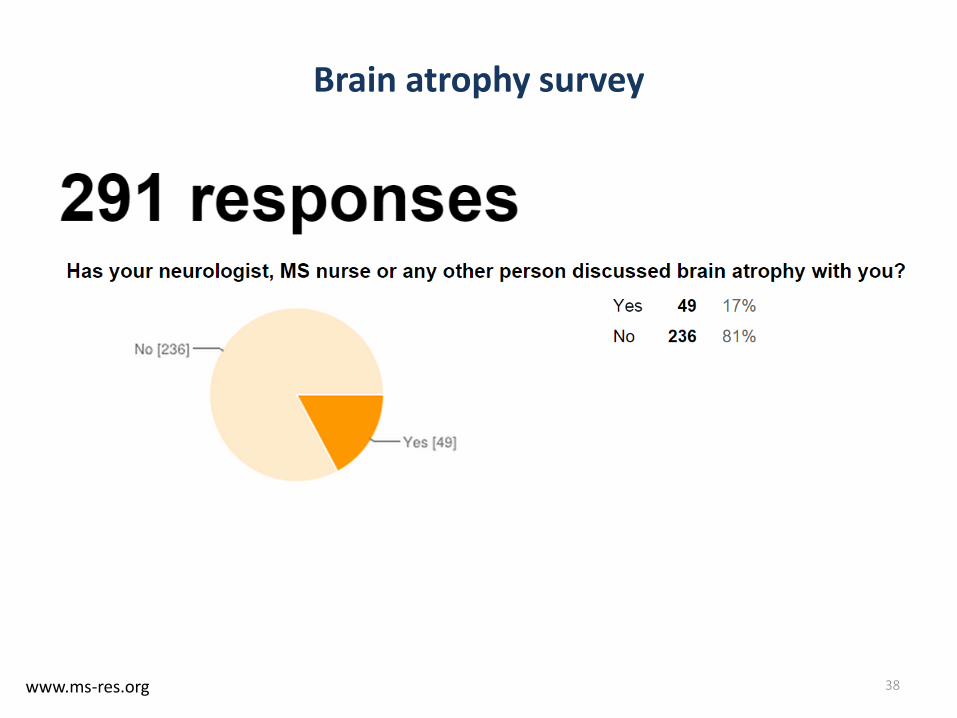
Brain atrophy survey
38www.ms-res.org

Brain atrophy survey
39www.ms-res.org


End-organ damage
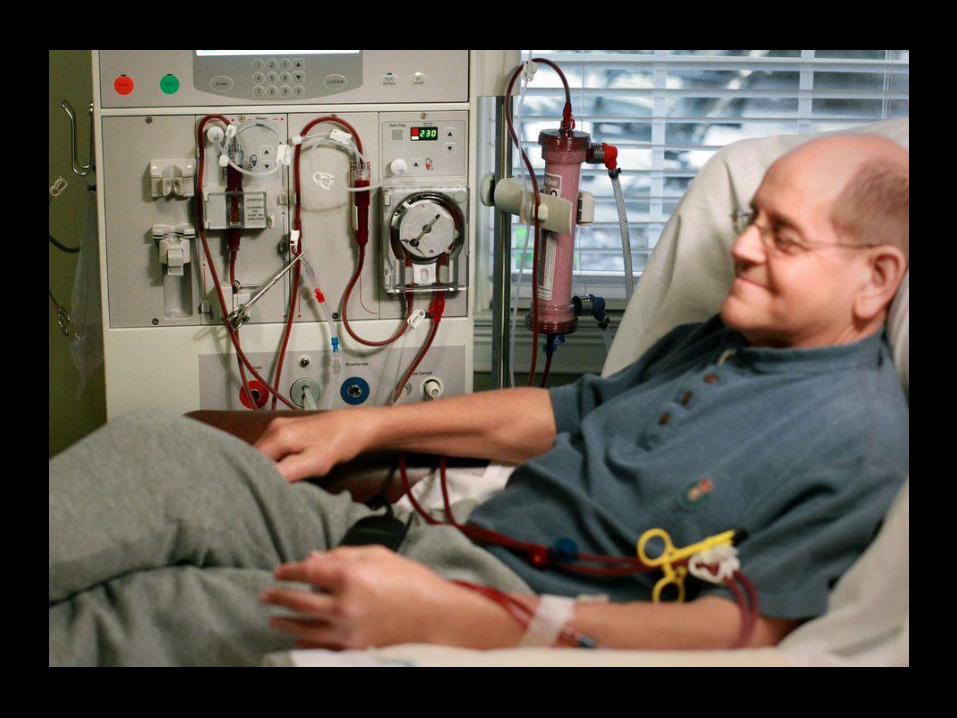
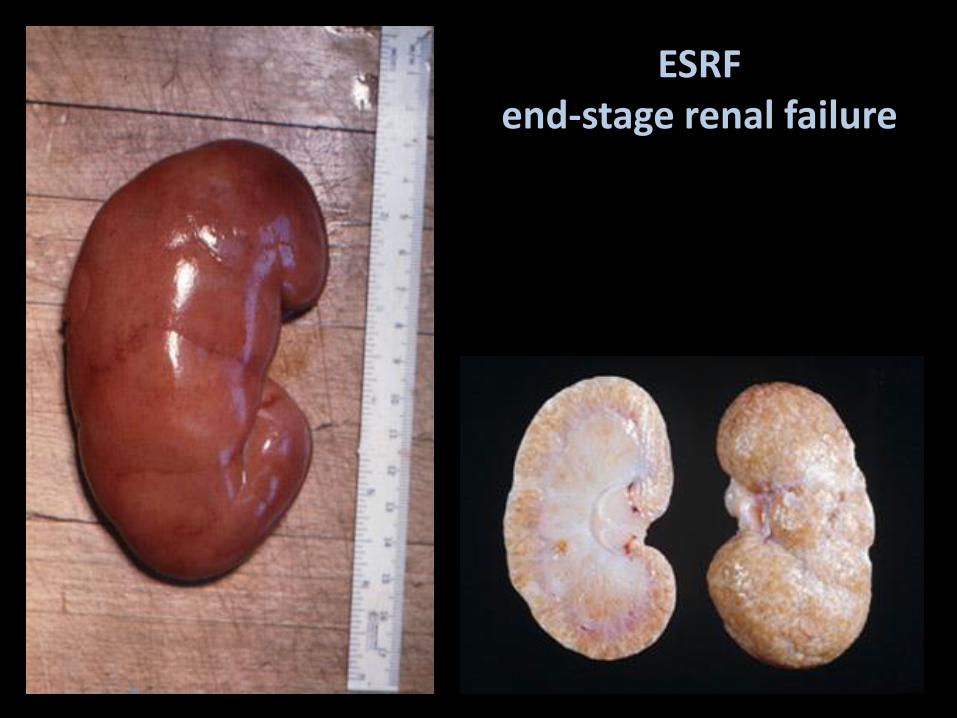
ESRFend-stage renal failure

Rheumatoid arthritisEnd-stage joint disease

What if we are wrong?


Conclusions
• MS is a bad disease• Mortality, disability, unemployment, divorce, cognitive impairment,
etc.
• On average early highly-effective therapy is the only realistic option of preventing end-organ damage • NEDA and T2T are current treatment target (zero tolerance)
• Beyond NEDA we need to target end-organ damage (brain atrophy and CSF NF levels)
• Risks and benefits• Who should take the risks?
• What is the role of the healthcare professional in decision-making?