treating progress functions as a managerial opportunity · treating progress functions as a...
TRANSCRIPT
Treating Progress Functions as a Managerial OpportunityAuthor(s): John M. Dutton and Annie ThomasSource: The Academy of Management Review, Vol. 9, No. 2 (Apr., 1984), pp. 235-247Published by: Academy of ManagementStable URL: http://www.jstor.org/stable/258437 .
Accessed: 29/08/2013 13:31
Your use of the JSTOR archive indicates your acceptance of the Terms & Conditions of Use, available at .http://www.jstor.org/page/info/about/policies/terms.jsp
.JSTOR is a not-for-profit service that helps scholars, researchers, and students discover, use, and build upon a wide range ofcontent in a trusted digital archive. We use information technology and tools to increase productivity and facilitate new formsof scholarship. For more information about JSTOR, please contact [email protected].
.
Academy of Management is collaborating with JSTOR to digitize, preserve and extend access to The Academyof Management Review.
http://www.jstor.org
This content downloaded from 131.252.130.248 on Thu, 29 Aug 2013 13:31:47 PMAll use subject to JSTOR Terms and Conditions

cAcademy of Management Review, 1984, Vol. 9, No. 2, 235-247.
Treating Progress Functions as
a Managerial Opportunity1
JOHN M. DUTTON ANNIE THOMAS
New York University
Use of progress functions in strategic planning has led to the principle that firms can expect continuous cost improvements with cumulative output. But finding policies that result in continuous cost improvements requires a better understanding of the dynamics underlying firms' progress func- tions. This paper draws on more than 200 empirical and theoretical studies of progress functions in industrial engineering, economics, and manage- ment. Factors causing progressfall into four categories that vary in origin (exogenous or endogenous) and in type (autonomous or induced).
This paper employs a theoretical framework for exploring the causes underlying progress functions of firms and for connecting progress functions with organizational behavior, drawing on the 50-year lit- erature on firms' progress functions as a data base. The progress principle has become a recommended mainstay of policymaking at the level of the firm. But implementing policies regarding progress func- tions is an ill-defined task because the dynamics un- derlying firms' progress functions are still poorly understood. In essence, the progress principle as for- mulated by early pioneers as well as later researchers states that a firm can expect continuous improvement in its input-output productivity ratios as a conse- quence of a growing stock of knowledge (Arrow, 1962; Hirsch, 1952; Wright, 1936). Use of the prog- ress principle in formulating corporate strategy was advocated by Andress (1954), Hirschmann (1964), the Boston Consulting Group (1970), and others. Its market implications cause it to be seen as an especial- ly powerful tool for managers in competitive envi- ronments (Abell & Hamond, 1979; Hofer & Schendel, 1978). More recent work further explores the competitive advantages that firms can gain from the effects of experience via lower costs and via policies on pricing and output expansion (Bass, 1980; Conley, 1970; Dolan & Jeuland, 1981; Enis, 1980;
Howell, 1980; Patel & Younger, 1978; Rapp, 1973; Robinson & Lakhani, 1975).
The progress principle is most commonly repre- sented by progress functions. Progress functions dif- fer from learning curves and experience curves in type of improvement and unit of analysis. Learning curves are used most commonly to describe labor learning at the level of an individual employee or a produc- tion process, such as an assembly line. Progress func- tions also may describe changes in materials inputs, process or product technologies, or managerial tech- nologies-from the level of a process to the level of a firm. Because they aggregate effects, progress func- tions also may reflect improvements not necessarily resulting from increasing knowledge. For instance, they may reflect the effects of revising production methods to accommodate higher expected output le- vels. The term progress functions (or curves) is sep- arate from experience curves; the latter, though sometimes used at the level of a firm, often are used to describe progress at an industry level. Experience curves also often use price as a proxy to capture progress effects (Boston Consulting Group, 1970), whereas progress functions are expressed in unit costs. This paper uses the term "experience" occa- sionally, but in the sense that experience is a means for firms gaining knowledge whereas progress is a result of firms gaining knowledge.
Because of their apparent similarity, progress func- tions are easily confused with other, frequently used
'The research leading to this paper was supported in part by the Challenge Fund Grant Program of New York University.
235
This content downloaded from 131.252.130.248 on Thu, 29 Aug 2013 13:31:47 PMAll use subject to JSTOR Terms and Conditions

curves in economics and production management, such as long run cost curves and average cost curves (Gold, 1981; Henderson & Quandt, 1980). But the philosophy of dynamic, continuous change underly- ing progress functions differs sharply from the con- cepts underlying static cost curves. Emphasized here is the point that firms progress functions show con- tinuing, dynamic cost reductions stemming from their capturing growing knowledge of different forms.
Firms that seek to use the progress principle face implementation issues, two of which are discussed in this paper:
1. What policy viewpoint on the progress principle is suggested by the 50-year history of studies on the concept?
2. What organizational issues arise in managing cost dynamics in the progress curve effect?
As Abell and Hammond note: "Experience does not cause [cost] reductions but rather provides an op- portunity that alert managements can exploit. Con- sequently strategies resulting from market planning should explicitly address how cost reductions are to be achieved" (1979, p. 113).
Such advice is not easily followed. The framework widely proposed for applying the progress principle provides managers with only a single policy variable that can be manipulated, namely, cumulative volume. Predictions of progress using firms' progress func- tions have proved unreliable. And underlying causes of cost improvements generally are obscure and poor- ly understood. These shortcomings render the prog- ress principle of limited use in strategic planning un- til its underlying dynamics are better understood.
Shortcomings and Potential
Between 1920 and 1980 over 100 studies of prog- ress functions were carried out in a variety of manufacturing-firm settings. These studies highlight the dynamics of production systems and point to op- portunities for inducing progress in many cost cate- gories-including production, marketing, and distri- bution. In popular form, the progress principle states that cost input per unit declines at a uniform rate with cumulative production. An early observation of this principle occurred in the aircraft industry, for which it was noted that direct labor input per airframe de- clined at a uniform rate as cumulative output grew (Middleton, 1945; Wright, 1936). Since then, the phe- nomenon has been observed and studied in different work settings and has been widely recommended for managerial control purposes and strategy formula-
tion (Abell & Hammond, 1979; Andress, 1954; Bos- ton Consulting Group, 1970; Hirschmann, 1964; Hofer & Schendel, 1978; Yelle, 1979). The most com- mon formulation of the progress function is the log- linear form:
y=ax b where
y = input cost for the xth unit x= cumulative number of units produced a= input cost for the first unit b= progress rate In progress functions as described above, cumu-
lative production volume is a proxy for experience and provides the only input (policy) variable. As a result, strategies using this functional form usually require that a producer acquire the largest market share relative to competition in order to obtain low- cost producer advantages. Such strategies necessitate increases in rate of production and usually, therefore, scale of operations-increases that are expected to achieve output economies. Faster accumulation of cumulative volume, via an increasing (accelerating) rate of output, also is believed to lead to increasing cost decline with time (Abell & Hammond, 1979; Boston Consulting Group, 1970).
These broad assertions have been examined by others. Lippman and Rumelt (1982) questioned the validity of the market share effect. And, as argued by Corey (1975), Hall (1980), Hammermesh, Ander- son, and Harris (1978), and Woo and Cooper (1982), high performance via low-cost producer advantages does not necessarily correlate with high market share. But factors contributing to market share and to overall performance are not comprehensively ad- dressed here. This discussion focuses on those firms emphasizing low-cost production and seeking dynamic cost efficiencies. For these firms, progress functions may be useful tools for analyzing aggregate dynamic effects not captured by static cost curves. But in their current forms progress functions also have serious limitations. In offering cumulative volume as the only policy input variable, they fail to match the complex, underlying dynamics of firms' costs and imply that building cumulative volume is the only way to achieve progress. However, examina- tion of progress-function studies reveals that sus- tained production often provides producers with op- portunities to effect cost efficiencies that have little to do with cumulative volume. Although commonly used as a proxy for experience, cumulative volume should not be seen as defining the means to gain
236
This content downloaded from 131.252.130.248 on Thu, 29 Aug 2013 13:31:47 PMAll use subject to JSTOR Terms and Conditions

experienced-based advantages. In fact, as discussed later, cumulative volume often is not the best proxy for experience (Sheshinski, 1967).
In general, strategies using the progress principle involve anticipation of progress based on predictions of values of b (progress rates) in advance of ex- perience. These rates then are assumed to be a given that can be achieved through alert managerial action. Therein lies a problem. Although evidence indicates that progress is widespread (Alchian, 1963), to date it has not been reduced to a stable, explainable, and predictable phenomenon. The progress curve is char- acterized by major variation. Over 200 empirical studies of progress curves suggest that, although the general notion of improvement with experience is strongly supported, in few instances has it been possi- ble to estimate future progress rates with precision (Dutton & Thomas, 1982).
Figure 1 shows the frequency distribution of prog- ress ratios obtained from a sample of over 100 studies. The studies include manufacturing processes in industries such as electronics, machine tools, EDP system components, papermaking, aircraft, steel, ap- parel, and automobiles (Alchian, 1963; Baloff, 1966a, 1971; Billon, 1966; Conway& Schultz, 1959; Hirsch, 1952, 1956; Searle & Goody, 1945). All are studies of firms' progress functions estimating cost behavior (unit or average cost) with cumulative volume. Thus all measure changes in the input-output ratios of processes. No industry-level experience curve studies or studies showing price declines are included.
The variation in results shown in Figure 1 suggests that caution is needed in estimating future progress rates. More detailed breakdowns reveal that not only do recorded rates vary across industries, processes, and products, but they also differ for similar pro- cesses and products. Indeed, progress rates have varied widely for subsequent runs of the same prod- uct in the same plant (Alchian, 1963; Asher, 1956; Billon, 1966; Conway & Schultz, 1959; Hirsch, 1952, 1956; Nadler & Smith, 1963; Preston & Keachie, 1964).
Problems presented by the high variability and lack of stability in progress functions are rarely treated as major in the management literature. Industry ex- perience curves, as well as firms' progress functions, are commonly used to advocate managerial policies for firms to attain cost advantages. Industry expe- rience curves often are misleading in showing average price trends correlating significantly with cumulative
industry volume. Such trends may mask price varia- tions and be distantly related to costs. In general, the empirical evidence offered in support of industry ex- perience curves fails to address crucial issues such as: (1) Does cumulative experience alone explain a sig- nificant part of the observed price reductions? (2) How are long periods of nonprogress accounted for? (3) What do these curves say about industry cost patterns and trends?
More importantly for this discussion, industry ex- perience curves say little about individual firms' cost dynamics. In any given industry, firms' progress functions, as well as progress rates, vary widely (Alchian, 1963; Billon, 1966; Nadler & Smith, 1963). This variation extends not only across firms at a given time, but also within firms over timen.nmilitary air- frame production Alchian (1963) found that using industry-wide progress functions to anticipate firms' future progress rates led to large errors. Firms' past progress curves also proved unreliable in predicting their future progress rates. In both cases, the mean prediction errors fell in the 22 percent-25 percent range. Alchian's conclusions about the problems as- sociated with such predictions were supported by the later studies of Billon (1966), Conway and Schultz (1959), and Hirsch (1952, 1956).
In general, the empirical findings caution against simplistic uses of either industry experience curves or a firm's own progress curves. Predicting future progress rates from past historical patterns has proved unreliable. Unexpected variability results in costly errors in production planning, and it may be a significant factor in the smaller than expected ultimate profits (Kiechel, 1981; Porter, 1980) found by firms using the concept. Evidence also indicates that the path of progress is subject to control and that certain kinds of progress effects can be induced (Conway & Schultz, 1959; Levy, 1965; Young, 1966). For policymakers these findings are highly suggestive, but they do not illuminate which factors in the underlying process are subject to control; nor do they show how the process can be influenced. Progress curves are aggregate empirical descriptions of a pro- cess, and they mask its underlying dynamics.
The mean and modal tendencies of the frequency distribution in Figure 1 suggest a basis for the wide- ly publicized 80 percent progress curve (Andress, 1954; Hartley, 1965; Hirschmann, 1964). But believ- ing that firms achieve cost leadership by accumu- lating volume faster along this (or another) given
237
This content downloaded from 131.252.130.248 on Thu, 29 Aug 2013 13:31:47 PMAll use subject to JSTOR Terms and Conditions
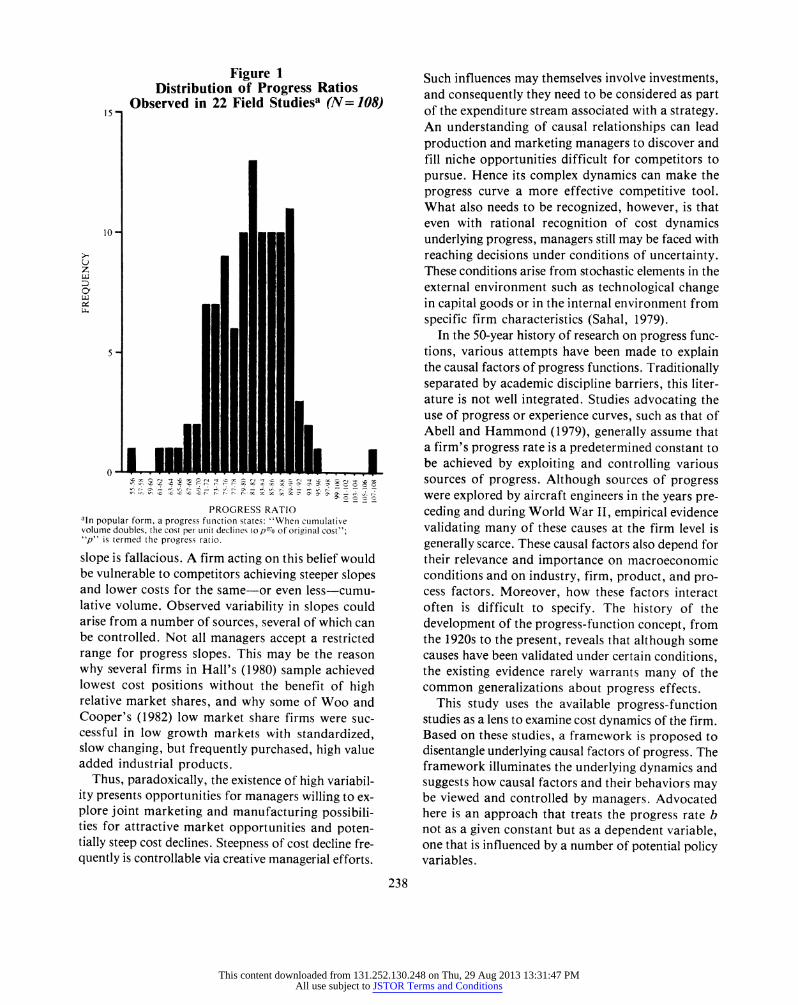
Figure 1 Distribution of Progress Ratios
Observed in 22 Field Studiesa (N= 108) I,5s
10-
z
5 -
0
: ,x 'A t sC Xc C " t?<C I r lo t8::_ XC4 -t QCX r o tol tfsC w; qC xr r > r_- 1 r 1 X ~ oo X C ; e? 0I
x 'x~~~~ PROGRESS RATIO
a'n popular form, a progress fuinction states: "When cumulative volume doubles, the cost per unit declines to p07o of original cost"; "p" is termed the progress ratio.
slope is fallacious. A firm acting on this belief would be vulnerable to competitors achieving steeper slopes and lower costs for the same-or even less-cumu- lative volume. Observed variability in slopes could arise from a number of sources, several of which can be controlled. Not all managers accept a restricted range for progress slopes. This may be the reason why several firms in Hall's (1980) sample achieved lowest cost positions without the benefit of high relative market shares, and why some of Woo and Cooper's (1982) low market share firms were suc- cessful in low growth markets with standardized, slow changing, but frequently purchased, high value added industrial products.
Thus, paradoxically, the existence of high variabil- ity presents opportunities for managers willing to ex- plore joint marketing and manufacturing possibili- ties for attractive market opportunities and poten- tially steep cost declines. Steepness of cost decline fre- quently is controllable via creative managerial efforts.
Such influences may themselves involve investments, and consequently they need to be considered as part of the expenditure stream associated with a strategy. An understanding of causal relationships can lead production and marketing managers to discover and fill niche opportunities difficult for competitors to pursue. Hence its complex dynamics can make the progress curve a more effective competitive tool. What also needs to be recognized, however, is that even with rational recognition of cost dynamics underlying progress, managers still may be faced with reaching decisions under conditions of uncertainty. These conditions arise from stochastic elements in the external environment such as technological change in capital goods or in the internal environment from specific firm characteristics (Sahal, 1979).
In the 50-year history of research on progress func- tions, various attempts have been made to explain the causal factors of progress functions. Traditionally separated by academic discipline barriers, this liter- ature is not well integrated. Studies advocating the use of progress or experience curves, such as that of Abell and Hammond (1979), generally assume that a firm's progress rate is a predetermined constant to be achieved by exploiting and controlling various sources of progress. Although sources of progress were explored by aircraft engineers in the years pre- ceding and during World War II, empirical evidence validating many of these causes at the firm level is generally scarce. These causal factors also depend for their relevance and importance on macroeconomic conditions and on industry, firm, product, and pro- cess factors. Moreover, how these factors interact often is difficult to specify. The history of the development of the progress-function concept, from the 1920s to the present, reveals that although some causes have been validated under certain conditions, the existing evidence rarely warrants many of the common generalizations about progress effects.
This study uses the available progress-function studies as a lens to examine cost dynamics of the firm. Based on these studies, a framework is proposed to disentangle underlying causal factors of progress. The framework illuminates the underlying dynamics and suggests how causal factors and their behaviors may be viewed and controlled by managers. Advocated here is an approach that treats the progress rate b not as a given constant but as a dependent variable, one that is influenced by a number of potential policy variables.
238
This content downloaded from 131.252.130.248 on Thu, 29 Aug 2013 13:31:47 PMAll use subject to JSTOR Terms and Conditions

Four Causal Catagories
Actual studies of progress functions reveal four main categories of factors causing progress: (1) ef- fects of technological change; (2) Horndal (labor learning) effects; (3) local industry and firm charac- teristics; and (4) scale effects. These causal factors (or combinations of them) explain observed progress in varying degrees (Dutton & Thomas, 1982).
Technological Progress in Capital Goods
In 1962 Arrow introduced technological change in capital goods into experience theory with the "learning-by-doing" concept. Arrow's hypothesis stipulated that investment in a series of improving capital goods creates a changing production environ- ment that contributes to the progress effect. In con- trast to studies in which cumulative volume is treated as the sole measure of experience, Arrow emphasizes investment in capital goods as the primary vehicle of progress, with cumulative gross investment consi- dered the main economic variable representing ex- perience.
Sheshinski (1967) presented strong empirical sup- port in several industries for the learning-by-doing hypothesis, finding that cumulative investment in most cases fared better than cumulative output as a proxy for experience. Indirect confirmation of the importance of this cumulative investment effect in the progress-curve phenomenon is found in a number of other studies, both in airframe manufacture (Crawford & Strauss, 1947; Middleton, 1945; Wright, 1936) and in other industries such as shipping, steel, rayon, chemicals, and nuclear power (Baloff, 1966b; Hollander, 1965; Hufbauer, 1966; Joskow & Rozan- ski, 1979; Searle & Goody, 1945). These studies pro- vide considerable evidence that cumulative invest- ments and improvements in capital equipment ex- plain a significant part of the variation in progress rates in similar processes and facilities. But apparent- ly no attempts to isolate systematically the effects of serially-improving capital goods on the progress func- tion exist.
The Horndal-Plant Effect
The Horndal iron works in Sweden had no new investment over a period of 15 years. However, pro- ductivity in terms of output per man hour rose about 2 percent per year (Lundberg, 1961). The Horndal- plant effect thus refers to progress brought about by direct and indirect labor learning for a given set of
capital goods. Progress of this type can be attributed to adaptation efforts by labor and technical person- nel and to other autonomous cost-reducing effects of sustained production of a good. Although this ef- fect in many instances is closely allied to and interacts with economies of scale, the Horndal effect can and often does occur independently of rate and scale effects.
Many progress-function studies focus narrowly on direct-labor learning as the main cause of the Horn- dal effect. Such learning, in the strict sense, is im- provement in the performance of fixed tasks. But it is only one of the several key factors in the Horndal effect. Improvements in direct-labor input often are due to indirect-labor behavior and learning. A fre- quent observation is that unless additional tooling and process changes are made by technical person- nel, direct-labor input into tasks of fixed design tends to plateau after a certain period (Baloff, 1966a; Chassan, 1945; Conway & Schultz, 1959; Guibert, 1945). In many forms of machine-intensive manufac- ture direct-labor learning is relatively insignificant and progress is due to indirect-labor learning or technical adaptations by staff personnel or managers (Baloff, 1966b; Billon, 1966; Hirsch, 1952, 1956).
The significance of several causal factors in the Horndal effect has been empirically confirmed (Dut- ton & Thomas, 1982). The precise nature of the rela- tionship between tooling and process design and rates of cost decline for a given set of capital goods is not yet fully understood. However, attempts have been made to analyze these relationships by Chassan (1945) and others. Product design changes also af- fect the shape of the progress curve. But the findings regarding their impact are mixed, no doubt heavily influenced by local system characteristics; steep im- provement rates have been observed under conditions in which model and design changes (within models) occurred at regular intervals (Conway & Schultz, 1959), as well as when product design was unchanged for long periods of time (Baloff, 1971). Billon (1966) found in his studies of EDP system components and heavy printing machinery that frequent design changes created unpredictable changes in progress rates.
A number of other causal factors such as schedul- ing, inventory management, quality control, and wage incentives also result in the Horndal effect (Dut- ton & Thomas, 1982). Although their relationships are not fully understood, the importance of these fac-
239
This content downloaded from 131.252.130.248 on Thu, 29 Aug 2013 13:31:47 PMAll use subject to JSTOR Terms and Conditions

tors in explaining a significant part of the observed variation in improvement rates can easily be over- looked.
Local System Characteristics
Even firms operating in highly similar markets with virtually identical capital goods and labor skills can vary widely in organizational structure, preferred customers, product mixes, and other operating sys- tem characteristics (Child, 1974; Starbuck & Dutton, 1973). The findings of progress studies to date argue for great variety-even uniqueness-in improvement rates for individual firms, plants, and processes. The organizations on which studies have focused are American industrial firms engaged in manufacturing. Often their preeminent concern is with cost effec- tiveness of operations, and they naturally focus on a particular set of operating factors. The findings in- dicate that the progress curve is affected by local operating system characteristics such as the degree of mechanization, the ratio of assembly to machin- ing, the length of cycle times, and whether the pro- cess is continuous or batch. The only conclusive find- ings regarding their impact were provided by Hirsch (1952, 1956) in his studies of the manufacture of ma- chine tools. Rates of improvement were found to be significantly different for assembly and machining labor. Thus prediction of improvement rates ought to be tied to local system characteristics. But to date few studies exist about how system characteristics af- fect experience and what changes may be needed to achieve targets.
Effects of Scale
Economies of scale are reductions in average costs attributable to increases in scale, and they can stem from a number of sources. Current progress theory does not distinguish between scale and nonscale ef- fects because progress curves aggregate these effects. Scale is included here as a causal factor because sometimes much of what is attributed to experience is due to scale. For that reason causes of cost reduc- tions often are misassigned. The two effects also are closely related, in that scale can contribute to prog- ress effects, but how this occurs is not yet fully understood. Total unit cost reductions because of in- creases in production rate can be attributed not only to absorption of indivisible (fixed) costs but also to economies from Horndal-type adaptations that are facilitated by rate increases. Currently, however,
findings regarding the effects of the rate of output on the progress curve remain mixed and contradic- tory. Impressive improvement rates were observed in aircraft production during World War II. During this time huge increases in output took place and new techniques for mass production were introduced. Engineering economies of mass production and ex- tensive tooling for large volumes yielded significant improvements (Carr, 1946; Crawford & Strauss, 1947; Middleton, 1945). Studies of other industries following World War II, for which large volume in- creases were absent, produced mixed results with respect to the role of scale factors.
A grasp of cost dynamics with respect to scale and progress is facilitated by distinguishing two factors of cost reduction (Alchian, 1959; Hirschleifer, 1962):
1. cost reductions due to increased knowledge resulting from increased cumulative output; and
2. cost reductions due to change in expected volume of production.
The former is akin to the progress curve, because it stipulates that as production continues, knowledge and experience increase and result in economies. Technological improvements in capital goods and the Horndal effect contribute to both these sources of cost reductions. But the latter type of cost reduction is due to varying techniques of production as a func- tion of expected volume. Techniques of production vary in order to exploit economies, mainly in absorb- ing indivisible costs. These economies can be realized only if production is scheduled in advance. A number of studies show instances in which cost reductions attributed to experience are likely to have resulted from this latter factor (Conway & Schultz, 1959; Wright, 1936). Because of their aggregate nature, progress functions can confound the effects of im- provements that do and those that do not result from growing knowledge, as well as mask their dynamics.
Managing the Rate of Progress
What is evident from an examination of progress curve studies is that the b parameter (the rate of im- provement) is neither fixed nor automatic. In many instances improvement rate is an outcome of mana- gerial policy decisions. More precisely, this parameter seems to depend partly on production decisions, part- ly on marketing decisions, and partly on joint deci- sions. Once it is realized and accepted that the rate of improvement is not a given, the question im- mediately shifts to the issue of how the rate of im- provement may be managed.
240
This content downloaded from 131.252.130.248 on Thu, 29 Aug 2013 13:31:47 PMAll use subject to JSTOR Terms and Conditions

Progress may stem from exogenous or endogenous sources and may be due to induced or autonomous learning (Levy, 1965). Induced learning requires in- vestment, induction, or resources made available that are not present in the current operating situation. Autonomous learning involves automatic improve- ments that result from sustained production over long periods. Progress induced in the short run may ap- pear autonomous in the long run, and induced learn- ing at the level of the individual employee or opera- tion may seem autonomous when aggregated over many operations. The distinction among these forms of progress must be made in the context of the time horizon and processes over which policy control is to be exerted. It can be argued that autonomous learning can be influenced by system characteristics, but the purpose here is to distinguish the relative degrees of accessibility to determinants of managerial influence. System characteristics that influence "au- tonomous" learning to some extent may be inherent, but they also may be cultural and not easily trans- ferred, such as establishing Japanese work cultures in American factories-thus the distinctions: (1) that induced learning is affected by proximate causes and autonomous learning is due to distant causes, and (2) that autonomous learning is more systematic and predictable given a set of system characteristics.
Progress due to exogenous learning usually results from information and benefits acquired from exter- nal sources such as suppliers, customers, competitors, and government (Rosenberg, 1982, Sahal, 1977; Von Hippel, 1976). Endogenous learning is attributable to employee learning within a firm as manifested by technical changes, direct-labor learning, and smoothing production flows. These distinctions are illuminated in Table 1 by means of some examples.
This 2 x 2 scheme (Table 1) modifies Levy's (1965) scheme wherein distinctions are made between in- duced learning, exogenous learning, and autonomous learning. It distinguishes among sources of progress in each of the four causal categories and suggests where progress may be influenced directly and where control may be more subtle. This scheme also dif- fers from Levy (1965) in that Levy treats random and exogenous learning as one and the same-as con- sisting of improvements that can result when firms unexpectedly acquire information from their en- vironments. But both endogenous and exogenous forms of progress can be subject to random influence (Dutton & Thomas, 1982; Sahal, 1979). By contrast,
progress from exogenous sources can be considered deterministic when a firm takes deliberate advantage of improved capital equipment or sources of material supply.
Although in these instances not well controlled for mixing of effects across cells (such absence of con- trols is typical of progress-function studies), the 2 x 2 scheme of Table 1 suggests distinct, separate origins of dynamic (and not static) cost changes. The need for research to discover separate types of learning in- fluences for each cell is suggested by frequent but un- validated assertions about the reliability and origins of firms' progress-functions such as:
One of the most reliable relationships in industrial economics is that as manufacturers move along the learning curve, unit costs fall steadily and dramatical- ly. Lifetime production volume, rather than proximity to raw materials or markets has come to be seen as the true comparative advantage of the industrial world (Kinkead, 1980, p. 54). The experience effect whereby costs fall with cumulative production is measurable and predictable; it has been observed in a wide range of products in- cluding automobiles, semiconductors, petrochemicals, long-distance telephone calls, synthetic fibres, airline transportation, the cost of administering life insur- ance, and crushed limestone, to mention a few (Abell & Hammond, 1979, p. 106). Although in many instances the evidence for an
industry or firm-level progress effect is so strong as to be obvious by inspection, this conclusion is irrele- vant to managing individual firms' progress. To predict progress from past data, progress functions must be stable, that is, subject to the same known sources of variation over time and space. But the cur- rent evidence is otherwise. On the other hand, to in- duce progress from variability, managers need doc- umented evidence for specific sources of progress variation accessible to the firm's influence.
Interactions Among Firms' Subunits
Exploiting the progress principle thus requires grasping opportunities latent in the cost dynamics of firms. These opportunities are realized through in- formational and decision processes. But relations be- tween organizational behavior and firms' progress functions are largely unexplored. By implication the incentive plan originated by Joseph Scanlon, the steelworkers' union organizer, recognized the poten- tial for inducing progress-function effects by direc- ting feedback at firms' organizational variables (Frost, Wakeley, & Ruh, 1974; Lesieur, 1958; Mc-
241
This content downloaded from 131.252.130.248 on Thu, 29 Aug 2013 13:31:47 PMAll use subject to JSTOR Terms and Conditions

Table 1 Some Examples of Four Learning Types via Which Firms May Capture Progress Effects
Autonomous Learning Induced Learning
Exogenous orgins 1. General growth in scientific and technical knowledge that flows 1. Learning of capital goods' suppliers induced by the users' experi-
freely into the firm (Nelson & Langlois, 1983); ence with the equipment (Joskow & Rozanski, 1979; Von Hippel, 1976);
2. Continuously improving productivity garnered when a firm peri- 2. Investment in improved capital goods in order to hasten the rate odically replaces its equipment (Arrow, 1962). of progress (Hollander, 1965; Searle & Goody, 1945);
3. Copying and adapting the technological innovation of a successful competitor (Mansfield, 1961; Tinnin, 1983).
Endogenous origins 1 . Direct-labor learning due to the "practice-makes-perfect" princi- 1. Increased tooling (Chassen, 1945; Conway & Schultz, 1959;
ple or wage-incentive plans (Conway & Schultz, 1959; Lundberg, Wright, 1936); 1961);
2. Routine production planning (Baloff 1966b, 1970; Conway & 2. Manufacturing process changes (Crawford & Strauss, 1947; Mid- Schultz, 1959; Nadler & Smith, 1963). dleton, 1945);
3. Model or product design changes to effect efficiencies in produc- tion (Billon, 1966; Conway & Schultz, 1959; Wright, 1936).
Gregor, 1960; Whyte, 1955). W. Edwards Deming's work in quality control and productivity, first with Japanese and later with American firms, also implies inducing dynamic progress via organizational variables ("Dr. Deming shows Pontiac the way," 1983).
Because most causal factors of progress functions cut across organizational subunit lines, intraorganiza- tional relations may influence progress effects. Some opportunities can be acted on separately by func- tional units of the firm. But, more often, strong in- teraction terms are present among firms' subunits in finding and acting on cost-reduction dynamics. Two subunits typically having high potential for joint in- volvement in managing the cost dynamics of progress are marketing and production. Progress-function and other studies reveal the potential for such joint de- cisions in each of the four main causal categories. Capacity planning, sales forecasting, production scheduling, quality assurance, and new product in- troduction are typical areas in which interface is need- ed on a routine basis between marketing and pro- duction managers (Hayes & Wheelwright, 1979; Lawrence & Lorsch, 1967; McCann & Galbraith, 1981; Shapiro, 1977; Skinner, 1979; Walton & Dut- ton, 1969). Emphasized here is joint policy control in gaining progress benefits, because the nature of progress dynamics is such that marketing and manufacturing cannot be handled independently and induce high rates of cost improvement.
A producer can induce progress by reinvesting such that the effects of the capital goods supplier's ex- perience (via the improved products) are garnered. The extent and timing of investment may be key de- terminants of improvement. Effective management of this variable probably is affected by industry con- centration, levels of competition, and other industry characteristics. Close interface on these investment decisions is called for between marketing and manu- facturing, because decisions on reinvestment in capital goods depend on capital costs, disposal values, and expected net earnings from new equip- ment. And these earnings, in turn, depend on the pro- ductivity of equipment and future sales of products.
Studies of capital goods investment decisions have not recognized the serial-capital goods effect of Ar- row (1962) and hence do not explore its potential for business strategy. In systems in which capital spend- ing is a dominant policy variable, the association of increased market share and subsequently greater cumulative volume with experience could lead mana- gers to overlook and misjudge sources of experience. To date, the relationships among the age of capital goods employed, the degree of improvement in newly available capital goods, and progress effects has not been formally studied. However, studies of produc- tivity in industries such as rayon, chemicals, and nuclear power (Hollander, 1965; Hufbauer, 1966; Joskow & Rozanski, 1979) shed light on the dynamics of technological improvement via capital goods (Leiberman, 1982).
242
This content downloaded from 131.252.130.248 on Thu, 29 Aug 2013 13:31:47 PMAll use subject to JSTOR Terms and Conditions
Hollander's study (1965) of Dupont's rayon manu- facture found:
1. Technological change was closely linked with in- vestment in plant and equipment and replacement was more important than investment in new facilities.
2. Investment in indirect technological changes (designed to "permit the production of higher out- put levels from substantially unchanged plant facilities") had greater impact on cost reduction than did investment in direct technological change (i.e., change designed to "permit the production of given output levels at lower total costs").
3. The cumulative effect of minor technological changes usually was much greater than that of ma- jor changes. Minor changes effected by technical and engineering personnel, often in cooperation with capital goods suppliers, accounted for most of the productivity gains.
Although these findings are partly industry specific, they are useful in revealing firms' cost dynamics. In a study of nuclear power plants, Jos- kow and Rozanski (1979) found the relative impact of major and minor changes to be somewhat dif- ferent. Workers effected minor improvements by learning to use and maintain equipment more effi- ciently. But such progress reaches a stage of dimi- nishing returns. Eventually a major improvement occurs when the system regenerates itself with im- proved capital goods. Such improvements results from capital goods' suppliers learning from their own as well as from purchasers' experience, and from general technological advances (Shen, 1981).
These findings suggest areas in which policy con- trol can be exerted. Decisions of replacement versus new investment and the timing of such investment are closely allied with expected future sales. Produc- tion makes decisions on regular maintenance and re- placement of equipment, but it needs to make joint decisions with marketing in order to garner learning effects inherent in newly available capital goods. Whether induced progress via improved capital goods should be direct or indirect (in the sense defined by Hollander) depends on expected earnings. If signifi- cantly greater progress can stem from indirect tech- nological change, then, because it means output ex- pansion, marketing needs to seek greater opportu- nities. Conversely, in periods of growth either by in- creasing market share or because of growth of pri- mary demand for the product, opportunities for progress via indirect technological change and via
scale economies seem numerous. In the absence of demand growth, and if there are unpredictable fluc- tuations in demand, direct changes may be the most profitable. Erratic demand patterns require technological change that allows the flexibility to pro- duce a range of volumes efficiently. Of course, suitable policies for both production and marketing must lie within the framework of the firm's overall strategy. But recognition of areas in which the two can exert joint influence to induce progress is a start- ing point for using the progress-function concept.
If local firm and industry characteristics are such that the cumulation of minor technological changes has greater impact than a major change, then oppor- tunities usually arise that production can exploit alone, independent of marketing. Problems arise in routine manufacturing operations that lead to inter- action between capital goods suppliers and users and subsequently results in learning via technological improvements.
Progress stemming from factors in the Horndal (labor learning) effect can be divided into induced and autonomous. It can be further divided into policy areas that require production decisions alone and those that require joint decisions. Production makes decisions on personnel and shop management, but both production and marketing criteria influence scheduling decisions and inventory practices. These decisions can facilitate autonomous learning. Such learning results from routine production planning and the "practice makes perfect" principle. Produc- tion also can induce progress more directly. Indirect labor and technical personnel in production can directly induce progress via increased tooling and changes in process design (Dutton & Thomas, 1982).
An area in which marketing and production can jointly induce progress effects is product design. A change in product design may occur endogenously because of insights by technical personnel wherein a new design makes production easier and less cost- ly. Marketing then needs to explore product accep- tance issues and price differentials that may be ob- tained. This, in turn, will determine the investment that production ought to make in a new product design. On the other hand, a change in product design may stem from exogenous sources as when it is dictated by external market considerations. In this case, improvement would depend on the level of technical expertise and familiarity with the new
243
This content downloaded from 131.252.130.248 on Thu, 29 Aug 2013 13:31:47 PMAll use subject to JSTOR Terms and Conditions
design. Again, close interface and joint decisions are needed to exploit existing opportunities. The two also can jointly influence progress effects in the area of product quality. Quality improvements can be seen largely as an internal production function. But the investment to be made in inducing benefits and prog- ress depends on policies with regard to product posi- tioning and price, policies largely in the marketers' area.
Policy control over local system characteristics could affect progress either by direct inducement or by facilitating autonomous learning. Internal design variables, such as the degree of mechanization, the ratio of assembly to machining labor and the length of work-cycle times, can be controlled by production alone to influence progress. On the other hand, mar- keting directly influences policy decisions with regard to factors such as the firm's preferred customers and its product mix, factors that can significantly affect scale economies and progress effects.
Local characteristics vary greatly in their accessi- bility to managerial influence. Organizational design and structure, plant design, work cultures, and so on usually are less accessible and more difficult to transform once established. Nevertheless, they are components of local systems that affect progress by contributing to (or detracting from) several forms of autonomous improvement. But here, too, opportu- nities arise to effect beneficial changes such as redesign of organizational structure to delineate areas of joint production and marketing policy control to induce progress.
The effects of scale and progress are so closely in- tertwined that separation of the two often is a dif- ficult task. But scale economies (and their contribu- tion to progress effects) represent an area in which numerous opportunities arise for inducing progress. Economies from varying techniques of production for different volumes of output can be realized only if volume is known in advance. In order to induce this aspect of progress, interface and cooperation be- tween marketing and manufacturing is essential. Economies that might result from increasing the pro- duction rate or from reducing the variance in pro- duction rates (i.e., smoothing production flow) also suggest the need for substantial cooperation between the two functions. Scale effects also are confounded with those of technological change in cases in which improvements in plant and capital equipment coin- cide with increases in plant scale. Sometimes scale
expansions directly result from learning, as often is the case when bottlenecks are eliminated from ex- isting plants (Lieberman, 1082). Clearly, the market implications of these expansions and expected future dynamics cannot be divorced from the production decisions.
Progress as a Continuous Phenomenon
The causal factors discussed here reveal that prog- ress in the form of continuous cost improvements may occur autonomously or may be induced. The progress curve is an aggregation of several static and dynamic improvements. Unearthing its causal factors and complex underlying dynamics reveals that mana- gers who wish to use the progress curve are faced with the task of identifying as well as taking advantage of both static and dynamic opportunities. Sources of dynamic improvement further divide into those that are relatively short run in value and those that are long run changes. In many systems the progress curve approaches a limit if autonomous learning constitutes the only component of improvement. Even induced learning eventually asymptotes and requires further investments if progress is to continue. The literature provides numerous examples of this phenomenon (Baloff, 1966a; Chassan, 1945; Conway & Schultz, 1959; Guibert, 1945).
Policymakers who seek to induce progress need to explore gains from factors that yield short run prog- ress as well as those that are long run in nature. In- ducing progress can be thought of as a continuous process of adaptation (Argris, 1977). Improved tool- ing that yields economies is a form of adaptation that is relatively short run in value; progress-inducing in- vestment in improved capital goods is a long run adaptation. A firm that seeks to manage progress ef- fects so as to gain competitive advantages confronts several issues:
1. Does the cumulative effect of regular short run adaptations or inducements yield significant prog- ress relative to a long run inducement?
2. When does the cumulative progress due to short run inducements asymptote?
3. When and how does the system have to be regen- erated in order that progress may continue?
Most systems display a pattern of several short run adaptations that are periodically "interrupted" by a significant long run adaptation. The causal factors of progress discussed here fall into one or the other of these categories based on industry, firm, techno-
244
This content downloaded from 131.252.130.248 on Thu, 29 Aug 2013 13:31:47 PMAll use subject to JSTOR Terms and Conditions
logical, and market characteristics. Investments in improved capital goods, changes in organizational and plant designs, major scale changes in the "fixed" factors of production (such as capital goods, absolute plant size, average direct labor employment), and most changes in product design are designed to effect long run improvements and position the firm to proceed down a progress curve that is different from the current one. On the other hand, most fac- tors in the Horndal effect, scale effects that arise from routine operations and, minor technological im- provements in equipment (Hollander, 1965), can be considered short run adaptations.
In the diverse literature on progress functions and their use, the causal factors underlying progress vary widely. In general, economists emphasize technolo- gical change in capital goods and scale economies as the primary causes of progress. Studies in the in- dustrial engineering and management literature focus on factors in the Horndal effect and local system characteristics. The emphasis on dynamics also varies significantly. For instance, Levy (1965) incorporates the asymptotic property of the progress function and treats progress as consisting of essentially one-time adaptations to a predetermined target. Arrow (1962), on the other hand, emphasizes serially-improving ca- pital goods and their continuous impact on progress. Studies of organizational effectiveness are not strictly progress-function studies, but their concerns include learning and progress. They are essentially static in nature, and learning is treated as a step function that changes the system from one steady-state to another (Miles, 1980; Nadler & Tushman, 1977).
Without an understanding of how different causal factors interact and influence firms' cost dynamics, prescriptions for using the progress principle, have limited value. The literature lacks longitudinal studies that control for different factors, thus isolating re- lative effects. The state of the art does yield a frame- work for managerial use in exploring different bases of progress and in considering impacts of organiza- tion on progress effects. Inducing progress reduces to a problem of return on investment; a firm's maxi- mum spending to induce progress depends on the
profits required from a given strategy, for which the costs of inducing progress are reflected in the strategy's expenditure stream.
Conclusions
Traditional progress functions are limiting in im- plying that manipulation of costs is best attained by maximizing cumulative volume of output. Contrary to widespread assertion, the rate of improvement b in a firm's traditional progress function of the form y = ax- b cannot be relied on as a constant based on past performance. Instead, it needs to be treated as a dependent variable influenced by a firm's behavior regarding a set of causal factors. An examination of five decades of progress-function studies reveals four causal categories underlying firms progress ratios. Varying between origins internal or external to firms, these causal factors also differ in how they arise, by being induced or autonomously. Reexamining firms' historical progress functions in this light illuminates factors that may be emphasized and controlled to meet firms' future progress-rate goals. In highlighting the dynamics underlying progress, this approach also indicates factor combinations that may need to vary from past practice to achieve future progress goals. Decisions regarding progress rates involve a priori in- vestment considerations as well as ex post implemen- tation issues.
Approaching firms' progress functions in this fash- ion reveals the absence of studies linking dynamic cost progess with organizational behavior. Because of the interdependence among causes of progress and because these causes cut across firms' hierarchical and subunit as well as organization-environment boundaries, a combining analysis of progress-func- tion and organizational behavior variables constitutes a research opportunity. Relations among firms' ma- jor subunits, such as between production and mar- keting, may significantly affect progress rates. Ex- amining such interunit relations in terms of four causes of progress suggest a wide range of oppor- tunities for research and application on progress functions and their uses.
References Abell, D. F., & Hammond, J. S. Strategic market planning.
Englewood Cliffs, N.J.: Prentice-Hall, 1979.
Alchian, A. Costs and outputs. In M. Abramovitz (Ed.), The allocation of economic resources: Essays in honor of B. F. Haley. Stanford, Cal.: Stanford University Press, 1959, 23-40.
Alchian, A. Reliability of progress curves in airframe production. Econometrica, 1963, 31, 679-693. (Also, Rand report 260-1, 1950).
Andress, F. J. The learning curve as a production tool. Harvard Business Review, 1954, 32(1), 87-97.
245
This content downloaded from 131.252.130.248 on Thu, 29 Aug 2013 13:31:47 PMAll use subject to JSTOR Terms and Conditions

Argyris, C. Double loop learning in organizations. Harvard Business Review, 1977, 55(5), 115-125.
Arrow, K. J. The economic implications of learning by doing. Review of Economic Studies, 1962, 29, 166-170.
Asher, H. Cost-quantity relationships in the airframe industry, R-291. Santa Monica, Cal.: The Rand Corporation, 1956.
Baloff, N. Startups in machine-intensive production systems. Jour- nal of Industrial Engineering, 1966a, 17(1), 25-32.
Baloff, N. The learning curve-Some controversial issues. Jour- nal of Industrial Economics, 1966b, 14, 275-282.
Baloff, N. Startup management. IEEE Transactions on Engineer- ing Management, EM-17, 1970, 132-141.
Baloff, N. Extensions of the learning curve-Some empirical results. Operational Research Quarterly, 1971, 22(1), 329-340.
Bass, F. M. The relationship between diffusion rates, experience curves, and demand elasticities for consumer durable technical innovations. Journal of Business, 1980, 53, 551-567.
Billon, S. A. Industrial learning curves and forecasting. Manage- ment International Review, 1966, 6(6), 65-96.
Boston Consulting Group. Perspectives on experience. Boston, Mass.: Boston Consulting Group, 1970.
Carr, G. W. Peacetime cost estimating requires new learning curves. A viation, April 1946, 76-77.
Chassan, J. Estimating direct labor cost in aircraft production. Industrial Aviation, July 1945, 56-63.
Child, J. Organization structure, environment and performance: The role of strategic choice. Sociology, 1972, 6, 1-22.
Conley, P. Experience curves as a planning tool. In Experience curves as a planning tool: A special commentary. Boston Con- sulting Group, 1970. Reprinted in R. Rothberg (Ed.), Corporate strategy and product innovation. New York: Free Press, 1976, 307-318.
Conway, R. W., & Schultz, A. The manufacturing progress func- tion. Journal of Industrial Engineering, 1959, 10(1), 39-54.
Corey, E. R. Key options in market selection and product plan- ning. Harvard Business Review, 1975, 53(5), 119-128.
Crawford, J. R., & Strauss, E. Crawford-Strauss study. Dayton, Ohio: Air Material Command, 1947.
Dolan, R. J., & Jeuland, A. P. Experience curves and dynamic demand models: Implications for optimal pricing strategies. Journal of Marketing, 1981, 45(1), 52-62.
Dr. Deming shows Pontiac the way. Fortune, April 18, 1983, p. 66.
Dutton, J. M., & Thomas, A. Progress functions and production dynamics. Working paper, Graduate School of Business Ad- ministration, New York University, 1982.
Enis, B. M. GE, PIMS, BCG, and the PLC. Business, 1980, 30(3), 10-18.
Frost, C. F., Wakeley, J. H., & Ruh, R. A. The Scanlon plan for organization development: Identity, participation and equity. Lansing, Mich.: Michigan State University Press, 1974.
Gold, B. Changing perspectives on size, scale, and returns: An interpretive survey. Journal of Economic Literature, March 1981, 19, 5-33.
Guibert, P. Le plan de fabrication ae'ronautique. Paris: Dunon, 1945.
Hall, W. K. Survival strategies in a hostile environment. Harvard Business Review, 1980, 58(5), 75-85.
Hammermesh, R. G., Anderson, M. J., Jr., & Harris, J. E. Strategies for low market share businesses. Harvard Business Review, 1978, 56(3), 95-102.
Hartley, K. The learning curve and its application to the aircraft industry. Journal of Industrial Economics, 1965, 13(2), 122-128.
Hayes, R. H., & Wheelwright, S. C. The dynamics of process- product life cycles. Harvard Business Review, 1979, 57(2), 127-136.
Henderson, J. M., & Quandt, R. E. Microeconomic theory: A mathematical approach. New York: McGraw Hill, 1980.
Hirsch, W. Z. Manufacturing progress functions. Review of Economic and Statistics, 1952, 34(2), 143-155.
Hirsch, W. Z. Firm progress ratios. Econometrica, 1956, 24, 136-144.
Hirschleifer, J. The firm's cost function-A successful reconstruc- tion. Journal of Business, 1962, 35, 235-255.
Hirschmann, W. B. Profit from the learning curve. Harvard Business Review, 1964, 42(1), 135-139.
Hofer, C. W., & Schendel, D. Strategy formulation: Analytical concepts. St. Paul, Minn.: West, 1978.
Hollander, S. The sources of increased efficiency: A study of Du- Pont rayon plants. Cambridge, Mass.: M.I.T. Press, 1965.
Howell, S. D. Learning for new products. Industrial Marketing Management, 1980, 9(2), 97-99.
Hufbauer, G. Synthetic materials and the theory of international trade. Cambridge, Mass.: Harvard University Press, 1966.
Joskow, P. L., & Rozanski, G. A. The effects of learning by do- ing on nuclear plant operating reliability. Review of Economics and Statistics, 1979, 61(2), 161-168.
Kiechel, W., III. The decline of the experience curve. Fortune, October 3, 1981, pp. 139-145.
Kinkead, G. An American company Honda can't mow down. For- tune, July 28, 1980, pp. 54-55.
Lawrence, P. R., & Lorsch, J. W. Differentiation and integra- tion in complex organizations. Administrative Science Quarterly, 1967, 12, 1-47.
Lesieur, F. G. What the plan isn't and what it is. In F. G. Lesieur (Ed.), The Scanlon plan... A frontier in labor-management cooperation. Cambridge, Mass.: M.I.T. Press, 1958, 34-49.
Levy, F. K. Adaptation in the production process. Management Science, 1965, 11, B136-B154.
Lieberman, M. B. The learning curve, pricing, and market struc- ture in the chemical processing industries. Doctoral dissertation, Harvard University, 1982.
246
This content downloaded from 131.252.130.248 on Thu, 29 Aug 2013 13:31:47 PMAll use subject to JSTOR Terms and Conditions
Lippman, S. A., & Rumelt, R. P. Uncertain imitability: An analysis of interfirm differences in efficiency under competition. The Bell Journal of Economics, 1982, 13, 418-438.
Lundberg, E. Produktivitet och rantabilitet. Stockholm, Sweden: P.A. Norstedt and Soner, 1961.
McCann, J., & Galbraith, J. R. Interdepartmental relations. In P. C. Nystrom & W. H. Starbuck (Eds), Handbook of organiza- tional design (Vol. 2). New York: Oxford University Press, 1981, 60-84.
McGregor, D. The human side of enterprise. New York: McGraw- Hill, 1960.
Mansfield, E. Technical change and the rate of imitation. Econometrica, 1961, 29, 741-766.
Middleton, K. Wartime productivity changes in the airframe in- dustry. Monthlv Labor Review, 1945, 61, 215-225.
Miles, R. H. Macro organizational behavior. Glenview, Ill.: Scott, Foresman, 1980.
Nadler, D. A., & Tushman, M. L. A diagnostic model for organizational behavior. In J. R. Hackman, E. E. Lawler, & L. W. Porter (Eds.), Perspectives on behavior in organizations. New York: McGraw-Hill, 1977, 85-98.
Nadler, G., & Smith W. D. Manufacturing progress functions for types of processes. International Journal of Production Research, 1963, 12(2), 115-135.
Nelson, R. R., & Langlois, R. N. Industrial innovation policy: Lessons from American history. Science, 1983, 219, 814-819.
Patel, P., & Younger, M. A frame of reference for strategy development. Long Range Planning, 1978, 11(2), 6-12.
Porter, M. E. Competitive strategy. New York: Free Press, 1980.
Preston, L., & Keachie, E. C. Cost functions and progress func- tions: An integration. American Economic Review, 1964, 54, 100-107.
Rapp, W. V. Strategy formulation and international competition Columbia Journal of World Business, Summer 1973, 98-112.
Robinson, B., & Lakhani, C. Dynamic price models for new prod- uct planning. Management Science, 1975, 10, 1113-1122.
Rosenberg, N. Learning by using. In N. Rosenberg (Ed.), Inside the black box: Technology in economics. New York: Cambridge University Press, 1982, 120-140.
Sahal, D. The multidimensional diffusion of technology. Technological Forecasting and Social Change, 1977, 10, 277-298.
Sahal, D. A theory of progress functions. AIEEE Transactions, 1979, 11, 23-29.
Searle, A. D., & Goody, C. S. Productivity increases in selected wartime shipbuilding programs. Mkonthly Labor Review, 1945, 61, 1132-1147.
Shapiro, B. Can marketing and manufacturing coexist? Harvard Business Review, 1977, 55(5), 104-114.
Shen, T. Y. Technology and organizational economics. In P. C. Nystrom & W. H. Starbuck (Eds.), Handbook of organizational design, (Vol. 1). New York: Oxford University Press, 1981, 268-289.
Sheshinski, E. Tests of the learning by doing hypothesis. Review of Economics and Statistics, 1967, 49, 568-578.
Skinner, W. Manufacturing-Missing link in corporate strategy. Harvard Business Review, 1969, 47(3), 136-145.
Starbuck, W. H., & Dutton, J. M. Designing adaptive organiza- tions. Journal of Business Policy, 1973, 3(4), 21-28.
Tinnin, D. B. How IBM stung Hitachi. Fortune, March 7, 1983, pp. 50-56.
Von Hippel, E. The dominant role of users in the scientific in- struments innovation process. Research Policy, 1976, 5(3), 212-239.
Walton, R. E., & Dutton, J. M. The management of interdepart- mental conflict: A model and review. Administrative Science Quarterly, 1969, 14, 73-84.
Whyte, W. F. Money and motivation, New York: Harper, 1955.
Woo, C. Y., & Cooper, A. C. The surprising case for low market share. Harvard Business Reviewv, 1982, 60(6), 106-113.
Wright, T. P. Factors affecting the cost of airplanes. Journal of Aeronautical Sciences, 1936, 3(4), 122-128.
Yelle, L. E. The learning curve: Historical review and comprehen- sive survey. Decision Sciences, 1979, 10, 302-328.
Young, S. L. Misapplications of the learning curve concept. Jour- nal of Industrial Engineering, 1966, 17(8), 410-415.
John M. Dutton is Professor of Management in the Graduate School of Business Administration, New York University.
Annie Thomas is Assistant Professor of Management in the Graduate School of Business Administration, New York University.
247
This content downloaded from 131.252.130.248 on Thu, 29 Aug 2013 13:31:47 PMAll use subject to JSTOR Terms and Conditions