travel strategic sourcing july 20, 2011 virginia business travel association
TRANSCRIPT

Travel Strategic Sourcing
July 20, 2011
Virginia Business Travel Association
Page: 2
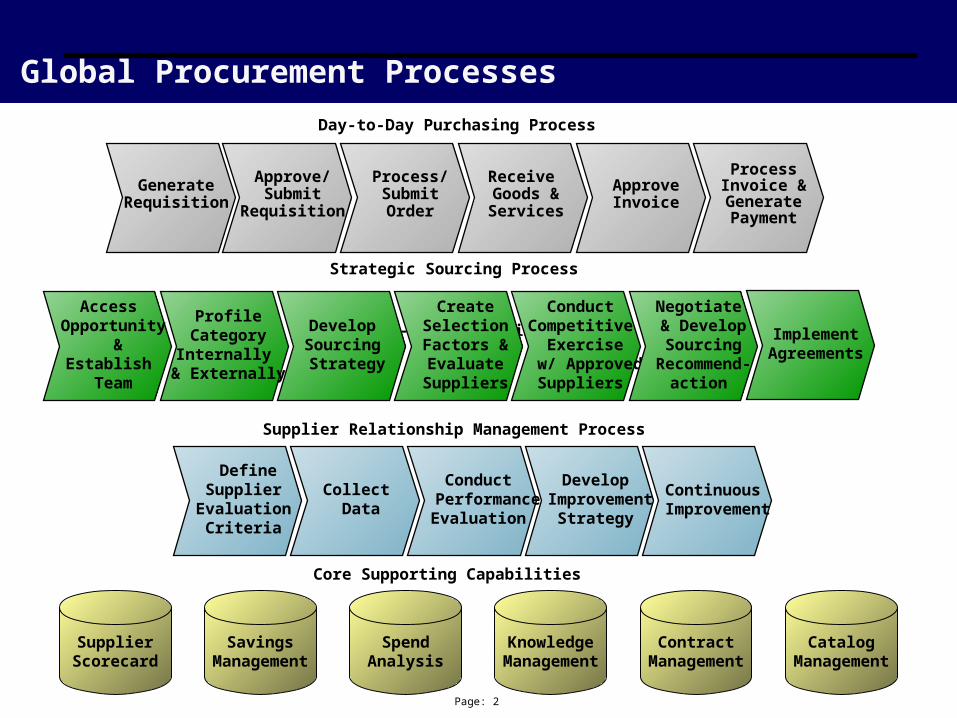
Global Procurement Processes
DefineSupplier
EvaluationCriteria
Collect Data
Conduct Performance
Evaluation
Develop Improvement
Strategy
Supplier Relationship Management Process
GenerateRequisition
Approve/Submit
Requisition
Process/SubmitOrder
Receive Goods &Services
ApproveInvoice
ProcessInvoice &GeneratePayment
Day-to-Day Purchasing Process
Strategic Sourcing Process
Access Opportunity
&Establish
Team
ProfileCategoryInternally
& Externally
Develop Sourcing Strategy
CreateSelectionFactors &EvaluateSuppliers
ConductCompetitive
Exercise w/ Approved
Suppliers
Negotiate & Develop Sourcing
Recommend-action
ImplementAgreements
Continuous Improvement
SupplierScorecard
SavingsManagement
SpendAnalysis
KnowledgeManagement
ContractManagement
CatalogManagement
Core Supporting Capabilities
Day-to-Day Purchasing Process

Page: 3
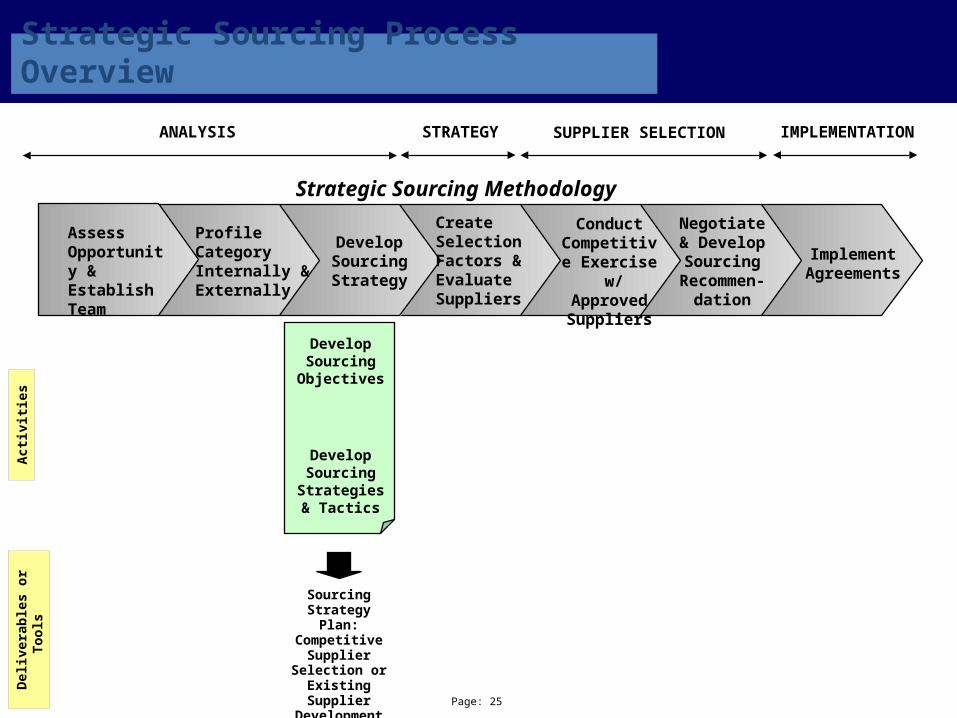
Strategic Sourcing Process Overview
ProfileCategoryInternally &Externally
CreateSelectionFactors &EvaluateSuppliers
Negotiate & Develop Sourcing
Recommend-action
ImplementAgreements
Strategic Sourcing Methodology
Act
ivit
ies
Del
iver
able
s o
r To
ols
Validate Internal
Requirements & Profile Category
ConductIndustry Analysis
Internal Category Profile
TCO Model
Cost Reduction Ideas
Industry Profile
Build TCO Model
Develop Sourcing
Objectives
Sourcing Strategy Plan: Competitive
Supplier Selection or
Existing Supplier
Development
Conduct Supplier Analysis
Create Supplier Selection Criteria
Supplier Selection
Decision Matrix
RFIs (optional)
“Short List” of Suppliers
Complete Traditional
RFP Process
RFPs / RFQs
eAuctions
Collaborative Discussions
Conduct eAuction(s)
Collaborate w/ Incumbent Supplier(s)
- AND/OR -
- AND/OR -
Prepare Fact-Based
Negotiation Packages
Negotiate Agreements
Fact-Based Negotiation Packages
Supplier Negotiations Presentation
Sourcing Recommendation
Finalized Agreements
Benefits Realization
Continual Supplier
Improvement
Implement Agreements and Monitor
KPIs
Evaluate Performance and Develop
Suppliers
Develop SourcingStrategy
Conduct Competitive Exercise w/ ApprovedSuppliers
Fast Track for Quick Savings
Develop Sourcing
Strategies & Tactics
ANALYSIS STRATEGY SUPPLIER SELECTION IMPLEMENTATION
AssessOpportunity & Establish Team
AssessOpportunity
Obtain Sponsorship
& ID Team
CreateProject
Plan
Project Plan
Analyze Current Spend
Document Requirements

Page: 4
Travel Category Opportunity
SAMPLE
Category Opportunity Baseline – Travel
Key Travel Contracts and Expiration Dates Preliminary Opportunities to Drive Accelerated Benefit
•Hertz Car Rental Agreement – Expiration Date: July 31, 2010•Northwest Airlines Agreement – Expiration Date: November 30, 2010•American Express Travel Agency Agreement – Expiration Date: September 30, 2009 – Currently Extended until September 30, 2010, with an additional 1 year extension (2011).
•Mandated Travel & Entertainment Policy•Drive Demand Management (Compliance Behavior):
•On-Line Booking Tool•Advance Ticket Purchase•Non-Refundable Tickets•Preferred Hotel usage•Preferred Car Rental usage
•Hotel Competitive Bid•Negotiate American Airlines contract•Car Rental Competitive Bid
Confirmation of Sourceable Spend
Sourcing Group
Category Sub-CategoryAddressable
Spend%
AddressableSourceable
SpendEst. Mid
Saving %Est. Mid
Savings $
Travel Airline $6,000,000 100% $5,500,000 3% $165,000
Travel Car Rental $1,000,000 100% $925,000 5% $46,250
Travel Hotel $4,500,000 100% $4,400,000 5% $220,000
Travel Agency - Agency Fees $170,000 100% $0 0% $0
TravelDemand Management (Compliance) N/A N/A $700,000
SAMPLE

Page: 5
Strategic Sourcing Process Overview
ProfileCategoryInternally &Externally
CreateSelectionFactors &EvaluateSuppliers
Negotiate & Develop Sourcing
Recommen-dation
ImplementAgreements
Strategic Sourcing Methodology
Act
ivit
ies
Del
iver
able
s o
r To
ols
Validate Internal
Requirements & Profile Category
ConductIndustry Analysis
Internal Category Profile
TCO Model
Cost Reduction Ideas
Industry Profile
Build TCO Model
Develop SourcingStrategy
Conduct Competitive Exercise w/ ApprovedSuppliers
ANALYSIS STRATEGY SUPPLIER SELECTION IMPLEMENTATION
AssessOpportunity & Establish Team
Page: 6
Industry Profile - Objective & Key Questions
Objective
Provide a detailed understanding of the current corporate travel industry as well as the forces shaping future travel services. The results of this profile will shape Comerica’s travel Sourcing Strategy.
Key Questions
How big is the industry?
Who are the major players?
How competitive is the market?
What are the key cost drivers?
Is the industry in a state of growth or decline?
What are the current pricing trends?
SAMPLE

Page: 7
Travel Scope
NAICS 481 – Transportation by Air
4811 – Scheduled Air Transportation
481111 – Scheduled Passenger Air Transportation
NAICS 721 – Accommodation
7211 – Traveler Accommodation
721110 – Hotels and Motels 721110.1 Guestroom Rental
NAICS 5321 – Automotive Equipment Rental
53211 – Passenger Car Rental and Leasing
532111 – Passenger Car Rental
NAICS 561 – Administrative and Support Services
5615 – Travel Arrangement and Reservation Services
561510 – Travel Agencies (including Meetings & Events)
In Scope
• Scheduled passenger air transportation, hotel, passenger car rentals and meeting/event planning services are in scope for travel sourcing.
• Because of the existing relationship with American Express One and the subsequent process standardization, it does not make sense to fully source the travel agency component of travel at this time. However, there may be components of the contract to reevaluate.
• Meeting/Event Planning Services are categorized under the same NAICS code as Travel Agencies.
Key Points
The travel industry encompasses a variety of different categories each grouped with an NAICS (North American Industry Classification System) code.
Source: http://www.bls.gov
SAMPLE

Page: 8
Airline Industry: Overview
• Collective operating revenue for the global airline market is forecasted at $545 Billion, up 13% from $483 Billion in 2009. The operating revenue for the US airline industry in 2009 was over $107 Billion.
• Delta, American and United are the market leaders based on revenue
• 9 Airlines comprise 86% of the market. The major players control market share and have power in the industry
• In 2009, the Top 4 airline’s net earnings were -$3.6 Billion, while AirTran, Alaska, Southwest and JetBlue earned $414 Million total.
• For 2010, IATA forecasts a $15.1 Billion profit for the global airline industry. North American carriers are expected to earn $5.1 Billion.
• For 2011, Airlines may see smooth upward progression being interrupted as oil and jet fuel prices rise and some economies in Europe look set to be driven back into recession by debt crises. However, IATA is forecasting a $9.1 Billion profit globally, and $3.2 for North American carriers.
• Airlines, as part of corporate negotiations, are starting to tighten up on granting frequent flyer elite status.
Top US Airlines By Revenues Key Points
Source: Travel Procurement, March 2010, Airline Financials.com, March 21, 2010, www.bloomberg.com, June 7, 2010, IATA, Wikipedia
Collective operating revenue for the global airline market is forecasted at $545 Billion, up 13% from $483 Billion in 2009. The US market amounted to over $107 Billion in 2009
SAMPLE
Delta
Amer
ican
United
Contin
enta
l
South
west
US Airw
ays
Alaska
Airw
ays
Jet B
lue
Air Tra
n$0
$5
$10
$15
$20
$25
20
09
Re
ve
nu
es
(in
Bil
lio
ns
)

The PPI (measures average change in prices over time) for passenger air transportation has decreased 8% since the end of 2009 indicating decreased costs primarily driven by lower fuel prices, but recently have gained an average of 15% back in 2011.
Airline Industry: PPI (Producer Price Index) – Scheduled Passenger Air Transportation
NAICS 481111 March – June 2011 Preliminary. All indexes are subject to revision four months after original publication.
Source: http://www.bls.gov/ppi/
2000
2001
2002
2003
2004
2005
2006
2007
2008
2009
2010
01/1
102
/11
03/1
104
/11
05/1
106
/11
180
200
220
240
260
280
186.5
200.6 200.4
205.7 205.8
217.1
229.6
234.5
257.1
235.9
254.6
260.6264.8
279.9277.9
272.1273
Pro
du
ce
r P
ric
e In
de
x
2011 Data

Page: 10
Airline Industry: Cost Drivers
Sources: Air Transport Association (http://www.airlines.org/econ
Cost Drivers Key Points• Jet Fuel: In 2009, Fuel prices were at record
highs. For 2010, fuel prices have decreased but are slowly rising again. Each penny increase in the price of a gallon of jet fuel adds $190 million in additional fuel costs
• Aircraft Age & Type: Fuel consumption is directly impacted by an aircraft’s age. Standardization of aircraft fleet assists airlines in reducing inventory and maintenance costs
• Distribution: This is a tiered cost for airlines, ranging from proprietary websites to GDS transaction costs
• Labor: In 2010, labor cost has exceeded fuel cost even though many airlines have been slashed due to reshaping labor structure, such as redundancies, sickness pay review, bonuses
• Other: These costs include insurance, utilities, office supplies, advertising and promotions, communication, personnel expenses, injuries, loss and damage, interrupted trips expenses, etc.
Airline costs consist of fuel, landing fees, aircraft, staffing costs, taxes and surcharges.
SAMPLE
0%
10%
20%
30%
40%
50%
60%
70%
80%
90%
100%
25.4%
24.7%
6.7%
8.3%
4.4%2.2%1.7%1.6%1.2%
23.8%
OTHER OP. EXPENSES implicit GDP deflator: 23.8% (Sept - 24.5%)
PASSENGER COMMISSIONS as % of passenger revenue: 1.2%
FOOD & BEVERAGE per RPM: 1.6% (Sept - 1.4%)
MAINTENANCE MATERIAL per revenue aircraft hour: 1.7%
LANDING FEES per capacity ton landed: 2.2%
NON-AIRCRAFT OWNERSHIP per enplanement: 4.4% (Sept - 4.8%)
PROFESSIONAL SERVICES per ASM: 8.3%
AIRCRAFT OWNERSHIP per operat-ing seat: 6.7% (Sept - 7.2%)
LABOR per FTE: 24.7% (Sept - 24.7%)
FUEL per gallon: 25.4% (Sept - 23.5%)

Page: 11
Airline Industry: Jet Fuel Costs
• Historically jet fuel expenses have ranged between 10% and 15% of U.S passenger airline operating costs, but in 2008 the cost of fuel was between 305 – 40% of total operating expenses for most carriers
• Year 2000 versus 2008: a 380% increase in jet fuel prices
• At the end of 2008, jet fuel had traded at record levels above $128.94 a barrel compared with an average of $88.28 in 2007, an increase of 45%
• In 2008, every dollar increase per barrel (42 gallons) drove an additional $448M in fuel expenses to carriers’ bottom lines
• Jet fuel prices decreased in 2009 to an average of $79.66, increased to $91.40 for 2010, but 2011’s average for jet fuel is at $128 per barrel
• Thru May 2011, domestic carriers consumed 4.5B gallons of jet fuel, costing $13B, a 28% increase over 2010 YTD
Increasing Jet Fuel Costs Key Points
Sources: www.airlines.org, www.bts.gov, www.iata.orgAMEX Business Travel 2010 Forecast & Trends, BTN June 1, 2009
Fuel is one of the largest cost contributor to airlines’ operating costs.
SAMPLE
2000 2001 2002 2003 2004 2005 2006 2007 2008 2009 2010$0
$20
$40
$60
$80
$100
$120
$140
$33.87
$32.64
$30.01$35.67
$48.53
$69.84
$82.60 $88.28
$128.94
$79.66
$91.40
Av
era
ge
Pri
ce
Pe
r B
arr
el

Page: 12
Airline Industry: Air Travel Price Index
Sources: Bureau of Transportation Statistics, AMEX, Procurement.Travel, August & September 2010, The Transnational.travel
Air Travel Price Index for Newport News/Williamsburg, Norfolk/Virginia
Beach, and Richmond1
Key Points
1 The air travel price index measures the percents change over time in prices paid by travelers.
2001 to 2010 Q4
• Historically, air travel prices originating from Spokane is considerably lower than the US average, however the gap has decreased significantly.
• CWT’s 2011 forecast shows a projected 3% to 5% increase in domestic airfares due to reduced seat capacity and less competition in some markets
• AMEX reports the Average domestic corporate airline ticket price for 2009 was $215 and for 2010 they are reporting an average domestic ticket price of $228. International corporate airline ticket price for 2009 was $1,636 and 2010 was $1,781.
• Airlines found several ways to grow revenue without raising fares – a la carte pricing: from charging for select coach seat assignments, boarding after elite status members, baggage fees and fuel surcharges and possibly using restrooms!
• In 2010, the airline industry earned approx. $23 billion in additional ancillary fees, which includes $3.4 billion for baggage fees.
The cost of air travel have been very volatile over the past several years. The cost of airfare in Newport News/Williamsburg has been lower than the U. S. average, but Norfolk/Virginia Beach has followed the US average, and Richmond has decreased to parallel with the US average.
SAMPLE
2001 Q1
2001 Q2
2001 Q3
2001 Q4
2002 Q1
2002 Q2
2002 Q3
2002 Q4
2003 Q1
2003 Q2
2003 Q3
2003 Q4
2004 Q1
2004 Q2
2004 Q3
2004 Q4
2005 Q1
2005 Q2
2005 Q3
2005 Q4
2006 Q1
2006 Q2
2006 Q3
2006 Q4
2007 Q1
2007 Q2
2007 Q3
2007 Q4
2008 Q1
2008 Q2
2008 Q3
2008 Q4
2009 Q1
2009 Q2
2009 Q3
2009 Q4
2010 Q1
2010 Q2
2010 Q3
2010 Q4
$180
$230
$280
$330
$380
$430
$480
$530
U.S.-Origin ATPI Newport News/ Williamsburg Norfolk/ Virginia Beach Richmond
Avera
ge A
ir F
are
s

Page: 13
Airline Industry: Price of Air Travel versus Other Goods & Services
Sources: www.airlines.org
Price of Air Travel Versus Other Goods and Services
Shown in their original values, facilitating comparisons with other goods & services versus the price of air travel and with movements in the U.S. Consumer Price Index (CPI).
SAMPLE
Product (Unit) 1978 2000 2010 2010 vs 1978
College Tuition: Public (Year) 1 $688 $3,508 $7,605 1005%
College Tuition: Private (Year) 1 $2,958 $16,072 $27,293 823%
Prescription Drugs (Index) 2 61.6 285.4 407.8 562%
New Vehicle 3 $6,470 $24,923 $29,793 360%
Unleaded Gasoline (Gallon) 5 $0.67 $1.51 $2.79 316%
New Single Family Home 4 $55,700 $169,000 $222,600 300%
Movie Ticket 6 $2.34 $5.39 $7.89 237%
CPI (All items) 2 65.2 172.2 218.1 234%
First-class Domestic Stamp 7 $0.15 $0.33 $0.44 193%
Whole Milk 2 81.0 156.9 191.2 136%
Grade-A Large Eggs (Dozen) 2 $0.82 $0.91 $1.66 102%
Air Travel: Domestic (Mile) 8 $186 $314 $316 70%
Air Travel: International (Mile) 8 n/a $935 $1,044 n/a
Television (Index) 2 101.8 49.9 8.0 -92%
1 The College Board - based on beginning of academic year
2 U.S. Bureau of Labor Statistics - including hedonic "quality-change' adjustments
3 National Automobile Dealers Association - average retail selling price
4 U.S. Census Bureau - median value
5 U.S. Department of Energy - Monthly Energy Review, Table 9.4
6 National Association of Theatre Owners
7 U.S. Postal Service - Publication 100
8 ATA via U.S. bureau of Transportation Statistics - excludes taxes; first column reflects 1979 (1978 data not available)
Page: 14
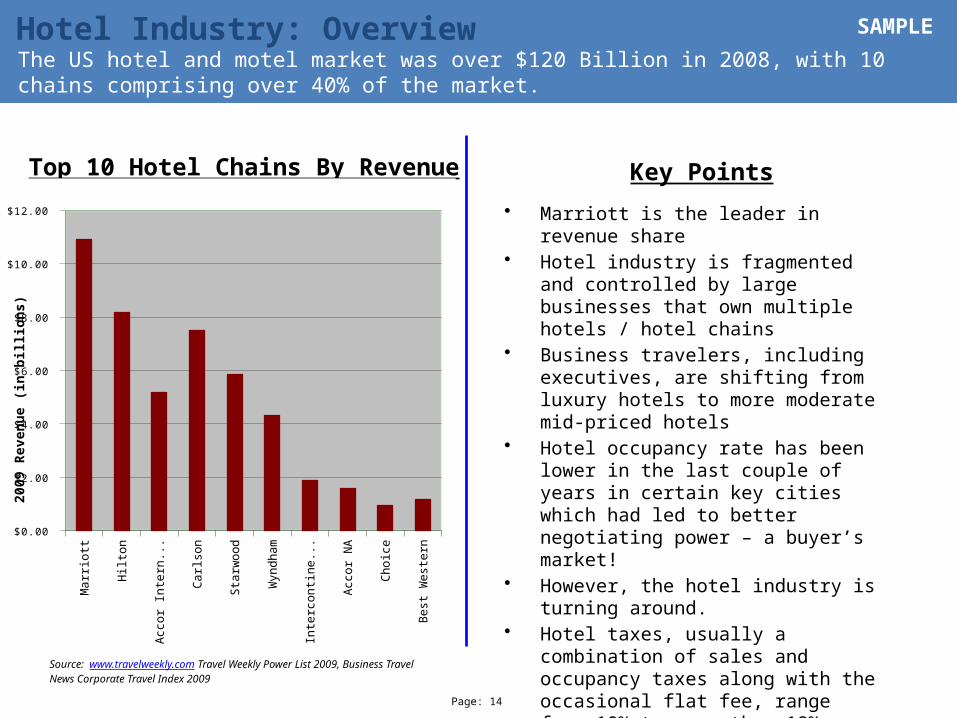
Hotel Industry: Overview
• Marriott is the leader in revenue share• Hotel industry is fragmented and
controlled by large businesses that own multiple hotels / hotel chains
• Business travelers, including executives, are shifting from luxury hotels to more moderate mid-priced hotels
• Hotel occupancy rate has been lower in the last couple of years in certain key cities which had led to better negotiating power – a buyer’s market!
• However, the hotel industry is turning around.
• Hotel taxes, usually a combination of sales and occupancy taxes along with the occasional flat fee, range from 10% to more than 18%.
• Hotel costs represent the single largest component of non-air expenses, about 43% of the travel dollar
Top 10 Hotel Chains By Revenue Key Points
Source: www.travelweekly.com Travel Weekly Power List 2009, Business Travel News Corporate Travel Index 2009
The US hotel and motel market was over $120 Billion in 2008, with 10 chains comprising over 40% of the market.
SAMPLE
Ma
rrio
tt
Hilt
on
Acc
or
Inte
rna
tion
al
Ca
rlso
n
Sta
rwo
od
Wyn
dh
am
Inte
rco
ntin
en
tal
Acc
or
NA
Ch
oic
e
Be
st W
est
ern
$0.00
$2.00
$4.00
$6.00
$8.00
$10.00
$12.00
2009
Rev
enu
e (i
n b
illi
on
s)
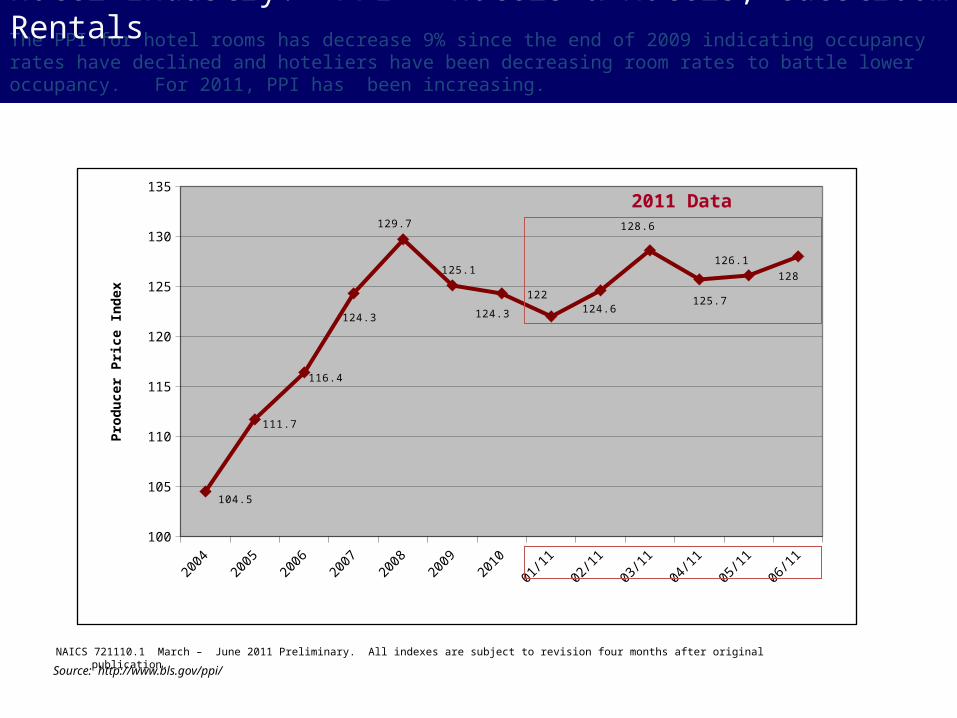
The PPI for hotel rooms has decrease 9% since the end of 2009 indicating occupancy rates have declined and hoteliers have been decreasing room rates to battle lower occupancy. For 2011, PPI has been increasing.
Hotel Industry: PPI – Hotels & Motels, Guestroom Rentals
Source: http://www.bls.gov/ppi/
2004
2005
2006
2007
2008
2009
2010
01/1
102
/11
03/1
104
/11
05/1
106
/11
100
105
110
115
120
125
130
135
104.5
111.7
116.4
124.3
129.7
125.1
124.3
122124.6
128.6
125.7
126.1
128
Pro
du
cer
Pri
ce I
nd
ex
NAICS 721110.1 March – June 2011 Preliminary. All indexes are subject to revision four months after original publication.
2011 Data
Page: 16
Hotel Industry: Cost Drivers
Source: http://www.Onesource.com
Operating Cost Drivers Key Findings
30%
19%
16%
15%
12%
8%
0%
10%
20%
30%
40%
50%
60%
70%
80%
90%
100%
Per
cen
t o
f S
pen
d
Administrative Overheads Employee
Repairs and Maintenance Food and Beverage
Power Selling Expenses
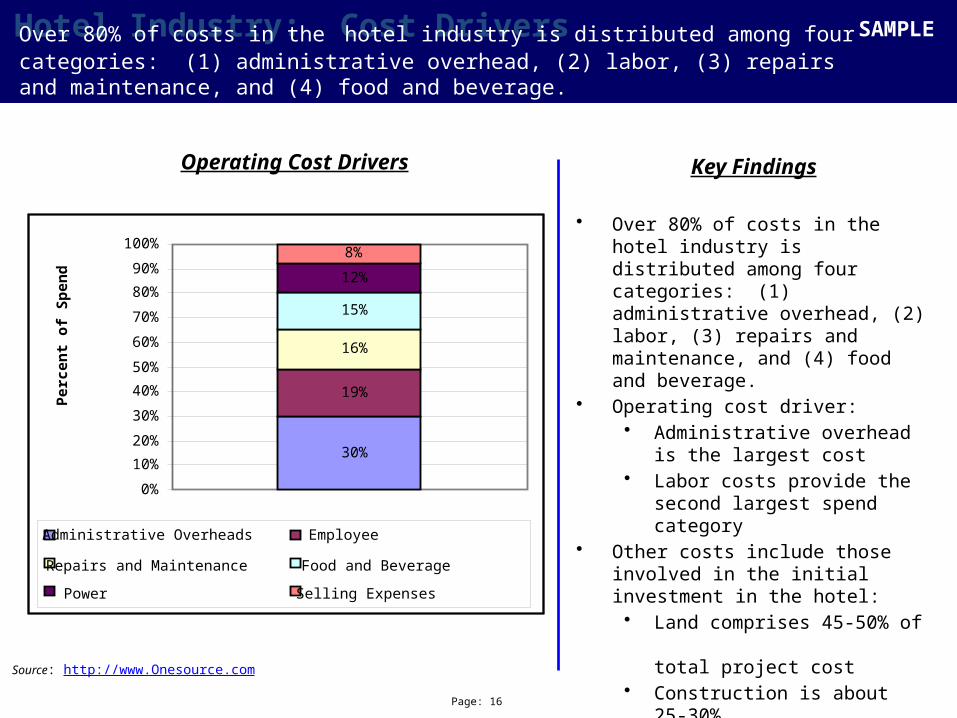
• Over 80% of costs in the hotel industry is distributed among four categories: (1) administrative overhead, (2) labor, (3) repairs and maintenance, and (4) food and beverage.
• Operating cost driver:• Administrative overhead is the
largest cost• Labor costs provide the second
largest spend category• Other costs include those involved in
the initial investment in the hotel:• Land comprises 45-50% of
total project cost• Construction is about 25-30%• Remainder goes to
furniture and fittings
Over 80% of costs in the hotel industry is distributed among four categories: (1) administrative overhead, (2) labor, (3) repairs and maintenance, and (4) food and beverage.
SAMPLE

Hotel Industry: Room Rates
• Hotel showed signs of pricing strength starting in 2011, through US rates remain well below peak levels reached in 2008
• For 2011, Forecaster’s Range estimates hotel average daily rates will increase by 1% to 8% in North America and 1% to 7% in Europe.
• Currently, hotel occupancy on the rise, and rates are either staying the same or rising $2 - $10 per night
• Rate increases also have not trickled down throughout the tier levels. Smith Travel Research (STR) reported that the average US hotel rate in March 2011 increased by 3.8% year over year, but rate growth was much stronger within the luxury tier
• STR projects occupancy to increase 2.5% for 2011
• AMEX Global Advisory Services has already seen an average increase of more than 7% in corporate rates worldwide for 2011 business travelers
• Hoteliers and analysts expect pricing power to continue rebounding throughout the year, leading to potentially tougher negotiations for buyers in the fall
Average Cost Per Night for March Hotel StaysBased on more than 750,00 hotel stays booked through US based
corporate travel agencies
Key Points
Source: Business Travel News Corporate Travel Index 2010, www.BTNonline.com, May 17, 2010, Procurement Travel, August, September, December 2010, and May 2011, The Transnational.travel, Business Travel Executive January 2011,
US hotel room rates started to decrease late 2008 which led to a buyers market . Buyers have enjoyed lower hotel rates for 2 years, but for 2011, we will see hotel rates increase.
2007 2008 2009 2010 2011$120
$125
$130
$135
$140
$145
$150
$155
$160
$148
$155
$134
$132
$139
Average US Corporate Hotel Rate
Co
rpo
rate
Nig
htl
y R
oo
m R
ate

Page: 18
Car Rental Industry: Overview
• Enterprise/National/Alamo, Hertz and Avis/Budget account for 90+% of the total market
• Car rental companies have tightened fleet controls and operating costs, leading to steady or even increased rates for corporate buyers.
• In the past 4 years, major car rental companies trimmed fleets from a total of about 2 million cars to about 1.3 million
• Car rental companies have implemented a variety of new ancillary fees to help preserve some of the lost revenue in recent times, such as tacking on fees to extend a reservation, eliminating 60 minute grace period, or increasing the cost of a two-day rental
• Avis/Budget began working with GDS operators to implement the addition of credit card information to rental car bookings. This opens the door to assess a no-show fee to travelers who fail to cancel their reservation without sufficient notice
• “Virtual rental technology” – enables customers to reserve, rent, access and return cars just about anywhere. ZipCar, WeCar, Connect.
Key Points
Source: www.autorentalnews.com, Business Travel News Corporate Travel Index 2010, Procurement Travel, August and September 2010
The U.S. car rental market is highly consolidated among a small number of major players and its going to get smaller.
SAMPLE
Top 4 Car Rental Companies By Revenue
Enterprise Hertz Avis/Budget Dollar Thrifty
$1.00
$3.00
$5.00
$7.00
$9.00
$11.00
$13.00 $12.10
$7.10
$5.13
$1.55
20
09
Re
ven
ue
(in
Bill
ion
s)
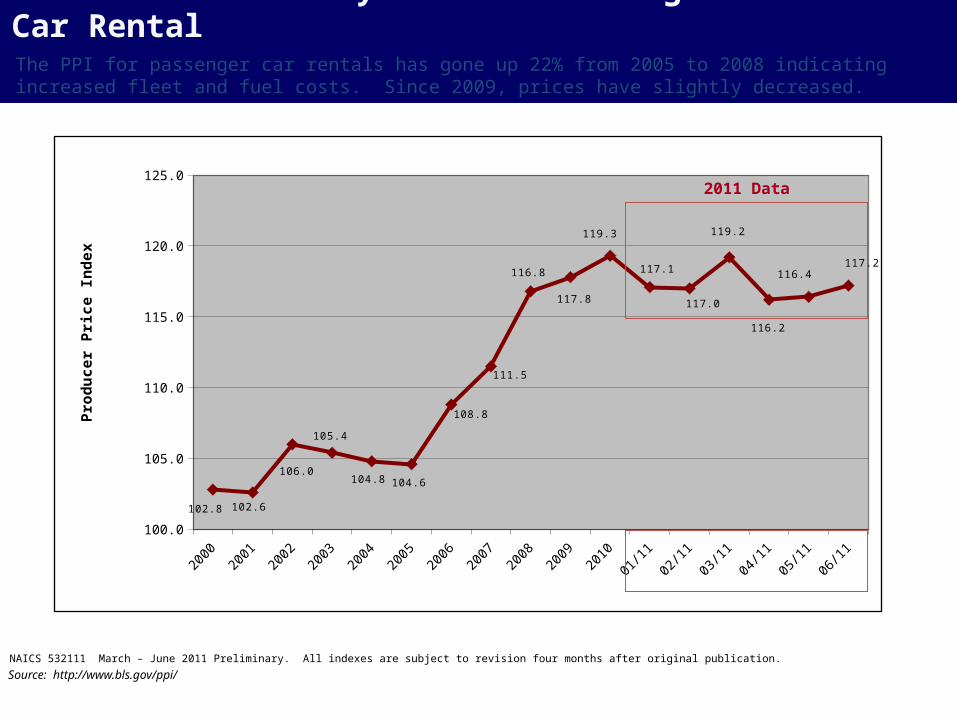
Rental Car Industry: PPI – Passenger Car Rental
NAICS 532111 March – June 2011 Preliminary. All indexes are subject to revision four months after original publication.
Source: http://www.bls.gov/ppi/
The PPI for passenger car rentals has gone up 22% from 2005 to 2008 indicating increased fleet and fuel costs. Since 2009, prices have slightly decreased.
2000
2001
2002
2003
2004
2005
2006
2007
2008
2009
2010
01/1
102
/11
03/1
104
/11
05/1
106
/11
100.0
105.0
110.0
115.0
120.0
125.0
102.8 102.6
106.0
105.4
104.8 104.6
108.8
111.5
116.8
117.8
119.3
117.1
117.0
119.2
116.2
116.4117.2
Pro
du
cer
Pri
ce In
dex
2011 Data

Page: 20
Car Rental Industry: Average Daily Rates
• The total corporate average US car rental cost listed in the 2010 Corporate Travel Index is $85.55 (before taxes and fees), up from $81.44 last year.
• BTN’s 2010 Corporate Travel Index: Detroit topped the 2010 car rental pricing list, with car rentals in the city costing an average of $175.25, up from $138.63 in 2009. Second-ranked NYC’s average rate of $163.19 is up from $128.37 last year. And Houston, ranked 12th in 2009, jumped to 5th place in 2010 with an average of $152.95 per rental.
• According to NBTA, $46 is the average corporate car rental rate in the US, an increase of 4% from the previous year.
• For 2011 Forecaster’s range is -2% to 4% for North America car rental rates and 2% to 5% in Europe.
• Good time to competitive bid car rental services. Areas of negotiation – GPS, Fuel charges, City Surcharges, Back end Rebates and multi-year agreement.
Key Points
Source: Business Travel News Corporate Travel Index 2010, National Business Travel Association 2008 - 2010 Business Travel Overview and Cost Forecast, Procurement travel, June and December 2010, Business Travel Executive January 2011
Average Daily Corporate Car Rental Rates: 2008 – 2010
Average corporate daily rates has been increasing slowly every year, approx. 4%
SAMPLE
2008 2009 2010$40
$41
$42
$43
$44
$45
$46
$47
$42
$44
$46
Avg
Dai
ly C
orp
ora
te C
ar R
enta
l R
ate

Travel Management Industry: Overview
• The top 50 travel management companies represent over $145 Billion in sales revenue in 2009.
• The top 13 travel management companies earned 92% of the sales revenue in 2009, a top heavy industry.
• Expedia, Orbitz, Travelocity, Priceline, AAA Travel, and Flight Centre receive 89% or more sales revenue from the leisure market and Travel Leaders earns 48% of their sales revenue from the leisure market.
• Travel management companies are experiencing soft demand and client cutbacks, resulting in downsizing their workforce.
• First time since the Travel Weekly Power List commenced (1992), AMEX did not occupy the top spot.
Top 13 (over $1B in revenue) Travel Management Co’s By Revenues
Key Points
Source: www.travelweekly.com Travel Weekly Power List 2010, BTN June 1, 2009, www.bts.gov
The Top 50 travel management companies represent over $145 Billion in sale revenue
Exped
ia, In
c
AMEX
Carlso
nHRG
BCDO
rbitz
Trave
locity
Priceli
ne
AAA Tra
vel
Flight
Cen
tre U
SA
Trave
l Lea
ders
Om
ega
Wor
ld Tra
vel
Trave
l and
Tra
nspo
rt$0
$5
$10
$15
$20
$25
$30
20
09
Re
ve
nu
es
(in
Bill
ion
s)

The PPI for travel agencies has gone down 13% since its high in 2001 (due to 9/11 and the commencement of the on-line booking tool), but has risen since and is close to its 2007 high once again..
TMC Industry: PPI – Travel Agencies
NAICS 481111 March– June 2011 Preliminary. All indexes are subject to revision four months after original publication.
Source: http://www.bls.gov/ppi/
2000
2001
2002
2003
2004
2005
2006
2007
2008
2009
2010
01/1
102
/11
03/1
104
/11
05/1
106
/11
105.0
110.0
115.0
120.0
125.0
121.8
123.3
114.0
112.5
108.6
107.4
111.5
113.2
111.7
111.5
112.4
112.5 112.5
112.3
112.5
112.4
112.7
Pro
du
cer
Pri
ce In
dex
2011 Data

Page: 23
Strategy Considerations
• Company should examine current travel policies. Enforcement of on-line booking tool, advance booking, preferred hotels and other travel guidelines will result in significant savings.
• Because of the relative small air travel spend compared to other companies, in addition to moving corporate headquarters to Dallas while still maintaining their Detroit area locations, Company should consider focusing hard dollar airline discounts with one or two major carriers supporting both markets. Furthermore, Company should consider exploring additional benefits for their secondary markets
• Company should re-examine their current preferred hotel program and consolidate markets and room nights to leverage buying power
• Company should leverage hotel spend for meetings/events in negotiating hotel rates for transient travel
• Preferred car rental utilization is “best in class”, therefore consider a competitive bid to leverage utilization
• Company may consider utilizing teleconferencing as an alternative to reduce their overall travel usage
SAMPLE
Page: 24
• Air Transport Association, www.airlines.org• AMEX Business Travel 2010 Forecast and Trends• ATWOnline, www.atwonline.com• Bureau of Labor Statistics, www.bls.gov• Bureau of Transportation Statistics, www.bts.gov• Business Travel Executive, January 2011• Business Travel News Corporate Travel Index 2010• Forbes, www.forbes.com• Hoovers Online, www.hoovers.com• IATA (International Air Transport Association) & World Air Transport Statistics (WATS 2006)• National Business Travel Association, www.nbta.org• NBTA 2010 Business Travel Overview & Cost Forecast• OneSource Inc., www.onesource.com• Power List 2010, www.travelweekly.com• Smith Travel Research Data• Standard & Poor’s, www.standardandpoors.com• The Transnational.travel• Travel Daily News, www.traveldailynews.com• Travel Procurement, March, June, August and September 2010• Travel Weekly, www.travelweekly.com• Wikipedia
Appendix: Data SourcesSAMPLE
Page: 25
Strategic Sourcing Process Overview
ProfileCategoryInternally &Externally
CreateSelectionFactors &EvaluateSuppliers
Negotiate & Develop Sourcing
Recommen-dation
ImplementAgreements
Strategic Sourcing Methodology
Act
ivit
ies
Del
iver
able
s o
r To
ols
Develop Sourcing
Objectives
Sourcing Strategy Plan: Competitive
Supplier Selection or
Existing Supplier
Development
Develop SourcingStrategy
Conduct Competitive Exercise w/ ApprovedSuppliers
Develop Sourcing
Strategies & Tactics
ANALYSIS STRATEGY SUPPLIER SELECTION IMPLEMENTATION
AssessOpportunity & Establish Team

Page: 26
Sourcing Strategies & TacticsSeveral sourcing strategies can be pursued, either separately or together.
— Possible Sourcing Strategies —
Best PriceAnalysis
Volume Leveraging
Strategic Relationship
ProcessImprovement
DemandManagement
CommoditySourcingStrategy
STRATEGIC RELATIONSHIP
Establish integrated or close relationships with suppliers where both buyer and supplier work together to share information, collaborate, and further each partner’s goals
STRATEGIC RELATIONSHIP
Establish integrated or close relationships with suppliers where both buyer and supplier work together to share information, collaborate, and further each partner’s goals
PROCESS IMPROVEMENT
Identify opportunities to standardize and streamline business processes that will result in improved quality, reduced cycle times, and lower total cost of ownership
PROCESS IMPROVEMENT
Identify opportunities to standardize and streamline business processes that will result in improved quality, reduced cycle times, and lower total cost of ownership
BEST PRICE ANALYSIS
Evaluate and model all costs and use negotiation tactics that increase transparency and maximize competition
BEST PRICE ANALYSIS
Evaluate and model all costs and use negotiation tactics that increase transparency and maximize competition
DEMAND MANAGEMENT
Address factors such as standards, requirements, and policies to reduce costs related to internal demand
DEMAND MANAGEMENT
Address factors such as standards, requirements, and policies to reduce costs related to internal demandVOLUME CONCENTRATION
Aggregate like goods and/or services across organizational units in order to increase negotiation leverage and negotiate better pricing, and terms and conditions
VOLUME CONCENTRATION Aggregate like goods and/or services
across organizational units in order to increase negotiation leverage and negotiate better pricing, and terms and conditions

Page: 27
Sourcing Strategy: Airlines
Current State• Travel policies located in Accounts Payable
Expenditure Manual – No enforcement• All departments using one travel agency,
however suspect that some Southwest bookings are going directly to Southwest.com
• Travel compliance is not be monitored• Recently moved corporate headquarters from
Detroit, MI to Dallas, TX• Top 3 airline spend: Northwest, American and
Southwest• Current contract with Northwest only (no
discount in Tier 3 and high market share commitment)
• 70% of air spend in Tier 3• Some international air spend – about 15%
Sourcing Recommendation• Create separate travel policy with management
enforcement• Enter into negotiations with Northwest (current
contracted supplier) and American Airlines. In addition, pursue possible corporate deal with Southwest Airlines.
• Stimulate competition between Northwest and American Airlines in multi-hub city pairs
• Stimulate competition between Northwest and American Airlines for international air spend
• Negotiate with Southwest and determine if market share can support a formal corporate agreement
• Market dynamics suggest a 2 year contract
Results• Separate travel policy resulting in improved compliance• Discount in Tier 3 level pricing• Capture all Southwest spend
SAMPLE
Page: 28
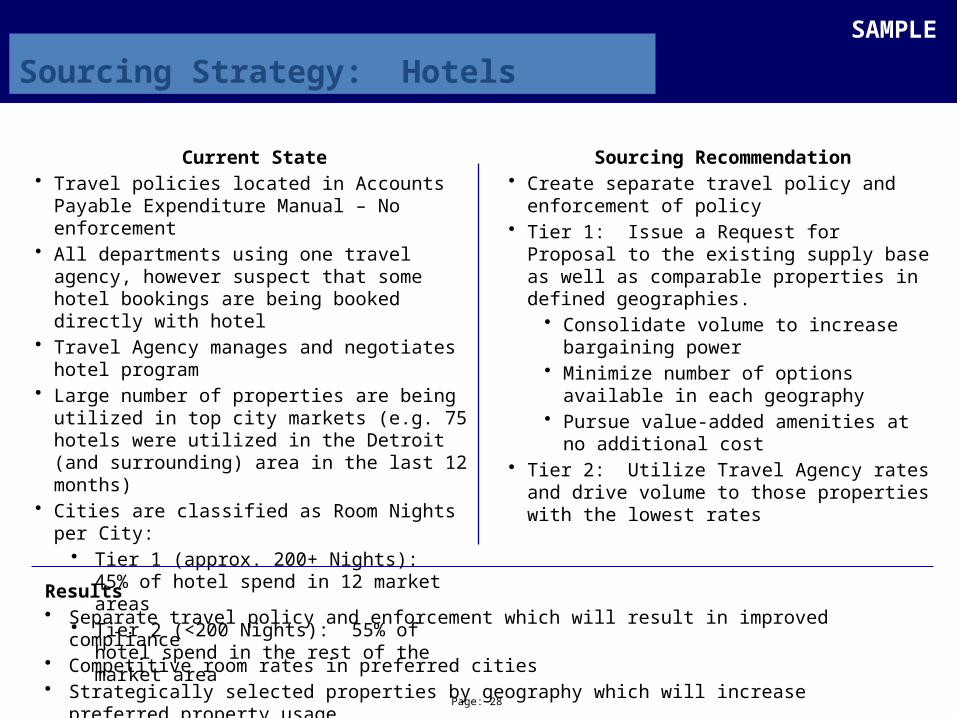
Sourcing Strategy: Hotels
Current State• Travel policies located in Accounts Payable
Expenditure Manual – No enforcement• All departments using one travel agency, however
suspect that some hotel bookings are being booked directly with hotel
• Travel Agency manages and negotiates hotel program
• Large number of properties are being utilized in top city markets (e.g. 75 hotels were utilized in the Detroit (and surrounding) area in the last 12 months)
• Cities are classified as Room Nights per City:• Tier 1 (approx. 200+ Nights): 45% of hotel
spend in 12 market areas• Tier 2 (<200 Nights): 55% of hotel spend in
the rest of the market area
Sourcing Recommendation• Create separate travel policy and enforcement of
policy • Tier 1: Issue a Request for Proposal to the
existing supply base as well as comparable properties in defined geographies.
• Consolidate volume to increase bargaining power
• Minimize number of options available in each geography
• Pursue value-added amenities at no additional cost
• Tier 2: Utilize Travel Agency rates and drive volume to those properties with the lowest rates
Results• Separate travel policy and enforcement which will result in improved compliance• Competitive room rates in preferred cities• Strategically selected properties by geography which will increase preferred property usage
SAMPLE

Page: 29
Sourcing Strategy: Car Rentals
Current State• Travel policies located in Accounts Payable
Expenditure Manual – No enforcement• All departments using one travel agency for
booking car rentals, however some spend is being booked via another source
• 97% of the car rental spend is with one preferred supplier
• Over 75% of car rental returns are subject to refueling charges
• The top 15 cities, by volume, represent 78% of the rental car spend
Sourcing Recommendation• Develop and implement one travel policy for all
departments• Issue a Request for Proposal to the top 5 rental
car companies• Consolidate volume from all sources to
increase bargaining power• Request pricing for one primary and one
primary and one secondary supplier relationship
• Negotiate refueling charges, if possible• Negotiate city surcharges for the top 15
cities, by volume• Market dynamics suggest a 2 year contract with
the option for a 1 year extension
Results• One travel policy for all departments resulting in capturing the non-compliance that is being done• Award contract to one primary or one primary and one secondary supplier, whichever is more
advantageous
SAMPLE
Page: 30
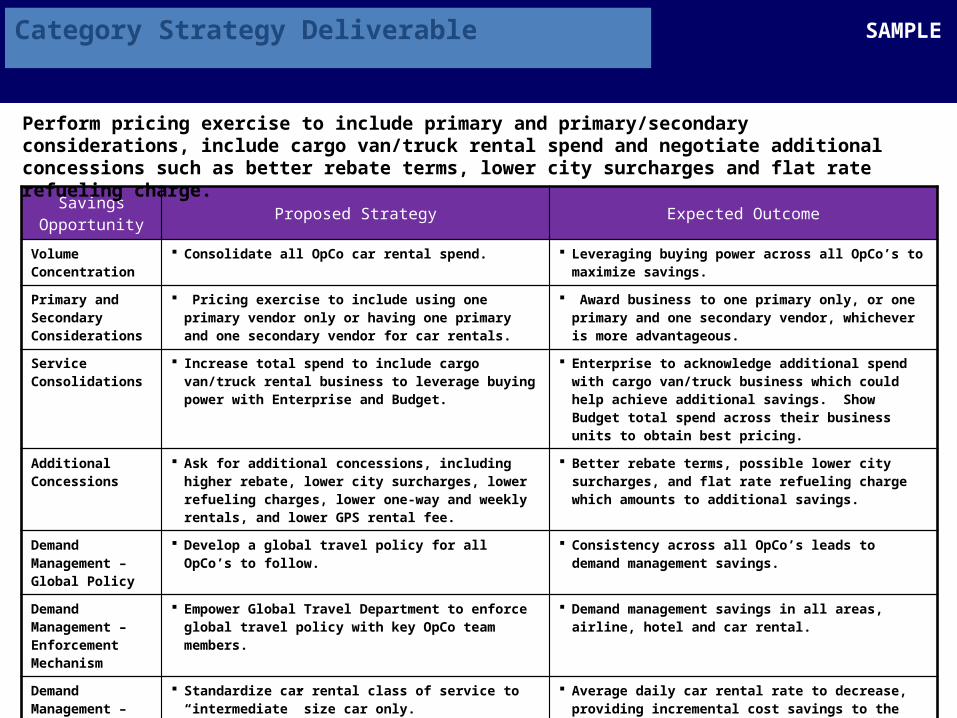
Savings Opportunity
Proposed Strategy Expected Outcome
Volume Concentration
Consolidate all OpCo car rental spend. Leveraging buying power across all OpCo’s to maximize savings.
Primary and Secondary Considerations
Pricing exercise to include using one primary vendor only or having one primary and one secondary vendor for car rentals.
Award business to one primary only, or one primary and one secondary vendor, whichever is more advantageous.
Service Consolidations
Increase total spend to include cargo van/truck rental business to leverage buying power with Enterprise and Budget.
Enterprise to acknowledge additional spend with cargo van/truck business which could help achieve additional savings. Show Budget total spend across their business units to obtain best pricing.
Additional Concessions
Ask for additional concessions, including higher rebate, lower city surcharges, lower refueling charges, lower one-way and weekly rentals, and lower GPS rental fee.
Better rebate terms, possible lower city surcharges, and flat rate refueling charge which amounts to additional savings.
Demand Management – Global Policy
Develop a global travel policy for all OpCo’s to follow. Consistency across all OpCo’s leads to demand management savings.
Demand Management – Enforcement Mechanism
Empower Global Travel Department to enforce global travel policy with key OpCo team members.
Demand management savings in all areas, airline, hotel and car rental.
Demand Management – Class of Service Standardization
Standardize car rental class of service to “intermediate” size car only.
Average daily car rental rate to decrease, providing incremental cost savings to the program.
Category Strategy Deliverable
Perform pricing exercise to include primary and primary/secondary considerations, include cargo van/truck rental spend and negotiate additional concessions such as better rebate terms, lower city surcharges and flat rate refueling charge.
SAMPLE

Page: 31
Strategic Sourcing Process Overview
ProfileCategoryInternally &Externally
CreateSelectionFactors &EvaluateSuppliers
Negotiate & Develop Sourcing
Recommen-dation
ImplementAgreements
Strategic Sourcing Methodology
Act
ivit
ies
Del
iver
able
s o
r To
ols
Conduct Supplier Analysis
Create Supplier Selection Criteria
Supplier Selection
Decision Matrix
RFIs (optional)
“Short List” of Suppliers
Develop SourcingStrategy
Conduct Competitive Exercise w/ ApprovedSuppliers
ANALYSIS STRATEGY SUPPLIER SELECTION IMPLEMENTATION
AssessOpportunity & Establish Team
Page: 32
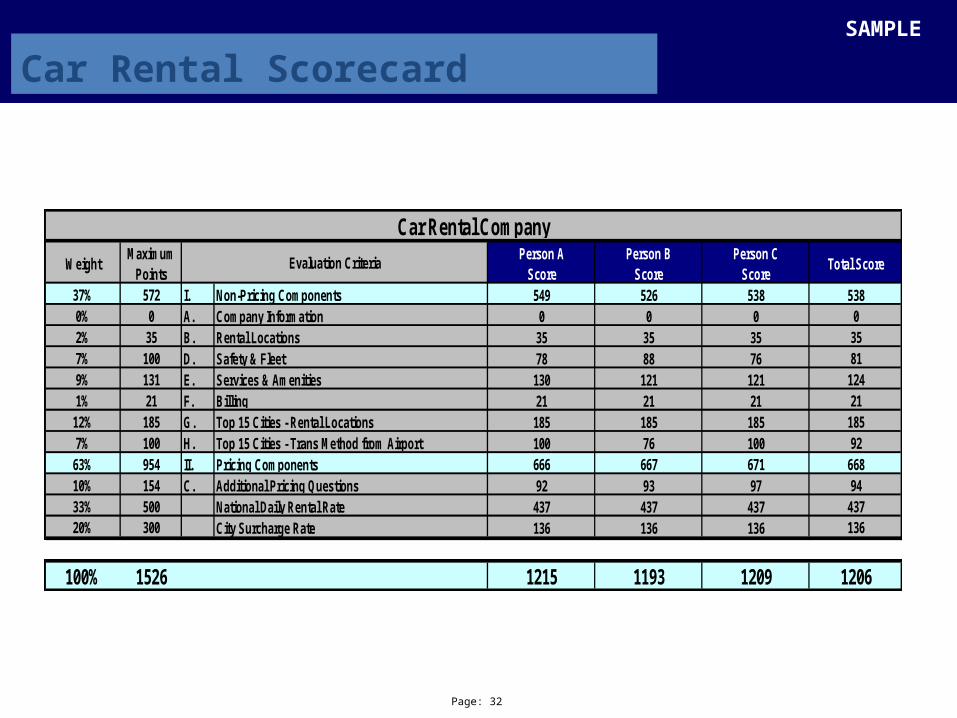
Car Rental Scorecard
WeightMaximum
PointsPerson A
ScorePerson B
ScorePerson C
ScoreTotal Score
37% 572 I. Non-Pricing Components 549 526 538 5380% 0 A. Company Information 0 0 0 02% 35 B. Rental Locations 35 35 35 357% 100 D. Safety & Fleet 78 88 76 819% 131 E. Services & Amenities 130 121 121 1241% 21 F. Billing 21 21 21 21
12% 185 G. Top 15 Cities - Rental Locations 185 185 185 1857% 100 H. Top 15 Cities - Trans Method from Airport 100 76 100 92
63% 954 II. Pricing Components 666 667 671 66810% 154 C. Additional Pricing Questions 92 93 97 9433% 500 National Daily Rental Rate 437 437 437 43720% 300 City Surcharge Rate 136 136 136 136
100% 1526 1215 1193 1209 1206
Car Rental Company
Evaluation Criteria
SAMPLE

Page: 33
Strategic Sourcing Process Overview
ProfileCategoryInternally &Externally
CreateSelectionFactors &EvaluateSuppliers
Negotiate & Develop Sourcing
Recommen-dation
ImplementAgreements
Strategic Sourcing Methodology
Act
ivit
ies
Del
iver
able
s o
r To
ols
Complete Traditional
RFP Process
RFPs / RFQs
eAuctions
Collaborative Discussions
Conduct eAuction(s)
Collaborate w/ Incumbent Supplier(s)
- AND/OR -
- AND/OR -
Develop SourcingStrategy
Conduct Competitive Exercise w/ ApprovedSuppliers
ANALYSIS STRATEGY SUPPLIER SELECTION IMPLEMENTATION
AssessOpportunity & Establish Team

Page: 34
Supplier Engagement Options
There are many ways to initially exchange information. While RFPs are often appropriate, they are one of many means of engaging suppliers.
Pre-NegotiationInformationExchange
Direct Negotiations with
an Incumbent Supplier
Direct Negotiations with a Target Supplier
Brainstorm with a Group of Trusted
Suppliers
On-Line AuctionsRFPs / RFQs
Should choose the method(s) that best meets both the Strategic Sourcing objective and the team
resource capacity
Should choose the method(s) that best meets both the Strategic Sourcing objective and the team
resource capacity
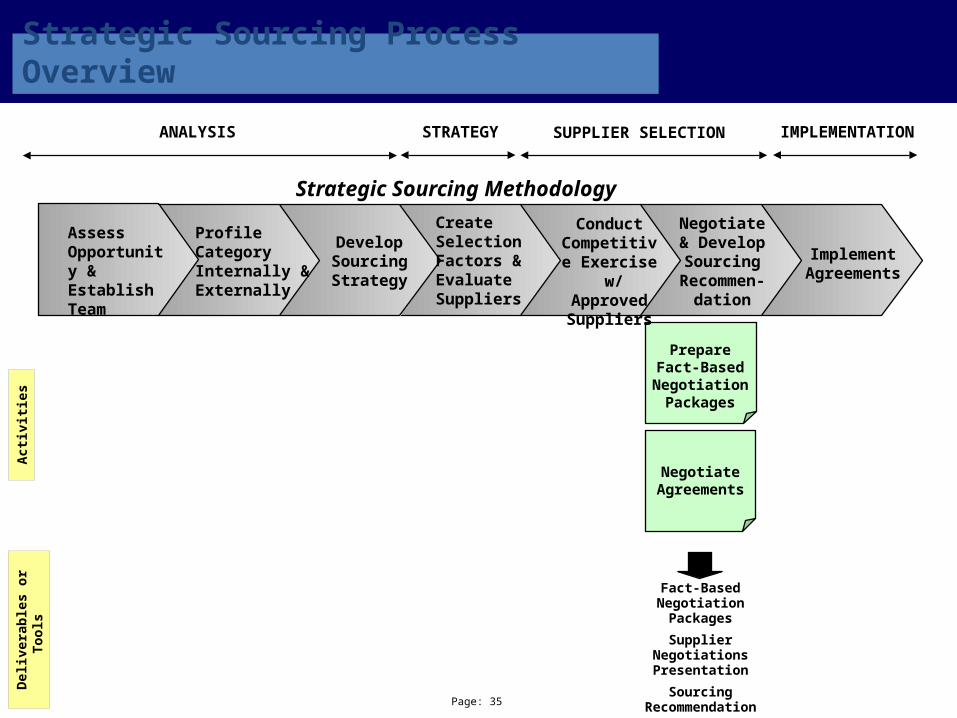
Page: 35
Strategic Sourcing Process Overview
ProfileCategoryInternally &Externally
CreateSelectionFactors &EvaluateSuppliers
Negotiate & Develop Sourcing
Recommen-dation
ImplementAgreements
Strategic Sourcing Methodology
Act
ivit
ies
Del
iver
able
s o
r To
ols
Prepare Fact-Based
Negotiation Packages
Negotiate Agreements
Fact-Based Negotiation Packages
Supplier Negotiations Presentation
Sourcing Recommendation
Develop SourcingStrategy
Conduct Competitive Exercise w/ ApprovedSuppliers
ANALYSIS STRATEGY SUPPLIER SELECTION IMPLEMENTATION
AssessOpportunity & Establish Team

Page: 36
Negotiations Approach – Discussion Points
Based on a review of Company’s current program, contract terms, and stakeholder requirements, the following improvement areas have been identified to maximize the annual incentive rebate.
Negotiation Point Description Supplier
Pricing, Incentive Rebate Structure
• Size down the gap between rebate tiers to reduce the risk associated with dropping to a lower tier. Closing the gap between tiers will inset Company to drive more spend to Amex.
• Ensure incentive BPS earned at each tier are best in class for domestic and non-domestic spend.
• ABC
Pricing, Signing Bonus • Reduce/eliminate minimum signing bonus *NACV thresholds (claw back clause) to avoid refunding any portion of the $1M signing bonus paid to Company in 2008.
• Take a position which suggest Company is doing Amex a favor by offering them other potential business. ABC should fight to keep this business considering transition cost will be minimal for them, thus their margin will not be adversely be effected.
• ABC
Pricing, Performance Bonus
• Establish a realistic performance target based on the post spin *NACV, the current (pre spin) performance target is too aggressive.
• Maximize the annual performance bonus.
• ABC
Pricing, Deductions • Minimize consulting assessment expenses (hourly rate) and Membership Reward (MR) fees which are deducted directly from the incentive rebate.
• Negotiate an annual credit which can be applied to consulting and MR expenses.
• ABC
Pricing, High ROC Transactions
• Reduce the 50 BSP reduction on P-card transactions > $10K (Hi-ROC volume).• Negotiate a buffer which can be applied to the Hi-ROC volume, i.e. request that the
BSP penalty apply only to Hi-ROC volume which exceeds a specified amount.
• ABC
*NACV – Net Annual Charge Volume (i.e. annual spend with Amex)
SAMPLE
Page: 37
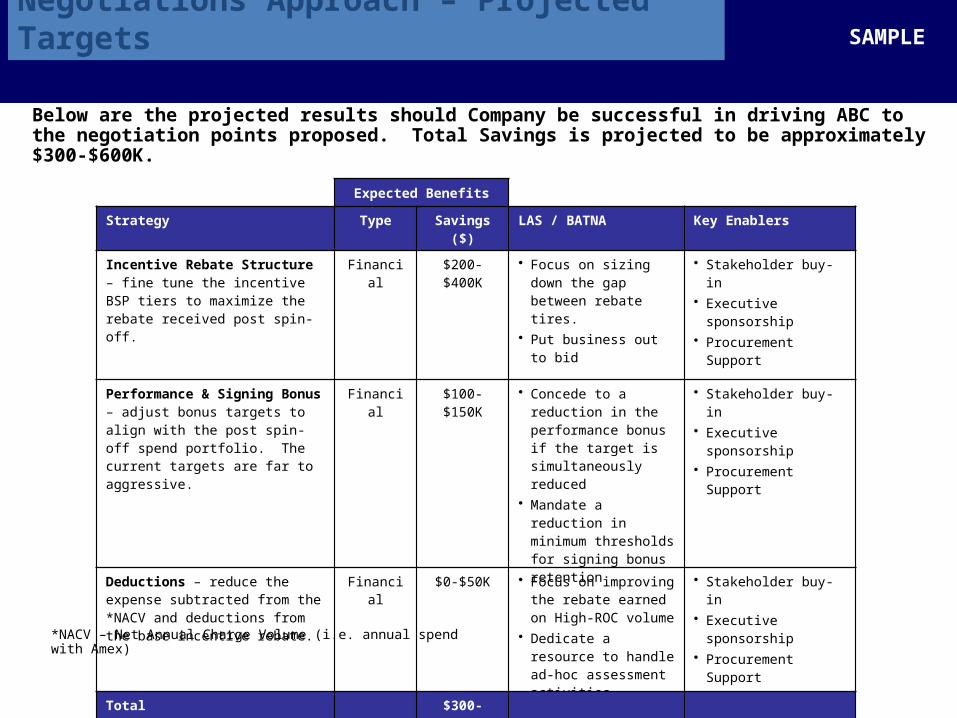
Negotiations Approach – Projected Targets
Below are the projected results should Company be successful in driving ABC to the negotiation points proposed. Total Savings is projected to be approximately $300-$600K.
SAMPLE Expected Benefits
Strategy Type Savings ($) LAS / BATNA Key Enablers
Incentive Rebate Structure – fine tune the incentive BSP tiers to maximize the rebate received post spin-off.
Financial $200-$400K • Focus on sizing down the gap between rebate tires.
• Put business out to bid
• Stakeholder buy-in• Executive sponsorship• Procurement Support
Performance & Signing Bonus – adjust bonus targets to align with the post spin-off spend portfolio. The current targets are far to aggressive.
Financial $100-$150K • Concede to a reduction in the performance bonus if the target is simultaneously reduced
• Mandate a reduction in minimum thresholds for signing bonus retention
• Stakeholder buy-in• Executive sponsorship• Procurement Support
Deductions – reduce the expense subtracted from the *NACV and deductions from the base incentive rebate.
Financial $0-$50K • Focus on improving the rebate earned on High-ROC volume
• Dedicate a resource to handle ad-hoc assessment activities
• Stakeholder buy-in• Executive sponsorship• Procurement Support
Total $300-$600K
*NACV – Net Annual Charge Volume (i.e. annual spend with Amex)
SAMPLE

Page: 38
Strategic Sourcing Process Overview
ProfileCategoryInternally &Externally
CreateSelectionFactors &EvaluateSuppliers
Negotiate & Develop Sourcing
Recommen-dation
ImplementAgreements
Strategic Sourcing Methodology
Act
ivit
ies
Del
iver
able
s o
r To
ols
Validate Internal
Requirements & Profile Category
ConductIndustry Analysis
Internal Category Profile
TCO Model
Cost Reduction Ideas
Industry Profile
Build TCO Model
Develop Sourcing
Objectives
Sourcing Strategy Plan: Competitive
Supplier Selection or
Existing Supplier
Development
Conduct Supplier Analysis
Create Supplier Selection Criteria
Supplier Selection
Decision Matrix
RFIs (optional)
“Short List” of Suppliers
Complete Traditional
RFP Process
RFPs / RFQs
eAuctions
Collaborative Discussions
Conduct eAuction(s)
Collaborate w/ Incumbent Supplier(s)
- AND/OR -
- AND/OR -
Prepare Fact-Based
Negotiation Packages
Negotiate Agreements
Fact-Based Negotiation Packages
Supplier Negotiations Presentation
Sourcing Recommendation
Finalized Agreements
Benefits Realization
Continual Supplier
Improvement
Implement Agreements and Monitor
KPIs
Evaluate Performance and Develop
Suppliers
Develop SourcingStrategy
Conduct Competitive Exercise w/ ApprovedSuppliers
Fast Track for Quick Savings
Develop Sourcing
Strategies & Tactics
ANALYSIS STRATEGY SUPPLIER SELECTION IMPLEMENTATION
AssessOpportunity & Establish Team
AssessOpportunity
Obtain Sponsorship
& ID Team
CreateProject
Plan
Project Plan
Analyze Current Spend
Document Requirements

Page: 39
Implementation Plan Overview
An effective implementation plan consists of several key components necessary to ensure rapid and complete benefits realization from the new supply arrangement(s), and to follow through on agreed to parameters during contract negotiations.
Plan Component Description
Transition Plan Shift from old supply agreements to new ones. May or may not involve switching suppliers.
Communication Plan
Inform the user community of the outcome of the strategic sourcing effort. Specify to users how they are impacted and what actions they are required to take
as a result of the strategic sourcing effort. Highlight all benefits that users may derive from the new supply arrangements.
Compliance Plan Determine how compliance to new supply arrangements will be enforced (if possible).
Closely linked to the “Communication Plan”.
Benefits Tracking & Reporting Plan
Measure benefits resulting from new supply arrangements relative to targets Report to senior management on both status and any necessary actions required to
improve benefits realization.
Performance Management Plan
Ensure that suppliers are performing along key metrics as required by the contract. Put in place a regular communication vehicle with suppliers to drive improvements
in supplier performance.
– Overview of Implementation Plan Components –
SAMPLE