travel efficiency assessment method: three case …€¢vmt •criteria pollutants – ozone...
TRANSCRIPT
Travel Efficiency Assessment Method: Three Case Studies

How much could travel efficiency strategies reduce:
•VMT
•Criteria pollutants – ozone precursors, particulate
matter, etc., and •Greenhouse gases We developed the Travel Efficiency Assessment Method to provide a way to answer this question
2
3

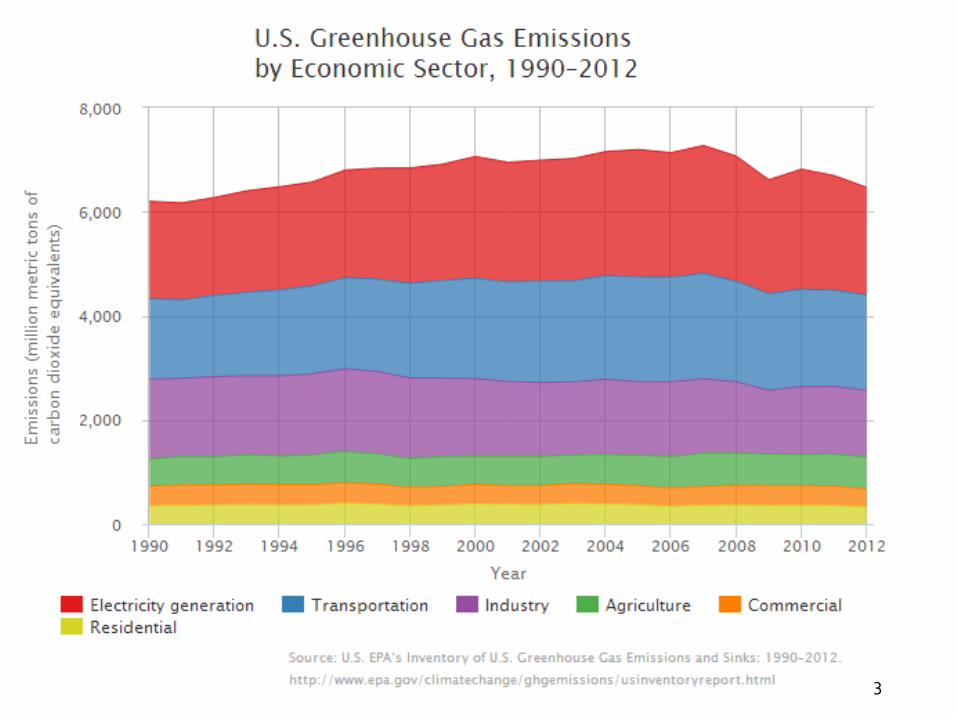
U.S. Greenhouse Gas Emissions by Economic Sector in 2012
After electricity generation, transportation is the leading source of U.S. GHG emissions
4 Source: U.S. EPA’s Inventory of U.S. Greenhouse Gas Emissions and Sinks: 1990–2012 (April 2014)

What is the Travel Efficiency Assessment Method?
5
Local data and strategies
4-Step Transportation
Model
Change in VMT, trips, fleet mix
MOVES Emissions Assessment
Local data and strategies
TRIMMS Sketch Model
Change in VMT, trips, fleet mix
MOVES Emissions Assessment
A methodology to assess multi-pollutant emission reductions from TE strategies at the local, state and national level Traditional Modeling:
TEAM:
Sketch models, like TRIMMS, are a cost-effective way to assess the travel activity effects of TE strategies
Traditional 4-Step models are insensitive to many TE strategies
Why TEAM?
• Interest in climate change and air quality at all levels, e.g.: • Federal Policies
• President’s Climate Action Plan • Partnerships and related efforts in EPA, DOT, DOE, HUD
• State Actions • Climate action plans • GHG goals and targets
• Regional Activity • Planning initiatives • Regional and local GHG goals and targets
• Varying levels of sophistication with respect to analysis • Traditional 4-step model versus activity-based modeling • Resource availability for analysis
• Decision makers differ in needs and interests
6

2010 National Study
We applied the TEAM approach on a national scale: • What if all urban areas in the U.S. adopted travel
efficiency strategies? • We grouped all U.S. cities into cohorts based on
population and transit share, and applied travel efficiency strategies as follows…
7

2010 National Study: Strategies and Assumptions
8
TCM Strategy Example measures 2010 - 2030 2030 - 2050 Employer-initiated TDM strategies
Flexible work hours Guaranteed ride home Ride sharing/ ride
matching Incentives for transit,
ped/bike modes, carpooling, telecommuting
30% of employers region-wide offer these programs
50% of employers region-wide offer these programs
Land use policies TOD, smart growth, increase in density, mixed use developments
5% reduction in transit and walk/bike travel times; 5% increase in auto travel time due to density/ congestion
10% reduction in transit and walk/bike travel times; 10% increase in auto travel time due to density/ congestion
Note: Access time taken as proxy for trip length. Transit projects and policies
Transit frequency and access improvements
5% reduction in transit travel time
10% reduction in transit travel time
Fare discounts, subsidies, or free transfers
10% reduction in transit fares
20% reduction in transit fares
Pricing policies Parking charges $2 increase per day $5 increase per day
VMT fees/congestion pricing $0.10 increase per mile $0.25 increase per mile

Results of the 2010 National Study: Urban Onroad Light Duty Emission Reductions
9
Scenario Strategies Emission Reductions in 2030 Emission Reductions in 2050
CO2e PM2.5 NOx VOC CO2e PM2.5 NOx
VOC 1 Region-wide
TDM 0.10% 0.10% 0.10% 0.09% 0.26% 0.26% 0.26% 0.25%
2 Plus: Smart Growth 1.01% 1.01% 1.00% 0.98% 2.97% 2.96% 2.93% 2.86%
3 Plus: Transit Fare Reduct’ns 1.40% 1.40% 1.39% 1.36% 4.19% 4.18% 4.16% 4.08%
4 Plus: Transit Service Improvements
1.44% 1.44% 1.43% 1.41% 4.30% 4.29% 4.28% 4.23%
5 Plus: Parking Fees 2.92% 2.92% 2.91% 2.90% 6.98% 6.94% 6.87% 6.68%
6 Plus: Mileage Fees, Minus: Parking Fees
1.94% 1.93% 1.92% 1.87% 6.28% 6.25% 6.17% 5.95%
7 All Strategies 3.42% 3.42% 3.40% 3.35% 8.83% 8.78% 8.65% 8.29%

Case Studies, 2013
•We applied TEAM to specific areas to demonstrate the capabilities of the approach at the regional scale •Our goals were to better understand:
• The strategies areas could be interested in, • The data that would be available, and • The issues a local area would need to resolve in applying TEAM
•Case studies were done in partnership with state, regional, or local planning agencies • We solicited letters of interest, communicating through EPA
Regions, NACAA, AASHTO, AMPO, APTA, NARC, TCI, and TRB’s Air Quality Committee
10
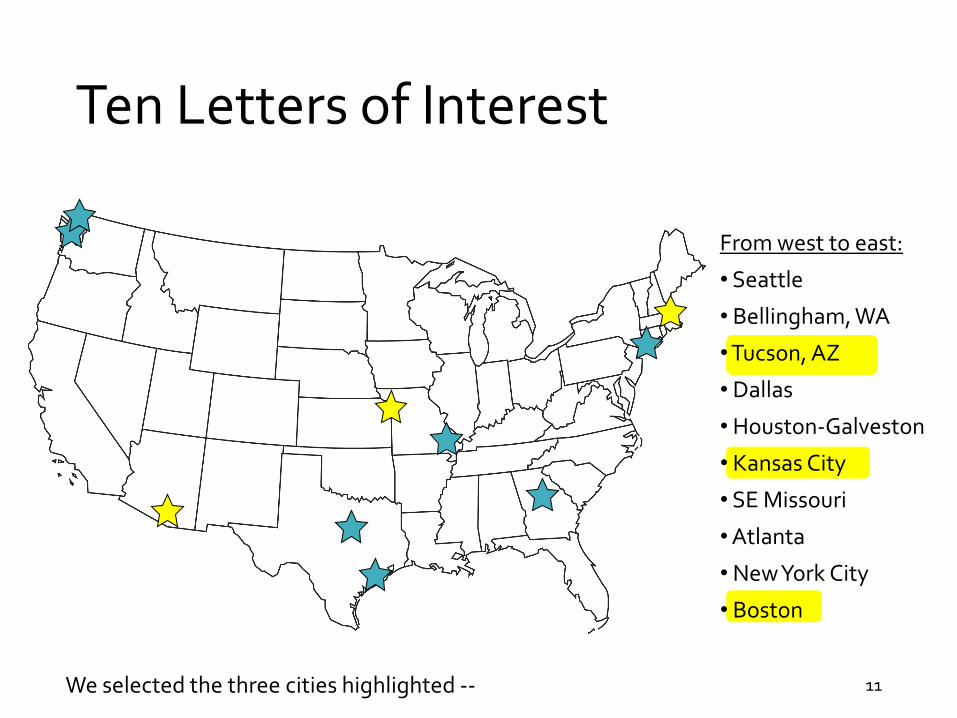
Ten Letters of Interest
11
From west to east:
• Seattle
• Bellingham, WA
• Tucson, AZ
• Dallas
• Houston-Galveston
• Kansas City
• SE Missouri
• Atlanta
• New York City
• Boston
We selected the three cities highlighted --
Strategy Selection
• We worked with the agencies selected to determine what strategies to model • Had to choose strategies that could be modeled by TRIMMS
• Areas were encouraged to evaluate aggressive “what if” scenarios • Four alternative scenarios, comprised of individual or
combinations of strategies
• We compared these “what if” scenarios to the area’s future year business-as-usual (BAU) scenario • The BAU scenario reflected the area’s future plans for land use and
transportation, which differed for each of the 3 areas
12
13
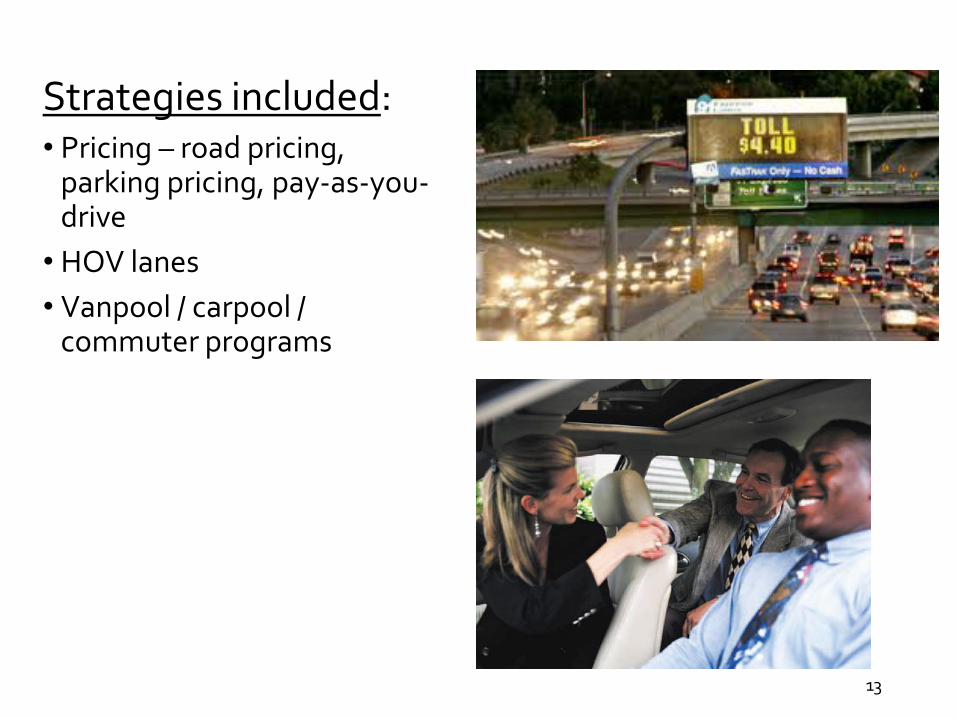
Strategies included: • Pricing – road pricing,
parking pricing, pay-as-you-drive • HOV lanes • Vanpool / carpool /
commuter programs

14
Strategies included: • Public transit • Transit-oriented development • Smart growth land use patterns
15
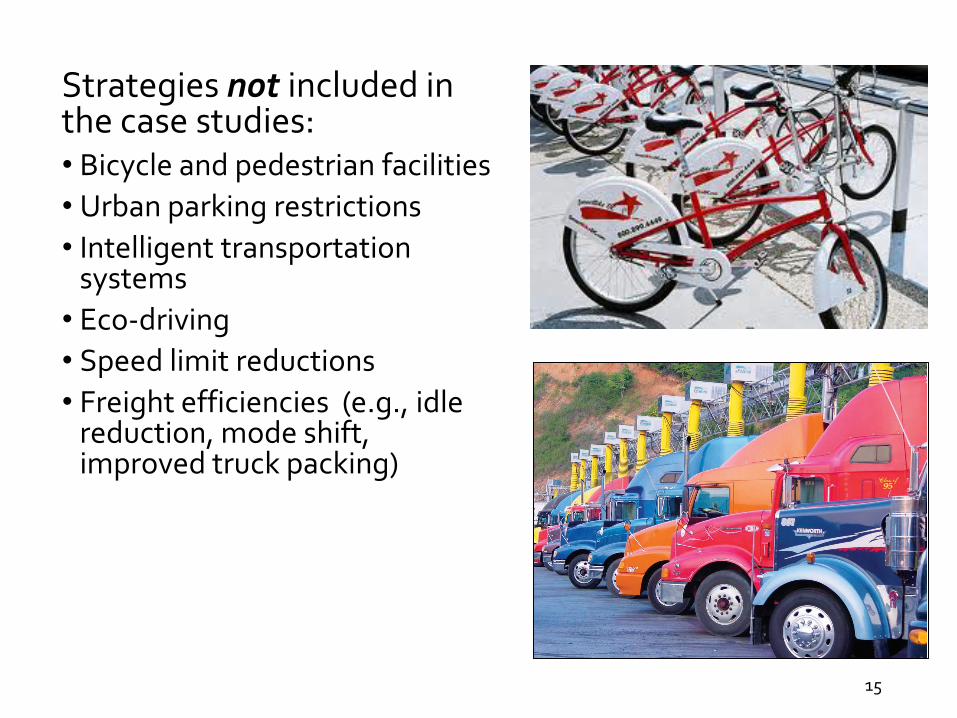
Strategies not included in the case studies: • Bicycle and pedestrian facilities • Urban parking restrictions • Intelligent transportation
systems • Eco-driving • Speed limit reductions • Freight efficiencies (e.g., idle
reduction, mode shift, improved truck packing)
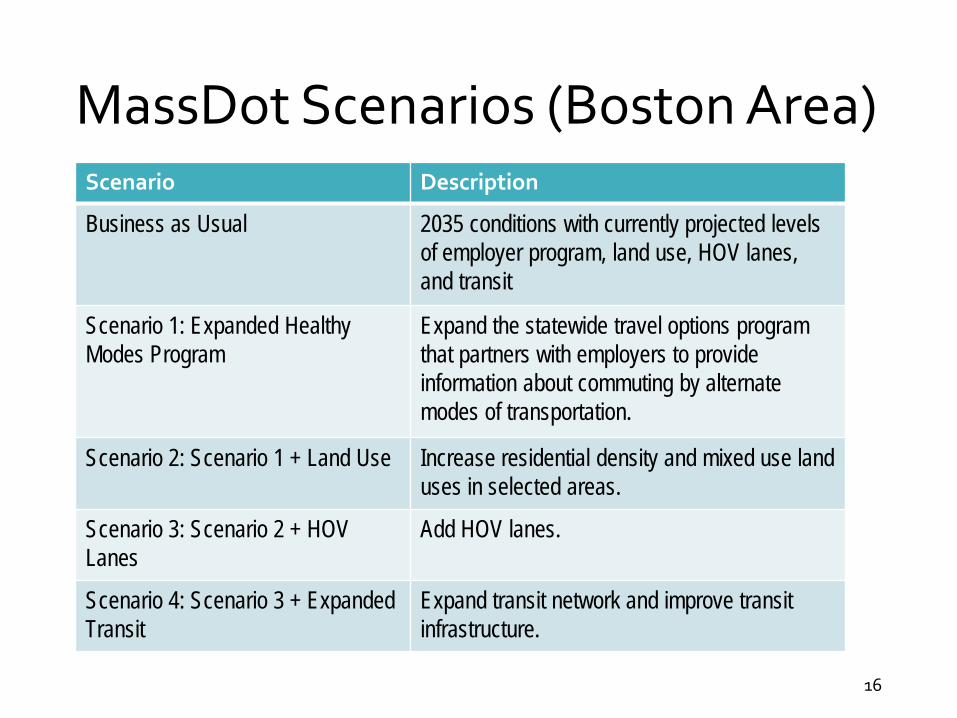
MassDot Scenarios (Boston Area)
16
Scenario Description
Business as Usual
2035 conditions with currently projected levels of employer program, land use, HOV lanes, and transit
Scenario 1: Expanded Healthy Modes Program
Expand the statewide travel options program that partners with employers to provide information about commuting by alternate modes of transportation.
Scenario 2: Scenario 1 + Land Use Increase residential density and mixed use land uses in selected areas.
Scenario 3: Scenario 2 + HOV Lanes
Add HOV lanes.
Scenario 4: Scenario 3 + Expanded Transit
Expand transit network and improve transit infrastructure.

Mass DOT Results
17
Scenario Light-Duty VMT
GHGs (CO2 equivalent) PM2.5 NOx VOC
Scenario 1: Expanded Healthy Modes Program -2.80% -2.80% -2.80% -2.79% -2.77%
Scenario 2: Scenario 1 + Land Use -3.89% -3.89% -3.88% -3.88% -3.84%
Scenario 3: Scenario 2 + HOV Lanes -4.07% -4.06% -4.06% -4.05% -4.02%
Scenario 4: Scenario 3 + Expanded Transit -4.41% -4.41% -4.40% -4.39% -4.36%
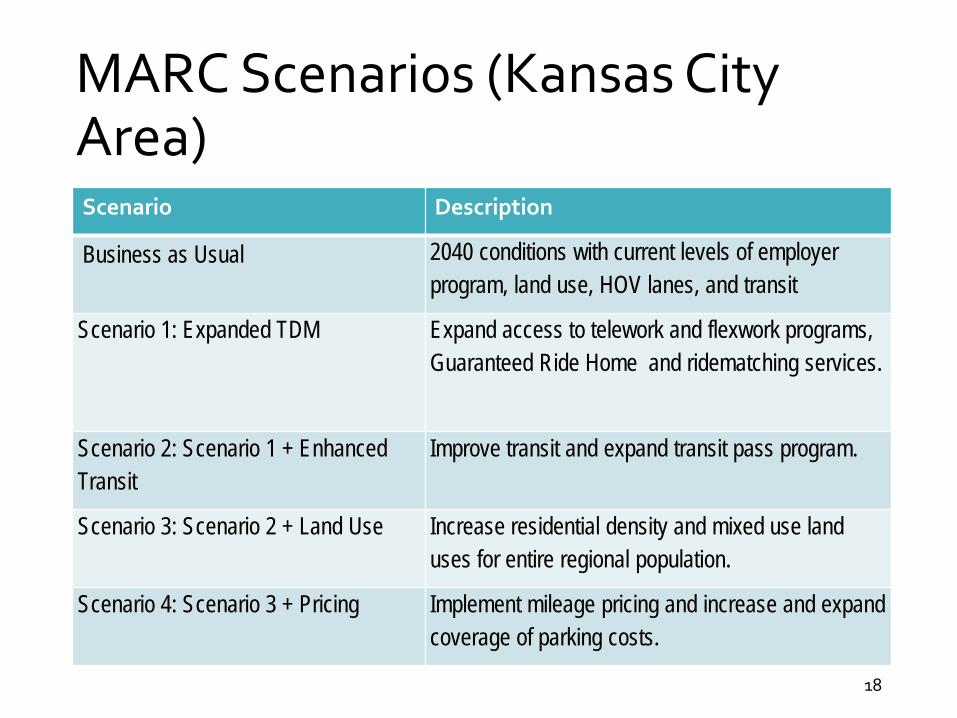
MARC Scenarios (Kansas City Area)
18
Scenario Description
Business as Usual
2040 conditions with current levels of employer program, land use, HOV lanes, and transit
Scenario 1: Expanded TDM Expand access to telework and flexwork programs, Guaranteed Ride Home and ridematching services.
Scenario 2: Scenario 1 + Enhanced Transit
Improve transit and expand transit pass program.
Scenario 3: Scenario 2 + Land Use Increase residential density and mixed use land uses for entire regional population.
Scenario 4: Scenario 3 + Pricing Implement mileage pricing and increase and expand coverage of parking costs.
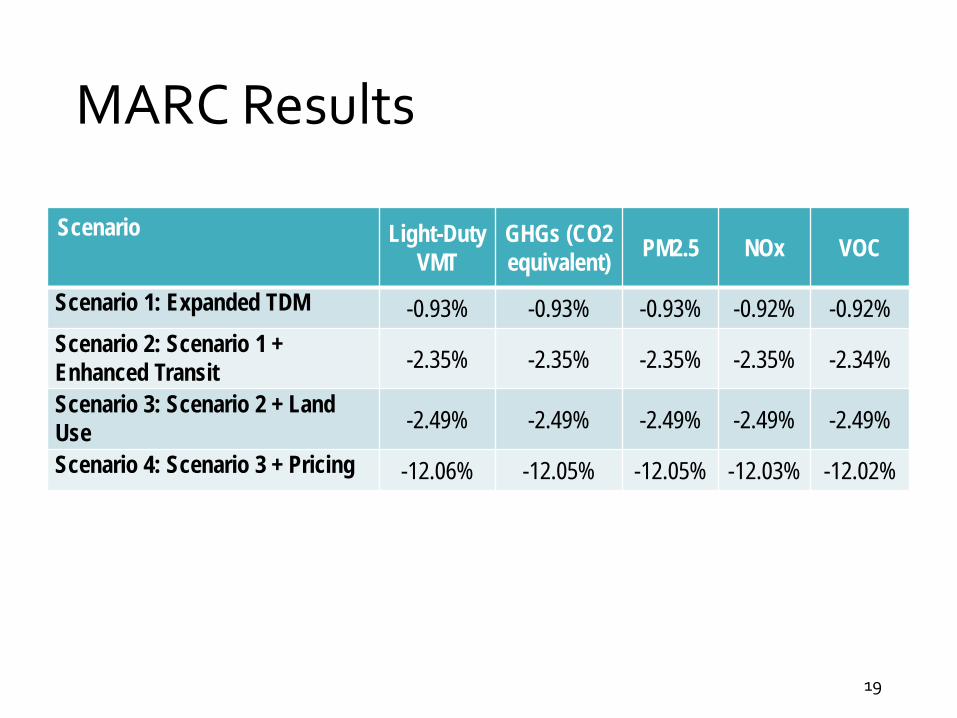
MARC Results
19
Scenario Light-Duty VMT
GHGs (CO2 equivalent) PM2.5 NOx VOC
Scenario 1: Expanded TDM -0.93% -0.93% -0.93% -0.92% -0.92% Scenario 2: Scenario 1 + Enhanced Transit -2.35% -2.35% -2.35% -2.35% -2.34%
Scenario 3: Scenario 2 + Land Use -2.49% -2.49% -2.49% -2.49% -2.49%
Scenario 4: Scenario 3 + Pricing -12.06% -12.05% -12.05% -12.03% -12.02%
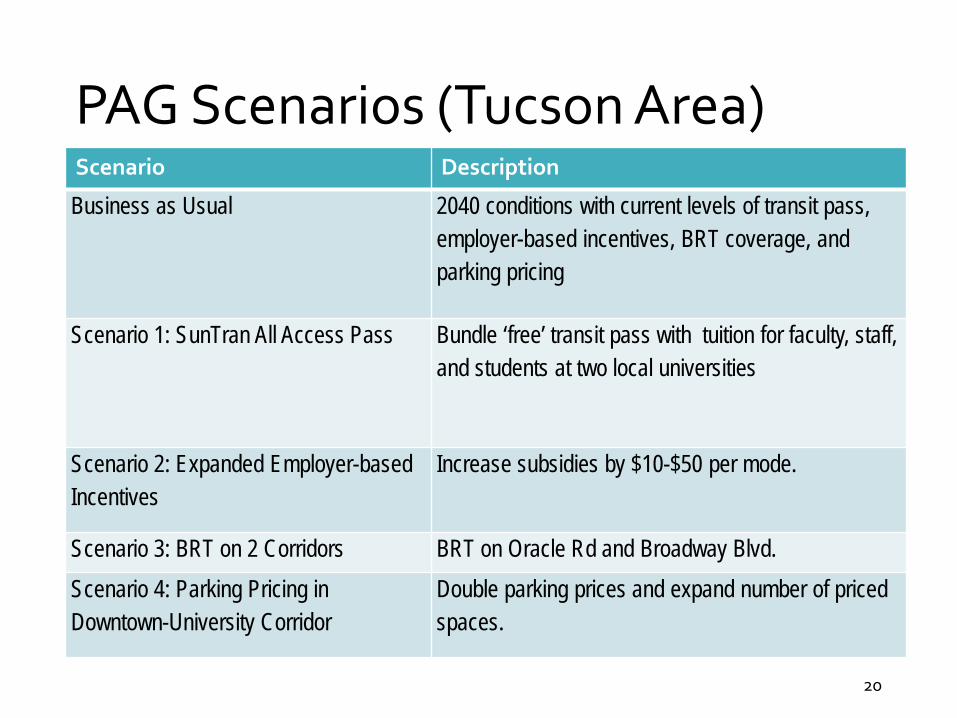
PAG Scenarios (Tucson Area)
20
Scenario Description
Business as Usual 2040 conditions with current levels of transit pass, employer-based incentives, BRT coverage, and parking pricing
Scenario 1: SunTran All Access Pass Bundle ‘free’ transit pass with tuition for faculty, staff, and students at two local universities
Scenario 2: Expanded Employer-based Incentives
Increase subsidies by $10-$50 per mode.
Scenario 3: BRT on 2 Corridors BRT on Oracle Rd and Broadway Blvd. Scenario 4: Parking Pricing in Downtown-University Corridor
Double parking prices and expand number of priced spaces.
EPA Land Use Scenario for PAG
• PAG chose not to include a land use scenario • EPA proposed a land use scenario based upon the existing
Imagine Greater Tucson (IGT) regional vision
• IGT is a nonprofit “community values” organization
• Vision is based on 46K responses to survey
• The IGT population density is 50% greater than in the existing long range regional transportation plan
• Concentrates population growth in existing urban centers
21
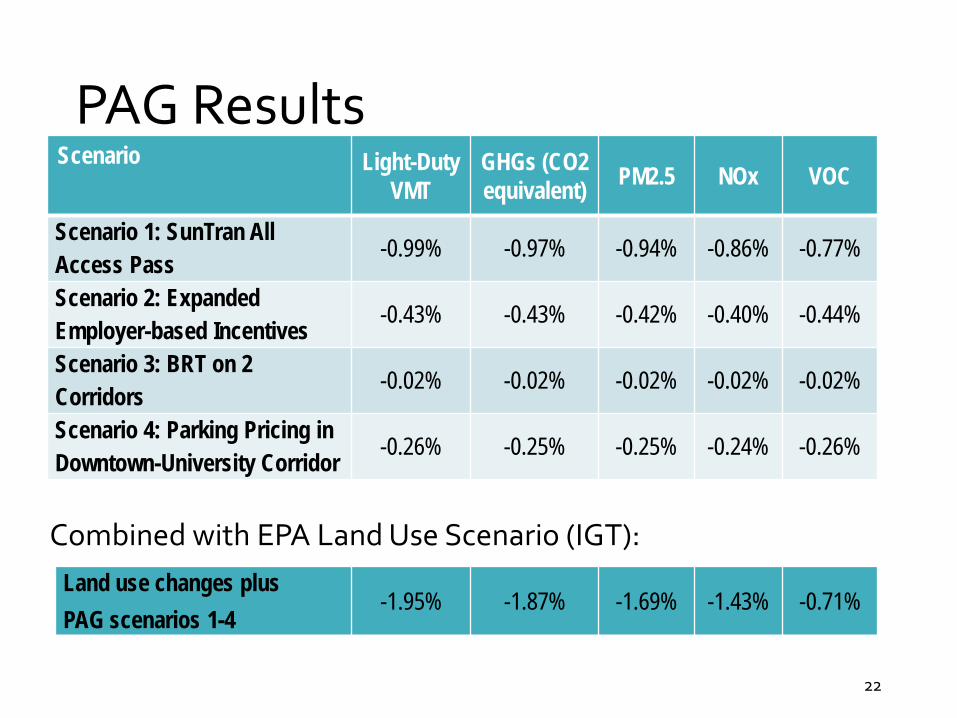
PAG Results
22
Scenario Light-Duty VMT
GHGs (CO2 equivalent) PM2.5 NOx VOC
Scenario 1: SunTran All Access Pass -0.99% -0.97% -0.94% -0.86% -0.77%
Scenario 2: Expanded Employer-based Incentives -0.43% -0.43% -0.42% -0.40% -0.44%
Scenario 3: BRT on 2 Corridors -0.02% -0.02% -0.02% -0.02% -0.02%
Scenario 4: Parking Pricing in Downtown-University Corridor -0.26% -0.25% -0.25% -0.24% -0.26%
Combined with EPA Land Use Scenario (IGT): Land use changes plus PAG scenarios 1-4
-1.95% -1.87% -1.69% -1.43% -0.71%

• It takes time to identify data requirements, collect or identify
substitute data elements, and to validate the appropriateness of data
• Areas are becoming increasingly familiar with MOVES and developing their own local inputs
• Default inputs are sufficient to compare and contrast different scenarios for this non-regulatory purpose
• The reasonableness and application of travel activity data in common use should not be taken for granted
• VMT distribution across vehicle types and road types are critical for accurate emissions estimation
Findings (Data)
23

• Larger reductions result from combinations of mutually supportive strategies modeled together, compared to the sum of individual strategies
• When the modeled population or geography represents a subset of the region, the reductions may be large for the subset, but quite small for the whole region
• Reductions from each region are smaller but generally within the range for similar regions in our 2010 national study • Results differing from our 2010 national study and other research appears to
be related to the limitation of TRIMMS land use component • Results among the case studies and the 2010 study are not directly
comparable, due to differing underlying assumptions and affected populations
Findings (Analysis)
24

Conclusions • The TEAM approach, utilizing existing data, tools and methods, is
capable of supporting State and local GHG planning and initial scenario evaluation • Provides consistency between data, tools and procedures used by
States and MPOs for regulatory transportation and air quality planning purposes
• TEAM can provide a relatively rapid and low cost evaluation of travel efficiency strategies
• The TEAM approach represents an efficient, but still evolving
procedure to estimate emission reductions from travel efficiency strategies • Provides an efficient “method” for local governments to assess multi-
pollutant benefits of travel efficiency strategies • Differences between the case studies and the 2010 national study
suggests the land use component of TRIMMS may be a factor
25