travel and tourism in saudi arabia to 2018 · travel and tourism in saudi arabia to 2018 page 1 ......
TRANSCRIPT
Travel and Tourism in Saudi Arabia to 2018 Page 1
© Timetric. This product is licensed and is not to be photocopied Published: May 2014
Travel and Tourism in Saudi
Arabia to 2018
Report Code: TT0175MR
Publication Date: May 2014
www.timetric.com
John Carpenter House
7 Carmelite Street
London
EC4Y 0BS
UK
Tel: +44 (0)20 7936 6400
Fax: +44 (0)20 7336 6813
EXECUTIVE SUMMARY
Travel and Tourism in Saudi Arabia to 2018 Page 2
© Timetric. This product is licensed and is not to be photocopied Published: May 2014
1 EXECUTIVE SUMMARY
Saudi Arabia has an oil-driven economy, as for several years the country has been dependent on oil
and related sectors for economic growth. However, focus has shifted to development of other sectors
such as tourism in order to decrease dependence on oil, particularly after the global financial crisis of
2009 when the oil sector declined at a rate of XX.XX%. The move will also create employment
opportunities in sectors other than oil within the country.
1.1 Key Trends and Issues
Timetric has identified the following key trends and issues in the travel and tourism sector in Saudi
Arabia:
1.1.1 Relaxed visa rules will increase inbound tourism
1.1.2 Entry of new airlines
1.1.3 Growing importance of tourism sector
EXECUTIVE SUMMARY
Travel and Tourism in Saudi Arabia to 2018 Page 3
© Timetric. This product is licensed and is not to be photocopied Published: May 2014
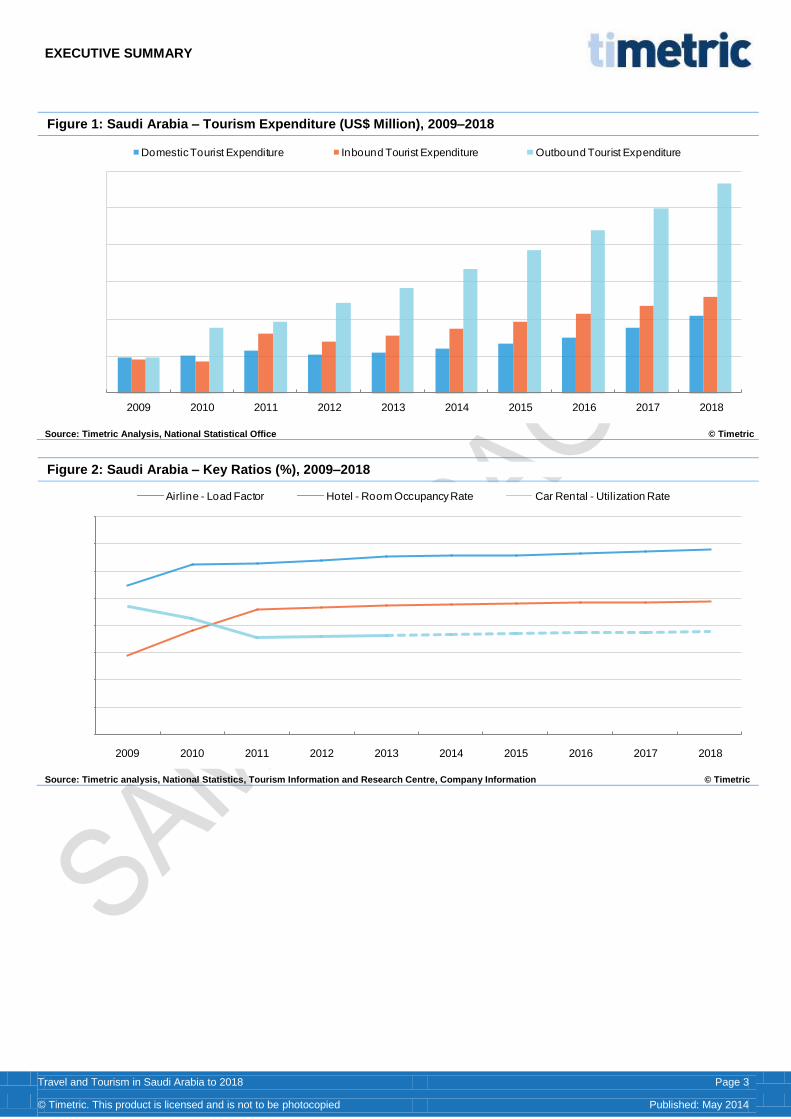
Figure 1: Saudi Arabia – Tourism Expenditure (US$ Million), 2009–2018
Source: Timetric Analysis, National Statistical Office © Timetric
Figure 2: Saudi Arabia – Key Ratios (%), 2009–2018
Source: Timetric analysis, National Statistics, Tourism Information and Research Centre, Company Information © Timetric
0
10,000
20,000
30,000
40,000
50,000
60,000
2009 2010 2011 2012 2013 2014 2015 2016 2017 2018
Domestic Tourist Expenditure Inbound Tourist Expenditure Outbound Tourist Expenditure
40%
45%
50%
55%
60%
65%
70%
75%
80%
2009 2010 2011 2012 2013 2014 2015 2016 2017 2018
Airline - Load Factor Hotel - Room Occupancy Rate Car Rental - Utilization Rate
TABLE OF CONTENTS
Travel and Tourism in Saudi Arabia to 2018 Page 4
© Timetric. This product is licensed and is not to be photocopied Published: May 2014
TABLE OF CONTENTS
1 Executive Summary ................................................................................................................................. 2
1.1 Key Trends and Issues ..................................................................................................................................................................2
1.1.1 Relaxed visa rules will increase inbound tourism ...................................................................................................................................... 2
1.1.2 Entry of new airlines ................................................................................................................................................................................. 2
1.1.3 Growing importance of tourism sector ...................................................................................................................................................... 2
2 The Travel and Tourism Sector In Context .......................................................................................... 13
2.1 Religious Tourism is the Forte of the Saudi Arabian Tourism Sector ........................................................................................... 13
3 Country Fact Sheet ................................................................................................................................ 14
4 Tourism Flows ....................................................................................................................................... 15
4.1 The Market ................................................................................................................................................................................... 15
4.1.1 Domestic tourism ................................................................................................................................................................................... 15
4.1.2 Inbound tourism ..................................................................................................................................................................................... 16
4.1.3 Outbound tourism .................................................................................................................................................................................. 18
4.2 Key Developments ....................................................................................................................................................................... 20
4.2.1 Increasing importance of the tourism sector ........................................................................................................................................... 20
4.2.2 Tourism ties with Greece ....................................................................................................................................................................... 20
4.2.3 Promotion of domestic tourism ............................................................................................................................................................... 20
4.2.4 Saudi Travel and Tourism Investment Market (STTIM) exhibition ........................................................................................................... 20
4.2.5 Relaxation in visa rules .......................................................................................................................................................................... 21
4.2.6 Promotional campaigns .......................................................................................................................................................................... 21
4.2.7 Tourism promotion by other countries in Saudi Arabia ........................................................................................................................... 21
4.2.8 Inbound tourism challenges ................................................................................................................................................................... 21
4.3 Timetric View ............................................................................................................................................................................... 22
4.3.1 Domestic tourism ................................................................................................................................................................................... 22
4.3.2 Inbound tourism ..................................................................................................................................................................................... 22
4.3.3 Outbound tourism .................................................................................................................................................................................. 23
5 Airlines ................................................................................................................................................... 24
5.1 The Market ................................................................................................................................................................................... 24
5.2 Key Developments ....................................................................................................................................................................... 24
5.2.1 Foreign airlines to serve on domestic routes .......................................................................................................................................... 24
5.2.2 New airline to be launched ..................................................................................................................................................................... 25
5.2.3 Privatization of Saudi Airlines ................................................................................................................................................................. 25
5.2.4 Airport infrastructure improvement ......................................................................................................................................................... 25
5.3 Competitive Landscape ................................................................................................................................................................ 26
5.4 Timetric View ............................................................................................................................................................................... 27
6 Hotels ...................................................................................................................................................... 28
6.1 The Market ................................................................................................................................................................................... 28
6.2 Key Developments ....................................................................................................................................................................... 29
6.2.1 High hotel investment............................................................................................................................................................................. 29
6.2.2 Occupancy rates lower than the UAE ..................................................................................................................................................... 29
6.3 Competitive Landscape ................................................................................................................................................................ 30
6.4 Timetric View ............................................................................................................................................................................... 31
7 Car Rental ............................................................................................................................................... 32
7.1 The Market ................................................................................................................................................................................... 32
7.2 Key Developments ....................................................................................................................................................................... 32
7.2.1 Seasonal demand .................................................................................................................................................................................. 32
7.2.2 Car rental market on upward trend ......................................................................................................................................................... 33
7.2.3 Acquisition to enter Saudi market ........................................................................................................................................................... 33
TABLE OF CONTENTS
Travel and Tourism in Saudi Arabia to 2018 Page 5
© Timetric. This product is licensed and is not to be photocopied Published: May 2014
7.3 Competitive Landscape ................................................................................................................................................................ 33
7.4 Timetric View ............................................................................................................................................................................... 33
8 Travel Intermediaries ............................................................................................................................. 34
8.1 The Market ................................................................................................................................................................................... 34
8.2 Key Developments ....................................................................................................................................................................... 34
8.2.1 Increasing need for tour operators ......................................................................................................................................................... 34
8.2.2 Expansion of Al Tayyar Travel Group ..................................................................................................................................................... 35
8.3 Timetric View ............................................................................................................................................................................... 35
9 Tourism Board Profile ........................................................................................................................... 36
9.1 Tourist Board Description ............................................................................................................................................................. 36
9.2 Target Market ............................................................................................................................................................................... 36
10 Airport Profiles ....................................................................................................................................... 37
10.1 Saudi Arabia Airports ................................................................................................................................................................... 37
10.1.1 Overview ................................................................................................................................................................................................ 37
10.1.2 Operator profile ...................................................................................................................................................................................... 38
10.1.3 Routes ................................................................................................................................................................................................... 38
11 Company Profiles – Airlines.................................................................................................................. 39
11.1 Company Profile: Saudi Arabian Airlines ..................................................................................................................................... 39
11.1.1 Saudi Arabian Airlines – company overview ........................................................................................................................................... 39
11.1.2 Saudi Arabian Airlines – main services .................................................................................................................................................. 39
11.1.3 Saudi Arabian Airlines – key employees ................................................................................................................................................ 40
11.2 Company Profile: Flynas Company LCC ...................................................................................................................................... 41
11.2.1 Flynas Company LCC – company overview ........................................................................................................................................... 41
11.2.2 Flynas Company LCC – main services ................................................................................................................................................... 41
11.2.3 Flynas Company LCC – key employees ................................................................................................................................................. 41
11.3 Company Profile: EgyptAir Saudi Arabia ...................................................................................................................................... 42
11.3.1 EgyptAir Saudi Arabia – company overview ........................................................................................................................................... 42
11.3.2 EgyptAir Saudi Arabia – main services ................................................................................................................................................... 42
11.3.3 EgyptAir Saudi Arabia – key employees ................................................................................................................................................. 42
11.4 Company Profile: Emirates Airline Saudi Arabia .......................................................................................................................... 43
11.4.1 Emirates Airline Saudi Arabia – company overview ................................................................................................................................ 43
11.4.2 Emirates Airline Saudi Arabia – main services ....................................................................................................................................... 43
11.4.3 Emirates Airline Saudi Arabia – key employees ..................................................................................................................................... 43
11.5 Company Profile: flydubai Saudi Arabia ....................................................................................................................................... 44
11.5.1 flydubai Saudi Arabia – company overview ............................................................................................................................................ 44
11.5.2 flydubai Saudi Arabia – main services .................................................................................................................................................... 44
11.5.3 flydubai Saudi Arabia – key employees .................................................................................................................................................. 44
12 Company Profiles – Hotels .................................................................................................................... 45
12.1 Company Profile: Boudl Hotels & Resorts .................................................................................................................................... 45
12.1.1 Boudl Hotels & Resorts – company overview ......................................................................................................................................... 45
12.1.2 Boudl Hotels & Resorts – main services ................................................................................................................................................. 45
12.1.3 Boudl Hotels & Resorts – key employees ............................................................................................................................................... 45
12.2 Company Profile: InterContinental Hotels Saudi Arabia ............................................................................................................... 46
12.2.1 InterContinental Hotels Saudi Arabia – company overview..................................................................................................................... 46
12.2.2 InterContinental Hotels Saudi Arabia – main services ............................................................................................................................ 46
12.2.3 InterContinental Hotels Saudi Arabia – key employees .......................................................................................................................... 46
12.3 Company Profile: Wyndham Hotel Group Saudi Arabia ............................................................................................................... 47
12.3.1 Wyndham Hotel Group Saudi Arabia – company overview ..................................................................................................................... 47
12.3.2 Wyndham Hotel Group Saudi Arabia – main services ............................................................................................................................ 47
12.3.3 Wyndham Hotel Group Saudi Arabia – key employees .......................................................................................................................... 47
TABLE OF CONTENTS
Travel and Tourism in Saudi Arabia to 2018 Page 6
© Timetric. This product is licensed and is not to be photocopied Published: May 2014
12.4 Company Profile: Accor KSA ....................................................................................................................................................... 48
12.4.1 Accor KSA – company overview ............................................................................................................................................................ 48
12.4.2 Accor KSA – main services .................................................................................................................................................................... 48
12.4.3 Accor KSA – key employees .................................................................................................................................................................. 48
12.5 Company Profile: Elaf Group, Inc. ................................................................................................................................................ 49
12.5.1 Elaf Group, Inc. – company overview ..................................................................................................................................................... 49
12.5.2 Elaf Group, Inc. – main services............................................................................................................................................................. 49
12.5.3 Elaf Group, Inc. – key employees ........................................................................................................................................................... 50
13 Company Profiles – Car Rental ............................................................................................................. 51
13.1 Company Profile: Budget Rent A Car Saudi Arabia ..................................................................................................................... 51
13.1.1 Budget Rent A Car Saudi Arabia – company overview ........................................................................................................................... 51
13.1.2 Budget Rent A Car Saudi Arabia – main services .................................................................................................................................. 51
13.1.3 Budget Rent A Car Saudi Arabia – key employees ................................................................................................................................ 52
13.2 Company Profile: Europcar Saudi Arabia ..................................................................................................................................... 53
13.2.1 Europcar Saudi Arabia – company overview .......................................................................................................................................... 53
13.2.2 Europcar Saudi Arabia – main services .................................................................................................................................................. 53
13.3 Company Profile: Sixt-KSA .......................................................................................................................................................... 54
13.3.1 Sixt-KSA – company overview ............................................................................................................................................................... 54
13.3.2 Sixt-KSA – main services ....................................................................................................................................................................... 54
13.3.3 Sixt-KSA – key employees ..................................................................................................................................................................... 54
13.4 Company Profile: Avis Saudi Arabia ............................................................................................................................................ 55
13.4.1 Avis Saudi Arabia – company overview .................................................................................................................................................. 55
13.4.2 Avis Saudi Arabia – main services ......................................................................................................................................................... 55
13.4.3 Avis Saudi Arabia – key employees ....................................................................................................................................................... 55
13.5 Company Profile: Al Tala’a International Transportation Co. Ltd ................................................................................................. 56
13.5.1 Al Tala’a International Transportation Co. Ltd – company overview ....................................................................................................... 56
13.5.2 Al Tala’a International Transportation Co. Ltd – main services ............................................................................................................... 56
13.5.3 Al Tala’a International Transportation Co. Ltd – key employees ............................................................................................................. 56
14 Company Profiles – Travel Intermediaries ........................................................................................... 57
14.1 Company Profile: Al Tayyar Travel Group .................................................................................................................................... 57
14.1.1 Al Tayyar Travel Group – company overview ......................................................................................................................................... 57
14.1.2 Al Tayyar Travel Group – main services ................................................................................................................................................. 57
14.1.3 Al Tayyar Travel Group – key employees ............................................................................................................................................... 58
14.2 Company Profile: Saddik & Mohammed Attar Company .............................................................................................................. 59
14.2.1 Saddik & Mohammed Attar Company – company overview ................................................................................................................... 59
14.2.2 Saddik & Mohammed Attar Company – main services ........................................................................................................................... 59
14.2.3 Saddik & Mohammed Attar Company – key employees ......................................................................................................................... 59
14.3 Company Profile: Kanoo Travel Saudi Arabia .............................................................................................................................. 60
14.3.1 Kanoo Travel Saudi Arabia – company overview ................................................................................................................................... 60
14.3.2 Kanoo Travel Saudi Arabia – main services ........................................................................................................................................... 60
14.3.3 Kanoo Travel Saudi Arabia – key employees ......................................................................................................................................... 60
14.4 Company Profile: Zahid Travel Group .......................................................................................................................................... 61
14.4.1 Zahid Travel Group – company overview ............................................................................................................................................... 61
14.4.2 Zahid Travel Group – main services ....................................................................................................................................................... 61
14.5 Company Profile: Zamil Travel ..................................................................................................................................................... 62
14.5.1 Zamil Travel – company overview .......................................................................................................................................................... 62
14.5.2 Zamil Travel – main services .................................................................................................................................................................. 62
15 Market Data Analysis ............................................................................................................................. 63
15.1 Tourism Output ............................................................................................................................................................................ 63
15.1.1 Total tourism output ............................................................................................................................................................................... 63
15.1.2 Direct tourism output .............................................................................................................................................................................. 64
TABLE OF CONTENTS
Travel and Tourism in Saudi Arabia to 2018 Page 7
© Timetric. This product is licensed and is not to be photocopied Published: May 2014
15.1.3 Indirect tourism output............................................................................................................................................................................ 65
15.1.4 Tourism output per employee ................................................................................................................................................................. 66
15.1.5 Direct tourism output per employee ........................................................................................................................................................ 67
15.1.6 Indirect tourism output per employee ..................................................................................................................................................... 68
15.2 Tourism Employment ................................................................................................................................................................... 69
15.2.1 Total tourism employment ...................................................................................................................................................................... 69
15.2.2 Direct tourism employment..................................................................................................................................................................... 70
15.2.3 Indirect tourism employment .................................................................................................................................................................. 71
15.2.4 Tourism employee compensation ........................................................................................................................................................... 72
15.2.5 Total gross income generated by total tourism employment ................................................................................................................... 73
15.3 Domestic Tourism ........................................................................................................................................................................ 74
15.3.1 Domestic trips by purpose of visit ........................................................................................................................................................... 74
15.3.2 Number of overnight stays ..................................................................................................................................................................... 75
15.3.3 Total domestic tourist expenditure .......................................................................................................................................................... 76
15.3.4 Average expenditure per domestic tourist by category ........................................................................................................................... 77
15.4 Inbound Tourism .......................................................................................................................................................................... 78
15.4.1 International arrivals by region ............................................................................................................................................................... 78
15.4.2 International arrivals by purpose of visit ................................................................................................................................................. 79
15.4.3 International arrivals by mode of transport.............................................................................................................................................. 80
15.4.4 Total inbound tourism expenditure by category ...................................................................................................................................... 81
15.4.5 Average international tourist expenditure by category ............................................................................................................................ 82
15.5 Outbound Tourism Flows ............................................................................................................................................................. 83
15.5.1 International departures by region .......................................................................................................................................................... 83
15.5.2 International departures by purpose of visit ............................................................................................................................................ 84
15.5.3 International departures by mode of transport ........................................................................................................................................ 85
15.5.4 Number of overnight stays ..................................................................................................................................................................... 86
15.5.5 Total outbound tourism expenditure by category .................................................................................................................................... 87
15.5.6 Average outbound expenditure per resident by category ........................................................................................................................ 88
15.6 Airlines ......................................................................................................................................................................................... 89
15.6.1 Seats available ...................................................................................................................................................................................... 89
15.6.2 Seats sold by carrier type – business travel ........................................................................................................................................... 90
15.6.3 Seats sold by carrier type – leisure travel ............................................................................................................................................... 91
15.6.4 Load factor by carrier type ..................................................................................................................................................................... 92
15.6.5 Passenger kilometers available by carrier type ...................................................................................................................................... 93
15.6.6 Revenue-generating passenger kilometers by carrier type ..................................................................................................................... 94
15.6.7 Revenue per passenger by carrier type .................................................................................................................................................. 95
15.6.8 Total revenue by carrier type .................................................................................................................................................................. 96
15.7 Hotels ........................................................................................................................................................................................... 97
15.7.1 Establishments by hotel category ........................................................................................................................................................... 97
15.7.2 Available rooms by hotel category .......................................................................................................................................................... 98
15.7.3 Room occupancy rate by hotel category ................................................................................................................................................ 99
15.7.4 Room nights available by hotel category .............................................................................................................................................. 100
15.7.5 Room nights occupied by hotel category .............................................................................................................................................. 101
15.7.6 Average revenue per available room by hotel category ........................................................................................................................ 102
15.7.7 Revenue per occupied room by hotel category .................................................................................................................................... 103
15.7.8 Total revenue per available room by hotel category ............................................................................................................................. 104
15.7.9 Total revenue by hotel category and customer type ............................................................................................................................. 105
15.7.10 Guests by hotel category and customer type ........................................................................................................................................ 106
15.8 Car Rentals ................................................................................................................................................................................ 107
15.8.1 Market value by customer type and rental location ............................................................................................................................... 107
15.8.2 Fleet size ............................................................................................................................................................................................. 108
15.8.3 Rental occasions.................................................................................................................................................................................. 109
15.8.4 Rental days .......................................................................................................................................................................................... 110
TABLE OF CONTENTS
Travel and Tourism in Saudi Arabia to 2018 Page 8
© Timetric. This product is licensed and is not to be photocopied Published: May 2014
15.8.5 Average rental length ........................................................................................................................................................................... 110
15.8.6 Utilization rate ...................................................................................................................................................................................... 111
15.8.7 Average revenue per day ..................................................................................................................................................................... 112
15.9 Travel Intermediaries ................................................................................................................................................................. 113
15.9.1 Market value by product type ............................................................................................................................................................... 113
15.9.2 Online revenues by type of intermediary or provider ............................................................................................................................ 114
15.9.3 Online revenues by type of tourist ........................................................................................................................................................ 115
15.9.4 In-store revenues by type of intermediary ............................................................................................................................................ 116
15.9.5 In-store revenues by type of tourist ...................................................................................................................................................... 117
15.9.6 Travel agent revenues from domestic tourism, by sales channel .......................................................................................................... 118
15.9.7 Travel agent revenues from international tourism by sales channel ...................................................................................................... 119
15.9.8 Tour operator revenues from domestic tourism, by sales channel ........................................................................................................ 120
15.9.9 Tour operator revenues from international tourism, by sales channel ................................................................................................... 121
15.9.10 Other intermediaries’ revenues from domestic tourism, by sales channel ............................................................................................. 122
15.9.11 Other intermediaries’ revenues from international tourism by sales channel ......................................................................................... 123
16 Appendix .............................................................................................................................................. 124
16.1 What is This Report About? ....................................................................................................................................................... 124
16.2 Definitions .................................................................................................................................................................................. 124
16.3 Methodology .............................................................................................................................................................................. 129
16.4 Contact Timetric ......................................................................................................................................................................... 131
16.5 About Timetric ............................................................................................................................................................................ 131
16.6 Timetric’s Services ..................................................................................................................................................................... 131
16.7 Disclaimer .................................................................................................................................................................................. 133
LIST OF TABLES
Travel and Tourism in Saudi Arabia to 2018 Page 9
© Timetric. This product is licensed and is not to be photocopied Published: May 2014
LIST OF TABLES
Table 1: Saudi Arabia – Tourist Arrivals from Top 10 Countries (Thousand), 2009–2018 ................................................................................................ 17 Table 2: Saudi Arabia – Tourist Departures to Top 10 Countries (Thousand), 2009–2018 .............................................................................................. 19 Table 3: Saudi Arabia – Top 10 Hotels by Volume, 2013 ................................................................................................................................................ 30 Table 4: Saudi Commission for Tourism and Antiquities – Key Facts and Locations ....................................................................................................... 36 Table 5: King Fahd International Airport − Overview ....................................................................................................................................................... 37 Table 6: King Abdulaziz International Airport − Overview ................................................................................................................................................ 37 Table 7: King Khalid International Airport – Overview ...................................................................................................................................................... 37 Table 8: Prince Mohammad bin Abdulaziz Airport – Overview ........................................................................................................................................ 38 Table 9: Saudi Arabian Airlines, Key Facts ..................................................................................................................................................................... 39 Table 10: Saudi Arabian Airlines, Main Services ............................................................................................................................................................. 39 Table 11: Saudi Arabian Airlines, Key Employees ........................................................................................................................................................... 40 Table 12: Flynas Company LCC, Key Facts .................................................................................................................................................................... 41 Table 13: Flynas Company LCC, Main Services ............................................................................................................................................................. 41 Table 14: Flynas Company LCC, Key Employees ........................................................................................................................................................... 41 Table 15: EgyptAir Saudi Arabia Key Facts ..................................................................................................................................................................... 42 Table 16: EgyptAir Saudi Arabia, Main Services ............................................................................................................................................................. 42 Table 17: EgyptAir Saudi Arabia, Key Employees ........................................................................................................................................................... 42 Table 18: Emirates Airline Saudi Arabia, Key Facts ........................................................................................................................................................ 43 Table 19: Emirates Airline Saudi Arabia, Main Services .................................................................................................................................................. 43 Table 20: Emirates Airline Saudi Arabia, Key Employees................................................................................................................................................ 43 Table 21: flydubai Saudi Arabia, Key Facts ..................................................................................................................................................................... 44 Table 22: flydubai Saudi Arabia, Main Services .............................................................................................................................................................. 44 Table 23: flydubai Saudi Arabia, Key Employees ............................................................................................................................................................ 44 Table 24: Boudl Hotels & Resorts, Key Facts .................................................................................................................................................................. 45 Table 25: Boudl Hotels & Resorts, Main Services ........................................................................................................................................................... 45 Table 26: Boudl Hotels & Resorts, Key Employees ......................................................................................................................................................... 45 Table 27: InterContinental Hotels Saudi Arabia, Key Facts ............................................................................................................................................. 46 Table 28: InterContinental Hotels Saudi Arabia, Main Services ....................................................................................................................................... 46 Table 29: InterContinental Hotels Saudi Arabia, Key Employees .................................................................................................................................... 46 Table 30: Wyndham Hotel Group Saudi Arabia, Key Facts ............................................................................................................................................. 47 Table 31: Wyndham Hotel Group Saudi Arabia, Main Services and Brands .................................................................................................................... 47 Table 32: Wyndham Hotel Group Saudi Arabia, Key Employees .................................................................................................................................... 47 Table 33: Accor KSA, Key Facts ..................................................................................................................................................................................... 48 Table 34: Accor KSA, Main Services ............................................................................................................................................................................... 48 Table 35: Accor KSA, Key Employees ............................................................................................................................................................................ 48 Table 36: Elaf Group, Inc., Key Facts .............................................................................................................................................................................. 49 Table 37: Elaf Group, Inc., Main Services ....................................................................................................................................................................... 49 Table 38: Elaf Group, Inc., Key Employees ..................................................................................................................................................................... 50 Table 39: Budget Rent A Car Saudi Arabia, Key Facts ................................................................................................................................................... 51 Table 40: Budget Rent A Car Saudi Arabia, Main Services ............................................................................................................................................. 51 Table 41: Budget Rent A Car Saudi Arabia, Key Employees ........................................................................................................................................... 52 Table 42: Europcar Saudi Arabia, Key Facts ................................................................................................................................................................... 53 Table 43: Europcar Saudi Arabia, Main Services ............................................................................................................................................................ 53 Table 44: Sixt-KSA, Key Facts ........................................................................................................................................................................................ 54 Table 45: Sixt-KSA, Main Services ................................................................................................................................................................................. 54 Table 46: Sixt-KSA, Key Employees ............................................................................................................................................................................... 54 Table 47: Avis Saudi Arabia, Key Facts .......................................................................................................................................................................... 55 Table 48: Avis Saudi Arabia, Main Services .................................................................................................................................................................... 55 Table 49: Avis Saudi Arabia, Key Employees ................................................................................................................................................................. 55 Table 50: Al Tala’a International Transportation Co. Ltd, Key Facts ................................................................................................................................ 56 Table 51: Al Tala’a International Transportation Co. Ltd, Main Services .......................................................................................................................... 56 Table 52: Al Tala’a International Transportation Co. Ltd, Key Employees ....................................................................................................................... 56 Table 53: Al Tayyar Travel Group, Key Facts .................................................................................................................................................................. 57 Table 54: Al Tayyar Travel Group, Main Services ........................................................................................................................................................... 57 Table 55: Al Tayyar Travel Group, Key Employees ......................................................................................................................................................... 58 Table 56: Saddik & Mohammed Attar Company, Key Facts ............................................................................................................................................ 59 Table 57: Saddik & Mohammed Attar Company, Main Services ...................................................................................................................................... 59 Table 58: Saddik & Mohammed Attar Company, Key Employees ................................................................................................................................... 59 Table 59: Kanoo Travel Saudi Arabia, Key Facts ............................................................................................................................................................ 60 Table 60: Kanoo Travel Saudi Arabia, Main Services ...................................................................................................................................................... 60 Table 61: Kanoo Travel Saudi Arabia, Key Employees ................................................................................................................................................... 60 Table 62: Zahid Travel Group, Key Facts ........................................................................................................................................................................ 61 Table 63: Zahid Travel Group, Main Services ................................................................................................................................................................. 61 Table 64: Zamil Travel, Key Facts ................................................................................................................................................................................... 62 Table 65: Zamil Travel, Main Services ............................................................................................................................................................................ 62 Table 66: Saudi Arabia – Total Tourism Output by Category (SAR Billion), 2009–2018 .................................................................................................. 63
LIST OF TABLES
Travel and Tourism in Saudi Arabia to 2018 Page 10
© Timetric. This product is licensed and is not to be photocopied Published: May 2014
Table 67: Saudi Arabia – Direct Tourism Output by Category (SAR Billion), 2009–2018 ................................................................................................. 64 Table 68: Saudi Arabia – Indirect Tourism Output by Category (SAR Billion), 2009–2018 ............................................................................................... 65 Table 69: Saudi Arabia – Total Tourism Output Generated per Employee by Category (SAR Thousand), 2009–2018 .................................................... 66 Table 70: Saudi Arabia – Direct Tourism Output Generated per Employee by Category (SAR Thousand), 2009–2018 .................................................. 67 Table 71: Saudi Arabia – Indirect Tourism Output Generated per Employee by Category (SAR Thousand), 2009–2018 ................................................ 68 Table 72: Saudi Arabia – Total Tourism Employment by Category (Thousand), 2009–2018 ........................................................................................... 69 Table 73: Saudi Arabia – Total Tourism Employment as a Percentage of Total Employment by Category (%), 2009–2018 ............................................ 69 Table 74: Saudi Arabia – Direct Tourism Employment by Category (Thousand), 2009–2018 .......................................................................................... 70 Table 75: Saudi Arabia – Direct Tourism Employment as a Percentage of Total Employment by Category (%), 2009–2018 ........................................... 70 Table 76: Saudi Arabia – Indirect Tourism Employment by Category (Thousand), 2009–2018........................................................................................ 71 Table 77: Saudi Arabia – Indirect Tourism Employment as a Percentage of Total Employment by Category (%), 2009–2018 ........................................ 71 Table 78: Saudi Arabia – Average Salary per Employee by Category (SAR Thousand), 2009–2018 .............................................................................. 72 Table 79: Saudi Arabia – Total Gross Income Generated by Total Tourism Employment by Category (SAR Billion), 2009–2018.................................... 73 Table 80: Saudi Arabia – Number of Trips by Purpose (Million), 2009–2018 ................................................................................................................... 74 Table 81: Saudi Arabia – Overnight Stays (Million), 2009–2018 ...................................................................................................................................... 75 Table 82: Saudi Arabia – Total Domestic Tourism Expenditure by Category (SAR Billion), 2009–2018........................................................................... 76 Table 83: Saudi Arabia – Average Expenditure per Domestic Tourist by Category (SAR), 2009–2018 ........................................................................... 77 Table 84: Saudi Arabia – International Arrivals by Region (Thousands), 2009–2018 ....................................................................................................... 78 Table 85: Saudi Arabia – International Arrivals by Purpose of Visit (Thousand), 2009–2018 ........................................................................................... 79 Table 86: Saudi Arabia – International Arrivals by Mode of Transport (Thousand), 2009–2018 ....................................................................................... 80 Table 87: Saudi Arabia – Total Inbound Tourism Expenditure by Category (SAR Billion), 2009–2018 ............................................................................ 81 Table 88: Saudi Arabia – Average Expenditure per Inbound Tourist by Category (SAR), 2009–2018 ............................................................................. 82 Table 89: Saudi Arabia – International Departures by Region (Thousands), 2009–2018 ................................................................................................. 83 Table 90: Saudi Arabia – International Departures by Purpose of Visit (Thousand), 2009–2018 ..................................................................................... 84 Table 91: Saudi Arabia – International Departures by Mode of Transport (Thousand), 2009–2018 ................................................................................. 85 Table 92: Saudi Arabia – Overnight Stays (Million), 2009–2018 ...................................................................................................................................... 86 Table 93: Saudi Arabia – Total Outbound Tourism Expenditure by Category (SAR Billion), 2009–2018 .......................................................................... 87 Table 94: Saudi Arabia – Average Outbound Expenditure per Resident by Category (SAR), 2009–2018 ........................................................................ 88 Table 95: Saudi Arabia – Seats Available by Carrier Type (Thousand), 2009–2018 ........................................................................................................ 89 Table 96: Saudi Arabia – Seats Sold by Carrier Type – Business Travel (Thousand), 2009–2018 .................................................................................. 90 Table 97: Saudi Arabia – Seats Sold by Carrier Type – Leisure Travel (Thousand), 2009–2018 ..................................................................................... 91 Table 98: Saudi Arabia – Load Factor by Carrier Type (%), 2009–2018 .......................................................................................................................... 92 Table 99: Saudi Arabia – Passenger Kilometers Available by Carrier Type (Million), 2009–2018 .................................................................................... 93 Table 100: Saudi Arabia – Revenue Generating Passenger Kilometers by Carrier Type (Million), 2009–2018 ................................................................ 94 Table 101: Saudi Arabia – Revenue per Passenger by Carrier Type (SAR), 2009–2018................................................................................................. 95 Table 102: Saudi Arabia – Total Revenue by Carrier Type (SAR Million), 2009–2018 ..................................................................................................... 96 Table 103: Saudi Arabia – Establishments by Category (Actual), 2009–2018 ................................................................................................................. 97 Table 104: Saudi Arabia – Available Hotel Rooms by Hotel Category (Thousand), 2009–2018....................................................................................... 98 Table 105: Saudi Arabia – Room Occupancy Rate by Hotel Category (%), 2009–2018 .................................................................................................. 99 Table 106: Saudi Arabia – Room Nights Available by Hotel Category (Million), 2009–2018 .......................................................................................... 100 Table 107: Saudi Arabia – Room Nights Occupied by Hotel Category (Million), 2009–2018 .......................................................................................... 101 Table 108: Saudi Arabia – Average Revenue per Available Room by Hotel Category (SAR), 2009–2018 ..................................................................... 102 Table 109: Saudi Arabia – Revenue per Occupied Room by Hotel Category (SAR), 2009–2018 .................................................................................. 103 Table 110: Saudi Arabia – Total Revenue Per Available Room by Hotel Category (SAR), 2009–2018 .......................................................................... 104 Table 111: Saudi Arabia – Total Revenue by Hotel Category and Customer Type (SAR Million), 2009–2018 ............................................................... 105 Table 112: Saudi Arabia – Guests by Hotel Category and Customer Type (Thousand), 2009–2018 ............................................................................. 106 Table 113: Saudi Arabia – Market Value by Customer Type and Rental Location (SAR Million), 2009–2018 ................................................................ 107 Table 114: Saudi Arabia – Fleet Size (Actual), 2009–2018 ........................................................................................................................................... 108 Table 115: Saudi Arabia – Rental Occasions (Thousand), 2009–2018 .......................................................................................................................... 109 Table 116: Saudi Arabia – Rental Days (Million), 2009–2018 ........................................................................................................................................ 110 Table 117: Saudi Arabia – Average Rental Length (Days), 2009–2018 ......................................................................................................................... 110 Table 118: Saudi Arabia – Market Utilization Rate (%), 2009–2018 .............................................................................................................................. 111 Table 119: Saudi Arabia – Car Rental Average Revenue per Day (SAR), 2009–2018 .................................................................................................. 112 Table 120: Saudi Arabia – Travel Intermediaries’ Market Value by Product Type (SAR Billion), 2009–2018 ................................................................. 113 Table 121: Saudi Arabia – Travel Intermediaries’ Online Revenues by Provider (SAR Million), 2009–2018 .................................................................. 114 Table 122: Saudi Arabia – Travel Intermediaries’ Online Revenues by Type of Tourist (SAR Million), 2009–2018 ........................................................ 115 Table 123: Saudi Arabia – Travel Intermediaries’ In-Store Revenues by Provider (SAR Million), 2009–2018 ................................................................ 116 Table 124: Saudi Arabia – Travel Intermediaries’ In-Store Revenues by Type of Tourist (SAR Million), 2009–2018...................................................... 117 Table 125: Saudi Arabia – Travel Agent Revenues from Domestic Tourism by Sales Channel (SAR Million), 2009–2018 ............................................ 118 Table 126: Saudi Arabia – Travel Agent Revenues from International Tourism by Sales Channel (SAR Million), 2009–2018 ....................................... 119 Table 127: Saudi Arabia – Tour Operator Revenues from Domestic Tourism by Sales Channel (SAR Million), 2009–2018 .......................................... 120 Table 128: Saudi Arabia – Tour Operator Revenues from International Tourism by Sales Channel (SAR Million), 2009–2018 ..................................... 121 Table 129: Saudi Arabia – Other Intermediaries’ Revenues from Domestic Tourism by Sales Channel (SAR Million), 2009–2018 ............................... 122 Table 130: Saudi Arabia – Other Intermediaries’ Revenues from International Tourism by Sales Channel (SAR Million), 2009–2018 ........................... 123 Table 131: Timetric Travel and Tourism Sector Definitions ........................................................................................................................................... 124
LIST OF FIGURES
Travel and Tourism in Saudi Arabia to 2018 Page 11
© Timetric. This product is licensed and is not to be photocopied Published: May 2014
LIST OF FIGURES
Figure 1: Saudi Arabia – Tourism Expenditure (US$ Million), 2009–2018 ......................................................................................................................... 3 Figure 2: Saudi Arabia – Key Ratios (%), 2009–2018 ....................................................................................................................................................... 3 Figure 3: Saudi Arabia – Domestic Tourism Expenditure (SAR Million), 2009–2018 ....................................................................................................... 15 Figure 4: Saudi Arabia – International Arrivals by Mode of Transport (%), 2009 and 2013 .............................................................................................. 16 Figure 5: Saudi Arabia – International Departures by Purpose of Visit (Thousand), 2009–2018 ...................................................................................... 18 Figure 6: Saudi Arabia – Number of Trips by Purpose (Million), 2009–2018 .................................................................................................................... 22 Figure 7: Saudi Arabia – International Departures by Mode of Transport (%), 2013 and 2018 ........................................................................................ 23 Figure 8: Saudi Arabia – Seats Available by Carrier Type (Thousand), 2009–2018......................................................................................................... 24 Figure 9: Saudi Arabia – Passenger Airlines: Company Market Share by Volume (%), 2012 .......................................................................................... 26 Figure 10: Saudi Arabia – Seats Sold vs Seats Available (Million), 2009–2018 ............................................................................................................... 27 Figure 11: Saudi Arabia – Room Occupancy Rates (%), 2009–2018 .............................................................................................................................. 28 Figure 12: Country Comparison – Room Occupancy Rate (%), 2009–2018 .................................................................................................................... 29 Figure 13: Saudi Arabia – Total Hotel Revenue (SAR Million), 2009–2018 ..................................................................................................................... 31 Figure 14: Saudi Arabia – Car Rental Value by Location (SAR Million), 2009–2018 ........................................................................................................ 32 Figure 15: Saudi Arabia – Average Revenue per Day (SAR), 2009–2018 ....................................................................................................................... 33 Figure 16: Saudi Arabia – Travel Intermediaries Market Value by Channel (SAR Million), 2009–2018 ............................................................................ 34 Figure 17: Saudi Arabia – Travel Intermediaries Market Value by Product Type (SAR Million), 2009–2018 .................................................................... 35 Figure 18: Saudi Arabia – Total Tourism Output by Category (SAR Billion), 2009–2018 ................................................................................................. 63 Figure 19: Saudi Arabia – Direct Tourism Output by Category (SAR Billion), 2009–2018 ................................................................................................ 64 Figure 20: Saudi Arabia – Indirect Tourism Output by Category (SAR Billion), 2009–2018 ............................................................................................. 65 Figure 21: Saudi Arabia – Total Tourism Output Generated per Employee by Category (SAR Thousand), 2009–2018 ................................................... 66 Figure 22: Saudi Arabia – Direct Tourism Output Generated per Employee by Category (SAR Thousand), 2009–2018 ................................................. 67 Figure 23: Saudi Arabia – Indirect Tourism Output Generated per Employee by Category (SAR Thousand), 2009–2018 ............................................... 68 Figure 24: Saudi Arabia – Total Tourism Employment by Category (Thousand), 2009–2018 .......................................................................................... 69 Figure 25: Saudi Arabia – Direct Tourism Employment by Category (Thousand), 2009–2018 ......................................................................................... 70 Figure 26: Saudi Arabia – Indirect Tourism Employment by Category (Thousand), 2009–2018 ...................................................................................... 71 Figure 27: Saudi Arabia – Average Salary per Employee by Category (SAR Thousand), 2009–2018 ............................................................................. 72 Figure 28: Saudi Arabia – Total Gross Income Generated by Total Tourism Employment by Category (SAR Billion), 2009–2018 .................................. 73 Figure 29: Saudi Arabia – Number of Trips by Purpose (Million), 2009–2018 .................................................................................................................. 74 Figure 30: Saudi Arabia – Overnight Stays (Million), 2009–2018 ..................................................................................................................................... 75 Figure 31: Saudi Arabia – Total Domestic Tourism Expenditure by Category (SAR Billion), 2009–2018 ......................................................................... 76 Figure 32: Saudi Arabia – Average Expenditure per Domestic Tourist by Category (SAR), 2009–2018 .......................................................................... 77 Figure 33: Saudi Arabia – International Arrivals by Region (Thousands), 2009–2018 ..................................................................................................... 78 Figure 34: Saudi Arabia – International Arrivals by Purpose of Visit (Thousand), 2009–2018 .......................................................................................... 79 Figure 35: Saudi Arabia – International Arrivals by Purpose of Visit (Thousand), 2009–2018 .......................................................................................... 80 Figure 36: Saudi Arabia – Total Inbound Tourism Expenditure by Category (SAR Billion), 2009–2018 ........................................................................... 81 Figure 37: Saudi Arabia – Average Expenditure per Inbound Tourist by Category (SAR), 2009–2018 ............................................................................ 82 Figure 38: Saudi Arabia – International Departures by Region (Thousands), 2009–2018 ................................................................................................ 83 Figure 39: Saudi Arabia – International Departures by Purpose of Visit (Thousand), 2009–2018 .................................................................................... 84 Figure 40: Saudi Arabia – International Departures by Purpose of Visit (Thousand), 2009–2018 .................................................................................... 85 Figure 41: Saudi Arabia – Overnight Stays (Million), 2009–2018 ..................................................................................................................................... 86 Figure 42: Saudi Arabia – Total Outbound Tourism Expenditure by Category (SAR Billion), 2009–2018......................................................................... 87 Figure 43: Saudi Arabia – Average Outbound Expenditure per Resident by Category (SAR), 2009–2018 ...................................................................... 88 Figure 44: Saudi Arabia – Seats Available by Carrier Type (Thousand), 2009–2018 ....................................................................................................... 89 Figure 45: Saudi Arabia – Seats Sold by Carrier Type – Business Travel (Thousand), 2009–2018 ................................................................................. 90 Figure 46: Saudi Arabia – Seats Sold by Carrier Type – Leisure Travel (Thousand), 2009–2018 .................................................................................... 91 Figure 47: Saudi Arabia – Load Factor by Carrier Type (%), 2009–2018......................................................................................................................... 92 Figure 48: Saudi Arabia – Passenger Kilometers Available by Carrier Type (Million), 2009–2018 ................................................................................... 93 Figure 49: Saudi Arabia – Revenue Generating Passenger Kilometers by Carrier Type (Billion), 2009–2018 ................................................................. 94 Figure 50: Saudi Arabia – Revenue per Passenger by Carrier Type (SAR), 2009–2018 ................................................................................................. 95 Figure 51: Saudi Arabia – Total Revenue by Carrier Type (SAR Million), 2009–2018 ..................................................................................................... 96 Figure 52: Saudi Arabia – Establishments by Category (Actual), 2009–2018 .................................................................................................................. 97 Figure 53: Saudi Arabia – Available Hotel Rooms by Hotel Category (Thousand), 2009–2018 ....................................................................................... 98 Figure 54: Saudi Arabia – Room Occupancy Rate by Hotel Category (%), 2009–2018 ................................................................................................... 99 Figure 55: Saudi Arabia – Room Nights Available by Hotel Category (Million), 2009–2018 ........................................................................................... 100 Figure 56: Saudi Arabia – Room Nights Occupied by Hotel Category (Million), 2009–2018 .......................................................................................... 101 Figure 57: Saudi Arabia – Average Revenue per Available Room by Hotel Category (SAR), 2009–2018 ...................................................................... 102 Figure 58: Saudi Arabia – Revenue per Occupied Room (SAR), 2009–2018 ................................................................................................................ 103 Figure 59: Saudi Arabia – Total Revenue per Available Room (SAR), 2009–2018 ........................................................................................................ 104 Figure 60: Saudi Arabia – Total Revenue by Hotel Category (SAR Million), 2009–2018................................................................................................ 105 Figure 61: Saudi Arabia – Guests by Hotel Category (Thousand), 2009–2018 .............................................................................................................. 106 Figure 62: Saudi Arabia – Market Value by Customer Type and Rental Location (SAR Million), 2009–2018 ................................................................. 107 Figure 63: Saudi Arabia – Fleet Size (Actual), 2009–2018 ............................................................................................................................................ 108 Figure 64: Saudi Arabia – Rental Occasions (Thousand), 2009–2018 .......................................................................................................................... 109
LIST OF FIGURES
Travel and Tourism in Saudi Arabia to 2018 Page 12
© Timetric. This product is licensed and is not to be photocopied Published: May 2014
Figure 65: Saudi Arabia – Rental Days (Million) vs Average Rental Length (Days), 2009–2018 .................................................................................... 110 Figure 66: Saudi Arabia – Market Utilization Rate (%), 2009–2018 ............................................................................................................................... 111 Figure 67: Saudi Arabia – Car Rental Average Revenue per Day (SAR), 2009–2018 ................................................................................................... 112 Figure 68: Saudi Arabia – Travel Intermediaries’ Market Value by Product Type (SAR Billion), 2009–2018 .................................................................. 113 Figure 69: Saudi Arabia – Travel Intermediaries’ Online Revenues by Provider (SAR Million), 2009–2018 ................................................................... 114 Figure 70: Saudi Arabia – Travel Intermediaries’ Online Revenues by Type of Tourist (SAR Million), 2009–2018 ......................................................... 115 Figure 71: Saudi Arabia – Travel Intermediaries’ In-Store Revenues by Provider (SAR Million), 2009–2018 ................................................................. 116 Figure 72: Saudi Arabia – Travel Intermediaries’ In-Store Revenues by Type of Tourist (SAR Million), 2009–2018 ...................................................... 117 Figure 73: Saudi Arabia – Travel Agent Revenues from Domestic Tourism by Sales Channel (SAR Million), 2009–2018 ............................................. 118 Figure 74: Saudi Arabia – Travel Agent Revenues from International Tourism by Sales Channel (SAR Million), 2009–2018 ........................................ 119 Figure 75: Saudi Arabia – Tour Operator Revenues from Domestic Tourism by Sales Channel (SAR Million), 2009–2018 ........................................... 120 Figure 76: Saudi Arabia – Tour Operator Revenues from International Tourism by Sales Channel (SAR Million), 2009–2018 ...................................... 121 Figure 77: Saudi Arabia – Other Intermediaries’ Revenues from Domestic Tourism by Sales Channel (SAR Million), 2009–2018 ................................ 122 Figure 78: Saudi Arabia – Other Intermediaries’ Revenues from International Tourism by Sales Channel (SAR Million), 2009–2018 ........................... 123
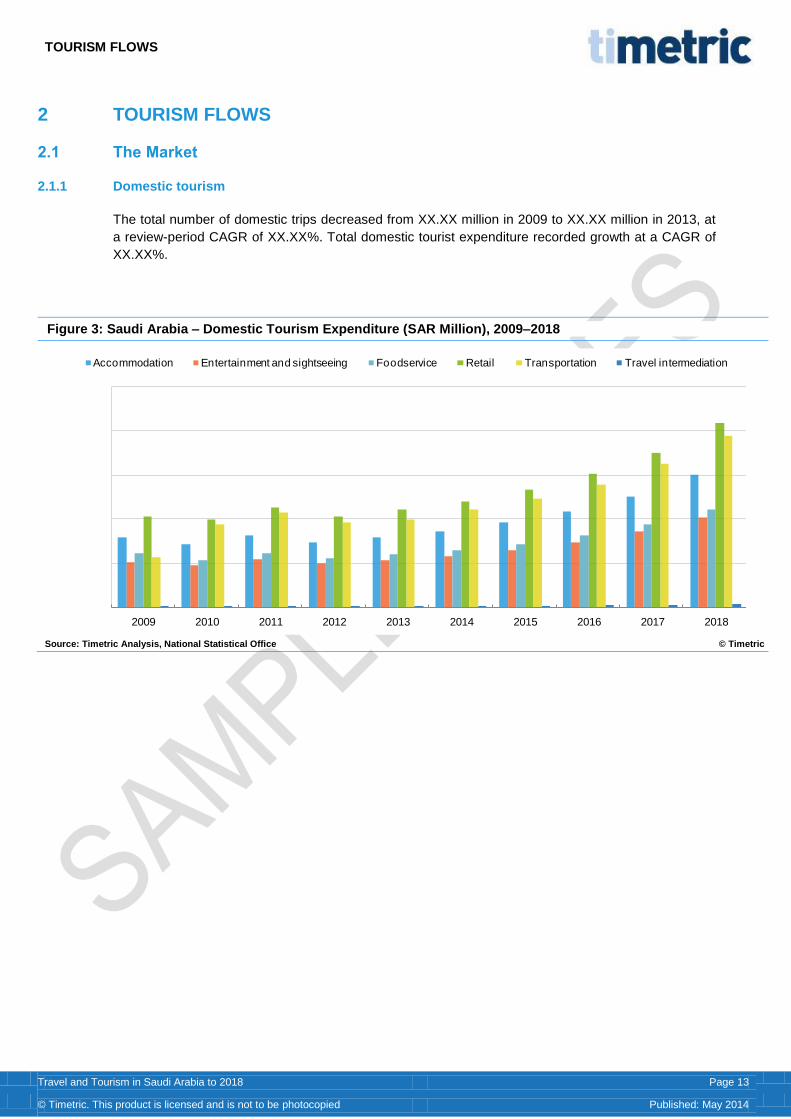
TOURISM FLOWS
Travel and Tourism in Saudi Arabia to 2018 Page 13
© Timetric. This product is licensed and is not to be photocopied Published: May 2014
2 TOURISM FLOWS
2.1 The Market
2.1.1 Domestic tourism
The total number of domestic trips decreased from XX.XX million in 2009 to XX.XX million in 2013, at
a review-period CAGR of XX.XX%. Total domestic tourist expenditure recorded growth at a CAGR of
XX.XX%.
Figure 3: Saudi Arabia – Domestic Tourism Expenditure (SAR Million), 2009–2018
Source: Timetric Analysis, National Statistical Office © Timetric
0
5,000
10,000
15,000
20,000
25,000
2009 2010 2011 2012 2013 2014 2015 2016 2017 2018
Accommodation Entertainment and sightseeing Foodservice Retail Transportation Travel intermediation
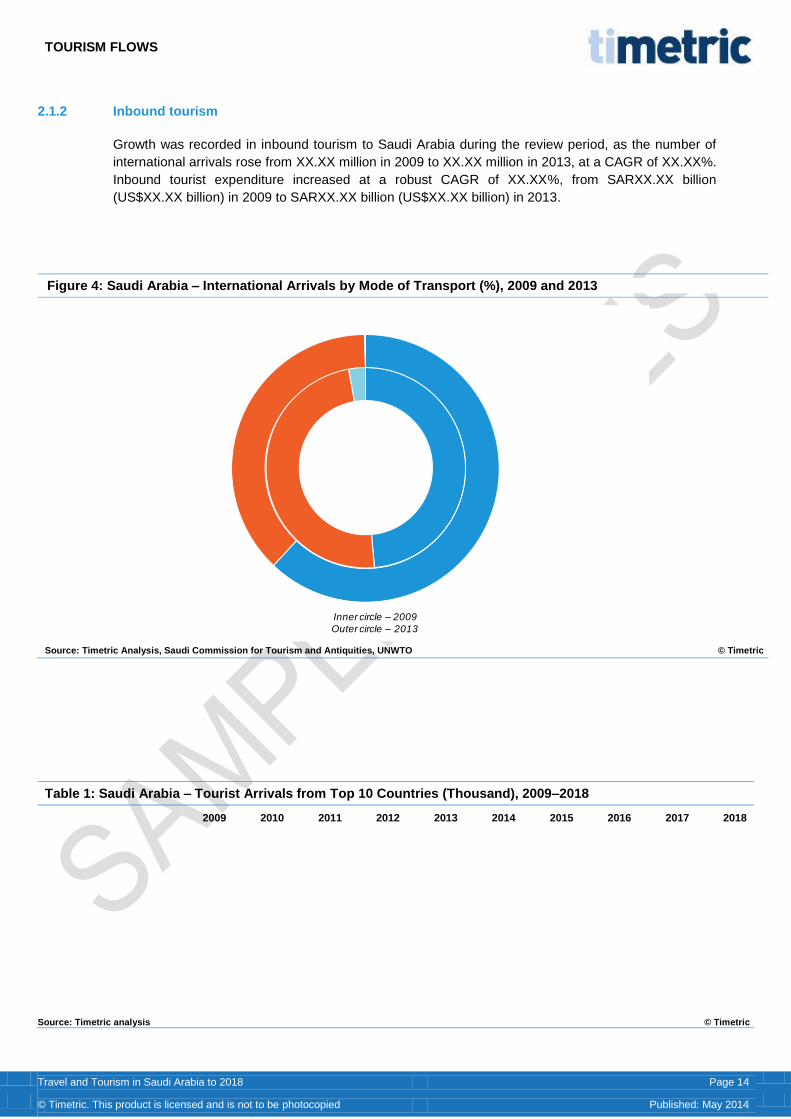
TOURISM FLOWS
Travel and Tourism in Saudi Arabia to 2018 Page 14
© Timetric. This product is licensed and is not to be photocopied Published: May 2014
2.1.2 Inbound tourism
Growth was recorded in inbound tourism to Saudi Arabia during the review period, as the number of
international arrivals rose from XX.XX million in 2009 to XX.XX million in 2013, at a CAGR of XX.XX%.
Inbound tourist expenditure increased at a robust CAGR of XX.XX%, from SARXX.XX billion
(US$XX.XX billion) in 2009 to SARXX.XX billion (US$XX.XX billion) in 2013.
Figure 4: Saudi Arabia – International Arrivals by Mode of Transport (%), 2009 and 2013
Source: Timetric Analysis, Saudi Commission for Tourism and Antiquities, UNWTO © Timetric
Table 1: Saudi Arabia – Tourist Arrivals from Top 10 Countries (Thousand), 2009–2018
2009 2010 2011 2012 2013 2014 2015 2016 2017 2018
Source: Timetric analysis © Timetric
Air
Land
Sea
Inner circle – 2009
Outer circle – 2013
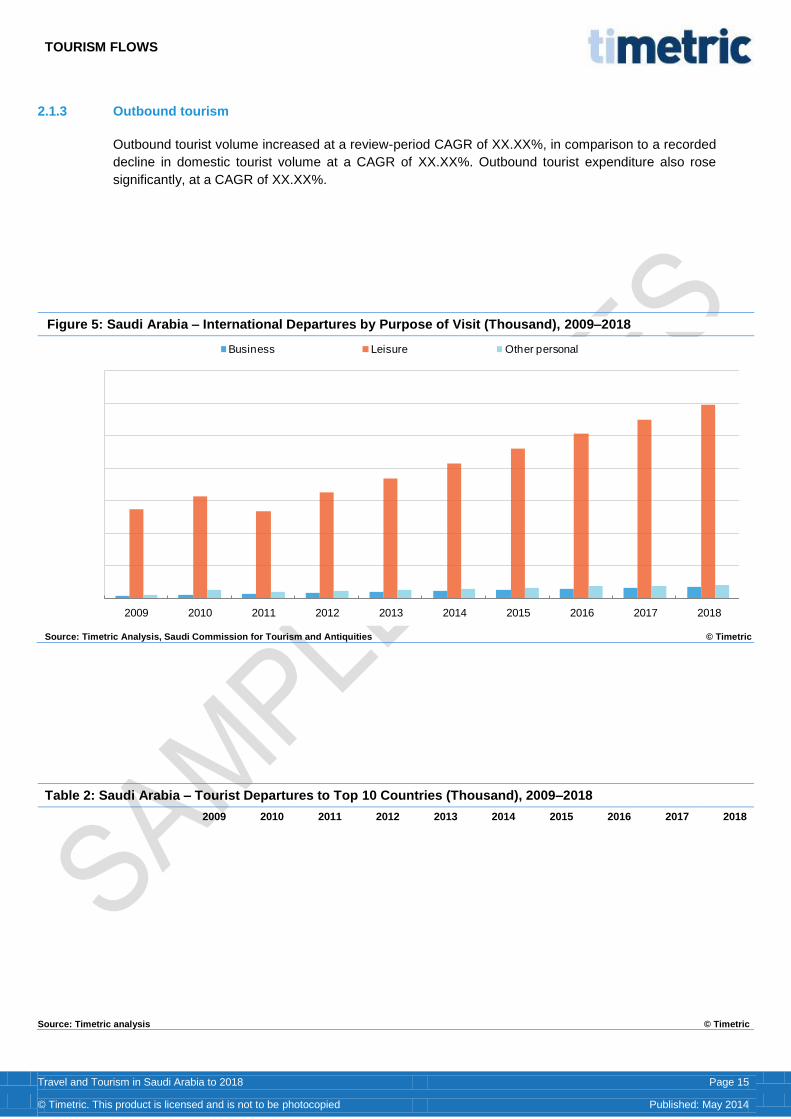
TOURISM FLOWS
Travel and Tourism in Saudi Arabia to 2018 Page 15
© Timetric. This product is licensed and is not to be photocopied Published: May 2014
2.1.3 Outbound tourism
Outbound tourist volume increased at a review-period CAGR of XX.XX%, in comparison to a recorded
decline in domestic tourist volume at a CAGR of XX.XX%. Outbound tourist expenditure also rose
significantly, at a CAGR of XX.XX%.
Figure 5: Saudi Arabia – International Departures by Purpose of Visit (Thousand), 2009–2018
Source: Timetric Analysis, Saudi Commission for Tourism and Antiquities © Timetric
Table 2: Saudi Arabia – Tourist Departures to Top 10 Countries (Thousand), 2009–2018
2009 2010 2011 2012 2013 2014 2015 2016 2017 2018
Source: Timetric analysis © Timetric
0
5,000
10,000
15,000
20,000
25,000
30,000
35,000
2009 2010 2011 2012 2013 2014 2015 2016 2017 2018
Business Leisure Other personal
TOURISM FLOWS
Travel and Tourism in Saudi Arabia to 2018 Page 16
© Timetric. This product is licensed and is not to be photocopied Published: May 2014
2.2 Key Developments
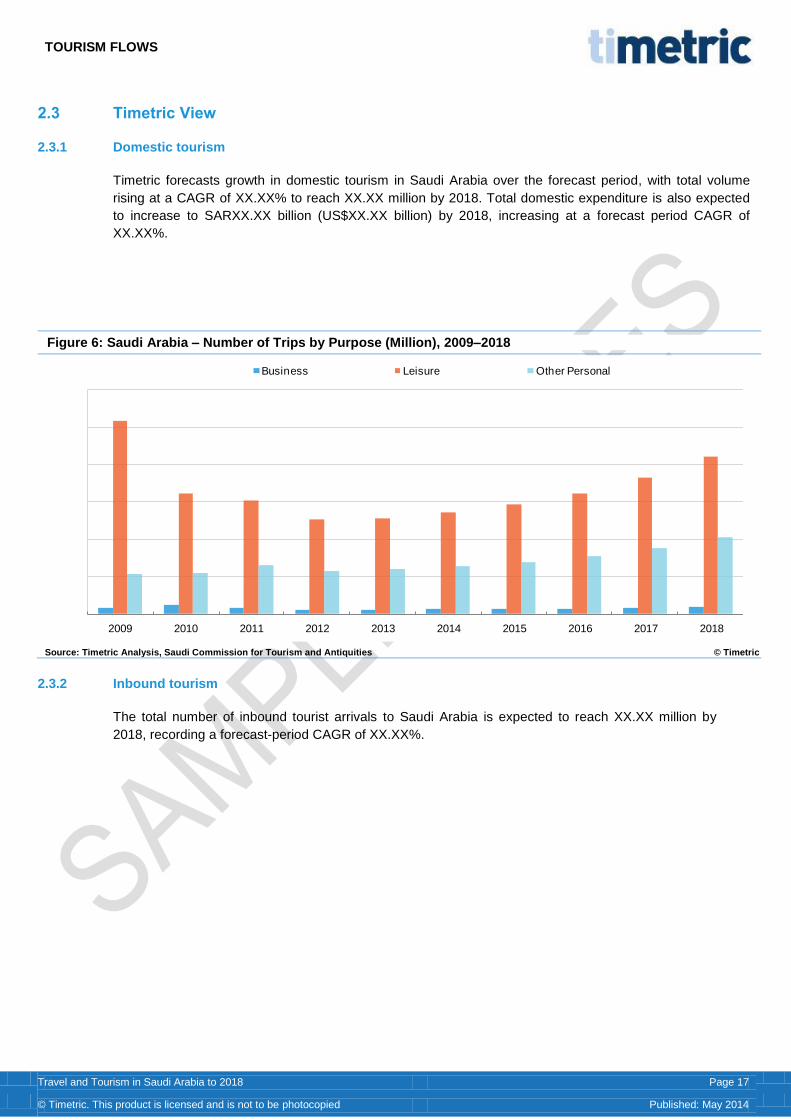
TOURISM FLOWS
Travel and Tourism in Saudi Arabia to 2018 Page 17
© Timetric. This product is licensed and is not to be photocopied Published: May 2014
2.3 Timetric View
2.3.1 Domestic tourism
Timetric forecasts growth in domestic tourism in Saudi Arabia over the forecast period, with total volume
rising at a CAGR of XX.XX% to reach XX.XX million by 2018. Total domestic expenditure is also expected
to increase to SARXX.XX billion (US$XX.XX billion) by 2018, increasing at a forecast period CAGR of
XX.XX%.
Figure 6: Saudi Arabia – Number of Trips by Purpose (Million), 2009–2018
Source: Timetric Analysis, Saudi Commission for Tourism and Antiquities © Timetric
2.3.2 Inbound tourism
The total number of inbound tourist arrivals to Saudi Arabia is expected to reach XX.XX million by
2018, recording a forecast-period CAGR of XX.XX%.
0
5
10
15
20
25
30
2009 2010 2011 2012 2013 2014 2015 2016 2017 2018
Business Leisure Other Personal
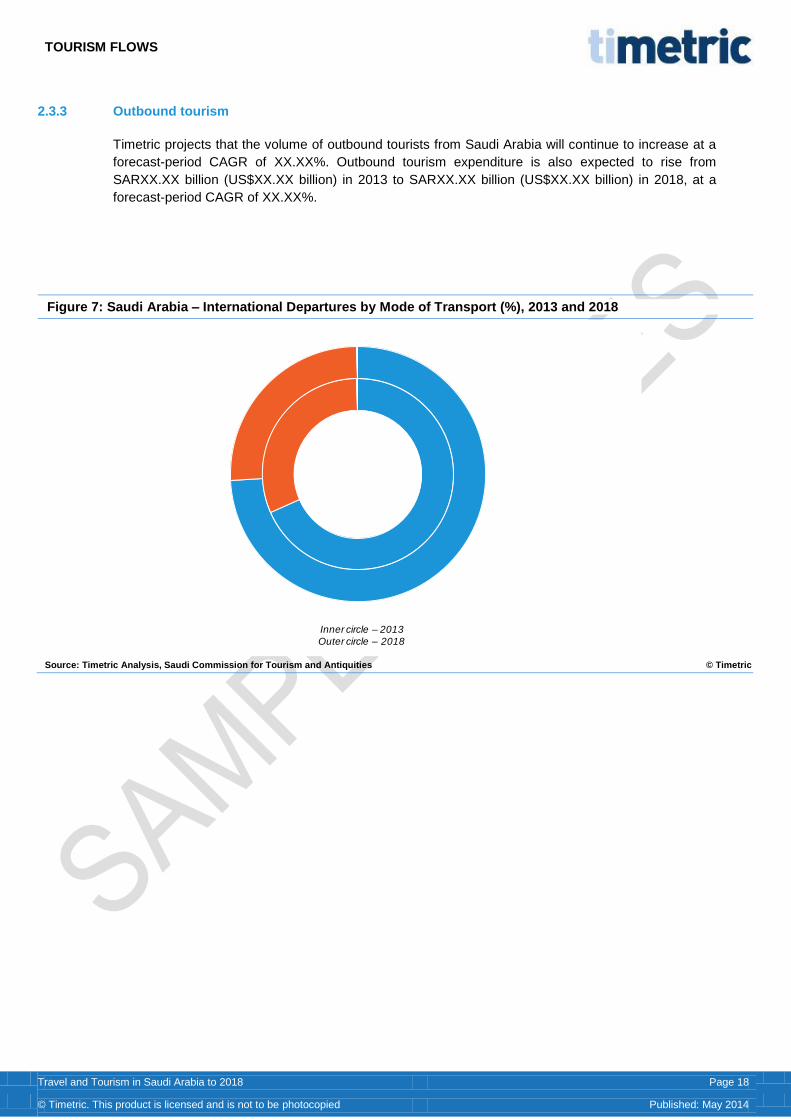
TOURISM FLOWS
Travel and Tourism in Saudi Arabia to 2018 Page 18
© Timetric. This product is licensed and is not to be photocopied Published: May 2014
2.3.3 Outbound tourism
Timetric projects that the volume of outbound tourists from Saudi Arabia will continue to increase at a
forecast-period CAGR of XX.XX%. Outbound tourism expenditure is also expected to rise from
SARXX.XX billion (US$XX.XX billion) in 2013 to SARXX.XX billion (US$XX.XX billion) in 2018, at a
forecast-period CAGR of XX.XX%.
Figure 7: Saudi Arabia – International Departures by Mode of Transport (%), 2013 and 2018
Source: Timetric Analysis, Saudi Commission for Tourism and Antiquities © Timetric
Air
Land
Sea
Inner circle – 2013
Outer circle – 2018
APPENDIX
Travel and Tourism in Saudi Arabia to 2018 Page 19
© Timetric. This product is licensed and is not to be photocopied Published: May 2014
3 APPENDIX
3.1 What is This Report About?
This report is the result of extensive research into the travel and tourism sector in Saudi Arabia,
covering its dynamics and its competitive landscape. It provides insights into the market size and
forecast for the travel and tourism sector, and includes analysis and insight on key tourism-related
subjects such as airports, popular destinations, and national tourist boards. It also includes an
overview of the leading companies in the travel and tourism sector, and details of strategic initiatives
undertaken by them.
3.2 Definitions
For the purposes of this report, the following timeframes apply:
Review period: 2009–2013
Forecast period: 2014–2018
Base year for forecasting: 2013
All data is collected in local currency. To avoid distortions due to currency fluctuations, all conversions
into US dollars, of current, historical and forecast data alike, are made with a yearly average exchange
rate. All values in tables, with the exception of compound annual growth rates (CAGRs), are displayed
to one decimal place. Growth rates may, therefore, appear inconsistent with absolute values due to
this rounding method.
The key market categories featured in the report are defined below:
Table 3: Timetric Travel and Tourism Sector Definitions
Term Definition
Tourism demand factors Factors that influence time and money spent on tourism. Typical factors include the amount of holiday leave available to the average employee in the country, and mean household income.
Annual employee holiday entitlement The number of days the average resident of a country will accrue annually through entitled holidays, including annual leave and public holidays. Public holidays are statutory holidays to which a country’s residents are entitled.
Domestic trip A trip taken to a destination within the traveler’s country of residence.
International trip A trip taken to a destination outside the traveler’s country of residence.
Trips taken by season The number of trips undertaken by the residents of a country (both domestic and international), segmented into four quarters: January–March, April–June, July–September and October–December.
Number of trips by residents The number of trips undertaken by the residents of a country, segmented by domestic and international trips.
Average length of trip The average number of nights spent by the residents of a country,
segmented by domestic and international trips.
Tourism flow factors Factors that influence the flow of tourists from one location to another.
Number of overnight stays The total number of nights spent by the residents of a country on all trips during a given year.
International arrivals The number of foreign nationals entering a country. For example, a person from Canada who visits France would be an international arrival to France.
APPENDIX
Travel and Tourism in Saudi Arabia to 2018 Page 20
© Timetric. This product is licensed and is not to be photocopied Published: May 2014
Leisure trips Trips for holidaying, recreation, or visits to friends and relatives.
Business trips Trips involving business as the primary purpose. This includes trips for
meetings, incentives, conventions and exhibitions (MICE) purposes,
events and conferences.
Other trips Trips for purposes other than leisure or business, such as education,
sports or pilgrimage.
International departures The total number of citizens leaving their home country and arriving in
other countries. This will be higher than the total number of citizens
leaving their home country, as a traveler might travel to more than one
country.
Domestic tourist expenditure Expenditure on tourism commodities during trips within national borders
by citizens of a country. This spending is categorized into accommodation,
sightseeing and entertainment, foodservice, retail transportation, travel
intermediation, and others, which include travel insurance and equipment
rental.
Accommodation The total direct spending on accommodation by inbound, domestic and
outbound tourists within a single economy.
Sightseeing and entertainment The total direct spending on sightseeing and entertainment by inbound,
domestic and outbound tourists within a single economy
Foodservice The total direct spending on food and beverages from foodservice outlets
by inbound, domestic and outbound tourists within a single economy.
Retail The total direct spending in retail outlets by inbound, domestic and
outbound tourists within a single economy.
Transportation The total direct spending on transportation by inbound, domestic and
outbound tourists within a single economy.
Travel intermediation The total direct spending via travel intermediaries by inbound, domestic
and outbound tourists within a single economy.
Other categories The total direct spending within all other categories by inbound, domestic
and outbound tourists within a single economy.
Inbound tourist expenditure Expenditure on travel and tourism commodities by international visitors
within a country. This spending is categorized into accommodation,
sightseeing and entertainment, foodservice, retail, transportation, travel
intermediation and others, which include travel insurance and equipment
rental.
Outbound tourist expenditure The total expenditure by the residents of a country for the purpose of, and
during, international tourism trips, irrespective of whether these
transactions involve domestic or international providers. This spending is
categorized by various categories such as accommodation, sightseeing
and entertainment, foodservice, retail, transportation, travel intermediation
and others, which include travel insurance and equipment rental.
Tourism balance of payments The difference between the expenditure of a country’s inbound and
outbound tourists with international tourism commodities providers.
Direct tourism output The total direct spending by inbound, domestic and outbound tourists
within a single economy, segmented by categories such as
accommodation or sightseeing and entertainment. Direct tourism output
represents all output consumed directly by visitors.
Indirect tourism output All output used as inputs in the process of producing direct tourism output.
Examples include toiletries for hotel guests and local entertainment for
hotels.
Indirect tourism employment All jobs where workers are engaged in the production of indirect tourism-
related output, which is used as an input in the process of producing direct
tourism output. For example, people employed for local entertainment in
hotels generate an indirect output, which will be used as an input for the
accommodation industry; a direct tourism output.
Direct tourism employment All jobs where workers are engaged in the production of direct tourism
output.
Total tourism output The sum of the value of goods and services purchased by tourists and
output which is used as an input in the process of producing these goods
APPENDIX
Travel and Tourism in Saudi Arabia to 2018 Page 21
© Timetric. This product is licensed and is not to be photocopied Published: May 2014
and services.
Total tourism employment All employees engaged in generating tourism output within a country, both
directly and indirectly.
Total tourism employment as a percentage of
total employment
The percentage of people employed in the tourism industry, both directly
and indirectly, of the total employed population.
Average salary by category Average remuneration per year for employees working within tourism-
related categories.
Total national tourism expenditure The total spending by residents on both domestic and outbound trips
within categories such as accommodation and transportation.
Average national tourism spend per day of trip
– domestic
The average daily expenditure of a country’s residents during domestic
trips.
Average national tourism spend per day of trip
– international
The average daily expenditure of a country’s residents during international
trips.
Percentage of total resident income spent on
tourism
The percentage of total annual income that a country’s residents spend on
travel and tourism activities.
Average expenditure per international tourist The average expenditure on travel and tourism activities by an
international tourist within a country. This spending is categorized by
accommodation, entertainment and sightseeing, foodservice, retail
transportation, travel intermediation, and others, which include travel
insurance and equipment rental.
Average expenditure per domestic trip The average expenditure on domestic travel and tourism activities by
residents of a country, segmented by categories such as accommodation
and foodservice.
Average overseas tourism expenditure The average expenditure on travel and tourism activities by outbound
tourists of a country, segmented by categories such as accommodation
and foodservice.
Domestic, outbound and inbound tourist
expenditure on transportation
Expenditure on all modes of transport within a country by domestic,
outbound and inbound tourists.
Direct tourism output on transportation The total direct spending on transportation by inbound, outbound and
domestic tourists within a single economy. Direct tourism output
represents all output consumed directly by visitors.
Indirect tourism output on transportation Indirect tourism output on transportation includes all output used as inputs
in the process of producing direct tourism output on transportation.
Indirect tourism employment on transportation Includes all jobs where workers are engaged in the production of indirect
tourism-related output, for example, output which is used as an input in
the process of producing direct tourism output.
Direct tourism employment on transportation Includes all jobs where workers are engaged in the production of direct
tourism output in the transportation category of a country.
Total tourism output on transportation The sum of the value of goods and services (directly or indirectly related
to transportation) purchased by tourists and output, which is used as an
input in the process of producing these goods and services.
Total tourism employment All employees engaged in generating tourism output within a country, both
directly and indirectly.
Total national tourism expenditure on
transportation
The total spending by residents on transport in domestic trips.
Average expenditure per international tourist
on transportation
The average expenditure on transport by an international tourist within a
country.
Average expenditure per domestic trip on
transportation
The average expenditure by residents of a country on transport during
domestic trips.
Passenger airlines An airline whose primary business is the transport of passengers.
Low-cost airlines Airlines that generally offer lower fares by eliminating many traditional
services. To recover the revenue lost in reduced ticket prices, the airlines
may charge for additional facilities such as priority boarding, seat
allocation, food and baggage.
Full-service airlines Full-service airlines generally have higher fares, operate long-distance
routes and offer a complete range of in-flight services.
APPENDIX
Travel and Tourism in Saudi Arabia to 2018 Page 22
© Timetric. This product is licensed and is not to be photocopied Published: May 2014
Charter airlines An airline hired by a group or single customer for leisure or business
purposes, or as an air ambulance, and flies outside normal schedules.
Airlines classified as non-scheduled by civil aviation organizations fall into
this category.
Number of seats available The number of seats available for purchase on all the airlines operating in
a country, for example, both national and foreign carriers operating on
domestic and international routes.
Number of seats sold The number of seats sold to revenue passengers by all the airlines
operating in a country in a year.
Hotels Establishments that provide paid lodging and full guest services, typically
with a continuous staff presence. In the case of motels, this includes off-
street parking facilities but not necessarily meal services.
Budget hotels Includes hotels that are considered to be budget accommodation, or have
a one- or two-star rating, providing accommodation on a short-term basis
at relatively low prices.
Midscale hotels Includes hotels with a three-star rating. These hotels provide more
facilities and comfort than budget hotels, and their services are charged at
higher prices.
Upscale hotels Includes hotels with a four-star rating. Upscale hotels include both
traditional full-service hotels and smaller select-service hotels with
comfortable accommodation at higher prices than midscale hotels.
Luxury hotels Includes hotels with a five-star rating or higher. Luxury hotels provide top
quality accommodation, with a combination of high-class facilities and
style, typically at much higher prices than standard hotels.
Number of rooms The total number of rooms available in all hotel accommodation
establishments in a country in a year.
Room occupancy rate The percentage of available rooms sold during a given period.
Revenue per available room A measure of financial performance in the hospitality industry. It is the
ratio of total room revenue to total rooms available. Average room rates
and occupancy can also be used to calculate revenue per available room.
Total room revenue The room rent that a guest pays for the occupied room.
Total non-room revenue Revenue earned by hotels other than the room rent. It includes revenue
from food and beverages, telecommunications, health and leisure
operations, and car rentals.
Number of guests Guest numbers in all hotel accommodation establishments in a country in
a year.
Business guests The annual number of guests arriving in hotel accommodation
establishments for business purposes.
Leisure guests The annual number of guests arriving in hotel accommodation
establishments for leisure purposes.
Car rental Car rental is the hiring of a passenger vehicle, which includes cars and
small vans by both business and leisure travelers, for a short term
duration. It excludes leasing and long term rentals.
Business rentals Annual revenue generated by a car rental company under negotiated
contractual agreements specific to business trips.
Leisure rentals Annual revenue generated by a car rental company through
leisure/personal trips.
Airport rentals by leisure customers Annual car rental revenue generated through direct customer rentals hired
at airport locations specific to leisure/personal trips.
Airport rentals by business customers Annual revenue generated through car rentals under negotiated
contractual agreements between the employers and the rental company
specific to the purpose of business trips hired at airport locations.
Non-airport rentals by leisure customers Annual car rental revenue generated through direct customer rentals hired
at locations other than airports for the purpose of leisure/personal trips.
Non-airport rentals by business customers Revenue generated through car rentals under negotiated contractual
agreements between the employers and the car rental company for the
purpose of business hired at locations other than airports.
APPENDIX
Travel and Tourism in Saudi Arabia to 2018 Page 23
© Timetric. This product is licensed and is not to be photocopied Published: May 2014
Insurance replacement The revenue generated by car rental firms through insurance and leasing
companies, repair shops or dealerships, with a contractual agreement for
the use of a replacement car by a consumer when his/her own car is
under repair.
Fleet size The number of operational cars available for short term rental for the
purpose of business, leisure and insurance replacement.
Number of rental occasions The number of car rental transactions between a car rental company and
the consumers in a calendar year.
Rental days The total number of days when all the operational cars in the fleet are
rented in a calendar year.
Average rental length Average rental length is the average number of days for which a car has
been hired in a single transaction.
Utilization rate The ratio of the number of rental days to total number of days for which
cars could be actually rented during the year.
Average revenue per day The mean revenue earned by a rented car in a day; i.e., the ratio of car
rental revenue to the total number of rental days in a year.
Travel intermediaries Part of a business that assists in selling travel products and services to
customers. The products may include airline tickets, car rentals, hotels,
railway tickets and package holidays that may combine several products.
Accommodation only Total revenue generated by intermediaries exclusively through
accommodation bookings.
Travel only Total revenue generated by intermediaries exclusively through travel
bookings.
Car rental only Total revenue generated by intermediaries exclusively through car rental
bookings.
Tourism packages A combination of tourism products or services, such as accommodation,
travel bookings and car rental bundled together by a tour operator.
Other products Revenue generated by travel intermediaries from travel products and
services that are not classified above.
Travel agents Businesses that sell travel-related products and services to both leisure
and business customers on behalf of suppliers such as tour operators.
These may include package holidays, sightseeing tours, airline tickets,
hotel accommodation, cruise bookings, car rentals, rail travel and travel
insurance. Some travel agents also serve as sales agents for international
travel companies.
Tour operators
Tour operators typically combine two or more travel services, such as
transport, sightseeing, accommodation, food and entertainment, and sell
them either directly to customers or through travel agents as a single
product, called a package tour, for a single price.
Other providers
Any part of the value chain between the direct supplier and traveler
(customer), which is not classified as a travel agent or a tour operator.
Online Revenue generated by travel intermediaries by selling travel-related
products or services over the internet.
In-store Revenue generated by travel intermediaries by selling related products or
services to a customer over the counter.
Source: Timetric analysis © Timetric
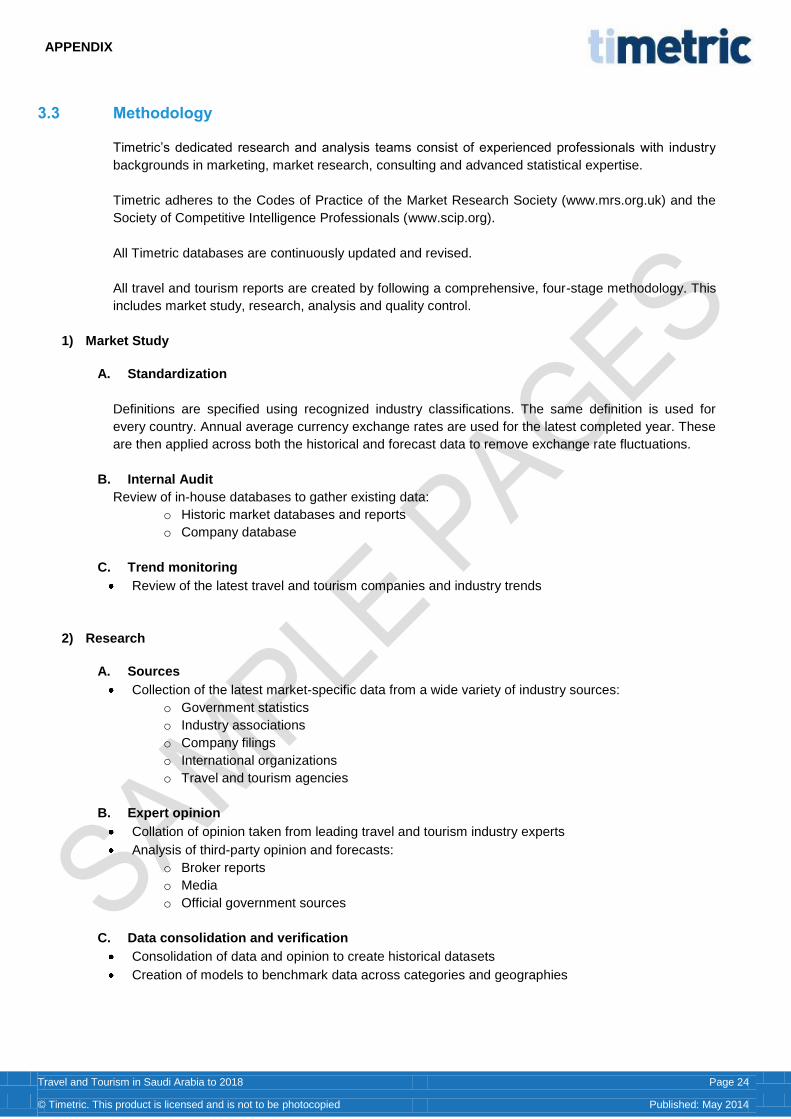
APPENDIX
Travel and Tourism in Saudi Arabia to 2018 Page 24
© Timetric. This product is licensed and is not to be photocopied Published: May 2014
3.3 Methodology
Timetric’s dedicated research and analysis teams consist of experienced professionals with industry
backgrounds in marketing, market research, consulting and advanced statistical expertise.
Timetric adheres to the Codes of Practice of the Market Research Society (www.mrs.org.uk) and the
Society of Competitive Intelligence Professionals (www.scip.org).
All Timetric databases are continuously updated and revised.
All travel and tourism reports are created by following a comprehensive, four-stage methodology. This
includes market study, research, analysis and quality control.
1) Market Study
A. Standardization
Definitions are specified using recognized industry classifications. The same definition is used for
every country. Annual average currency exchange rates are used for the latest completed year. These
are then applied across both the historical and forecast data to remove exchange rate fluctuations.
B. Internal Audit
Review of in-house databases to gather existing data:
o Historic market databases and reports
o Company database
C. Trend monitoring
Review of the latest travel and tourism companies and industry trends
2) Research
A. Sources
Collection of the latest market-specific data from a wide variety of industry sources:
o Government statistics
o Industry associations
o Company filings
o International organizations
o Travel and tourism agencies
B. Expert opinion
Collation of opinion taken from leading travel and tourism industry experts
Analysis of third-party opinion and forecasts:
o Broker reports
o Media
o Official government sources
C. Data consolidation and verification
Consolidation of data and opinion to create historical datasets
Creation of models to benchmark data across categories and geographies
APPENDIX
Travel and Tourism in Saudi Arabia to 2018 Page 25
© Timetric. This product is licensed and is not to be photocopied Published: May 2014
3) Analysis
A. Market forecasts
Feeding forecast data into market models:
o Macroeconomic indicators
o Industry-specific drivers
Analysis of travel and tourism industry database to identify trends:
o Latest travel and tourism trends
o Key drivers of the travel and tourism industry
B. Report writing
Analysis of market data
Discussion of company and industry trends and issues
Review of financial deals and travel and tourism trends
4) Quality Control
A. Templates
Detailed process manuals
Standardized report templates and accompanying style guides
Complex forecasting tools to ensure that forecast methodologies are applied consistently
Quality-control checklists
B. Quality control process
Peer review
Senior-level QC
Random spot checks on data integrity
Benchmark checks across databases
Market data cross-checked for consistency with accumulated data from:
o Company filings
o Government sources
APPENDIX
Travel and Tourism in Saudi Arabia to 2018 Page 26
© Timetric. This product is licensed and is not to be photocopied Published: May 2014
3.4 Contact Timetric
If you have any queries about this report, or would like any further information, please contact
3.5 About Timetric
Timetric is a leading provider of online data, analysis and advisory services on key financial and
industry sectors. It provides integrated information services covering risk assessments, forecasts,
industry analysis, market intelligence, news and comment.
Timetric helps over 1,500 financial services institutions and their partner companies around the world
benefit from better, timelier decisions.
Timetric provides:
High-quality data including proprietary, specialized industry data, survey-based research, social
media monitoring, macroeconomic data and forecasts
Expert analysis from experienced economists and analysts, who use robust proprietary models,
indices and forecasts
Powerful proprietary visualization and workflow technologies developed over years of extensive
investment
Timetric has office locations in London, New York, San Francisco, Hyderabad, Seoul, Singapore and
Sydney. It employs 500 people, including 150 analysts and economists, and 200 professional
researchers.
3.6 Timetric’s Services
Intelligence Centers
Timetric’s industry intelligence centers are premium web-based services that provide access to
interactive tools, comprehensive research and expert analysis in key sectors. They provide invaluable
decision support presented in an easily digestible format and grounded in deep research.
Timetric offers Intelligence Centers covering the following industries:
Banking
Insurance
Wealth
Construction
Travel and Tourism
APPENDIX
Travel and Tourism in Saudi Arabia to 2018 Page 27
© Timetric. This product is licensed and is not to be photocopied Published: May 2014
Briefing Services
Timetric offers a range of briefing services, which offer cutting-edge thought leadership and expert
commentary on and for the financial services industries. Driven by influential and respected editorial
teams with years of experience in their respective fields, these services deliver need-to-know insight
and analysis to decision makers across the financial services value chain.
Timetric offers briefing services covering the following financial sectors:
Accountancy
Asset Finance
Banking
Cards and Payments
Insurance
Consultancy
Timetric specializes in the development and delivery of innovative research solutions that are
designed to provide competitive advantage and profitability to clients.
Dedicated industry analysts and economists provide expert advice and actionable recommendations
underpinned by Timetric’s market and country knowledge, experience and proprietary databases,
panels and research infrastructure.
For projects requiring quantitative data, Timetric undertakes special research projects using its in-
house panels and survey technology. These provide ready access to an extensive source of specialist
business executives and consumers.
Core capabilities include:
Economic Research and Consulting
Highly experienced economists provide a number of bespoke research services covering subjects
ranging from macroeconomic forecasting to sector outlooks, business presentations and workshops.
Industry Analysis and Consulting
Information analysis, independent expert opinion and advice, facilitated decision or strategic support,
are provided by Timetric’s extensive body of proprietary data and analysis models. It provides
expertise-based consulting to deliver solutions that best suit its clients’ requirements.
Quantitative Research
Timetric connects with thousands of potential customers for various markets every day. Using
sophisticated, interactive and highly engaging graphical surveys, research speed is increased and
costs reduced, while ensuring that respondents deliver the insight needed.
Qualitative Research
Timetric’s Qualitative Research service helps customers understand the emotional and cultural
behaviors of a target audience. Timetric provides unique access through market-leading publications
and information services to decision makers specifically brought together to discuss topics that are
important to the client.
Technology Solutions
Timetric has built a unique technological platform to collect and visualize data, and employs some of
the world’s leading experts on data collection and visualization. Through technology and software
consulting services, Timetric can provide clients with the means to gather and visualize the data the
client has, or wants to collect.
APPENDIX
Travel and Tourism in Saudi Arabia to 2018 Page 28
© Timetric. This product is licensed and is not to be photocopied Published: May 2014
3.7 Disclaimer
All rights reserved.
No part of this publication may be reproduced, stored in a retrieval system or transmitted in any form
by any means, electronic, mechanical, photocopying, recording or otherwise, without the prior
permission of the publisher, Timetric.
The facts of this report are believed to be correct at the time of publication but cannot be guaranteed.
Please note that the findings, conclusions and recommendations that Timetric delivers will be based
on information gathered in good faith from both primary and secondary sources, whose accuracy we
are not always in a position to guarantee. Timetric will accept no liability, whatsoever, for actions taken
based on any information that may subsequently prove to be incorrect.