tra’s comments on omantel’s tra’s comments on omantel’s raio proposed charges omantel...
TRANSCRIPT

1
TRA’s Comments on Omantel’s RAIO Proposed Charges
Omantel submitted its First Draft RAIO, together with the proposed charges. The non-pricing terms of the First Draft RAIO have
already been reviewed and commented by the TRA. While providing such comments, the TRA stated that “In relation to the level of charges proposed by Omantel, the TRA is in the process of updating its BU-LRIC models and is reviewing/modifying Omantel’s cost models which will be used to determine the charges for RAIO services. The TRA will share its views and queries it may have relating to pricing issues with Omantel separately”. In relation to proposed charges, Article 48 of the A&I Regulation requires that “The First Draft RAIO shall include proposed charges for the Regulated A&I Services subject to the RAIO obligation, and shall be supported with sufficient information such as service cost models and associated documentation, demonstrating the Dominant Operator’s compliance with the pricing related requirements of this Regulation and its Annexes.” The A&I Regulation requires that the charges of Regulated A&I Services (with the exception of Broadband Resale Service, National Roaming Service and Mobile Access Service) shall be fair, reasonable and based on forward looking long run incremental cost (LRIC) of efficient service provision. Whereas the charges of Broadband Resale Service, National Roaming Service and Mobile Access Service are required to be based on Retail-Minus approach. The A&I Regulation also provides that in reviewing and determining the prices for A&I Services, the Authority may choose to:
(i) Use the top-down LRIC model prepared by the Operator after making necessary changes, if required; or
(ii) Use both the Operator top-down LRIC and its own bottom-up LRIC models in the manner it deems appropriate; or
(iii) Use its own bottom-up LRIC models in case no charge is proposed or no top-down LRIC model is provided by the Operator. Since Omantel submitted its Top-Down LRIC model to the TRA (in addition to two Excel-based models namely ‘Bit Stream Model’ and ‘Costing & Pricing Model for RAIO’) in support of its proposed charges and considering the fact that the TRA had earlier finalized its Bottom-Up LRIC models in 2015 in consultation with the industry, the TRA has decided to proceed with approach (ii) above, subject to necessary modifications and updation of these models. In doing so, the TRA sought further data and clarifications from

2
Omantel. This process started right after submission of models by Omantel in June 2016 and continued till November 2016 (i.e. almost 5 months). Having completed the review of proposed charges and the supporting calculations submitted by Omantel, the TRA hereby provides its comments on the proposed charges in Omantel’s First Draft RAIO (in particular Annex M) and on the supporting models/calculations. These shall complement the comments that have already been provided by the TRA on the non-pricing terms of Omantel’s First Draft RAIO. The summary of TRA’s comments on each of the proposed charges of Omantel, as provided in Annex M of the First Draft RAIO, is provided at Annex-I. These comments have been segregated into three categories as indicated below:
1. TRA’s Comments on the Proposed Charges in First Draft RAIO (in particular Annex M) [Please see Annex-II] 2. TRA’s Comments on Omantel’s RAIO models [Please see Annex-III] 3. TRA’s Proposed Changes in Omantel’s Top-Down LRIC Model [Please see Annex-IV]
The TRA also notes that Clause 9.10 of Annex-H of its First Draft RAIO (Ordering, Delivery. Fault Handling and Service Levels) contains proposed charges for fault investigation. The TRA considers that the Annex-M (Tariff) should be the only RAIO Schedule containing price terms, otherwise it may lead to omission of few charges when updating the RAIO. The TRA comments provided in Annex-III point (b) are also applicable on Omantel’s proposed charges for fault investigation.

3
Annex-I
Summary of TRA's Comments on Omantel’s Proposed Charges in First Draft RAIO
Applicability of TRA's Comments
S. No.
Code Service Description Type of Fee Units Proposed Charges
Annex-II (a)
Annex-II (b)
Annex-II (c)
Annex-III (a)
Annex-III (b)
Annex-IV
1 C-FA 01 Local Loop Unbundling
Initial Service setup fee Per MSAN NRC OMR 1,387.00
X X
Per Customer loop charges NRC OMR 72.00
X X
Per Customer loop charges MRC OMR/month 15.51
X
2 C-FA 02 Local Loop Unbundling -Line sharing
Initial Service setup fee Per MSAN
NRC OMR 1,387.00 X X
Per Customer loop charges
NRC OMR 72.00 X X
Per Customer loop charges
MRC OMR/month 12.41 X
3 C-FA 03
Local Loop Unbundling-Sub Loop Unbundling
Initial Service setup fee Per MSAN
NRC OMR 1,387.00 X X
Per Customer loop charges
NRC OMR 72.00 X X
Per Customer loop charges
MRC OMR/month 11.63 X
4 C-FA 04 Co-location Colocation: indoor
NRC OMR 1,087.00 X X

4
Colocation: indoor
MRC OMR Per SQR meter
OMR/Sqr-meter/month
100.00 X
5 C-FA 05 Wholesale Line Rental
Initial Service setup fee (for block of 10 customers)
NRC OMR 4,074.00 X X
Per Customer line charges
NRC OMR 72.00 X X
Per Customer line charges
MRC OMR/month 18.55 X
6 C-FA 06 Bitstream Layer 2
STM-1 on Metro Ring
NRC OMR 5,534.00 X X
STM-1 on Metro Ring
MRC OMR/month 14,531.00 X
STM-1 on Northern Ring
NRC OMR 5,534.00 X X
STM-1 on Northern Ring
MRC OMR/month 19,259.00 X
STM-1 on Eastern Ring
NRC OMR 5,534.00 X X
STM-1 on Eastern Ring
MRC OMR/month 10,837.00 X
STM-1 on Southern Ring
NRC OMR 5,534.00 X X
STM-1 on Southern Ring
MRC OMR/month 14,603.00 X
Link fee per Customer
NRC OMR 72.00 X X
Link fee per Customer
MRC OMR/month 12,407.00 X
Per MSAN Charges per Slot
NRC OMR 72.00 X X
Per MSAN Charges per Slot
MRC OMR/month 138.00 X
ADSL card per MSAN
NRC OMR 1,857.00 X

5
SDSL card per MSAN
NRC OMR 1,429.00 X
7 C-FA 07 Bitstream Layer 3
STM-1 on Metro Ring
NRC OMR 5,534.00 X X
STM-1 on Metro Ring
MRC OMR/month 14,531.00 X
STM-1 on Northern Ring
NRC OMR 5,534.00 X X
STM-1 on Northern Ring
MRC OMR/month 19,259.00 X
STM-1 on Eastern Ring
NRC OMR 5,534.00 X X
STM-1 on Eastern Ring
MRC OMR/month 10,837.00 X
STM-1 on Southern Ring
NRC OMR 5,534.00 X X
STM-1 on Southern Ring
MRC OMR/month 14,603.00 X
Link fee per Customer
NRC OMR 72.00 X X
Link fee per Customer
MRC OMR/month 12,407.00 X
Per MSAN Charges per Slot
NRC OMR 72.00 X X
Per MSAN Charges per Slot
MRC OMR/month 138.00 X
ADSL card per MSAN
NRC OMR 1,857.00 X
SDSL card per MSAN
NRC OMR 1,429.00 X
8 C-FA 08 Wholesale Transmission
Wholesale Transmission
The Wholesale Trunk Segment of Leased Line prices will be applicable
-
The Wholesale
Trunk Segment of Leased Line prices will be
applicable
X

6
9 C-FA 09 Internet Broadband Resale Service
Internet Broadband Resale Service
Retail Minus - Retail minus
12% X X
10 C-FA 10
Wholesale Terminating Segment of Leased Line
Maximum distance 3KM (2Mb/s)
NRC OMR 72.00 X X
Maximum distance 3KM (2Mb/s)
MRC OMR/month 19.00 X
Maximum distance 3KM (34Mb/s)
NRC OMR 72.00 X X
Maximum distance 3KM (34Mb/s)
MRC OMR/month 86.00 X
Maximum distance 3KM (155Mb/s)
NRC OMR 72.00 X X
Maximum distance 3KM (155Mb/s)
MRC OMR/month 86.00 X
11 C-FA 11
Wholesale Trunk Segment of Leased Line (National)
Terrestrial Link Within exchange (2Mb/s)
NRC OMR 100.00 X
Terrestrial Link Within exchange (2Mb/s)
MRC OMR/month 192.00 X
Terrestrial Link Within exchange (34Mb/s)
NRC OMR 200.00 X
Terrestrial Link Within exchange (34Mb/s)
MRC OMR/month 1,316.00 X
Terrestrial Link Within exchange (155Mb/s)
NRC OMR 200.00 X

7
Terrestrial Link Within exchange (155Mb/s)
MRC OMR/month 2,313.00 X
Terrestrial Link < 100 km (2Mb/s)
NRC OMR 100.00 X
Terrestrial Link < 100 km (2Mb/s)
MRC OMR/month 296.00 X
Terrestrial Link < 100 km (34Mb/s)
NRC OMR 200.00 X
Terrestrial Link < 100 km (34Mb/s)
MRC OMR/month 1,334.00 X
Terrestrial Link < 100 km (155Mb/s)
NRC OMR 200.00 X
Terrestrial Link < 100 km (155Mb/s)
MRC OMR/month 2,331.00 X
Terrestrial Link 101-300 km (2Mb/s)
NRC OMR 100.00 X
Terrestrial Link 101-300 km (2Mb/s)
MRC OMR/month 450.00 X
Terrestrial Link 101-300 km (34Mb/s)
NRC OMR 200.00 X
Terrestrial Link 101-300 km (34Mb/s)
MRC OMR/month 1,410.00 X
Terrestrial Link 101-300 km (155Mb/s)
NRC OMR 200.00 X
Terrestrial Link 101-300 km (155Mb/s)
MRC OMR/month 2,407.00 X
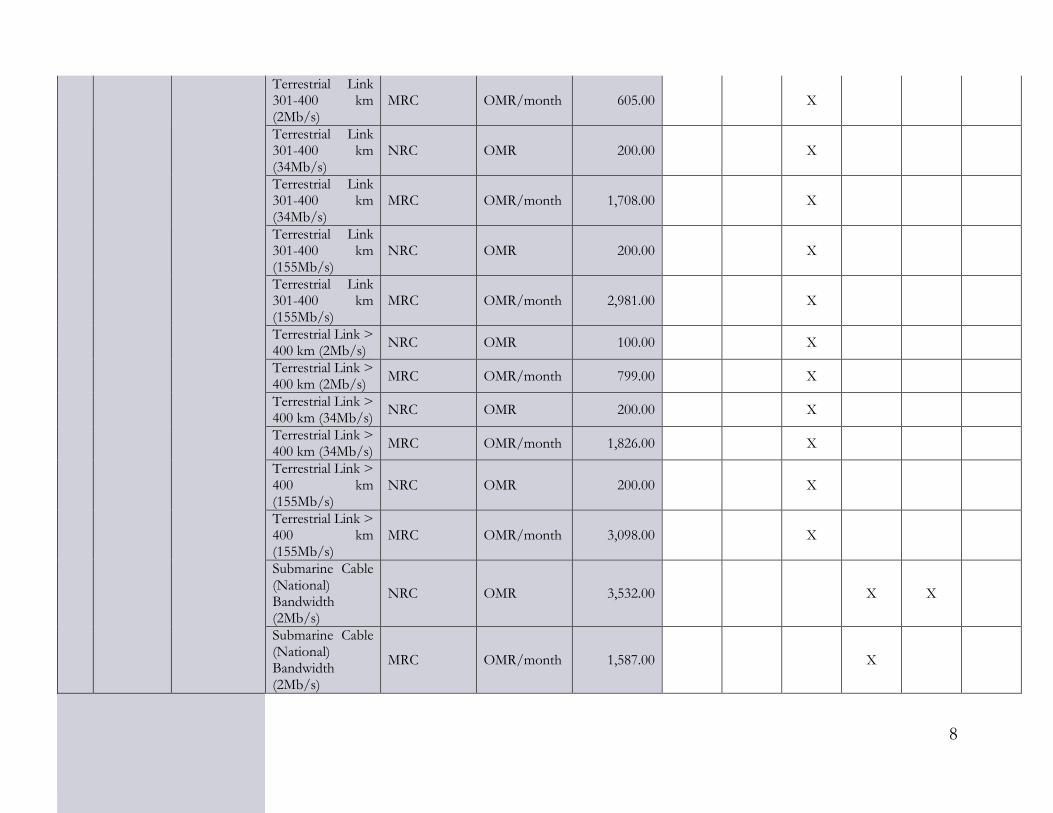
Terrestrial Link 301-400 km (2Mb/s)
NRC OMR 100.00 X
8
Terrestrial Link 301-400 km (2Mb/s)
MRC OMR/month 605.00 X
Terrestrial Link 301-400 km (34Mb/s)
NRC OMR 200.00 X
Terrestrial Link 301-400 km (34Mb/s)
MRC OMR/month 1,708.00 X
Terrestrial Link 301-400 km (155Mb/s)
NRC OMR 200.00 X
Terrestrial Link 301-400 km (155Mb/s)
MRC OMR/month 2,981.00 X
Terrestrial Link > 400 km (2Mb/s)
NRC OMR 100.00 X
Terrestrial Link > 400 km (2Mb/s)
MRC OMR/month 799.00 X
Terrestrial Link > 400 km (34Mb/s)
NRC OMR 200.00 X
Terrestrial Link > 400 km (34Mb/s)
MRC OMR/month 1,826.00 X
Terrestrial Link > 400 km (155Mb/s)
NRC OMR 200.00 X
Terrestrial Link > 400 km (155Mb/s)
MRC OMR/month 3,098.00 X
Submarine Cable (National) Bandwidth (2Mb/s)
NRC OMR 3,532.00 X X
Submarine Cable (National) Bandwidth (2Mb/s)
MRC OMR/month 1,587.00 X

9
Submarine Cable (National) Bandwidth (34Mb/s)
NRC OMR 3,532.00 X X
Submarine Cable (National) Bandwidth (34Mb/s)
MRC OMR/month 5,555.00 X
Submarine Cable (National) Bandwidth (155Mb/s)
NRC OMR 3,532.00 X X
Submarine Cable (National) Bandwidth (155Mb/s)
MRC OMR/month 11,110.00 X
12 C-FA 12
Wholesale Trunk Segment of Leased Line (IPLC)
ME Countries E1 NRC OMR 7,822.00 X X
ME Countries E1 MRC OMR/month 7,410.00 X
Non-ME Countries E1
NRC OMR 7,822.00 X X
Non-ME Countries E1
MRC OMR/month 6,311.00 X
ME Countries DS3
NRC OMR 10,682.00 X X
ME Countries DS3
MRC OMR/month 32,044.00 X
Non-ME Countries DS3
NRC OMR 10,682.00 X X
Non-ME Countries DS3
MRC OMR/month 27,552.00 X
ME Countries STM1
NRC OMR 13,542.00 X X
ME Countries STM1
MRC OMR/month 58,483.00 X
Non-ME Countries STM1
NRC OMR 13,542.00 X X

10
Non-ME Countries STM1
MRC OMR/month 54,102.00 X
13 C-FA 13
IP International Bandwidth Capacity
Bandwidth (155Mb/s)
NRC OMR 1,902.00 X X
Bandwidth (155Mb/s)
MRC OMR/month 63,405.00 X
14 C-FA 14 Access to Landing Station
Landing to Landing Station
NRC OMR 8,180.00 X X
Landing to Landing Station
MRC OMR per SQM
OMR/Sqr-meter
999.00 X
15 C-FA 15 Access to Earth Station
Access to Earth Station
NRC OMR 6,750.00 X X
Access to Earth Station
MRC OMR per SQM
OMR/Sqr-meter
510.00 X
16 C-FA 16 Access to Data Center
Access to Data Station
NRC OMR 6,750.00 X X
Access to Data Station
MRC OMR per SQM
OMR/Sqr-meter
510.00 X
17 C-FI 01 Fixed Ancillary Services
Point of Interconnection-Establishment of a Point of Interconnection
Price Once OMR 3,500.00 X
Point of Interconnection-Maintenance of a Point of Interconnection
Annually up front Price
OMR/year 700.00 X
Fixed Port Capacity Service (2Mb/s)
NRC per port OMR/port 100.00 X
Fixed Port Capacity Service (2Mb/s)
MRC per port OMR/port/month
15.00 X
Fixed Port Capacity Service (2Mb/s)
Disconnection fee per port
OMR/port 70.00 X

11
Basic Block and Expansion Colocation-Basic Block 63 x 2 Mb/s Customer Interface
MRC OMR/month 400.00 X
Basic Block and Expansion Colocation-Basic Block 1 x STM-1 Customer Interface
MRC OMR/month 500.00 X
Basic Block and Expansion Colocation-Expansion Block (63 x 2Mb/s) Customer Interface
MRC OMR/month 250.00 X
Basic Block and Expansion Colocation-Expansion Block 1 x STM-1 Customer Interface
MRC OMR/month 320.00 X
Number Ranges Implementation-Number implementation within a time frame
NRC per order
OMR/order 480.00 X
Number Ranges Implementation-Number implementation at a specified time
NRC per order
OMR/order 960.00 X

12
18 C-FI 02 Fixed Call-by-Call Carrier Selection
Setup Fee-Fixed Call by Call Carrier selection
Setup Fee OMR 2,989.00 X X
Call Origination Price (Baiza/min)
Baiza/min 2.53 X
19 C-FI 03 Fixed Carrier Pre Selection
Setup Fee-Fixed CPS Setup
Setup Fee OMR 2,989.00 X X
Setup Fee-Fixed CPS Setup
Change fee per subscriber
OMR/subscriber
72.00 X X
Call Origination Price (Baiza/min)
Baiza/min 2.53 X
20 C-FI 04
Call Origination for Non-Geographic Calls
Call Origination Price (Baiza/min)
Baiza/min 2.53 X
21 C-FI 05 Outgoing International Calls
International Outgoing Transit
Price (Baiza/min)
Baiza/min
1.75 + international
leg + the termination
party charges+ Admin
X
22 C-FI 06 Call to Special Fixed Services
Calls to Emergency Services-General Emergencies
Price (Baiza/min)
Baiza/min 2.24 X
Calls to Directory Enquiry Services
Price (Baiza/min)
Baiza/min 2.24 Bz +
185.9 Bz per Call
X X
Calls to Local Time Enquiry Service-Local Number Enquiries
Price (Baiza/min)
Baiza/min 2.24 Bz +
185.9 Bz per Call
X X
Calls to Local Time Enquiry Service-
Price (Baiza/min)
Baiza/min 2.24 Bz +
185.9 Bz per Call
X X

13
International Number Enquiries
Calls to Local Time Enquiry Service-Time in Arabic and English
Price (Baiza/min)
Baiza/min 2.24 Bz +
185.9 Bz per Call
X X
Calls to Local Time Enquiry Service-Time in Arabic and English
Price (Baiza/min)
Baiza/min 2.24 Bz +
185.9 Bz per Call
X X
23 C-FI 07
Pre-Paid Calling Cards Access Type 1
Pre-Paid Calling Cards Access Type 1
NRC OMR 2,989.00 X X
Call origination on Pre-Paid Calling Cards Access Type 1
Price (Baiza/min)
Baiza/min 138.35 X
24 C-FI 08
Pre-Paid Calling Cards Access Type 2
Setup Fee-Pre-Paid Calling Cards Access Type 2
NRC OMR 2,989.00 X X
Call Origination Price (Baiza/min)
Baiza/min 253.00 X
25 C-FI 09 Fixed Call Termination Service
Fixed Call Termination
Price (Baiza/min)
Baiza/min 2.24 X
26 C-FI 10 Fixed Call Transit Services
Fixed Call Transit Services
Price (Baiza/min)
Baiza/min 2.73 X
27 C-MA 01 National Roaming Service
Setup Fee-National Roaming Services
NRC per Site OMR/site 2,031.00 X X
Services Charges Retail Minus - Retail minus
12% X X

14
28 C-MA 02 Mobile Access Services
Setup Fee-Mobile Access Services
NRC OMR 150,000.00 X
Services Charges-National Services
Retail Minus - Retail minus
12% X X
Services Charges-International Roaming
Retail Minus - Retail minus
12% X X
29 C-MI 01 Mobile Ancillary Services
Point of Interconnection-Establishment of a Point of Interconnection
Price Once OMR 3,500.00 X
Point of Interconnection-Maintenance of a Point of Interconnection
Price Annually up front
OMR/year 700.00 X
Fixed Port Capacity Service (2Mb/s)
NRC per Port OMR/port 100.00 X
Fixed Port Capacity Service (2Mb/s)
MRC per Port OMR/port/month
15.00 X
Fixed Port Capacity Service (2Mb/s)
Disconnection fee per port
OMR/port 70.00 X
Basic Block and Expansion Colocation-Basic Block 63 x 2 Mb/s Customer Interface
MRC OMR/month 400.00 X
Basic Block and Expansion Colocation-Basic Block 1 x STM-1 Customer Interface
MRC OMR/month 500.00 X

15
Basic Block and Expansion Colocation-Expansion Block (63 x 2Mb/s) Customer Interface
MRC OMR/month 250.00 X
Basic Block and Expansion Colocation-Expansion Block 1 x STM-1 Customer Interface
MRC OMR/month 320.00 X
Number Ranges Implementation-Number implementation within a time frame
NRC per Level
OMR/level 480.00 X
Number Ranges Implementation-Number implementation at a specified time
NRC per Level
OMR/level 960.00 X
30 C-MI 02 Mobile Interconnection Services
Mobile Call Termination
Price (Bz/Min)
Baiza/min 10.51 X
SMS Termination Price (Bz/Min)
Baiza/min 0.83 X
MMS Termination
Price (Bz/Min)
Baiza/min 6.64 X
31 C-MI 03
Mobile Call by Call Carrier Selection
Setup Fee-Mobile Call by Call Carrier selection
NRC OMR 2,989.00 X X
Call Origination Price (Bz/Min)
Baiza/min 12.42 X
32 C-MI 04 Setup Fee-Fixed CPS Setup
Setup Fee OMR 2,989.00 X X

16
Mobile Carrier Pre Selection
Setup Fee-Change fee per subscriber
Setup Fee OMR 72.00 X X
Call Origination Price (Bz/Min)
Baiza/min 12.42 X
33 Other Services
Other Services
Electrical Power and UPD protected power
Installation Charges
OMR 2,000.00 X
Electrical Power and UPD protected power
AC Power Charges (OMR/kWh)
OMR/kWh 0.03 X
Electrical Power and UPD protected power
Protected Power UPS Monthly charges (OMR/kVA)
OMR/kVA 12.00 X
Cable Pulling (100 meter) along with Ducts
NRC OMR 2,975.00 X
Cable Pulling (100 meter) along with Ducts
MRC OMR/month 446.00 X
Communication Earth (new Pit)
NRC OMR 7,000.00 X
Communication Earth (new Pit)
MRC OMR/month 275.00 X
Power Earth (new Pit)
NRC OMR 7,000.00 X
Power Earth (new Pit)
MRC OMR/month 275.00 X
MDF/DDF/Patch Panel Patching
NRC OMR 2,083.00 X
MDF/DDF/Patch Panel Patching
MRC OMR/month 275.00 X
Site Visit-Technician (Sunday to Thursday (07:30 -
OMR/Hour OMR/hour 50.00 X

17
15:30),except Public Holidays)
Site Visit-Engineer (Sunday to Thursday (07:30 - 15:30),except Public Holidays)
OMR/Hour OMR/hour 70.00 X
Site Visit-Project Manager (Sunday to Thursday (07:30 - 15:30),except Public Holidays)
OMR/Hour OMR/hour 100.00 X
Site Visit-Senior Manager (Sunday to Thursday (07:30 - 15:30),except Public Holidays)
OMR/Hour OMR/hour 120.00 X
Site Visit-GM (Sunday to Thursday (07:30 - 15:30),except Public Holidays)
OMR/Hour OMR/hour 150.00 X
Site Visit-VP (Sunday to Thursday (07:30 - 15:30),except Public Holidays)
OMR/Hour OMR/hour 200.00 X
Site Visit-Technician (Sunday to Thursday after 15:30, full day on week-ends and Public Holidays)
OMR/Hour OMR/hour 60.00 X
18
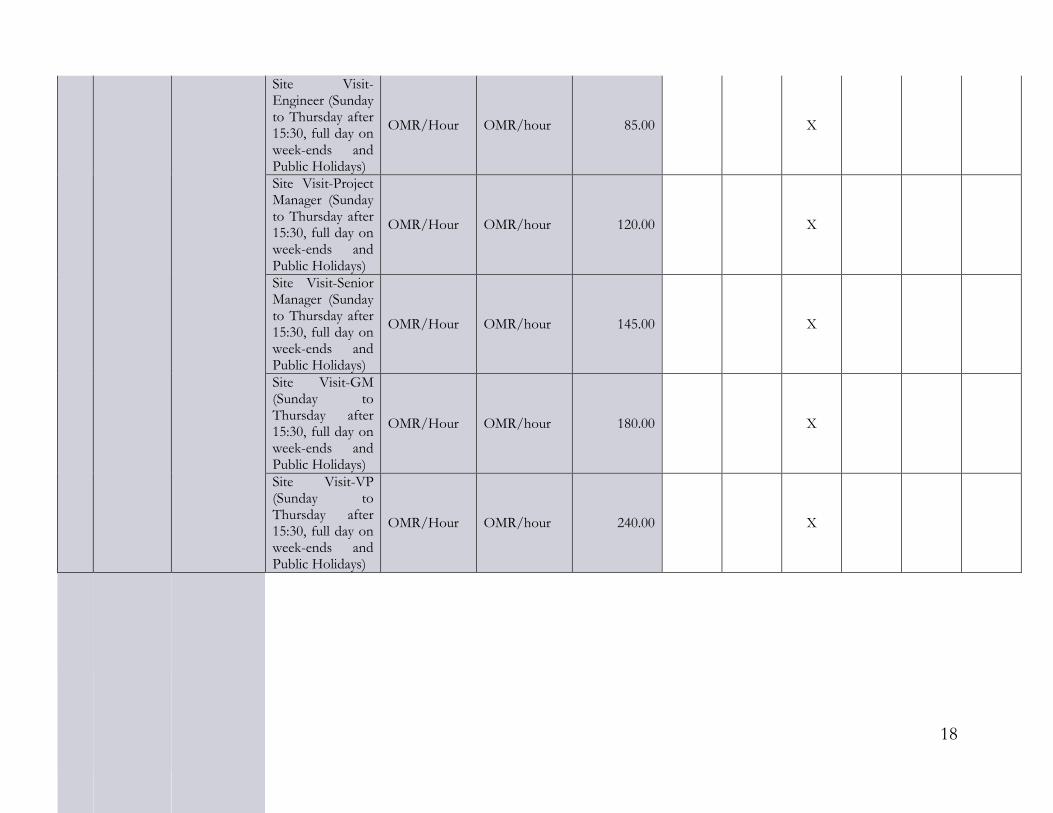
Site Visit-Engineer (Sunday to Thursday after 15:30, full day on week-ends and Public Holidays)
OMR/Hour OMR/hour 85.00 X
Site Visit-Project Manager (Sunday to Thursday after 15:30, full day on week-ends and Public Holidays)
OMR/Hour OMR/hour 120.00 X
Site Visit-Senior Manager (Sunday to Thursday after 15:30, full day on week-ends and Public Holidays)
OMR/Hour OMR/hour 145.00 X
Site Visit-GM (Sunday to Thursday after 15:30, full day on week-ends and Public Holidays)
OMR/Hour OMR/hour 180.00 X
Site Visit-VP (Sunday to Thursday after 15:30, full day on week-ends and Public Holidays)
OMR/Hour OMR/hour 240.00 X

19
Annex-II
TRA’s Comments on Omantel’s Proposed Charges in First Draft RAIO
(a) Omantel has not calculated the proposed minus % (i.e. 12%), for services to be priced on Retail-Minus approach, based on its financial statements. Instead this has been proposed by means of a confidential benchmark. The TRA believes that such operator-specific data cannot be referenced to third operators, but rather needs to properly represent the operations of Omantel. In this regard, the Top-Down model developed by Omantel constitutes a reliable source as it provides specific information on the retail costs at service level. Therefore, the TRA intends to calculate the minus % based on the information available in Omantel’s cost models.
(b) Omantel has failed to conduct the margin squeeze test to prove the replicability of its proposed charges for Broadband Resale Service, National Roaming Service and Mobile Access Service. Although the A&I Regulation requires dominant licensees to accompany their proposed wholesale rates with a Margin Squeeze test, Omantel has not taken that requirement into consideration, failing to provide such calculations to the TRA. Based on that, the TRA lacks evidences proving that the proposed wholesale rates would allow alternative operators to properly replicate the retail tariffs commercialized by Omantel.
(c) Omantel has failed to provide any evidence or supporting calculations for the proposed wholesale rates for following list of services:
Fixed: o Colocation: indoor - MRC OMR Per SQR meter o Wholesale Trunk Segment of Leased Line (National) -- Terrestrial Link
Within exchange – NRC:
2Mb/s
34Mb/s
155Mb/s o Wholesale Trunk Segment of Leased Line (National) -- Terrestrial Link
< 100 km – NRC:
2Mb/s
34Mb/s
155Mb/s o Wholesale Trunk Segment of Leased Line (National) -- Terrestrial Link
101-300 km – NRC:
2Mb/s
34Mb/s
155Mb/s o Wholesale Trunk Segment of Leased Line (National) -- Terrestrial Link
301-400 km – NRC:
2Mb/s
34Mb/s

20
155Mb/s o Wholesale Trunk Segment of Leased Line (National) -- Terrestrial Link
> 400 km – NRC:
2Mb/s
34Mb/s
155Mb/s o Establishment of a Point of Interconnection -- Price Once o Maintenance of a Point of Interconnection -- Annually up front o Fixed Port Capacity Service (2Mb/s) -- NRC per port o Fixed Port Capacity Service (2Mb/s) -- MRC per port o Fixed Port Capacity Service (2Mb/s) -- Disconnection fee per port o Basic Block 63 x 2 Mb/s Customer Interface o Basic Block 1 x STM-1 Customer Interface o Expansion Block 63 x 2 Mb/s Customer Interface o Expansion Block 1 x STM-1 Customer Interface o Number implementation within a time frame -- NRC per order o Number implementation at a specified time -- NRC per order
Mobile services: o Setup Fee-Mobile Access Services -- NRC o Establishment of a Point of Interconnection -- Price Once o Maintenance of a Point of Interconnection - Annually up front o Fixed Port Capacity Service (2Mb/s) -- NRC per Port o Fixed Port Capacity Service (2Mb/s) - MRC per Port o Fixed Port Capacity Service (2Mb/s) - Disconnection fee per port o Basic Block 63 x 2 Mb/s Customer Interface o Basic Block 1 x STM-1 Customer Interface o Expansion Block 63 x 2 Mb/s Customer Interface o Expansion Block 1 x STM-1 Customer Interface o Number implementation within a time frame -- NRC per Level o Number implementation at a specified time -- NRC per Level
Other Services: o Electrical Power and UPD protected power -- Installation Charges o Electrical Power and UPD protected power -- AC Power Charges
(OMR/kWh) o Electrical Power and UPD protected power -- Protected Power UPS
(OMR/kVA) o Cable Pulling (100 meter) along with Ducts - NRC o Cable Pulling (100 meter) along with Ducts - MRC o Communication Earth (new Pit) - NRC o Communication Earth (new Pit) - MRC o Power Earth (new Pit) - NRC o Power Earth (new Pit) - MRC
o MDF/DDF/Patch Panel Patching – NRC o MDF/DDF/Patch Panel Patching - MRC

21
Annex-III
TRA’s Comments on Omantel’s RAIO Models
Omantel provided the following two Excel models to the TRA in which it presents the calculations performed in order to come up with the wholesale rates proposed in its RAIO:
20140601 _ Bit Stream V1.1
20160601 _ Costing & Pricing Model for RAIO_V1.1 Having completed the review of these models, the following aspects have been identified by the TRA:
a) Consideration of a 1.43 uplift factor in the calculations of NRC. When calculating a relevant bulk of the wholesale charges presented, Omantel has used a 1.43 uplift factor which has been obtained as follows:
Where:
- “Royalty Fees” represent the applicable 7% fees on revenues
- “Margin” is set at 20%
- “Taxation” is set at 15% Although the TRA agrees in the application of the Royalty Fees, it has the following observations of the application of the margin and the taxation fields:
In cost setting purposes, the margin is represented by the WACC (Weighted Average Cost of Capital) which, in turn, is only applied over the capital employed by the operator (and not to its cost base including, inter alia, operational expenses). Therefore, the TRA is of the opinion that the “Margin” employed should be equal to the Omantel’s WACC of 12.07% and that it should only be applied over the capital employed by Omantel.
Given that a pre-tax WACC is employed in the previous definition of the “Margin”, which is calculated before the application of corporate income tax rates, the Taxation should not be applied in this formulae.
b) Consideration of an uplift factor in the calculation of staff hourly rates
As reported by Omantel, staff hourly rates are adjusted based on the time they need to dedicate to other activities such planning, coordination, etc. which depended on the role of the employee (e.g. manager, technician). However, given that all the calculations performed by Omantel seem to be inclusive of all the tasks that would be required to provide the different services, it is not clear why these additional uplifts should be applied. Based on this, the TRA is of the opinion that no uplift factors should be taken into consideration in the calculation of the ancillary services wholesale charges.
𝑈𝑝𝑙𝑖𝑓𝑡𝐹𝑎𝑐𝑡𝑜𝑟 =1
1 − (𝑅𝑜𝑦𝑎𝑙𝑡𝑦𝐹𝑒𝑒𝑠 + 𝑀𝑎𝑟𝑔𝑖𝑛 + 𝑀𝑎𝑟𝑔𝑖𝑛 · 𝑇𝑎𝑥𝑎𝑡𝑖𝑜𝑛)

22
Annex-IV TRA’s Proposed Changes in Omantel’s Top-Down LRIC Model
The proposed recurrent charges by Omantel have been mostly based, directly or indirectly, on the outputs produced by its TD-LRIC model for the year 2015. In order to verify the accuracy of those outputs, the TRA has conducted the review of Omantel’s Top-Down model. The review has been carried out over the three cost standards, namely:
FDC-HCA
FDC-CCA
LRIC-CCA As a result of this process, there are a number of issues that have been identified for modifications so as to comply with the requirement of A&I Regulation for these charges to be fair, reasonable and based on forward looking long run incremental cost (LRIC) of efficient service provision. These issues have been categorised as presented below: 1. Allocation Factors 2. CCA Valuations 3. Implementation of the TD-LRIC 4. Definition of CVRs For each of the issues identified the following information is presented:
Description of the issue.
Description of the alternative drivers suggested to correct the issue and come up with the rectified costs at service level.
Proposed modification.

23
1. Allocation Factors Based on the results of the review performed on the Allocation Factors, the main areas of improvement identified that should be corrected to properly determine the unit costs of Omantel’s products are presented below:
(i)
(i) Inaccurate drivers for the allocation of mobile network elements
(ii)
(ii) Oversimplified driver for the allocation of mobile radio equipment
(iii) On-net traffic considered for allocations at stage F is incorrect
(iv)

24
(iv) A royalty fee allocation is missing at stage G (i) Inaccurate drivers for the allocation of mobile network elements In the allocation from network elements (LNE, Stage D) to network components (LNC, Stage E), Omantel has used the drivers described below for the following accounts related to the mobile network:
Sender code Sender description Driver
D-LNE_MOB_ACC_BTS Access - BTS Number of channel links
D-LNE_MOB_BSS_BSC BSS – BSC % of link serving voice/events
D-LNE_MOB_BSS_RNC BSS - RNC % of link serving voice/data/events
D-LNE_MOB_RAD_BTS Radio - BTS Number of channel links
D-LNE_MOB_RAD_NDB Radio - Node B % of link serving voice/data/events
D-LNE_MOB_RAD_SRAN Radio - SRAN Number of channel links
D-LNE_MOB_SWI_MGW Switching - MGW % of link serving voice/events
Table 1.1: Drivers employed by Omantel for the allocation of different mobile related network elements
As it may be inferred from the table above, Omantel seems to be associating different links of the network to each service type (e.g. voice, data, events). However, in current convergent networks such an approximation would not be applicable as indeed all (or virtually all) links carry all types of traffic. Based on that, a driver that is commonly used instead is the measure of the traffic load generated by each type of service through the so-called routing factors. Referring back to an international benchmark of the figures used in other countries the following factors would be extracted:
Conversion from MB to minute Country 2G 3G 4G
Norway 4.24 1.10 0.18
Netherlands 5.74 0.73 -
Sweden 3.19 0.95 0.17
Simple Average 4.39 0.93 0.18
Table 1.2: Conversion factors from MB to minutes

25
Where each of these values is obtained by the Regulatory Authorities through the formula presented below:
𝐶𝑜𝑛𝑣𝑒𝑟𝑠𝑖𝑜𝑛𝐹𝑎𝑐𝑡𝑜𝑟 =(1 + 𝐼𝑃 𝑂𝑣𝑒𝑟ℎ𝑒𝑎𝑑𝑠) ∗ %𝑇𝑟𝑎𝑓𝑓𝑖𝑐𝐷𝑜𝑤𝑛𝑙𝑖𝑛𝑘 ∗ 𝐵𝑖𝑡𝑠𝐼𝑛𝐴𝐵𝑦𝑡𝑒
𝑆𝑒𝑐𝑜𝑛𝑑𝑠𝐼𝑛𝐴𝑀𝑖𝑛𝑢𝑡𝑒 ∗ 𝐶ℎ𝑎𝑛𝑛𝑒𝑙𝐷𝑎𝑡𝑎𝑅𝑎𝑡𝑒
Conversion from SMS to minute The conversion factor from SMSs to min is generally obtained through the formula presented below:
𝐶𝑜𝑛𝑣𝑒𝑟𝑠𝑖𝑜𝑛𝐹𝑎𝑐𝑡𝑜𝑟 =𝐵𝑖𝑡𝑠𝐼𝑛𝐴𝐵𝑦𝑡𝑒 ∗ 𝐵𝑦𝑡𝑒𝑠𝑃𝑒𝑟𝑆𝑀𝑆
𝐶ℎ𝑎𝑛𝑛𝑒𝑙𝑆𝑀𝑆𝑅𝑎𝑡𝑒 ∗ 𝑆𝑒𝑐𝑜𝑛𝑑𝑠𝐼𝑛𝐴𝑀𝑖𝑛𝑢𝑡𝑒
The application of this formula by the same three NRAs presented above leads to an equivalency of 0.000869 min/SMS. The values employed to reach that factor are presented below:
Parameters Value
Number of bytes per SMS 40
Channel SMS bitrate 6,136
Seconds in a minute 60
Bits in a byte 8
Table 1.3: Parameters employed in the SMS to minute conversion Based on the above, the following routing factors should be used to distribute costs between voice, data and SMS services (these would then need to be multiplied by the traffic of each service in order to extract the final driver to be adopted):
Country 2G 3G 4G
Voice 1.00 1.00 1.00
Data 4.39 0.93 0.18
SMS 0.00087 0.00087 0.00087
Table 1.4: Routing factors to be used Considering the volumes of traffic of each service reported by Omantel as part of the Accounting Separation reports, as well as the distribution of traffic by technology provided under the scope of the update of the Bottom-Up models, the allocation drivers originally used by Omantel would be adjusted as follows:

26
Senders Receivers Original Allocation Driver
Adjusted Allocation Driver
D-LNE_MOB_ACC_BTS
E-LNC_MOB_ACC_BTS_BSC_D ………1 ………
E-LNC_MOB_ACC_BTS_BSC_E ……… ………
E-LNC_MOB_ACC_BTS_BSC_M ……… ………
D-LNE_MOB_BSS_BSC E-LNC_MOB_BSS_BSC_E ……… ………
E-LNC_MOB_BSS_BSC_M ……… ………
D-LNE_MOB_BSS_RNC
E-LNC_MOB_BSS_RNC_D ……… ………
E-LNC_MOB_BSS_RNC_E ……… ………
E-LNC_MOB_BSS_RNC_M ……… ………
D-LNE_MOB_RAD_BTS
E-LNC_MOB_RAD_BTS_D ……… ………
E-LNC_MOB_RAD_BTS_E ……… ………
E-LNC_MOB_RAD_BTS_M ……… ………
D-LNE_MOB_RAD_NDB
E-LNC_MOB_RAD_NDB_D ……… ………
E-LNC_MOB_RAD_NDB_E ……… ………
E-LNC_MOB_RAD_NDB_M ……… ………
D-LNE_MOB_RAD_SRAN
E-LNC_MOB_RAD_SRAN_D ……… ………
E-LNC_MOB_RAD_SRAN_E ……… ………
E-LNC_MOB_RAD_SRAN_M ……… ………
D-LNE_MOB_SWI_MGW E-LNC_MOB_SWI_MGW_E ……… ………
E-LNC_MOB_SWI_MGW_M ……… ………
Table 1.5: Original and adjusted allocation drivers Apart from the above, and as highlighted in the table, it may be noted that the network element ‘D-LNE_MOB_BSS_BSC’ would not be allocating costs to data services as per the structure designed by Omantel. However, and following the same approach as already adopted by Omantel in the case of 3G network elements (see allocations for ‘D-LNE_MOB_BSS_RNC’), this network element would also be used by data services. Therefore, the allocation of that network element should be adjusted as presented below (new allocation highlighted in red font):
Senders Receivers Original Allocation Driver
Adjusted Allocation Driver
D-LNE_MOB_BSS_BSC
E-LNC_MOB_BSS_BSC_D - ………
E-LNC_MOB_BSS_BSC_E ……… ………
E-LNC_MOB_BSS_BSC_M ……… ………
Table 1.6: Adjusted allocation of the account ‘D-LNE_MOB_BSS_BSC’
1 Redacted due to confidentiality reasons.

27
TRA Comment #1. Allocation of mobile accounts at stage E
The TRA proposes to adjust the allocation factors used for the accounts as laid out in this section, ensuring that the drivers used are consistent and causal.
(ii) Oversimplified driver for the allocation of mobile radio equipment The allocation of the network block related to the mobile radio access network ‘C-LNB_MOB_RAD’ to network elements is performed by Omantel by means of an Equi-proportional Mark-up as presented below:
Sender code Sender description
Receiver code Receiver description Driver
C-LNB_MOB_RAD Radio
D-LNE_MOB_RAD_BTS Radio - BTS
EPMU D-LNE_MOB_RAD_ENDB Radio - Enode B
D-LNE_MOB_RAD_NDB Radio - Node B
D-LNE_MOB_RAD_SRAN Radio - SRAN
Table 1.7: Allocation of mobile radio equipment to NEs Given the materiality of this Stage C account (……… OMR), the use of an equi-proportional mark-up is believed to be an over-simplification and better alternatives to perform that allocation have been identified. Specifically, an allocation based on the number of cell sites would better comply with the cost causality principle. Indeed, Omantel already adopted such an approach for the allocation of the radio sites:
Sender code Receiver code Factor Actual driver Driver description
C-LNB_MOB_FAC_SITE
D-LNE_MOB_RAD_BTS ……… ………
Number of cell sites
D-LNE_MOB_RAD_ENDB ……… ………
D-LNE_MOB_RAD_NDB ……… ………
D-LNE_MOB_RAD_SRAN ……… ……… Table 1.8: Allocation of mobile facilities at stage D
The TRA is of view that the same driver should be used for the allocation of radio equipment and mobile facilities. Based on that, the adjusted allocation drivers that would be suggested for the allocation of the “C-LNB_MOB_RAD” network block are presented below:
Sender code Receiver code Original Allocation Driver
Adjusted Allocation Driver
C-LNB_MOB_RAD
D-LNE_MOB_RAD_BTS ……… ………
D-LNE_MOB_RAD_ENDB ……… ………
D-LNE_MOB_RAD_NDB ……… ………
D-LNE_MOB_RAD_SRAN ……… ………
Table 1.9: Original and adjusted allocation drivers

28
TRA Comment #2. Allocation of radio equipment at stage D The TRA proposes to adjust the drivers used for the allocation of the ‘C-LNB_MOB_RAD’ account by means of a more causal driver than an EPMU based on costs.
(iii) On-net traffic considered for allocations at stage F is incorrect Following TRA’s review of the TD-Model’s inputs, it has identified that some of the volumes reported and used by Omantel in the definition of its allocations would not be accurate. Specifically, the original and adjusted service volumes are outlined below:
Receiver code Original volume Adjusted volume
F-OM-CON-PRE_LIB-HS-CO-VOI-VC-P2P-M ……… ………
F-OM-CON-PRE_LIB-HS-CT-VOI-VC-P2P-M ……… ………
F-OM-CON-PRE_LIB-HS-CO-VOI-VC-P2P-E ……… ………
F-OM-CON-PRE_LIB-HS-CT-VOI-VC-P2P-E ……… ………
F-OM-CON-PRE-HS-CO-VOI-VC-P2P-M ……… ………
F-OM-CON-PRE-HS-CT-VOI-VC-P2P-M ……… ………
Table 1.10: Original and adjusted service volumes for various stage-F services Based on the above, the following allocations from Stage E to Stage F would need to be adjusted as presented below:

29
Sender code Receiver code Original driver Adjusted driver
E-LNC_MOB_ACC_BTS_BSC_M
F-OM-CON-PRE_LIB-HS-CO-VOI-VC-P2P-M ……… ………
F-OM-CON-PRE_LIB-HS-CT-VOI-VC-P2P-M ……… ………
F-OM-CON-PRE-HS-CO-VOI-VC-P2P-M ……… ………
F-OM-CON-PRE-HS-CT-VOI-VC-P2P-M ……… ………
E-LNC_MOB_BSS_RNC_M
F-OM-CON-PRE_LIB-HS-CO-VOI-VC-P2P-M ……… ………
F-OM-CON-PRE_LIB-HS-CT-VOI-VC-P2P-M ……… ………
F-OM-CON-PRE-HS-CO-VOI-VC-P2P-M ……… ………
F-OM-CON-PRE-HS-CT-VOI-VC-P2P-M ……… ………
E-LNC_MOB_RAD_BTS_M
F-OM-CON-PRE_LIB-HS-CO-VOI-VC-P2P-M ……… ………
F-OM-CON-PRE_LIB-HS-CT-VOI-VC-P2P-M ……… ………
F-OM-CON-PRE-HS-CO-VOI-VC-P2P-M ……… ………
F-OM-CON-PRE-HS-CT-VOI-VC-P2P-M ……… ………
E-LNC_MOB_RAD_NDB_M
F-OM-CON-PRE_LIB-HS-CO-VOI-VC-P2P-M ……… ………
F-OM-CON-PRE_LIB-HS-CT-VOI-VC-P2P-M ……… ………
F-OM-CON-PRE-HS-CO-VOI-VC-P2P-M ……… ………
F-OM-CON-PRE-HS-CT-VOI-VC-P2P-M ……… ………
E-LNC_MOB_RAD_SRAN_E F-OM-CON-PRE_LIB-HS-CO-VOI-VC-P2P-E ……… ………
F-OM-CON-PRE_LIB-HS-CT-VOI-VC-P2P-E ……… ………
E-LNC_MOB_RAD_SRAN_M F-OM-CON-PRE-HS-CO-VOI-VC-P2P-M ……… ………
F-OM-CON-PRE-HS-CT-VOI-VC-P2P-M ……… ………
E-LNC_MOB_SWI_HLR_E F-OM-CON-PRE_LIB-HS-CT-VOI-VC-P2P-E ……… ………
E-LNC_MOB_TXN_MGW_MGW_M
F-OM-CON-PRE_LIB-HS-CO-VOI-VC-P2P-M ……… ………
F-OM-CON-PRE_LIB-HS-CT-VOI-VC-P2P-M ……… ………
F-OM-CON-PRE-HS-CO-VOI-VC-P2P-M ……… ………
F-OM-CON-PRE-HS-CT-VOI-VC-P2P-M ……… ………
E-LNC_MOB_TXN_RNC_MGW_M
F-OM-CON-PRE_LIB-HS-CO-VOI-VC-P2P-M ……… ………
F-OM-CON-PRE_LIB-HS-CT-VOI-VC-P2P-M ……… ………
F-OM-CON-PRE-HS-CO-VOI-VC-P2P-M ……… ………
F-OM-CON-PRE-HS-CT-VOI-VC-P2P-M ……… ………
Table 1.11: Original and adjusted drivers for the allocation of various mobile accounts at stage F
TRA Comment #3. Allocations related to on-net traffic The TRA proposes to adjust the volumes of these services so as to better reflect the operational realities of Omantel.

30
(iv) A royalty fee allocation is missing at stage G In the review of the allocation of royalty fees to services it was observed that the service ‘H-OT-WS-NC-N-RNT-LL-N-N-E1-N’ did not receive any costs for that concept. The allocation of these royalty fees should be reflected in the allocation from Stage F to Stage G, which was actually performed by Omantel as presented below:
Sender code Receiver code Allocation factor
Driver value Driver description
F-OT-WS-NC-N-RNT-LL-N-N-R
G-OT-WS-NC-N-RNT-LL-N-N-E1-0_100-R
……… ………
Revenues
G-OT-WS-NC-N-RNT-LL-N-N-E1-101_300-R
……… ………
G-OT-WS-NC-N-RNT-LL-N-N-E1-301_400-R
……… ………
G-OT-WS-NC-N-RNT-LL-N-N-E1-51_100-R
……… ………
G-OT-WS-NC-N-RNT-LL-N-N-E1-GT400-R
……… ………
G-OT-WS-NC-N-RNT-LL-N-N-E1-PREM-R
……… ………
G-OT-WS-NC-N-RNT-LL-N-N-E1-XI-R
……… ………
G-OT-WS-NC-N-RNT-LL-N-N-STM1-GT400-R
……… ………
G-OT-WS-NC-N-RNT-LL-N-N-STM1-XI-R
……… ………
Table 1.12: Allocation of the account related to royalty fees to stage G The final service H-OT-WS-NC-N-RNT-LL-N-N-E1-N should receive royalty fee costs, similarly to the other receiver accounts in the table above. However, this allocation does not exist at this stage G. To correct this issue, a new receiver account at stage G should be created, and the allocation percentage should be defined based on the revenues of that service. The result of this correction is presented below (the new account is highlighted in red font):

31
Sender code Receiver code Allocation factor
Driver value Driver description
F-OT-WS-NC-N-RNT-LL-N-N-R
G-OT-WS-NC-N-RNT-LL-N-N-E1-0_100-R
……… ………
Revenues
G-OT-WS-NC-N-RNT-LL-N-N-E1-101_300-R
……… ………
G-OT-WS-NC-N-RNT-LL-N-N-E1-301_400-R
……… ………
G-OT-WS-NC-N-RNT-LL-N-N-E1-51_100-R
……… ………
G-OT-WS-NC-N-RNT-LL-N-N-E1-GT400-R
……… ………
G-OT-WS-NC-N-RNT-LL-N-N-E1-PREM-R
……… ………
G-OT-WS-NC-N-RNT-LL-N-N-E1-XI-R
……… ………
G-OT-WS-NC-N-RNT-LL-N-N-E1-N-R
……… ………
G-OT-WS-NC-N-RNT-LL-N-N-STM1-GT400-R
……… ………
G-OT-WS-NC-N-RNT-LL-N-N-STM1-XI-R
……… ………
Table 1.13: Adjusted allocation related to royalty fees at stage G
TRA Comment #4. Allocation related to royalty fees at stage G The TRA proposes to adjust the allocation of royalty fees so that each service receives a fair share of the applicable fees. The service identified above would be added to the allocations presented in this section.

32
2. CCA Valuations Based on the results of the review carried out on the CCA valuations implemented by Omantel, the main areas of improvement identified that should be corrected to properly determine the unit costs of Omantel’s services are presented below:
(i)
(i) eNodeBs’ unit costs are not aligned with their HCA valuation
(ii)
(ii) SRANs 2G’s unit costs are not aligned with their HCA valuation
(iii)
(iii) Towers’ unit costs are not representative of the associated height range
(iv)

33
(iv) PC terminals’ index is not
(v)
(v) MW links’ valuation is not representative of the actual network
(vi)
34
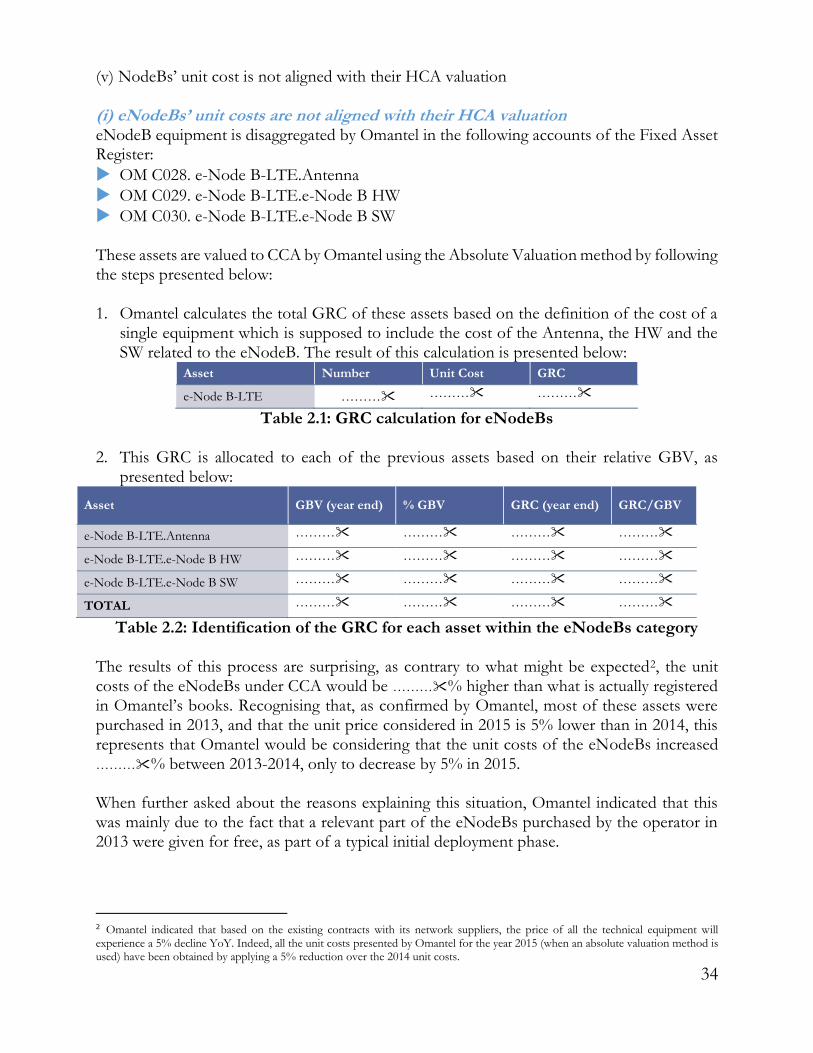
(v) NodeBs’ unit cost is not aligned with their HCA valuation (i) eNodeBs’ unit costs are not aligned with their HCA valuation eNodeB equipment is disaggregated by Omantel in the following accounts of the Fixed Asset Register:
OM C028. e-Node B-LTE.Antenna
OM C029. e-Node B-LTE.e-Node B HW
OM C030. e-Node B-LTE.e-Node B SW These assets are valued to CCA by Omantel using the Absolute Valuation method by following the steps presented below: 1. Omantel calculates the total GRC of these assets based on the definition of the cost of a
single equipment which is supposed to include the cost of the Antenna, the HW and the SW related to the eNodeB. The result of this calculation is presented below:
Asset Number Unit Cost GRC
e-Node B-LTE ……… ……… ………
Table 2.1: GRC calculation for eNodeBs
2. This GRC is allocated to each of the previous assets based on their relative GBV, as presented below:
Asset GBV (year end) % GBV GRC (year end) GRC/GBV
e-Node B-LTE.Antenna ……… ……… ……… ………
e-Node B-LTE.e-Node B HW ……… ……… ……… ………
e-Node B-LTE.e-Node B SW ……… ……… ……… ………
TOTAL ……… ……… ……… ………
Table 2.2: Identification of the GRC for each asset within the eNodeBs category The results of this process are surprising, as contrary to what might be expected2, the unit costs of the eNodeBs under CCA would be ………% higher than what is actually registered in Omantel’s books. Recognising that, as confirmed by Omantel, most of these assets were purchased in 2013, and that the unit price considered in 2015 is 5% lower than in 2014, this represents that Omantel would be considering that the unit costs of the eNodeBs increased ………% between 2013-2014, only to decrease by 5% in 2015. When further asked about the reasons explaining this situation, Omantel indicated that this was mainly due to the fact that a relevant part of the eNodeBs purchased by the operator in 2013 were given for free, as part of a typical initial deployment phase.
2 Omantel indicated that based on the existing contracts with its network suppliers, the price of all the technical equipment will experience a 5% decline YoY. Indeed, all the unit costs presented by Omantel for the year 2015 (when an absolute valuation method is used) have been obtained by applying a 5% reduction over the 2014 unit costs.

35
A proper CCA valuation must take into consideration the likely market realities in any given moment, and should ensure that, if these conditions applied to Omantel they would probably apply to a third operator. Based on that, the equipment that was given for free should still be considered as such in the CCA valuation. In order to solve this issue, two different alternatives have been identified:
a) Re-do the CCA valuation of these assets, without taking into consideration those assets that were given for free to Omantel
b) Given that these assets were recently acquired by Omantel, HCA valuation could be used as a reasonable proxy.
Considering that the necessary information in order to implement alternative a) above is not available, the second alternative has been adopted. Based on that, the GRC of these assets would be left as follows:
Asset GBV (year end) % GBV GRC (year end) GRC/GBV
e-Node B-LTE.Antenna ……… ……… ……… ………
e-Node B-LTE.e-Node B HW ……… ……… ……… ………
e-Node B-LTE.e-Node B SW ……… ……… ……… ………
TOTAL ……… ……… ……… ………
Table 2.3: Adjusted CCA valuation of the eNodeBs
TRA Comment #5. eNodeBs CCA valuation The TRA proposes to adjust the CCA valuation adopted for the eNodeBs using their GBV as a reasonable proxy for the time being.
(ii) SRANs 2G’s unit costs are not aligned with their HCA valuation SingleRAN 2G equipment is disaggregated by Omantel in the following accounts of the Fixed Asset Register:
OM C123. Sin RAN BTS.2G Equipment
OM C124. Sin RAN BTS.2G Software These assets are valued to CCA by Omantel using the Absolute Valuation method by following the steps presented below: 1. Omantel calculates the total GRC of these assets based on the definition of the cost of a
single equipment which is supposed to include the cost of the equipment and the SW related to the SRAN 2G. The result of this calculation is presented below:
Asset Number Unit Cost GRC
(2G) Single RAN ……… ……… ………
Table 2.4: GRC calculation for SRAN 2G

36
2. This GRC is allocated to each of the previous assets based on their relative GBV, as presented below:
Asset GBV (year end) % GBV GRC (year end) GRC/GBV
Sin RAN BTS.2G Equipment ……… ……… ……… ………
Sin RAN BTS.2G Software ……… ……… ……… ………
TOTAL ……… ……… ……… ………
Table 2.5: Identification of the GRC for each asset within the SRAN 2G category As it may be inferred from the previous table, Omantel would expect the GRC of these assets to be ………% higher than their GBV. Given that these assets were purchased mostly in 2013/2014, Omantel would be considering a substantial YoY increase in the unit price of these network elements, which does not seem to be aligned with recent market trends. Based on the above, the CCA valuation of the SingleRAN equipment performed by Omantel is not considered to be reasonable and should be adjusted in order to guarantee the robustness of the results of the TD Model. Similarly, to the previous issue, there would be two alternatives to solve the problem identified above:
a) Re-do the CCA valuation of these assets, taking into account the likely discounts that were granted to Omantel
b) Given that these assets were recently acquired by Omantel, HCA valuation could be used as a reasonable proxy.
Considering that the necessary information in order to implement alternative a) above is not available, the second alternative has been adopted. Based on that, the GRC of these assets would be set as follows:
Asset GBV (year end) % GBV GRC (year end) GRC/GBV
Sin RAN BTS.2G Equipment ……… ……… ……… ………
Sin RAN BTS.2G Software ……… ……… ……… ………
TOTAL ……… ……… ……… ………
Table 2.6: Adjusted CCA valuation of the SRANs 2G
TRA Comment #6. SRANs 2G CCA valuation The TRA proposes to adjust the CCA valuation adopted for the SRAN 2G equipment using their GBV as a reasonable proxy for the time being.

37
(iii) Towers’ unit costs are not representative of the associated height range The mobile sites category defined by Omantel aggregates the following assets of the Fixed Asset Register:
OM C012. Buildings.Buildings
OM C013. Buildings.Container
OM C014. Buildings.Ele mechanicals
OM C015. Buildings.Tower
OM C020. Civil Works.Civil Foundation
OM C035. Fencing.Boundary wall
OM C036. Fencing.Chain Link
OM C037. Fencing.Gates Barriers
OM C041. Generators.BTS Sites
OM C068. Land.Freehold Land
OM C106. Power Supply.Power Supp Eqpt
OM C107. Power Test.Power Equipment
OM C114. Roads.Roads
OM C165. Power Supply.Electricity Comp
OT C209. Power Supply.Power Supp Eqpt
OT C241. Power Supply.Electricity Comp Omantel calculates the total GRC of this asset category as the product of the quantity and unit price of different assets linked to buildings, power supplies and towers. The specific data considered by Omantel is presented below (assets related to towers are highlighted in red font):

38
Equipment Number Unit Cost GRC
Roof Tops/IBS ……… ……… ………
Green Field Towers, 10-30M ……… ……… ………
Green Field Towers, 30-40M ……… ……… ………
Green Field Towers, >40M ……… ……… ………
Monopoles 20 to 30 m ……… ……… ………
Shelter Type-A ……… ……… ………
Shelter Type- 3mx6m ……… ……… ………
Boundary Wall 15X15m Avg. ……… ……… ………
Fence 15x15m ……… ……… ………
Roads ……… ……… ………
Generator 20 to 50 KVA ……… ……… ………
Generator 80 to 200 KVA ……… ……… ………
Generator 200 to 650 KVA ……… ……… ………
Generator 750 to 1500 KVA ……… ……… ………
Extension of main power supply at different sites ……… ……… ………
DC system 30A to 100A with 50AH to 100AH Battery ……… ……… ………
DC system 200A to 400A with 200AH to 400AH Battery ……… ……… ………
DC system 600A to 1500A with 800AH to 1800AH Battery ……… ……… ………
DC system 3000A with 3000AH Battery ……… ……… ………
UPS 3 KVA to 20 KVA ……… ……… ………
UPS 30KVA to 60 KVA ……… ……… ………
UPS 80 KVA to 120 KVA ……… ……… ………
UPS > 120 KVA ……… ……… ………
DCDB and allied cable work ……… ……… ………
2x 2Tr Air conditioner with cyclic controller ……… ……… ………
5 Tr Air conditioner ……… ……… ………
Chillers ……… ……… ………
Basic Fire alarm (if not provided with shelter) ……… ……… ………
Lighting/switches/accessories ……… ……… ………
Mains I/P with meter panel and allied cabling ……… ……… ………
20KVA DG set with fuel Tank and AMF panel and allied cabling ……… ……… ………
20KVA stabilizer ……… ……… ………
TOTAL ………
Table 2.7: GRC calculation for the mobile sites category In the definition of the unit costs of the Green Field Towers highlighted in the table above, Omantel considered the tallest tower within each specific range (i.e. price of a 30m, 40m and 70m high tower), which led to an overestimation of costs.

39
In order to solve this issue, an average unit price for each range has been calculated based on the data provided by Omantel:
Size of tower Cost in Dakliah (OMR)
Cost in Wusta (OMR)
Cost in Dhofar (OMR)
Average unit price (OMR)
15 m ……… ……… ………
……… 20 m ……… ……… ………
25 m ……… ……… ………
30 m ……… ……… ………
……… 35 m ……… ……… ………
40 m ……… ……… ………
45 m ……… ……… ………
………
50 m ……… ……… ………
55 m ……… ……… ………
60 m ……… ……… ………
65 m ……… ……… ………
70 m ……… ……… ………
Table 2.8: Calculation of the average unit price for towers in each range of height The average price calculated for each range and resulting GRCs are shown below:
Asset Number Adjusted unit cost
Adjusted GRC
Green Field Towers, 10-30M ……… ……… ………
Green Field Towers, 30-40M ……… ……… ………
Green Field Towers, >40M ……… ……… ………
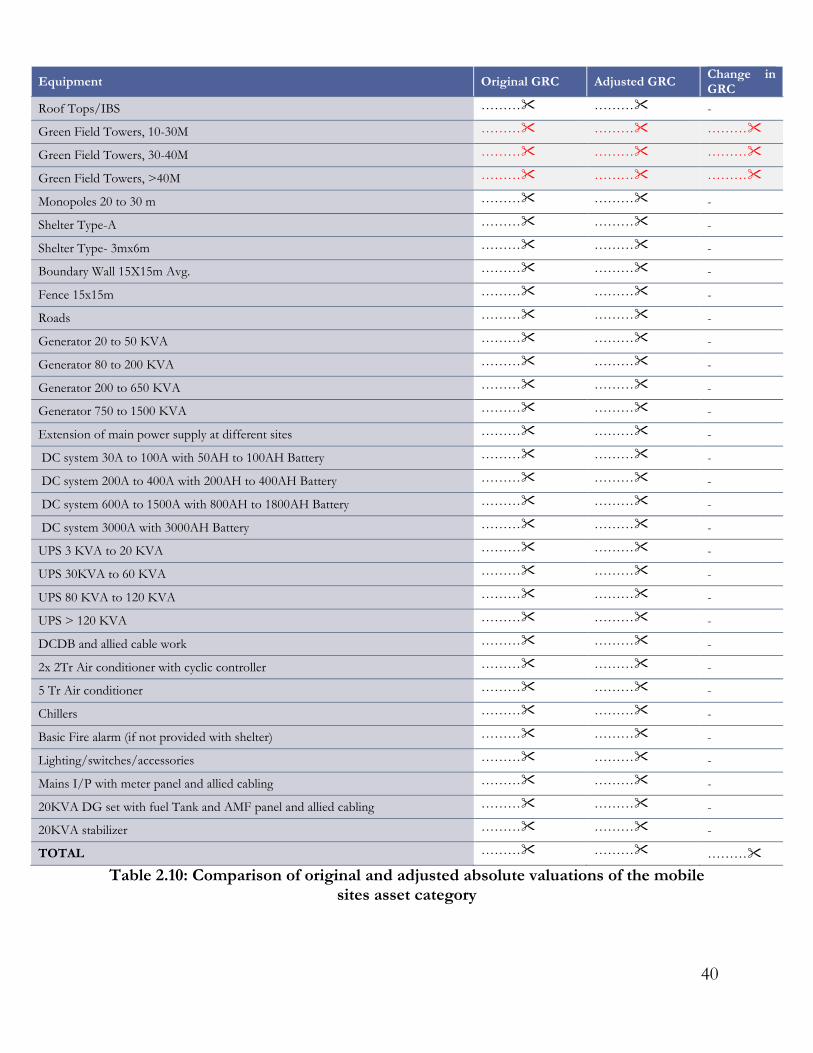
Table 2.9: Adjusted GRC calculation for towers A comparison of the original and adjusted absolute valuations of the mobile sites category is presented below (assets related to towers are highlighted in red font):
40
Equipment Original GRC Adjusted GRC Change in GRC
Roof Tops/IBS ……… ……… -
Green Field Towers, 10-30M ……… ……… ………
Green Field Towers, 30-40M ……… ……… ………
Green Field Towers, >40M ……… ……… ………
Monopoles 20 to 30 m ……… ……… -
Shelter Type-A ……… ……… -
Shelter Type- 3mx6m ……… ……… -
Boundary Wall 15X15m Avg. ……… ……… -
Fence 15x15m ……… ……… -
Roads ……… ……… -
Generator 20 to 50 KVA ……… ……… -
Generator 80 to 200 KVA ……… ……… -
Generator 200 to 650 KVA ……… ……… -
Generator 750 to 1500 KVA ……… ……… -
Extension of main power supply at different sites ……… ……… -
DC system 30A to 100A with 50AH to 100AH Battery ……… ……… -
DC system 200A to 400A with 200AH to 400AH Battery ……… ……… -
DC system 600A to 1500A with 800AH to 1800AH Battery ……… ……… -
DC system 3000A with 3000AH Battery ……… ……… -
UPS 3 KVA to 20 KVA ……… ……… -
UPS 30KVA to 60 KVA ……… ……… -
UPS 80 KVA to 120 KVA ……… ……… -
UPS > 120 KVA ……… ……… -
DCDB and allied cable work ……… ……… -
2x 2Tr Air conditioner with cyclic controller ……… ……… -
5 Tr Air conditioner ……… ……… -
Chillers ……… ……… -
Basic Fire alarm (if not provided with shelter) ……… ……… -
Lighting/switches/accessories ……… ……… -
Mains I/P with meter panel and allied cabling ……… ……… -
20KVA DG set with fuel Tank and AMF panel and allied cabling ……… ……… -
20KVA stabilizer ……… ……… -
TOTAL ……… ……… ………
Table 2.10: Comparison of original and adjusted absolute valuations of the mobile sites asset category
41
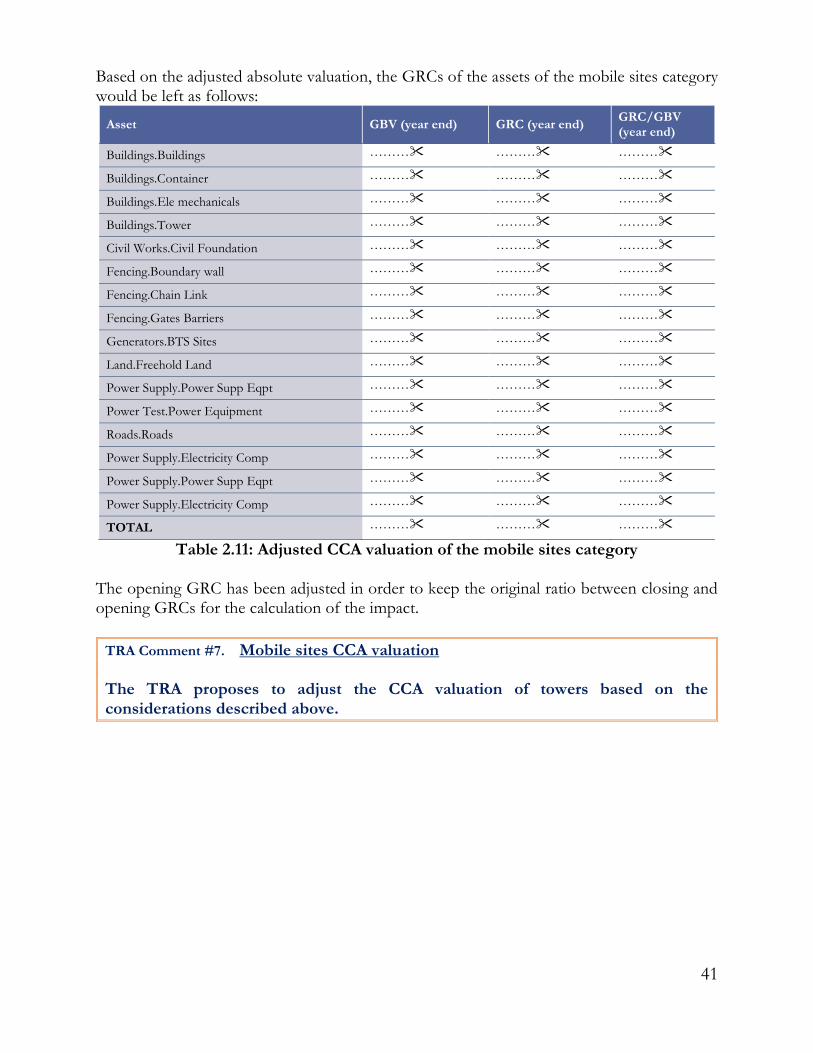
Based on the adjusted absolute valuation, the GRCs of the assets of the mobile sites category would be left as follows:
Asset GBV (year end) GRC (year end) GRC/GBV (year end)
Buildings.Buildings ……… ……… ………
Buildings.Container ……… ……… ………
Buildings.Ele mechanicals ……… ……… ………
Buildings.Tower ……… ……… ………
Civil Works.Civil Foundation ……… ……… ………
Fencing.Boundary wall ……… ……… ………
Fencing.Chain Link ……… ……… ………
Fencing.Gates Barriers ……… ……… ………
Generators.BTS Sites ……… ……… ………
Land.Freehold Land ……… ……… ………
Power Supply.Power Supp Eqpt ……… ……… ………
Power Test.Power Equipment ……… ……… ………
Roads.Roads ……… ……… ………
Power Supply.Electricity Comp ……… ……… ………
Power Supply.Power Supp Eqpt ……… ……… ………
Power Supply.Electricity Comp ……… ……… ………
TOTAL ……… ……… ………
Table 2.11: Adjusted CCA valuation of the mobile sites category The opening GRC has been adjusted in order to keep the original ratio between closing and opening GRCs for the calculation of the impact.
TRA Comment #7. Mobile sites CCA valuation The TRA proposes to adjust the CCA valuation of towers based on the considerations described above.

42
(iv) PC terminals’ index is not appropriate Omantel’s PC terminals asset category aggregates the following accounts of its Fixed Asset Register:
OT C032. PC Terminals.PC Ter OT HQ
OT C033. PC Terminals.PC Terminals These assets are valued to CCA by Omantel using the indexation method. The results of this valuation are presented below:
Asset GBV (year end) GRC (year end) GRC/GBV (year end)
PC Terminals.PC Ter OT HQ ……… ……… ………
PC Terminals.PC Terminals ……… ……… ………
TOTAL ……… ……… ………
Table 2.12: Replacement costs for each asset within the PC terminals category The index used by Omantel for the revaluation of PC terminals is the “Operator Systems” index from AUS, which is not specific to computer hardware and is increasing over time (not common in computer related assets, which have seen their costs fall significantly in the last few years). When asked about the choice of this index, Omantel indicated that they witnessed a sharp decline in GRC as compared to book value by applying the “General Purpose Computers” from AUS, which did not look reasonable, and hence it was decided to use the “Operator Systems” index. However, as already mentioned above, such a sharp decline should be normal and expectable in this kind of assets. Therefore, the substitution of the “General Purpose Computers” would not be justified from that point of view. In order to solve this issue, we decided to use the more appropriate “General Purpose Computers” index from AUS for the CCA valuation of PC terminals. A comparison of the original and adjusted GRCs of these assets is presented below:
Asset Original GRC Adjusted GRC Change in GRC
PC Terminals.PC Ter OT HQ ……… ……… ………
PC Terminals.PC Terminals ……… ……… ………
TOTAL ……… ……… ………
Table 2.13: Comparison of original and adjusted GRCs of PC terminals

43
Based on that, the CCA valuation of these assets would be left as follows:
Asset GBV (year end) GRC (year end) GRC/GBV (year end)
PC Terminals.PC Ter OT HQ ……… ……… ………
PC Terminals.PC Terminals ……… ……… ………
TOTAL ……… ……… ………
Table 2.14: Adjusted CCA valuation of PC terminals The opening GRC has been adjusted in order to keep the original ratio between closing and opening GRCs for the calculation of the impact.
TRA Comment #8. PC terminals CCA valuation The TRA proposes to adjust the index used for the CCA valuation of PC terminals by means of the “General Purpose Computers” index from AUS.
(v) MW links’ valuation is not representative of the actual network Omantel’s microwave (MW) links asset category aggregates the following accounts of its Fixed Asset Register:
OM C082. MW Links.Digital MW Links
OM C083. MW Links.Digital MW Rep
OM C084. MW Links.SDH link
OM C085. MW Links.Supervision HW
OM C086. MW Links.Supervision SW These assets are valued to CCA by Omantel using the Absolute Valuation method by following the steps presented below: 1. Omantel calculates the total GRC of these assets based on the assumption of a SDH
network with E1 links. They consider two type of assets, related to 2G and 3G technologies, for which they provide quantities and unit costs. The result of this calculation is presented below:
Asset Number Unit Cost GRC
Radio Access (3G, 8xE1) ……… ……… ………
Radio Access (2G) ……… ……… ………
TOTAL ………
Table 2.15: GRC calculation for MW links

44
2. This GRC is allocated to each of the previous assets based on their relative GBV, as presented below:
Asset GBV (year end) % GBV GRC (year end) GRC/GBV
MW Links.Digital MW Links ……… ……… ……… ………
MW Links.Digital MW Rep ……… ……… ……… ………
MW Links.SDH link ……… ……… ……… ………
MW Links.Supervision HW ……… ……… ……… ………
MW Links.Supervision SW ……… ……… ……… ………
TOTAL ……… ……… ……… ………
Table 2.16: Identification of the GRC for each asset within the MW links category This process is questionable on two aspects: 1. The assumption of a network using E1 links seems strange, as those links are outdated and
links of a much higher capacity would normally be used today. This hypothesis is not representative of the reality of the market and gives a wrong valuation of the costs that would be incurred by a third operator deploying his network today.
2. The cost of replacing these assets today would be ………% higher than what is actually registered in Omantel’s books. This increase in cost does not seem to be aligned with the market reality, where the price of these assets is expected to decrease over time.
Based on the above, the CCA valuation of MW links is not considered to be reasonable and adjustments should be made in order to ensure the consistency of the TD model. To solve this issue, we have adopted a conservative approach consisting on extracting the cost of E3 MW links from different costing models. The following assumptions have been taken: 1. In a convergent network, there would not be any differences in the links used for 2G and
3G access technologies.
2. An average price for E3 links is estimated from Omantel’s models and public international references as follows:
Source 2015 unit cost (OMR)
Omantel’s TD model (3G, 8xE1) ………
Omantel’s BU model ………
Sweden Bottom-Up model ………
France Bottom-Up model ………
Average ………
Table 2.17: Estimation of average unit cost for E3 links

45
Based on these assumptions, the following absolute valuation is obtained:
Asset Number Unit Cost GRC
Radio Access MW links ……… ……… ………
Table 2.18: Adjusted GRC calculation for MW links This value would represent a ………% reduction from the original GRC estimated by Omantel, while at the same time we note that there would be room for further reductions in the GRC if further technological improvements (e.g. Ethernet technologies) had been taken into account in its calculation. The CCA valuation of MW links resulting from the newly obtained GRC is presented below:
Asset GBV (year end) GRC (year end) GRC/GBV
MW Links.Digital MW Links ……… ……… ………
MW Links.Digital MW Rep ……… ……… ………
MW Links.SDH link ……… ……… ………
MW Links.Supervision HW ……… ……… ………
MW Links.Supervision SW ……… ……… ………
TOTAL ……… ……… ………
Table 2.19: Adjusted CCA valuation of MW links The opening GRC has been adjusted in order to keep the original ratio between closing and opening GRCs for the calculation of the impact.
TRA Comment #9. MW links CCA valuation The TRA proposes to adjust the CCA valuation adopted for the MW links by means of the procedures described above.

46
(v) NodeBs’ unit cost is not aligned with their HCA valuation Omantel’s NodeB asset category aggregates the following accounts of its Fixed Asset Register:
OM C089. Node B.Antenna
OM C090. Node B.Node B Equp
OM C091. Node B.Node B SW These assets are valued to CCA by Omantel using the Absolute Valuation method by following the steps presented below: 1. Omantel calculates the total GRC of these assets based on the cost of two different NodeB
equipments from Huawei and Ericsson which are supposed to include the cost of the Antenna, the HW and the SW related to the NodeB. The result of this calculation is presented below:
Asset Number Unit Cost GRC
Node B – Huawei ……… ……… ………
Node B - Ericsson ……… ……… ………
TOTAL ………
Table 2.20: GRC calculation for NodeBs
2. This GRC is allocated to each of the previous assets based on their relative GBV, as presented below:
Asset GBV (year end) % GBV GRC (year end) GRC/GBV
Node B.Antenna ……… ……… ……… ………
Node B.Node B Equp ……… ……… ……… ………
Node B.Node B SW ……… ……… ……… ………
TOTAL ……… ……… ……… ………
Table 2.21: Identification of the GRC for each asset within the NodeBs category As can be seen in the previous table, Omantel considers that the cost of the NodeBs under CCA would be ………% higher than what is actually registered in Omantel’s books. This increase does not seem logical based on current market trends, which show a clear downtrend in the evolution of the unit costs of this equipment. Omantel itself indicated the unit costs of NodeBs was reduced by 5% between 2014 and 2015. Based on that, the CCA valuation performed by Omantel cannot be considered reasonable and should be adjusted in order to ensure the consistency of the model. At the same time, the unit costs considered by Omantel in 2015 (……… OMR) do not seem to be aligned with those considered in 2013 (……… OMR). This would represent that the unit costs of these network elements would have increased by ………% in just two years. In order to estimate an alternative figure for the unit cost of the NodeBs, the process presented below has been followed:
47
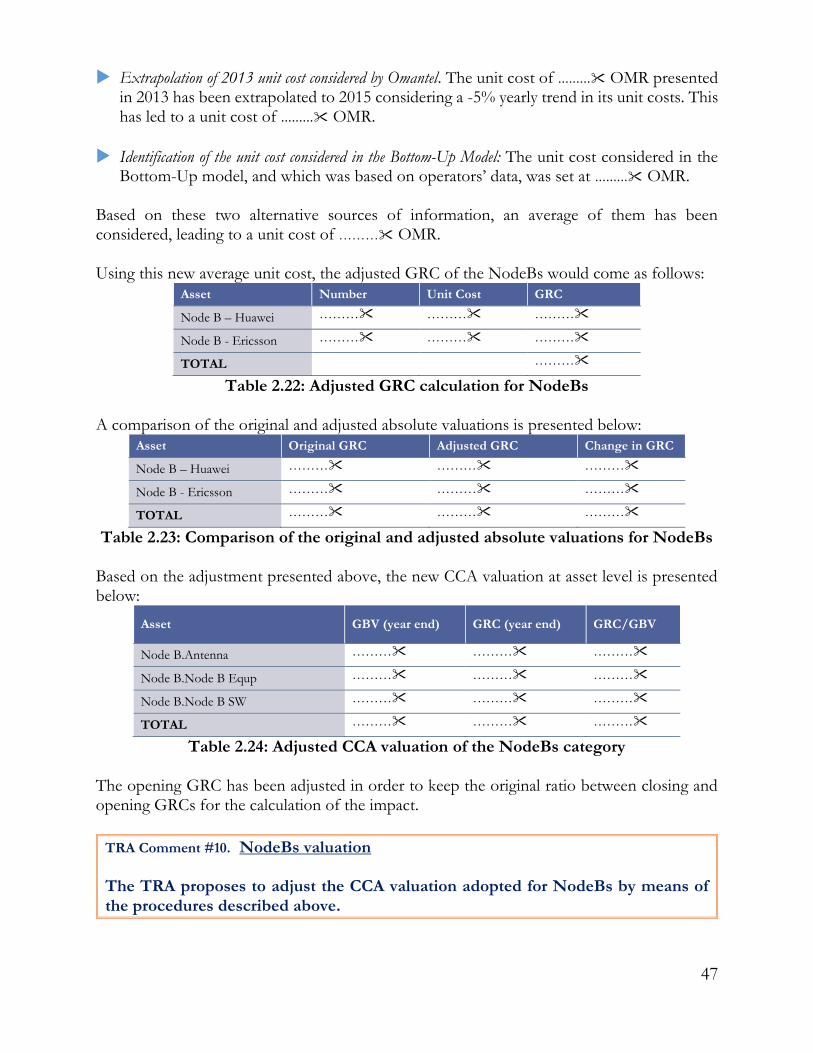
Extrapolation of 2013 unit cost considered by Omantel. The unit cost of ……… OMR presented in 2013 has been extrapolated to 2015 considering a -5% yearly trend in its unit costs. This has led to a unit cost of ……… OMR.
Identification of the unit cost considered in the Bottom-Up Model: The unit cost considered in the Bottom-Up model, and which was based on operators’ data, was set at ……… OMR.
Based on these two alternative sources of information, an average of them has been considered, leading to a unit cost of ……… OMR. Using this new average unit cost, the adjusted GRC of the NodeBs would come as follows:
Asset Number Unit Cost GRC
Node B – Huawei ……… ……… ………
Node B - Ericsson ……… ……… ………
TOTAL ………
Table 2.22: Adjusted GRC calculation for NodeBs A comparison of the original and adjusted absolute valuations is presented below:
Asset Original GRC Adjusted GRC Change in GRC
Node B – Huawei ……… ……… ………
Node B - Ericsson ……… ……… ………
TOTAL ……… ……… ………
Table 2.23: Comparison of the original and adjusted absolute valuations for NodeBs Based on the adjustment presented above, the new CCA valuation at asset level is presented below:
Asset GBV (year end) GRC (year end) GRC/GBV
Node B.Antenna ……… ……… ………
Node B.Node B Equp ……… ……… ………
Node B.Node B SW ……… ……… ………
TOTAL ……… ……… ………
Table 2.24: Adjusted CCA valuation of the NodeBs category The opening GRC has been adjusted in order to keep the original ratio between closing and opening GRCs for the calculation of the impact.
TRA Comment #10. NodeBs valuation The TRA proposes to adjust the CCA valuation adopted for NodeBs by means of the procedures described above.

48
3. Implementation of the TD-LRIC The review of the engine behind the implementation of the TD-LRIC calculations has led to the identification of two main areas of improvement which will be jointly treated throughout this section:
All CVRs seem to be treated by the engine as straight lines. Consequently, they do not lead to any particular LRIC allocation to the different increments, but simply provide a differentiation between fixed/common and incremental costs. Having completed the analysis of the results of Omantel’s TD-LRIC system, we observed that the allocation percentages of each CVR to the increments were the same under the LRIC and FDC standards, even when the CVRs were curved, as shown below:
CVR Increment FDC Allocation LRIC Allocation
001 Access ……… ………
001 Core ……… ………
001 Mobile ……… ………
002 Access ……… ………
002 Core ……… ………
002 Mobile ……… ………
003 Core ……… ………
004 Access ……… ………
004 Core ……… ………
004 Mobile ……… ………
Table 3.1: Extract of FDC and LRIC allocations from CVRs to increments Based on the above, and recognising that a curved CVR should lead to different allocations between LRIC and FDC, it could be concluded that Omantel’s software was treating all CVRs as if they were a straight line.
The common costs are allocated at the latest stage of the system by means of a mark-up over the products’ incremental costs. After the application of the CVRs in its TD-LRIC system, Omantel obtained a pool of common costs that would need to be allocated to services. In doing so, Omantel adopted an EPMU over products’ pure incremental costs. The approach adopted by Omantel meant that for instance, the common costs related to an SMS-C platform would be allocated to all products based on their costs (e.g. they would also be allocated to mobile data services). Instead of that approach, internal best practices seem to favour a CVR by CVR allocation of common costs, ensuring that the common costs of a given CVR are only allocated to the increments and products within it.

49
In order to solve the above issues, the following two measures should be adopted:
The application of CVRs should ensure that existing curves are actually considered.
Common costs should be allocated to products at CVR level
TRA Comment #11. Implementation of the TD-LRIC system The TRA proposes to adjust the way in which the TD-LRIC system has been implemented, by ensuring that common costs are allocated at CVR level and that the shape of the CVR actually has an impact on the increments’ costs.

50
4. Definition of CVRs Based on the results of the review performed on the definition of Omantel’s CVRs, the main areas of improvement identified that should be corrected to ensure the correctness of the costs at service level obtained under the LRIC standard are presented below:
(i)
(i) CVR 001 – MSAN_GPON should consider a reduced minimum equipment
(ii)
(ii) CVR 004 – SDH_DWDM should use lower capacity links at the minimum point
(iii)
(iii) CVR 005 – Microwave Transmission should consider reduced capacity links at the minimum point
(iv)

51
(iv) CVR 007 – IP Equipment should consider a more precise definition of its points
(v)

52
(v) CVR 015 – Mobile Base Station should consider only the number of nodes necessary for coverage at the minimum point
(i) CVR 001 – MSAN_GPON should consider a reduced minimum equipment Omantel’s CVR 001 relating to MSAN and GPON equipment is defined as a straight line, as presented in the exhibit below:
Chart 4.1: Omantel’s CVR 001 – MSAN GPON
The variable cost considered by Omantel includes the cost of extra cards that need to be installed to increase the capacity of the equipment, whereas the chassis is considered to be a fixed cost. Omantel also indicates that there is not more than one chassis at any site. In technical terms, it should be recognised that multiple sites are likely to be deployed for capacity reasons – as inferred from TRA’s model for fixed networks – which could be removed if demand tended to zero. At the same time, it could also be possible to have lower capacity chassis with a cheaper price. This vision seems to coincide with other international references which recognise a minimum network point typically below ………%, as presented in the following exhibit:
Chart 4.2: Comparison of Omantel’s CVR 001 with equivalent CVRs from
international references
0%
20%
40%
60%
80%
100%
0% 20% 40% 60% 80% 100%
Cos
t
Volume
0%
20%
40%
60%
80%
100%
0% 20% 40% 60% 80% 100%
Cost
Volume
Omantel BT Confidential 1

53
While we recognise that the consideration of a purely variable CVR (fixed cost set at 0%) could be a too aggressive approach, the implementation of this curve by BT actually represents the scenario presented above (i.e. a greater dependency of the chassis elements with the overall demand in the network). In order to improve the accuracy of this CVR, the TRA is of the view that the minimum cost level should be obtained as the cost of the minimum equipment required to provide access to a single line anywhere in the country. Given that we do not have the required information to perform these calculations, we believe that the consideration of BT’s CVR would provide a more realistic approach to represent the relationship between volume and costs for this CVR. Based on the above, the adjusted CVR would look as follows:
Chart 4.3: Original and adjusted CVR for MSAN and GPON equipment
TRA Comment #12. Adjusted CVR for MSAN and GPON equipment The TRA proposes to adjust CVR 001, recognising the dependence of the chassis elements with the demand.
(ii) CVR 004 – SDH_DWDM should use lower capacity links at the minimum point Omantel’s CVR 004 is related to SDH and DWDM equipment and is defined as a convex curve, as presented below:
Chart 4.4: Omantel’s CVR 004 – SDH DWDM
0%
20%
40%
60%
80%
100%
0% 20% 40% 60% 80% 100%
Cost
Volume
Original Adjusted
0%
20%
40%
60%
80%
100%
0% 20% 40% 60% 80% 100%
Cost
Volume

54
Omantel obtained this curve considering a progressive decrease of the capacity of the existing equipment (100G, 40G and 10G) as the volume is lowered. The minimum point was defined by Omantel considering that all its transmission links would have a capacity of 10Gbps. Nevertheless, the consideration of 10Gbps links still constitutes a considerably large network in terms of total capacity. In fact, it is likely that Omantel would still be using 1Gbps capacities in some of its links. Therefore, we are of the opinion that the following capacities should be considered in the exercise performed by Omantel:
100G
40G
10G
1G The perception that Omantel could be using a minimum network that is too large in terms of capacity to handle a single unit of traffic is reinforced when its CVR is compared with other international references:
Chart 4.5: Comparison of Omantel’s CVR 004 with similar CVRs from international
references The comparison with international references shows a high fixed cost at the minimum point in Omantel’s CVR. This results from the assumption of 10 Gbps links in the minimum network, while other references consider much lower capacities links (e.g. 34 Mbps links for BT’s SDH network). Using Omantel’s engineering model for CVR 004, and assuming a cost of 1 Gbps links equal to ……… OMR (estimated by means of an extrapolation of the cost of 10G, 40G and 100G links) the minimum point would become ………%. The new curve that would result from this exercise is presented below:
0%
20%
40%
60%
80%
100%
0% 20% 40% 60% 80% 100%
Cost
Volume
Omantel BT - SDH Confidential 1 - DWDM
BT - WDM Confidential 1 - SDH

55
Chart 4.6: Original and adjusted CVRs for SDH and DWDM equipment
TRA Comment #13. Adjusted CVR for SDH and DWDM equipment The TRA proposes to adjust CVR 004, recognising that lower capacity links should be installed in the minimum network to provide the minimum set of services required.
(iii) CVR 005 – Microwave Transmission should consider reduced capacity links at the minimum point Omantel’s CVR 005 relating to microwave transmission is defined as a fixed straight line, as presented below:
0%
20%
40%
60%
80%
100%
0% 20% 40% 60% 80% 100%
Co
st
Volume
Original Adjusted
56
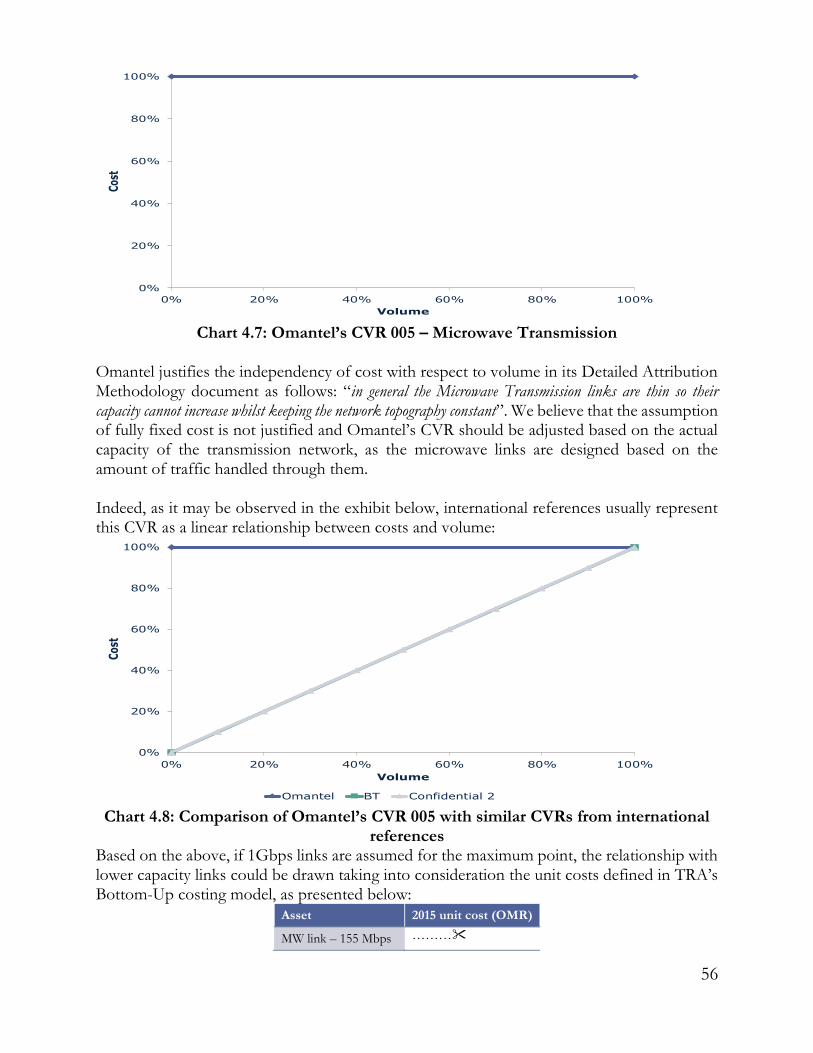
Chart 4.7: Omantel’s CVR 005 – Microwave Transmission
Omantel justifies the independency of cost with respect to volume in its Detailed Attribution Methodology document as follows: “in general the Microwave Transmission links are thin so their capacity cannot increase whilst keeping the network topography constant”. We believe that the assumption of fully fixed cost is not justified and Omantel’s CVR should be adjusted based on the actual capacity of the transmission network, as the microwave links are designed based on the amount of traffic handled through them. Indeed, as it may be observed in the exhibit below, international references usually represent this CVR as a linear relationship between costs and volume:
Chart 4.8: Comparison of Omantel’s CVR 005 with similar CVRs from international
references Based on the above, if 1Gbps links are assumed for the maximum point, the relationship with lower capacity links could be drawn taking into consideration the unit costs defined in TRA’s Bottom-Up costing model, as presented below:
Asset 2015 unit cost (OMR)
MW link – 155 Mbps ………
0%
20%
40%
60%
80%
100%
0% 20% 40% 60% 80% 100%
Cos
t
Volume
0%
20%
40%
60%
80%
100%
0% 20% 40% 60% 80% 100%
Co
st
Volume
Omantel BT Confidential 2

57
MW link – 500 Mbps ………
MW link – 1000 Mbps ………
Table 4.1: Unit costs for MW links of different capacities The adjusted CVR resulting from the interpolation of these estimated costs is presented below together with the original one from Omantel:
Chart 4.9: Original and adjusted CVR for microwave transmission
TRA Comment #14. Adjusted CVR for microwave transmission The TRA proposes to adjust CVR 005, recognising that microwave links would have a reduced capacity in the minimum network.
0%
20%
40%
60%
80%
100%
0% 20% 40% 60% 80% 100%
Co
st
Volume
Original Adjusted

58
(iv) CVR 007 – IP Equipment should consider a more precise definition of its points Omantel’s CVR 007 related to IP equipment is defined as a straight line, as presented below:
Chart 4.10: Omantel’s CVR 007 – IP Equipment
Omantel assumes that the cost of IP equipment increases linearly with volume, based on an increase of the number of cards and ports. The minimum point is extracted as the cost related to the minimum router configuration able to support a single unit of volume. Although Omantel’s approach for the calculation of the minimum point is fine, a more precise representation of the overall CVR could be made by identifying the cost level with ………% of the total volume. Performing the estimation of this point over the engineering model for this CVR presented by Omantel, the relevant costs obtained under that level of demand are presented below:
Asset Cost at 100% volume Cost at 50% volume Cost at 0% volume
Edge Routers ……… ……… ………
Core Routers ……… ……… ………
IG (M320) ……… ……… ………
IG MX960 ……… ……… ………
IG MX480 ……… ……… ………
TOTAL ……… ……… ………
Table 4.2: Estimated cost of IP equipment at different volumes The adjusted CVR obtained from the costs presented above is outlined below:
0%
20%
40%
60%
80%
100%
0% 20% 40% 60% 80% 100%
Cost
Volume

59
Chart 4.11: Original and adjusted CVR for IP equipment
TRA Comment #15. Adjusted CVR for IP equipment The TRA proposes to adjust CVR 007 related to IP equipment, by considering intermediate points in order to better represent the relationship between cost and volume
0%
20%
40%
60%
80%
100%
0% 20% 40% 60% 80% 100%
Co
st
Volume
Original Adjusted

60
(v) CVR 015 – Mobile Base Station should consider only the number of nodes necessary for coverage at the minimum point Omantel’s CVR 015 related to mobile base stations is defined as a straight line, as presented below:
Chart 4.12: CVR015 – Mobile Base Station
The fixed cost at the minimum point considered by Omantel is obtained “by obtaining the costs of a minimum capacity setup for one site considering use of U900 3G technology, and then multiplying this by the total number of sites”, which results in ………% fixed cost. Omantel’s CVR is produced considering only the evolution of NodeBs (and not BTSs or eNodeBs). Given that this CVR is also used to allocate the cost of BTSs and eNodeBs, it could lack sufficient representativeness in those cases. We also believe that the minimum network should only include the NodeB units that are necessary for coverage, which would result in a smaller fixed cost at the minimum point. The chart below presents a comparison of Omantel’s CVR with similar CVRs from other international reference:
Chart 4.13: Comparison of Omantel’s CVR 015 with equivalent CVRs from an
international reference
0%
20%
40%
60%
80%
100%
0% 20% 40% 60% 80% 100%
Cost
Volume
0%
20%
40%
60%
80%
100%
0% 20% 40% 60% 80% 100%
Cost
Volume
Omantel Confidential 2 - BTS
Confidential 2 - NodeB Confidential 2 - eNodeB

61
As it may be observed above, given the shape of the CVRs adopted in the international references, it may be inferred that those cases would also be considering the minimum number of nodes required to keep the same coverage levels reached by the operator, with a minimum configuration. The TRA is of view that the minimum network should only include the nodes required for coverage and not those installed for capacity. The ratio of coverage sites over the total has been extracted from the TRA’s Bottom-Up costing model for mobile networks, leading to the result presented below:
Type Number
NodeBs - coverage ………
NodeBs - total ………
Ratio ………
Table 4.3: Ratio of coverage NodeBs over the total Based on the ratio extracted from the Bottom-Up model, the minimum network point is estimated to be ………% of the total number of nodes. This percentage can be used as a reasonable proxy for the fixed cost at the minimum point of the CVR, even though a further cost reduction could eventually be taken into account due to the likely use of less equipped NodeBs in the minimum network. The adjusted CVR is presented below:
Chart 4.14: Original and adjusted CVR for mobile base stations
TRA Comment #16. Adjusted CVR for mobile base stations The TRA proposes to adjust CVR 015 related to mobile base stations, recognising that a lower number of nodes would be needed in the minimum network.
0%
20%
40%
60%
80%
100%
0% 20% 40% 60% 80% 100%
Co
st
Volume
Original Adjusted