transporter trafficking by nicole k. speed dissertation ... · tuberoinfundibular pathway, the...
TRANSCRIPT
ii
THE ROLE OF INSULIN SIGNALING ON DOPAMINE
TRANSPORTER TRAFFICKING
By
Nicole K. Speed
Dissertation
Submitted to the Faculty of the
Graduate School of Vanderbilt University
in partial fulfillment of the requirements
for the degree of
DOCTOR OF PHILOSOPHY
in
Pharmacology
August, 2010
Nashville, Tennessee
Approved:
Dr. Aurelio Galli
Dr. Randy Blakely
Dr. Kevin Niswender
Dr. Gregg Stanwood
Dr. Brian Wadzinski

iii
To my amazing, supportive parents,
for always keeping me smiling

iv
ACKNOWLEDGMENTS
This work would not have been possible without the funding that helped
support it. This financial support included an individual predoctoral NRSA
fellowship (F31 DA024885) from the National Institute on Drug Abuse, as well as
support awarded to my mentor, Dr. Galli, from the Vanderbilt Diabetes Research
and Traning Center (DK020593), and grants from the National Institute of Health
(DA14684 and DK085712).
I would first like to acknowledge my advisor, Dr. Aurelio Galli. His support
throughout my graduate career has been invaluable. He has encouraged my
development scientifically and beyond. Thank you for pushing me, even when I
pushed back. I hope to embrace science and life with the enthusiasm that he
does. I would also like to thank my thesis committee members Drs. Gregg
Stanwood, Brian Wadzinski, Kevin Niswender, and Randy Blakely for their
helpful guidance and support throughout my graduate career. Special thanks are
extended to my chair, Dr. Randy Blakely, for his help and advice, and to Dr.
Kevin Niswender for his collaborative efforts on my project.
I would also like to acknowledge my collaborators including Dr. Lynette
Daws and Anthony Owens, who provided much time and effort to my project and
always put a smile on my face, and Dr. Scott Russo, who provided the IRS-2
virus and helpful guidance with manuscript preparations. I am also grateful for
the assistance I received from several people at Vanderbilt, including Dr. Fang
Yu, Dr. Nicole Herring and Dr. Heather Gosnell, who helped me with learning

v
techniques. Also I owe a debt of gratitude to Sanaz Saadat, who may be the
most pleasant and helpful person I have ever encountered. I would also like to
thank the Pharmacology Department for their help and support throughout
graduate school.
I am grateful to the members of the Galli lab for their support, scientifically
and otherwise. I would especially like to thank Dr. Heiner Matthies for taking the
time to provide training with laboratory techniques and answer my many
questions, and Nicole Bibus-Christianson for her help, her patience at my
disorganization and, most importantly, her friendship. She truly has a heart of
gold. I would also like to thank Dr. Adeola Davis for her help with feeding rats.
Most of all, I am grateful to my incredibly supportive family and friends.
My parents have always given me faith in my abilities, and their constant
encouragement and love is the reason I push myself to accomplish my goals. I
cannot express how much their support means to me; it is the foundation to all of
my successes. I also would like to thank my sister Alexa, who always lends an
ear, and my crazy family, who always believe in me and are my rock of support.
I want to thank Leda Ramoz and Jessica Moore for their friendship while in
graduate school, which kept me sane, and Laurie and Ben Ott for their friendship
and hospitality. Lastly I would like to thank my fiancé, Brandon Lute. His love
and faith in me are endless, and for that I am extremely grateful.

vi
TABLE OF CONTENTS
Page
DEDICATION ....................................................................................................... ii
ACKNOWLEDGMENTS...................................................................................... iii
LIST OF FIGURES ............................................................................................. vii
LIST OF ABBREVIATIONS ................................................................................ ix
Chapter
I. INTRODUCTION .............................................................................................. 1
The Neurotransmitter Dopamine and Dopaminergic Pathways .......... 1 Dopaminergic Neurotransmission and the Dopamine Transporter .... 4 The Dopamine Transporter Structure and Function ........................... 10 Psychostimulants and the Dopamine Transporter ............................. 17 DAT Regulation by Interacting Proteins .............................................. 20 Regulation of Dopamine Transporter Surface Expression ................ 23 Insulin and the Dopamine Transporter ................................................ 30 Dopamine and Feeding Behavior ......................................................... 33 Insulin Regulation of Feeding Behavior .............................................. 37 Insulin, Diabetes, and DA-Related Diseases ....................................... 40 Specific Aims ......................................................................................... 42
II. ISOFORM SPECIFIC REGULATION OF DAT CELL SURFACE EXPRESSION BY AKT2 .................................................................................... 45
Introduction ............................................................................................ 45 Methods .................................................................................................. 47 Results .................................................................................................... 52 Discussion .............................................................................................. 60
III. DIET-INDUCED CHANGES IN INSULIN SIGNAILNG REGULATES THE TRAFFICKING AND FUNCTION OF THE DOPAMINE TRANSPORTER ........ 63
Introduction ............................................................................................ 63 Methods .................................................................................................. 67 Results .................................................................................................... 73

vii
Discussion .............................................................................................. 93 IV. GENERAL DISCUSSION AND FUTURE DIRECTIONS ........................... 100
Summary .............................................................................................. 100 Obesity and Diabetes .......................................................................... 102 Alternative Interpretations .................................................................. 106 Future Directions ................................................................................. 109
V. REFERENCES ............................................................................................ 117

viii
LIST OF FIGURES
Figure Page
1. Pathways of dopamine signaling in the brain .................................................... 2
2. Biosynthesis of dopamine .................................................................................. 5
3. Diagram of a dopaminergic synapse .................................................................. 7
4. Enzymatic degradation of dopamine. ................................................................. 9
5. Illustration of the dopamine transporter ......................................................... 12
6. Dopamine transporter uptake action ................................................................ 15
7. Schematic of activation of Akt by insulin......................................................... 27
8. Schematic of insulin regulation of the dopamine transporter. ....................... 44
9. Structures of isoform selective, allosteric Akt inhibitors. .............................. 53
10. Inhibition of Akt2 reduces hDAT cell surface expression in hDAT cells ....... 55
11. Inhibition of Akt2 reduces rDAT cell surface expression in rat striatal tissue .................................................................................................................. 57
12. Inhibition of Akt2 reduces DAT-mediates reverse transport of DA. ............... 59
13. High fat feeding results in increased food intake and weight gain ................ 76
14. High fat feeding results in insulin resistance .................................................. 77
15. Tyrosine hydroxylase levels are unchanged by high fat feeding ................... 78
16. Dopamine (DA) levels in striatum are unchanged by high fat feeding ........... 79
17. DIO induces a decrease in p-Akt in striatum and substantia nigra ................ 81
18. DIO induces a decrease in Akt activity in the striatum ................................... 82
19. DIO induces a decrease in p-Akt2 .................................................................... 83
20. Dopamine transporter cell surface expression is reduced in striatal
slices of high fat fed rats. .................................................................................. 85
21. Dopamine clearance rate is reduced in DIO animals....................................... 86

ix
22. AMPH-induced locomotor activity is reduced in DIO animals ........................ 88
23. AMPH levels in striatum after I.P. injection of AMPH remain the same between LF and HF fed rats .............................................................................. 89
24. Viral-mediated expression of HSV-GFP .......................................................... 91
25. Viral-mediated expression of IRS2 in DIO rats restores p-Akt levels ............. 92
26. Viral-mediated expression of IRS2 in DIO rats restores surface expression of
DAT ..................................................................................................................... 94
27. Viral-mediated expression of IRS2 does not alter the surface expression of the Na/K ATPase ................................................................................................ 95
28. Viral-mediated expression of IRS2 restores surface expression of DAT and
AMPH-induced locomotor activity .................................................................... 96

x
LIST OF ABBREVIATIONS
5-HT Serotonin
ADHD Attention-deficit hyperactivity disorder
Akt Serine/threonine protein kinase B
AMPH Amphetamine
ANOVA Analysis of variance
BBB Blood-brain barrier
BMI Body Mass Index
CaMKII Calcium/calmodulin-dependent kinase II
cAMP Cyclic adenosine monophosphate
COMT Catechol-O-methyl transferase
DA Dopamine
DAT Dopamine transporter
DIO Diet induced obesity
DOPA 3,4-dihydroxyphenylalanine
DR Dopamine receptor
ECL Extracellular loop
ERK Extracellular signal-regulated kinase
fMRI Functional magnetic resonance imaging
GABA γ-aminobutyric acid
GFP Green fluorescent protein
GSK3 Glycogen synthase kinase 3
xi
hDAT Human dopamine transporter
HEK Human embryonic kidney
HSCA High speed chronoamperometry
HSV Herpes simplex virus
IGF Insulin-like growth factor
IR Insulin receptor
IRS-2 Insulin receptor substrate 2
LeuT Leucine transporter
MAOB Monoamine oxidase B
MAPK Mitogen-activated protein kinase
MPP+ 1-methyl-4-phenylpyridium
NE Norepinephrine
NET Norepinephrine transporter
PBS Phosphate-buffered saline
PDK Phosphoinositol dependent kinase
PET Positron emission tomography
PI3K Phosphatidylinositol 3-kinase
PICK1 Protein interacting with C kinase
PKA Protein kinase A
PKC Protein kinase C
PMA Phorbol 12-myristate 13-acetate
PP2A Protein Phosphotase 2A
RACK1 Receptor for activated C-kinase

xii
RFP Red fluorescent protein
RTK Receptor tyrosine kinase
SERT Serotonin transporter
STZ Streptozotocin
SYN-1A Syntaxin 1a
TH Tyrosine hydroxylase
TMD Transmembrane domain
VMAT Vesicular monoamine transporter
VTA Ventral tegmental area

1
CHAPTER I
INTRODUCTION
The Neurotransmitter Dopamine and Dopaminergic Pathways
Dopamine (3-hydroxytyramine; DA) is a catecholamine neurotransmitter
that is a precursor to the synthesis of the neurotransmitter norepinephrine (NE).
DA in synthesized from tyrosine by a two step process, where tyrosine
hydroxylase (TH) is the rate-limiting enzyme in the reaction. Being that DA is a
precursor to NE synthesis, it was originally thought that it did not have signaling
properties on its own, but instead was only an intermediate to NE production.
However, in 1958, Carlsson and colleagues demonstrated that DA had signaling
properties on its own. Using 3,4-dihydroxyphenylalanine (DOPA), the precursor
to DA, they showed that in rabbits depleted of catecholamines by reserpine,
DOPA treatment could reverse the reserpine-mediated effects. Importantly, this
reversal corresponded to an increase in DA, not NE (Carlsson, Lindqvist et al.
1958). Later work pointed to enrichments of DA in certain brain regions, namely
the basal ganglia (Bertler and Rosengren 1959). Soon DA brain regions were
mapped, displaying several distinct pathways of DA signaling (Fuxe 1965;
Ungerstedt 1971). There are four main dopaminergic pathways: the
tuberoinfundibular pathway, the nigrostriatal pathway, the mesocortical pathway,
and the mesolimbic pathway (Figure 1). The tuberoinfundibular pathway, which

2
Figure 1. Pathways of Dopamine Signaling in the Brain. Illustration of major DA projections in the central nervous system. The nigrostriatal pathway originates in the substantia nigra and projects to the dorsal striatum. The mesolimbic and mesocortical projections originate in the ventral tegmental area and project both to ventral striatum and areas in the prefrontal cortex, respectively. The final system is the tuberoinfundibular system which projects from the hypothalamus to the pituitary. This image was obtained from cnsforum.com.
3
refers to a group of DA neurons in the arcuate nucleus of the hypothalamus that
project to the median eminence, controls prolactin secretion from the anterior
pituitary gland (Weiner and Ganong 1978). The nigrostriatal pathway consists of
neurons whose cell bodies originate in the substantia nigra and terminate in the
dorsal striatum. This area is implicated in movement since degeneration of these
projections has been shown to cause Parkinson’s Disease; characterized by
tremors, rigidity, and overall improper movement (Barbeau 1962). Recently it
has been demonstrated that this region is also important in feeding behavior
(Volkow, Wang et al. 2002; Sotak, Hnasko et al. 2005; Robinson, Rainwater et al.
2007). Next, dopaminergic neurons in the mesocortical pathway project from the
ventral tegmental area (VTA) to the frontal lobes of the cerebrum, particularly the
prefrontal cortex, and are involved in cognition and emotion. Lastly, neurons of
the mesolimbic pathway also originate in the VTA but instead innervate the
ventral striatum, also known as the nucleus accumbens. This pathway is
implicated in reward and pleasure.
DA is involved in a number of physiological and behavioral processes
including cognition, locomotion, mood, motivation, and reward. Abnormalities in
the central dopaminergic systems contribute to several neuropsychiatric
diseases, including Parkinson’s disease, attention-deficit hyperactivity disorder
(ADHD), schizophrenia, bipolar disorder, binge eating disorder, and addiction
(Wise 1998; Horschitz, Hummerich et al. 2005; Kienast and Heinz 2006; Volkow,
Wang et al. 2007; Davis, Levitan et al. 2008; Koob and Le Moal 2008). In
particular, the nigrostriatal system is thought to give us the motivation to seek

4
basic needs, such as food, while the mesolimbic pathway enables us to feel
pleasure from them (Palmiter 2007). Our eating behavior and our desire for food
is tied in closely with these systems, which receives input from areas of the brain
that monitor our nutritional need for food, such as the hypothalamus (Obici, Feng
et al. 2002; Obici, Zhang et al. 2002; Niswender and Schwartz 2003; Schwartz
and Porte 2005). Therefore, it is not surprising that dysfunction in DA signaling
has been linked to eating disorders and obesity (Wang, Volkow et al. 2001;
Shinohara, Mizushima et al. 2004; Chen, Yang et al. 2008).
As such, DA dysregulation looks to be the basis of several neurological
disorders. In order to develop effective pharmacotherapeutic approaches, it is
critical to understand dopaminergic neurotransmission, the regulatory factors
governing it, and how dysreguation of these factors can contribute to disease.
Dopaminergic Neurotransmission and the Dopamine Transporter
Several factors influence dopaminergic neurotransmission, such as the
amount of DA synthesized and released, the number of DA receptors (DRs) at
the synapse, and the length of time DA spends in the synaptic space. As noted
above, DA is synthesized through a series of enzymatic reactions, beginning with
the hydration of amino acid tyrosine to DOPA via TH. DOPA is decarboxylated by
aromatic amino acid decarboxylase to produce DA (Figure 2). The transmitter is
then packaged into synaptic vesicles by a vesicular monoamine transporter
(VMAT) and released at nerve terminals into the synapse upon stimulation.
Released DA then binds to DRs to elicit a response in the

5
Figure 2. Biosynthesis of dopamine. Synthetic enzymes and their changes to each product are labeled in green and blue, respectively. This image was obtained from www.neurosci.pharm.utoledo.edu.

6
postsynaptic cell. The released DA is then cleared from the synapse primarily by
the dopamine transporter (DAT), where it re-enters the presynaptic neuron to be
recycled and repackaged into vesicles (Figure 3).
An important component in DA signaling is the receptor itself. DRs are a
family of G protein-coupled receptors. There are five subtypes, which are divided
into two groups. D1-like receptors, comprising the D1 and D5 receptors, are
coupled to G proteins which stimulate adenylyl cyclase and cyclic adenosine
monophosphate (cAMP) production, whereas D2-like receptors, comprising the
D2 (D2R), D3 (D3R), and D4 (D4R) receptors, couple to Gi/o proteins and result
in the inhibition of adenylyl cyclase and suppression of cAMP production
(Kebabian and Calne 1979; Stoof and Kebabian 1981). D1-like receptors, by
stimulating cAMP production, are excitatory, whereas activation of D2-like
receptors is inhibitory. There are two isoforms of the D2R, a short form found
presynaptically, and a long form found postsynaptically(Usiello, Baik et al. 2000).
In fact, D2R is the main presynaptic autoreceptor of the dopaminergic system
(Mercuri, Saiardi et al. 1997). D2Rs are expressed throughout DA regions of the
brain. D3Rs, another member of the D2-like receptor family, also inhibit cAMP
production. They are found postsynaptically, and have a higher density in limbic
areas of the brain, such as the nucleus accumbens (Bouthenet, Souil et al.
1991). The diversity of DRs expressed at a given synapse help to define the
response elicited when DA is released. Furthermore, this response is not only
dependent on the receptor

7
Figure 3. Diagram of a dopaminergic synapse. Enlarged view of a typical dopaminergic synapse. The presynaptic terminal is located at the top and the postsynaptic neuron is on the
bottom. DOPA: 3,4-dihydroxyphenylalanine, DOPAC: 3,4-dihydroxyphenylacetic acid, D1R: type 1 dopamine receptor, D2R: type 2 dopamine receptor, MAO: monoamine oxidase. The dopamine transporter is shown on the presynaptic terminal in purple. The D2R subtype represents the main presynaptic autoreceptor of the dopaminergic system. The source for the image is http://www.nibb.ac.jp/annual_report/2004/img/240-01.jpg
8
type(s) at the synapse, but also the number of receptors present, lending another
element to regulation of DA neurotransmission (Figure 3).
Termination of DA neurotransmission is another important component for
maintaining proper dopaminergic tone. DA is degraded enzymatically by
monoamine oxidase B (MAOB) and catechol-o-methyl transferase (COMT)
(Figure 4), but enzymatic degradation does not account for inactivation of DA in
the synapse. Instead, termination of DA neurotransmission is regulated by DAT.
DAT allows DA to be cleared out of the synapse and taken up into the
presynaptic bouton (Giros and Caron 1993). The importance of this transport
system was demonstrated by the creation of DAT knockout mice, where DA
clearance is significantly slower than in wild type mice. DA remained in the
synapse at least 100 times longer than the control animals (Giros, Jaber et al.
1996; Gainetdinov, Jones et al. 1999), leading these animals to be hyperactive.
In addition to its main role, DAT also provides a supply of DA for repackaging into
vesicles for future release. This DAT-mediated recycling is the main source of
DA for vesicular release in the neuron, thus decreasing the amount of synthesis
needed to replenish vesicular stores of DA (Giros, Jaber et al. 1996). Indeed,
when stimulated, the DA neurons of DAT knockout mice release significantly less
DA than control animals (Giros, Jaber et al. 1996; Gainetdinov, Jones et al.
1999). It is thought that in DAT knockouts, there is a lack of DA available for
packaging into vesicles, and consequently a reduction in the amount of DA
available for vesicular release.
Furthermore, D2R expression and activity are reduced in mice lacking the

9
Figure 4. Enzymatic degradation of dopamine. Metabolic enzymes, COMT and MAO, that degrade unpackaged DA in synaptic areas.

10
DAT (Jones, Gainetdinov et al. 1999). These changes demonstrate that while
DAT plays an important role in directly regulating DA signaling, it also influences
several components of the dopaminergic synapse. Therefore changes in the
activity and functioning of DAT can markedly disrupt DA neurotransmission.
Due to the important role of DAT in DA homeostasis, loss of proper
function and regulation of the transporter has been implicated in several DA-
related diseases. Decreased striatal DAT binding has been reported in first-
episode schizophrenic patients (Mateos, Lomena et al. 2005), clinical depression
(Laasonen-Balk, Kuikka et al. 1999), and obese individuals (Chen et al. 2008).
Differences in the genomic variable number tandem repeat have been identified
as risk factors for bipolar disorder (Greenwood, Alexander et al. 2001).
Furthermore, genetic polymorphisms in the DAT coding region have been also
associated with ADHD (Mazei-Robison, Couch et al. 2005; Yang, Chan et al.
2007; Binda, Dipace et al. 2008), as well as eating disorders (Shen, Hagino et al.
2004). DAT is also well-known for its role in addiction, including substance
abuse of psychostimulants such as amphetamine (AMPH) (Giros, Jaber et al.
1996), which act on the transporter to elicit their behavioral effects. Due to its
role in several neurological disorders and addiction, many researchers have
focused on DAT structure, function, and regulation.
The Dopamine Transporter Structure and Function
The presence of a transport mechanism for biogenic amines was initially
reported in the 1960s by Julius Axelrod. In 1961, Hertting and Axelrod showed

11
that that NE could be accumulated in nerve endings, and released upon
stimulation (Axelrod, Whitby et al. 1961). Further characterization of
catecholamine uptake regions in the brain revealed that both NE and DA could
be accumulated by distinct regions of the brain, and that this accumulation could
be inhibited by co-application of either tricyclic antidepressants or drugs of
abuse, including cocaine and amphetamine (AMPH) (Glowinski and Axelrod
1964; Ross and Renyi 1967).
DAT is a member of the Na+/Cl--dependent neurotransmitter transporter
family (SLC6) that contains high affinity transporters for NE, serotonin (5-HT), γ-
aminobutyric acid (GABA), glutamate, and glycine (Kilty and Amara 1992; Torres,
Gainetdinov et al. 2003). In 1991, DAT was cloned (Giros, el Mestikawy et al.
1991; Kilty, Lorang et al. 1991; Shimada, Kitayama et al. 1991; Usdin, Mezey et
al. 1991), and analysis of the human DAT (hDAT) primary sequences revealed
that the DAT cDNA encodes a protein of 620 amino acids. Hydropathy analysis
predicts the presence of twelve transmembrane domains (TMDs) with
intracellular amino and carboxyl termini (Figure 5). DAT is closely related to
other catecholamine transporters, namely the NE transporter (NET), with which it
shares 66% sequence identity (Blakely, Defelice et al. 2005). The structure of
DAT also supports the notion that it is regulated by several signaling molecules.
The termini of the transporter contain several serine, threonine, and tyrosine
residues, allowing for regulation via phosphorylation. In fact, some of these
residues are found in the consensus sequences for kinases

12
Figure 5. Illustration of the dopamine transporter. The human dopamine transporter is an integral membrane protein that contains twelve transmembrane domains (TMDs) with intracellular N- and C-termini, a large extracellular loop between TMDs 3 and 4 with three N-linked glycosylation sites, and multiple phosphorylation sites located on intracellular termini and loops. Putative glycosylation sites are indicated with Y-shaped symbols on extracellular sequences. Possible phosphorylation sites are indicated with boxes for various protein kinases: gray boxes, protein kinase A; orange boxes, protein kinase C; white boxes, calcium-calmodulin protein
kinase. This image was obtained from (Siegal 1999).

13
such as protein kinase C (PKC), protein kinase A (PKA), and calcium/calmodulin-
dependent kinase II (CaMKII) (Giros and Caron 1993). Additionally, there are
three glycosylation sites in the large second extracellular loop (ECL) between
TMDs 3 and 4.
Chimeric studies conducted on DAT and NET in heterologous expression
systems initially defined DAT function as it related to structure. These studies led
to the hypothesis that TMDs 1-3 and 9-12 were important for the affinity of
substrates and sodium/chloride dependence, where TMDs 4-8 were involved in
transporting the substrate and inhibitor binding (Buck and Amara 1994; Giros,
Wang et al. 1994; Syringas, Janin et al. 2000). Mutagenesis studies have also
helped to reveal the structure/function relationship of DAT. For example,
mutation of glycosylation sites on ECL 2 results in a transporter that is expressed
at the plasma membrane, but has a reduction in DA uptake, as well as an
increase in sensitivity to inhibitors (Li, Chen et al. 2004). This predicts that
glycosylation on ECL2 is important to the transport process.
A high resolution crystal structure of the leucine transporter (LeuT), a
prokaryotic sodium-dependent transporter with approximately 25% homology to
DAT and related neurotransmitter transporters, is reported (Yamashita, Singh et
al. 2005). The LeuT is a fellow member of the SLC6 gene family and contains all
12 TMDs. Therefore, its structure has served as a point of reference for the
structure/function relationship of DAT, allowing for the initial hypotheses of DAT
topology to be confirmed (Yamashita, Singh et al. 2005). In fact, a recent study
used LeuT as a reference for determination of the binding sites of cocaine and

14
DA in DAT. Beuming and collegues developed models of DAT based on the
LeuT structure to predict a binding site for cocaine and dopamine between TMD
1, TMD 3, TMD 6, and TMD 8 (Beuming, Kniazeff et al. 2008) They then
confirmed these predictions experimentally using site directed mutagenesis and
chemical cross-linking methods (Beuming, Kniazeff et al. 2008). This study,
which was possible only with the hi-resolution LeuT structure, demonstrates that
cocaine utilizes the same binding site as DA. This work, which was aided with the
LeuT structure, is important in helping develop therapies for cocaine abuse and
addiction.
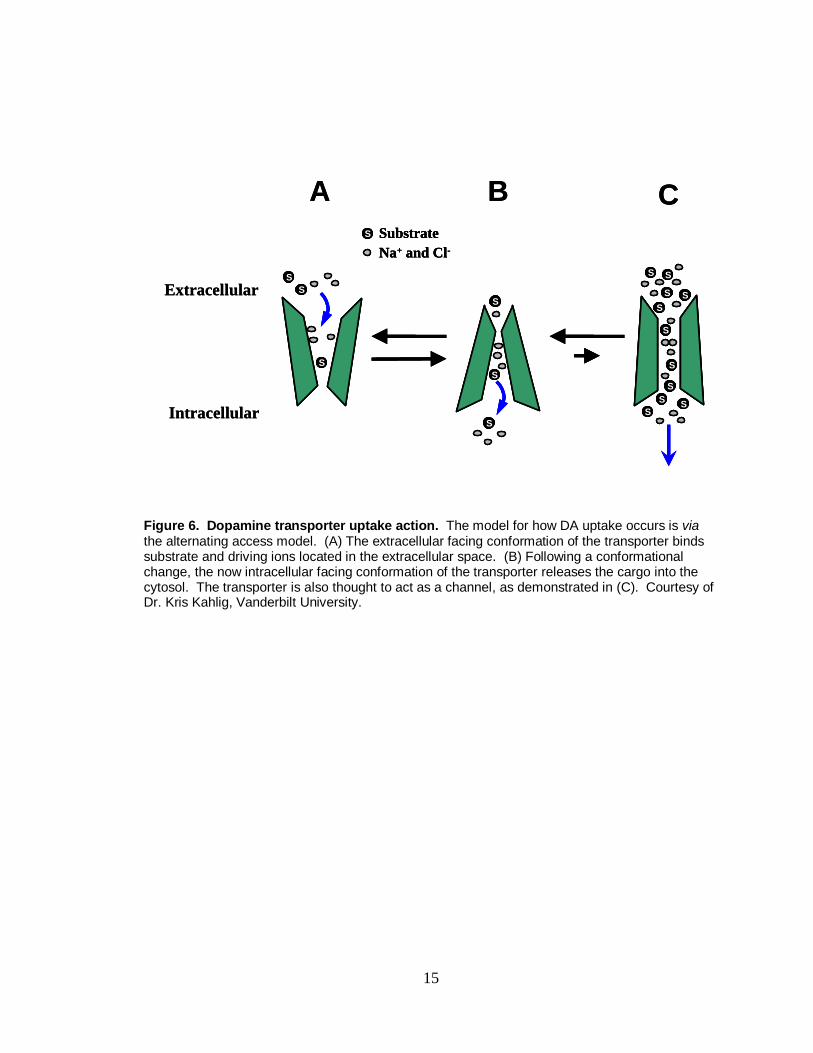
These structural studies have helped to further establish to a model of
transporter action that was first proposed in 1966, known as the alternating
access model (Jardetzky 1966), where external and internal gates alternately
allow access to the transporter channel (Figure 6). First the gate to the
extracellular space opens, allowing in the substrate and cotransported ions. This
gate then closes, allowing the gate facing the intracellular space to open and
release its cargo, thus ―alternating‖ the access of the transporter channel
between the outside and inside of the cell. This event is powered by the
electrochemical gradient generated by the plasma membrane Na+/K+-ATPase
(Torres, Gainetdinov et al. 2003). DA uptake by DAT, therefore, is reliant on both
sodium and chloride, where two sodium ions and one chloride ion are co-
transported with each DA molecule. It is important to note that stoichiometry
15
Figure 6. Dopamine transporter uptake action. The model for how DA uptake occurs is via the alternating access model. (A) The extracellular facing conformation of the transporter binds substrate and driving ions located in the extracellular space. (B) Following a conformational change, the now intracellular facing conformation of the transporter releases the cargo into the cytosol. The transporter is also thought to act as a channel, as demonstrated in (C). Courtesy of Dr. Kris Kahlig, Vanderbilt University.
Extracellular
Intracellular
S
S
S
S S
SS
S
S
S
S
SS
S
S
S
S
S Substrate
Na+ and Cl-
A B C
Extracellular
Intracellular
S
S
S
SS
SS
SS
S S
SS
S
S
S
S
SS
S
S S
SS
S
S
S
S
SS
S
SS SS
SSSS
SS
SS
SS
SS
SSSS
SS
S
S
S
SS
SS
SS
S Substrate
Na+ and Cl-
SS Substrate
Na+ and Cl-
A B C

16
predicts that this transport process should be electrogenic, with a net
translocation of two positive charges per transport cycle. Due to the flux in
electrical charge, this phenomenon can be measured by electrophysiology in a
single cell expressing DAT, providing a useful tool in studying the transporter
(Sonders, Zhu et al. 1997; Sitte, Huck et al. 1998; Khoshbouei, Wang et al. 2003;
Pifl, Rebernik et al. 2004). Interestingly, these studies have found that the inward
current is larger than the current predicted by the charge-to-flux ratio of the proposed
stoichiometry (Lester, Cao et al. 1996; Sonders and Amara 1996). This suggests an
uncoupled conductance. Therefore, the alternating access model cannot fully
account for transporter actions.
Interestingly, some recordings taken of DAT currents have exhibited a large
flux of DA crossing the membrane for a very brief amount of time, providing support
for an alternative mode of action (Galli, Blakely et al. 1996; Galli, Blakely et al.
1998; Kahlig, Binda et al. 2005). This has led to one hypothesis to account for the
uncoupled conductance of DAT; that it can act, albeit very briefly, as a channel.
This channel-like mode is similar to the open conformation of a ligand-gated ion
channel, consisting of large fluxes of substrate molecules and ions crossing the
membrane (Figure 6). Due to the large number of molecules that move across
the membrane very quickly, this state is of interest, even if it only occurs
infrequently. Other functions have also been discovered by studying the effect
of psychostimulants on the transporter. AMPH, for example, is shown to promote
a channel-like state of DAT that contributes to DA efflux (Kahlig, Binda et al.
17
2005). The ability of DAT to function in several modes demonstrates the
dynamic nature of this protein.
Psychostimulants and the Dopamine Transporter
DA has a well established role in pleasure and reward. It is not surprising
then that this system is the target of several psychostimulant drugs, many of
which elicit their effects through DAT. These drugs are mainly viewed as abuse
liabilities, they produce rewarding effects, alter DA tone, and lead to drug
addiction. DAT is a target for these drugs, which include cocaine,
methamphetamine, and AMPH (Kuhar, Ritz et al. 1991; Zaczek, Culp et al. 1991;
Giros and Caron 1993). They act to disrupt DAT’s ability to properly function,
causing increases in extracellular DA that stimulate postsynaptic receptors,
thereby enhancing neurotransmission. These drugs can broadly be
characterized through their mode of action. For example, one mechanism is to
block DAT directly. This is the mode used by the drug cocaine. By directly
blocking uptake of DA, cocaine allows for an increase in synaptic levels of DA and
enhanced DA neurotransmission (Ross and Renyi 1967; Giros, el Mestikawy et al.
1991). Several lines of evidence have also demonstrated that cocaine alters the
surface expression of DAT. Repeated cocaine administration was shown to
increase DA uptake in rats (Ng, Hubert et al. 1991; Parsons, Schad et al. 1993), and
acute exposure to 10 µM cocaine for 30 minutes increased DAT transport activity
and DAT cell surface expression (Daws, Callaghan et al. 2002). Studies have also
examined the impact of chronic cocaine treatment on DAT by looking at postmortem

18
tissue from cocaine addicts. Striatal synaptosomes obtained from such tissue
display a significant increase in both the Bmax of binding for the cocaine analog, WIN
35428, as well as the Vmax for DA uptake (Mash, Pablo et al. 2002). Furthermore,
reports have shown increased binding of WIN 35428 to DAT in postmortem brains
of addicts (Little, Kirkman et al. 1993; Staley, Hearn et al. 1994; Little, Zhang et al.
1999). These studies indicate a functional upregulation of DAT following chronic
cocaine abuse.
Another important method of action by psychostimulant drugs is to cause
effux of DA via DAT into the synapse. These drugs act as a substrate of DAT,
competing with DA for uptake. AMPH is perhaps the most well-known drug to
utilize this mechanism. Once inside the cell, AMPH acts to reverse the
conformation of the transporter, causing efflux of DA into the synapse (Fischer
and Cho 1979; Pierce and Kalivas 1997). This allows for the drug’s effects by
acting as an indirect agonist of DRs, thus stimulating the postsynaptic cell and
increasing DA neurotransmission.
Increases in DA signaling by either blocking DAT or by DAT-mediated DA
efflux in limbic areas is thought to mediate the rewarding properties of
psychostimulant drugs (Koob and Bloom 1988). Furthermore, AMPH-evoked DA
efflux reveals another functional aspect of DAT beyond uptake of DA.
Modifications to DAT function can be examined by changes to AMPH-induced
DA efflux. For example, in order for AMPH to elicit its effects, DAT must be on
the cell surface. Therefore alterations in the surface level of DAT will also
change the amount of AMPH-induced DA efflux, which allows for another method

19
to examine alterations in DAT function. As such, beyond its effects as a
psychostimulant drug, AMPH can be a useful tool to examine changes to DAT
function.
AMPH effects include several behavioral changes, such as restlessness,
reduced appetite, and hyperlocomotion. These drug actions are believed to
occur due to AMPH-induced increase in extracellular DA. Consistent with this
notion, DAT knockout mice do not show an increase in locomotion when
administered AMPH (Giros, Jaber et al. 1996). These findings demonstrate that
DAT plays a crucial role in the hyperlocomotor effects of AMPH, and indicate that
alterations in DAT function or expression can affect the ability of AMPH to elicit
its behavioral effects.
In addition to causing efflux and inducing behavioral changes such as
hyperlocomotion, AMPH alters the surface expression of DAT, a phenomenon
that has been shown by several groups (Fleckenstein, Haughey et al. 1999;
Saunders, Ferrer et al. 2000; Carvelli, Moron et al. 2002; Gulley, Doolen et al. 2002;
Kahlig, Javitch et al. 2004; Garcia, Wei et al. 2005; Johnson, Furman et al. 2005;
Boudanova, Navaroli et al. 2008). Application of AMPH to DAT transfected cells for
one hour reduced the rate of DA uptake and also decreased the surface expression
of DAT as measured by biotinylation (Saunders, Ferrer et al. 2000). Similar results
were obtained for the endogenous substrate, DA, as well (Saunders, Ferrer et al.
2000). Furthermore, measurements of a single transporter current after AMPH
application demonstrated that the current itself was unaltered, confirming that
changes to DA uptake were due to a redistribution of DAT away from the plasma

20
membrane (Kahlig, Javitch et al. 2004). Recently, live cell imaging was used to
examine changes to DAT surface expression after rapid treatment (up to one
minute) of AMPH in neuroblastoma N2A cells expressing DAT. These studies
indicated that intially, AMPH acts to increase the expression of DAT on the cell
surface, as does the endogenous substrate DA (Furman, Chen et al. 2009).
Prolonged exposure, however, led to a decrease of DAT cell surface expression.
Importantly, these results demonstrate that endogenous, as well as exogenous,
substrates of DAT regulate its expression on the plasma membrane in a biphasic
manner.
Due to the changes that occur to DA systems with chronic use, these
drugs are often thought of in a negative manner and as an abuse liability.
However, at times they have proved useful. AMPH is used frequently to treat
ADHD, under the tradename Adderall. Also, the unique properties and functions
they convey on DAT and DA transmission provide useful tools for studying the
transporter. Still, most exogenous compounds that act on the transporter are, in
fact, addictive and can have many negative consequences with frequent use.
DAT Regulation by Interacting Proteins
Being that DAT has an important role in DA neurotransmission, it is not
surprising that it is tightly regulated. Several proteins that regulate DAT also
physically interact with it, forming protein complexes, and much work continues
to further define these. To date, some identified DAT interacting proteins are, but
not limited to, protein interacting with C kinase (PICK1) (Torres, Yao et al. 2001),

21
Hic5 (Carneiro, Ingram et al. 2002), the catalytic subunit of protein phosphatase 2A
(PP2A) (Bauman, Apparsundaram et al. 2000), the PKC isoforms β1 and β2
(Johnson, Guptaroy et al. 2005), the receptor for activated C-kinases (RACK1)
(Lee, Kim et al. 2004), SYN-1a (Lee, Kim et al. 2004; Binda, Dipace et al. 2008),
CaMKII (Fog, Khoshbouei et al. 2006; Wei, Williams et al. 2006), and D2R (Lee, Pei
et al. 2007; Binda, Dipace et al. 2008).
PICK1 was found to interact with DAT via the PDZ recognition motif found on
the C-terminal tail on the transporter. PKC, a well known modulator of DAT surface
expression, also interacts with PICK1, leading to the possibility that PICK1 serves at
an adaptor protein for these two molecules (Torres, Yao et al. 2001). Interestingly,
RACK1 have been shown to interact with the DAT’s N-terminus by a yeast-two
hybrid assay (Lee, Kim et al. 2004). RACK1 also interacts with PKC, as well as
several other kinases, and therefore may serve to facilitate kinase regulation of DAT
by PKC and other kinases on the N-terminus (Ron and Mochly-Rosen 1994;
Rodriguez, Ron et al. 1999). Therefore, both of these interacting proteins, PICK1
and RACK1, may help to facilitate PKC modulation of DAT at two distinct regions on
the transporter. This indicates that PKC may modulate DAT in several ways,
depending on the area of DAT available for binding and the interacting protein
available to it.
SYN-1a is another protein identified to interact with DAT (Lee, Kim et al.
2004). This is of interest due to work on SYN-1a and DAT family members,
including the GABA transporter, GAT1, and NET. SYN-1a interacts with the N-
terminus of GAT1 and modulates the translocation of the transporter (Wang, Deken

22
et al. 2003), and is also shown to interact with NET (Sung, Apparsundaram et al.
2003), suggesting that it might serve a similar function in regulation of DAT. Recent
studies have shown an increase in association between SYN-1a and DAT with
AMPH treatment (Binda, Dipace et al. 2008), allowing for a possible role for SYN-1a
in AMPH-mediated DAT trafficking.
In addition to the proteins mentioned above, recent work has also identified
D2R to associate with DAT. Disruption of this interaction has been shown to
decrease DA uptake (Lee, Pei et al. 2007). The short isoform of D2R functions as
an inhibitory autoreceptor on the presynaptic cell, with a localization similar to DAT
(Centonze, Usiello et al. 2002). Previous work has demonstrated that D2R
stimulation may be regulating DAT through downstream activation of second
messenger signaling cascades (Mayfield and Zahniser 2001). For example, Bolan
and colleagues demonstrated that D2R stimulation causes enhanced substrate
clearance through an increase in DAT cell surface expression, which was
dependent upon extracellular signal-regulated kinases 1 and 2 (ERK 1/2), but
independent of phosphatidylinositol 3-kinase (PI3K) (Bolan, Kivell et al. 2007).
Lee and colleagues reported the first evidence of a direct association between
DAT and D2R, and that disruption of this interaction affects DAT function (Lee,
Pei et al. 2007). These studies suggest that there is a definite interplay, direct
and indirect, between presynaptic D2Rs and DAT to help maintain DA
homeostasis.
It is also quite interesting to note that DAT is thought to interact with itself.
Cross linking and mutagenesis studies, as well as studies using fluorescence

23
resonance energy transfer (FRET) imaging, demonstrated that DAT forms an
oligomer (Hastrup, Karlin et al. 2001; Hastrup, Sen et al. 2003; Sorkina, Doolen et
al. 2003; Torres, Carneiro et al. 2003). Recently, the substrates DA and AMPH
have been shown to reduce DAT oligomerization (Chen and Reith 2008), lending
yet another opportunity for regulation of DAT function. Further work is needed to
examine how second messager systems may also play a role in altering DA
uptake by changing the ability of DAT to form oligomers.
Regulation of Dopamine Transporter Surface Expression
DA uptake capacity depends on the turnover rate of an individual
transporter as well as on the number of functional transporters expressed at the
plasma membrane. DAT function is dependent upon expression on the plasma
membrane, and as such the surface expression of the transporter is a tightly
regulated mechanism for controlling DA neurotransmission. Several signaling
molecules have been identified as regulators of DAT cell surface expression,
including PKC, PKA, ERK1/2, and members of the insulin signaling family (i.e.
phosphoinositol 3 kinase (PI3K) and protein kinase B (PKB, or Akt)) (Batchelor and
Schenk 1998; Carvelli, Moron et al. 2002; Page, Barc-Pain et al. 2004; Garcia,
Wei et al. 2005; Bolan, Kivell et al. 2007).
Possibly the most well characterized of these pathways is PKC modulation of
DAT. PKC activation by phorbol esters has been shown to cause trafficking of the
transporter away from the plasma membrane, resulting in reduced DA uptake (Huff
et al. 1997; Vaughan et al. 1997; Zhang et al. 1997; Zhu et al. 1997; Pristupa et

24
al. 1998; Daniels and Amara 1999; Melikian and Buckley 1999; Granas et al.
2003; Loder and Melikian 2003; Kahlig et al. 2004; Foster et al. 2008). This
PKC-induced trafficking of DAT from the plasma membrane to intracellular
compartments is a clathrin-mediated and dynamin-dependent endocytic
mechanism (Daniels and Amara 1999; Sorkina, Hoover et al. 2005; Foster,
Adkins et al. 2008). Beyond this work, PKC has been also shown to modulate the
functionality of DAT by shifting it to a state that is more likely to result in DA efflux
(Kantor and Gnegy 1998; Kantor, Hewlett et al. 2001; Johnson, Guptaroy et al.
2005). This work displays another aspect of the role of PKC in altering DAT
function by supporting the reversal of DA transport.
Although it was originally believed that phosphorylation of DAT by PKC
was required for internalization (Huff, Vaughan et al. 1997; Vaughan, Huff et al.
1997; Cowell, Kantor et al. 2000; Chang, Lee et al. 2001; Foster, Pananusorn et
al. 2002; Granas, Ferrer et al. 2003; Foster, Adkins et al. 2008), recent lines of
evidence have shown that this is not the case. Truncation of the PKC consensus
sequence in the DAT N-terminus abolishes PKC-induced phosphorylation of DAT,
yet this form of the transporter is still able to traffic in response to phorbol ester
treatment (Granas, Ferrer et al. 2003). These data suggest that PKC regulation of
DAT may involve separate phosphorylation and trafficking components. In fact,
recent work by Foster and collegues demonstrated that, with PKC activation, the
loss of surface DAT occurred only in concanavalin A-sensitive, non-raft
membranes (Foster, Adkins et al. 2008). However, treatment with methyl-β-
cyclodextrin, which destabilizes lipid rafts by depleting cholesterol, inhibited PKC-
25
induced downregulation of DAT activity but still allowed for internalization of DAT
(Foster, Adkins et al. 2008). In addition, DAT phosphorylation was found to be at
a significantly greater level in cholesterol-rich lipid raft microdomains. These
findings suggest that regulation by PKC in the non-raft DAT population occurs
through trafficking-dependent processes. Conversely, in lipid rafts DAT
regulation by PKC is achieved through trafficking-independent processes (Foster,
Adkins et al. 2008). Importantly, this study suggests that the localization of DAT
is important in determining how it is regulated. Further work is needed to look at
the importance of DAT localization and how regulation of these distinct
populations affects the transporter.
Notably, recent work has revealed another interesting aspect of regulation
of DAT trafficking. Furman and collegues explored the changes to DAT cell
surface expression over time after exposure to a substrate, either DA or AMPH,
using live cell confocal imaging and biotinylation assays in neuroblastoma N2A
cells transfected with DAT. These investigations defined a biphasic regulation of
DAT cell surface expression in response to substrate binding. Initially, within
seconds, there is a rapid increase of DAT on the cell surface, beginning at 10
seconds and going to 2 minutes. This is followed by a decrease of cell surface
DAT upon continued exposure to the substrate (Furman, Chen et al. 2009).
Importantly, further work by this group also showed that inhibition of PKCβ
blocked the initial rapid increase of cell surface DAT after exposure to DA or
AMPH (Chen, Furman et al. 2009; Furman, Chen et al. 2009). Furthermore,
PKCβ knockout mice were found to have a reduction in cell surface DAT

26
expression compared to wild type mice, while there was no change to the total
levels of DAT protein between the two genotypes (Chen, Furman et al. 2009). In
addition, the rapid increase in DAT cell surface expression upon substrate
treatment seen in wild type mice was not observed in PKCβ knockout mice
(Chen, Furman et al. 2009). Overall, these studies indicate that there are two
phases of DAT trafficking in response to substrate binding, and that the initial
rapid phase is dependent upon PKCβ. This work further displays the complexity
to the regulation of DAT function via transporter trafficking.
PI3K signaling in regulating DAT Surface Expression. Much work has
shown that DAT activity is modulated by multiple signal transduction pathways,
and often this regulation involves modifying DAT trafficking and expression at the
plasma membrane. The PI3K signaling pathway has been extensively studied
for its role in modulating the surface expression of DAT. PI3K phosphorylates the
D-3 position of phosphoinositol-2 phosphate (PI(4,5)P2)to yield phosphoinositol-3
phosphate (PI(3,4,5)P3). The generation of PI(3,4,5)P3 at the plasma membrane
upon the activation of PI3K allows for translocation of Akt (Taha and Klip 1999;
Bondy and Cheng 2004). This localization of Akt to the plasma membrane is critical
for its activation (Figure 7). Once bound to PI(3,4,5)P3, Akt is phosphoylated by
phosphoinositide dependent kinase 1 (PDK1), and may go on to signal to several
downstream effectors (Yang, Tschopp et al. 2004).
In 2002, work by Carvelli and collegues showed that in hDAT expressing
heterologous cells, inhibition of PI3K by LY294002 led to a decrease in surface

27
expression of hDAT. The investigators also reported a decrease in DA uptake
with LY294002 treatment, not only in cells but also in rat striatal
Figure 7. Activation of Akt by Insulin. Upon activation of the insulin receptor (IR), insulin receptor substrate (IRS) acivates phosphoinositol-3-kinase (PI3K). PI3K goes on to phosphorylate phosphoinositol-2 phosphate (PIP2), converting it to phosphoinositol-3 phosphate (PIP3) and allowing translocation of Akt to the plasma membrane, leading to its subsequent activation. Akt is now an active kinase and can phosphorylate downstream targets. This figure was obtained from http://www.hsph.harvard.edu/faculty/brendan-manning/images/Insulin_Signaling.jpg

28
synaptosomes. These effects are dynamin dependent as DA uptake and DAT
cell surface expression after LY294002 treatment was inhibited by expression of
a dominant negative mutant of dynamin I.
PI3K is activated by receptor tyrosine kinase stimulation. Importantly,
RTK inhibitors have been shown to downregulate DAT activity and plasma
membrane expression (Zahniser and Doolen 2001), thus fitting the model that
PI3K activation through RTKs causes an increase in surface expression of DAT.
Carvelli and coworkers also demonstrated that incubation with a RTK activator,
insulin, showed increases in DAT transport capacity and surface levels (Carvelli,
Moron et al. 2002).
As mentioned earlier, further downstream effects of PI3K signaling include
the activation of Akt (Taha and Klip 1999). Akt is an important component in insulin
and growth factor signaling pathways, and is thought to regulate several cellular
functions including cell growth, glucose uptake and metabolism, as well as
apoptosis (Hanada, Feng et al. 2004). Three isoforms of Akt have been identified
(Hanada, Feng et al. 2004), all of which contain a pleckstrin homology domain that
interacts with PI(3,4,5)P3. This interaction allows for phosphorylation of Akt at
residues threonine-308 and serine-473, that are required for full Akt activation
(Hanada, Feng et al. 2004). Akt1 and Akt2 are ubiquitously expressed throughout
the body, but Akt3 is only found to be expressed in the brain and testes. Insights

29
into the specificity of these isoforms in Akt-related functions such as glucose
homeostasis and cell growth, have been provided by genetic studies where each
isoform, or combinations of them, have been genetically deleted. Akt1 null mice
knocked out show impaired growth, but similar glucose metabolism and
maintenance of insulin levels as their wild type counterparts (Cho, Thorvaldsen et al.
2001). The opposite is true, however, for Akt2 knockout mice. These animals are
normal in size, but are insulin resistant and hyperglycemic (Cho, Mu et al. 2001).
These studies suggest that Akt1 is important in proper growth factor and cell survival
signaling, whereas Akt2 is critical in insulin signaling and glucose metabolism.
Clues to the specificity of Akt3 were also discovered using knock out animals.
Knockouts of Akt3 show a reduced brain size (Tschopp, Yang et al. 2005).
Interestingly, dual knockouts of isoforms 2 and 3 have both reduced brain size and
impaired glucose metabolism, but a knockout of Akt1/Akt3 is embryonic lethal
(Dummler, Tschopp et al. 2006). These data suggest that Akt2 and Akt3 serve
distinct functions, because a dual knockout is not lethal. However, with both Akt1
and Akt3 knocked out, the mice do not survive, suggesting that one of these
isoforms is needed for proper development, and Akt2 cannot serve that function.
Therefore, it is thought that Akt1 and Akt3 are critical for proper cell growth,
particularly Akt3 in brain, whereas the primary role of Akt2 is maintaining insulin
signaling and keeping glucose at an appropriate level in the blood.
Being that Akt is downstream of PI3K activation, it is not surprising that the
role of Akt in regulating DAT has been explored (Garcia, Wei et al. 2005; Wei,
Williams et al. 2006). These studies provided further evidence that PI3K signaling

30
controls DAT plasma membrane expression by demonstrating that basal Akt activity
sustains DAT on the surface. Using both pharmacological means (ML9, an Akt
inhibitor) and genetic manipulations (dominant negative Akt mutant), Garcia and
collegues demonstrated in heterologous expressing cells that inhibiting active Akt
results in a decrease of DAT on the surface. Akt can be altered to remain active as
well through myristylation (myr-Akt), which keeps the protein anchored at the
plasma membrane in an active state. Importantly, transfection of this constitutively
active, myr-Akt increased the surface expression of DAT (Garcia, Wei et al. 2005;
Wei, Williams et al. 2006). The physiological relevance of these results was
emphasized by demonstrating that DA uptake, measured in heterologous
expressing cells and striatal synaptosomes, was also impaired with ML9
treatment (Garcia, Wei et al. 2005; Wei, Williams et al. 2006). These data provide
compelling evidence to support the hypothesis that basal PI3K/Akt signaling is
important in regulating DAT function. Furthermore, this work implies insulin
regulates DAT trafficking, consistent with hormonal regulation of dopaminergic
signaling. The suggestion that insulin signaling can regulate DA
neurotransmission via DAT is compelling given that insulin levels fluctuate with
food consumption (Niswender, Morrison et al. 2003), and DA is an important
neurotransmitter in regulation of reward and motivation for feeding.
Insulin and the Dopamine Transporter
DAT is an important component in regulation of DA signaling, and
therefore it is of interest that several lines of evidence suggest that insulin can
31
regulate the expression and activity of DAT. For example, chronic intracranial
administration of insulin enhanced DAT mRNA in the substantia nigra (Figlewicz,
Szot et al. 1994). Moreover, hyperinsulinemic rats showed increased DAT
mRNA in the substantia nigra (Figlewicz, Patterson et al. 1998). Food
restriction, which causes low circulating levels of insulin, results in a 32%
decrease in the Vmax of DA uptake in the striatum of rats, whereas the Km
remains unaltered, pointing to a reduction in the surface expression of DAT
(Zhen, Reith et al. 2006). Furthermore, food deprivation also reduces DA uptake
in striatal synaptosomes (Patterson, Brot et al. 1998). Incubation of these
synaptosomes with a physiological concentration of insulin restored DA uptake to
control levels (Patterson, Brot et al. 1998), suggesting that changes in circulating
insulin can modulate DAT activity. As discussed previously, important
components of the insulin signaling pathway, PI3K and Akt, have been shown to
regulate the transporter’s surface expression and function. These studies also
show that activating PI3K and Akt by stimulating heterologous cells expressing
DAT with insulin causes an increase of the transporter on the cell surface, as well
as an increase in DA uptake.
Perhaps the most telling studies thus far related to insuilin regulation of
DAT examined the effects of streptozotocin (STZ)-induced insulin depletion on
DAT surface expression and its function. STZ enters the pancreatic β-cell via the
glucose transporter GLUT2 and causes DNA damage, resulting in free radical
production and subsequent β-cell necrosis (Szkudelski 2001). Without β-cells,
animals suffer from hypoinsulinemia and hyperglycemia (Carr 1996). Rats made
32
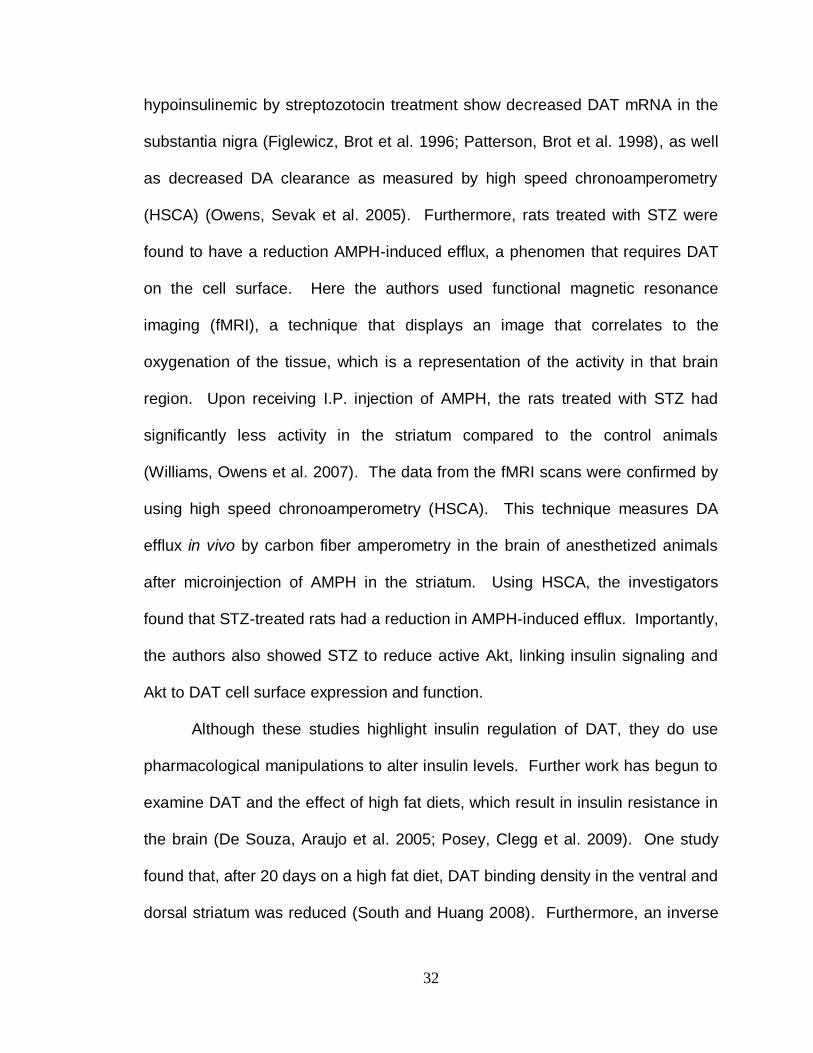
hypoinsulinemic by streptozotocin treatment show decreased DAT mRNA in the
substantia nigra (Figlewicz, Brot et al. 1996; Patterson, Brot et al. 1998), as well
as decreased DA clearance as measured by high speed chronoamperometry
(HSCA) (Owens, Sevak et al. 2005). Furthermore, rats treated with STZ were
found to have a reduction AMPH-induced efflux, a phenomen that requires DAT
on the cell surface. Here the authors used functional magnetic resonance
imaging (fMRI), a technique that displays an image that correlates to the
oxygenation of the tissue, which is a representation of the activity in that brain
region. Upon receiving I.P. injection of AMPH, the rats treated with STZ had
significantly less activity in the striatum compared to the control animals
(Williams, Owens et al. 2007). The data from the fMRI scans were confirmed by
using high speed chronoamperometry (HSCA). This technique measures DA
efflux in vivo by carbon fiber amperometry in the brain of anesthetized animals
after microinjection of AMPH in the striatum. Using HSCA, the investigators
found that STZ-treated rats had a reduction in AMPH-induced efflux. Importantly,
the authors also showed STZ to reduce active Akt, linking insulin signaling and
Akt to DAT cell surface expression and function.
Although these studies highlight insulin regulation of DAT, they do use
pharmacological manipulations to alter insulin levels. Further work has begun to
examine DAT and the effect of high fat diets, which result in insulin resistance in
the brain (De Souza, Araujo et al. 2005; Posey, Clegg et al. 2009). One study
found that, after 20 days on a high fat diet, DAT binding density in the ventral and
dorsal striatum was reduced (South and Huang 2008). Furthermore, an inverse

33
relationship between Body Mass Index (BMI) and striatal DAT availability has
been shown (Chen, Yang et al. 2008). These studies begin to point to changes
in DAT with a high fat diet, but they do not provide a mechanism for such
changes. However, these data are of interest for they demonstrate alterations in
a component of DA signaling in obesity. Still, it is not understood whether this
dysfunction is a cause, or a consequence of a high fat diet. Additionally, co-
morbidity between obesity and several DA-related disorders points to a need for
a better understanding of the interactions between insulin signaling and DA
systems.
Dopamine and Feeding Behaviors
DA is important in modulating several behaviors, ranging from movement
to cognition to motivation and pleasure, including our motivation to eat and the
pleasure we receive from eating. The role DA has in feeding behavior has been
demonstrated by studies that illustrate improper DA signaling in obesity. For
example, upon eating a palatable meal, dopaminergic areas of the brain, such as
the dorsal striatum, increase in activity (Stice et al., 2008). Interestingly, in
subjects with a BMI in the obese range, this activity is dampened, suggesting a
dysregulation of DA neurotransmission in obese individuals (Stice et al., 2008).
In studies on obese rats on high fat diets for up to 16 weeks, striatal DA turnover
is impaired (Davis, Tracy et al. 2008), and mRNA levels of DAT, D4R, D2R, and
TH are reduced (Huang, Yu et al. 2005; Huang, Zavitsanou et al. 2006). In
humans, D2R occupancy as measured by positron emission tomography (PET)

34
is reduced in a BMI-dependent manner (Wang, Volkow et al. 2001), and similar
results for DAT were also shown (Chen, Yang et al. 2008). Therefore, it is
becoming clear that DA systems are very important in our consumption of food,
as they are altered in states of excessive food consumption. The exact
mechanism of this phenomenon, however, is still being explored.
DA has several roles in our consumption of food, namely motivation for
seeking food and food consumption (Volkow, Wang et al. 2002; Palmiter 2007),
and the reward and satiety we feel when we eat (Volkow and Wise 2005). The
latter of these has been studied extensively. The DA reward system originates in
the VTA, with the projections ending in the ventral striatum, also known as the
nucleus accumbens. Several inputs feed into this system, including canabanoid
and opiate systems, as well as signaling molecules that are regulated by our food
consumption; which include insulin and leptin (Palmiter 2007). DA is well known
for the role it plays as the signaling molecule for our endogenous reward system.
Activation of DRs in the reward system is thought to give us a pleasant feeling for
several tasks, such as consuming food or having sex. Drugs are known to hijack
this system, leading to highs when consuming the drug and cravings when not.
In fact, comparisons between drug addiction and obesity have been made
(Volkow and Wise 2005). In fMRI scans, drug-addicted subjects had a reduction
of activity in the striatum, a dopamine rich area, upon receiving the drug
compared to non-addicted subjects. With constant drug use, their DA systems
were altered, as shown by a reduction in striatal activity. This is thought to be the
biological basis for addiction, causing them to crave the drug more, and also

35
need more to create a similar ―high‖. Some groups have presented a similar
hypothesis for food consumption and obesity. In fact, fMRI scans of obese
subjects also show a reduction in activity in the striatum when consuming a
highly palatable food compared to normal subjects (Stice, Spoor et al. 2008;
Stice, Spoor et al. 2008). It is hypothesized that this disparity will override one’s
metabolic signals for when food is actually needed.
As researchers continue to explore DA signaling in feeding behavior, this
view becomes overly simplistic. One study examined the effects of DA on
feeding by creating mice that are DA deficient in the brain (Sotak, Hnasko et al.
2005). This was accomplished by knocking out expression of TH, the enzyme
needed to synthesize DA, in neurons. Interestingly, these DA-deficient mice
would not eat and die shortly after birth, having no motivation to seek and
consume food. To attempt to rescue the animal’s motivation to eat, the
researchers rescued DA signaling by injection of a virus expressing TH in
different DA regions in the brain to determine exactly which region was
responsible for feeding behavior. Only restoration to the dorsal striatum caused
the animals to eat and survive. This study highlights the dorsal striatum, and
therefore the nigrostriatal system, in feeding behavior. The authors suggest that
the dorsal striatum may be the basis for our motivation for feeding; defining our
basic need for food. Without DA signaling in this region, the animals did not eat.
Therefore, alterations to DA signaling in the dorsal striatum and nigrostriatal
system may have implications for our basic need for consuming food, thus
altering feeding behavior. Importantly, restoration of signaling to the ventral

36
striatum had no effect, leading to the hypothesis that the dorsal striatum is
necessary for food intake, and the ventral striatum may act just to fine tune
feeding behavior (Sotak, Hnasko et al. 2005; Palmiter 2008).
Further work has supported the hypothesis of the importance of the dorsal
striatum in feeding behavior. A study conducted by Volkow and colleagues
examined extracellular DA levels using PET imaging, specifically a ratio of
Bmax/Kd of D2R ligand raclopride, in hungry subjects. These subjects were
presented with food they could see and smell, but not consume. They found,
that the Bmax/Kd ratio of raclopride was decreased in the dorsal striatum (Volkow,
Wang et al. 2002). They concluded these changes to be from an increase in
extracellular DA as the hungry subjects were presented with food, which bound
to the D2Rs and decreased the D2Rs available for raclopride binding.
Interestingly, they saw no change in D2R availability in the ventral striatum
(Volkow, Wang et al. 2002), further pointing to the role of the dorsal striatum in
desire and motivation for food.
These studies highlight the importance of DA systems, in particular the
dorsal striatum, to feeding behaviors. Notably, the effects of high fat diets on DA
systems, including the dorsal striatum, have also begun to be explored. Geiger
and colleagues examined the effects of obesity from a ―cafeteria style‖ diet in
rats, consisting of access to several different highly palatable, highly caloric foods
such as meats, cheeses, cookies, sweetened condensed milk, etc., on DA
systems. After 15 weeks on this diet, the rats became obese (Geiger, Haburcak
et al. 2009). They then measured the amount of DA released after electrical

37
stimulation ex vivo and found that the obese rats displayed a reduction in the
evoked DA potentials in slices from the ventral striatum, as well as from the
dorsal striatum (Geiger, Haburcak et al. 2009). This study suggests that obese
subjects have a reduction in DA neurotransmission in both the ventral and dorsal
striatum. Although it is still uncertain the exact role each system plays in feeding
behavior, it is clear that both affect feeding behavior, and therefore both areas
need to be explored in order to gain an understanding of the role of DA systems
in obesity.
Insulin Regulation of Feeding Behavior
Insulin is an important metabolic signal in our control of food consumption.
Insulin is produced by pancreatic β-cells, and is well-known for its control of
blood glucose levels. Insulin has long been recognized as a major endocrine
regulator of the uptake, cellular transport, and metabolism of small nutrient
molecules such as amino acids, fatty acids, and glucose. Insulin’s classical role
in the peripheral system in maintaining blood glucose levels has been well
characterized, and its involvement in the central nervous system was originally
thought to be minimal. However, evidence shows that insulin contributes to
energy homeostasis through input to the hypothalamus (Baskin, Figlewicz
Lattemann et al. 1999; Niswender, Morrison et al. 2003; Niswender, Baskin et al.
2004). Furthermore, additional roles of insulin signaling in the CNS have also
begun to emerge (Figlewicz, Evans et al. 2003; Sevak, Koek et al. 2006; Russo,
Bolanos et al. 2007; Williams, Owens et al. 2007).

38
The detection of insulin and insulin-related molecules in the brain provides
plausible support for a regulatory role in the CNS (Kar, Chabot et al. 1993). At
first it was believed that insulin was impermeable to the blood-brain barrier
(BBB), but evidence since has demonstrated otherwise. Insulin is shown to
rapidly enter the cerebrospinal fluid (Woods, Porte et al. 1985; Wallum, Taborsky
et al. 1987). In addition, animals with high levels of plasma insulin, such as
genetically obese rats, are found to have high insulin levels in the cerebrospinal
fluid (Stein, Dorsa et al. 1983), showing the blood plasma levels and
cerebrospinal fluid levels move in parallel. It is thought that movement across
the BBB via a transport system is responsible for the parallel shifts between the
two components (Woods, Porte et al. 1985). Such a system has since been
identified, allowing for the transfer of insulin from the blood plasma to brain
microvessels in the CNS (Frank and Pardridge 1983; Pardridge, Eisenberg et al.
1985). Further work confirmed such transport by showing the transfer of insulin
into the CNS using radiolabeled insulin injected into the blood that was later
observed in the brain. This transfer occured via a saturable transporter (Banks,
Jaspan et al. 1997; Banks, Jaspan et al. 1997). The transporter for insulin in the
BBB is now well characterized and is found to be widely distributed throughout
the central nervous system (Mateo, Budygin et al. 2004). Insulin crosses the
BBB with varying permeability, allowing for regulation of brain insulin levels, as
well as dysregulation in disease states. The transport system can be altered by
a number of physiological and pathological events including fasting, obesity, and
diabetes mellitus (Baskin, Stein et al. 1985; Banks, Jaspan et al. 1997; Banks

39
and Kastin 1998). The existence of such a system suggests that insulin serves a
physiological role in the brain.
Insulin receptors (IRs) are abundant in CNS, including striatum and
hypothalamus (Havrankova, Roth et al. 1978; Havrankova, Brownstein et al.
1981; Hill, Lesniak et al. 1986; Figlewicz, Evans et al. 2003), however CNS
glucose utilization is not insulin dependent. Instead, insulin serves functions in
the brain beyond regulating glucose homeostasis, showing other important
functions for this signaling peptide, including regulation of food intake. This was
first demonstrated in a primate study, where researchers administered insulin
directly to the brain by a intracerebroventricular (i.c.v.) infusion and found that
food intake was decreased (Woods, Lotter et al. 1979). Furthermore, using mice
that lacked IRs in the CNS, Bruning and collegues confirmed the importance of
insulin signaling in the brain. These mice were overweight, insulin-resistant, and
glucose intolerant (Bruning, Gautam et al. 2000). Taken together, these studies
indicate the importance of insulin signaling in the brain in regulation of food
intake, and body weight.
Understanding insulin signaling in all areas of the brain that contribute to
feeding behavior is important to help understand improper food intake and
obesity. As discussed earlier, studies have demonstrated the importance of DA
systems on feeding behavior, and IRs have been identified in the substantia
nigra and striatum by anatomical studies using receptor autoradiography and
receptor immunochemistry (Hill, Lesniak et al. 1986; Werther, Hogg et al. 1987;
Unger, Livingston et al. 1991; Schulingkamp, Pagano et al. 2000). Extensive

40
mRNA coexpression of the DA precursor TH and IRs was observed in the
substantia nigra (Figlewicz, Evans et al. 2003). With expression of IRs on DA
neurons, it is not surprising that a role for insulin in regulating components of DA
neurotransmission, including DAT, has begun to emerge.
Insulin, Diabetes, and DA-related Diseases
Several lines of evidence exist to link insulin to DAT and DA
neurotransmission. Interestingly, dysfunction in these systems overlaps as well.
Insulin resistance and type II diabetes have been linked to several disorders
involving improper DA signaling, such as Parkinson’s Disease (Sandyk 1993;
Morris, Zhang et al. 2008), schizophrenia (Mukherjee, Decina et al. 1996), bipolar
disorder (Fiedorowicz, Palagummi et al. 2008), and depression (Golden, Lazo et
al. 2008). A recent study found that, among diabetic patients, there was a
significant increase in the risk for Parkinson’s Disease (Driver, Smith et al. 2008).
Several studies have also shown a predisposition to the precursor to diabetes,
metabolic syndrome, as well as diabetes itself, and obesity, in patients with
bipolar disorder (Fiedorowicz, Palagummi et al. 2008; van Winkel, De Hert et al.
2008).
Perhaps the most well studied interplay of diabetes and DA-related
disease is schizophrenia, a disorder that is well known to involve DA dysfunction
(Kapur and Mamo 2003; Howes and Kapur 2009). Diabetes and insulin
resistance are known to be prominent in schizophrenic patients, where 18-19%
of patients have a family history of diabetes mellitus (Mukherjee, Schnur et al.

41
1989), compared to approximately 1.2-6.3% of the general population (Adams
and Marano 1995). Studies have linked this increase to second generation,
atypical antipsychotics, specifically clozapine and olanzapine, which have been
shown to increase insulin resistance and improper glucose metabolism in a
matter of a few months after beginning treatment (Newcomer 2001; van Winkel,
De Hert et al. 2008). This is of interest considering these drugs target dopamine
receptors. However, recent studies have demonstrated that use of these drugs
does not fully explain the increase of diabetes in schizophrenic patients. Ryan
and colleagues found in drug naïve patients that there was already insulin
resistance and impaired glucose tolerance (Ryan, Collins et al. 2003).
Furthermore, another group found that the prevalence of diabetes in the
schizophrenic population was increased before the use of new, atypical
antipsychotics (Dixon, Weiden et al. 2000). Lastly, Zhao and colleagues
examined insulin signaling in the prefrontal cortex of postmortem tissue from
schizophrenic patients. These subjects had been treated with first generation
antipsychotics, not the second generation, atypical drugs thought that were
previously hypothesized to be responsible for this correlation. They found a
significant decrease in several aspects of insulin signaling, including insulin
receptor phosphorylation and Akt phosphorylation (Zhao, Ksiezak-Reding et al.
2006), again suggesting improper insulin signaling in schizophrenic patients
regardless of the drugs used to treat them. These studies certainly demonstrate
a link between schizophrenia and diabetes, but the cause is still not clear.

42
Studies have not yet determined whether the dysfunction in insulin signaling
seen in these patients is a cause, or a consequence, of schizophrenia.
Although the exact relationship between insulin resistance and diseases
involving DA dysfunction are still not fully understood, these studies demonstrate
an important link between the two systems.
Specific Aims
DA signaling influences a wide range of behaviors, including movement,
motivation and cognition, and desire and reward. A growing body of literature
points to DA regulation of feeding behavior via signaling in the dorsal striatum.
DAT is an important component of DA neurotransmission, that functions to clear
away extracellular DA and terminate transmission. Therefore, changes to DAT
function have important implications in altering DA signaling and DA-mediated
behaviors, such as feeding behavior.
DAT function is regulated by changes in transporter expression on the
plasma membrane. The insulin signaling pathway, including PI3K and Akt, is
known to alter DAT function by regulating the transporter’s cell surface
expression (Figure 8). Therefore, alterations in insulin signaling could lead to
changes in DAT function and DA neurotransmission. Interestingly, dysregulated
insulin signaling and diabetes is seen in patients with DA-related disorders.
Furthermore, the occurrence of insulin resistance and obesity is increasing in our
nation (Mokdad, Ford et al. 2003; Flegal, Carroll et al. 2010), yet the effects of
this on DA systems and DA-related behaviors is not well understood. As a role

43
for insulin in regulating DA-related behaviors begins to be revealed,
understanding on a molecular level how changes to insulin signaling alter DAT
function is needed.
Therefore the aims of this dissertation are:
1) To further define components of the insulin signaling pathway that alter
DAT cell surface expression.
2) Examine diet-induced molecular changes to insulin signaling and DAT
function in the nigrostriatal pathway.

44
Figure 8. Schematic of insulin regulation of the dopamine transporter. Upon binding insulin to its receptor, the insulin signaling pathway, which consists of phosphoinositol-3-kinase (PI3K) and Akt, is activated. This acts to support the dopamine transporter (DAT) on the plasma membrane (blue). A high fat diet causes insulin resistance, inhibiting the insulin signaling pathway and therefore reducing DAT cell surface expression (red).
45
CHAPTER II
ISOFORM SPECIFIC REGULATION OF DAT CELL
SURFACE EXPRESSION BY AKT2
Introduction
DA is a neurotransmitter that plays an important role in movement,
motivation, and cognition. DA is also a key regulator of reward (Wise 1998). An
essential element in fine tuning DA neurotransmission is the DA transporter
(DAT) (Giros, el Mestikawy et al. 1992; Borowsky, Adham et al. 2001). DAT
function is required to clear released DA by active reuptake into the presynaptic
bouton (Giros, Jaber et al. 1996; Jones, Gainetdinov et al. 1998), thereby
terminating DA signaling. Therefore, changes in DAT function have profound
implications in DA homeostasis and signaling (Gelernter, Kranzler et al. 1994;
Spencer, Biederman et al. 2005).
Both function and trafficking of the DAT are tightly regulated by several
signaling pathways, including protein kinase C (PKC), mitogen activated protein
kinase (MAPK), phosphatidylinositol 3-kinase (PI3K) and importantly, protein
kinase B (Akt) (Gonzalez and Robinson 2004; Torres 2006). It is well
documented that inhibition of PI3K decreases surface levels of DAT and reduces
DAT function, including DA clearance measured in vivo (Carvelli, Moron et al.
2002; Owens, Sevak et al. 2005; Williams, Owens et al. 2007; Lute, Khoshbouei

46
et al. 2008). Similarly, inhibition of Akt results in a decrease in DAT surface
expression and function (Garcia, Wei et al. 2005).
While it is known that Akt regulates DAT cell surface expression, it is
unclear which Akt isoform is involved in this regulation. Importantly, different Akt
isoforms appear to serve distinct functions in brain (Tschopp, Yang et al. 2005;
Dummler, Tschopp et al. 2006). Akt exists as three isoforms; Akt1 and Akt2 are
ubiquitously expressed, whereas Akt3 is found only in the brain and testes
(Dummler, Tschopp et al. 2006). Knockout studies reveal that Akt1 is primarily
associated with cell survival and growth (Cho, Thorvaldsen et al. 2001), and Akt3
appears to have similar functions in the brain (Tschopp, Yang et al. 2005). In
contrast, Akt2 is associated with insulin modulation of glucose homeostasis,
including regulation of glucose transporter (GLUT4) trafficking (Cho, Mu et al.
2001; Bae, Cho et al. 2003).
Many studies have linked dysfunctions in Akt signaling to the underlying
mechanisms of disorders such as schizophrenia, which also involves
dysregulation of DA signaling (Emamian, Hall et al. 2004; Schwab, Hoefgen et al.
2005; Bajestan, Sabouri et al. 2006). Therefore, defining the isoform of Akt that
is responsible for altering DAT cell surface expression will further advance our
knowledge of how aberrant Akt signaling leads to abnormal DA
neurotransmission and may be clinically relevant to central dopaminergic
disorders.
47
Methods
Cell surface protein biotinylation. Biotinylation experiments were
performed on intact cells as described previously (Sung, Apparsundaram et al.
2003; Garcia, Wei et al. 2005; Dipace, Sung et al. 2007). Briefly, HEK-293 stably
transfected with hDAT (hDATcells) were plated at a density of 1 x 10⁶ per well in
a six-well poly-(D-lysine) coated plate. Cells were washed with cold PBS
containing Ca2+/Mg2+ and treated for the indicated times. Then, cells were
incubated with 1.0 mg/mL sulfosuccinimidyl-2-(biotinamido)ethyl-1,3-
dithiopropionate [NHS-SS-biotin] (Pierce/Thermo Scientific, Rockford, IL) for 30
minutes, washed, quenched with 100 mM glycine, and extracted in lysis buffer
(PBS Ca2+/Mg2+, 1% Triton 100-X, and 0.5 mM PMSF at 4°C). Lysates were
centrifuged, total fractions reserved, and supernatants incubated with
immobilized streptavidin beads (Pierce/ThermoScientific) for 1 hr at room
temperature. Beads were washed three times in lysis buffer, and bound proteins
eluted with 2X sample buffer containing 2-mercaptoethanol. Proteins were
separated by SDS-PAGE and immunoblotted. For estimation of relative amounts
of proteins, the exposed films of the immunoblots were scanned, and band
intensities were measured with Scion Image (Scion Corporation, Frederick, MD).
Brain slice preparation. Methods are as described (Grueter and Winder
2005). All procedures were conducted in accordance with the Vanderbilt
Institutional Animal Care and Use Committee. Briefly, Sprague Dawley rats
(approx. 300 g) were decapitated. The brains were quickly removed and placed
in an ice-cold, low-sodium/high-sucrose dissecting solution. Hemisected (300 µm)

48
coronal brain slices containing the striatum were prepared on a vibratome. Slices
were allowed to recover in a submerged holding chamber (37°C) containing
oxygenated (95% O2, 5% CO2) artificial cerebrospinal fluid (aCSF) that contained
the following (in mM): 124 NaCl, 4.4 KCl, 2.5 CaCl2, 1.3 MgSO4, 1 NaH2PO4, 10
glucose, and 26 NaHCO3 for a recovery period of 60 min before beginning
experiments. Slices were then incubated with Akt inhibitors: 12 µM (I-Akt1 and I-
Akt2), 5 µM (I-Akt ½) in aCSF, or aCSF containing the vehicle DMSO for one
hour at 37 degrees. Biotinylation assays were then performed.
Biotinylation assays. For slice assays, hemisected coronal slices (300 µm)
were transferred to multiwell submerged chambers containing oxygenated aCSF
with NHS-SS-Biotin (1 mg/ml) on ice at 4°C and incubated for 45 minutes, then
washed twice for 10 min each in aCSF, and finally incubated in aCSF containing
glycine (100mM) for two 20 min periods. Slices were then placed onto dishes on
dry ice and the striatum was removed and placed into eppendorf tubes. Tissue
punches of the striatum were homogenized in ice-cold homogenization buffer
(1% Triton, 2 mM sodium orthovanadate, 2 mM sodium fluoride, 25 mM HEPES,
150 mM NaCl, 10 µg/ml aprotinin, and 10 µg/ml leupeptin, and 100 µM
phenylmethylsulfonyl fluoride) and centrifuged for 30 min at 1000 x g at 4°C.
Protein levels were obtained, and equal amounts were added to strepavidin
beads with pulldown buffer (0.1 % Triton, 25 mM HEPES, 150 mM NaCl, 2 mM
sodium orthovanadate, 2 mM sodium fluoride, 10 µg/ml aprotinin, and 10 µg/ml
leupeptin, and 100 µM phenylmethylsulfonyl fluoride) and incubated overnight at
4°C. Samples were washed, eluted, and immunoblot analysis was carried out.

49
Total slice lysates and the biotinylated (slice surface) fraction underwent
immunodetection for rDAT.
Immunoprecipitation. After treatment with either vehicle or each inhibitor
as described, hDAT expressing HEK cells were washed with ice-cold
PBS/Ca2+/Mg2+ and incubated in 400 μl/well of lysis buffer containing 50 mM
NaH2PO4, 10 mM Tris, 100 mM NaCl, 0.5 mM PMSF, pH 8.0, plus 1% Triton X-
100 for 1 h at 4°C. Cell lysates recovered by centrifugation at 20,000g for 30 min
were incubated overnight at 4°C either with Akt1 (1:250; Cell Signaling
Technology; Danvers, MA) or Akt2 (1:800; Santa Cruz Biotechnology, Sana
Cruz, CA) antibodies. Complexes were retrieved by the addition of 20 μl of
protein G-Sepharose (GE Healthcare, Little Chalfont, Buckinghamshire, UK),
washed three times with lysis buffer. Bound proteins were then eluted and
processed for immunoblot analysis as described.
Immunoblotting. Determination of immunoreactivity was conducted
according to previously described methods (Garcia, Wei et al. 2005; Williams,
Owens et al. 2007). Briefly, tissue samples were separated by SDS-PAGE, and
resolved proteins were transferred to polyvinylidene difluoride (PVDF)
membranes (BioRad), which were incubated for 1 hr in blocking buffer (5% BSA
and 0.1% Tween20 in Tris-buffered saline). The blots were incubated with
primary antibody overnight at 4°C. Primary antibodies used for immunostaining
were CamKII (1:2000; Affinity BioReagents, Rockford, IL), p-Akt (Thr308; 1:1000;
Millipore, Billerica, MA) and hDAT (1:1000, Cell Signaling Technology, Danvers,
MA). For rat DAT (rDAT) immunostaining, mouse monoclonal primary

50
antibodies were used (antibody 16, 1:1000; (Gaffaney and Vaughan 2004)). All
proteins were detected using HRP-conjugated secondary antibodies (1:5000;
Santa Cruz Biotechnology, Santa Cruz, CA). After chemiluminescent
visualization (ECL-Plus; Amersham; Piscataway, NJ) on Hyper-film ECL film
(Amersham), protein band densities were quantified (Scion Image; Frederick,
MD) and normalized to control.
Immunohistochemistry. For tissue staining, slices were prepared as
described above and subsequently fixed with PBS Ca2+/Mg2+,4%
paraformaldehyde, washed three times with PBS, permeabilized and blocked
with PBS 4% bovine serum albumin (BSA)/0.15% Tween-20, and immunostained
with the appropriate antibody dissolved in PBS 4% BSA/0.05% Tween-20.
Primary antibodies used for immunostaining were used: Akt2 (1:200; Santa Cruz
Technology; Santa Cruz, CA) and rDAT (1:400; antibody 16, (Gaffaney and
Vaughan 2004)) overnight at 4°C. After incubation with secondary fluorophores,
immunofluorescence was imaged using a Perkin Elmer UltraView confocal with a
Nikon Eclipse 2000-U microscope equipped with a 60X lens with an N.A. of 1.49.
Image processing was performed using Image J and Adobe Photoshop.
HSCA. HSCA was conducted using the FAST-12 system (Quanteon;
http://www.quanteon.cc) as previously described with some modification (Owens
et al., 2005; Williams et al., 2007). Recording electrode/micropipette assemblies
were constructed using a single carbon-fiber (30 lm diameter; Specialty
Materials; Tulsa, OK), which was sealed inside fused silica tubing (Schott, North
America; Elmsford, NY). The exposed tip of the carbon fiber (150 μm in length)

51
was coated with 5% Nafion (Aldrich Chemical Co., St. Louis, MO; 3–4 coats
baked at 200 ˚C for 5 min per coat) to provide a 1000-fold selectivity of DA over
its metabolite dihydroxyphenylacetic acid (DOPAC). Under these conditions,
microelectrodes displayed linear amperometric responses to 0.5–10 μM DA
during in vitro calibration in 100 mM phosphate-buffered saline (pH 7.4). Animals
were anesthetized with injections of urethane (850 mg/kg, i.p.) and α-chloralose
(85 mg/kg, i.p.), fitted with an endotracheal tube to facilitate breathing, and
placed into a stereotaxic frame (David Kopf Instruments; Tujunga, CA). To locally
deliver test compounds (see below) close to the recording site, a glass single or
multi-barrel micropipette (FHC; Bowdion, ME) was positioned adjacent to the
microelectrode using sticky wax (Moyco; Montgomeryville, AL). The center-to-
center distance between the microelectrode and the micropipette ejector was 300
μm. The study used a multibarrel configuration in which barrels contained AMPH
(400 μM) or vehicle (aCSF) and additional barrels contained the Akt inhibitors
(1mM). The electrode/micropipette assembly was lowered into the striatum at
the following coordinates (in mm from bregma [68]): A/P +1.5; M/L, +/- 2.2; D/V, -
3.5 to -5.5. The application of drug solutions was accomplished using a
Picospritzer II (General Valve Corporation; Fairfield, NJ) in an ejection volume of
100–150 nl (5–25 psi for 0.25–3 s). After ejection of test agents, there is an
estimated 10–200-fold dilution caused by diffusion through the extracellular
matrix. To record the efflux of DA at the active electrode, oxidation potentials—
consisting of 100-ms pulses of 550 mV, each separated by a 1-s interval during
which the resting potential was maintained at 0 mV—were applied with respect to
52
an Ag/AgCl reference electrode implanted into the contralateral superficial cortex.
Oxidation and reduction currents were digitally integrated during the last 80 ms of
each 100-ms voltage pulse. For each recording session, DA was identified by its
reduction/oxidation current ratio: 0.55–0.80. At the conclusion of each
experiment, an electrolytic lesion was made to mark the placement of the
recording electrode tip. Rats were then decapitated while still anesthetized, and
their brains were removed, frozen on dry ice, and stored at -80˚C until sectioned
(20 μm) for histological verification of electrode location within the striatum.
HSCA data were analyzed with GraphPad Prism.
Results
Pharmacological inhibition of Akt has been shown to reduce DAT cell
surface expression (Garcia, Wei et al. 2005). However, the isoform of Akt
involved is unknown. Therefore, we utilized allosteric, isoform-specific inhibitors
of Akt1 (I-Akt1), Akt2 (I-Akt2), as well as a dual Akt1 and Akt2 inhibitor (I-Akt1/2),
to identify the Akt isoform that regulates DAT trafficking (Figure 9). These
selective inhibitors were developed and characterized in cell lines and primary
tissue (DeFeo-Jones, Barnett et al. 2005; Lindsley, Zhao et al. 2005; Zhao,
Robinson et al. 2008). HEK-293 cells stably expressing the human DAT (hDAT
cells) were plated at the same density and treated for one hour with either I-Akt1
(12 uM), I-Akt2 (12 uM), or I-Akt1/2 (5 uM). These concentrations have
previously been shown to be isoform specific (DeFeo-Jones, Barnett et al. 2005;
Lindsley, Zhao et al. 2005). Using biotinylation assays
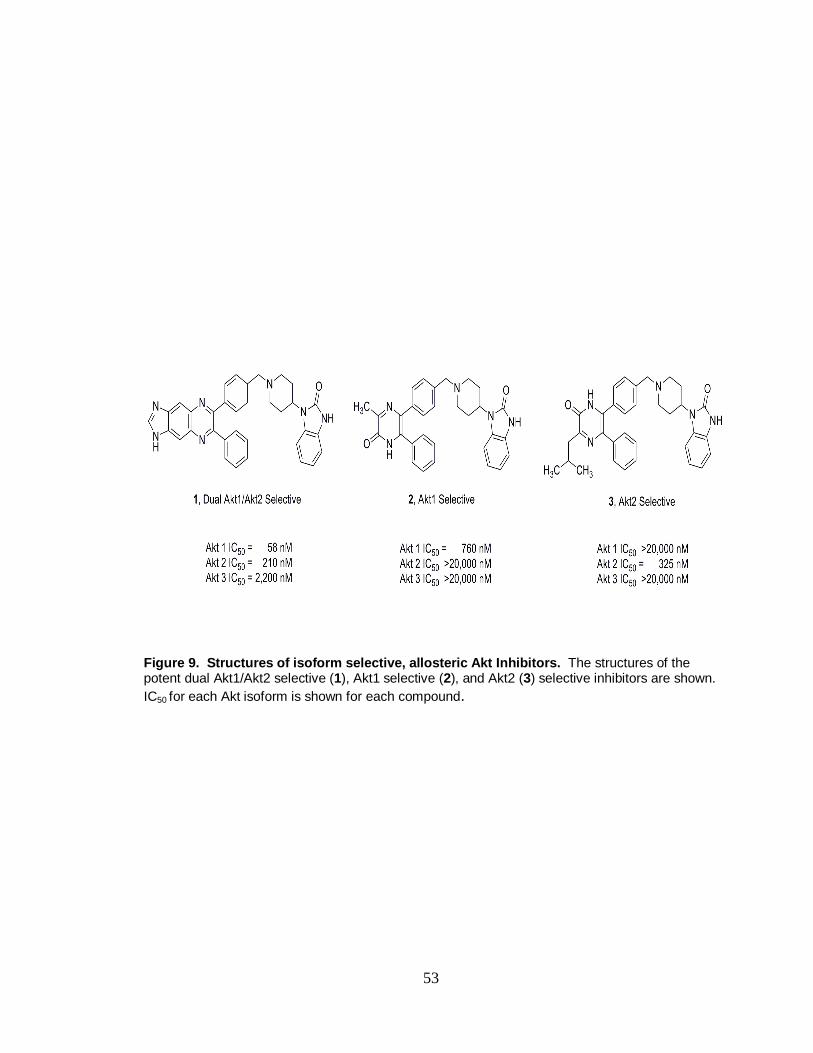
53
Figure 9. Structures of isoform selective, allosteric Akt Inhibitors. The structures of the potent dual Akt1/Akt2 selective (1), Akt1 selective (2), and Akt2 (3) selective inhibitors are shown.
IC50 for each Akt isoform is shown for each compound.

54
(Saunders, Ferrer et al. 2000; Garcia, Wei et al. 2005), we examined surface
expression of hDAT after both vehicle treatment and drug treatment. Figure 10A
(inset) shows representative immunoblots for hDAT obtained from hDAT cells
treated with vehicle (Control), I-Akt1, I-Akt2, or I-Akt1/2. Densitometric analysis
of the immunoblots was performed and the level of surface hDAT was
normalized to total hDAT. This data demonstrated that only inhibition of Akt2
significantly reduced hDAT cell surface expression (Fig. 10A, surface hDAT was
normalized to total hDAT and expressed as percent of control; *p<0.01 by one-
way ANOVA followed by Bonferroni post hoc test). Consistently, dual inhibition
of both isoforms significantly decreased surface hDAT as well (Fig. 10A).
Importantly, inhibition of Akt1 had no significant effect on hDAT surface
expression.
Active Akt is phosphorylated at Thr 308 and Ser 473, and therefore
application of isoform specific inhibitors should reveal reduction of the
phosphorylation of the appropriate isoform. Therefore, to confirm the isoform
specificity of these inhibitors in our assay, hDAT cells were treated as described
above and specific Akt isoforms were immunoprecipitated and analyzed by
immunoblot analysis using phospho-specific antibodies. We probed for
phosphorylated Akt (Thr-308) to gauge the active, phosphorylated state of each
Akt isoform after drug treatment. Fig. 10B demonstrates that the each inhibitor
dramatically decreased basal phosphorylation of the relevant isoform(s),
confirming that these inhibitors are isoform specific at the concentrations and
treatment time used in our assay. Thus, these data suggest that Akt2, not Akt1,
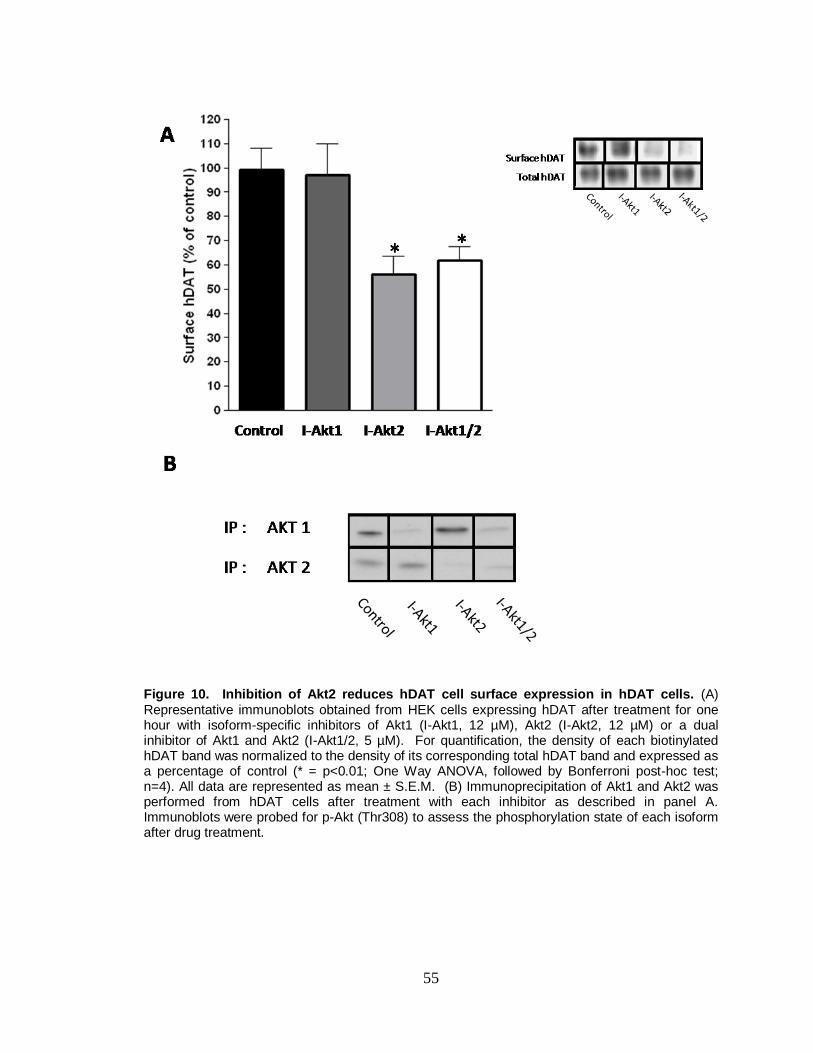
55
Figure 10. Inhibition of Akt2 reduces hDAT cell surface expression in hDAT cells. (A) Representative immunoblots obtained from HEK cells expressing hDAT after treatment for one hour with isoform-specific inhibitors of Akt1 (I-Akt1, 12 µM), Akt2 (I-Akt2, 12 µM) or a dual inhibitor of Akt1 and Akt2 (I-Akt1/2, 5 µM). For quantification, the density of each biotinylated hDAT band was normalized to the density of its corresponding total hDAT band and expressed as a percentage of control (* = p<0.01; One Way ANOVA, followed by Bonferroni post-hoc test; n=4). All data are represented as mean ± S.E.M. (B) Immunoprecipitation of Akt1 and Akt2 was performed from hDAT cells after treatment with each inhibitor as described in panel A. Immunoblots were probed for p-Akt (Thr308) to assess the phosphorylation state of each isoform after drug treatment.

56
is responsible for regulating hDAT cell surface expression in this heterologous
expression system.
Next we confirmed our findings ex vivo by biotinylation of striatal slices
(300 µm), which are enriched in DAT positive nerve termini (Giros and Caron
1993). Slices were treated with either I-Akt1, I-Akt2, or I-Akt1/2 as shown in Fig.
3. The samples from each tissue punch were normalized to total level of
proteins. Similar to the results obtained from hDAT cells, treatment of striatal
slices with I-Akt2 reduced rat DAT (rDAT) cell surface expression, as did
treatment with the dual inhibitor I-Akt1/2 (Fig. 11A, inset). The cytosolic protein
CaMKII was found only in the cytosolic fraction, confirming the plasma
membrane nature of the biotinylated fraction of the striatal preparation.
Importantly, CaMKII levels (loading control) were not affected by Akt inhibitor
treatment (Fig. 11A, inset). Densitometric analysis of the immunoblots showed
that inhibition of Akt2 significantly decreased DAT cell surface expression with
respect to vehicle treated control (Fig. 11A). Similarly, dual inhibition of both Akt1
and Akt2 significantly decreased DAT cell surface expression (Fig. 11A).
Importantly, inhibition of Akt1 alone had no effect on DAT trafficking in our striatal
preparation (Fig. 11A).
To demonstrate further the role of Akt2 in the regulation of DAT, we
determined whether Akt2 is expressed in striatum in DAT positive projections.
Figure 11B shows that in striatal slices, Akt2 is heavily enriched in dopaminergic
terminals marked by DAT immunoreactivity. These data further support our

57
Figure 11. Inhibition of Akt2 reduces rDAT cell surface expression in rat striatal tissue. (A) Representative immunoblots obtained from striatal slices of biotinylated and total rat DAT (rDAT) after treatment for one hour with isoform-specific inhibitors of Akt1 (I-Akt1; 12 µM), Akt2 (I-Akt2; 12 µM ), or dual inhibitor of Akt1 and Akt2 (I-Akt1/2; 5 µM). Immunoblots of CaMKII were used to determine the plasma membrane identity of the biotinylated fraction and control for loading. For quantification, the density of each biotinylated rDAT band was normalized to that of its corresponding total rDAT band and expressed as a percentage of control (* = p<0.05; One Way ANOVA followed by Bonferroni post-hoc test; n=11). All data are represented as mean ± S.E.M. (B) Confocal imaging of rat striatal slices, where green indicates DAT positive regions and red indicates Akt2 positive regions (scale bar, 12 µm). The merged image depicts yellow regions indicating high levels of expression of both Akt2 and DAT in dopaminergic projections (n=3).

58
finding that Akt2 is involved in regulating DAT trafficking, demonstrating for the
first time isoform specificity of Akt regulation of DAT trafficking in native tissue.
DAT function is regulated both by the number of transporters at the
plasma membrane and by the rate of their transport cycle. Therefore, we
determined in vivo whether inhibition of Akt decreases DAT function. For this, we
utilized amphetamine (AMPH), a substrate of DAT that reverses its transport
cycle to cause DA efflux. We monitored AMPH-induced DA efflux in striatum of
anesthetized rats, as a measure of DAT activity, by high speed
chronoamperometry (HSCA). Since Akt2 inhibition leads to a decrease in DAT
cell surface expression, we hypothesized that it would also lead to a reduction in
AMPH-induced DA efflux. Figure 12A shows striatal AMPH-induced DA efflux
recorded 45 min after injecting the Akt inhibitors I-Akt1, I-Akt2, or vehicle
(artificial cerebrospinal fluid [aCSF] in DMSO). The inhibitors, AMPH, and aCSF
were intrastriatally applied by way of a calibrated micropipette positioned
adjacent to the recording electrode. First AMPH was applied to obtain a baseline
measure for DA efflux. Inhibitors or aCSF were then applied and AMPH
pressure-ejected again 45 minutes later. Inhibition of Akt2 led to a significant
reduction in the ability of AMPH to cause DA efflux (Fig. 12B) further supporting
our hypothesis that Akt2 is the isoform that regulates DAT surface expression
and function.
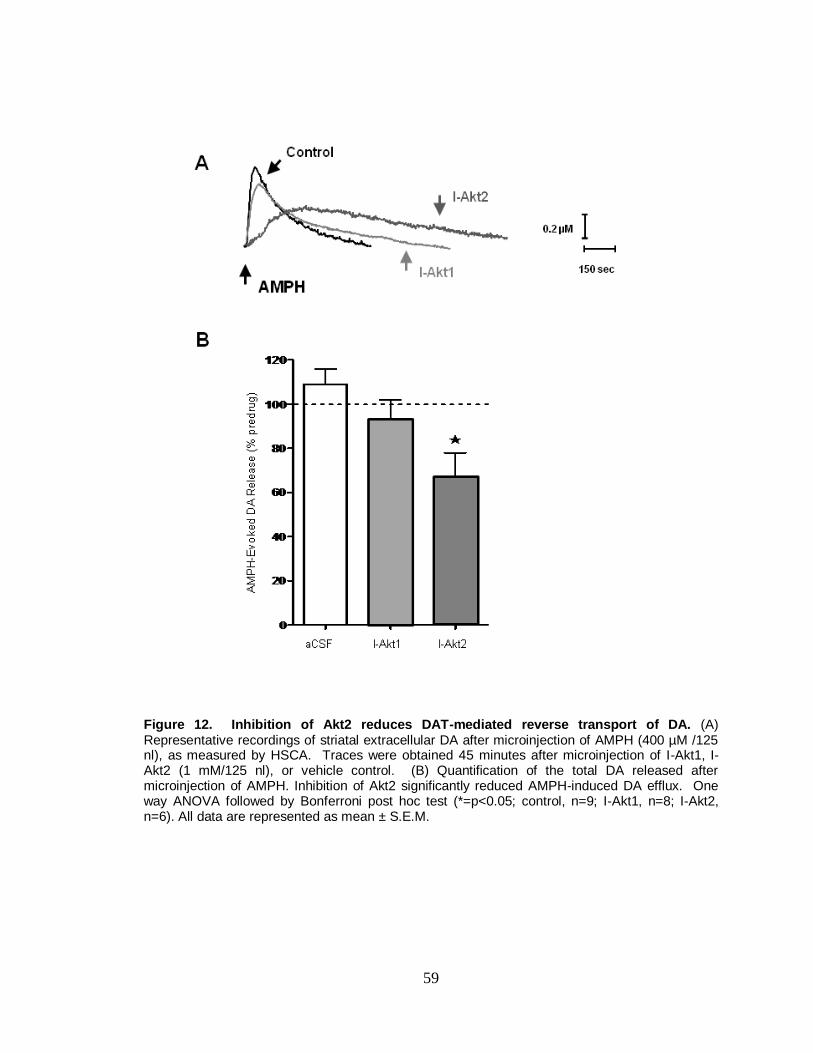
59
Figure 12. Inhibition of Akt2 reduces DAT-mediated reverse transport of DA. (A) Representative recordings of striatal extracellular DA after microinjection of AMPH (400 µM /125 nl), as measured by HSCA. Traces were obtained 45 minutes after microinjection of I-Akt1, I-Akt2 (1 mM/125 nl), or vehicle control. (B) Quantification of the total DA released after microinjection of AMPH. Inhibition of Akt2 significantly reduced AMPH-induced DA efflux. One way ANOVA followed by Bonferroni post hoc test (*=p<0.05; control, n=9; I-Akt1, n=8; I-Akt2, n=6). All data are represented as mean ± S.E.M.

60
Discussion
DA clearance is regulated both by DAT turnover rate and by the number of
active transporters at the plasma membrane (Giros, el Mestikawy et al. 1991).
As a consequence, DAT membrane expression is thought to fine tune DA
homeostasis and dopaminergic signaling (Amara 1996; Blakely, Defelice et al.
2005; Spencer, Biederman et al. 2005). Previously, we have shown that insulin
signaling through Akt regulates DAT cell surface expression, DA clearance, and
the ability of psychostimulants such as amphetamine to target the DAT and
thereby increase extracellular DA levels (Garcia, Wei et al. 2005; Owens, Sevak
et al. 2005; Williams and Galli 2006; Lute, Khoshbouei et al. 2008). Here, we
demonstrate by using selective inhibitors of Akt1 and Akt2 that, in striatum, Akt2
activity regulates DAT trafficking, whereas Akt1 does not.
Akt activation has diverse functions ranging from cell survival and growth
to glucose homeostasis (Cho, Mu et al. 2001; Cho, Thorvaldsen et al. 2001;
Somwar, Kim et al. 2001; Bae, Cho et al. 2003; Yang, Tschopp et al. 2004;
Krizman-Genda, Gonzalez et al. 2005). In order to contribute to such diverse
physiological processes, it is thought that each Akt isoform serves a distinct role.
This hypothesis is postulated from the phenotypes observed in the Akt isoform-
specific knockout mouse models (Cho, Mu et al. 2001; Cho, Thorvaldsen et al.
2001). In particular, Akt2 knockout mice are hyperglycemic and insulin resistant
(Cho, Mu et al. 2001). These observations obtained from knockout models are
consistent with data supporting a pivotal role of Akt2 in the increase of glucose
uptake (Bae, Cho et al. 2003). This insulin-mediated increase in glucose uptake

61
is supported by trafficking of the glucose transporter GLUT4 to the plasma
membrane, an effect shown to be mediated through Akt2, not Akt1 (Bae, Cho et
al. 2003). Although insulin crosses the blood-brain barrier (Banks, Jaspan et al.
1997), neurons use insulin-independent mechanisms to transport glucose.
Insulin receptors (IRs) are found throughout the brain, including DA-rich areas
such as the striatum (Schulingkamp, Pagano et al. 2000). Importantly, abnormal
insulin status has been shown to alter DAT cell surface expression and function
(Patterson, Brot et al. 1998; Owens, Sevak et al. 2005; Williams, Owens et al.
2007; Lute, Khoshbouei et al. 2008). Therefore, it is conceivable that insulin
signaling regulates DAT surface expression by modulating Akt2 activity.
Furthermore, disease states with dysfunctional insulin signaling, such as Type II
Diabetes, could alter Akt2 activity in brain and affect DAT function and DA
homeostasis. Further work is needed to determine the extent that improper
insulin tone is affecting DAT function and DA homeostasis.
Notably, these isoform-specific, allosteric Akt inhibitors exert their effects
by blocking the phosphorylation of Akt itself (Lindsley, Zhao et al. 2005), making
Akt unable to activate downstream targets. Importantly, they do not have
inhibitory activity on other cellular kinases, such as protein kinase A (PKA) or
protein kinase C (PKC) (DeFeo-Jones, Barnett et al. 2005). Previously, these
inhibitors have been used to examine the isoform specificity of increased Akt
activity in tumor cell lines and tissues (DeFeo-Jones, Barnett et al. 2005; Zhao,
Robinson et al. 2008). While each drug stimulates apoptosis, inhibition of both
isoforms by the dual inhibitor I-Akt1/2 was most effective, providing evidence that

62
tumor cell growth is somehow not isoform specific (DeFeo-Jones, Barnett et al.
2005). Conversely, in striatal preparations, we found isoform specificity to Akt
regulation of DAT trafficking, despite the fact that Akt1 is also expressed in
dopaminergic terminals (data not shown).
While the data shown here firmly point to Akt2 as an important regulator of
DAT, only Akt1 and Akt2 were examined. A third isoform, Akt3, is expressed in
the brain and testes (Gonzalez and McGraw 2009). Importantly, the inhibitors
used in this study do not alter Akt3. Previous work demonstrates that Akt3 plays
a role similar to Akt1 in the brain in regulating cell growth and survival, whereas
Akt2 contributes to mediating insulin receptor signaling (Tschopp, Yang et al.
2005; Dummler, Tschopp et al. 2006). The possibility that Akt3 regulates
monoamine transporter trafficking is intriguing and warrants further evaluation in
future studies when a specific inhibitor becomes available.
In summary, our data indicate that basal Akt2 activity is responsible for
maintaining DAT cell surface expression, implicating Akt2 as a key regulator of
DAT function and DA homeostasis. Akt2 is known to be coupled to insulin
receptor activation, further confirming insulin signaling as an important modulator
DAT function and dopaminergic tone.
63
CHAPTER III
DIET-INDUCED CHANGES IN INSULIN SIGNALING REGULATES THE
TRAFFICKING AND FUNCTION OF THE DOPAMINE TRANSPORTER
Introduction
High fat diets and the resulting obesity are known to cause several
changes in the periphery, including insulin resistance, which can lead to Type 2
Diabetes (Kahn, Hull et al. 2006), heart conditions (Hubert, Feinleib et al. 1983),
and depression (Golden, Lazo et al. 2008). Still, the impact of obesity on brain
function is not fully understood. Clinical evidence has shown a correlation
between disorders involving DA dysfunction to dysregulation in insulin signaling
and food intake. Binge eating disorder, for example, is associated with
impairments in DA signaling (Davis, Levitan et al. 2008; Davis, Levitan et al.
2009; Frieling, Romer et al. 2009). Furthermore, patients with Parkinson’s
Disease have been shown to have increased Type 2 Diabetes rates (Sandyk
1993; Morris, Zhang et al. 2008), as do patients with schizophrenia (Mukherjee,
Decina et al. 1996).
Physiological homeostasis of DA signaling in striatum has been linked to
motivation for feeding (Palmiter 2007). Such studies highlight a tight relationship
between insulin and DA signaling in the brain, such as that dysregulation of the
insulin pathway will cause impairment in DA signaling and vice versa. A tight

64
relationship is further supported by the comorbid nature of feeding behaviors
abnormalities with DA signaling dysfunction.
A key element fine tuning DA signaling is DAT (Giros, el Mestikawy et al.
1992; Borowsky, Adham et al.). DAT function is required to clear vesicular
released DA by active reuptake into the presynaptic bouton (Giros, Jaber et al.
1996; Jones, Gainetdinov et al. 1998), thus terminating DA signaling. DA is then
re-packaged into vesicles for release. Thus, changes in DAT function have
profound implications in DA signaling (Gelernter, Kranzler et al. 1994; Spencer,
Biederman et al. 2005). Therefore, is not surprising that both function and
trafficking of the DAT are tightly regulated by several signaling pathways
including PKC, mitogen activated protein kinase (MAPK), and importantly PI3K
(Gonzalez and Robinson 2004; Torres 2006).
It is well documented that a high density of IRs are expressed in DA
regions, including the striatum (Hill, Lesniak et al. 1986; Manzanares, Canton et
al. 1988; Bergstedt and Wieloch 1993; Kar, Chabot et al. 1993; Schulingkamp,
Pagano et al. 2000; Figlewicz, Evans et al. 2003), a brain region enriched in DA
projections and DATs (Pilotte, Sharpe et al. 1994; Ciliax, Heilman et al. 1995;
Ciliax, Drash et al. 1999). IRs signal through PI3K to activate Akt (Taha and Klip
1999; Bondy and Cheng 2004). Inhibition of PI3K decreases surface levels of
DAT, reduces DA function, as well as DA clearance in vivo (Carvelli, Moron et al.
2002; Owens, Sevak et al. 2005; Williams, Owens et al. 2007; Lute, Khoshbouei
et al. 2008). Consistently, inhibition of Akt results in a decrease in both DAT
surface expression and function (Garcia, Wei et al. 2005). AMPH is a well-

65
characterized psychostimulant that elicits its effects by its ability to reverse DAT-
mediated transport of DA, inducing efflux and therefore increasing extracellular
DA levels. Due to the requirement of DAT on the cell surface for this
phenomenon to occur, inhibition of Akt and the consequent reduction in DAT cell
surface expression results in a decrease of AMPH-induced DA efflux (Garcia,
Wei et al. 2005).
Interestingly, the isoforms of Akt appear to serve distinct functions. Akt
has three isoforms; Akt1 and Akt2 are ubiquitously expressed where as Akt3 is
found only in the brain and testes (Dummler, Tschopp et al. 2006). Many studies
have linked dysfunctions in Akt1 signaling to the underlying mechanisms of
schizophrenia (Emamian, Hall et al. 2004; Schwab, Hoefgen et al. 2005;
Bajestan, Sabouri et al. 2006). As shown in Chapter II, Akt2 is the isoform
responsible for regulating DAT cell surface expression. Importantly, several DA
related disorders have been linked to insulin dysfunction, including schizophrenia
(Mukherjee, Decina et al. 1996). Therefore, defining the isoform involved in
regulation of DAT in a state of insulin signaling dysfunction may help to further
define the role of insulin signaling in brain diseases such as schizophrenia.
Knockout studies have shown that Akt1 is primarily associated with cell survival
and growth (Cho, Thorvaldsen et al. 2001). Consistently, Akt3 appears to
function similarly for survival and growth in the brain (Tschopp, Yang et al. 2005).
In contrast, Akt2 has been associated with glucose homeostasis and insulin
signaling, including regulation of the glucose transporter (Cho, Mu et al. 2001;
Bae, Cho et al. 2003).

66
In vitro insulin treatment causes an increase in DAT on the surface and an
increase in DA uptake (Carvelli et al., 2002). In vivo, studies have tried to
address the functional regulation of DAT by depleting circulating insulin with
administration of STZ, a drug that is toxic to the insulin producing pancreatic β
cells. These animals have reduced striatal levels of p-Akt, and decreased DAT
surface expression and AMPH-induced efflux (Williams, Owens et al. 2007).
Consistently, food restriction, a manipulation that also results in hypoinsulinemia,
causes a reduction in DA uptake in rat striatal synaptosomes (Patterson et al.,
1998). These studies suggest that changes in insulin status such as diabetes or
obesity could affect DAT membrane expression by impairing Akt function.
Obesity and insulin resistance are highly prevalent in the United States
(Mokdad, Bowman et al. 2001). In western nations, it is estimated that as much
as 25% of the population is considered obese, and high fat diets are known to
result in insulin resistance (Wisse, Kim et al. 2007). In this pre-diabetic state, the
body maintains proper glucose levels by increasing insulin production as cells
become resistant due to increasing adiposity, resulting in euglycemia and
hyperinsulinemia (Schwartz and Porte 2005). This state is also known to result
in reduced p-Akt (active) levels (De Souza, Araujo et al. 2005; Posey, Clegg et
al. 2009). Therefore, we sought to explore whether a high fat diet could affect
DAT trafficking and function. This is particularly relevant, considering that DA
homeostasis supports food intake (Palmiter 2007) and possibly regulates feeding
behaviors including motivation for food seeking.
67
Considering that DA is involved in behaviors from cognition to movement
to motivation for food, this work may shed light on the comorbid aspects of
obesity and DA related diseases.
Methods
Diet induced obesity (DIO) model. Male Sprague-Dawley rats were
ordered from Charles River (Indianapolis, Indiana) at a body weight range of 275-
300 g. Upon arrival to the vivarium rats were individually housed in a facility kept
on a 12-hour light cycle and were given standard rodent chow and water ad
libidum. In the first phase of DIO, rats were given a control diet consisting of 10%
fat (Research Diets, New Brunswick, NJ) for 7 days. After this lead-in period, half
of the rats were switched to an isocaloric, nutrient matched high-fat (HF) diet of
60% fat for 28 more days; the remaining control rats were kept on the control,
low fat (LF) diet for the same amount of time. All experiments were performed in
the morning.
Tissue preparation. Tissue punches from specific brain regions were
collected (dorsal striatum and substantia nigra) and homogenized on ice in buffer
containing 20mM Tris (pH 7.5), 150 mM NaCl, 1 mM EDTA, 1% Triton X-100, 2.5
mM sodium pyrophosphate, 1 mM b-glycerolphosphate, 1 mM Na3VO4, 1 lg/ml
leupeptin and 1 mM PMSF, then spun at 13000xg for 30 minutes at 4°C. The
supernatant was taken, the protein content was assessed, and analysis was
performed.
68
Brain slice preparation. Methods are as described by (Grueter and
Winder 2005). Briefly, rats were decapitated. The brains were quickly removed
and placed in an ice-cold, low-sodium/high-sucrose dissecting solution.
Hemisected (300 µm) coronal brain slices containing the striatum were prepared
on a vibratome. Slices were allowed to recover in a submerged holding chamber
(37°C) containing oxygenated (95% O2, 5% CO2) artificial cerebrospinal fluid
(aCSF) that contained the following (in mM): 124 NaCl, 4.4 KCl, 2.5 CaCl2, 1.3
MgSO4, 1 NaH2PO4, 10 glucose, and 26 NaHCO3 for a recovery period of 60 min
before beginning experiments. If treated with Akt inhibitors, slices were
incubated with 12 µM (I-Akt1 and I-Akt2), 5 µM (I-Akt ½) in aCSF, or aCSF
containing the vehicle DMSO for one hour at 37 degrees. Biotinylation assays
were then performed.
Biotinylation assays. For slice assays, hemisected slices (300 µm) were
made as described above and transferred to multiwell submerged chambers
containing oxygenated aCSF with NHS-SS-Biotin (1 mg/ml) on ice at 4°C and
incubated for 45 minutes, then washed twice for 10 min in aCSF, and finally
incubated in aCSF containing glycine (100mM) for two 20 min periods. Slices
were then placed onto dishes on dry ice and the striatum was removed and
placed into eppendorf tubes. Tissue punches were homogenized in ice-cold
homogenization buffer (1% Triton, 2 mM sodium orthovanadate, 2 mM sodium
fluoride, 25 mM HEPES, 150 mM NaCl, 10 µg/ml aprotinin, and 10 µg/ml
leupeptin, and 100 µM phenylmethylsulfonyl fluoride) and centrifuged for 30 min
at 1000 x g at 4°C. Protein levels were obtained, and equal amounts were taken

69
and added to strepavidin beads with pulldown buffer (0.1 % Triton, 25 mM
HEPES, 150 mM NaCl, 2 mM sodium orthovanadate, 2 mM sodium fluoride, 10
µg/ml aprotinin, and 10 µg/ml leupeptin, and 100 µM phenylmethylsulfonyl
fluoride) and incubated overnight at 4°C. Samples were then washed, eluted,
and western analysis was carried out.
Immunostaining. For western blotting, determination of immunoreactivity
was conducted according to previously described methods (Garcia, Wei et al.
2005; Williams, Owens et al. 2007). Briefly, tissue samples were separated by
SDS-PAGE, and resolved proteins were transferred to polyvinylidene difluoride
(PVDF) membranes (BioRad), which were incubated for 1 hr in blocking buffer
(5% BSA and 0.1% Tween20 in Tris-buffered saline). The blots were then
incubated with primary antibody overnight at 4°C. The primary antibodies used
are as follows: Akt (1:1000; Cell Signaling Technology; Danvers, MA), Akt1
(1:1000; Cell Signaling Technology; Danvers, MA), phospho-Akt (Thr308)
(1:1000; Cell Signaling Technology; Danvers, MA), Akt2 (1:1000; Santa Cruz
Biotechnology; Santa Cruz, CA), Na/K ATPase (1:450; Dr. Fambrough, Johns
Hopkins University; Baltimore, MD), and CamKII (1:2000; Affinity BioReagents;
Rockford, IL), IRS2 (1:1000; Upstate Technologies; Billerica, MA). For rat DAT
(rDAT) immunostaining, mouse monoclonal primary antibodies were used
(antibody 16, 1:1000; (Gaffaney and Vaughan 2004). All proteins were detected
using HRP conjugated secondary antibodies (1:5000; Santa Cruz Biotechnology,
Santa Cruz, CA). After chemiluminescent visualization (ECL-Plus; Amersham;

70
Piscataway, NJ) on Hyper-film ECL film (Amersham), protein band densities
were quantified (Scion Image; Frederick, MD) and normalized to control.
Assay of Akt Activity. Akt activity assays were performed as described
previously. Tissue was lysed for 45 min at 4 degrees in a buffer containing
20mM Tris (pH 7.5), 150 mM NaCl, 1 mM EDTA, 1% Triton X-100, 2.5 mM
sodium pyrophosphate, 1 mM b-glycerolphosphate, 1 mM Na3VO4, 1 lg/ml
leupeptin and 1 mM PMSF. Lysed proteins (400 ug) underwent
immunoprecipitation with an Akt-specific monoclonal antibody as part of a
commercially available Akt activity assay kit (BioVision, Mountain View, CA).
Activity of the immunoprecipitated Akt was determined in vitro with the addition of
recombinant GSK3α a the kinase substrate; the resulting phosphorylated was
determined by immunoblotting using phosphospecific antibodies to GSK3α
(Ser21, diluted 1:1000), provided in the kit.
Immunohistochemistry. For tissue staining, slices were prepared as
described above and subsequently fixed with PBS Ca2+/Mg2+,/4%
paraformaldehyde, washed three times with PBS Ca2+/Mg2+, permeabilized and
blocked with PBS Ca2+/Mg2+/4% bovine serum albumin (BSA)/0.15% Tween-20,
and immunostained with the appropriate antibody dissolved in PBS 4%,
BSA/0.05%, Tween-20/0.05%. Primary antibodies used for immunoblotting were
used here at the following concentrations: Akt2 at 1:200 and DAT at 1:400
overnight at 4°C. For immunohistochemistry experiments to confirm viral
injections, rats were perfused with 4% paraformaldehyde in PBS and the intact
brains were removed, postfixed for 24 hours, then put into PBS with 20% sucrose

71
overnight, and then sectioned and processed according to previously published
protocols (Russo, Bolanos et al. 2007). Briefly, sections were incubated in
blocking buffer (containing BSA) and then with rabbit antibody to GFP (1:5000;
Abcam Inc.; Cambridge, MA) and rat tyrosine hydroxylase (1:500; Chemicon;
Billerica, MA). After incubation with secondary fluorophores,
immunofluorescence was imaged using a Perkin Elmer UltraView confocal with a
Nikon Eclipse 2000-U microscope equipped with a 60X lens with an N.A. of 1.49.
Image processing was performed using Image J and Adobe Photoshop.
Locomotor activity. Locomotor activity was assessed by placing the rat in
a 26 × 61 × 23 cm high plexiglass chamber located within sound-attenuating
cubicles. Horizontal activity was measured with four pairs of infrared photobeams
positioned 4 cm above the floor of the chamber. Each beam was placed 15 cm
away from the next immediate photobeam and the two extreme photobeams
were located 8 cm away from the floor sides. An hour baseline was recorded,
animals were given amphetamine (1.78 mg/kg) by I.P. injection, and placed
immediately back into the chambers to continue recording for 60 minutes. The
data was collected in 5 minute periods over each 60 minute test.
HSCA. HSCA was conducted using the FAST-12 system (Quanteon;
http://www.quanteon.cc) as previously described with some modification (Owens
et al., 2005; Williams et al., 2007). Recording electrode/micropipette assemblies
were constructed using a single carbon-fiber (30 lm diameter; Specialty
Materials; Tulsa, OK), which was sealed inside fused silica tubing (Schott, North
America; Elmsford, NY). The exposed tip of the carbon fiber (150 μm in length)

72
was coated with 5% Nafion (Aldrich Chemical Co., St. Louis, MO; 3–4 coats
baked at 200 ˚C for 5 min per coat) to provide a 1000-fold selectivity of DA over
its metabolite dihydroxyphenylacetic acid (DOPAC). Under these conditions,
microelectrodes displayed linear amperometric responses to 0.5–10 μM DA
during in vitro calibration in 100 mM phosphate-buffered saline (pH 7.4). Animals
were anesthetized with injections of urethane (850 mg/kg, i.p.) and α-chloralose
(85 mg/kg, i.p.), fitted with an endotracheal tube to facilitate breathing, and
placed into a stereotaxic frame (David Kopf Instruments; Tujunga, CA). To locally
deliver test compounds (see below) close to the recording site, a glass single or
multi-barrel micropipette (FHC; Bowdion, ME) was positioned adjacent to the
microelectrode using sticky wax (Moyco; Montgomeryville, AL). The center-to-
center distance between the microelectrode and the micropipette ejector was 300
μm. The electrode/micropipette assembly was lowered into the striatum at the
following coordinates (in mm from bregma [68]): A/P +1.5; M/L, +/- 2.2; D/V, -3.5
to -5.5. The application of drug solutions was accomplished using a Picospritzer
II (General Valve Corporation; Fairfield, NJ) in an ejection volume of 100–150 nl
(5–25 psi for 0.25–3 s). After ejection of test agents, there is an estimated 10–
200-fold dilution caused by diffusion through the extracellular matrix. To record
the efflux and clearance of DA at the active electrode, oxidation potentials—
consisting of 100-ms pulses of 550 mV, each separated by a 1-s interval during
which the resting potential was maintained at 0 mV—were applied with respect to
an Ag/AgCl reference electrode implanted into the contralateral superficial cortex.
Oxidation and reduction currents were digitally integrated during the last 80 ms of
73
each 100-ms voltage pulse. For each recording session, DA was identified by its
reduction/oxidation current ratio: 0.55–0.80. At the conclusion of each
experiment, an electrolytic lesion was made to mark the placement of the
recording electrode tip. Rats were then decapitated while still anesthetized, and
their brains were removed, frozen on dry ice, and stored at -80˚C until sectioned
(20 μm) for histological verification of electrode location within the striatum.
HSCA data were analyzed with GraphPad Prism.
Viral Injections. At day 25 of the diet, rats were anesthetized with
isoflurane inhalation and given 0.5 ul bilateral microinjections of HSV vectors
encoding GFP (as a control), or wild-type IRS2 over 5 min into the substantia
nigra (A/P -5.3, M/L +/- 2.0, D/L -7.8, measured from bregma). After a 5 minute
pause, the needle was slowly withdrawn over 5 minutes. Biochemical and
behavioral assays were performed as described above 3 days after surgery.
Results
Diet-induced obesity results in reduced Akt activity in striatum and
substantia nigra. We hypothesized that insulin resistance would also lead to
decreased DAT surface expression. To test this hypothesis we induced obesity
and insulin resistance by high-fat feeding in rats (diet-induced obesity (DIO) (De
Souza, Araujo et al. 2005; Posey, Clegg et al. 2009). Rats were fed a 60% lard-
based high-fat diet (HF) for 28 days and controls fed a micro-nutrient matched
10% low-fat diet (LF). Throughout the 28 day period, HF animals consumed
significantly more calories than LF animals (Fig. 13A; 3001 ± 134.3 cal. vs. 2633

74
± 95.65 cal, *=p<0.05 by Student’s t-test). Also, HF animals gained significantly
more weight than LF animals (Fig. 13B; 187.0 ± 9.63 g vs. 160.8 ± 5.38 g,
*=p<0.05 by Student’s t-test). Importantly, while blood glucose levels were not
significantly different in the HF versus LF animals (Fig. 14A), plasma insulin
levels were significantly elevated in the HF animals, indicating the presence of
insulin resistance (Fig. 14B). Furthermore, levels of tyrosine hydroxylase (TH)
and dopamine were found to be similar between LF and HF groups (Fig. 15 and
Fig. 16).
Akt is activated by phosphorylation at threonine 308 in response to insulin.
Therefore, Akt phosphorylation is commonly utilized as a marker of insulin action
(Luque et al., 2006). To confirm that the DIO model resulted in impaired Akt
phosphorylation, we assessed phosphorylated Akt (p-Akt) at position 308 in
striatal extracts by western blot. HF feeding resulted in reduction of p-Akt to 57 ±
9% of LF animals (Fig. 17A; *=p<0.01 by Student’s t-test). Similar results were
obtained in the substantia nigra, where the HF feeding decreased Akt
phosphorylation to 69 ± 5% of LF animals (Fig. 17B; *=p<0.05 by Student’s t-
test). Importantly, total Akt levels were unaffected by DIO. To further confirm a
decrease in active Akt, we performed Akt activity assays. For this, Akt was
immunoprecipitated from striatal tissue of LF and HF animals. A substrate of Akt,
glycogen synthase kinase 3 (Gsk-3) was then added and phosphorylation of the
substrate was assessed as a measurement of Akt activity in each preparation.
DIO led to a decrease in Akt activity, as measured by p-Gsk-3 (Fig. 18, *=p<0.05
by Student’s t-test, n=4), further confirming a reduction in active Akt in HF rats.

75
To assess the isoform specificity of the observed decreases in active Akt
in the HF animals, immunoprecipitations were performed to pull down specific
Akt isoforms, and then probed for phosphorylation. In the HF animals, there was
a significant reduction in p-Akt2 with respect to LF animals (Fig. 19A; *=p<0.05,
by Student’s t-test), while no significant changes in the level of p-Akt1 were
observed (Fig. 19B). As a control, each isoform was immunoprecipitated and
then probed for Akt1 or Akt2. Figure 19C demonstrates the specificity of the
immunoprecipitations.
HF feeding reduces DAT cell surface expression. Because HF feeding
impairs Akt2 activation in the striatum, we next determined whether DIO induces
a decrease in DAT cell surface expression using biotinylation assays on striatal
slices. Fig. 18A shows representative immunoblots of both biotinylated (surface)
and total fraction obtained from either HF or LF animals. As a control, for non-
specific membrane protein trafficking, we also determined surface levels of the
Na/K ATPase, a protein found predominantly at the plasma membrane. We
observed a lack of immunoreactivity for Na/K ATPase in the cytosolic fraction,
confirming the specificity of our assay. Quantification by western blot analysis
shows that levels of surface DAT in HF animals were reduced to 73 ± 9% of LF
animals (Fig. 20B, *=p<0.05 by Student’s t-test). This HF feeding-induced
phenomenon was likely due to impaired trafficking since the total levels of DAT
are unchanged (Fig. 20A). Furthermore, since Na/K ATPase surface levels are
unchanged, our data suggest that this DIO-induced trafficking does not target
membrane proteins indiscriminately.

76
Figure 13. High fat feeding results in increased food intake and weight gain. Rats were fed a diet of either 10 % fat (LF) or 60% fat (HF) for 28 days. The HF-fed rats have a significant increase in food intake (A, n=13; *=p<0.05 by Student’s t-test) and weight gain (B, n=13; *=p<0.05 by Student’s t-test). (*=p<0.05 by Student t-test; LF, n=13; HF, n=16). All data are represented as mean ± S.E.M.

77
A
B
Figure 14. High fat feeding results in insulin resistance. Rats were fed a diet of either 10 % fat (LF) or 60% fat (HF) for 28 days. On day 28, blood was collected and plasma glucose and insulin levels were measured. (A) Plasma glucose levels were not significantly different between the two groups. (B) Insulin levels in the HF rats were significantly higher as compared to the LF group (*=p<0.05 by Student t-test; LF, n=13; HF, n=16). All data are represented as mean ± S.E.M.

78
A
B
Low Fat High Fat0
20
40
60
80
100
120
TH
ba
nd
de
ns
ity
(%
of
co
ntr
ol)
Figure 15. Tyrosine hydroxylase levels are unchanged by high fat feeding. Rats were fed a diet of either 10 % fat (LF) or 60% fat (HF) for 28 days. (A) Representative immunoblot of tyrosine hydroxylae (TH) from the striatum of LF and HF animals. (B) Band densities of TH were quantified and are shown as a percentage of control. There is not a significant difference between the two groups (n=3, p>0.05 by Student’s t-test). All data are represented as mean ±
S.E.M.

79
Figure 16. Dopamine (DA) levels in striatum are unchanged by high fat feeding. (B) Dopamine levels were assessed in LF and HF rats on day 28 and no significant difference is seen between the two groups (shown as a percentage of control, n=5, p>0.05 by Student’s t-test). All data are represented as mean ± S.E.M.
Low Fat High Fat0
10
20
30
40
50
60
70
80
90
100
110D
A L
ev
els
(%
of
co
ntr
ol)

80
Importantly, levels of DA were found to be unchanged between HF and LF
animals (Fig. 20A), as well as protein levels of tyrosine hydroxylase, the rate-
limiting enzyme in DA synthesis (Fig. 20B).
HF feeding reduces DA clearance in vivo. DAT activity is affected by the number
of transporters at the cell surface and by their catalytic function. Therefore, the
DIO-induced reduction in DAT surface expression was predicted to lead to a
consequent reduction in DAT activity. We assessed this hypothesis by
determining DA clearance in vivo using HSCA. A calibrated micropipette
positioned adjacent to the recording electrode was lowered into the striatum of
anesthetized rats. DA was applied into the striatum and its clearance measured
over time. Figure 21 shows the kinetic profile for DA clearance. There was no
effect on the signal amplitude or on the rise time (not shown) of the signal
attained for a given amount of exogenously applied DA, which suggests that
there is no change in the rate of diffusion of DA through the extracellular matrix
between the two groups. In contrast, compared to LF rats, HF animals showed a
marked and significant reduction in the rate at which DA was cleared from
extracellular fluid (Fig. 21, p<0.0001 by two-way repeated measures ANOVA,
F4,24=60.83; *=p<0.01, with Bonferroni post-hoc analysis). These data
demonstrate that the decrease observed in the surface expression of DAT results
in a functional decrease in DAT activity in vivo.
HF feeding impairs AMPH-induced locomotion. Alterations in Akt
phosphorylation, thus, lead to changes in surface levels of DAT, as well as DAT
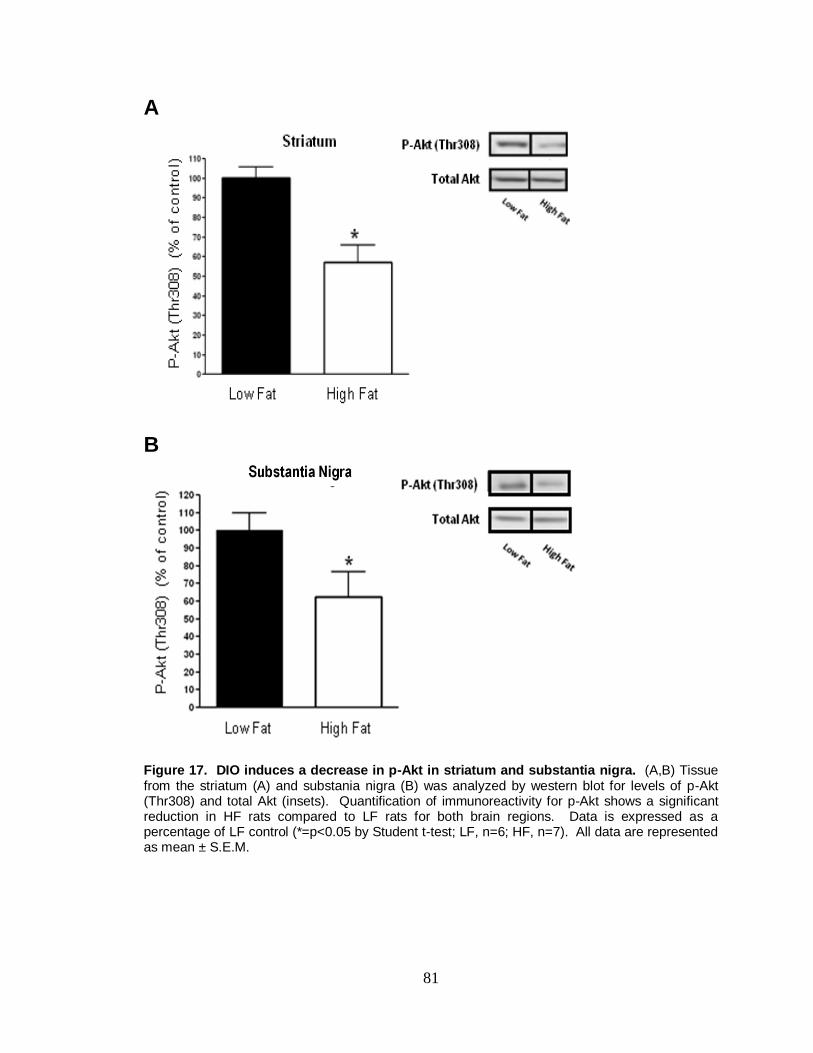
81
A
B
Figure 17. DIO induces a decrease in p-Akt in striatum and substantia nigra. (A,B) Tissue from the striatum (A) and substania nigra (B) was analyzed by western blot for levels of p-Akt (Thr308) and total Akt (insets). Quantification of immunoreactivity for p-Akt shows a significant reduction in HF rats compared to LF rats for both brain regions. Data is expressed as a percentage of LF control (*=p<0.05 by Student t-test; LF, n=6; HF, n=7). All data are represented as mean ± S.E.M.

82
Figure 18. DIO induces a decrease in Akt activity in striatum. Akt activity was measured by the ability of immunoprecpitated Akt from striatal tissue of LF and HF fed animals to phosphorylate the substrate glycogen synthase kinase 3 (Gsk-3) in vitro. Levels of phosphorylated Gsk-3 were analyzed by western blot (insets). Quantification of immunoreactivity for p-Gsk-3 shows a significant reduction in HF rats compared to LF rats. Data is expressed as a percentage of LF control (*=p<0.05 by Student t-test;n=4). All data are represented as mean ± S.E.M.
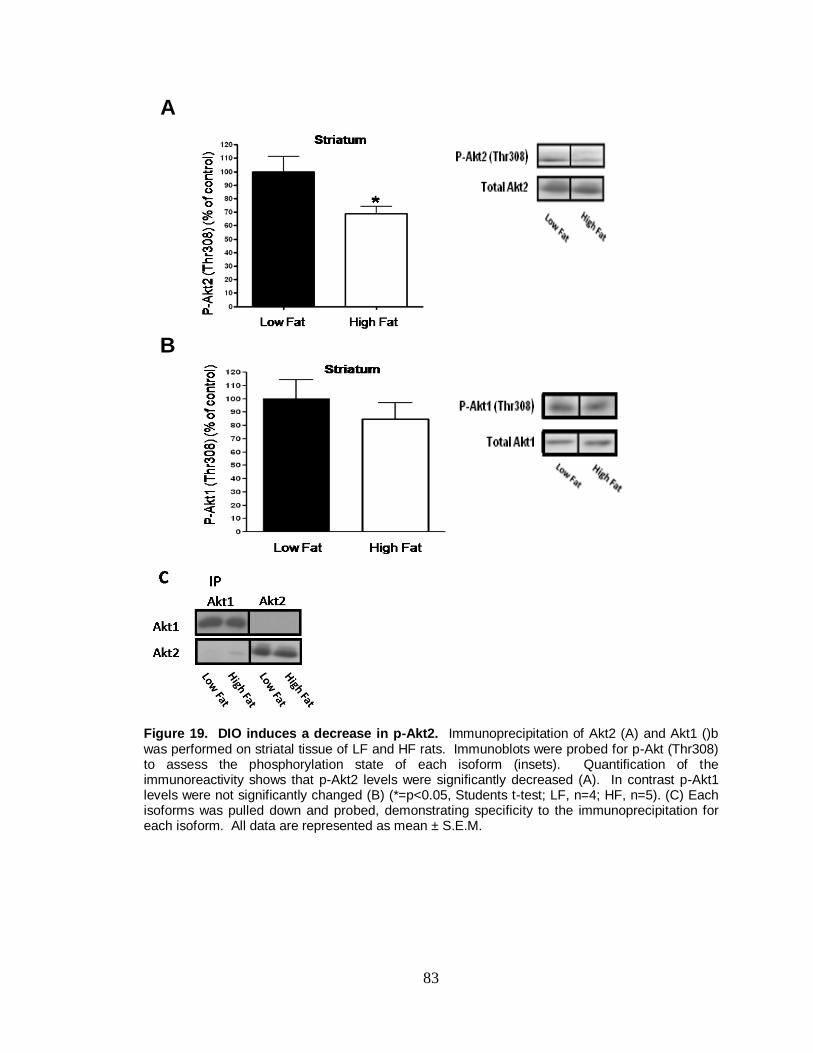
83
A
B
Figure 19. DIO induces a decrease in p-Akt2. Immunoprecipitation of Akt2 (A) and Akt1 ()b was performed on striatal tissue of LF and HF rats. Immunoblots were probed for p-Akt (Thr308) to assess the phosphorylation state of each isoform (insets). Quantification of the immunoreactivity shows that p-Akt2 levels were significantly decreased (A). In contrast p-Akt1 levels were not significantly changed (B) (*=p<0.05, Students t-test; LF, n=4; HF, n=5). (C) Each isoforms was pulled down and probed, demonstrating specificity to the immunoprecipitation for each isoform. All data are represented as mean ± S.E.M.

84
activity. AMPH elicits increased locomotion by causing DA efflux through reverse
transport of DA, mediated by DAT. Therefore, we used AMPH-induced changes
in locomotion to probe functional changes in DAT mediated behavior between LF
and HF rats. Movement was assessed by the number of beam breaks (activity
counts) in a 5 minute period. Figure 21A shows rat locomotor activity over a 90
min time period, wherein AMPH (1.78 mg/kg) was administered by I.P. injection
at time = 60 minutes (arrow). Baseline locomotor activity (between 0 and 60 min)
was unchanged by HF feeding (Fig. 21B). Importantly, after injection of AMPH,
locomotion was increased in both groups, but the total distance traveled was
reduced in HF animals (Fig. 21C, 8618 ± 835.7 vs. 6345 ± 573.0 mean activity
counts, *=p<0.05 by Student’s t-test). These data indicate that DIO reduces
AMPH-induced locomotion, providing additional behavioral evidence that a high-
fat diet impairs DA signaling in striatum. Furthermore, levels of AMPH in the
striatum were found to be the same between LF and HF animals. Animals were
given an I.P. injection of AMPH (1.78 mg/kg) and then tissue was taken at three
different time points, 5, 10, and 20 minutes. The amount of AMPH in the tissue
was similar over time, demonstrating that the ability of AMPH to reach the
striatum between the two groups is not significantly different (Figure 23).
Virally mediated IRS2 expression restores Akt activity in the substantia
nigra. Our data demonstrate that DIO leads to a reduction in DAT surface
expression as a consequence of decreased Akt phosphorylation. To cement this
hypothesis, we employed a viral expression system to increase expression of

85
Figure 20. Dopamine transporter cell surface expression is reduced in striatal slices of HF rat. (A) Representative immunoblots of biotinylated (surface) and total proteins for the dopamine transporter (DAT) obtained from LF and HF rats. As a control we used both surface and cytosolic levels for the Na/K ATPase. Na/K ATPase is found only at the surface and is unchanged across groups. (B) Quantification of rDAT immunoreactivity. rDAT surface levels were normalized to the total amount of rDAT and expressed as a percent of control. The levels of surface rDAT were significantly reduced in HF animals as compared to LF animals (**=p<0.01 by Students t-test, LF, n=4; HF, n=5). Data are represented as mean ± S.E.M.

86
Figure 21. DA clearance rate is reduced in DIO animals. Dopamine (DA) clearance rates obtained by pressure ejecting different concentrations of DA in striatum of anesthetized LF and HF rats. HF rats show a significant reduction in DA clearance as compared to LF rats (*=p < 0.05 by two way repeated measures ANOVA followed by Bonferroni post hoc test, n=4). All data are represented as mean ± S.E.M.

87
IRS2, a cytosolic protein upstream of Akt whose activation increases Akt function
(Gelling, Morton et al. 2006). We injected a herpes simplex virus (HSV)
encoding IRS2 (HSV-IRS2) into the substantia nigra of HF and LF animals, as
well as HSV expressing GFP (HSV-GFP) as a control. This virus has been
characterized previously in dopaminergic regions of the rodent brain (Russo,
Bolanos et al. 2007). Virally mediated GFP expression in the cell bodies of the
nigral dopaminergic neurons and in their terminal projection to the striatum was
confirmed by immunohistochemistry (Fig. 24A). Neurons were labeled after
injection of HSV-GFP GFP with antibody against TH, a marker for dopaminergic
neurons. Figure 24 shows expression of GFP in TH-positive neuronal cell bodies
(top) and nerve endings (bottom). Next we confirmed that injection of HSV-IRS2
restores basal Akt phosphorylation in HF animals. Since IRS2 is upstream of
Akt, we expected that overexpression of IRS2 would restore p-Akt levels in HF
animals, as observed by others (Gelling, Morton et al. 2006). In the HF animals
injected with HSV-IRS2, a significant increase in IRS2 protein level was observed
in the substantia nigra compared to HF animals injected with HSV-GFP (Fig.
25A, *=p<0.05; one way ANOVA followed by Bonferroni post hoc test).
Importantly, IRS2 overexpression reversed the impairment in basal Akt
phosphorylation seen between HF and LF rats (Fig. 25B). Although IRS2
expression did not increase p-Akt levels in the LF animals, it was able to
significantly increase p-Akt level in the HF animals as compared to HF animals
injected with HSV-GFP (*=p<0.05, one way Anova followed by Bonferroni post
hoc test).
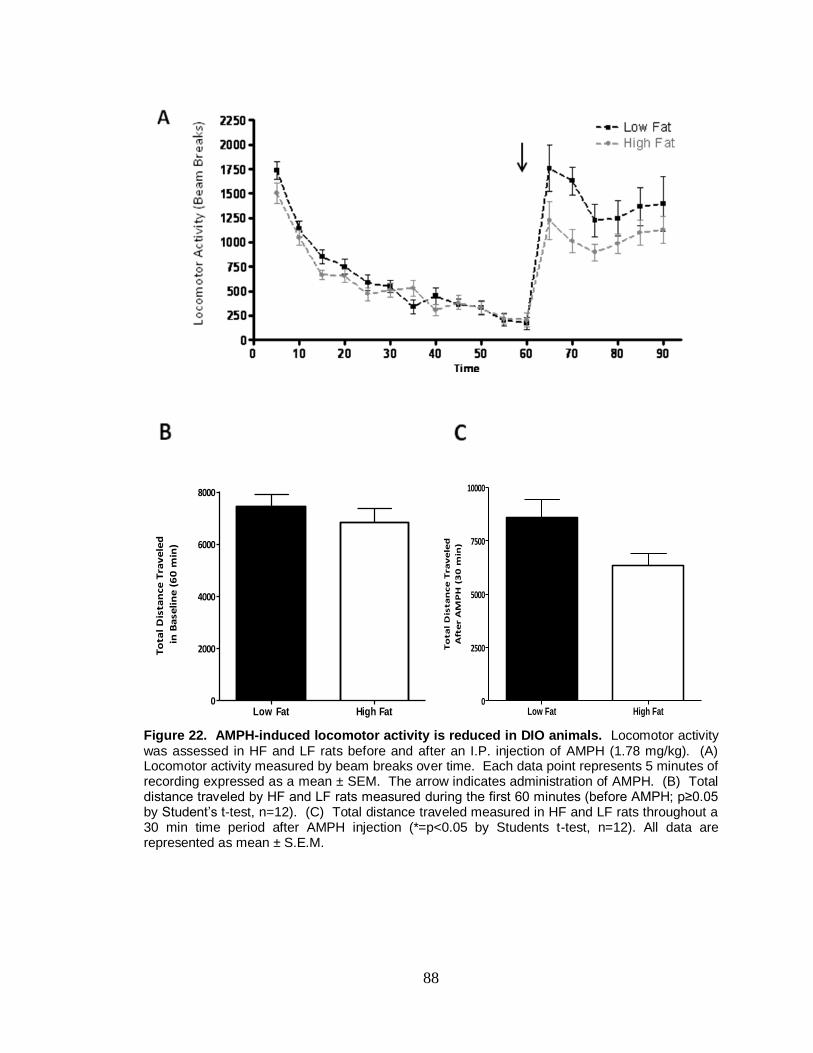
88
Figure 22. AMPH-induced locomotor activity is reduced in DIO animals. Locomotor activity was assessed in HF and LF rats before and after an I.P. injection of AMPH (1.78 mg/kg). (A) Locomotor activity measured by beam breaks over time. Each data point represents 5 minutes of recording expressed as a mean ± SEM. The arrow indicates administration of AMPH. (B) Total distance traveled by HF and LF rats measured during the first 60 minutes (before AMPH; p≥0.05 by Student’s t-test, n=12). (C) Total distance traveled measured in HF and LF rats throughout a 30 min time period after AMPH injection (*=p<0.05 by Students t-test, n=12). All data are represented as mean ± S.E.M.
Low Fat High Fat0
2000
4000
6000
8000
To
tal
Dis
tan
ce
Tra
ve
led
in
Ba
se
lin
e (
60
min
)
Low Fat High Fat0
2500
5000
7500
10000
To
tal
Dis
tan
ce
Tra
ve
led
Aft
er
AM
PH
(3
0 m
in)

89
0 5 10 15 20 250.15
0.25
0.35
0.45Low Fat
High Fat
Minutes after Injection
Am
ph
(n
Mo
l/m
g p
rote
in)
Figure 23. AMPH levels in striatum after I.P. injection of AMPH remain the same between LF and HF fed rats. AMPH levels were assessed at different time point in the striatum of LF and HF rats after an I.P. injection of AMPH (1.78 mg/kg). There was not a significant difference between the two groups (n=3 for each time point). All data are represented as mean ± S.E.M.
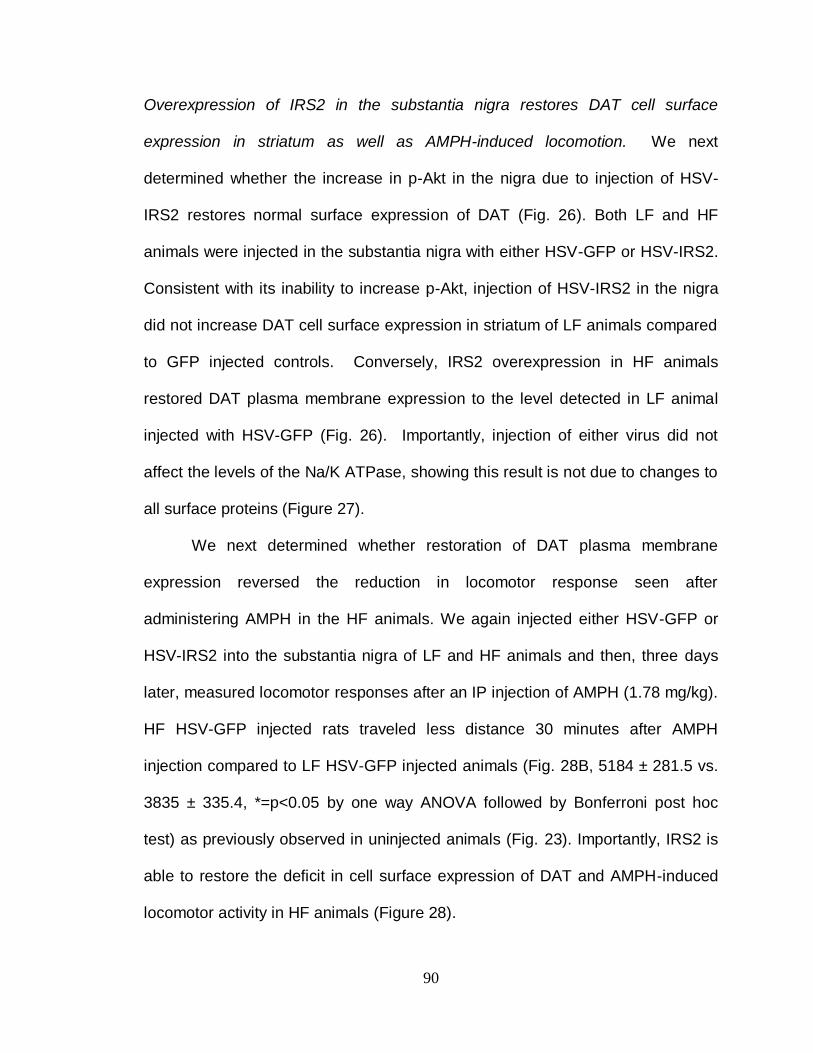
90
Overexpression of IRS2 in the substantia nigra restores DAT cell surface
expression in striatum as well as AMPH-induced locomotion. We next
determined whether the increase in p-Akt in the nigra due to injection of HSV-
IRS2 restores normal surface expression of DAT (Fig. 26). Both LF and HF
animals were injected in the substantia nigra with either HSV-GFP or HSV-IRS2.
Consistent with its inability to increase p-Akt, injection of HSV-IRS2 in the nigra
did not increase DAT cell surface expression in striatum of LF animals compared
to GFP injected controls. Conversely, IRS2 overexpression in HF animals
restored DAT plasma membrane expression to the level detected in LF animal
injected with HSV-GFP (Fig. 26). Importantly, injection of either virus did not
affect the levels of the Na/K ATPase, showing this result is not due to changes to
all surface proteins (Figure 27).
We next determined whether restoration of DAT plasma membrane
expression reversed the reduction in locomotor response seen after
administering AMPH in the HF animals. We again injected either HSV-GFP or
HSV-IRS2 into the substantia nigra of LF and HF animals and then, three days
later, measured locomotor responses after an IP injection of AMPH (1.78 mg/kg).
HF HSV-GFP injected rats traveled less distance 30 minutes after AMPH
injection compared to LF HSV-GFP injected animals (Fig. 28B, 5184 ± 281.5 vs.
3835 ± 335.4, *=p<0.05 by one way ANOVA followed by Bonferroni post hoc
test) as previously observed in uninjected animals (Fig. 23). Importantly, IRS2 is
able to restore the deficit in cell surface expression of DAT and AMPH-induced
locomotor activity in HF animals (Figure 28).
91
Figure 24. Viral-mediated expression of HSV-GFP. (A) DA neurons from the substantia nigra and projection terminals in the striatum were stained for TH immunoreactivity after injection of HSV-GFP into the nigra. (scale bars, 20 uM, top panel; 12 uM, bottom panel). Injection coordinates were A/P +5.3, M/L+/- 2.0, D/V -7.8. All coordinated measured from the top of the skull at bregma.

92
A B
Figure 25. Viral-mediated expression of IRS2 in DIO rats restores p-Akt levels. (A) Representative immunoblot (inset) and quantification of IRS2 levels in the substania nigra after injection of HSV-IRS2 (*=p<0.05 by one way ANOVA followed by Bonferroni post hoc test; n=4). (B) Representative immunoblot (inset) and quantification of p-Akt (Thr308) levels in the substania nigra after injection of HSV-IRS2. Injection of HSV-IRS2 significantly increases p-Akt levels in HF rats (*=p < 0.05 by one way ANOVA followed by Bonferroni post hoc test; LF, n=3; HF, n=4). All data are represented as mean ± S.E.M.
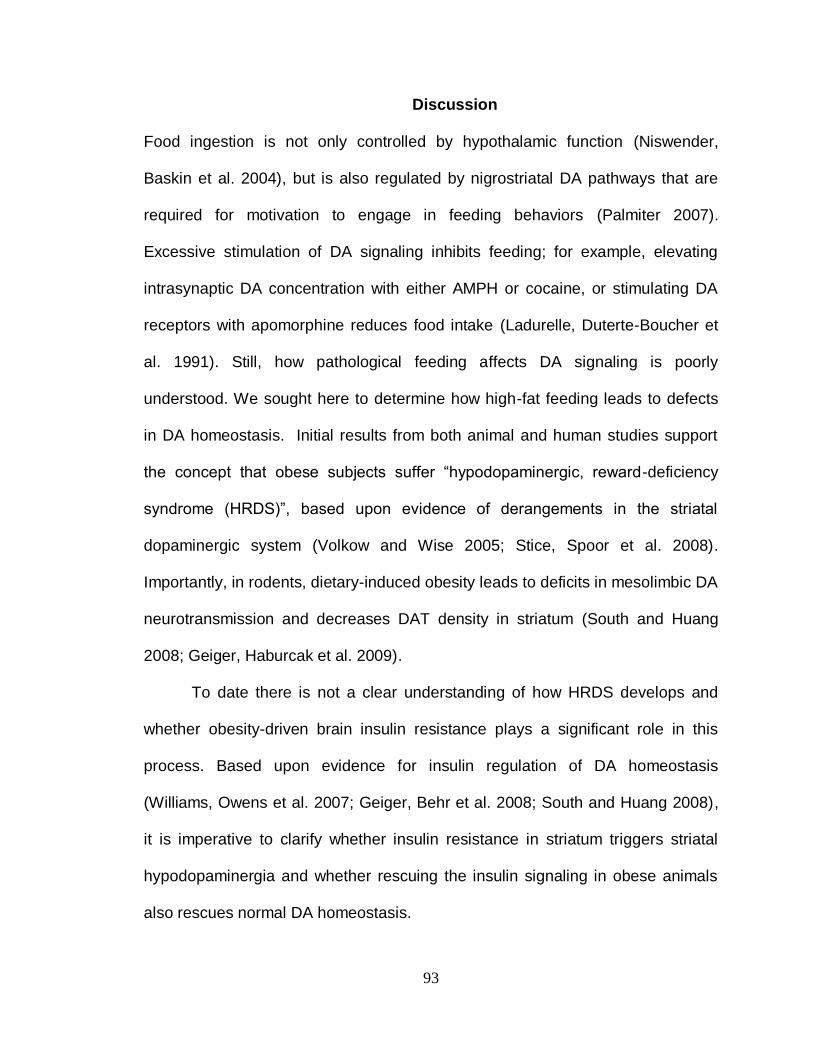
93
Discussion
Food ingestion is not only controlled by hypothalamic function (Niswender,
Baskin et al. 2004), but is also regulated by nigrostriatal DA pathways that are
required for motivation to engage in feeding behaviors (Palmiter 2007).
Excessive stimulation of DA signaling inhibits feeding; for example, elevating
intrasynaptic DA concentration with either AMPH or cocaine, or stimulating DA
receptors with apomorphine reduces food intake (Ladurelle, Duterte-Boucher et
al. 1991). Still, how pathological feeding affects DA signaling is poorly
understood. We sought here to determine how high-fat feeding leads to defects
in DA homeostasis. Initial results from both animal and human studies support
the concept that obese subjects suffer ―hypodopaminergic, reward-deficiency
syndrome (HRDS)‖, based upon evidence of derangements in the striatal
dopaminergic system (Volkow and Wise 2005; Stice, Spoor et al. 2008).
Importantly, in rodents, dietary-induced obesity leads to deficits in mesolimbic DA
neurotransmission and decreases DAT density in striatum (South and Huang
2008; Geiger, Haburcak et al. 2009).
To date there is not a clear understanding of how HRDS develops and
whether obesity-driven brain insulin resistance plays a significant role in this
process. Based upon evidence for insulin regulation of DA homeostasis
(Williams, Owens et al. 2007; Geiger, Behr et al. 2008; South and Huang 2008),
it is imperative to clarify whether insulin resistance in striatum triggers striatal
hypodopaminergia and whether rescuing the insulin signaling in obese animals
also rescues normal DA homeostasis.

94
Figure 26. Viral-mediated expression of IRS2 restores surface expression of DAT. (A) Representative immunoblots (inset) of biotinylated (surface) and total rDAT obtained from LF and HF rats injected either with HSV-GFP or HSV-IRS2. Quantification of surface levels, normalized to total and expressed as a percentage of control (LF, HSV-GFP injected rats) are shown (*=p < 0.05 by one way ANOVA followed by Bonferroni post hoc test; n=6). All data are represented as mean ± S.E.M.
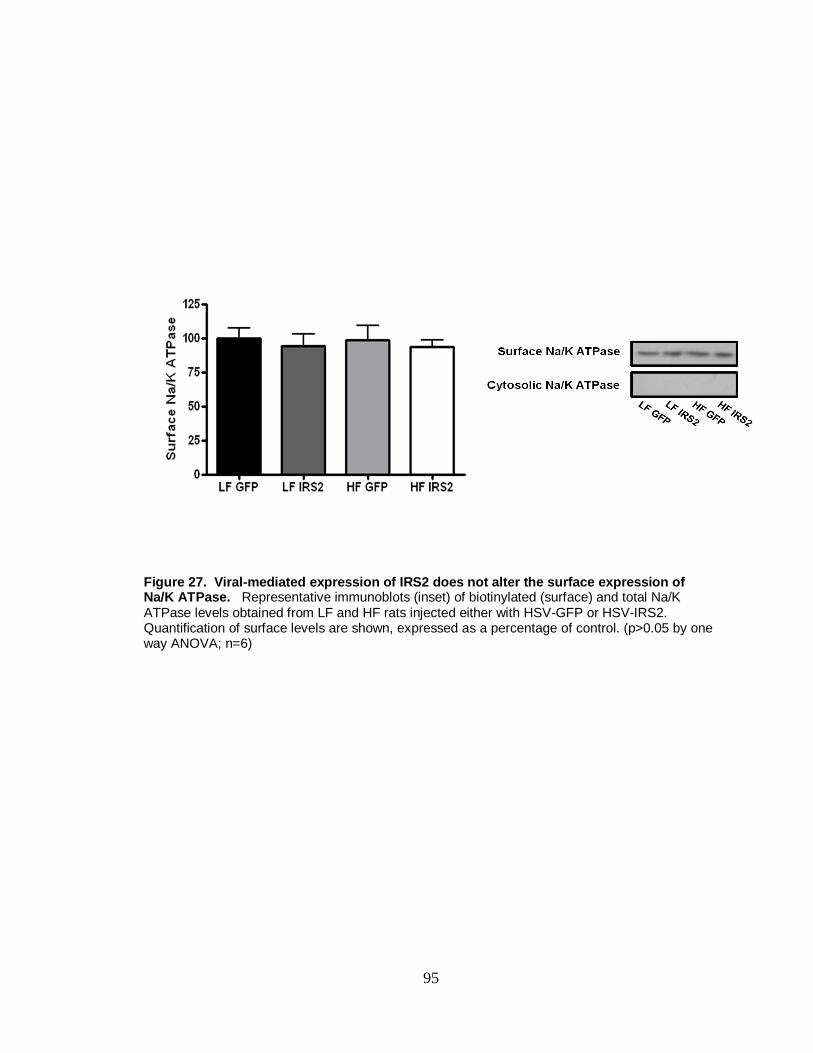
95
Figure 27. Viral-mediated expression of IRS2 does not alter the surface expression of Na/K ATPase. Representative immunoblots (inset) of biotinylated (surface) and total Na/K ATPase levels obtained from LF and HF rats injected either with HSV-GFP or HSV-IRS2. Quantification of surface levels are shown, expressed as a percentage of control. (p>0.05 by one way ANOVA; n=6)

96
A
0 10 20 30 40 50 60 70 80 90100
300
500
700
900
1100
LF GFP
HF GFP
HF IRS2
Time
Loco
mo
tor
Act
ivit
y (B
ea
m B
rea
ks)
B
Figure 28. Viral-mediated expression of IRS2 restores surface expression of DAT and AMPH-induced locomotor activity in DIO rats. (A) Locomotor activity measured by beam breaks over time, with AMPH (arrow) given at 60 minutes (I.P., 1.78 mg/kg) to HF rats injected either with HSV-IRS2 (HF IRS2) or HSV-GFP (HF GFP) and LF rats injected with HSV-GFP (LF GFP). (B) Total distance traveled throughout a 30 min time period after injection of AMPH in HF IRS2, HF GFP and LF GFP (*=p<0.05 by one way ANOVA followed by Bonferroni post hoc test; LF GFP, n=13; HF GFP, n=12; HF IRS2, n=13). All data are represented as mean ± S.E.M.

97
The two main DA projections to the striatum originate from either the
substantia nigra to the dorsal striatum, or from the ventral tegmental area to the
ventral striatum. The ventral striatum does not underlie the primary motivation
for feeding, since disruption of DA signaling in the nucleus accumbens does not
impair food intake (Salamone, Correa et al. 2005; Palmiter 2008). This notion is
further support by studies demonstrating that DA synthesis in dorsal striatum, in
contrast to the ventral striatum, is essential for feeding (Cannon, Abdallah et al.
2004; Palmiter 2008). Thus, we focused our attention to whether the
development of obesity impairs DA signaling in the nigrostriatal system and
whether this dysregulation can be triggered by acquired dietary-induced brain
insulin resistance. Here, we show that high-fat feeding decreases cell surface
expression of a key element of DA homeostasis, namely, DAT. This decrease in
DAT cell surface expression could therefore lead to a reduction in striatal DA
clearance and mechanistically contribute to HRDS. Further work into changes in
DA signaling in the nigrostriatal system during the development of obesity will be
required uncover the role this signaling pathway plays in feeding and identify
possible drug targets for pharmacotherapies of obesity.
The insulin signaling pathway, via Akt, regulates DAT trafficking to and
from the plasma membrane as well as DAT-mediated DA clearance (Carvelli,
Moron et al. 2002; Owens, Sevak et al. 2005; Williams, Owens et al. 2007).
High-fat feeding and/or obesity leads to changes in insulin signaling (Edelman
1998; Clegg, Benoit et al. 2005; Posey, Clegg et al. 2009), including defects in
Akt activation. After 28 days of high-fat feeding we found a reduction in

98
phosphorylation of Akt, at position Thr308, concomitant to the reduction in DAT
plasma membrane expression. Importantly, we extended this observation by
examining whether DIO impairs Akt phosphorylation in an isoform specific
manner and observed specific defects in striatal Akt2 phosphorylation.
It is compelling then, given past work linking insulin signaling to DAT
surface expression (Carvelli, Moron et al. 2002; Garcia, Wei et al. 2005; Williams,
Owens et al. 2007), that inhibition of Akt2, not Akt1, affects levels of DAT at the
plasma membrane. Since inhibition of Akt2 reduces the ability of AMPH to cause
DA efflux in vivo, as measured by chronoamperometry, Akt2-mediated DAT
trafficking, therefore, supports changes in DAT function and possibly DA
homeostasis. Because AMPH relies on DAT-mediated reverse transport of DA in
order to cause its behavioral effects, we sought to extend these findings to
determine whether DIO affects AMPH-induced hyperlocomotion: indeed DIO
leads to a significant reduction in AMPH-induced locomotion, further supporting
the notion that DIO impairs DAT function.
In order to solidify the hypothesis that high-fat feeding causes decreases
in striatal DAT cell surface expression by impairing Akt phosphorylation/activity
we sought next to determine whether genetic rescue of insulin signaling also
rescues DAT expression/trafficking in DIO animals. Overexpression of a viral
vector expressing IRS-2, a kinase upstream of Akt, in substantia nigra increased
phosphorylation of Akt in the DIO animals to a level comparable to that of low-fat
fed control animals. The substantia nigra has DA projections to the dorsal
striatum. Concomitant with rescue of Akt phosphorylation, IRS-2 gene therapy
99
also restored DAT cell surface expression in the dorsal striatum of DIO animals
to the level observed on LF controls. Consistent with our functional model,
normalization of DAT cell surface expression normalized the ability of AMPH to
induce locomotion.
Thus, our work demonstrates that 4 weeks of a high-fat diet is sufficient to
impair striatal DA clearance as well as the ability of AMPH to cause DA efflux
and locomotion and this functional alteration is mediated by impaired activation of
Akt isoform 2. Our results further suggest that high-fat feeding decreases DAT
cell surface expression by inducing brain insulin resistance. As the role of DA
signaling in feeding behavior begins to be revealed, a higher resolution
understanding of alterations in DA systems by high-fat diets may yield insight into
comorbid neuropsychiatric disorders and/or novel obesity therapeutic targets.
100
CHAPTER IV
GENERAL DISCUSSION, IMPLICATIONS, AND FUTURE DIRECTIONS
DA signaling plays an important role in mood, reward, behavior, and motor
function. Imbalances in dopaminergic signaling are thought to underlie various
psychiatric disorders, including Parkinson’s disease, bipolar disorder,
schizophrenia, drug abuse and ADHD (Wise 1998; Horschitz, Hummerich et al.
2005; Kienast and Heinz 2006; Volkow, Wang et al. 2007; Davis, Levitan et al.
2008; Koob and Le Moal 2008). DAT plays a critical role in dopaminergic
signaling by taking up DA released into the synapse back into the presynaptic
terminal (Borowsky, Adham et al. 2001). Importantly, DA signaling is influenced
by several signals, including peptides that are well known for their role in
regulating food intake and metabolism, such as insulin. Dysregulated insulin
signaling and diabetes is seen in patients with DA-related disorders (Mukherjee,
Decina et al. 1996; Dixon, Weiden et al. 2000; van Winkel, De Hert et al. 2008).
Therefore, it is not surprising that researchers are discovering that insulin plays a
role in regulating DA homeostasis. As a role for insulin in regulating DA-related
behaviors begins to be revealed, understanding on a molecular level how
peptides related to food intake, such as insulin, affect DA systems is needed.
Therefore this dissertation: 1) further defines components of the insulin signaling
pathway that alter DAT cell surface expression and 2) examines diet-induced
molecular changes to insulin signaling and DAT function in the nigrostriatal

101
pathway. With obesity and diabetes rising in occurrence, further studies into how
changes in insulin tone affect dopaminergic systems are warranted.
Obesity and Diabetes
According to the Center for Disease Control, obesity is quickly becoming
an epidemic in our nation, with rates of obesity increasing markedly over the past
20 years (Flegal, Carroll et al. 2010). More than half of Americans are either
overweight or obese, as defined by a BMI above 24 or 30, respectively (Mokdad,
Bowman et al. 2001). Perhaps even more startling is the increase of obesity in
children and adolescents. Approximately 31% of children, age 2-18, have a BMI
above the 85th percentile for their age, sex, and height (Ogden, Carroll et al.
2010). Furthermore, these increases are leading to a financial burden to the
health care system. It is estimated that there has been a 36% increase in
spending on obesity and obesity related disorders (Finkelstein, Fiebelkorn et al.
2003). This trend is quite alarming, given the association between obesity and
many chronic diseases, including type 2 diabetes, cardiovascular disease,
several types of cancer, musculoskeletal disorders, sleep apnea, and gallbladder
disease (Must, Spadano et al. 1999; Visscher and Seidell 2001).
Whereas obesity and diabetes mellitus continue to increase in occurrence,
the understanding of how these conditions affect the brain is only beginning to be
uncovered. Americans over consume foods, and often these are high fat foods.
Several ideas were put forth that the signaling of insulin, and other hormones
relating to food consumption such as leptin, were not just important to the
102
periphery, but also in the brain. It has been well established that these peptides
signal to the hypothalamus, which helps balance our body’s rate of energy
expenditure to the amount of food we have consumed. Dysfunction here has
been hypothesized to account for obesity, and surely does play a role. However,
this view alone is too simplistic. Often individuals will eat when full, and the
motivation for food and the pleasure of eating is believed to be an important
component in feeding behavior. In fact, fMRI studies have shown activity in the
areas of our brain known to be involved in pleasure and reward, which involve
DA as a neurotransmitter, are activated as we eat something palatable (Stice,
Spoor et al. 2008). Increased DA turnover and release occur in the nucleus
accumbens and the dorsal striatum in response to feeding (Yoshida, Yokoo et al.
1992). As discussed, DA has been shown to have a role in motivation for food
and the pleasure we feel from eating, but this role is not yet well understood.
Interestingly, diabetes and obesity occur in patients with diseases involving DA
dysfunction (Sandyk 1993; Morris, Zhang et al. 2008). This overlap implies an
important interplay between the two systems. Insulin receptors are expressed in
DA rich areas, including the substantia nigra, the VTA, and the striatum
(Figlewicz, Evans et al. 2003). Therefore, it is plausible that insulin signaling in
DA regions helps to regulate our feeding behavior. In order to understand
overconsumption of food and obesity, it is critical to understand at a molecular
level how metabolic signaling molecules such as insulin regulate DA
homeostasis, and how this, as a whole, regulates food intake.

103
DA signaling comprises several components, all which provide an
opportunity for regulation. Proper dopaminergic tone is dependent upon several
factors, including the amount of DA synthesized, vesicular release of DA, DRs on
the post synaptic cell, and termination of the signal by uptake of DA through
DAT. PET imaging studies have demonstrated an inverse relationship between
BMI and DAT binding in human subjects (Chen, Yang et al. 2008), pointing to
alterations in the surface expression of DAT in obese subjects. The work in this
dissertation focuses on the alterations in DAT cell surface expression after a 4
week period on a 60% high fat diet. Prior work has demonstrated that improper
insulin signaling can modify DAT function (Owens, Sevak et al. 2005; Williams,
Owens et al. 2007). These studies used an animal model of insulin depletion by
injecting STZ, a drug that is toxic to the insulin producing β-cells in the pancreas.
After treatment, these animals had a reduction in DAT function, shown by a
reduction in DA clearance and AMPH-induced DA efflux as well as striatal Akt
activity. Therefore, we hypothesize that insulin signals through Akt to maintain
DAT on the cell surface, thereby regulating DAT function and DA transmission.
In this dissertation, this hypothesis was tested using a Diet Induced
Obesity (DIO) model where rats were given a 60% high fat diet for 28 days.
Control animals were kept on a 10% fat diet, which contains the same amount of
fat as rat laboratory chow, but is also nutrient matched with the high fat diet. The
data collected demonstrate that consuming a high fat diet alters insulin signaling,
namely phosphorylation of Akt, in the nigrostriatal system. It also results in a
reduction in DAT cell surface expression, DA clearance, and AMPH-induced

104
hyperlocomotion. Importantly, restoration of Akt signaling by overexpression of
IRS-2 by viral injection restores DAT to the cell surface. This work indicates that
insulin is signaling through Akt to regulate DAT function, demonstrating insulin
regulation of DA neurotransmission.
To help identify how insulin modulates DAT function, it is important to
define the pathway insulin signals through to regulate DAT cell surface
expression. Studies examining PI3K and Akt, two important components of this
pathway, show that they regulate the cell surface expression of DAT (Carvelli,
Moron et al. 2002; Garcia, Wei et al. 2005; Lute, Khoshbouei et al. 2008). Here,
the isoform specificity of Akt in regulating DAT was explored, which was possible
due to the development of isoform specific inhibitors of Akt. Prior to this work, it
was unknown if Akt regulation of DAT was primarily due to activation of insulin,
being that Akt is stimulated by a variety of signals and controls several cellular
processes in addition to serving as a mediator of insulin signaling, Akt signaling
supports survival and cell growth (Hanada, Feng et al. 2004). Interestingly, the
isoforms of Akt appear to serve distinct roles. It is known that Akt2 is the isoform
responsible for mediating insulin signaling (Cho, Mu et al. 2001). In contrast,
Akt1 is thought to govern signaling for growth and cell survival (Cho, Thorvaldsen
et al. 2001). Therefore, establishing that Akt2 is the isoform of Akt regulating
DAT helps to further define that insulin itself is mediating DAT function. In fact,
Akt2 inhibition alone was sufficient to reduce DAT cell surface expression in the
striatum, as well as inhibit AMPH-induced efflux. Therefore, this work supports

105
the hypothesis that insulin is an important mediator of DAT cell surface
expression via PI3K and Akt2.
Previously, studies used these inhibitors to try and identify an isoform-
specific target for tumor cells (DeFeo-Jones, Barnett et al. 2005). Rapid cellular
growth is often characterized with high levels of active Akt, and researchers
looked to define the isoform of Akt responsible in hopes to be able to define a
pharmacological target for halting tumor growth without affecting the other
important roles of Akt. However, they found that neither isoform was solely
responsible, but only inhibition of both forms reduced tumor growth (DeFeo-
Jones, Barnett et al. 2005). In contrast, here we did identify isoform specificity to
a biological process. We found inhibition of Akt2 alone, not Akt1, can alter a
component of DA signaling, specifically by reducing DAT cell surface expression.
Alterations in DAT cell surface expression affect its function, allowing DA to
remain in the synapse and enhance DA neurotransmission, thereby affecting
dopaminergic tone. As such, this data displaying isoform specificity to DAT
trafficking is particularly interesting for it is the first work using these inhibitors to
demonstrate Akt isoform specificity. Furthermore, it allows for an isoform-specific
pharmacological target for altering DAT function, which may be useful in treating
diseases of DA dysfunction. For example, DA neurotransmission could be
modulated by inhibiting Akt2, resulting in a decrease of DAT function. Knowing
the specific isoform to target would prevent potential unwanted outcomes of
inhibiting all isoforms of Akt. Perhaps defining a specific Akt isoform responsible
in tumor growth was not possible because several processes are altered in this

106
state of cellular dysfunction, and therefore biological functions such as cell
growth are greatly skewed. As such, extreme situations of DA dysfunction may
also lead to differential regulation of DAT by Akt, and therefore further study is
warranted before treatment of a disease.
Alternative Interpretations
High fat feeding and DIO. Here we examine alterations to DAT, a critical
component in DA homeostasis, after 28 days on a high fat diet. We report that
high fat feeding causes alterations to Akt phosphorylation and DAT cell surface
expression. It is important to note that prior work using high fat diets
demonstrates several changes throughout the body (Montague 2003; De Souza,
Araujo et al. 2005; Posey, Clegg et al. 2009). Furthermore, alterations from high
fat diets continue to be defined. Several studies have examined changes to
components of DA neurotransmission in response to alterations in diet. For
example, Geiger and colleagues utilized animals with either obesity-prone or
obesity-resistant phenotypes to examine differences in dopamine release
between the two groups. In this model, obesity-prone rats were hyperphagic and
had a 20% higher body weight than the obesity-resistant rats. Using slice
preparations from these animals, they found that electrically evoked DA release
was significantly reduced in obesity-prone rats in the dorsal striatum, along with
other DA regions such as the ventral striatum and prefrontal cortex, suggesting
that there may be a widespread dysfunction in mechanisms regulating dopamine
release (Geiger, Behr et al. 2008). Unlike the work in this dissertation, the model

107
of obesity used by the investigators in this study did not alter the type of diet.
However, their data demonstrates alterations in stimulated release in an obese
state. Therefore, it is possible that there are alterations to DA release upon
stimulation in the DIO model as well. If so, such changes could influence the
modifications we show in DAT cell surface expression and are an important
consideration for future studies.
Another important consideration is the role of diet changes and obesity on
DRs. For example, it is possible that the reduction in active Akt is affecting the
presynaptic D2R, which has been shown to associate with DAT and affect its
function (Lee, Pei et al. 2007). Therefore, Akt may be affecting the receptor first,
and the effects seen on the transporter may be indirect. A recent study examined
changes to D2R in the striatum in another model of obesity, which they refer to
as a ―cafeteria-style‖ diet. Johnson and Kenny fed animals several forms of ―junk
food‖ to model a typical poor diet that results in obesity. They found that striatal
levels of the D2R were signficantly reduced in the animals fed a ―cafeteria-style‖
diet compared to control animals (Johnson and Kenny 2010). However, D2Rs
are found both pre- and postsynaptically, and the authors did not examine which
population was altered. Still, modulation of either population could affect DAT
cell surface expression and function, whether directly or indirectly. Therefore,
changes to D2R are another important consideration for interpretation.
Pharmacological manipulations. The data in this dissertation indicate that
Akt2 is responsible for sustaining DAT cell surface expression. These
experiments made use of pharmacological inhibitors of Akt1 and Akt2. It is
108
important to note that treatment with these drugs affects all cells in the striatum,
not only DA neurons. Therefore, it is possible that isoform-specific inhibition of
Akt in other neuronal populations in the striatum could be the primary change,
and changes to DAT cell surface expression may be secondary. Experiments
utilizing a preparation that enriches for DA terminals would be useful to confirm
that it is indeed alterations to active Akt2 in DA neurons responsible for changes
in DAT cell surface expression.
Viral intervention with wild type IRS2. We clearly show that expression of
wild type IRS2 in the substantia nigra leads to an increase in phosphorylated Akt
and DAT cell surface expression, as well as changes to AMPH-induced
locomotion. However, it is important to note that these data could have
alternative interpretations. Viral expression in the substantia nigra could directly
alter presynaptic components of DA neurotransmission, such as vesicular
release, DA production, or changes to presynaptic DRs. In addition to
modulation of DA signaling components, viral expression of IRS2 could alter
receptors important to the excitability of the neuron itself. For example, it is
possible that the surface expression of other proteins is modulated as well. To
test this possibility, experiments looking for changes in other membrane bound
receptors important to excitability, for example AMPA receptors, would be useful
to determine if IRS2 injection is altering important components to
neurotransmission beyond DAT.

109
Future Directions
Downstream effectors of Akt regulating DAT cell surface expression. With
Akt2 identified as an important component in regulation of DAT cell surface
expression, further work is now needed in determining what is downstream of
Akt2 activation in order to alter DAT trafficking. This exact process is still
unknown. Several kinases downstream of Akt2 have been identified (Frame and
Cohen 2001; Kramer, Witczak et al. 2006; Thong, Bilan et al. 2007; Wieman,
Wofford et al. 2007), allowing for several candidates for an intermediate between
Akt2 and DAT. However, one model of transporter trafficking by insulin activation
leads to a hypothesis for a similar model for regulation of DAT trafficking. The
glucose transporter 4 (GLUT4) cell surface expression is mediated by insulin
signaling via Akt2 (Sano, Kane et al. 2003). Prior studies demonstrate that
adipocytes from Akt2 null animals had a decrease of GLUT4 at the cell surface,
as well as decreased insulin-stimulated glucose uptake (Bae, Cho et al. 2003).
Rescue of Akt2 by viral expression restored GLUT4 surface expression, while
viral expression of Akt1 had no effect (Bae, Cho et al. 2003). Therefore, GLUT4
cell surface expression is mediated through Akt2. Importantly, this specificity is
also demonstrated in this dissertation with Akt regulation of DAT. This allows for
a potential model to identify molecules downstream of Akt2 that are responsible
for DAT trafficking, particularly because one such molecule has been identified in
GLUT4 trafficking. AS160 is a GTPase activating protein that catalyzes the
inactivation of several Rab proteins (Kane, Sano et al. 2002). These proteins are
known to be important in the translocation of molecules throughout the cell,
110
including inter-membrane trafficking (Gonzalez and McGraw 2009). Interestingly,
AS160 is known to regulate GLUT4 cell surface expression, leading to the
possibility that it may function in a similar manner to regulate the trafficking of
DAT. For example, knockdown of AS160 by RNAi expression increases the
basal levels of GLUT4 on the cell surface in adipocytes (Eguez, Lee et al. 2005).
Importantly, inhibition of AS160 is dependent on phosphorylation by Akt (Bae,
Cho et al. 2003; Thong, Bilan et al. 2007). In fact, GLUT4 increases in cell
surface expression by activation of Akt2 have been shown to be reliant on the
subsequent inhibition of AS160 (Eguez, Lee et al. 2005). This indicates that Akt2
activation leads to AS160 inhibition, supporting GLUT4 on the cell surface. DAT
cell surface expression has been shown to be regulated in a similar manner, via
insulin and Akt2. Therefore, AS160 should be targeted as a possible
downstream effector of insulin receptor and Akt2 activation, resulting in
modulation of DAT cell surface expression. Experiments testing whether
inhibition or overexpression of AS160 alters DAT cell surface expression and DA
uptake could examine this hypothesis. Furthermore, it would be interesting to
determine whether the effects seen by inhibition of Akt2 on DAT cell surface
expression require AS160.
This work defining Akt2 in the regulation of DAT cell surface expression
helped to further define the role of insulin signaling in DA systems. The work in
this dissertation also examined the effects of improper insulin signaling by using
a model of obesity and insulin resistance; the DIO model. Importantly, the levels
of active Akt2 in the striatum of DIO animals were reduced, whereas active Akt1

111
was unchanged. Further work examining changes to targets downstream of Akt2
in DIO animals would help to define the effecter proteins contributing to the
changes seen with improper insulin signaling to DAT. If AS160 is involved in
DAT trafficking, it would be expected that its phosphorylation is increased in HF
fed animals compared to LF fed control animals, allowing it to remain active.
Using viral techniques similar to those used with IRS-2, expression of dominant
negative AS160 could reduce active AS160 and maintain DAT on the cell surface
in HF rats. Conversely, overexpression of AS160 in LF animals should produce
an effect similar to that seen in HF animals, with DAT reduced on the cell
surface.
Although AS160 is an interesting candidate for regulation of DAT
trafficking, it is important to note that there are many downstream effectors of
Akt2 that could be regulating DAT trafficking. For instance, glycogen synthase
kinase 3 (GSK3) is a kinase targeted by Akt. GSK3 is probably most well known
for its role in activating glycogen synthase, which occurs when GSK3 is inhibited
by Akt, allowing for the formation of glycogen upon insulin stimulation (Cohen,
Alessi et al. 1997). Phosphorylation by Akt of either GSK3α at serine-21 or
GSK3β at serine-9 promotes inhibition of GSK3 activity (Cohen, Alessi et al.
1997; Frame and Cohen 2001). GSK3 signaling has been shown to regulate the
plasma membrane expression of the glucose transporter-1 (GLUT1) (Wieman,
Wofford et al. 2007), integrins (Roberts, Woods et al. 2004), and the megalin
receptor (Yuseff, Farfan et al. 2007). Therefore, as with AS160, it would be
interesting to test whether GSK3 modulates DAT cell surface expression and

112
function. Also similar to AS160, activation of Akt inhibits GSK3 activity (Cohen,
Alessi et al. 1997). Therefore, experiments similar to those described above for
AS160 could test for the involvement of GSK3 in the regulation of the transporter.
Alterations to GSK3 have been noted in schizophrenia (Emamian, Hall et al.
2004), a disease of DA dysfunction that has been linked to polymorphisms to
Akt1 (Emamian, Hall et al. 2004; Bajestan, Sabouri et al. 2006; Ikeda, Iwata et al.
2006). In fact, GSK3 is the target of the drug lithium, a well-known treatment for
another DA-related disease, Bipolar disorder. The relation of GSK3 signaling to
diseases of DA dysfunction makes a possible interaction between DAT and
GSK3 very intriguing. Evidence collected so far support regulation of GSK3 by
Akt1, due to the changes seen in schizophrenic patients (Emamian, Hall et al.
2004), however this is far from conclusive and only an observation of a disease
state. Much work remains to be done to establish the isoform specificity to Akt
regulation of GSK3 in brain, and therefore the potential regulation of DAT
function. AS160 and GSK3, as well as all effector proteins of Akt, should be
explored as possible candidates for insulin regulation of DAT cell surface
expression. Identification of the exact components of the pathway that insulin
acts through to modify DAT function would provide a better understanding of how
Akt regulates DA systems.
Alterations to DAT and interacting proteins. Another important component
in understanding how insulin signaling affects DAT cell surface expression is to
examine if the post-translational modifications and interacting proteins of the
transporter is itself, and how they are altered with inhibition of Akt2 or in the DIO
113
model. For example, much work has been done examining the phosphorylation
of DAT in response to activation of PKC, a well known regulator of DAT cell
surface expression. PKC activators such as phorbol 12-myristate 13-acetate
(PMA) and protein phosphatase inhibitors such as okadaic acid (OA) have been
shown to induce DAT endocytosis and reduce transporter Vmax (Daniels and
Amara 1999; Melikian and Buckley 1999; Doolen and Zahniser 2001). Initial
models suggested that this PKC-dependent downregulation of DAT activity is
primarily due to the intracellular accumulation of the transporter (Zhang, Coffey et
al. 1997; Zhu, Kavanaugh et al. 1997; Pristupa, McConkey et al. 1998; Daniels
and Amara 1999; Melikian and Buckley 1999; Chang, Lee et al. 2001; Granas,
Ferrer et al. 2003; Loder and Melikian 2003). It has been postulated that PKC
downregulation of DAT is mediated by the phosphorylation of the transporter,
therefore modifications such as phosphorylation could also be possible for insulin
regulation of DAT cell surface expression. When examining the effects of PKC
activation on DAT, direct phosphorylation of N-terminal serines was observed
using 32PO4-labeled DAT (Vaughan, Huff et al. 1997; Foster, Pananusorn et al.
2002). Such experiments looking at the phosphorylation of DAT after Akt2
activation by insulin, or Akt2 inhibition by inhibitors used in this dissertation, could
help to define if DAT itself is phosphorylated in response insulin. Another possibility
is to examine DAT mutants with truncations of the N-terminus or the C-terminus that
are transfected into cell lines, or mutations with alterations to the amino acids that
can be phosphorylated on these termini. One could treat these cells with the Akt2
inhibitor, I-Akt2, and look to see if DAT cell surface expression is reduced, as with

114
wild-type DAT, or not. If there is no change, then the region mutated is important to
Akt2-mediated DAT trafficking. Overall, it is important to determine if post-
translational modifications, such as phosphorylation, to DAT by insulin occur and
determine what region of the transporter is important for insulin-mediated DAT
trafficking. This would help to further define how insulin regulates DAT cell surface
expression, which is critical to understand the interaction between insulin and DA
systems.
Mechanism of DAT trafficking in response to insulin signaling. Decreases
to the surface expression of a protein can occur either by removal from the
plasma membrane, or by prevention of insertion onto the cell surface, or both.
For the former, experiments examining whether certain proteins known to be
involved in internalization, such as clathrin or dynamin, are required for DAT
surface expression changes would be useful. For example, the redistribution of
DAT from the plasma membrane by a member of the insulin signaling pathway,
PI3K, is known to be dynamin dependent (Carvelli, Moron et al. 2002).
Therefore, one would hypothesize that modulation of DAT cell surface
expression by other insulin signaling members, such as Akt2, is also dynamin
dependent, but this remains to be tested. Defining if internalization of DAT is
responsible for DAT surface expression changes, and then understanding how
that internalization is accomplished is important to understand how insulin
signaling regulates DAT cell surface expression. In fact, internalization of DAT is
an extensive area of study, and recent work has indicated it could be dependent
upon the location of DAT on the plasma membrane. This was examined by
115
again looking at PKC-dependent internalization. PKC stimulated trafficking of
DAT is also believed to be dynamin-dependent, as with PI3K, as well as clathrin
mediated (Daniels and Amara 1999; Sorkina, Hoover et al. 2005; Foster, Adkins
et al. 2008). Foster and coworkers demonstrated that a combination of
trafficking and trafficking-independent processes are involved in PKC-dependent
downregulation of DAT activity based upon the location of DAT (Foster, Adkins et
al. 2008). They found that PKC induced loss of cell surface DAT occurs only
from non-raft populations. Conversely, in cholesterol-rich lipid raft microdomains,
PKC activation led to an increase in DAT phosphorylation compared to non-raft
populations, as well as a loss of DAT activity, but there was not a decrease in the
cell surface expression (Foster, Adkins et al. 2008). This study indicates that
non-raft DATs are regulated by trafficking events and that cholesterol-dependent
nontrafficking regulatory mechanisms occur in lipid rafts. Due to the changes
seen in this study in cell surface expression, one would hypothesize that only the
non-raft populations of DAT are regulated by insulin signaling. Experiments
looking at the localization of DATs regulated by insulin similar to those conducted
looking at PKC and DAT would be needed to determine if this is the case.
Understanding the population of DATs that are susceptible to regulation by
insulin would help to further our knowledge on insulin regulation of DAT and DA
systems. By determining the population of DATs on the plasma membrane that
are affected by insulin signaling, therapies that are specific to that population can
be developed. This allows for a more specific target for treatment of diseases
with improper insulin signaling, such as insulin resistance and obesity.

116
With the emerging data indicating a role for insulin signaling in modulation
of DA systems, the list of the detrimental effects of a high fat diet and insulin
resistance grows beyond dysregulation of blood glucose levels. DA signaling is
important for a variety of behaviors and implicated in several diseases, from
schizophrenia, depression, addiction, ADHD, binge eating disorder, and several
others (Wise 1998; Horschitz, Hummerich et al. 2005; Kienast and Heinz 2006;
Volkow, Wang et al. 2007; Davis, Levitan et al. 2008; Koob and Le Moal 2008).
Alterations to DA homeostasis by improper insulin tone, therefore, have
important implications for DA-based behaviors. Here it is shown that a high fat
diet results in a decrease in DAT cell surface expression, DAT function, and
AMPH-induced DA efflux. These changes are rescued with overexpression of a
kinase directly downstream of the insulin receptor, IRS2. Importantly, this
trafficking event is attributed to Akt2 activity, the isoform of Akt known to be
involved in insulin signaling. Overall, the work in this dissertation demonstrates
that insulin signaling via Akt2 is regulating DAT function, and that a high fat diet
leads to improper insulin signaling thereby altering DAT function. However, it is
not fully understood how DA signaling alters feeding behavior. Future studies
aimed at revealing the role of DA systems in feeding behavior, as well as how
alterations in insulin affect this will help to elucidate the co-morbitity of obesity
and DA-related disorders, and hopefully begin to identify treatments.

117
REFERENCES Adams, P. F. and M. A. Marano (1995). "Current estimates from the National
Health Interview Survey, 1994." Vital Health Stat 10(193 Pt 1): 1-260. Amara, S. G. (1996). "Neurotransmitter transporters: new insights into structure,
function and pharmacology." Rev Bras Biol 56 Su 1 Pt 1: 5-19.
Axelrod, J., L. G. Whitby, et al. (1961). "Effect of psychotropic drugs on the uptake of H3-norepinephrine by tissues." Science 133: 383-4. Bae, S. S., H. Cho, et al. (2003). "Isoform-specific regulation of insulin-dependent
glucose uptake by Akt/protein kinase B." J Biol Chem 278(49): 49530-6.
Bajestan, S. N., A. H. Sabouri, et al. (2006). "Association of AKT1 haplotype with
the risk of schizophrenia in Iranian population." Am J Med Genet B Neuropsychiatr Genet 141B(4): 383-6.
Banks, W. A., J. B. Jaspan, et al. (1997). "Transport of insulin across the blood-
brain barrier: saturability at euglycemic doses of insulin." Peptides 18(9): 1423-9.
Banks, W. A., J. B. Jaspan, et al. (1997). "Effect of diabetes mellitus on the
permeability of the blood-brain barrier to insulin." Peptides 18(10): 1577-84.
Banks, W. A., J. B. Jaspan, et al. (1997). "Selective, physiological transport of
insulin across the blood-brain barrier: novel demonstration by species-specific radioimmunoassays." Peptides 18(8): 1257-62.
Banks, W. A. and A. J. Kastin (1998). "Differential permeability of the blood-brain
barrier to two pancreatic peptides: insulin and amylin." Peptides 19(5): 883-9.
Barbeau, A. (1962). "The pathogenesis of Parkinson's disease: a new
hypothesis." Can Med Assoc J 87: 802-7. Baskin, D. G., D. Figlewicz Lattemann, et al. (1999). "Insulin and leptin: dual
adiposity signals to the brain for the regulation of food intake and body weight." Brain Res 848(1-2): 114-23.
Baskin, D. G., L. J. Stein, et al. (1985). "Genetically obese Zucker rats have
abnormally low brain insulin content." Life Sci 36(7): 627-33.

118
Batchelor, M. and J. O. Schenk (1998). "Protein kinase A activity may kinetically upregulate the striatal transporter for dopamine." J Neurosci 18(24):
10304-9. Bauman, A. L., S. Apparsundaram, et al. (2000). "Cocaine and antidepressant-
sensitive biogenic amine transporters exist in regulated complexes with protein phosphatase 2A." J Neurosci 20(20): 7571-8.
Bergstedt, K. and T. Wieloch (1993). "Changes in insulin-like growth factor 1
receptor density after transient cerebral ischemia in the rat. Lack of protection against ischemic brain damage following injection of insulin-like growth factor 1." J Cereb Blood Flow Metab 13(5): 895-8.
Bertler, A. and E. Rosengren (1959). "Occurrence and distribution of dopamine in
brain and other tissues." Experientia 15(1): 10-1. Beuming, T., J. Kniazeff, et al. (2008). "The binding sites for cocaine and
dopamine in the dopamine transporter overlap." Nat Neurosci 11(7): 780-
9. Binda, F., C. Dipace, et al. (2008). "Syntaxin 1A interaction with the dopamine
transporter promotes amphetamine-induced dopamine efflux." Mol Pharmacol 74(4): 1101-8.
Blakely, R. D., L. J. Defelice, et al. (2005). "Biogenic amine neurotransmitter
transporters: just when you thought you knew them." Physiology (Bethesda) 20(4): 225-31.
Bolan, E. A., B. Kivell, et al. (2007). "D2 receptors regulate dopamine transporter
function via an extracellular signal-regulated kinases 1 and 2-dependent and phosphoinositide 3 kinase-independent mechanism." Mol Pharmacol 71(5): 1222-32.
Bondy, C. A. and C. M. Cheng (2004). "Signaling by insulin-like growth factor 1 in
brain." Eur J Pharmacol 490(1-3): 25-31. Borowsky, B., N. Adham, et al. (2001). "Trace amines: identification of a family of
mammalian G protein-coupled receptors." Proc Natl Acad Sci U S A 98(16): 8966-71.
Boudanova, E., D. M. Navaroli, et al. (2008). "Amphetamine-induced decreases
in dopamine transporter surface expression are protein kinase C-independent." Neuropharmacology 54(3): 605-12.
Bouthenet, M. L., E. Souil, et al. (1991). "Localization of dopamine D3 receptor
mRNA in the rat brain using in situ hybridization histochemistry:

119
comparison with dopamine D2 receptor mRNA." Brain Res 564(2): 203-19.
Bruning, J. C., D. Gautam, et al. (2000). "Role of brain insulin receptor in control
of body weight and reproduction." Science 289(5487): 2122-5. Buck, K. J. and S. G. Amara (1994). "Chimeric dopamine-norepinephrine
transporters delineate structural domains influencing selectivity for catecholamines and 1-methyl-4-phenylpyridinium." Proc Natl Acad Sci U S A 91(26): 12584-8.
Cannon, C. M., L. Abdallah, et al. (2004). "Dysregulation of striatal dopamine
signaling by amphetamine inhibits feeding by hungry mice." Neuron 44(3): 509-20.
Carlsson, A., M. Lindqvist, et al. (1958). "On the presence of 3-hydroxytyramine
in brain." Science 127(3296): 471. Carneiro, A. M., S. L. Ingram, et al. (2002). "The multiple LIM domain-containing
adaptor protein Hic-5 synaptically colocalizes and interacts with the dopamine transporter." J Neurosci 22(16): 7045-54.
Carr, K. D. (1996). "Feeding, drug abuse, and the sensitization of reward by
metabolic need." Neurochem Res 21(11): 1455-67.
Carvelli, L., J. A. Moron, et al. (2002). "PI 3-kinase regulation of dopamine
uptake." J Neurochem 81(4): 859-69. Centonze, D., A. Usiello, et al. (2002). "Dopamine D2 receptor-mediated
inhibition of dopaminergic neurons in mice lacking D2L receptors." Neuropsychopharmacology 27(5): 723-6.
Chang, M. Y., S. H. Lee, et al. (2001). "Protein kinase C-mediated functional
regulation of dopamine transporter is not achieved by direct phosphorylation of the dopamine transporter protein." J Neurochem 77(3): 754-61.
Chen, N. and M. E. Reith (2008). "Substrates dissociate dopamine transporter
oligomers." J Neurochem. Chen, P. S., Y. K. Yang, et al. (2008). "Correlation between body mass index and
striatal dopamine transporter availability in healthy volunteers--a SPECT study." Neuroimage 40(1): 275-9.

120
Chen, R., C. A. Furman, et al. (2009). "Protein kinase Cbeta is a critical regulator of dopamine transporter trafficking and regulates the behavioral response to amphetamine in mice." J Pharmacol Exp Ther 328(3): 912-20.
Cho, H., J. Mu, et al. (2001). "Insulin resistance and a diabetes mellitus-like
syndrome in mice lacking the protein kinase Akt2 (PKB beta)." Science 292(5522): 1728-31.
Cho, H., J. L. Thorvaldsen, et al. (2001). "Akt1/PKBalpha is required for normal
growth but dispensable for maintenance of glucose homeostasis in mice." J Biol Chem 276(42): 38349-52.
Ciliax, B. J., G. W. Drash, et al. (1999). "Immunocytochemical localization of the
dopamine transporter in human brain." J Comp Neurol 409(1): 38-56.
Ciliax, B. J., C. Heilman, et al. (1995). "The dopamine transporter:
immunochemical characterization and localization in brain." J Neurosci 15(3 Pt 1): 1714-23.
Clegg, D. J., S. C. Benoit, et al. (2005). "Reduced anorexic effects of insulin in
obesity-prone rats fed a moderate-fat diet." Am J Physiol Regul Integr Comp Physiol 288(4): R981-6.
Cohen, P., D. R. Alessi, et al. (1997). "PDK1, one of the missing links in insulin
signal transduction?" FEBS Lett 410(1): 3-10. Cowell, R. M., L. Kantor, et al. (2000). "Dopamine transporter antagonists block
phorbol ester-induced dopamine release and dopamine transporter phosphorylation in striatal synaptosomes." Eur J Pharmacol 389(1): 59-65.
Daniels, G. M. and S. G. Amara (1999). "Regulated trafficking of the human
dopamine transporter. Clathrin-mediated internalization and lysosomal degradation in response to phorbol esters." J Biol Chem 274(50): 35794-801.
Davis, C., R. D. Levitan, et al. (2008). "Reward sensitivity and the D2 dopamine
receptor gene: A case-control study of binge eating disorder." Prog Neuropsychopharmacol Biol Psychiatry 32(3): 620-8.
Davis, C. A., R. D. Levitan, et al. (2009). "Dopamine for "wanting" and opioids for
"liking": a comparison of obese adults with and without binge eating." Obesity (Silver Spring) 17(6): 1220-5.
Davis, J. F., A. L. Tracy, et al. (2008). "Exposure to elevated levels of dietary fat
attenuates psychostimulant reward and mesolimbic dopamine turnover in the rat." Behav Neurosci 122(6): 1257-63.

121
Daws, L. C., P. D. Callaghan, et al. (2002). "Cocaine increases dopamine uptake and cell surface expression of dopamine transporters." Biochem Biophys Res Commun 290(5): 1545-50.
De Souza, C. T., E. P. Araujo, et al. (2005). "Consumption of a fat-rich diet
activates a proinflammatory response and induces insulin resistance in the hypothalamus." Endocrinology 146(10): 4192-9.
DeFeo-Jones, D., S. F. Barnett, et al. (2005). "Tumor cell sensitization to
apoptotic stimuli by selective inhibition of specific Akt/PKB family members." Mol Cancer Ther 4(2): 271-9.
Dipace, C., U. Sung, et al. (2007). "Amphetamine induces a calcium/calmodulin-
dependent protein kinase II-dependent reduction in norepinephrine transporter surface expression linked to changes in syntaxin 1A/transporter complexes." Mol Pharmacol 71(1): 230-9.
Dixon, L., P. Weiden, et al. (2000). "Prevalence and correlates of diabetes in
national schizophrenia samples." Schizophr Bull 26(4): 903-12. Doolen, S. and N. R. Zahniser (2001). "Protein tyrosine kinase inhibitors alter
human dopamine transporter activity in Xenopus oocytes." J Pharmacol Exp Ther 296(3): 931-8.
Driver, J. A., A. Smith, et al. (2008). "Prospective cohort study of type 2 diabetes
and the risk of Parkinson's disease." Diabetes Care 31(10): 2003-5.
Dummler, B., O. Tschopp, et al. (2006). "Life with a single isoform of Akt: mice
lacking Akt2 and Akt3 are viable but display impaired glucose homeostasis and growth deficiencies." Mol Cell Biol 26(21): 8042-51.
Edelman, S. V. (1998). "Type II diabetes mellitus." Adv Intern Med 43: 449-500.
Eguez, L., A. Lee, et al. (2005). "Full intracellular retention of GLUT4 requires AS160 Rab GTPase activating protein." Cell Metab 2(4): 263-72.
Emamian, E. S., D. Hall, et al. (2004). "Convergent evidence for impaired AKT1-
GSK3beta signaling in schizophrenia." Nat Genet 36(2): 131-7. Fiedorowicz, J. G., N. M. Palagummi, et al. (2008). "Elevated prevalence of
obesity, metabolic syndrome, and cardiovascular risk factors in bipolar disorder." Ann Clin Psychiatry 20(3): 131-7.
Figlewicz, D. P., M. D. Brot, et al. (1996). "Diabetes causes differential changes
in CNS noradrenergic and dopaminergic neurons in the rat: a molecular study." Brain Res 736(1-2): 54-60.

122
Figlewicz, D. P., S. B. Evans, et al. (2003). "Expression of receptors for insulin and leptin in the ventral tegmental area/substantia nigra (VTA/SN) of the rat." Brain Res 964(1): 107-15.
Figlewicz, D. P., T. A. Patterson, et al. (1998). "Dopamine transporter mRNA is
increased in the CNS of Zucker fatty (fa/fa) rats." Brain Res Bull 46(3):
199-202. Figlewicz, D. P., P. Szot, et al. (1994). "Intraventricular insulin increases
dopamine transporter mRNA in rat VTA/substantia nigra." Brain Res 644(2): 331-4.
Finkelstein, E. A., I. C. Fiebelkorn, et al. (2003). "National medical spending
attributable to overweight and obesity: how much, and who's paying?" Health Aff (Millwood) Suppl Web Exclusives: W3-219-26.
Fischer, J. F. and A. K. Cho (1979). "Chemical release of dopamine from striatal
homogenates: evidence for an exchange diffusion model." J Pharmacol Exp Ther 208(2): 203-9.
Fleckenstein, A. E., H. M. Haughey, et al. (1999). "Differential effects of
psychostimulants and related agents on dopaminergic and serotonergic transporter function." Eur J Pharmacol 382(1): 45-9.
Flegal, K. M., M. D. Carroll, et al. (2010). "Prevalence and trends in obesity
among US adults, 1999-2008." Jama 303(3): 235-41.
Fog, J. U., H. Khoshbouei, et al. (2006). "Calmodulin kinase II interacts with the
dopamine transporter C terminus to regulate amphetamine-induced reverse transport." Neuron 51(4): 417-29.
Foster, J. D., S. D. Adkins, et al. (2008). "Phorbol Ester Induced Trafficking-
Independent Regulation and Enhanced Phosphorylation of the Dopamine Transporter Associated with Membrane Rafts and Cholesterol." J Neurochem.
Foster, J. D., B. Pananusorn, et al. (2002). "Dopamine transporters are
phosphorylated on N-terminal serines in rat striatum." J Biol Chem 277(28): 25178-86.
Frame, S. and P. Cohen (2001). "GSK3 takes centre stage more than 20 years
after its discovery." Biochem J 359(Pt 1): 1-16.
Frank, H. J. and W. M. Pardridge (1983). "Insulin binding to brain microvessels."
Adv Metab Disord 10: 291-302.

123
Frieling, H., K. D. Romer, et al. (2009). "Epigenetic dysregulation of dopaminergic genes in eating disorders." Int J Eat Disord.
Furman, C. A., R. Chen, et al. (2009). "Dopamine and amphetamine rapidly
increase dopamine transporter trafficking to the surface: live-cell imaging using total internal reflection fluorescence microscopy." J Neurosci 29(10):
3328-36. Fuxe, K. (1965). "Evidence for the Existence of Monoamine Neurons in the
Central Nervous System. Iv. Distribution of Monoamine Nerve Terminals in the Central Nervous System." Acta Physiol Scand Suppl: SUPPL 247:37+.
Gaffaney, J. D. and R. A. Vaughan (2004). "Uptake inhibitors but not substrates
induce protease resistance in extracellular loop two of the dopamine transporter." Mol Pharmacol 65(3): 692-701.
Gainetdinov, R. R., S. R. Jones, et al. (1999). "Functional hyperdopaminergia in
dopamine transporter knock-out mice." Biol Psychiatry 46(3): 303-11. Galli, A., R. D. Blakely, et al. (1996). "Norepinephrine transporters have channel
modes of conduction." Proc Natl Acad Sci U S A 93(16): 8671-6.
Galli, A., R. D. Blakely, et al. (1998). "Patch-clamp and amperometric recordings
from norepinephrine transporters: channel activity and voltage-dependent uptake." Proc Natl Acad Sci U S A 95(22): 13260-5.
Garcia, B., Y. Wei, et al. (2005). "Akt Is Essential for Insulin Modulation of
Amphetamine- Induced Human Dopamine Transporter Cell Surface Redistribution." Mol Pharmacol.
Garcia, B. G., Y. Wei, et al. (2005). "Akt is essential for insulin modulation of
amphetamine-induced human dopamine transporter cell-surface redistribution." Mol Pharmacol 68(1): 102-9.
Geiger, B. M., G. G. Behr, et al. (2008). "Evidence for defective mesolimbic
dopamine exocytosis in obesity-prone rats." Faseb J 22(8): 2740-6. Geiger, B. M., M. Haburcak, et al. (2009). "Deficits of mesolimbic dopamine
neurotransmission in rat dietary obesity." Neuroscience 159(4): 1193-9.
Gelernter, J., H. R. Kranzler, et al. (1994). "Genetic association between
dopamine transporter protein alleles and cocaine-induced paranoia." Neuropsychopharmacology 11(3): 195-200.

124
Gelling, R. W., G. J. Morton, et al. (2006). "Insulin action in the brain contributes to glucose lowering during insulin treatment of diabetes." Cell Metab 3(1):
67-73. Giros, B. and M. G. Caron (1993). "Molecular characterization of the dopamine
transporter." Trends Pharmacol Sci 14(2): 43-9.
Giros, B., S. el Mestikawy, et al. (1991). "Cloning and functional characterization
of a cocaine-sensitive dopamine transporter." FEBS Lett 295(1-3): 149-54. Giros, B., S. el Mestikawy, et al. (1992). "Cloning, pharmacological
characterization, and chromosome assignment of the human dopamine transporter." Mol Pharmacol 42(3): 383-90.
Giros, B., M. Jaber, et al. (1996). "Hyperlocomotion and indifference to cocaine
and amphetamine in mice lacking the dopamine transporter." Nature 379(6566): 606-12.
Giros, B., Y. M. Wang, et al. (1994). "Delineation of discrete domains for
substrate, cocaine, and tricyclic antidepressant interactions using chimeric dopamine-norepinephrine transporters." J Biol Chem 269(23): 15985-8.
Glowinski, J. and J. Axelrod (1964). "Inhibition of Uptake of Tritiated-
Noradrenaline in the Intact Rat Brain by Imipramine and Structurally Related Compounds." Nature 204: 1318-9.
Golden, S. H., M. Lazo, et al. (2008). "Examining a bidirectional association
between depressive symptoms and diabetes." Jama 299(23): 2751-9.
Gonzalez, E. and T. E. McGraw (2009). "The Akt kinases: isoform specificity in
metabolism and cancer." Cell Cycle 8(16): 2502-8. Gonzalez, M. I. and M. B. Robinson (2004). "Neurotransmitter transporters: why
dance with so many partners?" Curr Opin Pharmacol 4(1): 30-5.
Granas, C., J. Ferrer, et al. (2003). "N-terminal truncation of the dopamine
transporter abolishes phorbol ester- and substance P receptor-stimulated phosphorylation without impairing transporter internalization." J Biol Chem 278(7): 4990-5000.
Greenwood, T. A., M. Alexander, et al. (2001). "Evidence for linkage
disequilibrium between the dopamine transporter and bipolar disorder." Am J Med Genet 105(2): 145-51.
Grueter, B. A. and D. G. Winder (2005). "Group II and III metabotropic glutamate
receptors suppress excitatory synaptic transmission in the dorsolateral

125
bed nucleus of the stria terminalis." Neuropsychopharmacology 30(7): 1302-11.
Gulley, J. M., S. Doolen, et al. (2002). "Brief, repeated exposure to substrates
down-regulates dopamine transporter function in Xenopus oocytes in vitro and rat dorsal striatum in vivo." J Neurochem 83(2): 400-11.
Hanada, M., J. Feng, et al. (2004). "Structure, regulation and function of
PKB/AKT--a major therapeutic target." Biochim Biophys Acta 1697(1-2): 3-16.
Hastrup, H., A. Karlin, et al. (2001). "Symmetrical dimer of the human dopamine
transporter revealed by cross-linking Cys-306 at the extracellular end of the sixth transmembrane segment." Proc Natl Acad Sci U S A 98(18):
10055-60. Hastrup, H., N. Sen, et al. (2003). "The Human Dopamine Transporter Forms a
Tetramer in the Plasma Membrane: Cross-Linking of a Cysteine in the Fourth Transmembrane Segment is Sensitive to Cocaine Analogs." J Biol Chem 278(46): 45045-8.
Havrankova, J., M. Brownstein, et al. (1981). "Insulin and insulin receptors in
rodent brain." Diabetologia 20 Suppl: 268-73. Havrankova, J., J. Roth, et al. (1978). "Insulin receptors are widely distributed in
the central nervous system of the rat." Nature 272(5656): 827-9.
Hill, J. M., M. A. Lesniak, et al. (1986). "Autoradiographic localization of insulin
receptors in rat brain: prominence in olfactory and limbic areas." Neuroscience 17(4): 1127-38.
Horschitz, S., R. Hummerich, et al. (2005). "A dopamine transporter mutation
associated with bipolar affective disorder causes inhibition of transporter cell surface expression." Mol Psychiatry.
Howes, O. D. and S. Kapur (2009). "The dopamine hypothesis of schizophrenia:
version III--the final common pathway." Schizophr Bull 35(3): 549-62. Huang, X. F., Y. Yu, et al. (2005). "Differential expression of dopamine D2 and
D4 receptor and tyrosine hydroxylase mRNA in mice prone, or resistant, to chronic high-fat diet-induced obesity." Brain Res Mol Brain Res 135(1-2): 150-61.
Huang, X. F., K. Zavitsanou, et al. (2006). "Dopamine transporter and D2
receptor binding densities in mice prone or resistant to chronic high fat diet-induced obesity." Behav Brain Res 175(2): 415-9.

126
Hubert, H. B., M. Feinleib, et al. (1983). "Obesity as an independent risk factor for cardiovascular disease: a 26-year follow-up of participants in the Framingham Heart Study." Circulation 67(5): 968-77.
Huff, R. A., R. A. Vaughan, et al. (1997). "Phorbol esters increase dopamine
transporter phosphorylation and decrease transport Vmax." J Neurochem 68(1): 225-32.
Ikeda, M., N. Iwata, et al. (2006). "Positive association of AKT1 haplotype to
Japanese methamphetamine use disorder." Int J Neuropsychopharmacol 9(1): 77-81.
Jardetzky, O. (1966). "Simple allosteric model for membrane pumps." Nature
211(52): 969-70.
Johnson, L. A., C. A. Furman, et al. (2005). "Rapid delivery of the dopamine
transporter to the plasmalemmal membrane upon amphetamine stimulation." Neuropharmacology.
Johnson, L. A., B. Guptaroy, et al. (2005). "Regulation of amphetamine-
stimulated dopamine efflux by protein kinase C beta." J Biol Chem. Johnson, P. M. and P. J. Kenny (2010). "Dopamine D2 receptors in addiction-like
reward dysfunction and compulsive eating in obese rats." Nat Neurosci 13(5): 635-41.
Jones, S. R., R. R. Gainetdinov, et al. (1999). "Loss of autoreceptor functions in
mice lacking the dopamine transporter." Nat Neurosci 2(7): 649-55.
Jones, S. R., R. R. Gainetdinov, et al. (1998). "Profound neuronal plasticity in
response to inactivation of the dopamine transporter." Proc Natl Acad Sci U S A 95(7): 4029-34.
Kahlig, K. M., F. Binda, et al. (2005). "Amphetamine induces dopamine efflux
through a dopamine transporter channel." Proc Natl Acad Sci U S A 102(9): 3495-3500.
Kahlig, K. M., J. A. Javitch, et al. (2004). "Amphetamine regulation of dopamine
transport. Combined measurements of transporter currents and transporter imaging support the endocytosis of an active carrier." J Biol Chem 279(10): 8966-75.
Kahn, S. E., R. L. Hull, et al. (2006). "Mechanisms linking obesity to insulin
resistance and type 2 diabetes." Nature 444(7121): 840-6.

127
Kane, S., H. Sano, et al. (2002). "A method to identify serine kinase substrates. Akt phosphorylates a novel adipocyte protein with a Rab GTPase-activating protein (GAP) domain." J Biol Chem 277(25): 22115-8.
Kantor, L. and M. E. Gnegy (1998). "Protein kinase C inhibitors block
amphetamine-mediated dopamine release in rat striatal slices." J Pharmacol Exp Ther 284(2): 592-8.
Kantor, L., G. H. Hewlett, et al. (2001). "Protein kinase C and intracellular calcium
are required for amphetamine-mediated dopamine release via the norepinephrine transporter in undifferentiated PC12 cells." J Pharmacol Exp Ther 297(3): 1016-24.
Kapur, S. and D. Mamo (2003). "Half a century of antipsychotics and still a
central role for dopamine D2 receptors." Prog Neuropsychopharmacol Biol Psychiatry 27(7): 1081-90.
Kar, S., J. G. Chabot, et al. (1993). "Quantitative autoradiographic localization of
[125I]insulin-like growth factor I, [125I]insulin-like growth factor II, and [125I]insulin receptor binding sites in developing and adult rat brain." J Comp Neurol 333(3): 375-97.
Kebabian, J. W. and D. B. Calne (1979). "Multiple receptors for dopamine."
Nature 277(5692): 93-6.
Khoshbouei, H., H. Wang, et al. (2003). "Amphetamine-induced dopamine efflux.
A voltage-sensitive and intracellular Na+-dependent mechanism." J Biol Chem 278(14): 12070-7.
Kienast, T. and A. Heinz (2006). "Dopamine and the diseased brain." CNS
Neurol Disord Drug Targets 5(1): 109-31. Kilty, J. E. and S. G. Amara (1992). "Families of twelve transmembrane domain
transporters." Curr Opin Biotechnol 3(6): 675-82.
Kilty, J. E., D. Lorang, et al. (1991). "Cloning and expression of a cocaine-
sensitive rat dopamine transporter." Science 254(5031): 578-9. Koob, G. F. and F. E. Bloom (1988). "Cellular and molecular mechanisms of drug
dependence." Science 242(4879): 715-23.
Koob, G. F. and M. Le Moal (2008). "Addiction and the brain antireward system."
Annu Rev Psychol 59: 29-53.

128
Kramer, H. F., C. A. Witczak, et al. (2006). "AS160 regulates insulin- and contraction-stimulated glucose uptake in mouse skeletal muscle." J Biol Chem 281(42): 31478-85.
Krizman-Genda, E., M. I. Gonzalez, et al. (2005). "Evidence that Akt mediates
platelet-derived growth factor-dependent increases in activity and surface expression of the neuronal glutamate transporter, EAAC1." Neuropharmacology.
Kuhar, M. J., M. C. Ritz, et al. (1991). "The dopamine hypothesis of the
reinforcing properties of cocaine." Trends Neurosci 14(7): 299-302. Laasonen-Balk, T., J. Kuikka, et al. (1999). "Striatal dopamine transporter density
in major depression." Psychopharmacology (Berl) 144(3): 282-5.
Ladurelle, N., D. Duterte-Boucher, et al. (1991). "Stimulation of D1 and D2
dopamine receptors produces additive anorectic effects." Fundam Clin Pharmacol 5(6): 481-90.
Lee, F. J., L. Pei, et al. (2007). "Dopamine transporter cell surface localization
facilitated by a direct interaction with the dopamine D2 receptor." Embo J 26(8): 2127-36.
Lee, K. H., M. Y. Kim, et al. (2004). "Syntaxin 1A and receptor for activated C
kinase interact with the N-terminal region of human dopamine transporter." Neurochem Res 29(7): 1405-9.
Lester, H. A., Y. Cao, et al. (1996). "Listening to neurotransmitter transporters."
Neuron 17(5): 807-10. Li, L. B., N. Chen, et al. (2004). "The role of N-glycosylation in function and
surface trafficking of the human dopamine transporter." J Biol Chem. Lindsley, C. W., Z. Zhao, et al. (2005). "Allosteric Akt (PKB) inhibitors: discovery
and SAR of isozyme selective inhibitors." Bioorg Med Chem Lett 15(3): 761-4.
Little, K. Y., J. A. Kirkman, et al. (1993). "Cocaine use increases [3H]WIN 35428
binding sites in human striatum." Brain Res 628(1-2): 17-25. Little, K. Y., L. Zhang, et al. (1999). "Striatal dopaminergic abnormalities in
human cocaine users." Am J Psychiatry 156(2): 238-45.
Loder, M. K. and H. E. Melikian (2003). "The dopamine transporter constitutively
internalizes and recycles in a protein kinase C-regulated manner in stably transfected PC12 cell lines." J Biol Chem.

129
Lute, B. J., H. Khoshbouei, et al. (2008). "PI3K signaling supports amphetamine-induced dopamine efflux." Biochem Biophys Res Commun.
Manzanares, J., R. Canton, et al. (1988). "Levels of insulin in the brains of rats
modified by chronic administration of amphetamine, haloperidol and sulpiride." Neuropharmacology 27(11): 1141-4.
Mash, D. C., J. Pablo, et al. (2002). "Dopamine transport function is elevated in
cocaine users." J Neurochem 81(2): 292-300. Mateo, Y., E. A. Budygin, et al. (2004). "Voltammetric assessment of dopamine
clearance in the absence of the dopamine transporter: no contribution of other transporters in core or shell of nucleus accumbens." J Neurosci Methods 140(1-2): 183-7.
Mateos, J. J., F. Lomena, et al. (2005). "Decreased striatal dopamine transporter
binding assessed with [123I] FP-CIT in first-episode schizophrenic patients with and without short-term antipsychotic-induced parkinsonism." Psychopharmacology (Berl) 181(2): 401-6.
Mayfield, R. D. and N. R. Zahniser (2001). "Dopamine D2 receptor regulation of
the dopamine transporter expressed in Xenopus laevis oocytes is voltage-independent." Mol Pharmacol 59(1): 113-21.
Mazei-Robison, M. S., R. S. Couch, et al. (2005). "Sequence variation in the
human dopamine transporter gene in children with attention deficit hyperactivity disorder." Neuropharmacology.
Melikian, H. E. and K. M. Buckley (1999). "Membrane trafficking regulates the
activity of the human dopamine transporter." J Neurosci 19(18): 7699-710.
Mercuri, N. B., A. Saiardi, et al. (1997). "Loss of autoreceptor function in
dopaminergic neurons from dopamine D2 receptor deficient mice." Neuroscience 79(2): 323-7.
Mokdad, A. H., B. A. Bowman, et al. (2001). "The continuing epidemics of obesity
and diabetes in the United States." Jama 286(10): 1195-200. Mokdad, A. H., E. S. Ford, et al. (2003). "Prevalence of obesity, diabetes, and
obesity-related health risk factors, 2001." Jama 289(1): 76-9.
Montague, M. C. (2003). "The physiology of obesity." Abnf J 14(3): 56-60.
Morris, J. K., H. Zhang, et al. (2008). "Measures of striatal insulin resistance in a
6-hydroxydopamine model of Parkinson's disease." Brain Res 1240: 185-95.

130
Mukherjee, S., P. Decina, et al. (1996). "Diabetes mellitus in schizophrenic patients." Compr Psychiatry 37(1): 68-73.
Mukherjee, S., D. B. Schnur, et al. (1989). "Family history of type 2 diabetes in
schizophrenic patients." Lancet 1(8636): 495. Must, A., J. Spadano, et al. (1999). "The disease burden associated with
overweight and obesity." Jama 282(16): 1523-9.
Newcomer, J. W. (2001). "Metabolic disturbances associated with antipsychotic
use." J Clin Psychiatry 62 Suppl 27: 3-4; discussion 40-1. Ng, J. P., G. W. Hubert, et al. (1991). "Increased stimulated release and uptake
of dopamine in nucleus accumbens after repeated cocaine administration as measured by in vivo voltammetry." J Neurochem 56(5): 1485-92.
Niswender, K. D., D. G. Baskin, et al. (2004). "Insulin and its evolving partnership
with leptin in the hypothalamic control of energy homeostasis." Trends Endocrinol Metab 15(8): 362-9.
Niswender, K. D., C. D. Morrison, et al. (2003). "Insulin activation of
phosphatidylinositol 3-kinase in the hypothalamic arcuate nucleus: a key mediator of insulin-induced anorexia." Diabetes 52(2): 227-31.
Niswender, K. D. and M. W. Schwartz (2003). "Insulin and leptin revisited:
adiposity signals with overlapping physiological and intracellular signaling capabilities." Front Neuroendocrinol 24(1): 1-10.
Obici, S., Z. Feng, et al. (2002). "Decreasing hypothalamic insulin receptors
causes hyperphagia and insulin resistance in rats." Nat Neurosci 5(6):
566-72. Obici, S., B. B. Zhang, et al. (2002). "Hypothalamic insulin signaling is required
for inhibition of glucose production." Nat Med 8(12): 1376-82.
Ogden, C. L., M. D. Carroll, et al. (2010). "Prevalence of high body mass index in
US children and adolescents, 2007-2008." Jama 303(3): 242-9. Owens, W. A., R. J. Sevak, et al. (2005). "Deficits in dopamine clearance and
locomotion in hypoinsulinemic rats unmask novel modulation of dopamine transporters by amphetamine." J Neurochem 94(5): 1402-10.
Page, G., S. Barc-Pain, et al. (2004). "The up-regulation of the striatal dopamine
transporter's activity by cAMP is PKA-, CaMK II- and phosphatase-dependent." Neurochem Int 45(5): 627-32.

131
Palmiter, R. D. (2007). "Is dopamine a physiologically relevant mediator of feeding behavior?" Trends Neurosci 30(8): 375-81.
Palmiter, R. D. (2008). "Dopamine signaling in the dorsal striatum is essential for
motivated behaviors: lessons from dopamine-deficient mice." Ann N Y Acad Sci 1129: 35-46.
Pardridge, W. M., J. Eisenberg, et al. (1985). "Human blood-brain barrier insulin
receptor." J Neurochem 44(6): 1771-8. Parsons, L. H., C. A. Schad, et al. (1993). "Co-administration of the D2
antagonist pimozide inhibits up-regulation of dopamine release and uptake induced by repeated cocaine." J Neurochem 60(1): 376-9.
Patterson, T. A., M. D. Brot, et al. (1998). "Food deprivation decreases mRNA
and activity of the rat dopamine transporter." Neuroendocrinology 68(1):
11-20. Pierce, R. C. and P. W. Kalivas (1997). "Repeated cocaine modifies the
mechanism by which amphetamine releases dopamine." J Neurosci 17(9):
3254-61. Pifl, C., P. Rebernik, et al. (2004). "Zn(2+) modulates currents generated by the
dopamine transporter: parallel effects on amphetamine-induced charge transfer and release." Neuropharmacology 46(2): 223-31.
Pilotte, N. S., L. G. Sharpe, et al. (1994). "Withdrawal of repeated intravenous
infusions of cocaine persistently reduces binding to dopamine transporters in the nucleus accumbens of Lewis rats." J Pharmacol Exp Ther 269(3): 963-9.
Posey, K. A., D. J. Clegg, et al. (2009). "Hypothalamic proinflammatory lipid
accumulation, inflammation, and insulin resistance in rats fed a high-fat diet." Am J Physiol Endocrinol Metab 296(5): E1003-12.
Pristupa, Z. B., F. McConkey, et al. (1998). "Protein kinase-mediated bidirectional
trafficking and functional regulation of the human dopamine transporter." Synapse 30(1): 79-87.
Roberts, M. S., A. J. Woods, et al. (2004). "Protein kinase B/Akt acts via
glycogen synthase kinase 3 to regulate recycling of alpha v beta 3 and alpha 5 beta 1 integrins." Mol Cell Biol 24(4): 1505-15.
Robinson, S., A. J. Rainwater, et al. (2007). "Viral restoration of dopamine
signaling to the dorsal striatum restores instrumental conditioning to dopamine-deficient mice." Psychopharmacology (Berl) 191(3): 567-78.

132
Rodriguez, M. M., D. Ron, et al. (1999). "RACK1, a protein kinase C anchoring protein, coordinates the binding of activated protein kinase C and select pleckstrin homology domains in vitro." Biochemistry 38(42): 13787-94.
Ron, D. and D. Mochly-Rosen (1994). "Agonists and antagonists of protein
kinase C function, derived from its binding proteins." J Biol Chem 269(34):
21395-8. Ross, S. B. and A. L. Renyi (1967). "Inhibition of the uptake of tritiated
catecholamines by antidepressant and related agents." Eur J Pharmacol 2(3): 181-6.
Russo, S. J., C. A. Bolanos, et al. (2007). "IRS2-Akt pathway in midbrain
dopamine neurons regulates behavioral and cellular responses to opiates." Nat Neurosci 10(1): 93-9.
Ryan, M. C., P. Collins, et al. (2003). "Impaired fasting glucose tolerance in first-
episode, drug-naive patients with schizophrenia." Am J Psychiatry 160(2):
284-9. Salamone, J. D., M. Correa, et al. (2005). "Beyond the reward hypothesis:
alternative functions of nucleus accumbens dopamine." Curr Opin Pharmacol 5(1): 34-41.
Sandyk, R. (1993). "The relationship between diabetes mellitus and Parkinson's
disease." Int J Neurosci 69(1-4): 125-30.
Sano, H., S. Kane, et al. (2003). "Insulin-stimulated phosphorylation of a Rab
GTPase-activating protein regulates GLUT4 translocation." J Biol Chem 278(17): 14599-602.
Saunders, C., J. V. Ferrer, et al. (2000). "Amphetamine-induced loss of human
dopamine transporter activity: an internalization-dependent and cocaine-sensitive mechanism." Proc Natl Acad Sci U S A 97(12): 6850-5.
Schulingkamp, R. J., T. C. Pagano, et al. (2000). "Insulin receptors and insulin
action in the brain: review and clinical implications." Neurosci Biobehav Rev 24(8): 855-72.
Schwab, S. G., B. Hoefgen, et al. (2005). "Further evidence for association of
variants in the AKT1 gene with schizophrenia in a sample of European sib-pair families." Biol Psychiatry 58(6): 446-50.
Schwartz, M. W. and D. Porte, Jr. (2005). "Diabetes, obesity, and the brain."
Science 307(5708): 375-9.
133
Sevak, R. J., W. Koek, et al. (2006). "Insulin replacement restores the behavioral effects of quinpirole and raclopride in streptozotocin-treated rats." J Pharmacol Exp Ther.
Shen, H. W., Y. Hagino, et al. (2004). "Regional Differences in Extracellular
Dopamine and Serotonin Assessed by In Vivo Microdialysis in Mice Lacking Dopamine and/or Serotonin Transporters." Neuropsychopharmacology.
Shimada, S., S. Kitayama, et al. (1991). "Cloning and expression of a cocaine-
sensitive dopamine transporter complementary DNA." Science 254(5031): 576-8.
Shinohara, M., H. Mizushima, et al. (2004). "Eating disorders with binge-eating
behaviour are associated with the s allele of the 3'-UTR VNTR polymorphism of the dopamine transporter gene." J Psychiatry Neurosci 29(2): 134-7.
Siegal, G. J., Agranoff, E.W., Albers, R.W., Fisher, S.K., Uhler, M.D. (1999).
Basic Neurochemistry, 6th edition. Philadelphia, Lippincott-Raven. Sitte, H. H., S. Huck, et al. (1998). "Carrier-mediated release, transport rates, and
charge transfer induced by amphetamine, tyramine, and dopamine in mammalian cells transfected with the human dopamine transporter." J Neurochem 71(3): 1289-97.
Somwar, R., D. Y. Kim, et al. (2001). "GLUT4 translocation precedes the
stimulation of glucose uptake by insulin in muscle cells: potential activation of GLUT4 via p38 mitogen-activated protein kinase." Biochem J 359(Pt 3): 639-49.
Sonders, M. S. and S. G. Amara (1996). "Channels in transporters." Curr Opin
Neurobiol 6(3): 294-302. Sonders, M. S., S. J. Zhu, et al. (1997). "Multiple ionic conductances of the
human dopamine transporter: the actions of dopamine and psychostimulants." J Neurosci 17(3): 960-74.
Sorkina, T., S. Doolen, et al. (2003). "Oligomerization of dopamine transporters
visualized in living cells by FRET microscopy." J Biol Chem. Sorkina, T., B. R. Hoover, et al. (2005). "Constitutive and Protein Kinase C-
Induced Internalization of the Dopamine Transporter is Mediated by a Clathrin-Dependent Mechanism." Traffic 6(2): 157-70.

134
Sotak, B. N., T. S. Hnasko, et al. (2005). "Dysregulation of dopamine signaling in the dorsal striatum inhibits feeding." Brain Res 1061(2): 88-96.
South, T. and X. F. Huang (2008). "High-fat diet exposure increases dopamine
D2 receptor and decreases dopamine transporter receptor binding density in the nucleus accumbens and caudate putamen of mice." Neurochem Res 33(3): 598-605.
Spencer, T. J., J. Biederman, et al. (2005). "In vivo neuroreceptor imaging in
attention-deficit/hyperactivity disorder: a focus on the dopamine transporter." Biol Psychiatry 57(11): 1293-300.
Staley, J. K., W. L. Hearn, et al. (1994). "High affinity cocaine recognition sites on
the dopamine transporter are elevated in fatal cocaine overdose victims." J Pharmacol Exp Ther 271(3): 1678-85.
Stein, L. J., D. M. Dorsa, et al. (1983). "Immunoreactive insulin levels are
elevated in the cerebrospinal fluid of genetically obese Zucker rats." Endocrinology 113(6): 2299-301.
Stice, E., S. Spoor, et al. (2008). "Relation between obesity and blunted striatal
response to food is moderated by TaqIA A1 allele." Science 322(5900):
449-52. Stice, E., S. Spoor, et al. (2008). "Relation of reward from food intake and
anticipated food intake to obesity: a functional magnetic resonance imaging study." J Abnorm Psychol 117(4): 924-35.
Stoof, J. C. and J. W. Kebabian (1981). "Opposing roles for D-1 and D-2
dopamine receptors in efflux of cyclic AMP from rat neostriatum." Nature 294(5839): 366-8.
Sung, U., S. Apparsundaram, et al. (2003). "A regulated interaction of syntaxin
1A with the antidepressant- sensitive norepinephrine transporter establishes catecholamine clearance capacity." J Neurosci 23(5): 1697-709.
Sung, U., S. Apparsundaram, et al. (2003). "A regulated interaction of syntaxin
1A with the antidepressant-sensitive norepinephrine transporter establishes catecholamine clearance capacity." J Neurosci 23(5): 1697-
709. Syringas, M., F. Janin, et al. (2000). "Structural domains of chimeric dopamine-
noradrenaline human transporters involved in the Na(+)- and Cl(-)-dependence of dopamine transport." Mol Pharmacol 58(6): 1404-11.

135
Szkudelski, T. (2001). "The mechanism of alloxan and streptozotocin action in B cells of the rat pancreas." Physiol Res 50(6): 537-46.
Taha, C. and A. Klip (1999). "The insulin signaling pathway." J Membr Biol
169(1): 1-12. Thong, F. S., P. J. Bilan, et al. (2007). "The Rab GTPase-activating protein
AS160 integrates Akt, protein kinase C, and AMP-activated protein kinase signals regulating GLUT4 traffic." Diabetes 56(2): 414-23.
Torres, G. E. (2006). "The dopamine transporter proteome." J Neurochem. Torres, G. E., A. Carneiro, et al. (2003). "Oligomerization and trafficking of the
human dopamine transporter. Mutational analysis identifies critical domains important for the functional expression of the transporter." J Biol Chem 278(4): 2731-9.
Torres, G. E., R. R. Gainetdinov, et al. (2003). "Plasma membrane monoamine
transporters: structure, regulation and function." Nat Rev Neurosci 4(1): 13-25.
Torres, G. E., W. D. Yao, et al. (2001). "Functional interaction between
monoamine plasma membrane transporters and the synaptic PDZ domain-containing protein PICK1." Neuron 30(1): 121-34.
Tschopp, O., Z. Z. Yang, et al. (2005). "Essential role of protein kinase B gamma
(PKB gamma/Akt3) in postnatal brain development but not in glucose homeostasis." Development 132(13): 2943-54.
Unger, J. W., J. N. Livingston, et al. (1991). "Insulin receptors in the central
nervous system: localization, signalling mechanisms and functional aspects." Prog Neurobiol 36(5): 343-62.
Ungerstedt, U. (1971). "Stereotaxic mapping of the monoamine pathways in the
rat brain." Acta Physiol Scand Suppl 367: 1-48. Usdin, T. B., E. Mezey, et al. (1991). "Cloning of the cocaine-sensitive bovine
dopamine transporter." Proc Natl Acad Sci U S A 88(24): 11168-71.
Usiello, A., J. H. Baik, et al. (2000). "Distinct functions of the two isoforms of
dopamine D2 receptors." Nature 408(6809): 199-203. van Winkel, R., M. De Hert, et al. (2008). "Prevalence of diabetes and the
metabolic syndrome in a sample of patients with bipolar disorder." Bipolar Disord 10(2): 342-8.

136
van Winkel, R., M. De Hert, et al. (2008). "Major changes in glucose metabolism, including new-onset diabetes, within 3 months after initiation of or switch to atypical antipsychotic medication in patients with schizophrenia and schizoaffective disorder." J Clin Psychiatry 69(3): 472-9.
Vaughan, R. A., R. A. Huff, et al. (1997). "Protein kinase C-mediated
phosphorylation and functional regulation of dopamine transporters in striatal synaptosomes." J Biol Chem 272(24): 15541-6.
Visscher, T. L. and J. C. Seidell (2001). "The public health impact of obesity."
Annu Rev Public Health 22: 355-75. Volkow, N. D., G. J. Wang, et al. (2002). ""Nonhedonic" food motivation in
humans involves dopamine in the dorsal striatum and methylphenidate amplifies this effect." Synapse 44(3): 175-80.
Volkow, N. D., G. J. Wang, et al. (2007). "Depressed dopamine activity in
caudate and preliminary evidence of limbic involvement in adults with attention-deficit/hyperactivity disorder." Arch Gen Psychiatry 64(8): 932-40.
Volkow, N. D. and R. A. Wise (2005). "How can drug addiction help us
understand obesity?" Nat Neurosci 8(5): 555-60. Wallum, B. J., G. J. Taborsky, Jr., et al. (1987). "Cerebrospinal fluid insulin levels
increase during intravenous insulin infusions in man." J Clin Endocrinol Metab 64(1): 190-4.
Wang, D., S. L. Deken, et al. (2003). "Syntaxin 1A inhibits GABA flux, efflux, and
exchange mediated by the rat brain GABA transporter GAT1." Mol Pharmacol 64(4): 905-13.
Wang, G. J., N. D. Volkow, et al. (2001). "Brain dopamine and obesity." Lancet
357(9253): 354-7.
Wei, Y., J. Williams, et al. (2006). "Dopamine Transporter Activity Mediates
Amphetamine-induced Inhibition of Akt through a CaMKII-dependent Mechanism." Mol Pharmacol 71(3): 835-42.
Weiner, R. I. and W. F. Ganong (1978). "Role of brain monoamines and
histamine in regulation of anterior pituitary secretion." Physiol Rev 58(4): 905-76.
Werther, G. A., A. Hogg, et al. (1987). "Localization and characterization of
insulin receptors in rat brain and pituitary gland using in vitro

137
autoradiography and computerized densitometry." Endocrinology 121(4): 1562-70.
Wieman, H. L., J. A. Wofford, et al. (2007). "Cytokine stimulation promotes
glucose uptake via phosphatidylinositol-3 kinase/Akt regulation of Glut1 activity and trafficking." Mol Biol Cell 18(4): 1437-46.
Williams, J. M. and A. Galli (2006). "The dopamine transporter: a vigilant border
control for psychostimulant action." Handb Exp Pharmacol(175): 215-32. Williams, J. M., W. A. Owens, et al. (2007). "Hypoinsulinemia regulates
amphetamine-induced reverse transport of dopamine." PLoS Biol 5(10):
2369-78. Wise, R. A. (1998). "Drug-activation of brain reward pathways." Drug Alcohol
Depend 51(1-2): 13-22.
Wisse, B. E., F. Kim, et al. (2007). "Physiology. An integrative view of obesity."
Science 318(5852): 928-9. Woods, S. C., E. C. Lotter, et al. (1979). "Chronic intracerebroventricular infusion
of insulin reduces food intake and body weight of baboons." Nature 282(5738): 503-5.
Woods, S. C., D. Porte, Jr., et al. (1985). "Insulin: its relationship to the central
nervous system and to the control of food intake and body weight." Am J Clin Nutr 42(5 Suppl): 1063-71.
Yamashita, A., S. K. Singh, et al. (2005). "Crystal structure of a bacterial
homologue of Na(+)/Cl(-)-dependent neurotransmitter transporters." Nature.
Yang, B., R. C. Chan, et al. (2007). "A meta-analysis of association studies
between the 10-repeat allele of a VNTR polymorphism in the 3'-UTR of dopamine transporter gene and attention deficit hyperactivity disorder." Am J Med Genet B Neuropsychiatr Genet 144(4): 541-50.
Yang, Z. Z., O. Tschopp, et al. (2004). "Physiological functions of protein kinase
B/Akt." Biochem Soc Trans 32(Pt 2): 350-4. Yoshida, M., H. Yokoo, et al. (1992). "Eating and drinking cause increased
dopamine release in the nucleus accumbens and ventral tegmental area in the rat: measurement by in vivo microdialysis." Neurosci Lett 139(1): 73-6.

138
Yuseff, M. I., P. Farfan, et al. (2007). "A cytoplasmic PPPSP motif determines megalin's phosphorylation and regulates receptor's recycling and surface expression." Traffic 8(9): 1215-30.
Zaczek, R., S. Culp, et al. (1991). "Interactions of [3H]amphetamine with rat brain
synaptosomes. II. Active transport." J Pharmacol Exp Ther 257(2): 830-5.
Zahniser, N. R. and S. Doolen (2001). "Chronic and acute regulation of Na+/Cl- -
dependent neurotransmitter transporters: drugs, substrates, presynaptic receptors, and signaling systems." Pharmacol Ther 92(1): 21-55.
Zhang, L., L. L. Coffey, et al. (1997). "Regulation of the functional activity of the
human dopamine transporter by protein kinase C." Biochem Pharmacol 53(5): 677-88.
Zhao, Z., H. Ksiezak-Reding, et al. (2006). "Insulin receptor deficits in
schizophrenia and in cellular and animal models of insulin receptor dysfunction." Schizophr Res 84(1): 1-14.
Zhao, Z., R. G. Robinson, et al. (2008). "Development of potent, allosteric dual
Akt1 and Akt2 inhibitors with improved physical properties and cell activity." Bioorg Med Chem Lett 18(1): 49-53.
Zhen, J., M. E. Reith, et al. (2006). "Chronic food restriction and dopamine
transporter function in rat striatum." Brain Res 1082(1): 98-101. Zhu, S. J., M. P. Kavanaugh, et al. (1997). "Activation of protein kinase C inhibits
uptake, currents and binding associated with the human dopamine transporter expressed in Xenopus oocytes." J Pharmacol Exp Ther 282(3): 1358-65.