transportation research part f
TRANSCRIPT

Transportation Research Part F 54 (2018) 196–210
Contents lists available at ScienceDirect
Transportation Research Part F
journal homepage: www.elsevier .com/locate / t r f
‘‘Please watch right” – Evaluation of a speech-based on-demandassistance system for urban intersections
https://doi.org/10.1016/j.trf.2018.01.0181369-8478/� 2018 Elsevier Ltd. All rights reserved.
⇑ Corresponding author.E-mail address: [email protected] (N. Schoemig).
Nadja Schoemig a,⇑, Martin Heckmann b, Heiko Wersing b, Christian Maag a, Alexandra Neukuma
aWuerzburg Institute for Traffic Sciences GmbH (WIVW), Robert-Bosch-Str. 4, 97209 Veitshöchheim, GermanybHonda Research Institute Europe, Carl-Legien-Str. 30, 63073 Offenbach/Main, Germany
a r t i c l e i n f o
Article history:Received 13 July 2016Received in revised form 4 August 2017Accepted 25 January 2018
Keywords:Assistance systemSpeech-based systemOn-demandDriving performanceGlance behaviourGap choice
a b s t r a c t
In a driving simulator study we evaluated a speech-based driver assistance system forurban intersections (called Assistance on Demand AoD system) which supports the driverin monitoring and decision making. The system provides recommendations for suitabletime gaps to enter the intersection based on the observation of crossing traffic.Following an ‘‘on-demand”-concept, the driver activates the assistance only if support isdesired.In one drive, drivers used the AoD system in every situation they experienced to guaran-
tee that every driver had the same exposure to the system when evaluating it. Duringanother drive, drivers were free to decide if they want to use the system or not. The exper-imental study compared the AoD system with driving manually and with driving sup-ported by a more conventional visual-based system which was always active atintersections (system showing colored arrows in a simulated head-up display (HUD) tovisualize the crossing traffic). This resulted in four drives the drivers had to perform.Every drive consisted of several intersections with varying traffic conditions. The drivershad to turn left at every intersection.A total of 24 drivers took part in the study; one group with 14 middle-aged drivers and
another group with ten high-aged drivers. Several questionnaires and online ratings wereused to assess drivers’ acceptance, perceived usefulness, benefits and specific characteris-tics of both system variants. In addition, driving behaviour with regard to gap choice anddrivers’ monitoring behaviour (using head tracking data) were analyzed.The results show that the AoD system reaches high acceptance ratings and is preferred
compared to the visual, always active system. Using the speech modality for communica-tion and the on-demand concept were both highly appreciated by the drivers. With regardto driving behaviour, the AoD system is comparably safe as manual driving while at thesame time making driving easier by facilitating the monitoring of vehicles while waitingat an intersection.
� 2018 Elsevier Ltd. All rights reserved.

N. Schoemig et al. / Transportation Research Part F 54 (2018) 196–210 197
1. Introduction
1.1. State of the art on intersection assistance
Turning left at an unsignalized urban intersection with high traffic density arriving from the subordinate road is one ofthe most challenging tasks for drivers (according to subjective reports and objective workload measures, e.g. Hancock, Wulf,Thom, & Fassnacht, 1990; Stinchcombe & Gagnon, 2009; Verwey, 2000). They have to monitor traffic from several directions,estimate suitable time gaps between vehicles, decide when to enter the intersection safely and finally execute the demand-ing left-turn manoeuvre. As a consequence, both cognitive and visual load are especially high in these situations. Addition-ally, they account for 26% of all crashes among lightweight vehicles in the United States (Najm, Sen, Smith, & Campbell,2003). Therefore, there seems to be a need to support the driver in such situations.
Currently available assistance systems for urban intersections are mainly designed as collision avoidance systems dedi-cated to preventing the driver from safety-critical situations. These systems monitor crossing traffic and prompt the driversto start an emergency braking by activating visual and acoustic warnings and/or automatically engaging the brakes (e.g. sys-tems by Toyota or Mercedes Benz). I.e. these systems aim at correcting wrong decisions or driving manoeuvers already takeneither by the drivers themselves or by other road users to avoid a collision. Research on intersection assistance aims todevelop systems that are able to provide earlier warnings e.g. by means of Car-to-X technologies (Naujoks & Neukum,2014) or even prevent the driver from entering the intersection (e.g. Klanner, Thoma, & Winner, 2008).
What could be a meaningful add-on to these systems is an assistance which supports the driver already in the monitoringand decision-making process before entering an intersection.
Donath, Shankwitz, Ward, and Creaser (2007) developed an intersection decision support system that identifies safe gapsin traffic on a high-speed rural expressway and communicates this information to drivers waiting to enter the intersectionfrom a minor intersecting road. However, this system is designed as a Driver-Infrastructure system displaying information atan intersection outside the host vehicle on respective digital signs. An in-vehicle assistance system providing this kind ofinformation was investigated by Dotzauer, Caljouw, de Waard, and Brouwer (2013) in a driving simulator study with 18older drivers. They presented information about safe gaps in form of a bar in front of the driver by means of a head-up dis-play (HUD). Their system is a three-stage system that dynamically changes from green to amber to red and vice versa as thetraffic situation changes. A gap between cars greater than 5 s indicated safe crossing (green flag). Gaps between 2.5 and 5 swere classified as marginal indicated by an amber flag, and gap sizes smaller than 2.5 s were considered unsafe as conveyedby the red flag. Their results show that equipped with this system, drivers allocated more attention to the road center ratherthan the left and right, crossed intersections in shorter time, engaged in higher speeds and crossed more often with a criticaltime-to-collision value (TTC).
The present study presents an alternative approach for assistance derived from observing drivers’ natural behaviour:When planning to turn left at an unsignalized intersection drivers often use the opportunity to ask a present front seat pas-senger for support, e.g. by transferring them the task of monitoring traffic from one direction, typically the traffic from theright and requesting feedback about suitable time gaps to enter the intersection. A typical dialogue sounds like this: ‘‘Canyou please check the traffic from the right for me?” – ‘‘Sure, I can” – ‘‘vehicle from the right” – ‘‘still vehicle from the right”– ‘‘still vehicle from the right” – ‘‘now it’s free” – ‘‘thank you”. Also the passengers themselves could initiate this dialogue ifthey notice that the driver needs support.
In police emergency vehicle operations such a human-human cooperation proved to diminish risk, with notably moreeven and calm driver speed behaviour as well as significantly lower emotional workload (Neukum & Krüger, 2003).
The idea of the presented study was to develop and evaluate a system which transfers this human-human cooperationobservable in natural behaviour into a human-system cooperation with the system acting as a co-passenger which is givingsupport when requested (i.e. only ‘‘on demand”) and which is communicating with the driver via speech. Both, the questionof how to design such a system as well as what benefits to expect, are topics of this paper.
1.2. Concept of cooperative control
We have chosen the concept of shared or cooperative control as theoretical concept for the design of the system. In thisconcept the driver and the system are considered as one combined system in which the two agents interact with each other,taking into account the intentions, potentials and weaknesses of their partner to reach the common goal (e.g. Bratman, 1992;Sheridan, 1992). Therefore, the task distribution between the two agents is relatively flexible, dynamic and adaptive todifferent influencing factors.
The term ‘‘cooperative control” is defined in a working definition by Biester (2009) by the following characteristics(p. 11):
� [. . .] a continuous exchange process between driver and automobile, with the exchange process creating a commonknowledge base and goals [. . .]
� both participants are responsible for certain parts of the commonly defined whole task, which is the result of a continuouscoordination process [. . .]

198 N. Schoemig et al. / Transportation Research Part F 54 (2018) 196–210
� [. . .] the current interaction of human and automobile is a continuously negotiated form of automation [. . .]� [. . .] parameters inducing this process of negotiation are the driving situation, the driver’s condition, and the environmen-tal situation. [. . .]
� [. . .] In each case the realized interaction produces an identifiable profit for both sides (Biester, 2004) to create a solution,a positive result for the respective task, or to fulfill a social need [. . .]
This cooperative approach bears the potential to increase the quality of the interaction, to support and improve thecommunication (e.g. by spoken language), to promote the situation awareness, to optimize the workload, to measurablyincrease the acceptance and trust and to increase the satisfaction in oneself and the overall system (Biester, 2009).
1.3. Using a speech interface for communication between driver and assistance system
In the last years, a growing number of car manufacturers provide speech interfaces in their vehicles. The use of speech inthe HMI design for in-vehicle entertainment systems (such as music selection and tasks related to smartphone use) and nav-igation systems emerged due to the large distractive effects associated with performing visual manual tasks while driving,causing drivers to look away from the road and heavily increasing crash risk (see for example the results of the 100 car studyKlauer, Dingus, Neale, Sudweeks, & Ramsey, 2006). Several authors revealed positive effects of speech-based systems ondriving performance and eyes off-road measures (e.g. Owens, McLaughlin, & Sudweeks, 2010; Owens, McLaughlin, &Sudweeks, 2011; Schömig, Schoch, Neukum, Schumacher, & Wandtner, 2015; Tijerina, Parmer, & Goodman, 1998;Tsimhoni, Smith, & Green, 2004).
In contrast, using speech-based interfaces for assistance systems is not very common. For warning systems for example itturned out that speech is less effective than pure tones or auditory icons (Tan & Lerner, 1995; Lerner, Steinberg & Perel, 1997cited from Lee et al., 2007). Therefore, Dingus et al. (1998; from Lee et al., 2007) suggest to avoid speech displays for atten-tional warnings. An exception is the study by Lee et al. (2007) on the design of an intersection warning system. He found aspeech-based STOP warning (STOP for stop sign) to be more effective in eliciting a stopping behaviour from drivers than thetone-based warning and explains this by the specific context in which it is presented. Mental processing requirements mightbe higher in determining the meaning of a tone-based warning in an intersection approach context than in identifying andunderstanding a verbal command.
Campbell, Richard, Brown, and McCallum (2007) recommend using speech for simple informational or status messagesthat are not time-critical. Despite its low usability for warning messages he considers it as an effective means for commu-nicating information to the driver in applications that require a high degree of message detail or flexibility in terms of themessage content.
Therefore it seems to be an adequate modality for different use cases where especially complex and diverse informationhas to be transmitted to the driver in order to support him in the decision making process for a driving manoeuvre.
1.4. Description of basic system functionality
Based on these theoretical assumptions, the system concept was developed as an assistance system for urban intersec-tions which acts like a co-pilot with which the driver can interact by speech communication (Heckmann & Wersing,2015). The goal in the specific situation of urban intersections is to find suitable time gaps to cross the intersection comfort-ably and safely. In contrast to a more conventional assistance system this system was based on an ‘‘Assistance on demand”(AoD) concept meaning that the system is not always active but the driver activates the system in situations where he/shewants to have support.
The system is thought as a comfort system which should support the driver while waiting at an intersection andmonitoring the traffic. In the present study the system was restricted to only monitor one direction, namely the trafficfrom the right, although the system would be able to also observe other directions and multiple directionssimultaneously.
Furthermore, it assists in manoeuver decision only by recommending a suitable time gap for turning or crossing the inter-section. The final decision and manoeuvre execution remains in the responsibility of the driver. The modality of interactionbetween the driver and the system is speech, as speech is thought to be the most flexible, natural, and interactive tool for thecommunication between the two agents. The driver will give an explicit assistance request to the system by speech input(e.g. ‘‘please check right”) whereupon the system will react by specific speech outputs.
Biester (2009) already evaluated the concept of a cooperative intersection assistance for the use case ‘‘turning left onurban and country roads with oncoming traffic”. He compared driving manually with driving while using the cooperativesystem in a between-subjects design. The dialogue between the driver and the system was simulated using a wizard-of-oz-technique (meaning the experimenter is simulating the behaviour of the system). This dialogue could therefore be rela-tively flexible and extensive. Biester (2009) found that drivers perceived an increase in the interaction quality, that the sys-tem was well-accepted and highly attractive with an even higher trust in high traffic density compared to low densityconditions. He could not find any effects on physiological measures and on critical gap choices. Drivers in the cooperativecondition chose suitable gaps sooner.
N. Schoemig et al. / Transportation Research Part F 54 (2018) 196–210 199
Biester’s system supports the driver in estimating time gaps in oncoming traffic when turning left. Oncoming trafficwas the only traffic in his scenario. Such a scenario can be easily solved, at least by experienced drivers. However, thereis effectively a transfer of responsibility from the driver to the system for solving the task. In order to still perceive thesystem as useful the driver has to fully rely on the system’s recommendations which should compensate for driver’s weak-nesses in perception and decision making. In the present study however, the distribution of the task between the driverand the system is more pronounced as the system takes over the monitoring of traffic from the right while the drivermonitors the traffic from the left. For a highly crowded intersections this is a situation which requires full attention evenfrom a high experienced driver. In contrast to Biester’s approach, in the current system architecture the driver initiates theinteraction with the system by requesting support at a specific intersection. The system does not give advice withoutbeing asked.
1.5. Study questions
The specific research questions are:
� Will such an AoD system be accepted, trusted and used by the drivers?� Which benefit do drivers perceive compared to unassisted driving and more conventional assistance concepts?� How do drivers evaluate specific HMI features?� How do drivers interact with the system if they have the freedom to use it as they prefer?� How does the system affect driver’s behaviour in terms of monitoring the traffic environment and the gaps used for enter-ing the intersection?
� Which factors influence system usage and acceptance, e.g. personal trait factors (age, attitude towards technology) or fac-tors affecting situation complexity (traffic density)?
In order to investigate the benefits of specific characteristics of the system, namely the ‘‘on-demand” concept and theadvantage of using the speech modality, it was decided to compare it with manual driving as well as with a more conven-tional intersection assistance system. This conventional system was an ‘‘always active visual assistance system” that usedvisual information presented via a head-up display (HUD) to inform the driver, similar to that described in Dotzauer et al.(2013).
2. Method
2.1. Participants
N = 24 drivers took part in the study. They were recruited from the WIVW test driver panel. They all had participated atleast in a 2.5 h training session in the simulator before. Two subsamples of drivers were compared: One group of 14 middle-aged drivers between 25 and 53 years (M = 34.6; SD = 9.6 years). Their average mileage driven in the last 12 months was20,789 km (SD = 9593 km). The other group consisted of n = 10 drivers with an age above 60 years (M = 69.3; SD = 6.5 years)and an average mileage of 8000 km (SD = 3018 km). The sample size is unequal because two older drivers had to quit thestudy due to simulation sickness and could only be replaced by two middle-aged drivers.
The two age groups had a comparable attitude towards technology in vehicles (derived from a separate questionnaire).However, the older group had less experience with speech-based systems in general (group 1: 79% vs. group 2: 60% – derivedfrom a separate questionnaire).
One test driver from group 2 cancelled the last of the four simulator drives. As this person answered all questionnaires, itwas decided to not exclude the subject from the sample.
2.2. Study environment
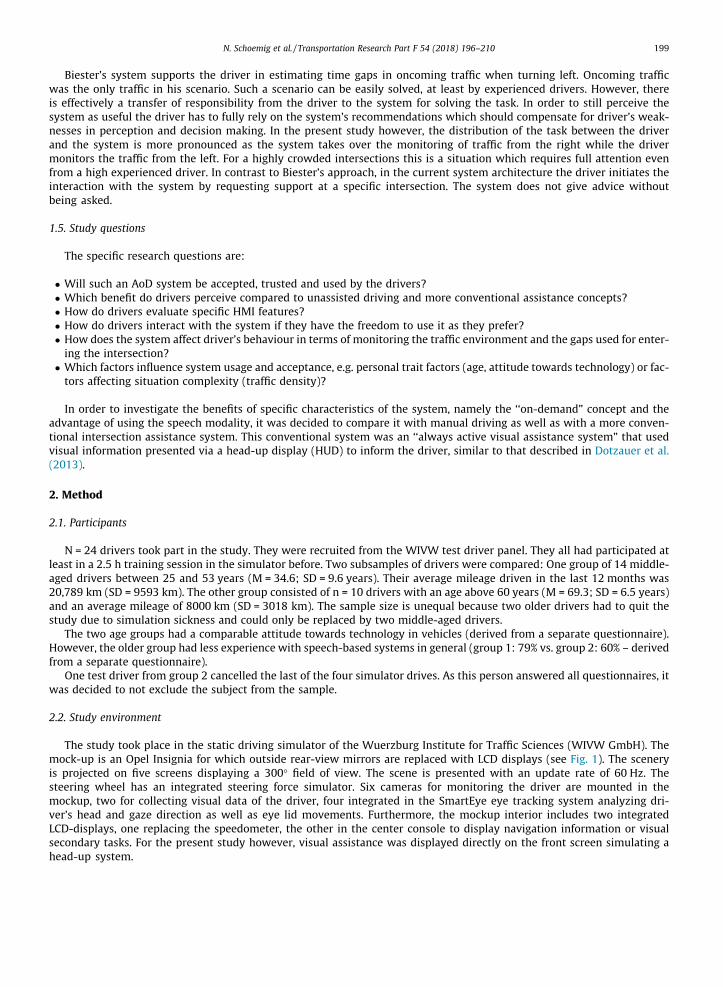
The study took place in the static driving simulator of the Wuerzburg Institute for Traffic Sciences (WIVW GmbH). Themock-up is an Opel Insignia for which outside rear-view mirrors are replaced with LCD displays (see Fig. 1). The sceneryis projected on five screens displaying a 300� field of view. The scene is presented with an update rate of 60 Hz. Thesteering wheel has an integrated steering force simulator. Six cameras for monitoring the driver are mounted in themockup, two for collecting visual data of the driver, four integrated in the SmartEye eye tracking system analyzing dri-ver’s head and gaze direction as well as eye lid movements. Furthermore, the mockup interior includes two integratedLCD-displays, one replacing the speedometer, the other in the center console to display navigation information or visualsecondary tasks. For the present study however, visual assistance was displayed directly on the front screen simulating ahead-up system.

Fig. 1. Outside view of the static driving simulator of WIVW used for the study.
200 N. Schoemig et al. / Transportation Research Part F 54 (2018) 196–210
2.3. System specification
2.3.1. AoD systemFor the AoD system it is assumed that the vehicle is equipped with a radar or laser scanner that is able to detect vehicles,
pedestrians and cyclists that approach an intersection. Hidden obstacles or vehicles are not perceived. In principle, the sys-tem would be able to observe traffic from all directions, also multiple directions simultaneously. For the simulator studyhowever, it was decided to concentrate on the use case ‘‘turning left at an intersection” as this situation requires a high coop-eration between the driver and the assistance system which was one of the core principles of the AoD system that should bedemonstrated. As mentioned above, to highlight this cooperative character it was decided to restrict the system to only mon-itor one direction, namely traffic coming from the right as it was expected to put higher demands on monitoring than trafficfrom the left. Traffic from the left still has to be monitored by the drivers themselves.
Requests for system activation can already be given when the driver approaches the intersection. The driver activates thesystem by a speech input whereupon the experimenter starts the system by pressing a button (as real speech recognitionwas not implemented). After having crossed the intersection, the system is automatically deactivated. The output of the sys-tem is triggered by an algorithm using a combination of different parameters (for a visualization see Fig. 2):
� Vego: Minimum defined speed of the host vehicle when approaching the intersection [in m/s]� TPOIr: Time distance of crossing vehicles [in s] to the center of the intersection (called POI – point of interest)� Tgapr: Time gaps between successive vehicles arriving at the intersection from the left [in s] and/or the right [in s]
Speech output was generated by a software that converts written text into audio files. The speech samples created resem-ble natural speech. The voice used was a female one.
Several system states were defined according to which different system outputs were triggered. Fig. 3 shows a simplifiedversion of the most important system states. In approaching the intersection the driver’s request (e.g. ‘‘Please watch right”)activates the system. In the simulator study this state was triggered by a button pressed by the test leader immediately afterthe request1. The system confirms the successful activation by answering ‘‘okay – I will watch”. When the driver reaches theintersection (defined by driving below a certain minimum speed), the system starts giving recommendations based on differentconditions. If the time distance of the closest vehicle from the right to the POI (parameter TPOIr) is above a defined threshold(defined with 10 s), the system will interpret this as a state where there is no vehicle present (at least none in the sensor rangeof the system) and triggers the output ‘‘no vehicle from the right”. It was deliberately decided to not announce ‘‘right is free” asthis could be interpreted as a permission to drive without further monitoring the actual traffic and therefore creating potentiallyhazardous situations.
If this condition is still valid after 8 s the information is repeated with ‘‘still no vehicle from the right”. If a vehicle isapproaching from the right and reaches a critical time distance TPOIr (defined with 6 s) to the intersection and simultane-ously another vehicle is following with a time gap Tgapr below a certain threshold (defined with 6 s), the system interpretsthis as a sequence of vehicles which does not allow entering the intersection for turning. The linked speech output is ‘‘vehiclefrom the right”. If the time gap to the next oncoming vehicle is again below Tgapr_crit, and 8 s have elapsed the informationis repeated with ‘‘still vehicle from the right”.
1 This is the only manual action of the experimenter. It could be replaced by a standard ASR system.

Fig. 2. System parameters for the AoD system (description see text).
Fig. 3. Most important system states for AoD system.
N. Schoemig et al. / Transportation Research Part F 54 (2018) 196–210 201
If a vehicle is approaching from the right and reaches a certain time distance TPOIr (TPOIr_ant defined with 3 s) to theintersection and simultaneously the time gap to the next oncoming vehicle is large enough (>6 s), the system interprets thisas a suitable time gap for entering the intersection. The system output is therefore already given before the previous vehiclehas passed the intersection, in order to create a certain preparation time so that the driver can optimally benefit from therecommended gap. Therefore the speech output is ‘‘gap after approaching vehicle”. If the time gap has elapsed and the nextvehicle is approaching with the same conditions, the output is repeated with ‘‘gap after next vehicle”. All speech outputs(translated into German) were at least pretested with regard to the maximum allowed duration to avoid timely interferenceswith another and the global understanding of their meaning.
The time gap of 6 s which the system recommends as suitable was derived from a literature reference cited in the hand-book for the dimensioning of road systems (FGSV, 2005; Weinert, 2001). The so-called critical time gaps, i.e. the minimumtime gap in a superior traffic stream used by a subordinate vehicle for executing the intended manoeuver was derived fromthe distribution of time gaps observed under real traffic conditions and for different road systems. For the situation studiedhere a critical time gap of 6.6 s was measured. Comparable numbers are reported in Donath et al. (2007) with an actual meanof about 6 s for gaps that are selected by drivers.
2.3.2. HUD systemIn order to evaluate the AoD system’s specific characteristics, i.e. the speech-based interaction and the on-demand acti-
vation, it was compared with a reference system. However, there is no system on the market with comparable features sup-porting the driver in monitoring and manoeuver decision at urban intersections. Therefore, we decided to create a referencesystem that is always active and that uses the visual modality for giving feedback about upcoming traffic at the intersection.This was implemented via colored arrows in the HUD resembling the traffic coming from the right or left (Fig. 4).

Fig. 4. Simulated HUD display in the driving simulator with the colored arrows visualizing traffic information from the left and right direction at an urbanintersection.
202 N. Schoemig et al. / Transportation Research Part F 54 (2018) 196–210
We furhter decided that this system should be able to monitor both directions (i.e. left and right). Comparable systemstates, comparable conditions and identical parameter specifications as in the AoD system were used. Conditions now referalso to distances and time gaps for vehicles from the left. The speech output ‘‘vehicle from the right” in the AoD system isreplaced by a red arrow either from the right, left or both. The system state connected with the speech output ‘‘gap afterapproaching vehicle” is now replaced by a yellow arrow either from the right, left or both. The decision for entering the inter-section has to be made by the driver by combining the information from both directions (e.g. a yellow and a red arrowmeansit is not possible to enter the intersection). It was deliberately decided not to display a green arrow in the system state whereno vehicles are in the sensor range of the system (in contrast to the system described in Dotzauer et al., 2013) for the samereasons that the AoD system does not announce ‘‘right is free”. Instead, the red or yellow arrow simply disappears, if therespective condition is valid.
2.4. Driving course
In each drive the drivers had to drive through a set of several scenarios all containing an urban intersection. As basic lay-out for this scenario an X intersection was chosen with the host vehicle approaching from the subordinate road. Give waysigns are placed at the roadside. A stop line should assure that all drivers stop at a comparable distance in front of the inter-section entrance. The surrounding at the intersection is created in a way that the drivers cannot see the arriving vehicles onthe superordinate road when they approach the intersection. While waiting at the intersection the visual range is about 8 sto the right and 10 s to the left (taking 50 km/h as a basis). The instruction asks the driver to turn left at the intersection.
In each scenario traffic was continuously approaching the intersection. This traffic was operationalized by a sequence of10 vehicles arriving from the right and/or left. The vehicles were driving with a constant speed of 50 km/h and defined timegaps between each other. The last time gap in a sequence was defined sufficiently large such that every driver was able topass the intersection. Traffic density for both directions was varied on four levels (no, light, variable, high). The high trafficdensity was obtained by time gaps of 2 s between the vehicles, the light one by 7 s between vehicles. Variable traffic wascreated by varying the time gaps between 5 s and 7 s. By varying and combining traffic density from the left and right aset of eight basic scenarios was created. To investigate the influence of the different conditions on the time gaps driversaccepted when turning, intersections with increasing time gaps between vehicles were created. The resulting time gapsequence between vehicles was: 2 s, 2 s, 2 s, 4.5 s, 5.5 s, 6.5 s, 7.5 s, 8.5 s, 20 s. The first time gap recommended by the systemis the 6.5 s gap, as 6 s is set as threshold. To avoid influences from other factors, in these scenarios vehicles were approachingeither only from the left or the right direction.
These ten scenarios were put together to one driving course meaning that the driver drove from one intersection to thenext by always turning left. The scenarios were randomly assembled and the order of the scenarios was permuted in thedifferent drives to avoid sequence effects.
2.5. Experimental plan
All 24 drivers performed four subsequent drives (each with a different experimental condition – within-factor design, seeTable 1). The first drive was always a manual drive (MAN) where the drivers had to complete the scenarios without anyassistance. In the second and third drive drivers drove with the two system variants AoD and HUD. In order to assure thatall drivers have a comparable basis for system evaluation during this first AoD drive the drivers were instructed to use thesystem in all scenarios (even though the system’s basic idea is to be activated ‘‘on demand”). This drive was called theAoD-forced drive. Sequence effects from drive 2 and 3 were avoided by randomizing and counter-balanceing the sequencebetween the drivers.
Table 1Four conditions varied as within-factor in four different drives.
No Drive Instruction
1 Manual Without any assistance2 AoD – forced AoD instructed to be used in all scenarios3 HUD Visual assistance system (always active)4 AoD – free AoD used according to driver’s preference
N. Schoemig et al. / Transportation Research Part F 54 (2018) 196–210 203
In the fourth and final drive the drivers should then again drive with the AoD system but could now use it according totheir own preference, i.e. only in those situations where they wanted to have support (AoD-free drive).
2.6. Test procedure
All drivers started the test session with a 5 min introduction drive to get familiar with the simulator environment in thecity. The next drive was the manual drive without any assistance. After this drive, drivers answered a short questionnaire.The drivers then received a description of the AoD-forced or HUD system (depending on the sequence of drives) and con-ducted the according drive. This was followed by the corresponding drive (AoD-forced or HUD). Both drives started witha short practice run for getting used to the assistance system. After each scenario of the AoD-forced and HUD drive the dri-vers shortly rated how helpful the system had been in the previous scenario. They could either shortly stop for the answer or– after getting more familiar with the rating scale – also proceed driving. Both drives (AoD-forced and HUD) were followedby a questionnaire evaluating again the drive and the assistance system on different dimensions. After having completedboth system drives drivers compared both system variants in a separate questionnaire. The final drive was the AOD-freedrive where drivers could decide when to activate the system. This drive was followed by a questionnaire specifically regard-ing the ‘‘on-demand” concept. The total session took about 120 min. Drivers received a compensation of 30 € for their par-ticipation in the study.
2.7. Measures
Several measures were used to assess the acceptance of both system variants as well as specific system features. In thefollowing we will only explain those for which we also present results.
First, the drivers rated the usefulness of the system online during the drive after each scenario. They should answer thequestion ‘‘how helpful had the system been in the previous scenario?” We used a 16-point rating scale with verbal categoriesfrom ‘‘not at all” (0), over ‘‘very low” (1–3), ‘‘low” (4–6), ‘‘medium” (7–9), ‘‘high” (10–12), up to ‘‘very high” (13–15)helpfulness (Heller, 1985). After deciding for one verbal category, drivers were requested to further define their rating bynumbers from 0 to 15 in total.
After each of the two drives with the system variants AoD-forced and HUD the drivers received questionnaires for theevaluation of the system (e.g. acceptance, trust, usability, ease of use, perceived workload, emotional aspects, safety aspects,HMI features).
After having driven both system variants, a questionnaire was given for a direct comparison between them. Driversshould state which system variant (either AoD or HUD) and which drive they preferred and why. For the latter they shouldgive a ranking from 1 to 3 (with 1 as the most preferred) to the manual, the AoD and the HUD drive.
As behavioral measure the interaction with the AOD system was assessed in the AoD-free drive by investigating in whichsituations drivers activated the system and requested its assistance.
With regard to objective driving behaviour we analyzed in the scenarios with increasing time gaps from either the left orright which time gap the drivers chose in the different conditions, i.e. when driving manually or assisted.
In order to estimate the criticality of drivers’ behaviour, the minimal Time to Collisions (TTCs) and post encroachmenttimes (PETs – i.e. the time between the first road user leaving the common spatial zone and the second road user arrivingat it) between the host vehicle and crossing vehicles during the turning manoeuver were calculated. Different referencepoints for vehicles from left and right were used here. From left, the moment was used when the front bumper of the hostvehicle was in the middle of the left lane when turning. From the right, the moment was used when the rear bumper of thehost vehicle had arrived on the right lane.
As the criticality of the scenarios depends on the design of the traffic at the simulated intersections it seemed to be mostadequate to define criticality not by using absolute values but based on the distribution of values occurring in this specificsimulator study. Therefore the 5% most critical TTCs and PETs in the manual drive are chosen as a basis for the comparisonwith the assisted drives.
Drivers‘ monitoring behaviour was analyzed in selected scenarios by the number and duration of glances to the right andthe left. A scenario with variable traffic both from left and right was chosen for this analysis as in this situation most driverswaited the complete sequence of vehicles to pass resulting in a relatively long and stable waiting time at the intersection.Drivers’ eye tracking and head tracking was assessed with a four camera system manufactured by SmartEye. As eye trackingdata proved to be unreliable in the context of this specific study (due to strong head movements), head tracking was used

204 N. Schoemig et al. / Transportation Research Part F 54 (2018) 196–210
instead to infer the glance behaviour. This procedure is justified due to the large viewing angle required to monitor theoncoming traffic from the left and the right. Drivers had to turn their head together with the glances to the right and theleft. For defining glances the parameter head heading (in degree) was selected. Minimal head heading per glance was definedwith +/-20�, the minimal time distance between two glances had to be 100 ms and the minimal duration of head heading hadto be above 100 ms.
3. Results
3.1. Online ratings of usefulness
For the online ratings of usefulness, rated after each scenario, the lowest (minimum), the average (mean) and the highestrating (maximum) were calculated per drive and averaged across all drivers. The average online rating (see Fig. 5) across allten scenarios shows a significant higher usefulness (t(23) = 3.242; p = .004) for the AoD system (m = 8.6, sd = 3.84) comparedto the HUD system (m = 6.2, sd = 3.89) on the 16-point-rating scale. The absolute value however, is only in the medium rangeof the scale. This is reasonable as the perceived usefuleness of the system might depend on the traffic scenario. This inter-pretation is supported when looking at the highest and lowest ratings per drive. The maximum rating is 11.3 (sd = 3.81) forthe AoD system and 9.2 (sd = 3.82) for the HUD system (t(23)=2.412; p = .024). The minimum usefulness rating is also sig-nificantly higher for the AoD (m = 4.4, sd = 3.78) than for the HUD system (m = 2.3, sd = 3.87; t-test: t(23) = 2.414; p = .024).There is no significant effect of age on the ratings (F[1;20] = 0.011; p = .916).
3.2. Preference for drives and system variants
After the three drives MAN, AoD-forced, and HUD drivers were asked to rate the preferred drive by ranking them from 1(highest preference) to 3 (lowest preference). Results (Fig. 6 left) indicate a clear preference for the AoD system, followed bydriving manually. The lowest preference is given to the HUD system. Analyzing comments by the drivers yields hintstowards the higher potential for distraction of the visual feedback as a cause.
Drivers report a clear preference for the AoD system (see Fig. 6 right): 18 drivers (meaning¾) prefer the AoD systemwhilesix drivers (1/4) prefer the HUD system. There is no influence of age on these effects. In the middle-aged group 71% (10 out of14 drivers) prefer the AoD system, in the higher-aged group 80% (8 out of 10 drivers). Furthermore, the distribution of therankings of the drives is comparable for both age groups.
Fig. 5. Lowest, average and highest usefulness rating (with standard deviations) across one drive with ten scenarios for the AoD_forced drive and the HUDdrive.

Fig. 6. Ranking of the three drives Manual, AoD-forced and HUD (left) and preference of the 2 system variants AoD vs. HUD (right).
N. Schoemig et al. / Transportation Research Part F 54 (2018) 196–210 205
3.3. Detailed system evaluation
The results of the detailed system evaluation show that the AOD system is rated significantly more positive compared tothe HUD system (Fig. 7).
With regard to perceived usefulness and usability, the AoD system is rated as quite useful and meaningful, highly intu-itive, learnable and reliable. However, drivers trust the system to a moderate degree. The system gives sufficient feedbackand is rated highly comprehensible.
In contrast, the HUD system is rated significantly less useful and meaningful, less intuitive and less easy to use. In addi-tion, drivers are not fully satisfied with the feedback and the system’s comprehensibility. Drivers’ reliance on the system ismuch lower.
With regard to workload aspects the AoD system tends to decrease workload. The opposite is true for the HUD system.However, drivers answer that both systems do not distract them. Both monitoring and decision making are rated to be quitehighly facilitated by the AoD system. On the other hand, the HUD system makes monitoring even more difficult (probablydue to the fact that information for both directions is displayed). Drivers rate their general Situation Awareness (SA) asincreased by the AoD system while they report that the HUD slightly decreases SA.
Furthermore, the AOD system provokes clearly positive emotions. Drivers report that they like using the system, feel notannoyed by it and feel safe when using it. The expressed buying interest is on average ranked as neutral. In contrast to this,the HUD system evokes negative feelings when using it and an unwillingness to buy the system.
When analyzing the perceived safety aspects drivers rate the AoD and the HUD system as not leading to risky drivingbehaviour. The AoD system increases their personal safety but only to a lower extent the general traffic safety. The HUD sys-tem’s potential to increase driving safety is rated significantly lower.
3.4. Activation of the AoD system in the AoD-free drive
Fig. 8 left shows how often drivers activated the AoD system in the AoD-free drive depending on their system preference(AoD vs. HUD vs. MAN). Drivers preferring the AoD system use it in 70% of the scenarios. Drivers who prefer driving manuallyuse the AoD system much less. Fig. 8 right illustrates the dependency of system usage on the traffic scenario: In situationswith lower traffic density fewer drivers use the system.
3.5. Gap choice
In two scenarios time gaps between vehicles from left and right increased systematically from 4.5 s to 8.5 s. This allowedmeasuring which time gaps drivers choose when driving manually or when being assisted by the AoD or HUD system.According to the functionality of the systems, the time gaps 6.5 s, 7.5 s and 8.5 s are recommended as suitable (in AoD onlyfrom the right, in HUD both from the left and the right). Time gaps of 4.5 s and 5.5 s are interpreted as being too small forsafely entering the intersection.

Fig. 8. Percentage of system usage in the AoD-free drive depending on driver’s preference (left) and depending on the traffic scenario (right; coding: l= left;r = right, 0 = no traffic,1 = light, 2 = variable, 3 = dense; inc. = increasing time gaps).
Fig. 7. Detailed system evaluation of both systems AoD and HUD on different dimensions rated on a 5-point-scale with agreement/disagreement towards astatement. An asterisk (*) marks significant differences in a t-test for repeated measures.
206 N. Schoemig et al. / Transportation Research Part F 54 (2018) 196–210

Fig. 9. Selected time gaps for entering the intersection in Situations 9 and 10 with increasing time gaps between vehicles from either the left or the rightdirection.
N. Schoemig et al. / Transportation Research Part F 54 (2018) 196–210 207
Fig. 9 shows that only the time gaps 4.5 s, 5.5 s and 6.5 s are chosen for entering the intersection. This means that driverseither chose time gaps smaller than the time gaps recommended during the assisted drives or exactly the recommended gap.None of the drivers waits for a larger time gap in order to negotiate the intersection.
An analysis of the distribution of chosen time gaps from the left reveals that the drivers choose larger time gaps in theassisted drives compared to the manual drive (Chi2-test: 18.001; df = 4; p = 001). The time gaps most often chosen fromthe left are 4.5 s during the manual (79%) and AoD drive (58%). Note that, as the AoD system gives no recommendationfor gaps from the left, this gap is the one selected by the drivers themselves. In the HUD condition, the system recommendsa larger time gap than most drivers chose during the manual drive. However, they most often selected the 5.5 s gap which issmaller than the recommended 6.5 s gap. This means that drivers very often ignored the system’s recommendations.
For time gaps from the right there is no significant difference in the distribution of time gaps between the three exper-imental conditions (Chi2-test: 4.896; df = 4; p = .298). Nevertheless, a descriptive analysis shows that drivers chose largertime gaps in the assisted drives compared to the manual drive. Whereas drivers most often opt for 4.5 s time gaps duringthe manual drive, there is a slight preference for the 6.5 s time gap in the assisted drives. This is in accordance with the rec-ommendations given by the AoD as well as the HUD system indicating that driver’s followed the recommendations althoughthey would intuitively chose smaller time gaps.
When analyzing the effect of age group on gap choice, statistical tests show for none of the experimental condition a sig-nificant effect (time gaps from left: MAN: Chi2-test = 2.454; df = 2; p = .293; AoD: Chi2-test = 1.665; df = 2; p = .435; HUD:Chi2-test = 2.450; df = 2; p = .294; time gaps from right: MAN: Chi2-test = 3.531; df = 2; p = .171; AoD: Chi2-test = 0.551;df = 2; p = .759; HUD: Chi2-test = 0.046; df = 2; p = .977). Therefore, older drivers do not chose other time gaps comparedto the middle-aged group.
3.6. TTCs and PETs when crossing the intersection
In order to estimate the number of critical situations that occurred when drivers entered the intersection the percentageof TTC and PET values during the assisted drives that are smaller than the 5% TTC and PET percentile of the manual drive(defined as critical values) were taken (Fig. 10). The 5% percentile of minimal PET with traffic from the right is 1.64 s (6out of 138 valid cases lie below this value). In the AoD drive, 10.9% of the cases are below this as critical defined threshold(14 out of 128 valid cases). In the HUD drive, 10.8% of the cases are below this threshold (13 out of 120 valid cases). Statis-tically, this difference between the conditions is not significant (Chi2 = 4.850; df = 2; p = .088). (see Fig. 11.)
The 5% percentile of minimal TTC with traffic from the left is 2.43 s (5 out of 108 valid cases lie below this value). In theAoD drive, 1% of the cases are below this as critical defined threshold (1 out of 102 valid cases; please note: there was noassistance for traffic from the left in this condition). In the HUD drive, 4% of the cases are below the threshold (4 out of99 valid cases). Again, this difference between the experimental conditions is statistically not significant (Chi2 = 2.532; df= 2; p = .282).
3.7. Monitoring behaviour
In the analyzed situation the number of glances to the left and the right does not differ significantly between the condi-tions (Friedman-test; left: p = .625; right: p = .202). The glance duration to the left differs almost significantly between theconditions (F[2;44] = 3.117; p = .054) with longer glances in the AoD drive compared to the HUD drive (t = 3.068; df = 22;p = .006). Glance duration to the right differs statistically significantly as an effect of the experimental condition

Fig. 10. Percentage as critical defined PETs from the right (left) and TTCs from the left (right) across the three conditions.
Fig. 11. Number (left) and duration (right) of glances to the right and the left in the drives manual, AoD_forced and HUD, analyzed for the selected scenariol2/r2 (left_variable/right variable traffic).
208 N. Schoemig et al. / Transportation Research Part F 54 (2018) 196–210
(F[2;36] = 3.405; p = .044) with shorter glances during the AoD drive compared to the manual drive (t = 2.580, df = 18;p = .019). The results reveal that drivers still execute a comparable number of glances to check the traffic at the intersectionalthough they are supported by an assistance system. However, with the AoD monitoring the traffic from the right, driversreorient their attention and show shorter looks to the right and more extended glances to the left.
4. Discussion and conclusions
Altogether, it can be stated that the AoD system reaches high acceptance ratings both in groups of middle-aged as well ashigher-aged drivers. It is rated better compared to a visually, always active system on many different dimensions. Withregard to driving behaviour it is comparably safe as manual driving while at the same time facilitating driver’s monitoringof crossing traffic.
This result is remarkable as the system has some constraints that might have reduced acceptance of the drivers – butactually did not. The first constraint was the decision to design the system as a supporting system for monitoring and deci-sion making that leaves the final responsibility whether and when to cross the intersection with the driver. This ‘‘cooperativeapproach” was highly accepted by the drivers indicating that sharing different driving tasks between the driver and thesystem is appreciated by the drivers. This is somewhat in contrast to the current strong trend towards automating as manydriving tasks as possible. Especially in the case of urban traffic where automated driving will remain a very challenging taskfor the next decade this cooperative concept might be a promising strategy.

N. Schoemig et al. / Transportation Research Part F 54 (2018) 196–210 209
The second constraint was that the AoD system used in the study was able to monitor only one direction. Anotherapproach would be a system that is also able to monitor more than one direction and might combine this information toa more global statement about the general traffic situation at an intersection. This increase in system functionality mightfurther decrease workload and increase acceptance. However, the low acceptance of the HUD system that provided a higherlevel of information by combining recommendations for traffic from the left as well as from the right indicates how difficultthis approach will be. Future research is required for understanding to what extent the increased functionality of the systemmight require an even clearer communication between the driver and the system. The collected comments by the driversshow that many drivers explicitly favored the idea that they are allowed to concentrate their attention to only one direction(while the AoD system monitors the other direction). Drivers’ glance behaviour further indicated that as the system onlymonitors one direction the drivers still scan and observe the traffic environment. At the same time, their workload isreduced, because the task of just checking the system recommendation may be easier than identifying a suitable gap amongcomplex incoming traffic. It is also plausible that the active selection of a single supervisory direction prepares the driver foran action based on the expected system speech feedback. This preselection narrows the possible action alternatives andthereby may reduce the overall workload. Taking these results into consideration the strategy of monitoring only one direc-tion worked fine – although the system might be able to provide even more information. However, it would be important toconsider potential risks of increased exposure such that the driver might completely stop checking the driving environmentand overrely on the system‘s output.
The third constraint was that the recommended time gaps might have been somewhat too conservative compared to thetime gaps selected by some drivers. Especially for traffic from the left smaller time gaps might be recommended. However, inorder to guarantee safe driving and taking into account drivers’ reaction time the decision for a more conservative approachis highly justified. In addition, drivers gave high acceptance ratings. The acceptance might further increase if the time gapsare adapted to the individual driver. In Orth, Kolossa et al. (2017) we investigated individual driver’s gap acceptance andfound that there is a large variation from driver to driver. Furthermore, we also derived an algorithm to estimate this per-sonalized gap acceptance from few observations. In Orth, Schömig et al. (2017) we used this algorithm to provide person-alized gaps to the drivers. First results confirm the hypothesis that these personalized recommendations increase theacceptance of the AoD system.
Using speech for communicating with the driver was highly appreciated by the drivers. It has the potential to promote theintegration of the highly increasing number of assistance functions on one common platform. This common platform couldbe a ‘‘speech interface”. With more assistance systems in a vehicle the driver needs more know-how to comprehend and usethem appropriately. In order to simplify the interaction between the driver and the vehicle, an integrated interface could beuseful. This interface should combine functions and contents of all available assistance systems and data bases, both from thevehicle as well as from external devices such as smartphones (see Biester, 2009). This approach would allow the user toaccess all different functions and applications while giving him/her the impression to interact with only one partner. Thisconcept would have the potential to increase systems’ usability thus increasing driver acceptance of assistance systems.However, it has to be noted that the positive ratings of speech were derived in a well-controlled setting of a simulator study,where no disturbing noise such as radio or crying children in the back were present. Future research is required to getinsights into what the acceptance will be in natural exposure over time.
The on-demand concept is a well-accepted feature. This is supported by the result that the usefulness ratings given by thedrivers strongly depend on specific factors, e.g. the traffic density at an intersection. Therefore, the opportunity to activatethe system only if support is really desired increases driver acceptance. However, this is only one aspect of the concept ofcooperative control. A further advance would be, if the system itself would start the interaction with the driver in case itperceives a potential need for support. In this case, the system would offer the driver some assistance and he/she coulddecide whether to accept or reject the offer. Biester (2009) already studied the resulting bidirectional communicationbetween the driver and the system – however, in a non-controlled way and by using the wizard-of-oz-technique.
Further studies could analyze whether a realistic system using a formal algorithm for this bidirectional interaction wouldbe accepted by drivers and how it should be designed in detail. Furthermore, it would be interesting whether a system solu-tion which monitors both directions (but with the challenge to mentally assign system feedback to the respective direction)would lead to comparable positive results regarding workload and acceptance.
Acknowledgments
The project was funded by Honda Research Institute Europe.
References
Biester, L. (2004). Application of ccoperation between human and machine in cars. Paper presented at the 21. VDI/VW Gemeinschaftstagung, Wolsfburg.Biester, L. (2009). Cooperative automation in automobiles Dissertation. Berlin: Humboldt-University.Bratman, M. E. (1992). Shared cooperative activity. The Philosophical Review, 101(2), 327–341.Campbell, J. L., Richard, C. M., Brown, J. L., & McCallum, M. (2007). Crash warning system interfaces: Human factors insights and lessons learned. Report no. HS
810 697. National Highway Traffic Safety Administration.Donath, M., Shankwitz, C., Ward, N., & Creaser, J. (2007). Intersection decision support: an overview. Report no. MN/RC 2007–33. Minnesota Department of
Transportation.

210 N. Schoemig et al. / Transportation Research Part F 54 (2018) 196–210
Dotzauer, M., Caljouw, S. R., deWaard, D., & Brouwer, W. H. (2013). Intersection assistance: A safe solutionfor older drivers? Accident Analysis and Prevention,59, 522–528.
FGSV (2005). Handbuch für die Bemessung von Straßenverkehrsanlagen. HBS, Ausgabe 2001, Fassung 2005. Köln: Forschungsgesellschaft für Straßen- undVerkehrswesen, e.V.
Hancock, P. A., Wulf, G., Thom, D., & Fassnacht, P. (1990). Driver workload during differing driving maneuvers. Accident Analysis and Prevention, 22(3),281–290.
Heckmann, M., & Wersing H. (2015). Method for controlling a driver assistance system. Europ. Patent application EP 2 949 536 A1. 2 Dec. 2015.Heller, O. (1985). Hörfeldaudiometrie mit dem Verfahren der Kategorienunterteilung (KU). Psychologische Beiträge, 27, 478–493.Klanner, F., Thoma, S., & Winner, H. (2008). Fahrerverhaltensuntersuchungen und Mensch-Maschine-Interaktionskonzepte für die Kreuzungsassistenz. 3. Tagung
Aktive Sicherheit durch Fahrerassistanz. 7–8 April, 2008. Garching bei München.Klauer, S. G., Dingus, T. A., Neale, V. L. Sudweeks, J. D., & Ramsey, D.J. (2006). The impact of driver inattention on near crash/crash risk: an analysis using the 100-
car naturalistic driving study data. National Highway Traffic Safety Administration (NHTSA) Report no. DOT HS 810 594. Washington, DC: NHTSA.Lee, S. E., Perez, M. A., Doerzaph, Z. R., Stone, S. R., Neale, V. L., Brown, . . . Dingus, T.A. (2007). Intersection collision avoidance-violation project: Final project
report. Report no. DOT HS 810 749. National Highway Traffic Safety Administration.Mercedes Benz – BAS Plus with cross traffic Assist. Available at: <http://techcenter.mercedesbenz.com/de/bas_plus_cross_traffic_assist/detail.html>
(18.02.2016).Najm, W., Sen, B., Smith, D., & Campbell, B. (2003). Analysis of light vehicle crashes and pre-crash scenarios based on the 2000 general estimates system.
Washington, DC: National Highway Traffic Safety Administration, US Department of Transportation.Naujoks, F., & Neukum, A. (2014). Timing of in-vehicle advisory warnings based on cooperative perception. In D. de Waard, K. Brookhuis, R. Wiczorek, F. die
Nocera, R. Brouwer, P. Barham, C. Weikert, A. Kluge, W. Gerbino & A. Toffeti (Eds.), Proceedings of the human factors and Ergonomics Society Europe chapter2013 annual conference. ISSN 2333-4959. Available at: <http:/hfes-europe.org>.
Neukum, A., & Krüger, H.-P. (2003). Ein Trainingskonzept zur Schulung von Einsatzfahrten. In C. Lorei (Ed.), Polizei und Psychologie. Kongressband der Tagung,Polizei und Psychologie‘‘ am 18. Und 19. März in Frankfurt am Main (pp. 515–534). Frankfurt am Main: Verlag der Polizeiwissenschaft.
Orth, D., Kolossa, D., Sarria Paja, M., Schaller Pech, A., & Heckmann, M. (2017). A maximum likelihood method for driver-specific critical-gap estimation. IEEEIntelligent Vehicles Symposium (IV), 553–558.
Orth, D., Schömig, N., Mark, Ch., Jagiellowicz-Kaufmann, Kolossa, D. & Heckmann, M. (2017). Benefits of Personalization in the context of a speech-basedleft-turn assistant. In Conference Proceedings of the 9th International Conference on Automotive User Interfaces and Interactive Vehicular Applications(Automotive UI’17). Oldenburg, Germany, September, 24–27, 2017.
Owens, J. M., McLaughlin, S. B., & Sudweeks, J. (2010). On-road comparison of driving performance measures when using handheld and voice-controlinterfaces for mobile phones and portable music players. SAE International Journal of Passengers Cars – Mechanical Systems, 3(1), 734–743.
Owens, J. M., McLaughlin, S. B., & Sudweeks, J. (2011). Driver performance while text messaging using handheld and in-vehicle systems. Accident Analysisand Prevention, 43(3), 939–947.
Schömig, N., Schoch, S., Neukum, N., Schumacher, M., & Wandtner, B. (2015). Simulatorstudien zur Ablenkungswirkung fahrfremder Tätigkeiten (Berichte derBundesanstalt für Straßenwesen, Reihe Mensch und Sicherheit, Heft M253). Bremen: Carl Schünemann Verlag. Available at: http://bast.opus.hbz-nrw.de/volltexte/2015/835/.
Sheridan, T. B. (1992). Telerobotics, automation and human supervisory control. Cambridge, MA: MIT Press.Stinchcombe, A., & Gagnon, S. (2009). Estimating workload demands of turning left at intersections of varying complexity. In Proceedings of the 5th
international driving symposium on human factors in driver assessment, training and vehicle design, 440–446.Tijerina, L., Parmer, E., & Goodman, M.J. (1998). Driver workload assessment of route guidance system destination entry while driving: A test track study. In
Proceedings of the 5th ITS world congress, Seoul, Korea.Toyota Pre Crash Safety System (2016). Available at: <http://www.toyota.co.jp/en/news/09/0226.html> (15.04.2016).Tsimhoni, O., Smith, D., & Green, P. (2004). Address entry while driving: Speech recognition versus a touch-screen keyboard. Human Factors, 46(4), 600–610.Verwey, W. B. (2000). On-line driver workload estimation. Effects of road situation and age on secondary task measures. Ergonomics, 43, 187–209.Weinert, A. (2001). Grenz- und Folgezeitlücken an Knotenpunkten ohne Lichtsignalanlagen Dissertation. Bochum: Ruhr-Universität Bochum.