transportation project impact case studies...
TRANSCRIPT

SHRP 2 Reliability Project C03
Transportation Project Impact Case Studies (T-PICS)
User Guide
SHRP 2 Reliability Project C03
Transportation Project Impact Case Studies (T-PICS)
User Guide
Economic Development Research Group, Inc.
In association with
ICF International Cambridge Systematics, Inc. Wilbur Smith Associates, Inc.
TRANSPORTATION RESEARCH BOARD Washington, D.C.
2015 www.TRB.org

© 2015 National Academy of Sciences. All rights reserved. ACKNOWLEDGMENT This work was sponsored by the Federal Highway Administration in cooperation with the American Association of State Highway and Transportation Officials. It was conducted in the second Strategic Highway Research Program, which is administered by the Transportation Research Board of the National Academies. COPYRIGHT INFORMATION Authors herein are responsible for the authenticity of their materials and for obtaining written permissions from publishers or persons who own the copyright to any previously published or copyrighted material used herein. The second Strategic Highway Research Program grants permission to reproduce material in this publication for classroom and not-for-profit purposes. Permission is given with the understanding that none of the material will be used to imply TRB, AASHTO, or FHWA endorsement of a particular product, method, or practice. It is expected that those reproducing material in this document for educational and not-for-profit purposes will give appropriate acknowledgment of the source of any reprinted or reproduced material. For other uses of the material, request permission from SHRP 2. NOTICE The project that is the subject of this document was a part of the second Strategic Highway Research Program, conducted by the Transportation Research Board with the approval of the Governing Board of the National Research Council. The Transportation Research Board of the National Academies, the National Research Council, and the sponsors of the second Strategic Highway Research Program do not endorse products or manufacturers. Trade or manufacturers’ names appear herein solely because they are considered essential to the object of the report. DISCLAIMER The opinions and conclusions expressed or implied in this document are those of the researchers who performed the research. They are not necessarily those of the second Strategic Highway Research Program, the Transportation Research Board, the National Research Council, or the program sponsors. The information contained in this document was taken directly from the submission of the authors. This material has not been edited by the Transportation Research Board. SPECIAL NOTE: This document IS NOT an official publication of the second Strategic Highway Research Program, the Transportation Research Board, the National Research Council, or the National Academies.

The National Academy of Sciences is a private, nonprofit, self-perpetuating society of distinguished scholars engaged in scientific and engineering research, dedicated to the furtherance of science and technology and to their use for the general welfare. On the authority of the charter granted to it by Congress in 1863, the Academy has a mandate that requires it to advise the federal government on scientific and technical matters. Dr. Ralph J. Cicerone is president of the National Academy of Sciences.
The National Academy of Engineering was established in 1964, under the charter of the National Academy of Sciences, as a parallel organization of outstanding engineers. It is autonomous in its administration and in the selection of its members, sharing with the National Academy of Sciences the responsibility for advising the federal government. The National Academy of Engineering also sponsors engineering programs aimed at meeting national needs, encourages education and research, and recognizes the superior achievements of engineers. Dr. C. D. (Dan) Mote, Jr., is president of the National Academy of Engineering.
The Institute of Medicine was established in 1970 by the National Academy of Sciences to secure the services of eminent members of appropriate professions in the examination of policy matters pertaining to the health of the public. The Institute acts under the responsibility given to the National Academy of Sciences by its congressional charter to be an adviser to the federal government and, upon its own initiative, to identify issues of medical care, research, and education. Dr. Victor J. Dzau is president of the Institute of Medicine.
The National Research Council was organized by the National Academy of Sciences in 1916 to associate the broad community of science and technology with the Academy’s purposes of furthering knowledge and advising the federal government. Functioning in accordance with general policies determined by the Academy, the Council has become the principal operating agency of both the National Academy of Sciences and the National Academy of Engineering in providing services to the government, the public, and the scientific and engineering communities. The Council is administered jointly by both Academies and the Institute of Medicine. Dr. Ralph J. Cicerone and Dr. C.D. (Dan) Mote, Jr., are chair and vice chair, respectively, of the National Research Council. The Transportation Research Board is one of six major divisions of the National Research Council. The mission of the Transportation Research Board is to provide leadership in transportation innovation and progress through research and information exchange, conducted within a setting that is objective, interdisciplinary, and multimodal. The Board’s varied activities annually engage about 7,000 engineers, scientists, and other transportation researchers and practitioners from the public and private sectors and academia, all of whom contribute their expertise in the public interest. The program is supported by state transportation departments, federal agencies including the component administrations of the U.S. Department of Transportation, and other organizations and individuals interested in the development of transportation. www.TRB.org
www.national-academies.org

Contents
Chapter 1 Introduction.........................................................................................................1
Project Background and Overview .............................................................................1
Objective of the T-PICS Web Tool ............................................................................2
Chapter 2 Instructions for Using the T-PICS On-Line Database and Project Tool ......4
Home Page ..................................................................................................................4
Case Search Page ........................................................................................................4
My Project Tools Page ..............................................................................................14
Chapter 1 Introduction Project Background and Overview The second Strategic Highway Research Program (SHRP 2) Capacity Project C03, Interactions Between Transportation Capacity, Economic Systems, and Land Use, produced a series of reports on methods, models, and case studies that examined the economic and development impacts of highway capacity investment projects. This report is one volume in that series. Project Objective The intent of this project and its research products and web tool is to further public and transportation agency understanding of the range of economic impacts that result from various types of highway projects. The information provided can aid both technical research and public discussion of the topic. It can also assist transportation agencies in their planning processes by helping define the broad range of impacts and factors affecting highway projects. And it can help refine public debate about highway projects by establishing boundaries of the likely positive and negative impacts of such projects.
The products of this study were designed to help the collaborative decision-making process for transportation planning by providing data from the range of observed results from past highway projects. Such information can potentially be of substantial use in early stages of the planning process when alternative project concepts are being suggested and screened.
Of course, one cannot assume that every proposed project will have the same results as the average observed from past projects of a similar type. The unreliability of such an assumption is precisely why local data are collected and models developed in later stages of the planning process to identify expected changes in local traffic characteristics and subsequent economic development. Thus, this project should be viewed as a complement to, rather than a replacement for, location-specific transportation and economic impact analysis that may be necessary in later phases of the planning process. Case Study Database The most notable accomplishment of this project was the development of 100 case studies of highway projects to (a) compare pre- and postproject changes in economic and land development conditions, (b) contrast them with corresponding conditions to provide a basis for comparison, and (c) include both quantitative impact measures and qualitative assessments based on local interviews.
1. This collection of case studies, completed in 2010, was compiled with the goal of including all known preproject and postproject highway impact studies in the United States, plus available English-language studies from Canada and abroad. Members of the
1

project team then conducted additional quantitative and qualitative data collection and analysis to bring all of the cases up to a similar standard of comparability. For further information on the case study development process, readers are referred to Chapter 3 in SHRP 2 Report S2-C03-RR: Interactions Between Transportation Capacity, Economic Systems, and Land Use (http://www.trb.org/Main/Blurbs/166934.aspx).
T-PICS Web Tool The case studies were put into Transportation Project Impact Case Studies (T-PICS), a web-based viewing and analysis system that includes (a) a search function that allows for user-defined screening and selection of relevant cases; (b) a case study viewer that provides user access to impact measures, discussion text, maps, and related documents; and (c) an impact estimation calculator that shows the average and expected range of impacts associated with any user-defined project profile. For further information on this system, readers are referred to the T-PICS Web Tool User Guide, which can be accessed at http://transportationforcommunities.com/t-pics.
The T-PICS system was designed to assist transportation agencies in project planning and evaluation by providing agency staff and interested stakeholders with a means for establishing the range of job, income, and development impacts typically associated with various types of transportation projects in different settings. Objective of T-PICS Web Tool The T-PICS web tool was designed for the user to do the following:
• Review, select, and analyze case studies based on criteria selection; • Understand the relationship between project characteristics and economic impacts; • Compare and evaluate projects by specified criteria; and • Develop a range of anticipated impacts for customized projects.
The tool’s user interface is structured around two approaches to project analysis:
• “Case Search” accesses the database of case studies of highway projects, which allows users to 1. Filter the cases they want to see based on a variety of factors (e.g., type, region, and
cost); 2. Select cases to view separately or to compare based on their criteria; 3. View before and after conditions, project area settings, project characteristics,
intermodal freight or passenger volume (if applicable), and economic impacts for each case;
2
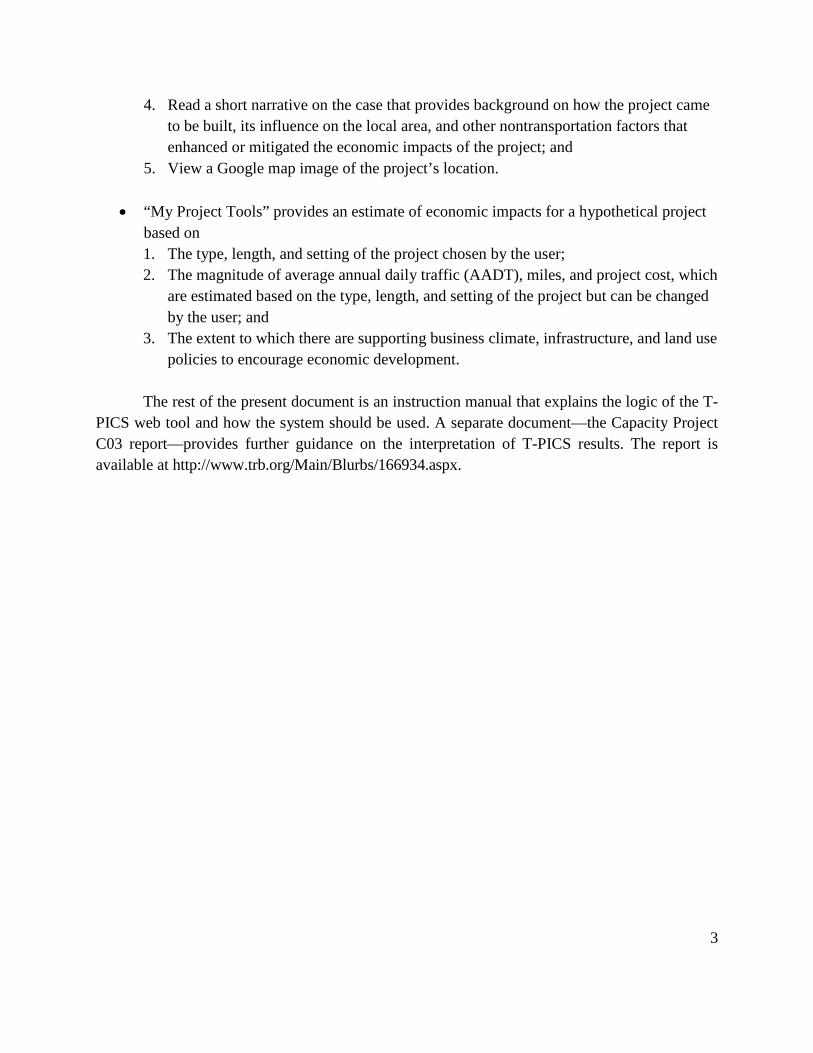
4. Read a short narrative on the case that provides background on how the project came to be built, its influence on the local area, and other nontransportation factors that enhanced or mitigated the economic impacts of the project; and
5. View a Google map image of the project’s location.
• “My Project Tools” provides an estimate of economic impacts for a hypothetical project based on 1. The type, length, and setting of the project chosen by the user; 2. The magnitude of average annual daily traffic (AADT), miles, and project cost, which
are estimated based on the type, length, and setting of the project but can be changed by the user; and
3. The extent to which there are supporting business climate, infrastructure, and land use policies to encourage economic development.
The rest of the present document is an instruction manual that explains the logic of the T-
PICS web tool and how the system should be used. A separate document—the Capacity Project C03 report—provides further guidance on the interpretation of T-PICS results. The report is available at http://www.trb.org/Main/Blurbs/166934.aspx.
3

Chapter 2 Instructions for Using the T-PICS Online Database and Project Tool Home Page First, the user should go to the T-PICS website (http://transportationforcommunities.com/t-pics) or access it through the Related Research link at the bottom of the Transportation for Communities—Advancing Projects through Partnerships (TCAPP) home page (http://www.transportationforcommunities.com/).
The menu bar near the top of the T-PICS home page (Figure 2.1) features four buttons shaded in gray: Home, Case Search, My Project Tools, and About T-PICS.
• Case Search should be selected if the user wants to see case studies of actual projects, and • My Project Tools should be selected if the user wants to estimate the economic impacts
of a hypothetical project.
Figure 2.1. T-PICS home page. Case Search Page Basic Criteria The Case Search page can be accessed by clicking on either the gray Case Search tab in the menu across the upper screen or the box in the lower left corner of the screen.
The Case Search option allows users to select a series of project characteristics to meet
4

their criteria. T-PICS then provides a list of project cases that meet the selected criteria.
Selecting Case Search brings the user directly to the Basic Criteria screen, which provides six categories (five criteria and a keyword search option) with which to define the type of case study projects that will be selected (Figure 2.2). The first three criteria—project type, region, and motivation—allow the user to choose or reject all or some of the various choices within each criterion. Users can select any categories they want as the default settings include all 100 case studies. Unchecking boxes will remove case studies with these criteria from the search results. The six categories are as follows:
• Project Type. Covers all the case study project types: bypass, limited access road, beltway, interchange, bridges, access road, widening, connector, intermodal freight, and intermodal passenger;
• Region. Lists the six geographic regions where the case studies were located, based on those defined by the Bureau of Economic Analysis (BEA);
• Motivation. Lists reasons for the project, based on access, market expansion, development, congestion mitigation, and tourism (a project can have multiple motivations);
• Urban/Class Level. Indicates whether a project is located in a metropolitan (metro), rural, or urban and rural (mixed) environment, based on U.S. Census classifications by county;
• Economic Distress. Denotes whether local and/or regional unemployment levels are higher (Distressed) or lower (Non Distressed) than the national average; and
• Keywords. Enables a search for keywords in the narrative portion of each case study, which includes an in-depth description and economic analysis of the project.
Once the Basic Criteria have been selected, the number of potential matches is listed in
the upper right corner of the screen. Clicking on the View Results button on the left side of the screen will show the user all
the cases that fit the selected criteria. If further refinement is desired, the user can proceed to Other Criteria to filter the cases
by project cost, AADT, and other factors.
5

Figure 2.2. Case Search—Basic Criteria. Other Criteria The Other Criteria screen provides ten additional project selection criteria from a range of values based on the case studies (Figure 2.3). To select the value for each category, the user drags the triangle slider icons to define the range of desired values. The number of Potential Matches in the upper right corner will change as the sliders move. The other criteria are as follows:
• Project Cost ranges from $0 to more than $1 billion (measured in 2008 dollars); • Market Size describes the size of the population (ranging from 0 to 4 million, in
thousands) within 40 minutes of the study area; • AADT counts (in thousands) for the project range from 0 to 500,000; • Population Density defines the population per square mile, ranging from 0 to 16,200; • Airport Travel Distance describes (in miles) the distance required to travel to the
nearest commercial airport, ranging from 0 to 150 miles; • Topography measures the type of terrain in the case study, from 1 (flat) to 21
(mountainous); • Length gives the distance (in miles) of the project, from 0 to 325 miles; and • Population, Employment, and Income Growth Rates describe the percentage growth
rates for these three categories from 2001 to 2006.
6
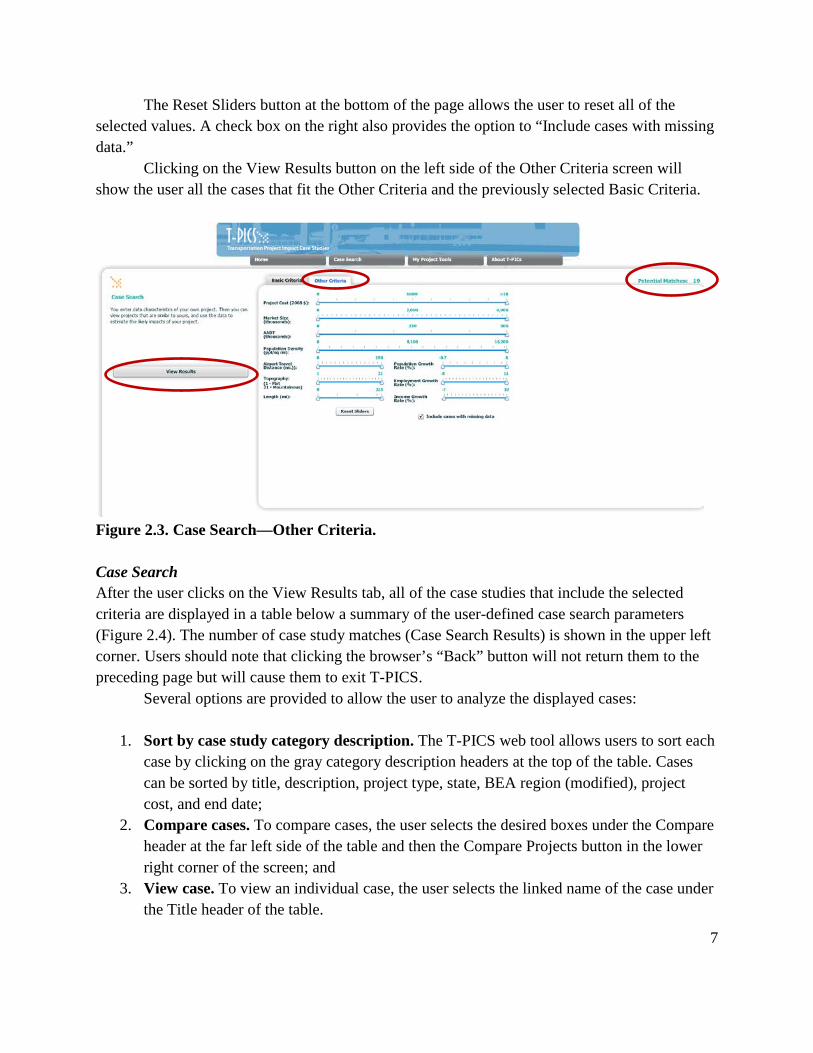
The Reset Sliders button at the bottom of the page allows the user to reset all of the selected values. A check box on the right also provides the option to “Include cases with missing data.”
Clicking on the View Results button on the left side of the Other Criteria screen will show the user all the cases that fit the Other Criteria and the previously selected Basic Criteria.
Figure 2.3. Case Search—Other Criteria. Case Search After the user clicks on the View Results tab, all of the case studies that include the selected criteria are displayed in a table below a summary of the user-defined case search parameters (Figure 2.4). The number of case study matches (Case Search Results) is shown in the upper left corner. Users should note that clicking the browser’s “Back” button will not return them to the preceding page but will cause them to exit T-PICS.
Several options are provided to allow the user to analyze the displayed cases:
1. Sort by case study category description. The T-PICS web tool allows users to sort each case by clicking on the gray category description headers at the top of the table. Cases can be sorted by title, description, project type, state, BEA region (modified), project cost, and end date;
2. Compare cases. To compare cases, the user selects the desired boxes under the Compare header at the far left side of the table and then the Compare Projects button in the lower right corner of the screen; and
3. View case. To view an individual case, the user selects the linked name of the case under the Title header of the table.
7
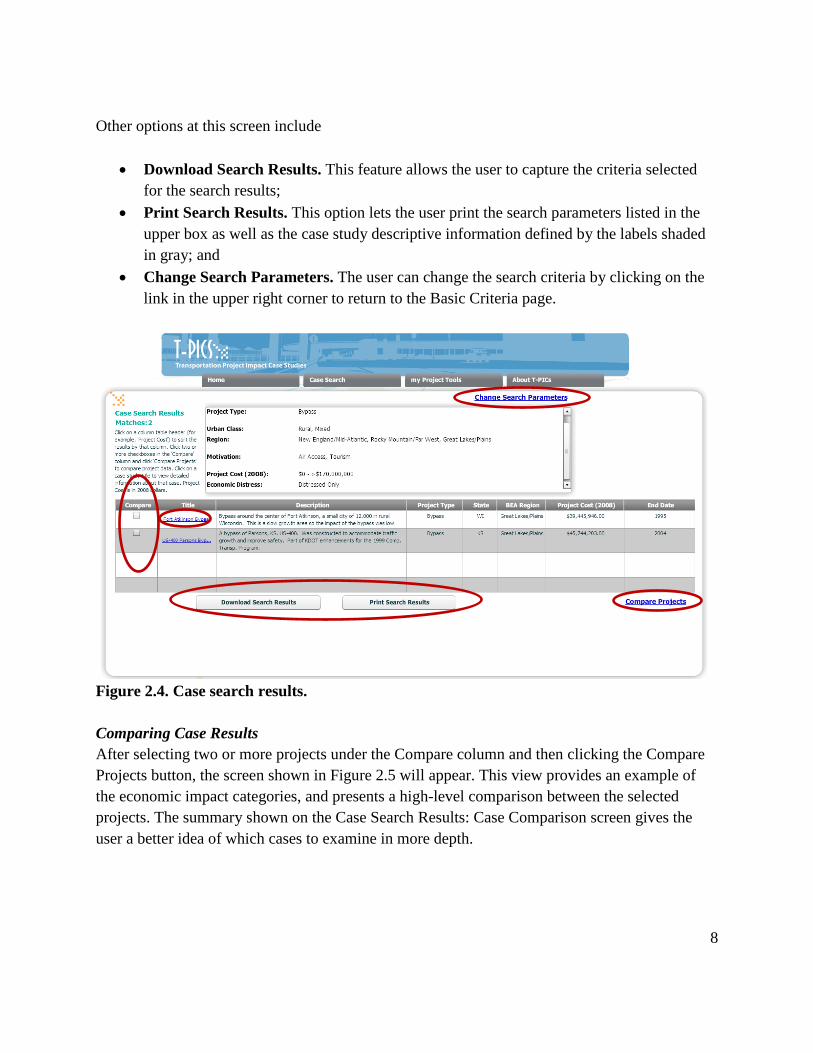
Other options at this screen include
• Download Search Results. This feature allows the user to capture the criteria selected for the search results;
• Print Search Results. This option lets the user print the search parameters listed in the upper box as well as the case study descriptive information defined by the labels shaded in gray; and
• Change Search Parameters. The user can change the search criteria by clicking on the link in the upper right corner to return to the Basic Criteria page.
Figure 2.4. Case search results. Comparing Case Results After selecting two or more projects under the Compare column and then clicking the Compare Projects button, the screen shown in Figure 2.5 will appear. This view provides an example of the economic impact categories, and presents a high-level comparison between the selected projects. The summary shown on the Case Search Results: Case Comparison screen gives the user a better idea of which cases to examine in more depth.
8

Figure 2.5. Case Search results—Case Comparison. Viewing a Specific Case The user can view a specific case by clicking on the Back to Results button at the top right corner of the Case Search Results: Case Comparison page and then clicking on the case study name under the Title column. The resulting screen (Figure 2.6) features tabs for different categories of information available for the selected study. (Clicking on the Back to Results button in the top right corner of the screen will return the user to the Case Search Results page.)
The first tabbed table that appears, labeled Characteristics, provides a summary of the original user-defined search parameters with a few additional points of data about the project (e.g., city; impact area, which for U.S. cases is based on counties; construction start and end dates; and latitude and longitude, determined by the Geographical Information System, or GIS).
9

Figure 2.6. Case Search Results—Characteristics.
The Intermodal tab provides information about planned cost, actual cost, freight volume, and passenger volume for intermodal projects as shown in Figure 2.7. This tab is inactive for nonintermodal projects.
Figure 2.7. Case Search Results—Intermodal.
The Setting tab shows the Other Criteria specific to the case (Figure 2.8).
10

Figure 2.8. Case Search Results—Setting.
The Pre/Post Conditions tab lists pre- and postproject economic measures of personal income, economic distress, total number of jobs, population, property value, business sales, tax revenue, and density at the local (city or municipality), county (or multiple counties), or state level (Figure 2.9). These measures are only economic indicators at the scale of the jurisdiction selected (i.e., local, county, or state) and should not be viewed as economic impacts (these are shown under the Impacts tab). The dollar values can be compared because they have been adjusted to postyear equivalents (i.e., preyear dollars were adjusted using the appropriate consumer price index).
11
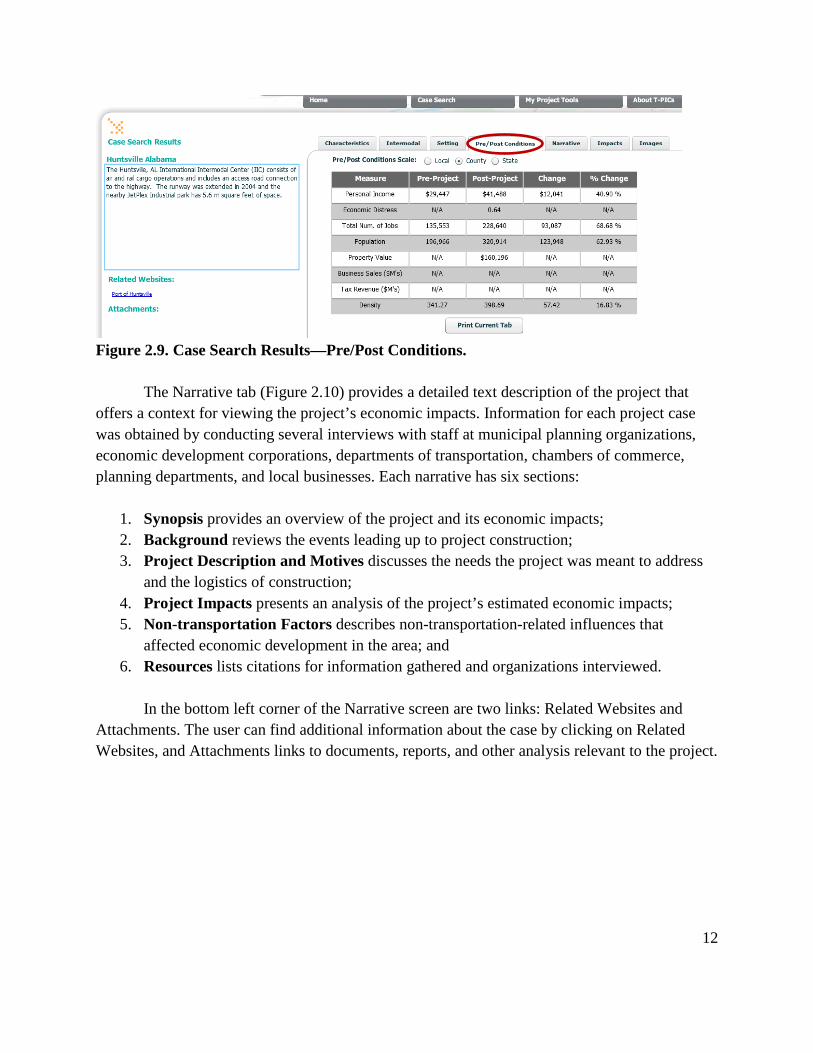
Figure 2.9. Case Search Results—Pre/Post Conditions.
The Narrative tab (Figure 2.10) provides a detailed text description of the project that offers a context for viewing the project’s economic impacts. Information for each project case was obtained by conducting several interviews with staff at municipal planning organizations, economic development corporations, departments of transportation, chambers of commerce, planning departments, and local businesses. Each narrative has six sections:
1. Synopsis provides an overview of the project and its economic impacts; 2. Background reviews the events leading up to project construction; 3. Project Description and Motives discusses the needs the project was meant to address
and the logistics of construction; 4. Project Impacts presents an analysis of the project’s estimated economic impacts; 5. Non-transportation Factors describes non-transportation-related influences that
affected economic development in the area; and 6. Resources lists citations for information gathered and organizations interviewed.
In the bottom left corner of the Narrative screen are two links: Related Websites and
Attachments. The user can find additional information about the case by clicking on Related Websites, and Attachments links to documents, reports, and other analysis relevant to the project.
12

Figure 2.10. Case Search Results—Narrative.
The Impacts tab shows the project’s estimated net economic impacts—that is, only those that can be attributed to the project that were estimated for the selected case (Figure 2.11). These impacts may include number of jobs, income/wages, output, investment (in square feet), new construction, property value, local taxes, and state taxes (the number of impacts shown will vary depending on the data available). Each impact is described in three ways:
• Direct Impacts are directly attributed to the project; • Indirect Impacts capture multiplier effects (from suppliers and workers’ respending of
wages) in the local economy generated by the direct impacts; and • Total Impacts, the sum of direct and indirect impacts, are a measure of the economic
footprint of the project.
Figure 2.11. Case Search Results—Impacts.
The final tab on the Case Search Results page is Images, which connects the user to an
13

interactive Google Map of the location of the project (Figure 2.12). The image can enhances the user’s understanding of the relationship between the project, other transporation linkages, and the surrounding development. Many of the Google links to case images can be viewed at the street level, giving the user a flexible and informative view of current on-the-ground conditions for each case.
Figure 2.12. Case Search Results—Images. My Project Tools Page The My Project Tools page (Figure 2.13) allows users to estimate a range of potential economic impacts for a planned project. The page can be accessed by clicking the gray tab on the menu near the top of the screen or by selecting the My Project Tools box in the lower middle of the home page. Project Parameters The My Project Tools page differs from the Case Search page in that instead of defining project criteria to match an existing case, the user selects parameters for a hypothetical case.” These parameters, such as project cost and traffic volumes, are used in order to estimate the likely ranges of economic impacts. The five initial parameters to be defined are Project Type, Region, Urban/Class Level, Economic Distress, and Length of Your Project (this last parameter should be left blank for interchanges). After selecting these initial categories the user clicks the View
14
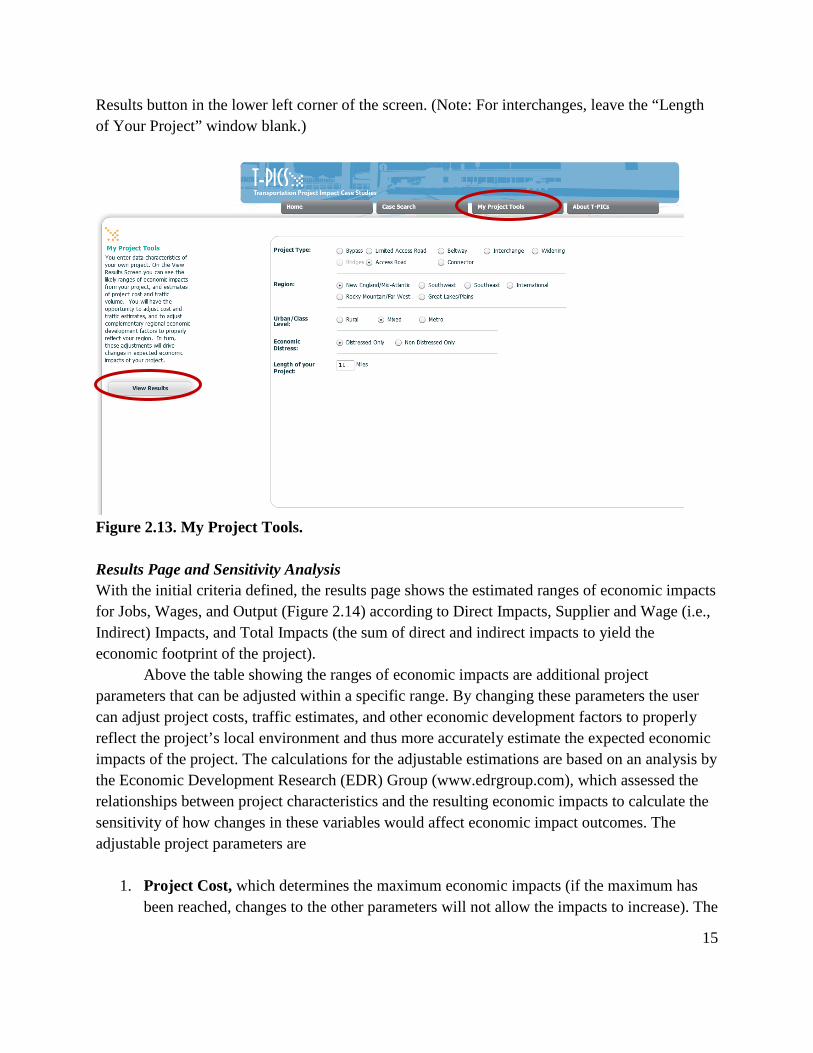
Results button in the lower left corner of the screen. (Note: For interchanges, leave the “Length of Your Project” window blank.)
Figure 2.13. My Project Tools. Results Page and Sensitivity Analysis With the initial criteria defined, the results page shows the estimated ranges of economic impacts for Jobs, Wages, and Output (Figure 2.14) according to Direct Impacts, Supplier and Wage (i.e., Indirect) Impacts, and Total Impacts (the sum of direct and indirect impacts to yield the economic footprint of the project).
Above the table showing the ranges of economic impacts are additional project parameters that can be adjusted within a specific range. By changing these parameters the user can adjust project costs, traffic estimates, and other economic development factors to properly reflect the project’s local environment and thus more accurately estimate the expected economic impacts of the project. The calculations for the adjustable estimations are based on an analysis by the Economic Development Research (EDR) Group (www.edrgroup.com), which assessed the relationships between project characteristics and the resulting economic impacts to calculate the sensitivity of how changes in these variables would affect economic impact outcomes. The adjustable project parameters are
1. Project Cost, which determines the maximum economic impacts (if the maximum has
been reached, changes to the other parameters will not allow the impacts to increase). The
15

default setting is the median cost of construction (in 2008 dollars) based on the project parameters.
2. AADT, which, along with mileage, is a main driver of economic impacts. The default setting is the median based on project parameters.
3. Land Use Policies, reflecting how restrictive or supportive the local area is for construction (e.g., through tax breaks or financing). The default setting is Average.
4. Business Climate, a measure of how supportive the local area is in allowing development. The default setting is Average.
5. Infrastructure, a measure of the supporting infrastructure to serve development associated with the project (e.g., water/sewer). The default setting is Average.
The economic impacts shown should not be considered final since they are a best
estimate given the information available from the case study database and the professional judgment of EDR Group. But they do capture the relationship between economic impacts and the effects of project parameters and local conditions as well as the appropriate magnitude of impacts given the project specifications.
Figure 2.14. My Project Tools—Impact Results. By clicking the Change Search Parameters link in the upper right corner of the screen and returning to the first screen (see Figure 2.13), the user can redefine the proposed project and assess how changes in the characteristics of the project may produce different ranges of economic impacts. The combination of location, project type and characteristics, and supportive initiatives in land use policies, non-transportation infrastructure investment, and business climate and conditions can be explored to see how these decisions interact to produce economic impacts
16

associated with each proposed project.
The final tab on the main menu of the T-PICS site, About T-PICS, is linked to an external web page that provides additional information (Figure 2.15). Click T-PICS User Guide link to access.
Figure 2.15. T-PICS page—More Information.
17