transportation planning fact sheet€¦ · state route 1 in monterey county transportation planning...
TRANSCRIPT
______________________________________________________________________________________________ State Route 1 in Monterey County Transportation Planning Fact Sheet
December 2009 1
Transportation Planning Fact Sheet State Route (SR) 1 in Monterey County
Purpose of this Transportation Fact Sheet:
Transportation Planning Fact Sheets provide one comprehensive summary document that captures physical, social, political, and development characteristics along State Routes and provides web links to various planning resources and documents. Fact sheets are to be used as supplemental planning documents to existing to Transportation Concept Reports (TCRs) and to future Corridor System Management Plans (CSMPs). Route Description:
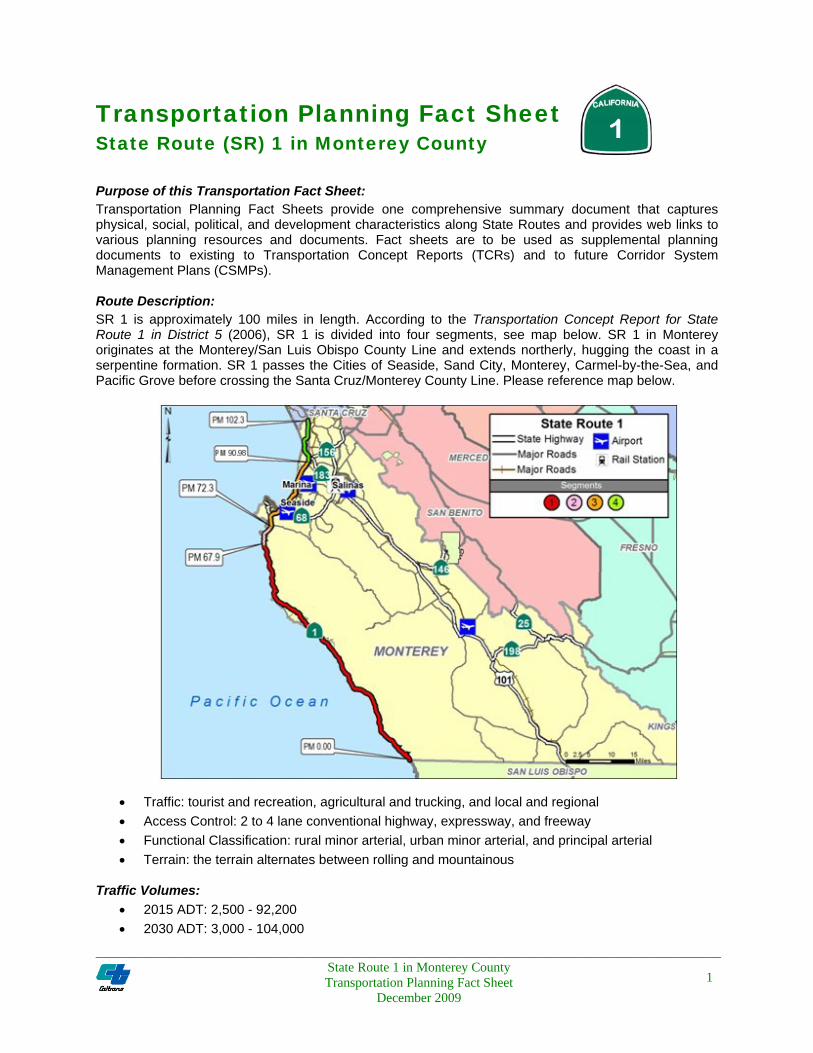
SR 1 is approximately 100 miles in length. According to the Transportation Concept Report for State Route 1 in District 5 (2006), SR 1 is divided into four segments, see map below. SR 1 in Monterey originates at the Monterey/San Luis Obispo County Line and extends northerly, hugging the coast in a serpentine formation. SR 1 passes the Cities of Seaside, Sand City, Monterey, Carmel-by-the-Sea, and Pacific Grove before crossing the Santa Cruz/Monterey County Line. Please reference map below.
• Traffic: tourist and recreation, agricultural and trucking, and local and regional
• Access Control: 2 to 4 lane conventional highway, expressway, and freeway
• Functional Classification: rural minor arterial, urban minor arterial, and principal arterial
• Terrain: the terrain alternates between rolling and mountainous Traffic Volumes:
• 2015 ADT: 2,500 - 92,200
• 2030 ADT: 3,000 - 104,000
1

______________________________________________________________________________________________ State Route 1 in Monterey County Transportation Planning Fact Sheet
December 2009 2
Truck Volumes:
• Peak Hour: 3 - 6%
• ADT: 3.5 - 9.7% F uture Concept:
According to the Transportation Concept Report for State Route 1 in District 5 (2006), the future concept for SR 1 in Monterey County is provided by Level of Service (LOS):
Segment Begin Postmile
End Postmile Route Concept
Segment 1 (TCR Segment 12) 0.00 67.90 LOS D, 2-lane conventional highway
Segment 2 (TCR Segment 13) 67.90 72.30 LOS D, 2-lane conventional highway
Segment 3 (TCR Segment 14) 72.30 90.98 LOS D, 4 and 6-lane conventional highway or 6-lane
freeway depending on section Segment 4 (Mon) (TCR Segment 15) 90.98 R102.03 LOS D, 4-lane conventional/expressway/
freeway
Route Designation:
• Freeway and Expressway System
• High Emphasis Route
• Interregional Road System
• National Highway System
• Scenic Highway System
• Terminal Access Route
• Truck Restrictions
County Profile:
• Located on the Central Coast of California, Monterey County consists of 12 incorporated cities, 6 of which are located near SR 1: Carmel-By-the-Sea, Marina, Monterey, Pacific Grove, Sand City, and Seaside.
• The Association of Monterey Bay Area Governments’ Monterey Bay Area Regional Growth Forecast projects the population of Monterey County will grow to 530,362 from 422, 632.
Population Growth Monterey County, Unincorporated Area, and Selected Cities: 2005-2035
0
100,000
200,000
300,000
400,000
500,000
600,000
Monterey County
Carmel‐by‐the‐Sea
Marina
City of M
onterey
Pacific Grove
Sand City
Seaside
Unincorporated
2005
2035
Source: Association of Monterey Bay Area Governments. (2008). Monterey Bay Area Regional Growth Forecast

______________________________________________________________________________________________ State Route 1 in Monterey County Transportation Planning Fact Sheet
December 2009 3
• 51% of Monterey County Residents over 5 years of age speak a language other than English at home (US Census Bureau).
• Government services and farming dominate the economy of Monterey County, employing approximately 49% of the workforce in 2007. Strawberries are the principal crops for agriculture and many of the public sector jobs are associated with California State University, Monterey Bay, and the state correctional facility in Soledad. Recreation and leisure, and professional services, while making up a small percentage of the total economy, experienced strong absolute growth in 2007.
Bicycle Access:
• According to the Caltrans-District 5 Bicycle Map: For State Highways of the Central Coast (2004), all of the State Highways are open to bicyclist except at a few sections of freeways.
• A majority of SR 1 is open to bicycles, with the exception of the portion inside the Cities of Monterey, Seaside, Marina, and Castroville, and a small section between the Salinas Road interchange and the Santa Cruz boarder. In each case, the Pacific Coast Bicycle Route and other local routes provides access.
Public Transportation:
Public transit service in Monterey is limited. However the following services are or in the future will be available:
• Monterey-Salinas Transit provides urban transit service within and among the urban communities on the Greater Monterey Peninsula. MST also provides inter-city service for travel from the Peninsula east to Salinas and to Watsonville in Santa Cruz County.
• Caltrain will extend commuter rail service to Monterey County beginning in 2011, adding stops in the cities of Pajaro, Castroville, and Salinas.
• The Monterey Peninsula Fixed Guideway Service will provide inner-city rail service along the Monterey Peninsula and in the Salinas area beginning 2014. The system will connect to the proposed Caltrain extension in Salinas.
Intercity Rail Service:
Amtrak provides rail and bus service in Monterey County. The Coast Starlight runs from Seattle to Los Angeles with three stations in Monterey: Salinas, Gilroy, and King City. Additionally, the Coast Starlight is contiguous with the Pacific Surfliner between San Luis Obispo and Los Angles, providing the region access to that rail line, which runs from San Luis Obispo to San Diego. Finally, 7 Thruway Bus Stations are located in Monterey County: 1 in Carmel-by-the-Sea, 5 in Monterey, and 1 in Salinas. These stations connect the region to the Amtrak’s nation rail network.
Airport:
Six airports are located throughout the Monterey County: The Monterey Peninsula Airport, Clark Ranch, San Ardo Field, Salinas Municipal Airport, Marina Municipal Airport, Mea Del Rey Municipal Airport. Of these six, the Monterey Peninsula Airport provides the most extensive public regional airport services. Transportation Agencies:
• Association of Monterey Bay Area Governments – MPO
• Transportation Agency for Monterey County - RTPA TCR General Recommendations:
According to the Transportation Concept Report for State Route 1 in District 5 (2006), the recommended actions for SR 1 in Monterey County include: Segments 12 & 13:
• Provide standard width travel lanes and 4-foot shoulders where possible.

______________________________________________________________________________________________ State Route 1 in Monterey County Transportation Planning Fact Sheet
December 2009 4
• Minimize and consolidate access. • Evaluate need and provide operational improvements including turn-outs and channelization for
turning. • Implement CHMP actions. • Accommodate California Coastal Trail in right-of-way, as circumstances require.
Segments 14:
• Widen 2-lane to 4-lane and 4-lane to 6-lane. • Consolidate access points where feasible south of SR 68 West (Sub-segment 14A) • Install operational improvements. • Widen to 6-lanes north of SR 68 West. • Install ITS elements to improve operations. • Pursue commuter and inter-city rail extension to Monterey Peninsula for commuter and
interregional travel. • Pursue non-highway mobility measures (rail, transit, and bicycling) for regional travel among
Monterey Bay destinations. Segment 15:
• Construct 4-lane expressway or equivalent capacity in bypass, light rail, and/or other modes. • Consolidate access points where feasible. • Pursue commuter and inter-city rail extension to Monterey Peninsula for commuter and
interregional travel. • Pursue non-highway mobility measures (rail, transit, and bicycling) for regional travel among
Monterey Bay destinations. • Provide standard width shoulders.
State Highway Projects:
For an updated list of State Highway projects (including State Transportation Improvement Plan/State Highway Operation and Protection Program) along SR 1 in Monterey County, click on the Caltrans, District 5, Status of Projects web link: http://www.dot.ca.gov/dist05/projects/.
• For more information about Caltrans Monterey County highway projects visit: http://www.dot.ca.gov/dist05/projects/#mon
• Transportation Projects identified in the identified in the TAMC 2005 Regional Transportation Plan: http://www.tamcmonterey.org/programs/rtp/index.html
• Local Agency STIP Projects – Caltrans Local Assistance Website: http://www.dot.ca.gov/dist05/local/stip_index.html
Caltrans Contact:
• Mark McCumsey [email protected] (805) 549-3963 Monterey County – Regional Planning
• John Olejnick [email protected] (805) 549-4751 Monterey County – Development Review
• Claudia Espino [email protected] (805) 549-3640 Travel Forecasting

Transportation Concept ReportFor
State Route 1 in District 5
DEPARTMENT OF TRANSPORTATION, DISTRICT 5System Planning Branch
APRIL 2006


Transportation Concept Report State Route 1 03/23/06
Table of ContentsEXECUTIVE SUMMARY..........................................................................................................iii
INTRODUCTION..................................................................................................................... 1
The Transportation Concept Report.......................................................................................................... 1TCR in the Planning Process .................................................................................................................... 1Organization of Report ............................................................................................................................ 2
PART ONE: BACKGROUND FOR TRANSPORTATION CONCEPT DEVELOPMENT .................... 4
State Route 1 in District 5 ....................................................................................................................... 4Route/Corridor Purpose and Characteristics........................................................................................... 4Route Designations............................................................................................................................. 5
System Planning Process and Considerations ............................................................................................ 6Route Segmentation and Analysis ........................................................................................................ 7Present and Future Operating Conditions .............................................................................................. 7Context Sensitive Solutions.................................................................................................................. 8Alternatives to Reduce Motor Vehicle Trips............................................................................................ 8Performance Measures........................................................................................................................ 9Additional Considerations .................................................................................................................. 10
PART TWO: SUB-CORRIDOR ANALYSIS AND DETAIL......................................................... 13
Corridor and Interregional Concerns....................................................................................................... 13Santa Barbara County ........................................................................................................................... 15
Area and Population: Description and Trends ...................................................................................... 15Operating Conditions and Segment Summaries ................................................................................... 16Alternatives to Reduce Demand or Improve Operations........................................................................ 19Transportation Concept and Strategies ............................................................................................... 22
San Luis Obispo County ........................................................................................................................ 24Area and Population: Description and Trends ...................................................................................... 24Operating Conditions and Segment Summaries ................................................................................... 25Alternatives to Reduce Demand or Improve Operations........................................................................ 30Transportation Concept and Strategies ............................................................................................... 33
Monterey County .................................................................................................................................. 37Area and Population: Description and Trends ...................................................................................... 37Operating Conditions and Segment Summaries ................................................................................... 38Alternatives to Reduce Demand or Improve Operations........................................................................ 42Transportation Concept and Strategies ............................................................................................... 45
Santa Cruz County................................................................................................................................ 49Area and Population: Description and Trends ...................................................................................... 49Operating Conditions and Segment Summaries ................................................................................... 50Alternatives to Reduce Demand or Improve Operations........................................................................ 53Transportation Concept and Strategies ............................................................................................... 56
Route Continuity................................................................................................................................... 58
PART THREE: FUTURE CONSIDERATIONS .......................................................................... 59
Programming Concept Facilities ............................................................................................................. 59Environmental Factors .......................................................................................................................... 59Ultimate Transportation Corridor............................................................................................................ 61Conclusion ........................................................................................................................................... 62
SOURCES CONSULTED......................................................................................................... 63
i

Transportation Concept Report State Route 1 03/23/06
APPENDIX A: Definitions, Acronyms, and AbbreviationsAPPENDIX B: Maps and Segment DataAPPENDIX C: Comments and Issues Identified in Community MeetingsAPPENDIX D: Programmed Projects in the STIP
The Transportation Concept Report for State Route 1 was prepared by the District 5 PlanningDivision/System Planning Branch. The following individuals contributed to the document:
Tim Rochte System Planning Branch Chief - OversightGina Kirk System Planning - Principal Author - (805) 549-3800Carl Hilbrants System Planning – Editing and DistributionKeith Hinrichsen (formerly System Planning) - Public OutreachLars Olson (formerly System Planning) - Public Outreach and MappingJeff Berkman Travel Modeling and Forecasting - Traffic Volumes and LOS
CalculationsErin Toyama Travel Modeling and Forecasting - Traffic Volumes and LOS
CalculationsScott Eades (formerly Traffic Operations) - Operations Analysis and ConsultationSteve Cadenasso Traffic Safety - Traffic Collision DataAndy Richardson GIS - Mapping and Format Consultation
ii

Transportation Concept Report State Route 1 03/23/06
EXECUTIVE SUMMARY
This Transportation Concept Report (TCR) is the long-term planning document for State Route 1(Route 1 or SR 1) in District 5 of the California Department of Transportation (Caltrans). The TCR (1)evaluates current and projected conditions along the route; (2) establishes a twenty-year planningvision or concept; and (3) recommends long- and short-term improvements to achieve the concept.The most recent previous TCR updates for Route 1 in District 5 were completed in 1987 and 1990.
Route 1 extends some 265 miles through four counties in District 5: Santa Barbara, San Luis Obispo,Monterey, and Santa Cruz. Traffic characteristics, existing facilities, and environmental setting varyconsiderably along the corridor. Each county has its own regional transportation planning agency(RTPA) or metropolitan planning organization (MPO) that performs regional transportation planning.In preparing the TCR, Caltrans consulted each of these agencies and referenced its most recent plan(RTP or MTP). Caltrans also consulted the public. Meetings were held with residents, electedofficials, and local and regional transportation agency staff in each of the four counties.
The TCR reflects regional plans for accommodating travel demand on the State Route as well as localconcerns and priorities. However, Caltrans is charged with the additional responsibility to ensure thatits highways provide reasonable interregional traffic flow, safety, continuity, and efficient goodsmovement to sustain the State’s economy. The TCR provides this statewide perspective. The TCRoffers descriptive commentary on areas where goods movement and interregional travel areconstrained.
Commitments are developing for alternatives that reduce the need to rely on single-occupant motorvehicle travel. The TCR provides a limited qualitative assessment of potential contributions of modalalternatives, local land use policies, and transportation demand management efforts.
Route segments and sub-segments were identified for analyzing traffic data on Route 1. Ideally, thetraffic analyses, along with alternatives for accommodating or reducing travel demand, and localplans, would provide the basis for establishing a traffic concept for each route segment. In severalurban areas along Route 1, however, intersection operations rather than segment flows control levelof service. Intersection analyses were not consistently available, which has made analysis moredifficult in urbanized settings.
The ability to provide capacity to accommodate rising volumes has become increasingly difficult inCalifornia. Historically, District 5 targeted a peak hour concept of LOS C or better for state highways.(See Appendix A for a definition of level of service or “LOS” and descriptions of the six levels.)However, in each county, current operations, existing development patterns, environmental values,local plans, and/or projected growth are such that achieving even LOS D will require majorimprovements and concerted efforts to manage demand.1 In some segments, the California CoastalAct prohibits additional capacity. Finally, along several stretches of the highway, issues arise fromcompeting objectives and/or complex traffic flows demanding analysis that is beyond the scope of aTCR. For such areas, the TCR recommends further study: a corridor study or an area/network study.
1 Both Santa Barbara and Monterey Counties have Congestion Management Programs that reflect LOS D as the standardfor state highways within the counties. iii

Transportation Concept Report State Route 1 03/23/06
The chart below summarizes the setting, major considerations and route concepts proposed for eachsegment of Route 1 in District 5. The backgrounds and analyses that were the bases for theseconcepts are detailed county-by-county in Part Two of this report.
Summary of Route 1 Segment Considerations and Concept LOS for 2025
SEG-MENT LIMITS MAJOR CONSIDERATIONS ROUTE CONCEPT
Santa BarbaraCounty
1
US Route 101Junction toState Route246
- 2-4-lane expressway and conventional highway- Increasing commuter traffic to South Coast job sites- Winding roadway through rolling terrain- Limited passing opportunities due to sight restrictions- Designated California Scenic Route- Erosion/rockslide potential adjacent to cut walls- Frequent closures- Narrow bridges over El Jaro Creek- Pacific Coast Bike Route
Peak LOS D or better/provide operational
improvements such aspassing lanes and
channelization.
2State Route246 toPurisima Road
- 4-lane conventional highway coincident with OceanAvenue (State Route 246) and H Street through centralLompoc
- Multiple signalized intersections- Multiple mid-block driveways for commercial
development- Road maintenance- Interregional, regional, and local (main street) traffic- Segment operations controlled by intersections
Peak LOS C/D or better/evaluate effects of CentralAvenue extension on Route
1; widen NB Santa YnezRiver Bridge for cyclists;
consider designating parallelarterials as directionalcouplets in Lompoc.
3Purisima Roadto OrcuttExpressway
- 4-lane conventional highway and expressway- Traffic operations at intersection of H Street with Harris
Grade and Purisima Roads- Access to Allan Hancock College, Vandenberg Village,
and Vandenberg Air Force Base- Continuity of bicycle lanes- Aesthetics- Speeding
Peak LOS C or better/minimize and consolidate
points of access.
4
OrcuttExpresswayto SantaBarbara/SanLuis ObispoCounty Line
- 2-4-lane expressway and conventional highway- Narrow travel lanes, narrow/absent paved shoulders,
and narrow bridges- Slow-moving agricultural vehicles- Insufficient turning lanes- Discontinuous bicycles lanes- Pedestrian/vehicular conflicts in Guadalupe- At-grade crossing of railroad tracks near SR 1/166
intersection blocking access to Santa Maria serviceswhen trains are present
Peak LOS C or better/ widennon-standard lanes andshoulders; add passing lanesor turn-outs; addchannelization for turns;improve local circulation inGuadalupe; provide elevatedrailroad crossing on SR 166or parallel alignment inGuadalupe; widen SantaMaria River Bridge.
iv

Transportation Concept Report State Route 1 03/23/06
v
SEG-MENT LIMITS MAJOR CONSIDERATIONS ROUTE CONCEPT
San Luis ObispoCounty
5
SantaBarbara/SanLuis ObispoCounty Lineto HalcyonRoad
- 2-lane conventional highway- Vertical undulations in roadway- Seasonal flooding over roadway- Hard turns at Willow Road and Halcyon Road- Slow-moving agricultural vehicles- Proliferation of low density development in Mesa
area- High percentage of trucks in traffic mix- California Coastal Zone
Peak LOS C/D or better/improve vertical and
horizontal alignments;consolidate driveways to
limit access points;provide channelization forturns; support extensionof area county road(s) to
US 101.
6
HalcyonRoad to USRoute 101Junction(PismoBeach)
- 2-lane conventional highway- Direct access to residential, beach-related,
commercial, and light industrial uses- Heavy seasonal recreational traffic- Rural and urban sections passing through Oceano,
Grover Beach, and Pismo Beach- Multiple signalized intersections- Roadside parking- Potential for local multi-modal programs: shuttles
and bicycles; land use options incorporatingparking, park and ride
- California Coastal Zone
Peak LOS C/D or better/widen to four lanes where
feasible; improve localcirculation; consolidate
driveways to limit accesspoints; provide Class II
bicycle facilitiesthroughout; improvepedestrian access.
7
US Route101 Junction(San LuisObispo) toHighlandDrive
- 4-lane urban highway- Circuitous ramp access from/to US 101- Heavy local, regional, and interregional traffic
along Santa Rosa Street- Multiple mid-block access points to commercial
uses and offices- Main access to Sierra Vista Hospital via Murray
Street- Inconclusive past studies of alternative alignments
for Segment 7 and sub-segment 8A.- Segment operations controlled by intersections- Heavy bicycle and pedestrian traffic at Foothill
Boulevard- California Coastal Zone
Peak LOS D or better/improve US 101/SR 1interchange; evaluate
potential for widening tosix lanes; evaluate
bypass/relinquishment;evaluate improvements at
Foothill Boulevardintersection; improvetransit/TDM; improve
pedestrian access;synchronize signals;consider local CSSproposals; analyze
potential for CMS andHAR on NB US 101 re: SR
1 conditions.
8
HighlandDrive in SanLuis Obispoto South BayBoulevard inMorro Bay
- 4-lane rural expressway- High speed traffic- Signalized intersections at Cuesta College and
regional park- Major institutional (employment) centers along
highway- Inconclusive past studies of alternative alignments
for Segment 7 and sub-segment 8A.- Special designations: Scenic Byway/ All American
Road, State Scenic Highway- California Coastal Zone
Peak LOS C or better/minimize and consolidate
access; convertconventional toexpressway and
expressway to freewaywhere feasible.

Transportation Concept Report State Route 1 03/23/06
vi
SEG-MENT LIMITS MAJOR CONSIDERATIONS ROUTE CONCEPT
San Luis Obispo County, cont.
9
South BayBlvd inMorro Bayto StateRoute 46
- 4-lane expressway and freeway with 2-laneconventional highway north of Cayucos
- Parks and beach-related activities, residentialdevelopment, and urban uses along highwaybetween north Morro Bay and Cayucos
- Regional (commuter) and interregional (tourist)traffic
- Special designations: Scenic Byway/ All AmericanRoad, State Scenic Highway
- California Coastal Zone
Peak LOS C/D or better/in 9A & 9B: consolidateaccess to convert 4-laneexpressway sections to
freeway; improveinterchange with SR 41
(and Main Street); in 9C,consolidate access;evaluate need for
passing lanes; installCMS south of SR 46.
10
State Route46 to SanCarpoforoCreek
- 2-lane expressway and conventional highway- Special designations: Scenic Byway/ All AmericanRoad, State Scenic Highway
- Coastal zone- Planned realignment away from coastline north of
Cambria- Potential development of Hearst Ranch property- California Coastal Zone
Peak LOS D or better/minimize and consolidateaccess; improve vertical
and horizontalalignments; widen non-
standard lanes andshoulders.
11
SanCarpoforoCreek to SanLuis Obispo/MontereyCounty Line
- 2-lane conventional highway- Special designations: Scenic Byway/ All AmericanRoad, State Scenic Highway
- Within Coast Highway Management Plan (CHMP)area
- Slow-moving traffic- Rockslides and storm-related road damage
- California Coastal Trail to be in right-of-way insome areas
- California Coastal Zone
Peak LOS D or better/minimize and consolidateaccess; provide 12-foot
travel lanes & 4-footshoulders where possible;implement CHMP actions.
Transportation Concept Report State Route 1 03/23/06
vii
SEG-MENT LIMITS MAJOR CONSIDERATIONS ROUTE CONCEPT
MontereyCounty
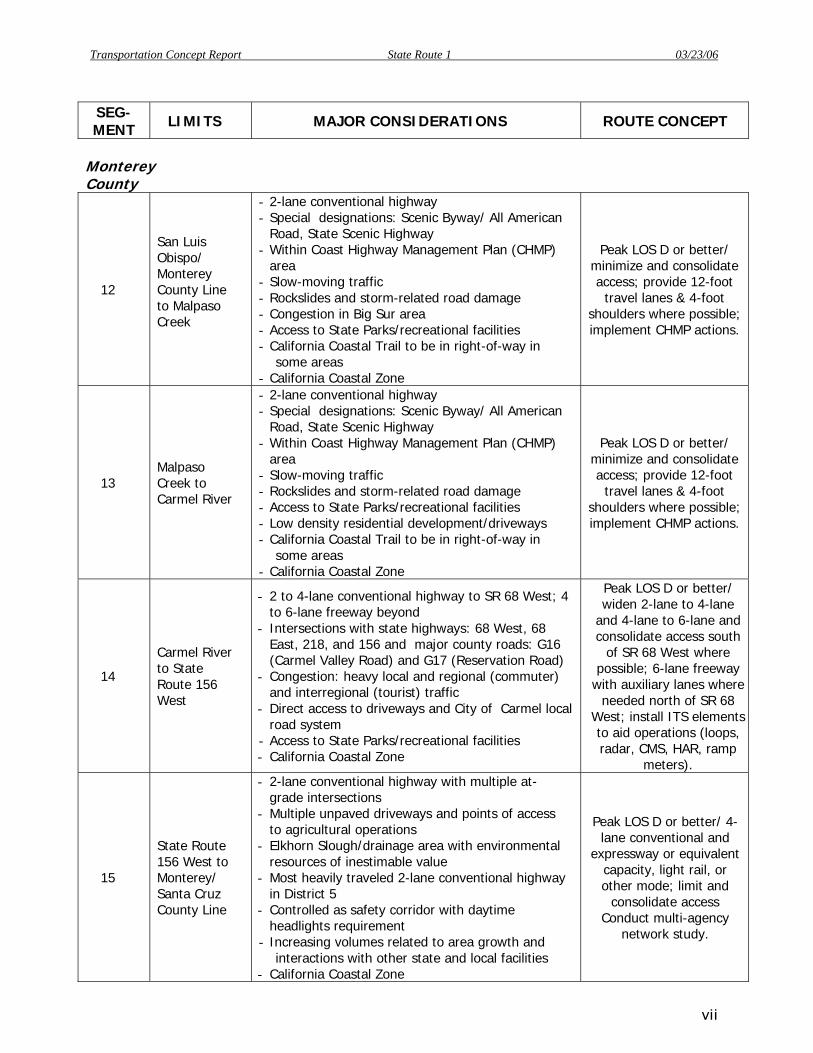
12
San LuisObispo/MontereyCounty Lineto MalpasoCreek
- 2-lane conventional highway- Special designations: Scenic Byway/ All American
Road, State Scenic Highway- Within Coast Highway Management Plan (CHMP)
area- Slow-moving traffic- Rockslides and storm-related road damage- Congestion in Big Sur area- Access to State Parks/recreational facilities- California Coastal Trail to be in right-of-way in
some areas- California Coastal Zone
Peak LOS D or better/minimize and consolidateaccess; provide 12-foot
travel lanes & 4-footshoulders where possible;implement CHMP actions.
13MalpasoCreek toCarmel River
- 2-lane conventional highway- Special designations: Scenic Byway/ All American
Road, State Scenic Highway- Within Coast Highway Management Plan (CHMP)
area- Slow-moving traffic- Rockslides and storm-related road damage- Access to State Parks/recreational facilities- Low density residential development/driveways- California Coastal Trail to be in right-of-way in
some areas- California Coastal Zone
Peak LOS D or better/minimize and consolidateaccess; provide 12-foot
travel lanes & 4-footshoulders where possible;implement CHMP actions.
14
Carmel Riverto StateRoute 156West
- 2 to 4-lane conventional highway to SR 68 West; 4to 6-lane freeway beyond
- Intersections with state highways: 68 West, 68East, 218, and 156 and major county roads: G16(Carmel Valley Road) and G17 (Reservation Road)
- Congestion: heavy local and regional (commuter)and interregional (tourist) traffic
- Direct access to driveways and City of Carmel localroad system
- Access to State Parks/recreational facilities- California Coastal Zone
Peak LOS D or better/widen 2-lane to 4-lane
and 4-lane to 6-lane andconsolidate access south
of SR 68 West wherepossible; 6-lane freeway
with auxiliary lanes whereneeded north of SR 68
West; install ITS elementsto aid operations (loops,radar, CMS, HAR, ramp
meters).
15
State Route156 West toMonterey/Santa CruzCounty Line
- 2-lane conventional highway with multiple at-grade intersections
- Multiple unpaved driveways and points of accessto agricultural operations
- Elkhorn Slough/drainage area with environmentalresources of inestimable value
- Most heavily traveled 2-lane conventional highwayin District 5
- Controlled as safety corridor with daytimeheadlights requirement
- Increasing volumes related to area growth andinteractions with other state and local facilities
- California Coastal Zone
Peak LOS D or better/ 4-lane conventional and
expressway or equivalentcapacity, light rail, orother mode; limit and
consolidate accessConduct multi-agency
network study.

Transportation Concept Report State Route 1 03/23/06
viii
SEG-MENT LIMITS MAJOR CONSIDERATIONS ROUTE CONCEPT
Santa CruzCounty
16
Monterey/Santa CruzCounty Lineto SanAndreas Rd/Larkin ValleyRd
- 4-5-lane freeway- Access to Watsonville- Intersections with SRs 129 & 152- California Coastal Zone
Peak LOS D or better/ 4-lane freeway to SR 129
and 6-lane freewayremainder;
pursue parallel passengerrail service.
17
San AndreasRd LarkinValley Rd toState Route17
- 4-lane freeway- Heavy congestion with large interregional
commuter component- Most heavily traveled 4-lane freeway in District 5- Sensitive environmental and community setting- Topography and existing development limiting
options for alternative roadwayalignments/geometrics
Peak LOS D or better/6-lane freeway;
support intermodalinterconnectivity amonghighway, transit, rail,
bicycle; install ITSelements to aid
operations (loops, CCTVcameras, CMS ramp
meters); support TDMsand intermodal facilities;pursue parallel passenger
rail service.
18
State Route17 Junctionto Santa CruzCity Limits
- 2-4-lane conventional highway- Heavily-traveled, congested urban corridor- Serves as main street through west Santa Cruz- Multiple signalized intersections- Topography and existing development limiting
options for alternative roadwayalignments/geometrics
Peak LOS D or better/ 6-lane freeway to Mission/Chestnut Streets; 4-laneto 6-lane conventional,
Mission/Chestnut toSwift; 2-lane conventional
to urban boundary;consolidate access;
improve channelization atintersections; improve
pedestrian access.
19
Santa CruzCity Limitsto SantaCruz/SanMateoCounty Line
- 2-lane conventional highway- Aesthetics- California Coastal Zone
Peak LOS D or better/minimize and consolidate
access; improvechannelization.

Transportation Concept Report State Route 1 03/23/06
INTRODUCTION
System planning is the California Department of Transportation’s (Caltrans’) long-rangeplanning process. It is performed pursuant to Government Code Section 65086(a) andDepartment policy. System planning identifies, at the earliest stage, the capacity andoperational improvements, new technologies, and alternatives to driving that will optimizeperformance of the facility. System planning thereby lays the groundwork for investments inthe transportation system to meet future needs for mobility, access, and safety. The systemplanning process is recorded in three interrelated sets of planning documents: (1)Transportation Concept Reports (TCRs), (2) District System Management Plan (DSMP), and (3)Transportation System Development Program (TSDP).2
THE TRANSPORTATION CONCEPT REPORT
The Transportation Concept Report is Caltrans’ long-term planning document for an individualstate route corridor. The TCR (1) evaluates current and projected conditions for the route; (2)establishes a twenty-year planning vision or concept; and (3) recommends long-termimprovements to achieve the concept. The TCR documents strategies from long-range plansprepared by the Regional Transportation Planning Agencies (RTPAs) and Metropolitan PlanningOrganizations (MPOs) that plan and program regional transportation projects. The TCR alsoidentifies major alternatives for accommodating demand within the state highway corridor.The TCR addresses Caltrans’ responsibility to ensure that its highways provide reasonableinterregional traffic flow, safety, continuity, and efficient goods movement to sustain theState’s economy. When State highway corridors pass through more than one county, theDistrict-level TCR addresses the role of the corridor in interregional travel and goodsmovement. In doing so, the TCR may modify or augment regional strategies to create a singlecomprehensive, corridor-specific document.
The improvements identified in a TCR are not necessarily tied to a funding source, nor doesthe document project future funding scenarios. Collectively the TCRs provide the basis fordeveloping the TSDP and the State Transportation Improvement Program (STIP) which doaddress funding availability and are project specific.
TCR IN THE PLANNING PROCESS
A TCR is the culmination of an integrated effort among various stakeholders. Figure 1represents the interdisciplinary planning involved in preparing a concept report and the placeof the TCR in the project identification process. As the illustration shows, several documentsincluding the TCR and the Regional Transportation Plan (RTP) can identify and describetransportation needs. As these plans are updated they should be consistent in addressing suchneeds, reflecting community concerns and intergovernmental agency cooperation. The purposeof the integrated process is to attain general agreement among stakeholders on the directionof transportation improvements in a given area.
2 The purpose and scope of the DSMP and TSDP are described in Appendix A: Definitions, Acronyms, andAbbreviations.
1
Transportation Concept Report State Route 1 03/23/06
The process of generating a TCR involves identification and evaluation of transportation needsin collaboration with the following sources:
1. Caltrans specialists in areas such as safety and operations, forecasting,programming, transit and non-motorized travel, context sensitivity, andenvironmental issues for technical and programmatic information;
2. Local government agencies and members of the public for community values andconcerns; and
3. Regional and metropolitan transportation agencies for regional as well as localperspectives and priorities.
The TCR does not function as a programming tool for transportation projects; rather, it servesas a starting point for transportation infrastructure improvements. With a potential needidentified, a project study further evaluates the feasibility of alternatives to achieve the desiredtransportation improvements. The Project Study Report (PSR) translates broad improvementplanning concepts into project level detail. Once a project has been established to address theneed identified during the TCR (or RTP) process, it proceeds to a more tangible process whereit competes for inclusion in a future funding program.
ORGANIZATION OF REPORT
The TCR comprises three major parts. Part One provides a broad overview of the functions,current development and designations of Route 1. Part One also reviews the process followedin developing an appropriate concept for the facility.
Part Two begins by identifying locations along the route where traffic levels, topography, orother constraints give rise to concerns related to goods movement and/or the flow ofinterregional traffic. This section is followed by an analysis of Route 1 in District 5. Thefollowing information is presented for each of the four counties through which Route 1 passes:area description and trends; present and future operating conditions of the highway; andalternatives to single-occupant vehicle travel. Each county analysis concludes with anappropriate 20-year transportation concept and the facilities or programs that will be requiredto achieve the concept.
Part Three considers realization of the 2025 transportation concept for Route 1 through futureplanning and programming. Environmental factors that will need to be considered areidentified. Finally, the ultimate Route 1 transportation corridor, looking beyond the 20-yearplanning period, is presented.
Appendices provide background information, maps, and additional detail. Appendix A identifiesthe acronyms and abbreviations used in the TCR. Maps, segment summaries and data sheetsfor the 36 route sub-segments are presented in Appendix B. Comments heard and issuesidentified by local and regional agencies, community groups, and individuals are listed inAppendix C. Appendix D identifies the currently programmed or planned improvements toRoute 1 identified in the State Transportation Improvement Program (STIP) and project lists inthe four Regional Transportation Plans.
2

Transportation Concept Report State Route 1 03/23/06
THE TCR IN THE TRANSPORTATION PLANNING PROCESS
KEY
DSMP District System Management Plan ITSP Interregional Transportation Strategic Plan
MPO Metropolitan Planning Organization
MTP Metropolitan Transportation Plan
RTP Regional Transportation Plan
RTPA Regional Transportation Planning Agency
TCR Transportation Concept Report
TSDP Transportation System Development Program
Regular Process
ProjectStudy Project
CALTRANSDOCUMENTS
CTP, DSMP,ITSP, TSDP
PUBLIC
COUNTY
CITIES
CALTRANS
RTPAMPO
RTPMTP
IdentifyNeed
FIGURE 1
SPECIALSTUDIES
CorridorStudy
System, Community,Regional & Environmental
Planning; Modeling &Forecasting; Traffic
Operations & Safety;Maintenance; Adjacent
Districts
Special Circumstances
CTP California Transportation Plan
TCR
3

Transportation Concept Report State Route 1 03/23/06
PART ONE: BACKGROUND FOR TRANSPORTATION CONCEPT DEVELOPMENT
Part One of the TCR presents an overview of the purpose, use, and designations of Route 1,the major coastal route through District 5. This is followed by a description of the process thatwas followed in analyzing the route for the TCR and various considerations that werereferenced in developing transportation concepts for route segments.
STATE ROUTE 1 IN DISTRICT 5
State Route 1 is the major coastal route through District 5. The route extends some 270 milesthrough four counties in the District: Santa Barbara, San Luis Obispo, Monterey, and SantaCruz. Traffic characteristics and settings vary greatly along the route. Sections of Route 1 aredistinctly rural and lightly traveled, with Average Daily Traffic (ADT) levels under 5,000. Inthese areas, slow-moving agricultural equipment regularly share the road with conventionalvehicles. At the other extreme, ADT on the Route 1 freeway in the City of Santa Cruz is wellover 100,000, the highest traffic count for any four-lane highway in District 5. Here, a systemof advanced electronic and information technologies support operations, safety, andproductivity.
Traffic volume is only one of the dimensions that vary through the District. Others includesettlement patterns, suitability for agricultural production, topography, proximity to touristdestinations, and proximity to major employment centers. In many locations, changes in thesefactors are changing the mix of traffic and the use of the route.
Route/Corridor Purpose and Characteristics
Route 1 accommodates trips ranging from interregional to local. Coastal areas in District 5 arereplete with tourist and recreational resources including beaches, parks, historic sites, scenicvistas, venues for cultural events, and hosting facilities. The role of Route 1 in interregionaltourism is incomparable in the state. In San Luis Obispo, Monterey, and Santa Cruz Counties,the majority of tourist traffic on the route is interregional, destination oriented and markedlyseasonal. Along the Big Sur coast, the highway itself is an acclaimed tourist destination. Innorthern Monterey and southern Santa Cruz Counties, Route 1 is the final link for trips fromthe San Joaquin Valley and the Santa Clara Valley to tourist destinations along the MontereyBay.
Route 1 is important for goods movement – both interregional and regional. Truckingpredominates in moving goods through District 5. No seaports or non-military cargo airportsare located in District 5. Neither are major manufacturing centers located in the District. Whilefreight rail activity through District 5 is increasing, it does not approach the volumes carried onnorth-south routes through the Central Valley.
In all four District 5 counties, the highway passes through rich agricultural land on which highvalue crops are grown year round. Agricultural products begin the journey from field topackinghouse and on to state, national, and international markets along segments of Route 1.The highway is also vital for moving manufactured goods from other regions to meet theneeds of growing coastal population centers in the District – especially along the MontereyBay.
4

Transportation Concept Report State Route 1 03/23/06
Along several stretches of Route 1, commuter traffic has become the major component oftraffic. Regional commute trips predominate along segments south and north of Lompoc inSanta Barbara County and between San Luis Obispo and Morro Bay in San Luis Obispo County.In northern Monterey and southern Santa Cruz Counties, Route 1 is heavily used for bothregional and interregional commuter trips with most of the latter trips to job sites in SantaClara County and the Bay Area.
Finally, in addition to linking major coastal communities at the regional level, Route 1 is criticalfor local travel. Route 1 serves as the main street through the historic centers of two cities inSanta Barbara County: Lompoc and Guadalupe, and directly serves several unincorporatedcommunities in the District: Oceano and San Simeon in San Luis Obispo County; Big Sur andMoss Landing in Monterey County; and Davenport in Santa Cruz County. While the route doesnot serve as “main street” in Grover Beach, Pismo Beach, San Luis Obispo and Santa Cruz, itpasses through these communities over city streets lined with mixed urban uses.
Throughout the District, Route 1 is intended to accommodate the array of corridor users with afacility that operates in a safe, efficient, and (as much as practicable) environmentally benignmanner.
Route Designations
The location and environmental setting of Route 1 have resulted in numerous specialdesignations by federal and state agencies. These designations and classifications provideinformation regarding the facility itself and its intended use. They may indicate the availabilityof special purpose funding related to the designation.
In all four counties, where trip lengths and travel densities indicate substantial statewide andinterstate travel, Route 1 is classified as a Principal Arterial. In long stretches, principally a fewmiles north and south of the Santa Barbara/ San Luis Obispo county line and between thenorth San Luis Obispo city limits and the Carmel River Bridge, the route is a Minor Arterial.
The section of Route 1 that describes the crescent of the Monterey Bay (Monterey and SantaCruz Counties) is also part of the National Highway System (NHS) identified in the federalTransportation Equity Act for the 21st Century (TEA-21). The NHS is comprised of theInterstate System and other urban and rural principal arterials that are essential for interstateand regional commerce and travel, national defense, intermodal transfer facilities, and trade.
Large sections of Route 1 in District 5 are included in the National Truck Network. ThisNetwork was designated pursuant to the federal Surface Transportation Assistance Act (STAA)of 1982. Sections excluded from the Network are located in three areas: (1) within the City ofLompoc; (2) between the Orcutt expressway and US 101 in Pismo Beach; and (3) along theBig Sur Coast from San Simeon in San Luis Obispo County to the Carmel River in MontereyCounty. For various reasons related to geometric standards, truck advisories or restrictionsexist for many of these areas. The section between Orcutt and US 101 passes throughagricultural areas that are in production year-round. While this area is not on the NationalNetwork, much of it is part of the California Legal Network, allowing trucks access to fields andpackinghouses from the National Network.
5

Transportation Concept Report State Route 1 03/23/06
The Strategic Highway Corridor Network (STRAHNET) is a network of linked highways deemedessential to national defense for facilitating the movement of troops and equipment to airports,ports, rail lines and military bases. The federal Department of Defense in cooperation withCaltrans has identified the section of Route 1 from VAFB north to State Route 135 as aSTRAHNET connector route.
The State of California has granted important designations to various sections of Route 1.First, major sections of the route are on the Freeway and Expressway System (F & E) whosecompletion has been declared essential to the future development of the State. Generally,inclusion on the F & E system entails provision for control of access to the extent necessary topreserve the value and utility of the facility. Three sections of Route 1 in District 5 areexcluded: (1) Cienaga Road to the south junction with US 101 in San Luis Obispo County; (2)San Simeon Road in San Luis Obispo County to the Carmel River Bridge; and (3) City of SantaCruz north limit to the Santa Cruz/San Mateo County line.
Route 1 is also one of 87 statutorily identified routes on the State’s Interregional Road System(IRRS). The section of Route 1 extending from the Carmel Bridge in Monterey County toState Route 17 in Santa Cruz County is additionally one of 34 High Emphasis Routes identifiedin Caltrans’ Interregional Transportation Strategic Plan (ITSP). In 1997, California Senate Bill45 created an Interregional Improvement Program (IIP) for which Caltrans submits projects inspecified categories. The IIP funds project components that provide for interregionalmovement of people and goods, including state highway projects on the IRRS.
Both the State of California and the federal government have recognized the majority of Route1 in District 5 for outstanding scenic qualities. In Santa Barbara County the section from US101 to Route 246 is a designated State Scenic Highway. In San Luis Obispo County, the sectionbeginning near Halcyon and continuing north to Route 101 in Pismo Beach is eligible fordesignation as a State Scenic Highway. The long stretch from the Carmel River north throughthe remainder of Monterey County and on through Santa Cruz County is also eligible. In orderto achieve the designation for an eligible section of a route, local governments must prepareand adopt a scenic corridor protection program.
The highway from San Luis Obispo’s north city limit to the Carmel River in Monterey Countyhas been designated an All American Road as well as a State Scenic Highway. The latter is thehighest designation under the federal Scenic Byways Program. The All American Road passesthrough several beach communities and units in the state parks system as well as the famedBig Sur coast.
In addition to its various designations, Route 1 is subject to numerous local, regional, state,and federal policies, laws, and regulations. Among these are California Coastal Act policieswhich are applicable to Route 1 segments that are located in the Coastal Zone. (SeeDevelopment Centers maps in Appendix B.) Coastal Act policies limit Route 1 to two lanes inrural areas.
SYSTEM PLANNING PROCESS AND CONSIDERATIONS
Transportation planners at every level of government are challenged by the multiple uses ofRoute 1, the mixture of interregional, regional, and local traffic, and the beauty andenvironmental sensitivity of the highway corridor, and the prospect of growth and increasing
6
Transportation Concept Report State Route 1 03/23/06
travel demand along the Route. This TCR presents an opportunity for District 5 to develop a conceptfor this important facility in consultation with its regional partners.
The system planning process includes analyzing current and projected operating conditions forindividual route segments, consulting with local and regional agencies and the public, andidentifying the type of facility that will provide acceptable operations in the 20-year horizon.Other factors such as alternatives that might reduce demand, goods movement requirements,and route continuity are also considered.
Route Segmentation and Analysis
The District 5 portion of Route 1 has been divided into nineteen segments for purposes ofanalysis. Segment ends are identified by features such jurisdictional boundaries or changes infunctional classification as well as by post mile measures.3 Several of the segments werefurther divided into sub-segments, generally at intersections with other routes.4
The sub-segment is the basic unit for analysis of the travel volumes, forecasts and associatedlevels of service, and collision rates upon which a transportation concept has been built. 5 Foreach of the 36 sub-segments on Route 1, recent average traffic counts were compared withtraffic projections for the year 2025.6 For most Route 1 sub-segments, current levels of servicecould be calculated and compared with expected service levels in the year 2025.
In several urban locations, intersection operations would provide a more meaningful andaccurate measure of service than sub-segment traffic flow. Current data (counts, turningmovements, delay) were not available for many of these intersections. In some cases,Regional Transportation Plans or other sources identified intersection hot spots along Route 1.The TCR identifies these intersections and others where intersection operations are known tobe critical.
Segment Summaries are included in the county level analyses and in Appendix B where mapsand individual data sheets with technical descriptions of each sub-segment are included aswell.
Present and Future Operating Conditions
The TCR references traffic data obtained in 2002. It also forecasts travel demand for the year2025 based on local and regional land use designations. The traffic forecasts are used todetermine future levels of service (LOS) and estimate the measures required to maintainacceptable service levels. The forecast data in this TCR were generated from traffic models
3 Caltrans assigns post-miles along all routes on the State highway system on a county-by-county basis. For a north-south route,measurements are taken from the southern origin of the route within the county. In the case of Route 1 in District 5, a post-mile0.00 is located at the southern origin of the route in each county.4 Segments and sub-segments of odd-numbered routes are numbered from south to north through the District. Sub-segment 1 ofRoute 1 begins at Las Cruces where Route 1 diverges from US 101 as a separate route. Segment 19 ends at the Santa CruzCounty/San Mateo County line, the north boundary of District 5.5 Traffic volumes for 2025 were generated for each of the four counties according to methods used by the agencies charged withforecasting transportation conditions for each county. The three agencies are Santa Barbara County Association of Governments,San Luis Obispo Council of Governments, and Association of Monterey Bay Area Governments, the Metropolitan PlanningOrganization for Monterey and Santa Cruz Counties.6 The year 2025 levels of service presented in this TCR were calculated using capacities that will exist upon completion of currentlyprogrammed STIP projects.
7

Transportation Concept Report State Route 1 03/23/06
and local growth trends using 2002 traffic volumes, 2000 Census data, and policies fromcurrent General Plans. This document recommends improvements in both urbanized and non-urbanized segments of the route, with the recognition that RTPAs and MPOs have primaryresponsibility for addressing urban congestion.7
The TCR identifies a few areas where competing objectives or complex traffic flows demandanalysis that is beyond the scope of a TCR. For such locations, corridor studies or areatransportation studies are recommended.
Context Sensitive Solutions
The concept of Context Sensitive Solutions (CSS) embraces the integration of community andenvironmental values in transportation project planning, design, construction, maintenance,and operations. The concept began to emerge in the 1990s amid increasing public andcommunity resistance to traditional approaches for solving transportation needs. Caltranspolicy now encourages the pursuit of solutions that use innovative and inclusive approaches tointegrate and balance community, aesthetic, and environmental values with transportationsafety and performance goals.8
In the spring of 2003, meetings were held with planners in the four regional transportationplanning agencies, local government officials, and local residents in cities and communitiesalong the route. Extensive outreach was conducted in Spanish and English in two cities havinglarge populations of Spanish-speaking workers and families: Guadalupe in Santa BarbaraCounty and Watsonville in Santa Cruz County. The purpose of these meetings was to identifylocal priorities and concerns relative to the Route 1 corridor that should be addressed in thetransportation concept and recommendations. Concerns identified in the public outreachprocess are listed in Appendix C. This TCR reflects community and environmental valuesidentified in meetings with the public and agency representatives and in local and regionalplans. Projects arising from this TCR will also incorporate CSS processes and principles.
Alternatives to Reduce Motor Vehicle Trips
A new emphasis on interrelationships has developed within the discipline of transportationplanning and its institutional settings. With the Intermodal Surface Transportation EfficiencyAct of 1991 (ISTEA) and its 1998 successor Transportation Equity Act for the 21st Century(TEA21), the federal government set a new course for planning and funding transportationfacilities. These laws stress interconnectivity among transportation modes, enlarge the roles ofregional planning agencies, and require the preparation of regional and state transportationplans that are comprehensive and linked. The Safe, Accountable, Flexible and EfficientTransportation Equity Act of 2005: A Legacy for Users (SAFETEA-LU) continues this basicframework. In 1997, California Senate Bill 45 directed Caltrans and regional planning agenciesto address common issues as partners.
A variety of alternatives can contribute to accommodating future mobility needs along theRoute 1 corridor. Opportunities for passenger rail, intercity and local public transit, and
7 For purposes of the TCR, urban sub-segments that fail to attain LOS D are characterized as congested. See data sheets inAppendix B. Caltrans recognizes the existence of many definitions of urban congestion.8 Caltrans Director’s Policy No. 22, November 2001
8

Transportation Concept Report State Route 1 03/23/06
transportation demand management strategies such as ridesharing and teleworking may beexploited to reduce the impact of the new growth on the highway facility. Demand for travelon Route 1 and use of the facility may be better managed through Intelligent TransportationSystems (ITS) and construction of High Occupancy Vehicle (HOV) lanes. New development inthe four counties may be undertaken in a pattern that reduces the need for automobile travel.This TCR identifies major alternatives in each of the four District 5 counties. It also speaks tothe potential of each to influence the travel patterns along the route.
Numerous sources provide information regarding bicycle facilities in the District.9 Althoughbicycles are accommodated within or close to Caltrans’ right-of-way along much of Route 1,the majority of bicycle use outside urban areas is recreational rather than a modal alternativeto conventional vehicular travel. In many areas, however, bicycling could be an alternative tosuch travel on the highway. From this perspective, the greatest potential contribution ofbicycle use is likely to occur within urban areas where the mode can provide for travel to finaldestinations or to park and ride lots, transit stops, or train stations where inter-modal facilities(for storage) have been provided.
As partnerships evolve and new incentives and commitments are developed to enhance theattractiveness and effectiveness of rail and transit, TDM, and new land use patterns, thesechanges will be reflected in future Transportation Concept Reports. District 5 will continue towork with local agencies to develop comprehensive, all-inclusive approaches to easecongestion and improve safety.
Performance Measures
In the past several years Caltrans has focused attention on measuring and improving theperformance of the transportation system. In 1998, a report entitled Transportation SystemPerformance Measures, presented concept-level “system performance outcomes” anddiscussion regarding performance indicators by which the attainment of desired outcomesmight be measured. Subsequently in 1999, the California Transportation Commissionpromulgated guidelines for the preparation of Regional Transportation Plans (RTPs) statingthat program level transportation system performance measures should be adopted andapplied in the evaluation and selection of plan alternatives.
In this Transportation Concept Report, performance of the State Route 1 is measured primarilyusing level of service (LOS) and delay as indicators for mobility, reliability, and accessibility.Collision rates along individual highway segments are compared with state averages as ameasure of safety. Additional Transportation System Performance Measures are addressedqualitatively. Environmental resources known to exist along the transportation corridor areidentified in anticipation of the comprehensive evaluation of environmental quality that wouldattend a major transportation project.
The outreach to local agencies and the public that has been part of the TCR preparationprocess has provided a means to address coordinated transportation and land use and equity.The TCR incorporates numerous recommendations gathered during the outreach process. Forsome locations, the TCR recommends additional studies with local agencies to assure that the
9 For example, for District 5, Caltrans has published a booklet titled, “Bicycle Map for the State Highways of the Central Coast” andmost local agencies have adopted bicycle plans.
9

Transportation Concept Report State Route 1 03/23/06
future transportation facility provides adequate access while operating safely and efficiently forthe traveling public. Such studies will include additional opportunities for public participation.Comments and suggestions from the public meetings conducted for this TCR are included inAppendix C. These comments address the needs and wishes of system users including transitriders, commuters, truckers, farmers, bicyclists and pedestrians.
Additional Considerations
Goods Movement - According to the 1998 California Statewide Goods Movement Strategy,goods movement on the transportation system was projected to increase by some 46 percentover the twenty-year period 1992-2012. The freight transportation system has alreadybecome the lifeline of domestic and international trade.
The strategy document was prepared as part of the 1998 California Transportation Plan inrecognition of the critical role of transportation in sustaining economic vitality. It focuses onimproving existing system efficiency, through new technology and other means, to maximizesystem capacity and reliability and minimize long-term transportation system costs.
Route 1 has an important role in District 5 in getting agricultural products to market.Additionally, in the Monterey Bay area from Carmel to Santa Cruz especially, Route 1 is criticalfor moving the goods needed to sustain the lives of local residents and the local businesses.Specific concerns and potential actions to improve goods movement along Route 1 will beidentified in Part Two.
Non-Motorized Travel – While the central focus of this TCR is on Route 1 as a highway facilityadequate to accommodate motor vehicle demand, the Route 1 corridor is uniquely attractivefor and suited to non-motorized travel. Bicyclists share the highway with motorized vehiclesfor the majority of the Route. The type of bicycle facility available in the highway right-of-wayfor each route segment is indicated in the “Existing Roadbed Information” section of the datasheets in Appendix B. Deficiencies such as non-standard shoulders that could impact bicyclistsare identified in Part Two in the “Operating Conditions” sections for each county. Among theactions recommended for individual segments are many that will improve the facility for use bybicyclists and pedestrians.
California’s Pacific Coast Bike Route coincides with Route 1 through Santa Barbara County andsections of the highway in each of the other three District 5 counties on Route 1. The BikeRoute follows local roads in other areas.
The California Coastal Trail (CCT) is planned to be a continuous recreational trail extendingfrom the Mexican border to the Oregon state line. The CCT is envisioned to accommodate avariety of users – walkers, bicyclists, equestrian and the mobility impaired – using beaches,bluff tops, or roadway shoulders, through developed areas as well as open space. Along theBig Sur Coast, it is likely that portions of the CCT will coincide with the Route 1 right-of-way.Additionally, parallel recreational trails exist or are planned along the Route in San Luis Obispo,Monterey, and Santa Cruz Counties.
Intelligent Transportation Systems (ITS) - Intelligent Transportation Systems apply advancedtechnologies and management strategies to increase the safety and efficiency of the surfacetransportation system. Over the next 20 years, the deployment of ITS in District 5 will bring
10

Transportation Concept Report State Route 1 03/23/06
significant improvements to Route 1 locations as diverse as agricultural operations in SantaBarbara and South San Luis Obispo Counties, the remote Big Sur Coast, and the heavilytraveled corridor around the Monterey Bay. In rural areas ITS components such as smart callboxes can help travelers overcome isolation. Changeable message signs can warn of closuresor delays ahead. In urban areas, ITS components constitute an integrated system thatgathers data on roadway conditions; conveys information to drivers; and optimizes traffic flow.
The Central Coast ITS Strategic Deployment Plan (SDP), completed in June, 2000, provided aframework for developing a variety of ITS activities in District 5. A cornerstone of the CentralCoast SDP is the Traffic Management Center (TMC) operated from District 5 offices in San LuisObispo. Here Caltrans and CHP personnel staff monitor real time traffic conditions, provide pre-trip and en route information to travelers, coordinate emergency response efforts, and managetraffic flow. The TMC coordinates the following ITS components:
1. Closed circuit television (CCTV) and surveillance loops to monitor traffic flow androadway conditions
2. Ramp meters and synchronized signals to improve traffic flow3. Changeable message signs (CMS), extinguishable message signs (EMS), highway
advisory radio (HAR), and web-based information services to provide real-time regionalmulti-modal traveler information, including notice of incidents and road closures
4. “Smart call boxes” that provide motorists with direct connections to dispatch facilities5. “Smart cards” to facilitate automatic payment of transit fares, parking fees and
roadway use tolls.
To date, ITS elements on Route 1 are concentrated in Santa Cruz County, a reflection of thatcounty’s past affiliation with District 4 and long-standing economic ties with Santa ClaraCounty. Additional ITS applications throughout Route 1 in District 5 are identified in Part Two.
The importance of ITS for California’s continued economic vitality is reflected in the StatewideGoods Movement ITS Action Plan published by the Division of New Technology and Research.The Plan proposes (1) research and development of standards and screening technologies; (2)field testing of standards; and (3) integration of public and private investments in technology.The Plan does not address deployment of specific applications in the field. However, because82 percent of goods by tonnage travel via the highway system, the Plan focuses on truckingand the state’s responsibility for the highway system and intermodal connections. In thefuture, new standards and technologies for fleet management and transportation systemmanagement will apply to state highways in District 5.
HOV Consideration - The California Transportation Commission requires Caltrans to evaluatethe efficacy of High Occupancy Vehicle (HOV) lanes when considering any project to widen afreeway within an urban area.10 A minimum of 800 vehicles per hour per lane, or 1800persons per hour per lane should be projected to use the High Occupancy Vehicle facilityduring the peak hour in order to be effective. Components of successful HOV lanes includesupport facilities such as park and ride lots, transit facilities and public awareness campaigns.
10 As a long-range planning document based upon a macro-analysis of travel demand and capacity, the TCR does notevaluate the potential effectiveness of HOV lanes within particular segments of roadway. HOV analysis will be includedin the Project Study Report (PSR) that will be prepared as part of any proposed widening project along Route 1.
11

Transportation Concept Report State Route 1 03/23/06
At least one segment of Route 1 in District 5, Segment 17 in Santa Cruz County, currentlymeets the minimum requirements for HOV lanes, as will be noted in Part Two.
Route Continuity - Continuity of state routes may require coordination with adjacent districts.District 5 seeks route continuity for functional classification and facility type from county tocounty as warranted by traffic conditions. In District 5, Route 1 originates at US 101 in theinterior of Santa Barbara County, where route continuity is not an issue. The route leaves theDistrict and enters District 4 at the Santa Cruz/San Mateo County line. System planning staffconsulted District 4 staff regarding route concepts. The concept for Route 1 in Santa CruzCounty provides for continuity into San Mateo County. Specific features of the facility throughthe border of the two districts are addressed further in Part Two, following the section onSanta Cruz County.
12

Transportation Concept Report State Route 1 03/23/06
PART TWO: SUB-CORRIDOR ANALYSIS AND DETAIL
Part Two provides a segment-by-segment analysis of Route 1 through District 5. The followinginformation is presented for each of the four counties through which Route 1 passes: areadescription and trends; present and future operating conditions of the highway; andalternatives to reduce single-occupant vehicle travel or improve highway operations. Eachcounty analysis concludes by identifying an appropriate 20-year transportation concept and thefacilities or programs that will be required to achieve the concept.
Part Two begins with a brief description of locations where Caltrans has particular concernsrelated to its charge to provide reasonable interregional traffic flow, safety, continuity, andefficient goods movement to sustain the State’s economy.
CORRIDOR AND INTERREGIONAL CONCERNS
The significance of Route 1 requires Caltrans to consider issues and needs from aninterregional perspective. Caltrans has identified concerns related to the flow of interregionaltraffic, safety, continuity, and/or goods movement through certain stretches of Route 1. Threeof these stretches are particularly problematic. Beginning from the south, these are Santa RosaStreet in San Luis Obispo County, the Big Sur Coast in San Luis Obispo and Monterey Counties,and the stretch between the Carmel River Bridge in Monterey County and SR 17 in Santa CruzCounty, which is a designated High Emphasis Route.
In the City of San Luis Obispo, Route 1 diverges from US 101 via non-standard ramps andproceeds northwest along the Santa Rosa Street alignment to the urban boundary. Santa RosaStreet is burdened to accommodate tourist-related interregional traffic in addition to heavylocal and regional traffic. Local sentiment, existing development patterns, and topographic andenvironmental constraints are major factors when considering alternatives to improve trafficflow on this stretch of Route 1, which is analyzed below as Segment 7.
To the north along the scenic Big Sur Corridor in San Luis Obispo and Monterey Counties,reliability is a transportation concern. Where Route 1 winds along the western face of theSanta Lucia Mountains, the steep rock walls and erosive soils above the highway are slideprone, especially during heavy seasonal storms. Caltrans’ challenge is to maintain the highwayin a manner that protects the fragile environment while minimizing closures and inconvenienceto out-of-area travelers as well as area residents and business owners for whom Route 1 is alifeline. The Big Sur corridor was recently the subject of a comprehensive planning effort byCaltrans and numerous agency and citizen stakeholders. The Coast Highway Management Planfully addresses traffic and maintenance issues as well as a host of important contextual issues.
Mobility is a major concern in Monterey and Santa Cruz Counties between the Carmel RiverBridge and SR 17 in the City of Santa Cruz. The challenge here is to provide for acceptabletraffic flows through the urbanized areas. Increasing volumes of tourist and commuter trips,combined with roadways and interchanges that are no longer adequate for current trafficvolumes, are lowering the level of service for all traffic: interregional, regional, and local. Truckmovement around the Monterey Bay is the most important goods movement issue on Route 1.In transporting fresh produce, timing is critical. Trucks leave fields or packinghouses as soonas they are loaded, regardless of conditions on roadways on which they travel. Truckers also
13

Transportation Concept Report State Route 1 03/23/06
rely on Route 1 for delivering goods to retailers and final users in the cities and unincorporatedcommunities around the Monterey Bay.
Within this stretch of Route 1, a section of two-lane highway through an environmentally richarea at the north end of Monterey County is particularly problematic with safety and continuityissues in addition to mobility concerns.
14

Transportation Concept Report State Route 1 03/23/06
SANTA BARBARA COUNTY
Area and Population: Description and Trends
Santa Barbara County includes five centers of economic activity and development distributedover a varied topography. (See map of Santa Barbara County Development Centers inAppendix B-1.) The two largest developed areas, the South Coast area and the Santa Mariaarea lie along US 101. The South Coast includes the county seat, Santa Barbara, the cities ofCarpinteria and Goleta, and several unincorporated communities, including Isla Vista, near theUniversity of California at Santa Barbara campus.
The rapidly-growing Santa Maria area is located at the north end of the County. The City ofSanta Maria lies on both sides of US 101 just south of the San Luis Obispo County line. Thisarea also encompasses the community of Orcutt and the City of Guadalupe to the west ofSanta Maria on Route 1.
The Santa Ynez Valley area lies north of the South Coast area and the Santa Ynez Mountains.The City of Buellton at the junction of US 101 and SR 246 is the gateway to other Santa YnezValley communities to the east including the City of Solvang and several unincorporatedcommunities.
The Lompoc and Cuyama Valley centers of development are located away from the US 101axis. Lompoc lies west of US 101 on Route 1. The Cuyama Valley is near the extremenortheast of the County, on SR 166.
The Lompoc area on Route 1 includes the City of Lompoc and the communities of VandenbergVillage and Mission Hills, all of which are affected by activity levels at Vandenberg Air ForceBase (VAFB) to their west. The City of Lompoc can be reached from US 101 by three differentroutes. Route 1 leaves US 101 some 19 miles southeast of Lompoc. Although SR 246 providesshorter and faster access to Lompoc from US 101 in the vicinity of Buellton, for commuters tothe South Coast, Route 1 is shorter and more direct. Finally, a combination of SR 135, one ormore local roads, and Route 1 provide access from the north.
The Santa Barbara County Association of Governments (SBCAG) projects that the population ofSanta Barbara County will increase from 399,000 in the year 2000 to 513,000 by 2025, anincrease of 28 percent. In 2025, 54 percent of the population is expected to reside in thenorthern portion of the county (up from 50 percent in 2000). While the South Coast area isjob-rich with government, technology, tourism, retail employment, and the UC campus, it lacksaffordable housing. Significant and still-growing numbers of South Coast area workers residein Santa Maria, the Santa Ynez Valley, and Lompoc. Each of these areas is growing its ownemployment base as well, in response to residential growth and local economic developmentinvestments. Because the development centers to the north are less constrained bytopography, existing patterns of development, and traffic congestion, they can more easilyaccommodate growth.
Lompoc, the major city on Route 1, will continue to be somewhat of a bedroom community forthe South County area. According to the US Census, some 10,000 residents, more than halfLompoc’s work force, travel outside the city to work. More than 40 percent of those
15

Transportation Concept Report State Route 1 03/23/06
commuters travel to South Coast job sites. Although Lompoc and nearby communities of MesaOaks, Mission Hills, and Vandenberg Village grew in population between 1990 and 2000, thepopulation residing at VAFB declined by some 3,700 or 38 percent during this period. Lompoc’seconomy is still linked with the level of activity at VAFB. Growth in commercial launches at thebase, expansion of Allan Hancock College, and development of a private packaging facility areexpected to be major sources of job growth in the Lompoc area.
North of Lompoc and VAFB, Route 1 provides access to productive agricultural operations inthe Santa Maria Valley, extractive operations in the northwest portion of the county, and theCity of Guadalupe just south of the county line. Guadalupe is projected to grow by 14 percentto a population of 6,500 in the year 2025, an increase of 14 percent from the year 2000.
According to Caltrans’ 2000-2001 California Statewide Household Travel Survey, weekdayvehicle trips per household were greater in Santa Barbara County than anywhere in the state.The high number of trips is somewhat balanced by the fact that average trip duration (inminutes) is the lowest in the State. The County’s relative ranking on these measures wasunchanged from results of the 1991 survey. This overall pattern of many shorter trips may bemore prevalent in the more densely populated South Coast area than along the Route 1corridor.
Operating Conditions and Segment Summaries
Route 1 in Santa Barbara County consists of four major segments, three of which are furtherdivided into sub-segments. Traffic conditions for each segment are described below. Maps,summaries and details for each of the segments and sub-segments can be found in AppendixB-1.
Segment 1 (P.M. R0.00/19.25) – Route 1 originates in District 5 at US 101 near the smallsettlement of Las Cruces between the Gaviota and Nojoqui passes (P.M. R48.85 on Route101). The highway transitions from four to two lanes within three miles from US 101, and theroad continues northwest as a two-lane conventional highway through the Santa YnezMountains to join SR 246 at a signalized intersection inside the east limits of the City ofLompoc. Segment 1 is a State designated scenic highway. The majority of the segment is hillyand winding; in some areas travel lanes and paved shoulder widths are as narrow as 11 andfour feet, respectively – below the standard 12 and eight feet. Passing lanes are provided inboth directions at two sections within the segment. Segment 1 is subject to closures due towinter weather-related landslides.
Daily traffic on Segment 1 averaged 7,500 in 2002 operating at LOS D. Traffic is projected toincrease to 14,300 by the year 2025, but LOS will remain at “D”.
Segment 2 (P.M. 19.25/R23.30) - Segment 2 follows local streets through the City of Lompoc.This segment serves as the “Main Street” for the City of Lompoc. It is the last leg of regionaltrips between the South Coast and Lompoc and between Buellton and Lompoc. The segmentalso carries regional traffic between the southeast corner of Lompoc and centers north of theCity (Allan Hancock College, Mission Hills, Vandenberg Village and VAFB).
Sub-segment 2A follows Ocean Avenue coinciding with SR 246 from the Route 1/SR 246junction to the intersection of Ocean Avenue and H Street, in the historic city center. There are
16

Transportation Concept Report State Route 1 03/23/06
four signalized intersections on this four-lane urban section. (See Segment 2 map in AppendixB-1.) Sub-segment 2B extends north on Lompoc’s H Street from Ocean Avenue to theintersection with Harris Grade and Purisima Roads. This sub-segment passes central citydevelopment, strip commercial development, and shopping centers. Sub-segment 2B is a four-lane facility with ten signalized intersections. (See map.)
Daily traffic on sub-segment 2A averaged 16,500 in 2002 and is projected to increase to25,700 by the year 2025. On sub-segment 2B, average daily traffic will increase from 18,100 in2002 to 26,100 in 2025.
Peak hour operations in sections of both sub-segments are controlled by intersectionoperations. While intersection analyses are not available for sub-segment 2A, a traffic studyrecently completed for a nearby residential development indicates existing peak hour levels ofservice for locations on 2B (H Street).
2000 2008 2015South of Purisima D D ENorth of Central D F FSouth of Central B C CNorth of North Ave. C D DSouth of North Ave. C D D
The study also provided service levels for selected intersections along H Street.
2000 2008 2015SR 1/Purisima B D DH Street/Central D E FH Street/North Avenue B (n.a.) C
Segment 3 (P.M. R23.30/ R34.78) - Segment 3 is a four-lane conventional highway andexpressway that extends from the Route 1/ Harris Grade and Purisima Road intersection to theOrcutt Expressway. VAFB land abuts the majority of this segment. Segment 3 has three sub-segments. Sub-segment 3A ends at the main gate of the military base. Signalizedintersections are located at Hancock Road, Timber Lane, and the main gate, where the routemakes a 90-degree right turn. (See Segment 3 map in Appendix B-1.) Sub-segment 3A carries17,800 ADT while operating at LOS A. Traffic volume is projected to increase to 26,200 andoperate at LOS A/B by 2025. Traffic is heaviest just north of the intersection with Harris GradeRoad where most of Lompoc’s growth is occurring. This imbalance may be accentuated asadditional residential development occurs and enrollment at Allan Hancock College increases.
A traffic study recently completed for a nearby residential development indicates existing peakhour levels of service for locations on Lompoc-Casmalia Road (State Route 1)
2000 2008 2015Southeast of Hancock Drive B C CNorthwest of Hancock Drive B C C
17
Transportation Concept Report State Route 1 03/23/06
The study also provided peak-hour service levels for intersections along Lompoc-CasmaliaRoad (State Route 1).
2000 2008 2015SR 1/Hancock Drive A A B
Sub-segment 3B continues as a conventional highway through VAFB to the south junction ofState Routes 1 and 135. This sub-segment carries 13,900 ADT and operates at LOS A. Trafficis projected to rise to 17,700 ADT by 2025 with service declining slightly to A/B. Although sub-segments 3A and 3B are classified as conventional highway, only one major point of accessexists along the portion that passes through VAFB. This could change if options underconsideration for certain sections of the base property were realized. These include: (1) leaseof acreage to the California Space Authority and the Chumash Indians for a rest center withareas for viewing launches, parking, a museum, and exhibits; (2) a national cemetery off sub-segment 3B; and (3) lease of acreage off sub-segment 3A for development of a windmill farm.
Sub-segment 3C is an expressway that coincides with SR 135 to the Orcutt Expressway. Herethe sub-segment ends and the routes diverge; Route 1 courses northwest as SR 135 continuesnorth into Orcutt and Santa Maria. Sub-segment 3C carried 15,000 ADT in 2002 whileoperating at LOS A. With 17,800 ADT in 2025, LOS will remain at A.
Segment 4 (P.M. R34.78/50.61) - Segment 4 extends from the Orcutt Expressway to the SantaBarbara/San Luis Obispo County line at the north side of the Santa Maria River. Traffic volumeon sub-segment 4A is 77 percent less than on sub-segment 3C to the south. Sub-segment 4Ais a two-lane facility extending north through the rich agricultural fields of the Santa MariaValley to State Route 166 at south end of the City of Guadalupe. Travel lanes and shouldersare less than standard width on long stretches of the sub-segment. Produce trucks and slow-moving agricultural equipment are a regular component of traffic here. Sub-segment 4B isGuadalupe Street, the city’s “main street.” It reenters the unincorporated area just south of theSanta Maria River Bridge. Guadalupe Street is lined with commercial and industrial uses. AlongRoute 1 through Guadalupe there are no traffic signals but an all-way stop sign exists at 11th
Street. An Amtrak station, the only passenger rail station along Route 1 in Santa BarbaraCounty, is located on the east side of Guadalupe Street along tracks that run parallel to Route1. The Santa Maria River Bridge, which ends sub-segment 4B, lacks standard shoulders.
State Route 166 provides access to Santa Maria from Route 1 in Guadalupe. This access isblocked periodically when trains are present on the railroad tracks just east of Route 1. Nofinancially feasible or practical alternatives for a grade-separated crossing have been identifiedto date. Development on the southeast corner will require improvements to the SR 1/SR 166intersection as well as channelization along SR 166 just east of the intersection.
Daily traffic on sub-segment 4A is 3,700, projected to rise to 4,000 by 2025. In the horizonyear the facility will continue to operate at its current LOS C. With 5,000 ADT, sub-segment 4Boperates at LOS A. Level of service on the sub-segment is not expected to change with ADT of6,000 in 2025.
18

Transportation Concept Report State Route 1 03/23/06
According to a traffic study prepared for proposed development on the southeast corner ofState Routes 1 and 166, the unsignalized intersection at the end of sub-segment 4A currentlyoperates at LOS B and would fall to C in 2023 (without the proposed project).
At a joint meeting of the Boards of SBCAG and the San Luis Obispo Council of Governments(SLOCOG) held in the fall of 2005, representatives of SBCAG voiced concerns that approvednew development in San Luis Obispo County would impact operations along Route 1 in the Cityof Guadalupe. Traffic studies prepared for recent projects have not indicated such impactswould occur.
Linkages – Route 1 intersects with US Route 101 and State Routes 246, 135, and 166 (south tonorth) in Santa Barbara County.
Alternatives to Reduce Demand or Improve Operations
The Santa Barbara County Association of Governments Metropolitan Transportation Plan 2004-2030 recognizes that dependence on the automobile is the number one issue affecting thecounty’s transportation system. Urban sprawl and a jobs/housing imbalance followdependence on the automobile. Certain alternatives could lessen impacts to Route 1 fromfuture growth and development in the Lompoc and Santa Maria areas. These include variousmodes of travel, transportation demand management, measures to control the flow of traffic,and new land use and circulation policies. The potential for each of these to affect traveldemand on Route 1 is explored below.
Passenger Rail - Amtrak provides passenger rail service for interregional travel through District5 with twice daily service by the Pacific Surfliner and daily service with Coast Starlight trains.The Union Pacific tracks follow US 101 north through the South Coast area of the county andon to Gaviota. At Gaviota, the tracks head west, more or less along the Route 1 corridor,through the Lompoc area, then north to Guadalupe, and on into San Luis Obispo County. Theline continues to Oakland in the Bay Area.
The one staffed passenger station in the county is in the City of Santa Barbara. To the north,unstaffed stations at Surf and Guadalupe serve the Lompoc-Vandenberg area and the SantaMaria Valley, respectively. Surf is out of direction for travel from Lompoc to Santa Barbara.Given the station location and limited service, passenger rail provides a reasonable alternativefor interregional trips but will have negligible effects on regional trips, e.g., commuter travelbetween the Lompoc and South Coast areas. North county communities have access toadditional passenger trains southbound from Santa Barbara via dedicated Amtrak bus servicelinking north county with the Santa Barbara station.
Freight Rail - Freight operations provided by the Union Pacific Railroad Company areaccommodated on the main rail line that diverges from the US 101 corridor at Gaviota, andcontinues west along the coast. Freight rail activity is light (two trains daily in each directionthrough the corridor) and there does not appear to be significant potential for more. The mostsignificant freight rail activity in the county is the movement of bulk commodities andagricultural products between Guadalupe and Santa Maria. This service of the Santa MariaValley Railroad includes a major spur to the Santa Maria Airport industrial zone providing forinter-modal transfers. This operation has minimal impact on the operational characteristics ofRoute 1.
19
Transportation Concept Report State Route 1 03/23/06
Urban Transit - The City of Lompoc Transit (COLT) provides both fixed route and demand-responsive service within the city and out to the nearby unincorporated communities of MissionHills and Vandenberg Village. For the residents of these communities, which are north ofLompoc and accessed via Route 1, this service reduces highway trips and also satisfiesdemand that might otherwise be unmet. As Allan Hancock College grows and developmentincreases north of Lompoc, COLT transit service can be expected to relieve some of thedemand to travel on Segments 2 and 3 of Route 1.
The Santa Maria Organization of Transportation Helpers (SMOOTH) operates the GuadalupeShuttle providing deviated fixed route transit service within Guadalupe.
Inter-city Transit - Two types of travel needs – commuting and special needs – areaccommodated by inter-city transit along the Route 1 corridor. The Clean Air Express deliverscommuters from both Santa Maria and Lompoc to South Coast (Santa Barbara and Goleta)employment centers. If residential growth continues to outstrip job-creation in the Lompocarea, this service will become even more important for meeting future travel demand betweenLompoc and the South Coast. The service will have positive impacts not only for Route 1, butalso SR 246 and US 101. SMOOTH operates the Guadalupe Flyer, which provides fixed routeservice with one-hour headways between Guadalupe and Santa Maria. This service, however,responds to travel demand on SR 166 rather than Route 1. Regular use of inter-city transit forcommuting can be enhanced through provision of park and ride lots at trip origin sites andcoordination with intra-city services at both origin and destination sites.
A new service, The Breeze, runs between Santa Maria and Lompoc with stops in Orcutt, VAFB,and Vandenberg Village. The majority of the 15 daily one-way trips on The Breeze buses aretimed to accommodate commuters. The Breeze was initiated in May 2005 as a three-year pilotprogram. Ridership of 35,000 is expected the first year, rising to 66,000 in the third.
Both SMOOTH and the City of Lompoc Transit (COLT) provide services to special populations.SMOOTH offers demand-responsive service from Guadalupe and Lompoc to Santa Barbara fourtimes daily on weekdays for health care purposes. COLT also offers round-trip service twice aweek between Lompoc and Santa Barbara. This service includes a door-to-door Dial-a-Ridefeature for persons traveling to Santa Barbara for medical appointments. Others may board theCOLT buses at the Mission Plaza shopping center. Advance reservations are required for theCOLT service to Santa Barbara. In addition, SMOOTH provides scheduled transit rides toCalifornia Department of Social Services CalWorks recipients on weekdays between Lompocand Santa Maria. These services can reduce automobile trips on Route 1 while assisting specialneeds or transit-dependent persons.
In spring of 2005, Greyhound Bus Lines discontinued inter-city and interregional bus servicelinking Lompoc on Route 1 with major employment and trade centers in Santa Maria to thenorth and South Coast communities (Goleta, Santa Barbara and Carpinteria) to the south.However, because service had been limited to one daily trip in each direction, Greyhoundaccommodated interregional travelers (e.g., trips to Los Angeles or the Bay Area) rather thancommuters to South Coast sites.
Non-motorized Transportation – The 2004 Metropolitan Transportation Plan (MTP) for SantaBarbara County includes a system of bikeways providing access throughout major population
20

Transportation Concept Report State Route 1 03/23/06
centers as well as linkages among such centers and recreational destinations in the region.Bicycle travel has potential as an alternative to motorized travel – especially in the Lompoc-Hancock College-Vandenberg corridor.
In the Lompoc area Class II bike lanes are proposed for Route 1 south of SR 246 and north ofthe Santa Ynez River. The extensive Class II and III bikeway system proposed within the cityitself will avoid Route 1 along heavily traveled Ocean and H Streets. The proposed RegionalBikeway System does not include bike routes through the City of Guadalupe.
Narrow travel lanes and shoulders are a concern for both bicyclists and motorists. These aremost problematic along the north end of Segment 2B and through the intersection with HarrisGrade and Purisima Roads and along sub-segment 4A between the Orcutt Expressway and SR166. In other areas, standard shoulders are absent over bridges.
All of Route 1 in Santa Barbara County is on the Pacific Coast Bike Route.
Transportation Demand Management – Transportation demand management includes a rangeof techniques to reduce traffic congestion including ridesharing, flexible work hours, andtargeted pricing of parking (by area, vehicle occupancy or time of day or duration of stay).
TDM will be successful to the extent that the individual behaviors of large numbers of driverschange. Conditions and changes such as higher driving or parking costs, intolerable levels ofcongestion, work schedule changes effected by multiple employers, and concerted public policyactions can induce changes in transportation demand.
Intelligent Transportation Systems (ITS) – ITS projects promise to aid travelers and improveroadway operations. ITS projects have been implemented in the County and additional projectshave a high priority. When the Central Coast ITS Strategic Plan is fully implemented, thefollowing elements will be available on Route 1:- System of call boxes- Changeable message signs (CMS) and/or highway advisory radio (HAR) on US 101 and SR
154 to warn of traffic incidents, slides, and road closures along Segment 1- Transit vehicle monitoring system and synchronization/coordination of traffic signals in
Lompoc- Traffic surveillance stations (Closed Circuit TV cameras) along Segment 3
Land Use Planning – Most of the development along Route 1 in Santa Barbara County hasoccurred and continues to occur at low densities. Strict separation of land uses has encouragedan automobile-dependent population. The resulting development pattern is difficult to servewith efficient intra-urban transit is not conducive to walking to commercial centers.
Local governments in Santa Barbara County have recognized the interrelationships among landuse patterns, transportation, and quality of life concerns. The county and its cities areattempting to achieve more positive outcomes through complementary policies.
The SBCAG MTP acknowledges the problems facing most communities as they attempt toencourage modal shifts through land use: patterns of existing development are not conduciveto such shifts. The MTP identifies the development of regional jobs/housing strategies as a
21

Transportation Concept Report State Route 1 03/23/06
promising approach to addressing congestion and air quality through land use planning.Caltrans will work cooperatively with local governments to ensure that improvements in theRoute 1 corridor are consistent with local plans and coordinated with other transportationmodes.
Transportation Concept and Strategies
Caltrans strives to provide a consistently high level of service on its facilities as they passthrough urban and rural communities. Historically, District 5 has targeted a peak hour LOS C orbetter for state highways. In Santa Barbara County, challenging traffic conditions put a realistictarget LOS at D in certain areas. This will require operational improvements and perhapschanges to local circulation patterns. As part of the County’s Congestion Management Program,SBCAG has also adopted a standard LOS D or better as the realistically achievable target LOSfor projects in its 2004 Metropolitan Transportation Plan.
Segment 1 - The transportation concept for Segment 1 is peak hour LOS D or better. Anumber of actions can be taken to improve the performance of this rural highway where trafficis growing rapidly.
The following improvements could improve operations along this segment:
- Widen El Jaro Creek bridges to provide standard shoulders or construct parallel facilities ofnon-motorized travel.
- Consider additional passing lanes, turnouts, and channelization to ease turningmovements.
- Install changeable message signs on US 101, SR 246, and/or Segment 2 of Route 1 toadvise drivers of blockages on Segment 1.
- Attempt to reduce regional trips between the South Coast and the Lompoc area withexpress bus service, car pools, and vanpools and promotion of an upgraded SR 246 as analternative.
Segment 2 - The transportation concept for Segment 2 is peak hour LOS C/D or better.
The following improvements could improve operations along this segment:
- Evaluate the feasibility of extending Central Avenue east of Route 1.- Evaluate opportunities to improve local circulation with directional couplets of parallel
arterials.- Evaluate opportunities to improve conditions for bicyclists at the Santa Ynez River Bridge,
northbound, and through the intersection at Harris Grade and Purisima Roads.
Segment 3 - The transportation concept for Segment 3 is peak hour LOS C or better. Futurenon-military activities proposed for VAFB land will require evaluation and mitigation of trafficimpacts. However, the four-lane conventional highway/expressway will continue to operatewell to the year 2025.
Segment 4 – The transportation concept for Segment 4 is peak hour LOS C or better.
The following improvements could improve operations along this segment:
22

Transportation Concept Report State Route 1 03/23/06
- Widen non-standard travel lanes and shoulders including bridge crossings to improvemotor vehicle and bicycle operations.
- Provide passing lanes or turnouts to compensate for mix of automobiles, trucks, and farmequipment on the highway. (Sub-segment 4A)
- Provide operational improvements at unsignalized intersections such as channelization andacceleration and deceleration lanes. (Sub-segment 4A)
- Promote ridership on The Breeze as a commuter transit alternative between Lompoc,Vandenberg, and Santa Maria.
- Evaluate alternatives for providing continuous reliable service between Guadalupe andSanta Maria in advance of significant new development in Guadalupe. Alternatives shouldinclude an elevated railroad crossing on an east-west street alignment away from SR 166.
- Improve circulation on the local street system in the City of Guadalupe to ensure adequatepedestrian and vehicular access in advance of new development. (Sub-segment 4B)
Appendix B-1 includes maps, sub-segment data sheets, and summaries of the issues,concepts, and recommended improvements described above for Route 1 in Santa BarbaraCounty.
23

Transportation Concept Report State Route 1 03/23/06
SAN LUIS OBISPO COUNTY
Area and Population: Description and Trends
San Luis Obispo County includes seven incorporated cities and several unincorporatedcommunities. The coastal and near-inland areas of San Luis Obispo County enjoy a gentleMediterranean climate and ideal conditions for growing crops throughout the year. The countylies midway between the Los Angeles Basin and the Bay Area and beyond daily commutingdistance from either. Its communities have remained relatively distinct; its landscape remainsdistinctly rural.
State Route 1 runs along the coast through three of the four planning subregions identified bythe San Luis Obispo Council of Governments: South County, Central, and North Coast. (Seemaps in Appendix B-2.) South County includes the cities of Arroyo Grande, Grover Beach, andPismo Beach as well as the communities of Nipomo, Oceano, and Shell Beach. Nipomo,located near the county line on US 101, has grown rapidly over the past decade; its residentshave explored the possibility of incorporating as a city. To the north, the Five Cities area11
offers facilities and services for tourists: restaurants, campgrounds, motels, and beach-orientedmobile home parks. The City of Pismo Beach in particular is a tourist and recreationaldestination. Route 1 provides local access to agricultural and rural residential areas, thebeachfront, recreational facilities, and residential communities in Oceano, Grover Beach, andPismo Beach.
From Pismo Beach, Route 1 is contiguous with the US 101 alignment moving away from thecoast, across the San Luis Range and into the Central area and the City of San Luis Obispo. InSan Luis Obispo, Route 1 diverges from US 101, which continues north over the Cuesta Gradeinto the North County Area.
Route 1 heads northwest into the North Coast area. Several points of interest lie along Route 1north of San Luis Obispo: a series of ancient volcanic peaks known as the Morros, the City ofMorro Bay and the unincorporated communities of Cayucos and Cambria, beaches andspectacular ocean vistas. Popular units of the California Park system are located betweenCambria and the county line: San Simeon State Park, W.R. Hearst Memorial State Beach, theHearst Castle, and the Piedras Blancas Light Station. The economy of the North Coast is basedon tourism with motels, restaurants, retailing, and recreational outfitters. The Route 1 corridorfrom the north city limits of San Luis Obispo through the remainder of the County is adesignated All American Road.
The San Luis Obispo Council of Governments (SLOCOG) projects the population of San LuisObispo County will grow from 258,500 in 2004 to 335,000 in 2025, an increase of 30 percent.Most of the growth is projected to occur in North County, South County, and the North Coast.The County Planning Department projects that Nipomo will grow more than 68 percent overthe next 20 years. While no established community along Route 1 is projected to grow fasterthan 22 percent, growth in the rural South County will slightly exceed the overall rate for theCounty. The County’s fastest growing areas will be inland communities in the North County.
11 Collectively the cities of Arroyo Grande, Grover Beach, and Pismo Beach along with the
unincorporated community of Oceano and the community of Shell Beach within Pismo Beach havelong been known as the Five Cities.
24

Transportation Concept Report State Route 1 03/23/06
The Central subregion is projected to grow 21 percent in the next 20 years. The City of SanLuis Obispo, the county seat, cultural center, and home to California State PolytechnicUniversity, is a major employment center and has a chronic shortage of affordable housing.Residents of the South County, North County and North Coast areas commute to jobs in SanLuis Obispo jobs via US 101 and Route 1.
Operating Conditions and Segment Summaries
Route 1 in San Luis Obispo County consists of seven major segments, four of which have beenfurther divided into sub-segments. Traffic characteristics of each segment are presentedbelow. Segment maps and summaries and additional data for each of the segments and sub-segments can be found in Appendix B-2.
Segment 5 (P.M. 0.00/10.90) - Segment 5 extends from the Santa Barbara/San Luis ObispoCounty line to the north (second) intersection with Halcyon Road. The segment is a two-laneconventional highway without medians except at intersection approaches where left turn laneshave been constructed. While this segment of Route 1 provides a parallel route to US 101 fornorthbound traffic, the facility serves low volumes of largely local and regional traffic includingfarm vehicles and trucks carrying produce from fields to packing facilities in Guadalupe.
Segment 5 has been divided into two sub-segments at Willow Road. Both sub-segments 5Aand 5B include stretches with non-standard width travel lanes as well as multiple curves andundulations, the steepest of which is a 10 percent grade south of the Nipomo Mesa. The SantaMaria River Bridge at the south end of sub-segment 5A has non-standard width outsideshoulders. While little development currently exists along Segment 5A, a major mixed-use(residential, commercial, office and recreational uses) development has been approved for a950-acre parcel at the southeast corner of Route 1 and Willow Road.
The density of rural homesites and small subdivisions increases north of Willow Road.
A study completed in the year 2000 considered improvements along Route 1 includingalternatives to align the route with Halcyon Road, a more direct parallel route to the west. Therealignment was rejected due to environmental issues and the cost of bringing the road toacceptable state highway standards.
The south and north legs of Halcyon are offset at the northern intersection of Halcyon Roadand Route 1. A project to realign and signalize this intersection will improve operations.
In 2002, average daily traffic (ADT) was 5,500 along both Segments 5A and 5B, with trucksaccounting for approximately 11 percent of peak hour traffic. Both sub-segments operated atpeak hour LOS C. Traffic is projected to rise to 9,000 in sub-segment 5A by 2025 withoperations remaining at LOS C. In sub-segment 5B traffic will increase to 9,500 with operationsfalling to LOS D by the horizon year.
Segment 6 (P.M. 10.90/16.77) - Route 1 continues toward the coast from the northern HalcyonRoad intersection. The intensity of development increases gradually from south to norththrough this segment. Near the Oceano Airport, the highway turns north passing throughOceano, Grover Beach, and Pismo Beach. North of Grover Beach the highway follows Dolliver
25
Transportation Concept Report State Route 1 03/23/06
Street, the main thoroughfare of Pismo Beach, then Price Street, to US 101 where Segment 6ends. Segment 6 is a two-lane conventional highway throughout.
Motor vehicles, bicyclists, pedestrians, and sometimes equestrians all contend for access toRoute 1 along this segment. Numerous driveways provide access to parks, beaches,campgrounds, recreational vehicle parks, and residences while slowing through-traffic.Pedestrian safety is a concern for area residents, especially south of Pismo Beach.
In 2002, ADT on Segment 6 ranged from 10,500 to 13,700 with an average of 12,200 ADT andan average LOS E. Average daily traffic is projected to increase to 24,300 by the year 2025and to operate at LOS F. Beginning at Pier Street, Segment 6 includes seven signalizedintersections, five of which are within Pismo Beach. Despite the numerous driveways andheavy use by tourists unfamiliar with the area, collision and injury rates on Segment 6 are wellbelow statewide averages for the facility type. In general, the highest level of use by touristsdoes not occur during weekday peak hours when commuter traffic is heaviest.
Although less developable land is available adjacent to Segment 6 than Segment 5, newdevelopment to the south can be expected to add to congestion and heighten operationalconcerns for motorists, bicyclists and pedestrians along Segment 6.
From Pismo Beach, Route 1 and US 101 course north together for 12 miles into the City of SanLuis Obispo where Route 1 resumes as an independent route.
Segment 7(P.M. 16.77/17.80) – Segment 7 is the one-mile stretch from US 101 to the citylimits at Highland Drive. Segment 7 begins with a complex access system through cityneighborhoods to Santa Rosa Street. The state route follows Santa Rosa Street through thenorthwest corridor of the city. Santa Rosa Street is a busy four-lane local thoroughfare linedwith commercial, office, and residential uses with individual driveways. Through most of thesegment, center lanes provide for mid-block left turns. This segment accommodates a varietyof trip purposes. First, the road is used for local trips to Santa Rosa Street destinations andSierra Vista Hospital and trips between downtown San Luis Obispo and the city’s FoothillAvenue axis. Second, the road handles heavy regional traffic to California State PolytechnicUniversity, Cuesta College, and employment sites located in downtown San Luis Obispo andalong Segment 8. Finally, the facility accommodates interregional traffic between US 101 andmajor North Coast attractions such as Hearst Castle and the Big Sur coast. Although themajority of parcels along this heavily traveled corridor are developed, a large faculty housingproject at the Southwest corner of Highland Drive and Route 1 will generate additional localtraffic.
Segment 7 carried an average of 41,000 vehicles per day in 2002 with 3,100 during the peakhour. Santa Rosa Street traffic is projected to increase to 46,500 by the year 2025. Due to theheavy traffic volume and signal spacing along this segment, intersection analyses rather thantraffic flow analysis would provide the appropriate measure of service level. The intersection atFoothill Boulevard accommodates the highest volume and has the most complex signalphasing. According to Vision 2025, the 2005 Regional Transportation Plan for San Luis ObispoCounty, this segment operated at LOS E in 2004, with LOS F expected in 2025.
Segment 7 is classified as a Highway/Regional Route on the City of San Luis Obispo CirculationElement. The Circulation Element expresses support for a study to evaluate widening SantaRosa Street to six lanes and for constructing an underpass or overpass at Foothill Boulevard.
26

Transportation Concept Report State Route 1 03/23/06
There are also plans to study the reconstruction of the US 101/Route 1 interchange. Caltranshas determined that major improvements to the US 101/SR 1 interchange would not resolvesegment congestion without also widening Santa Rosa Street. Through the years, alternativealignments have been considered for Segments 7 and 8A. Such alternatives would route trafficfrom US 101 via an alternate route south of Santa Rosa Street to rejoin the existing Route 1 inthe vicinity of Cuesta College. To date, concerns related to environmental impacts and growth-inducement have hampered exploration of these alternatives.
Segment 8 (P.M. 17.80/27.88) – Segment 8 extends from the north end of San Luis Obispo tothe south end of Morro Bay. This segment is constructed as a four-lane expressway. Theentire segment accommodates North Coast commuters and students traveling south to SanLuis Obispo job sites and Cal Poly as well as interregional tourist traffic bound for North Coastdestinations. Sub-segment 8A ends at Education Drive, the northern entrance to CuestaCollege. Several public entities along this sub-segment are themselves employmentdestinations: California Department of Forestry, California Conservation Corps, County Sheriff,California Men’s Colony, Camp San Luis Obispo National Guard Base, Cuesta College, El ChorroRegional Park, Dairy Creek Golf Course, and the San Luis Obispo County School District offices.High-speed through traffic coupled with high turning volumes into these facilities contributes toconcerns for traffic safety and operations. A median barrier between northbound andsouthbound travel lanes has reduced the potential for cross-median collisions. The barrier hasreceived favorable comments for its context sensitive design and appearance.
Most of the land along sub-segment 8B continuing to South Bay Boulevard is in agricultural usewith scattered homesteads and farm-related structures. The median barrier will be extendedthrough this sub-segment.
Segment 8 also marks the south limit of the San Luis Obispo North Coast (SLONC) All AmericanRoad that continues north to the San Luis Obispo/Monterey County line (where it joins the BigSur Coast Highway All American Road). Segment 8 corresponds with “The Morros” section ofthe SLONC byway. The SLONC Corridor Enhancement Plan (CEP) addresses the broadpurposes of protecting and enhancing the corridor, coordinating a coherent and appealingmarketing plan, and identifying potential locations for interpretive improvements. The CEPproposes a number of specific improvements for the Morros section: gateway improvements, aCal Poly-Cuesta College bikeway connector, an interpretation facility, utilities undergrounding,and billboard removal. Caltrans would be a partner in implementing all improvements withinthe Route 1 right-of-way.
Traffic on sub-segment 8A is projected to increase from 23,800 in 2002 to 30,900 in 2025.Operations here are controlled by breaks in traffic flow for the four signalized intersections.Volumes on sub-segment 8B are lower: 20,000 ADT in 2002, with 24,500 projected in thehorizon year. This segment has no traffic signals and few unsignalized intersections.Operations are expected to remain at LOS A/B to the year 2025.
Segment 9 (P.M. 27.88/45.99) – Segment 9 spans the 18-mile section of highway from thesouth end of Morro Bay north to the junction with SR 46. Segment 9 includes sections of four-lane freeway, four-lane expressway, and two-lane expressway. The segment accommodateslocal and regional trips between North Coast communities as well as interregional tourist tripsto Central Coast destinations.
27

Transportation Concept Report State Route 1 03/23/06
Like Segment 8, Segment 9 is part of the SLONC All American Road. For this stretch, the CEPproposes highway ramp landscaping, bridge improvements, utilities undergrounding, billboardremoval, park and ride lots in Morro Bay and Cayucos, and an interpretation site/vistaoverlook. The CEP also includes a number of bicycle and pedestrian improvements includingcontinuous Class II lanes along the highway and Class I and multi-use paths west of thehighway between Morro Bay and Cayucos.
Sub-segment 9A extends to the north end of Morro Bay. In 2002 this sub-segmentaccommodated 18,900 ADT at LOS A. Traffic is projected to grow to 23,000 ADT in 2025 withservice remaining at LOS A. The grade-separated interchange with SR 41 operates poorlywhen traffic backs up at the intersection of SR 41 and Morro Bay’s Main Street. Main Streetserves as a frontage road parallel and just east of Route 1. While the roundaboutprogrammed for the intersection of SR 41 and Main Street would clear both intersections moreefficiently, the project is opposed by some community stakeholders and is being reconsidered.
Sub-segment 9B is the 4.7-mile stretch of four-lane freeway and expressway from the northend of Morro Bay to P.M. 36.80, north of Cayucos. At this point, the freeway ends and theroadway narrows to two lanes. The 2002 ADT of 11,900 on sub-segment 9B will rise to 13,400by the year 2025. The sub-segment will continue to operate at LOS A.
Sub-segment 9C completes the segment with a nine-mile stretch of two-lane expresswaythrough open space and rangeland. Traffic volumes are considerably lower than on theprevious sub-segment: 7,300 ADT in 2002 and projected to rise to 7,900 by 2025. This two-lane stretch with limited passing opportunities currently operates at LOS D but is expected tofall to LOS D/E by 2025. The settlement of Harmony is located east side of the highway justnorth of the crest of a small hill. Harmony is accessed via an at-grade intersection withHarmony Valley Road. (A private road intersects Route 1 opposite Harmony Valley Road)Highway operations will be improved with construction of a southbound left turn lane at theintersection. The Harmony Climbing Lane project study found that passing lanes in this areawould be technically feasible, but may not be cost-effective. Technically, passing lanes wouldbe an operational improvement rather than additional capacity. However, the CoastalCommission may oppose such a project if it is seen as widening.
Segment 10 (P.M. 45.99/71.34) Segment 10 extends from SR 46 to San Carpoforo Creek,three miles south of the San Luis Obispo/Monterey County line. While commuter traffic isreflected in peak hour volumes, tourist-related traffic predominates in the segment.
Segment 10A is a two-lane expressway which ends at the signalized Main Street exit to thecoastal community of Cambria. Residents travel Route 1 for jobs and services in San LuisObispo and North County. Cambria has more than 6,000 residents. It is the last settlementwith services such as banking, supermarket, professional offices, hardware and drug storesbefore the City of Carmel-by-the-Sea, some 100 miles north in Monterey County. Cambriavillage is a popular tourist destination with shopping, dining, and lodging facilities.
Sub-segment 10B continues north as a two-lane expressway through and beyond Cambria,providing access to San Simeon and the Hearst San Simeon State Historical Monument (HearstCastle). A previous alignment of Route 1 followed Main Street through Cambria. The bypasswas constructed in the early 1960s. Traffic signals are located at the intersections with BurtonDrive and Windsor Boulevard in Cambria. San Simeon, a small settlement approximately three
28

Transportation Concept Report State Route 1 03/23/06
miles south of Hearst Castle, provides housing and limited services for employees of theMonument as well as lodging and restaurants for tourists. Roads parallel to Route 1 provideaccess to properties on the west and east sides of the settlement while limiting access to thehighway.
Sub-Segment 10C continues as a conventional highway from the Hearst Castle entrance at SanSimeon to San Carpoforo Creek. Lanes and shoulders of less than standard width are commonthroughout this sub-segment.
The area west of sub-segments 10B and 10C is encumbered by a scenic easement acquiredfrom the Hearst Corporation in 2005. This acquisition also included the rights for Caltrans torealign portions of the highway affected by coastal erosion. Concurrent conservationagreements limit development on some 82,000 acres of Hearst Ranch property, including mostlands to the east ridgeline (viewshed) from north of San Simeon to the San LuisObispo/Monterey County line.
Segment 10 includes the north portion of the Harmony Valley/South San Simeon Coast sectionand the entire Big Sur Gateway/North San Simeon Coast section identified in the SLONCCorridor Enhancement Plan (CEP). Here the CEP proposes passing lanes, two interpretivesites/overlooks, highway operational improvements, pedestrian access improvements, utilitiesundergrounding, and billboard removal. The CEP also includes a number of bicycle andpedestrian improvements, including Class II facilities along Route 1 as far north as the HearstCastle.
Segment 10A carried 9,000 ADT in 2002 while operating at LOS D. The service level isexpected to remain at LOS D in 2025 when ADT reaches 11,500.
In 2002, ADT on sub-segment 10B was 6,100. Traffic is projected to reach 8,500 ADT by theyear 2025. As with sub-segment 10A, LOS is expected to remain at LOS D on sub-segment 10Bto the planning horizon.
On sub-segment 10C, ADT was 3,200, in 2003 - just over half the traffic carried on sub-segment 10B. The drop in volume reflects the high number of daily return trips to HearstCastle and San Simeon from locations to the south. Volume will increase to 5,200 by the year2025 while LOS declines from C to D.
Segment 11 (P.M. 71.34/74.32) Segment 11 begins at San Carpoforo Creek and ends at theSan Luis Obispo/Monterey County line. San Carpoforo Creek marks the beginning of the uniquetopography that characterizes the Big Sur coast. North of the Creek, the highway begins asteep rise, winding along mountainsides above the Pacific coastline. The 75-mile long corridorthat is addressed in the Coast Highway Management Plan (CHMP) extends north from SanCarpoforo Creek in San Luis Obispo County to the Carmel River in Monterey County.
Lanes and shoulders are less than current standard width throughout this sub-segment. Thesheer rock walls and steep slopes along Segment 11 and the Monterey County segments thatlie within the CHMP area, make lane widening and accommodating the California Coastal Trail(CCT) more difficult than in other locations. It is likely that portions of the CCT will coincidewith the Route 1 right-of-way in Segment 11.
29

Transportation Concept Report State Route 1 03/23/06
In the year 2002, the ADT on Segment 11 was 2,600. Traffic volume is projected to increase to4,200 by the year 2025. This segment operates at LOS C, but is projected to operate at LOS Dby the year 2025.
Linkages – US 101, SR 41, and SR 46 connect with Route 1 (south to north) in San Luis ObispoCounty.
Alternatives to Reduce Demand or Improve Operations
In San Luis Obispo County, tourism accounts for a large share of traffic on Route 1; thegeographic areas and demographic groups that provide the majority of visitors to the County’scoastal areas are expanding rapidly. An Intermodal Systems Emphasis scenario guides the SanLuis Obispo County Regional Transportation Plan towards a balance among highways, streetsand roads; transit and rail; and non-motorized transportation. Patterns of highway use anddevelopment along Route 1 limit the likelihood that alternatives will reduce demandsignificantly. Nevertheless, it will be important to identify alternatives most likely to contributeto demand reduction and management. Various alternatives are discussed below.
Passenger Rail – Amtrak provides passenger rail service for interregional travel along thecentral coast between San Luis Obispo and the large metropolitan areas to the north and south(with a stop in Grover Beach). While passenger rail offers a viable alternative to travel on USRoute 101 which carries much higher volumes of interregional traffic through the County, thismode has little potential to reduce demand on Route 1. Residential densities and traveldemand do not warrant consideration of short-haul passenger rail service between San LuisObispo and Grover Beach, Guadalupe, or Lompoc, the District 5 communities with rail stationsnear Route 1. The Union Pacific tracks follow US 101 north of San Luis Obispo.
Freight Rail – In San Luis Obispo County, Route 1 is not a major goods movement corridor.Therefore, freight rail is not an alternative to traveling Route 1.
Urban Transit – All the communities along Route 1 in San Luis Obispo County are served byfixed route urban transit systems. The South County Area Transit (SCAT) system servesArroyo Grande, Grover Beach, Pismo Beach, and Oceano, while SLO Transit serves the City ofSan Luis Obispo. Both these services offer fixed route transit service on weekdays, withheadways of one hour or less. Trolley service through downtown San Luis Obispo and Cambriais provided by SLO Transit and the Cambria Trolley (the “Otter”), respectively. A beach areashuttle could relieve seasonal traffic demand on Route 1 in Pismo Beach and the Five Citiesarea.
Transit is an especially important component of weekday circulation within the relativelycompact City of San Luis Obispo. Free service for Cal Poly students, faculty and staff isintended to reduce both traffic on local streets such as Santa Rosa Street (Route 1) and theneed for parking areas on campus.
A number of communities provide Dial-a-Ride and other demand service to special populations.
Regional (Inter-city) Transit – A significant amount of travel takes place among communitiesalong Route 1 in San Luis Obispo County especially trips into San Luis Obispo. In SouthCounty, the SCAT system functions as a hybrid of urban and inter-city transit within and
30
Transportation Concept Report State Route 1 03/23/06
between the closely spaced communities. This service provides transfers to the Central CoastArea Transit (inter-city service) at the Grover Beach Multi-Modal Center. With this feature, theSCAT system accommodates South County commuters to the San Luis Obispo area.
The Central Coast Area Transit (CCAT) system offers scheduled, fixed route, early morning-to-early evening inter-city service centered on San Luis Obispo. CCAT brings riders into the City,Cal Poly, and Cuesta College not only from South County communities and Santa Maria, butalso from cities along US 101 north of Cuesta Grade and from the coastal communities onRoute 1 as far north as San Simeon. The service between San Luis Obispo and Cuesta Collegeis one of the most productive in the County; frequently all seats are filled.
CCAT is an important service element for commuters and college students who mightotherwise travel on Route 1 by automobile. The CCAT service has been designed to facilitateinter-modal travel, with stops at park and ride facilities, multi-modal centers shared with urbantransit stops, and bike racks affixed to each bus. The Regional Transit Authority (RTA) whichoperates the SCAT and CCAT adjusts service frequency and vehicle size as needed to maintainefficiency. The inter-city service, when supported by land use planning and investments ininter-modal facilities, has the potential to accommodate an increasing share of trips on Route 1in the future.
Commercial bus carriers, notably Greyhound Bus Lines, also serve the City of San Luis ObispoCounty and destinations north and south. Greyhound recently revealed plans to discontinuestops at smaller communities in the county. The company’s major role is accommodatinginterregional rather than inter-city travel.
Non-motorized Transportation – The 1998 County Bikeways Plan and the 2005 RegionalTransportation Plan depict a system of bikeways providing access throughout major populationcenters as well as linkages among such centers and regional recreational destinations. Thesebikeways offer a viable alternative to intra-city and some inter-city automobile travel, especiallyin the more densely settled communities such as San Luis Obispo and the tourist-orientedSouth County area. Bicycle trips have minimal impacts on County commuter traffic except inthe City of San Luis Obispo, where nearly five per cent of commuter trips are by bicycle.
The bikeway system provides inter-modal access to park-and-ride facilities for inter-city transitor rail users. In support of this, SLOCOG is developing a comprehensive inter-linked bicyclesystem consisting of Class I and Class II bikeways within and between all communities. Thesystem will be supported with facilities such as bicycle lockers and security racks at all parkand ride lots, major bus stops and major distribution centers, and policies allowing bikes onbuses. All regional fixed-route transit vehicles have bike racks.
Route 1 is shown as a suggested route on the County’s Bike Map. The Pacific Coast BikeRoute follows much of the Route. The recent designation of San Luis Obispo County’s Route 1from San Luis Obispo north as an All American Road could attract even more recreationalcyclists to this already popular stretch of the highway. Much of the Route has Class II bikelanes.
Transportation Demand Management - Transportation demand management includes a rangeof techniques to address traffic congestion by decreasing single occupant vehicle traffic duringpeak hours. These methods include ridesharing promotion, ride matching, park and ride lots,
31

Transportation Concept Report State Route 1 03/23/06
flexible work hours, alternative work location, targeted pricing of parking or parkingmanagement (by area, vehicle occupancy, time of day or duration of stay).
Vanpools can be an effective travel option for the journey to work for major employers.Several vanpools that serve South County commuters have the effect of reducing trips on bothUS 101 and Route 1. Although demand and regional transportation policy support vanpools,funding has become a difficult issue.
Intelligent Transportation Systems (ITS) – In San Luis Obispo County Route 1 carriessignificant levels of urban and regional commuter traffic, and especially interregional touristtraffic. Intelligent Transportation Systems projects promise to aid travelers and improveroadway operations for all these users.
ITS projects have been implemented in the County and additional projects have a high priority.When the Central Coast ITS Strategic Plan is fully implemented, the following elements will beavailable on Route 1:
- Smart call boxes from City of San Luis Obispo to San Luis Obispo/Monterey County line- CCTV camera and CMS installation in Segment 9- Traffic surveillance stations (loop detectors ) through Segments 7, 8, and 9- Changeable message signs (CMS) and/or highway advisory radio (HAR) on US 101 in
San Luis Obispo and Paso Robles to warn of traffic incidents, slides, and road closuresalong Route 1
- Transit Management including vehicle tracking, schedule management fare collection,video surveillance and signal priority for transit
Land Use Planning - With the exceptions of the urban cores of the cities of Pismo Beach, SanLuis Obispo, and Morro Bay, much of the existing development along Route 1 in San LuisObispo County has occurred at low densities with separation of land uses for a largelyautomobile-dependent population. The Nipomo Mesa area southwest of the intersection ofRoute 1 and Willow Road provides an example of low-density development in theunincorporated area. Large-lot scattered rural development is difficult to serve with urbantransit and it is not conducive to walking or cycling to retail, office, job site, or schooldestinations. By contrast, unincorporated Cayucos and Cambria in the North Coast area wereestablished communities earlier in the 20th century. Later development has extended theoriginal patterns of these communities, albeit at lower densities.
Most communities in San Luis Obispo County have addressed the interrelationships amongvarious land uses and the transportation system to achieve more desirable outcomes. TheCounty and the cities along Route 1 have complementary policies aimed at preservingagricultural land, minimizing environmental impacts, and ensuring that new urban-typedevelopment takes place where urban services can be provided. The City of San Luis ObispoGeneral Plan includes goals specifically calling for the reduction in automobile use through landuse strategies and traffic demand management measures. The City of Pismo Beach GeneralPlan encourages clustered development and pedestrian scale commercial areas. This could beparticularly effective in the downtown area where Route 1 experiences traffic congestion. Aprimary goal of the San Luis Obispo Council of Governments is to support livable communityconcepts and efforts. A range of policies favoring less dependence on the automobile supportsthis goal.
32

Transportation Concept Report State Route 1 03/23/06
Areas lying within the California Coastal Zone are subject to additional policies that call fordefensible urban-rural boundaries, non-motorized transportation alternatives, increased coastalaccess, and protection of the visual qualities of communities’ character and rural setting.Morro Bay and Cambria are the largest urban areas within the county’s Coastal Zone, whichreaches farthest inland around Morro Bay and north of Cayucos to the San LuisObispo/Monterey County line.
Transportation Concept and Strategies
Historically, District 5 has targeted a peak hour LOS C or better on the state highways throughrural and urban communities and scenic corridors such as Route 1 in San Luis Obispo County.Given today’s challenging traffic conditions, existing development and environmental andfinancial constraints, LOS D or better will be a more realistic target for most segments.
Segment 5 - The transportation concept for Segment 5 is peak LOS D or better. A number ofactions can be taken to improve the operation of this rural highway where adjacent land use ischanging rapidly:
- Improve vertical and horizontal alignments.- Provide standard width travel lanes and shoulders and turnouts for slow-moving vehicles
to accommodate agricultural vehicles and bicycles in addition to passenger vehicles.- Provide channelization for turns.- Minimize and consolidate driveways.- Extend Willow Road to US 101 to accommodate traffic from development projects east
and north of Route 1.- Provide Class II bicycle facilities throughout.- Support transit-oriented development.- Conduct long-range planning for better circulation between Route 1 and US 101.- Continue to support TDMs and intermodal facilities to reduce demand.
Development has been proposed for several parcels in the unincorporated area near WillowRoad. In order to avoid impacting Route 1 (and US 101) with project traffic that could beaccommodated on extended or realigned local roads, a long-range plan for circulation in thisarea should be undertaken by local agencies and Caltrans and funded by project sponsors.
Segment 6 - The transportation concept for Segment 6 is peak LOS C/D or better. The facilityshould be widened to four lanes where possible.
Class II bicycle facilities throughout Segment 6 would provide a valuable amenity for touristsand local residents alike. Bicycling has potential as a substitute for driving on beach-orientedSegment 6. Roadside motor vehicle parking would be an issue in providing dedicated bicyclefacilities along the pavement.
Additional actions that will improve highway operations and conditions for non-motorized usersinclude:
- Provide standard width travel lanes and shoulders and turnouts for slow-moving vehiclesto accommodate use by agricultural vehicles and bicycles in addition to passengervehicles.
33

Transportation Concept Report State Route 1 03/23/06
- Provide channelization for turns.- Develop Class I multi-use trail in Oceano area for use by bicyclists, walkers, and
equestrians.- Minimize and consolidate driveways.- Address area flooding/drainage issues.- Consider locally sponsored CSS projects- Improve local circulation and parking in Pismo Beach to reduce congestion on Route 1.- Provide Class II bicycle facilities through segment.- Improve pedestrian access throughout the segment.- Plan for pedestrian-friendly/transit-friendly modifications including sidewalks, medians,
traffic calming, access to rail station and bus stops, and park and ride lots.- Enhance shuttle service for motels, restaurants, shopping, and beach area destinations.- Support planning for circulation in developing area along Segment 5 to minimize future
traffic impacts to Segment 6.- Continue to support TDMs and intermodal facilities to reduce demand.
Segment 7 - The transportation concept for Segment 7 is peak LOS C/D or better. Wideningthe facility to six lanes should be evaluated and improving the interchange with US 101pursued. Improved pedestrian access such as grade-separated crossings could contribute toimproved roadway operations. Other alignments, either a new Route 1 facility or a continuousand reliable route from south San Luis Obispo to Cuesta College over the local road system,have been considered in the past and should be revisited.
Recommended strategies for this segment include:
- Consider CMS or HAR for NB US 101 to advise of road conditions on Route 1.- Improve local circulation (e.g., bus pullouts).- Improve conditions for bicyclists and pedestrians at intersection with Foothill Boulevard.- Synchronize signals (e.g., optimize and synchronize with ITS to maintain traffic flow).- Consider locally sponsored CSS projects (e.g., landscaped medians).- Increase transit services to meet demand.- Improve pedestrian access.- Evaluate grade separation at Foothill Boulevard intersection.- Evaluate alternatives to achieve acceptable traffic flow on Route 1 between US 101 and
Cuesta College: widen Santa Rosa Street to six lanes; adopt/construct alternate alignmentfor regional and interregional traffic on Segments 7 and 8A; improve circulation for localand regional traffic on city and county roads).
- Continue to support TDMs and intermodal facilities to reduce demand.
Segment 8 - The transportation concept for Segment 8 is LOS C or better with at least a four-lane expressway throughout.
Recommendations for this segment include:
- Consolidate driveways where possible and minimize access points.- Convert conventional highway sections to expressway where possible.- Convert expressway to freeway where possible.- Evaluate potential for a grade-separated interchange at Education Drive.
34

Transportation Concept Report State Route 1 03/23/06
- Continue to search for opportunities to improve traffic flow on Route 1 between US 101and Cuesta College (e.g., alternative alignment for regional and interregional traffic onSegments 7 and 8A and/or improved circulation for local and regional traffic on the systemof city and county roads).
- Widen non-standard width bridges.- Continue to support TDMs and intermodal facilities to reduce demand.
Segment 9 - The transportation concept for Segment 9 is peak LOS C/D or better. Operationswill be improved as access is consolidated extending the freeway sections of sub-segments 9Aand 9B. Acquisition of coastal land along sub-segment 9C for public access and enjoyment willrequire additional planning for safe highway access with minimal impacts to highwayoperations.
A number of actions can be taken to improve the operation of this segment:
- Consolidate access to convert expressway sections to freeway as feasible through sub-segments 9A and 9B.
- Construct new interchange facilities to accommodate traffic at intersections SR 41 andMain Street.
- Continue to evaluate need for passing lanes in sub-segment 9C.- Install CMS to advise of delays ahead.- Support provision of Class I bicycle/pedestrian facilities from Morro Bay to Cayucos.- Provide pullouts, channelization, and/or passing lanes to improve traffic flow on sub-
segment 9C.- Support provision of safe non-motorized coastal access from east side of highway at south
end of Cayucos.- Consider actions in SLONC CEP.- Provide for safe access to coastal activities with signage, well marked highway exits, and a
system of frontage roads and connecting recreational trails where possible.- Widen non-standard width bridges.- Continue to support TDMs and intermodal facilities to reduce demand.
Segment 10 - The transportation concept for Segment 10 is peak LOS D or better. Newattractions along sub-segment 10B may require additional parking and new access points.Advance planning for safe highway access will also minimize impacts to highway operations.
A number of actions can be taken to maintain acceptable highway operations:
- Consolidate driveways where possible and minimize access points.- Improve opportunities for safe pedestrian access between west and east sides of the
highway in San Simeon and other points of interest.- Improve facility for use by bicyclists.- Widen non-standard shoulders.- Provide for safe access to coastal activities with signage, well marked highway exits, and a
system of frontage roads and connecting recreational trails where possible.- Improve vertical and horizontal alignments on sub-segment 10C.- Install CMS to advise of delays ahead.
35

Transportation Concept Report State Route 1 03/23/06
- Provide pullouts, channelization, and/or passing lanes to improve traffic flow.- Consider actions in SLONC CEP.- Support development of the California Coastal Trail.- Continue to support TDMs and intermodal facilities to reduce demand.
Segment 11 - The transportation concept for Segment 11 is peak LOS D or better. Althoughtopographic, geological, environmental, and other constraints exist along the Big Sur coast, thefollowing improvements should be made where feasible:
- Widen travel lanes and shoulders to 12 and four feet, respectively. (Four-foot shouldersare less than standard and would require a design exception.)
- Consolidate driveways where possible and minimize access points.- Turn-outs and pull-outs should be located to facilitate operations and travelers’ use and
enjoyment of the corridor.- Support development of the California Coastal Trail (CCT) with a focused process for public
participation, planning, programming, design, construction, and maintenance; developcriteria for integrating the trail into capital improvements; accommodate the trail in thehighway right-of-way as circumstances require.
- Continue to support TDMs and intermodal facilities to reduce demand.
Additional actions identified in the Coast Highway Management Plan for Segment 11 areincorporated by reference. These actions address topics including maintenance, slopestabilization, access, and aesthetics. Caltrans will also cooperate with SLOCOG in mattersrelated to implementation of the SLONC CEP.
Appendix B-2 includes maps, sub-segment data sheets, and summaries of the issues,concepts, and recommended improvements described above for Route 1 in San Luis ObispoCounty.
36

Transportation Concept Report State Route 1 03/23/06
MONTEREY COUNTY
Area and Population: Description and Trends
Monterey County is the only county in District 5 with major development centers along twomajor north-south State highway corridors. (See maps in Appendix B-3.) In Monterey County,as in Santa Barbara and San Luis Obispo Counties, the county seat and largest city, Salinas, islocated on US 101. Unlike Santa Barbara and San Luis Obispo Counties, the historic centerand County namesake, the City of Monterey lies to the west on Route 1.
Local features in Monterey County have created patterns of economic activity, land use, andcirculation that are recognized in county planning areas. Historically, population and economicactivity have been concentrated in two areas. The Monterey Peninsula along Route 1 includesseven of the county’s twelve cities. Tourism, recreation, and the arts largely support the citiesof Monterey, Pacific Grove, and Carmel-by-the-Sea in the latter area. The City of Del Rey Oaksis located on SR 218, less than a mile east of Route 1. Further growth in these cities isconstrained by jurisdictional boundaries, water supply, and other environmental factors. Tothe north, the cities of Seaside, Marina, and Sand City have undergone significant growth anddevelopment in response to the closure of the Fort Ord military facility and establishment of aCSU Monterey Bay campus on the site. Route 1 is the primary highway serving the MontereyPeninsula. Coastal agriculture is concentrated between the Salinas and Pajaro Rivers. Theunincorporated community of Castroville is located in this area.
Lying inland on US 101, Salinas is the hub of agricultural activity for the rich Salinas Valley.South of Salinas, the cities of King City, Greenfield, Soledad, and Gonzales are all located alongUS 101 in the central Salinas Valley. Historically, the economies of these cities were based inagriculture. In recent years, however, the shortage of affordable housing in Santa Clara Countyhas resulted in significant residential development here and in the unincorporated communityof Prunedale to the north. With the new residential growth and expansion of prison facilities inSoledad, communities along US 101 are being challenged in the areas of water quality, airquality, urban services, and conversion of ag land, as well as transportation.
No cities are located in the remaining areas and their current populations are small. All havepotential for significant future growth, with the exception of the Coast area on Route 1 southof the Monterey Peninsula. Rugged topography, limited access, large public holdings, andcoastal development policies limit growth along the Coast area south of the Carmel River. Acorridor management plan, the Big Sur Coast Highway Management Plan, focuses onmaintaining and preserving important qualities of the Route 1 corridor in the Coast area.
The Association of Monterey Bay Area Governments (AMBAG) projects that Monterey Countywill grow from a population of 433,600 in the year 2005 to 564,900 in 2025, an increase of 30percent. The cities along US 101 will see the highest rates of growth; collectively they will growsome 48 percent over the 20-year period. The county’s unincorporated area will grow amoderate 18 percent. On the coast, a major population shift has been underway the last twodecades and will continue into the future. The combined population of the four coastal citiesto the south (Carmel-by-the-Sea, Pacific Grove, Monterey, and Del Rey Oaks) is expected todecline slightly (4 percent by 2025), while the cities to the north (Seaside, Sand City, andMarina) together will grow by 21 percent. The conversion of Peninsula housing units fromprimary residences to second homes has accelerated in recent years, most notably in Carmel-by-the-Sea. Both Seaside and Marina will be larger than the City of Monterey within the next 5
37

Transportation Concept Report State Route 1 03/23/06
years. New projects such as University Villages for more than 1,200 new residences willaccommodate growth on the former Ft. Ord base, in this case in Marina. This growth patternwill have significant impacts on the central Monterey Bay sections of Route 1.
A high level of job commuting occurs between housing and employment centers of theMonterey Peninsula and Salinas areas. Examples include service workers employed in tourist-related jobs on the Monterey Peninsula (and South Coast as well), but residing in Salinaswhere housing costs have historically been lower, and workers traveling from homes on thePeninsula to jobs in Salinas. The county also houses increasing numbers of workers whocommute to job sites in Santa Clara County. While most of these commuters’ residences are inSalinas or other communities along US 101, the Monterey Peninsula housing market has alsobeen affected by this demand.
Growth in Monterey County itself, the San Joaquin Valley, and Bay Area and the growingpopulation of leisure-seeking retirees will result in increased tourist-related traffic in MontereyCounty over the next 20 years.
Goods movement is a vital industry in Monterey County where commercial trucking isrecognized as the most efficient way to move perishable agricultural commodities from field toprocessor and on towards out-of-area markets. Route 1 provides important circulation betweengrowing fields and processing centers in Marina, Castroville, and Pajaro in Monterey County,and Watsonville in Santa Cruz County. AMBAG’S 1995 Regional Freight Study identified threecritical problems shared by Monterey County’s agricultural community: (1) poor logistics,communications, and shipping practices; (2) lack of alternative service options; and (3)inadequate capacity on key segments of the truck transportation system. The 2005 MontereyCounty Regional Transportation Plan identifies the stretch of Route 1 between SR 183 andSalinas Road (the non-freeway portion of Segment 15), as one of those key stretches that areimpacted by the combination of a high percentage of truck traffic and poor levels of service.
Operating Conditions and Segment Summaries
Route 1 in Monterey County consists of four segments. Two of these, 12 and 13, comprise theBig Sur Coast Highway All American Road. This portion of the highway and the northernmostsegment in San Luis Obispo County were the focus of the Coast Highway Management Plan(CHMP).
Segments 14 and 15 trace the arc of the Monterey Bay from the Carmel River Bridge to theMonterey/Santa Cruz County line. Maps and details on each of the Monterey County segmentscan be found in Appendix B-3.
Segment 12 (P.M. 0.00/67.90) and Segment 13 (P.M. 67.90/72.30) – Segments 12 and 13follow the Big Sur coastline as a narrow two-lane highway winding and climbing along ledgescut into rock walls and bridges spanning canyons. In some areas, the highway passes throughcoastal terraces where small settlements with lodging facilities have been established.Travelers bound for recreational destinations or simply out to enjoy the coastal sceneryaccount for the majority of traffic on Segments 12 and 13. The highway is the lifeline forpermanent residents and businesses along the corridor. No state highway or significant localroads intersect this 72-mile long stretch of Route 1.
38

Transportation Concept Report State Route 1 03/23/06
As with Segment 11 in San Luis Obispo County, these Big Sur coast segments are subject toweather-related road damage and closure for landslides and rock falls. The tight curves andsteep grades that challenge drivers also challenge Caltrans as it strives to maintain thehighway in good repair. Conditions that result in traffic delays on the narrow highway includeslow-moving vehicles, disabled vehicles, congestion, fallen rocks or other obstructions on theroadway, and maintenance work.
In many locations travel lanes and paved shoulders are narrower than the currrent standard.The sheer rock walls and steep slopes along Segment 11 and the Monterey County segmentsthat lie within the CHMP area, make lane widening and accommodating the California CoastalTrail (CCT) more difficult than in other locations. It is likely that portions of the CCT willcoincide with the Route 1 right-of-way in Segments 12 and 13.
Traffic volumes increase from south to north through sub-segments 12A, B, and C andSegment 13. This reflects the greater numbers of round trips into the corridor from theMonterey Peninsula (as compared with trips originating in San Luis Obispo County), in additionto daily trips generated by permanent residences that are concentrated in the north portion ofthe corridor, along Segment 13. The lower volumes in the southern sub-segments do nottranslate into higher levels of service in these areas. While there are no passing lanes in eitherSegment 12 or Segment 13, the extreme grades and curves in sub-segment 12A most severelylimit sight distance and passing opportunities. Sub-segment 12B additionally includes thecommunity of Big Sur with a concentration of residences and retail, hospitality, and communityservices. Local traffic, visitors’ vehicles entering or leaving the traffic stream, and pedestriantraffic all affect the flow of traffic on Route 1 through the area.
In 2002, ADT was 2,900 on sub-segment 12A, which ends at the Castro Canyon Bridge and4,700 on sub-segment 12B, which continues to the entrance to Andrew Molera State Park atP.M. 51.20. For the year 2025, ADT is projected to rise to 3,400 in 12A and 6,300 in 12B.Both sub-segments operated at LOS C/E in 2002. Service on 12A would fall to LOS C/F, while12B would fall to LOS D/E at the projected volumes. Steep grades and tight curves result inpoor levels of service with relatively low traffic volumes.
Sub-segment 12C extends from Andrew Molera State Park to the Malpaso Creek Bridge at P.M.67.90. The 5,800 ADT in the year 2002 is projected to rise to 7,500 by 2025, with LOS fallingfrom C to D.
Segment 13 continues from the Malpaso Creek Bridge to the Carmel River Bridge, the end ofthe designated All American Road. Here the effects of short trips to and from the MontereyPeninsula are most evident. The 13,200 ADT in the year 2002 was four and one-half times thevalue for sub-segment 12A to the south. Traffic is projected to rise to 16,400 in 2025 with LOSfalling from D/F to E/F over the period.
Segment 14 (P.M. 72.30/90.98) - This segment begins at the Carmel River and extends to SR156. The Carmel River Bridge marks a break between the more leisurely traffic pace ofSegment 13 and the high-volume urban-type traffic flows beginning north of the River.Eighteen-mile-long Segment 14 is the spine of a complex local network of area roadways. Thehighway connects the Monterey Peninsula cities of Carmel, Pacific Grove, Monterey, Del ReyOaks, Sand City, Seaside, and Marina. Along its course, Segment 14 intersects with five state
39

Transportation Concept Report State Route 1 03/23/06
highways, more than any other route segment in District 5. Several major local roads alsoconnect with the segment.
The majority of Peninsula-bound tourists from Southern California, the Central Valley, and theBay Area take SR 68 or SR 156 from US 101 to Segment 14. Regional traffic bound for theCommunity Hospital of the Monterey Peninsula, coastal golf courses, Monterey PeninsulaCollege, California State University at Monterey Bay, and major shopping centers at Carmel,Seaside, and Sand City take access via Segment 14. Regional commuter traffic is also heavieston this segment. Peninsula residents travel to jobs in Salinas and north into Santa Cruz andSanta Clara Counties. Tourist industry employees travel to the Peninsula from communities tothe north and from Salinas and other communities along US 101.
Segment 14 has been divided into three sub-segments for analysis. Sub-segment 14A is a 2.8-mile long stretch of two-lane and four-lane conventional highway from the Carmel River to thejunction with SR 68 West. The sub-segment is lined with trees and heavy vegetation. Traffic iscontrolled by signals at four busy intersections: Rio and Carmel Valley Roads, Ocean Avenue,and Carpenter Street. Carmel residents take access to shopping centers east of the highwayvia Route 1. In addition, development along Carmel Valley Road (G16 on the County roadsystem) including the unincorporated community of Carmel Valley and several golf courses,generate significant traffic on Route 1. In 2002 sub-segment 14A carried 46,000 ADT; volumecould reach 63,000 by the year 2025. The facility currently operates at LOS F and wouldremain at that level in 2025.
Planning for a freeway bypass of sub-segment 14A through Hatton Canyon was halted in 1999and the reserved right-of-way subsequently transferred to the California Department of Parksand Recreation. With this decision, attention was focused on improving the existing highwaywith operational improvements including turn lanes and acceleration lanes. A northboundclimbing lane has been constructed between Carmel Valley Road and Morse Drive. Anextension of the lane from Rio Road to Carmel Valley Road is included in the 2005 MontereyCounty Regional Transportation Plan (RTP). The SR 1/SR 68 West interchange at the north endof the sub-segment currently operates poorly. Additional development in the unincorporatedarea to the west of Route 1 will exacerbate congestion and delay conditions and impede accessto the Community Hospital of the Monterey Peninsula from the interchange. A project tomodify the interchange is included in the TAMC’s 2005 RTP.
Sub-segment 14B, continues from SR 68 West to SR 68 East as a freeway with four to sixlanes. This sub-segment carries local traffic generated in Monterey and Pacific Grove,commuter traffic, tourist traffic, and other interregional traffic from US 101 and SR 156. Trafficvolume is higher here than in sub-segment 14A: 57,500 in 2002, projected to reach 72,500 by2025. The poor level of service will remain at F in the horizon year. Sub-segment 14Ccontinues north from where SR 68 East joins Route 1. Traffic volume is higher still on sub-segment 14C, a four- to six-lane freeway extending from SR 68 East to the interchange withSR 156. This sub-segment passes fast-growing coastal centers: Seaside, Sand City, Marina,and the former Fort Ord military base. The base is now partly redeveloped with California StateUniversity Monterey Bay, facilities of the University of California at Santa Cruz, and other uses.Daily traffic, which averaged 66,000 at LOS D in the year 2002, is projected to increase to91,500 by 2025. The level of service would fall from E/F to F.
40

Transportation Concept Report State Route 1 03/23/06
Traffic volumes and patterns on sub-segments 14B and 14C have changed significantly overthe past 20 years. In response to growing congestion and operational deficiencies during thisperiod, portions of these sub-segments have been the focus of special studies. Three suchstudies, AMBAG’s 1990 State Route 1 Corridor Study through Monterey and Seaside, SandCity’s 1998 Traffic Operation Study – Route 1 Corridor, and the 2004 Nexus Study for aRegional Development Impact Fee prepared for the Transportation Agency of Monterey County(TAMC), all identified improvements to address needs. TAMC’s 2005 RTP includes projects towiden the highway between Fremont Street and Del Monte Avenue, construct improvements atthe Fremont Street, Del Monte Avenue and Canyon Del Rey Boulevard interchanges, andconstruct a Monterey Road interchange between Fremont Street and Light Fighter Drive. Inaddition, the City of Marina proposes in conjunction with TAMC and Caltrans to studymodifications to the interchange at 12th Street to accommodate future demand.
Goods movement is an important consideration along the Monterey Bay. Route 1 fromSegment 14 through Segment 17 in Santa Cruz County is a designated High Emphasis Routeon the Interregional Road System. Congestion, outdated freeway ramps, and travelerinformation are particular issues for truckers using this corridor. Based upon the studiesidentified above and other analysis demonstrating need, TAMC has recommended locations forselective widening, operational improvements, and interchange construction and modificationthroughout Segment 14.
Segment 15 (P.M. 90.98/R102.03) – SR 156 originates at P.M. R90.98 on Route 1. More thanhalf the northbound traffic leaves the route to travel east on SR 156 towards US 101. Segment15 of Route 1 continues north as a two-lane expressway and conventional highway, passingMoss Landing and the mouth of Elkhorn Slough. The final 0.6 mile of Segment 15 is a four-lanefreeway extending to the Monterey County/Santa Cruz county line. A junction with SR 183 isreached approximately one mile north of the SR 156 junction. Traffic from SR 183 replenishesthe traffic flow on Route 1 with traffic from Castroville and Salinas.
This segment carries a combination of local, agricultural, tourist/recreational, and regionalcommuter traffic in both directions. As indicated above, the non-freeway portion of Segment15 is recognized as a key stretch in the truck transportation system that is impacted by thecombination of high truck usage and poor levels of service. Commuter traffic is growing aswell. An increasing number of residents of the Watsonville area in south Santa Cruz Countytravel the route to Monterey Peninsula job sites or classes at the CSU at Monterey Bay campus.Likewise residents of the Peninsula travel Route 1 to employment sites in Santa Cruz and SantaClara Counties.
The two-lane section of Route 1 includes a number of at-grade intersections. Increasingnumbers of vehicles waiting for opportunities to enter or exit Route 1 contribute to significantlydegraded facility operations. Speed and unsafe passing and turning have contributed tocollision rates above the state average. Measures have been implemented to improve safety:this stretch is a designated Safety Corridor with increased enforcement, daylight headlightzone, signing, striping, and raised profile thermoplastic in the centerline. Potential changes tothe intersection of Route 1 with SR 183 are being studied as part of the redevelopment effortfor the community of Castroville.
Linkages - State Routes 68 West, 68 East, 218, 183, and 156 West all connect with Route 1(south to north) in Monterey County.
41

Transportation Concept Report State Route 1 03/23/06
Alternatives to Reduce Demand or Improve Operations
While major improvements to the highway facility will be required to accommodate increasedtravel demand, alternatives to travel by private automobile must also play a big part inmanaging Route 1 in Monterey County. These include alternative modes of travel,transportation demand management, measures to control the flow of traffic, and new land usepatterns. Operational improvements including Intelligent Transportation Systems elements canimprove operations and optimize the use of highway capacity.
Passenger Rail – Passenger rail in Monterey County operates on Union Pacific tracks thatparallel US 101 from the San Luis Obispo/Monterey County line to Salinas. North of Salinas thetracks follow the SR 183 alignment to Pajaro Junction in Monterey County. The line then veerseast returning to the US 101 corridor near the San Benito/Santa Clara County line south ofGilroy. Amtrak’s Coast Starlight passenger service provides Salinas with daily inter-city service(both northbound and southbound). The Starlight Service is accessible to residents of theMonterey Peninsula area (Route 1 corridor) via Monterey-Salinas Transit (MST) which providesscheduled and on-call service to the Salinas Amtrak station. This or additional intercitypassenger rail service out of Salinas such as the Coast Daylight would have minimal impact ontravel demand on Route 1. Should the Union Pacific tracks be upgraded for higher speed railservice and with rail connections from the Peninsula to a mainline station in Pajaro or Gilroy,this intercity service could be an attractive alternative to travel on both Route 1 and US 101.
Commuters and interregional travelers from the Peninsula area have limited access to railservices at present. Amtrak provides bus service from the Monterey Peninsula and inlandareas to San Jose where connections to Oakland, Davis, and Sacramento are available via theCapitols lines. Commuters from Monterey County’s Peninsula can also take a bus to Gilroy forconnections to Caltrain service to Santa Clara, San Mateo, and San Francisco Counties. TAMCplans to extend the Caltrain rail service as far as Salinas. While the most direct benefits of thisextended Caltrain service would be as an alternative to travel on the US 101 corridor, plannedstations in Castroville and Watsonville could ease traffic on Route 1, especially if users canapproach these stations via the regional bus system.
TAMC is also pursuing ambitious plans to restore the intercity rail service between Montereyand San Francisco that was discontinued in 1971. This will entail purchase and refurbishmentof rail facilities between Seaside and Castroville. The service is intended as an alternative forbusiness and tourist travel between the Peninsula and the Bay Area. The extended line couldadditionally serve as a section of a rail line tracing the Monterey Bay crescent from thePeninsula to Santa Cruz with stops at a new Seaside/Marina station, the former Fort Ord Base,a new Castroville station, and other points of interest. Such service would have great potentialto entice drivers from reliance on Route 1 for regional trips.
Freight Rail - Union Pacific Railroad provides freight service through Monterey County over themain line connecting Los Angeles and the Bay Area. Pajaro is a center for food processing inMonterey County and the community has expressed interest in developing the Pajaro Stationas a rail center for freight in addition to passenger rail. Within the County a small amount oflocal freight -- principally food products and construction materials -- is still moved betweenPajaro and Watsonville Junction. Packers that once moved fresh and frozen vegetables out ofthe Salinas Valley by rail now use trucks almost exclusively. They do not foresee returning torail. Therefore, freight rail is unlikely to accommodate increasing demand for travel on Route 1.
42

Transportation Concept Report State Route 1 03/23/06
Urban and Inter-city Transit - Monterey-Salinas Transit (MST) provides the urban transitservice within and among the Cities of Monterey, Pacific Grove, and Carmel and other urbancommunities on the Greater Monterey Peninsula. MST also provides the inter-city service fortravel from the Peninsula east to Salinas and north to Watsonville in Santa Cruz County. InWatsonville, transit riders can transfer to Santa Cruz County’s Metropolitan Transit District foraccess to destinations in north Santa Cruz County.
MST service has been coordinated with rail service as well. MST will play an important role inthe return of inter-city train service between the Monterey Peninsula and the Bay Area. Prior tothe extension of rail service to Monterey, MST will carry passengers to a new rail station inCastroville.
MST also provides service on a seasonal basis between the Monterey Peninsula locations andBig Sur Coast destinations: Pt. Lobos State Park, Point Sur Light Station, Andrew Molera StatePark, Big Sur River Inn, Pfeiffer Big Sur State Park and Nepenthe. While ridership on this linehas never represented a significant portion of trips to the Big Sur Coast, the service allowstravelers such as students, the elderly, foreign travelers, and others without access toautomobiles to experience the All American Road. With two mid-day departures fromMonterey and operation limited to the months of June, July and August, the service is nottargeted for tourist industry employees. Upon request, southbound buses will stop near BixbyCreek Bridge for viewing/photographing the landmark.
As traffic has increased along Route 1, so has MST ridership. This service accommodates notonly the transit dependent, but also local and regional commuters for whom MST’s coverageand schedules offer an attractive alternative to solo driving. Of choice and necessity, transit willplay an important role in accommodating future demand and complementing new passengerrail services.
Greyhound Bus Lines offer scheduled inter-city service along the US 101 corridor, but not onRoute 1.
Non-motorized Transportation – The General Bikeways Plan for Monterey County includesgoals for enhancing the bicycle circulation system for both commuters and recreational riders.The Plan identifies commuter routes for bicyclists in the Greater Monterey Peninsula area. TheBig Sur Coast and the Monterey Peninsula are well known for recreational riding opportunitiesenjoyed by residents and tourists alike.
Bicycling to job sites in the Monterey Peninsula area or to educational centers on former FortOrd land will be an attractive alternative for some. A greater, but still small reduction in peakhour demand along Route 1 may be realized with cycling as a component of inter-modal tripswith transit or train travel. Avid and occasional recreational cyclists, locals as well as tourists,enjoy cycling on the scenic, relatively flat trails in the Monterey Bay area. To the extent thatcycling and walking are feasible for short trips and a continuous trail system is accessiblewithout an intervening automobile trip, highway travel can be reduced, but probably notsignificantly.
Several recreational trails exist or are in the planning stage in the vicinity of Monterey Bay. TheMonterey Peninsula Regional Parks District is the lead agency for a transportationenhancement project proposing to construct a bicycle/pedestrian trail through Hatton Canyon.
43

Transportation Concept Report State Route 1 03/23/06
This facility would roughly parallel to the east of sub-segment 14A of Route 1. The MontereyBay Recreational trail is a Class I facility that extends from Pacific Grove to north of Marina.Three other recreational trails of regional or greater significance are only partially complete inMonterey County pending negotiation and adoption of precise alignments; acquisition ofeasements; and construction and signing of the facilities. While the majority of the PacificCoast Bike Route follows Route 1, Caltrans has worked with local governments to locatesuitable alternatives for some stretches. The Pacific Coast Bike Route follows local roads inthree sections of Segment 15, including the section from Moss Landing to the Monterey/SantaCruz County line. Where feasible, highway projects should incorporate features to enhancebicycle mobility and address future needs for bicycle and pedestrian access.
The Monterey Bay Sanctuary Scenic Trail, a portion of the CCT, is envisioned as a multi-userecreational and interpretive pathway linking existing trail segments into a continuous coastaltrail around Monterey Bay. The existing segments run from Pt. Pinos in Pacific Grove to Marinaand from Aptos to Natural Bridges State Beach in Santa Cruz County, leaving a gap along partof sub-segment 14C and Segment 15 in Monterey County as well as Segment 16 and sub-segment 17A in Santa Cruz County. AMBAG is the lead agency in the completion of this trail.
Transportation Demand Management – In 1998, TAMC accepted the final report on its TripReduction Program, an effort that included outreach to employers and employees throughoutthe County. This outreach included information about alternative travel modes and TDM aswell as extensive data gathering regarding receptivity to various trip reduction alternatives.While employees were most responsive to economic incentives such as priced parking, free orsubsidized passes for express transit, and employer-sponsored vanpools, these were leastattractive to employers. Teleworking is not practical for workers in the tourist, retail sales, andagricultural industries that are large segments of the Peninsula economy. Some of theseworkers, however, do travel during off-peak hours. Flexible hours and telecommuting are morelikely to be offered at the out-of-area high-tech job sites to which a growing number ofMonterey County residents commute. TDM has almost no potential to relieve non-commute-related congestion arising from seasonal tourism or other interregional traffic.
TAMC and MST have proposed park and ride facilities in Segment 14 (Carmel and the Fort Ordreuse area). These facilities will support the use of transit and rail as well as car pools and vanpools. Caltrans will support locally-initiated TDM efforts by assisting with facilities such as parkand ride facilities and HOV lanes. However, more immediate traffic improvements may berealized through operational improvements, including traffic control measures (TCMs).
Intelligent Transportation Systems (ITS) – ITS will play a critical role in managing operationson State Route 1 in Monterey County. ITS projects have been implemented in the County andadditional projects have a high priority. When the Central Coast ITS Strategic Plan is fullyimplemented, the following elements will be available on Route 1 in Monterey County:
- Smart call boxes from San Luis Obispo/Monterey County line to Monterey/Santa CruzCounty line
- Traffic surveillance stations (loop detectors) through Segments 14 (freeway portion) and15
- CCTV camera installation and freeway control ramp metering between SR 68 West andReservation Road
44

Transportation Concept Report State Route 1 03/23/06
- Changeable message sign (CMS) and/or highway advisory radio (HAR) near junction withSR 68 West
- Road Weather Information System with environmental sensors and informationdissemination in Big Sur area
- Transit Management including vehicle tracking, schedule management fare collection,video surveillance and signal priority for transit for MST system
Land Use Planning - In recent years, significant development has occurred along MontereyCounty’s Route 1 corridor, especially in the coastal cities north of Monterey and the former FortOrd site. The populations of these areas are projected to increase more than 80 percentbetween the year 2000 and 2020. TAMC’s Regional Transportation Plan (RTP) recognizes thatthe expansion of undefined city edges in the form of large-scale automobile dependentsubdivisions and shopping malls have worsened traffic in the county. The RTP identifies anumber of planning principles that would result in a more transit and pedestrian friendly landuse pattern to complement TAMC’s efforts to improve transit, rail, and bicycling facilities. Localdecision-makers should also support the design of new recreational and visitor-orienteddevelopment that encourages visitor use of alternative modes of transportation.
Transportation Concept and Strategies
The current and ever-worsening levels of congestion along Route 1 from Carmel to centralSanta Cruz are fueled and sustained by regional and interregional economic growth andchanging demographics. Satisfactory resolution of these issues will require planning beyondthe scope of a single route TCR or subsequent corridor study. A comprehensive traffic analysisof the stressed network of state and local transportation facilities that carries traffic betweenUS 101 and Route 1 and along the Route 1 corridor should be conducted as a preliminary steptowards planning for regional transportation improvements.
In Monterey County, all of Route 1 north of the Carmel River will require widening and/oroperational improvements and reliance on alternative modes of transportation to achieve LOSD in the year 2025. Even with completion of the freeway system and addition of travel lanes innorthern Monterey County, future area growth will require bold supplemental measures tomaintain acceptable mobility. Only with investment in the multi-modal system in concert witheffective local land use planning is it likely that acceptable levels of service will be maintainedfor Segments 14 and 15 through the year 2025.
Segments 12 and 13 - In Segments 12 and 13, geology, topography, and a desire to maintainthe rustic setting are major considerations. With the exception of the growing, but stillrelatively small number of residents who commute travel north daily from Segment 13, muchof the traffic on these segments is recreational and somewhat discretionary. Traffic volumescould be self-regulated to some extent if the quality of the travel experience declines. Thetransportation concept for both segments is LOS D or better. The following improvementsshould be made where feasible:
- Widen travel lanes and shoulders to a uniform 12 and four feet, respectively. (Four-footshoulders are less than standard and would require a design exception.)
- Consolidate driveways where possible and minimize access points.- Locate turn-outs and pull-outs to facilitate operations and enhance travelers’ experience of
the corridor.
45

Transportation Concept Report State Route 1 03/23/06
- Provide ITS elements such as CMS and HAR to alert motorists of weather and roadconditions along the highway.
- Support development of the California Coastal Trail (CCT) with a focused process for publicparticipation, planning, programming, design, construction, and maintenance; developcriteria for integrating the trail into capital improvements; accommodate the trail in thehighway right-of-way as circumstances require.
- Encourage vanpools and transit extensions for Big Sur commuters.
Additional actions identified in the CHMP address maintenance, slope stabilization, aesthetics,and other environmental concerns.
Segment 14 – According to the 2005 Monterey County Regional Transportation Plan, most ofSegment 14 currently operates at LOS E or F during peak hours. Level of service will decline ineach sub-segment by the year 2025 as both volume-to-capacity ratios and vehicle hours ofdelay rise. In order to maintain or attain acceptable operations at LOS D for the significantlygreater demand projected for the year 2025, a combination of widening, operationalimprovements, and enhanced alternatives to travel by single occupant vehicles will berequired. ITS elements such as loop detection and ramp metering will be a major componentof operational improvements.
Recommended strategies for this segment include:
- Convert conventional highway sections to expressway where possible.- Convert expressway to freeway where possible.- Improve channelization for turning at intersections.- Add auxiliary lanes and improve freeway interchanges to improve operations.- Implement ITS components to improve operations.- Ensure that any interim improvements to the facility will accommodate the concept facility.- Support local land use decisions that will accommodate the concept and ultimate facility.- Develop continuous Class I multi-use trail system west of Route 1 to minimize conflicts and
need for highway travel to reach trailheads.- Enhance shuttle/transit service for motels, restaurants, shopping, and beach area
destinations.- Synchronize signals on sub-segment 14A to maintain traffic flow.- Install CMS to advise of delays ahead.- Provide for safe access to coastal activities with signage, well-marked highway exits, and a
system of frontage roads and connecting recreational trails where possible.- Reduce demand by implementing improvements to transit and passenger rail.- Minimize conflicts with highway operations in siting and developing public access to coastal
and recreational areas from Route 1.- Strive for advance agreements and early design of access and circulation for areas of
future coastal access.- Encourage local governments to provide frontage roads and parallel routes when
development occurs or other opportunities arise.- Continue to explore opportunities to develop passenger rail between the Monterey
Peninsula and Pajaro for commuter and intercity travel and, in a multi-agency, multi-jurisdictional context, opportunities to develop light rail, personal rapid transit system(PRT), ferry service, and other alternatives for environmentally sensitive travel amongactivity centers.
46

Transportation Concept Report State Route 1 03/23/06
Segment 15 – The transportation concept for Segment 15 is peak hour LOS D, or better. Inorder to achieve acceptable operations for the significantly greater demand projected for theyear 2025, a combination of widening to four lanes, operational improvements, and enhancedalternatives to travel by single occupant vehicles will be required. ITS elements will be a majorcomponent of operational improvements.
Recommended strategies for this segment in advance of widening include:
- Convert conventional highway sections to expressway where possible.- Minimize and consolidate driveways.- Provide standard width shoulders.- Provide pullouts, channelization, and/or passing lanes as interim improvements to improve
traffic flow.- Implement ITS components to improve operations.- Ensure that any interim improvements to the facility will accommodate the concept facility.- Support local land use decisions that will accommodate the concept facility.- Provide for safe access to coastal activities with signage, well marked highway exits, and a
system of frontage roads and connecting recreational trails where possible.- Plan for opportunities to enhance safe public access to coastal and recreational areas while
minimizing conflicts with highway operations.- Strive for advance agreements and early design of access and circulation for areas of
future coastal access.- Support continuous Class I multi-use trail system west of Route 1, where feasible, to
minimize conflicts and need for highway travel to reach trailheads.- Support enhanced shuttle/transit service for motels, restaurants, shopping, and beach area
destinations.- Support improvements to transit and passenger rail that will reduce demand for highway
travel.- Encourage local governments to provide frontage roads and parallel routes when
development occurs or other opportunities arise.- Support intermodal freight facilities at Pajaro Station.- Conduct a comprehensive traffic analysis of the stressed network of state and local
transportation facilities that carry traffic between US 101 and Route 1 and along Route 1 asa preliminary step towards planning for regional transportation improvements. (SeeAdditional considerations with respect to improving the Moss Landing corridor, below.)
Additional considerations with respect to widening Segment 15The two-lane Moss Landing corridor Segment 15 has been the focus of concern for anumber of decades. While the Monterey County Local Coastal Program is the standardof review for future widening, the California Coastal Commission has classified the MossLanding Corridor as a rural coastal facility. The California Coastal Act reflects legislativeintent that as a rural coastal facility this corridor will remain a scenic two-lane road. Thetwo-lane character is a classic part of the experience of travelling along the Big SurCoast (Segments 11, 12, and 13). However, the seven miles of two-lane conventionalhighway in Segment 15 differs from the Big Sur segments in several respects:
1. The Moss Landing two-lane segment carries heavy regional and interregional trafficbetween major urban centers: the Monterey Peninsula and the City of Santa Cruz.
2. The two-lane segment links four-lane freeway sections.
47

Transportation Concept Report State Route 1 03/23/06
3. Traffic on the two-lane section is fed at nearby intersections with four statehighways: SR 156 and SR 183 at the south end and SR 129 and SR 152 to thenorth.
4. Traffic from increasing development along several local roads enters the two-laneRoute 1 segment at at-grade intersections.
5. The facility operates a peak LOS F and has a collision history above the stateaverage for this type of facility.
6. The ever-increasing commuter traffic on the Moss Landing segment is steadilydiminishing the facility’s rural, scenic character.
Additional considerations with respect to improving the corridor without wideningPursuit of alternatives that would remove a major component of the non-recreationaltraffic from Segment 15 appear to be limited by cost, jurisdictional complexities,existing and planned development patterns, and a context of sensitive environmentalresources and productive agricultural lands. However, given a high priority, suchalternatives could be explored in a comprehensive traffic analysis and transportationimprovement study. Alternatives for improving regional transportation could includemeasures that would reduce urban-type and interregional traffic on Segment 15. Suchmeasures include a parallel highway facility to the east, realignment of east-west routesaway from the two-lane portion of Route 1, a light rail or personal rapid transit system(PRT) around the bay, and/or planned investment in the Caltrain system.
Potential alignments for any viable alternative to the current alignment through MossLanding are constrained by geography and the presence of environmental resources.The facility would:1. Lie east of the Elkhorn Slough to avoid environmental resources and minimize
impacts.2. Lie west of US 101 to minimize out of direction travel for Route 1 traffic between
the Monterey Peninsula and Santa Cruz and to avoid interactions with the Prunedalesection of that route.
Appendix B-3 includes maps, sub-segment data sheets, and summaries of the issues,concepts, and recommended improvements described above for Route 1 in Monterey County.
48
Transportation Concept Report State Route 1 03/23/06
SANTA CRUZ COUNTY
Area and Population: Description and Trends
Santa Cruz County is the northernmost county in District 5. (See maps in Appendix B-4.) TheCounty is by far the smallest in land area in the District, and the second smallest in the State.With a population of 259,000 in the year 2000, Santa Cruz County ranks third in the Districtand 37th in the State.
The urban population of Santa Cruz County is concentrated in three areas, two of which areaccessed from Route 1 and the third from SR 17. The City of Watsonville located on Route 1near the south end of the County, is the fastest-growing city. State Routes, 1, 152, and 129converge in Watsonville, which lies in the heart of a fertile agricultural area. To the northalong Route 1, the coastal area includes the communities of Rio Del Mar, Aptos, Soquel, andLive Oak and the Cities of Capitola and Santa Cruz. Santa Cruz is the county seat and home ofthe University of California, Santa Cruz (UCSC). The corridor from Watsonville to SR 17includes the most heavily traveled stretch of four-lane highway in all of District 5. Congestionon Route 1 south of SR 17 has been a major topic for civic discussion. State Routes 17 and 9both originate at Route 1 in Santa Cruz. SR 17 follows creek drainages and natural passesthrough the Santa Cruz Mountains to the community of Pasatiempo, the City of Scotts Valley,and on to Santa Clara County, site of the Silicon Valley phenomenon that has fueled much ofthe county’s growth in recent decades.
The communities of Paradise Park, Mt. Herman, Glen Harbor and Ben Lomond are locatedalong Route 9, which follows the San Lorenzo River northwest from Route 1. Route 1 itselfcontinues north to the Santa Cruz/San Mateo County line where it leaves District 5, passing thecommunity of Davenport on the way.
All locations along the Route 1 coastal corridor in Santa Cruz County enjoy a gentleMediterranean climate. However, the shelter afforded by the Monterey Bay and the network ofaccess routes to inland areas has favored the Bay area for both habitation and intense farming.The Spanish established a mission along the south-facing arc of the Bay in 1791 and thesettlements that later became the Cities of Santa Cruz and Capitola were founded soon after.The City of Watsonville is a historic agricultural center located just inland, near the mid-point ofthe coastal arc of the Bay. The city’s favorable location is attracting major developmentprojects. By contrast, the coastal lands north of Santa Cruz are more exposed to the elementsand more isolated. The small community of Davenport is the primary settlement along Route1 between Santa Cruz and the Santa Cruz/San Mateo County line. The coastal terraces alongthe northern portion of Santa Cruz Route 1 support agricultural crops. However, extensiveareas remain in chaparral.
Agriculture, tourism, education, and government are major sectors of the Santa Cruz Countyeconomy. A number of world-class marine research facilities are located in the county – afortunate result of the bayside location and proximity to top-rank institutions of higherlearning. The County has demonstrated a long history of support for conservation andenvironmental protection as evidenced by an early adoption of urban limit lines, publicacquisition of land for greenbelts, and high levels of transit and bicycle use. Some members ofthe community have expressed opposition to widening Route 1, as well, citing environmentaland community values.
49

Transportation Concept Report State Route 1 03/23/06
Santa Cruz County and its transportation system have been greatly affected by the economy ofSanta Clara County, where creation of technology-based jobs has long outstripped housingproduction. The Santa Cruz County Regional Transportation Commission (SCCRTC) estimatesthat more than 20,000 county residents commute to Silicon Valley job sites on a daily basis.Most of these commuters use Route 1 and SR 17. Recent area growth, in particular growth inthe commuter population has increased roadway congestion to unacceptable levels. Greatersupport now exists for widening Route 1 from Aptos to SR 17 in Santa Cruz.
According to census figures adjusted by the State’s Department of Finance (DOF), thepopulation of Santa Cruz County was 259,300 in mid-year 2000. The DOF projects a 10percent increase in population to 286,000 in the year 2020. Over the past decade, while thecounty’s population increased 11 percent overall, the cities of Watsonville and Scotts Valleyboth grew more than 30 percent, together accounting for more than 60 percent of the county’sgrowth.
Operating Conditions and Segment Summaries
Route 1 in Santa Cruz County consists of four segments. Two of these have been divided intosub-segments. Traffic conditions of each of the segments are described below. Maps, segmentsummaries, and additional data for the seven sub-segments can be found in Appendix B-4.
Segment 16 (P.M. R0.00/R7.66) – Segment 16 begins at the south end of the Pajaro RiverBridge and continues through the City of Watsonville to the interchange with Larkin ValleyRoad. This segment is a four- and five-lane freeway.
Two state highways originate from Segment 16. SR 129 leaves Route 1 less than a mile northof the Pajaro River (county line); SR 152 originates approximately two miles north of SR 129 inthe City of Watsonville. Both of these routes carry traffic between Route 1 and US 101. LarkinValley Road originates at Airport Boulevard in Watsonville and runs parallel and east of Route 1before joining it at the end of the segment. Segment 16 accommodates commuters bound forjob sites in Monterey, Santa Cruz, and Santa Clara Counties and beyond. This stretch is alsoused by tourists, area residents, and local and interregional goods movers.
In 2002 Segment 16 carried 46,000 ADT while operating at LOS C. Service level is expected tofall to LOS D by 2025 when an ADT of 56,000 is projected.
Segment 17 (P.M. R7.66/16.82) – Segment 17 extends from the Larkin Valley Roadinterchange to the SR1/17 interchange in the City of Santa Cruz. Traffic volumes rise steadilyfrom south to north through this heavily traveled segment. The components of traffic aresimilar to Segment 16, with a higher proportion of trips generated in the City of Santa Cruz.
Sub-segment 17A is a four-lane freeway ending at State Park Drive. In 2002 this sub-segmentcarried 77,000 operating at LOS E. Traffic is projected to rise to 83,000 and service to fall toLOS F by the year 2025. Initial studies of congestion on Segment 17 were focused on sub-segments 17B and C (State Park Drive to SR 17). After a Project Study Report initiated in theyear 2000 found that severe peak period congestion would result if lane widening terminatedat State Park Drive, sub-segment 17A was incorporated into the project area for a wideningproject.
50

Transportation Concept Report State Route 1 03/23/06
Sub-segment 17B extends from State Park Drive to Morrissey Boulevard. This four-lanefreeway carried 103,300 ADT at LOS F in 2002. Theoretically traffic could rise to 121,000 in2025 causing the facility to operate at a lower level of LOS F.
The highest traffic volume on Segment 17 occurs on sub-segment 17C where 2002 volumewas 109,400. Volume could rise to 137,000 in 2025. Level of service was “F” in 2002 andwould perform even more poorly in the year 2025. At present this sub-segment is a four-lanefreeway. Segment 17 ends at a complex interchange with SR 17 and Segment 18 of Route 1.One element of the interchange is a looped ramp called the “fishhook”, which carriesnorthbound traffic from Segment 17 on to Segment 18 at a lower grade. Topographic andenvironmental concerns and the high cost of reconfiguring this interchange for safety,improved operations, and additional capacity have challenged Caltrans and the community foryears.
Operational improvements including auxiliary lanes and ramp metering may be pursued as ameans to improve traffic flow on Segment 17 in advance of widening. Auxiliary lanes havebeen constructed between the Bay/Porter and 41st Avenue interchanges. A project to constructauxiliary lanes between the Soquel and Morrissey interchanges awaits full funding.
Segment 18 (P.M. 16.82/20.61) – Segment 18 extends from the SR 1/SR 17 interchange to thenorth urban limit of the City of Santa Cruz near the UCSC Marine Lab. Beyond the fishhookinterchange, sub-segment 18A continues as a four-lane freeway to the San Lorenzo RiverBridge, where it becomes a conventional highway. A complex, frequently congested, at-gradeintersection with SR 9 (north) and River Street (south) lies less than one-tenth mile from theend of the freeway; the Pacific Railway tracks cross the highway approximately one-tenth milebeyond the intersection. Sub-segment 18A ends at the intersection of Chestnut and MissionStreets, where Route 1 veers right along the Mission Street alignment. Sub-segment 18Acarries heavy traffic bound for the UC Santa Cruz campus, regional traffic, and local trafficbetween downtown Santa Cruz and residential areas to the west.
Sub-segment 18A carried 55,000 ADT in 2002, with volume expected to rise to 60,000 by theyear 2025. Level of service on sub-segment 18A is controlled by traffic flow through two majorsignalized intersections: SR 9 and Chestnut/Mission. A project study report (PSR) for a projectto reconstruct the SR 1/SR 9 intersection indicated the intersection operated below LOS C inthe late 1990s, with heavy congestion and back-ups on nearby streets already apparent. ThePSR stated that operations would deteriorate to LOS F under the do nothing alternative. Morerecent analyses provided by the City Of Santa Cruz indicates the intersection currently operatesat LOS D and confirms that LOS F will be reached with buildout of approved development infive to eight years.
Signalized Intersection 2004 2009-12Mission/Chestnut D F
Sub-segment 18B continues as a four-lane conventional highway from the Chestnut/MissionStreets intersection. The highway follows Mission Street to Swift Street near the western edgeof the City. At Swift Street, Mission Street leaves Route 1, which continues north as the Cabrillo
51

Transportation Concept Report State Route 1 03/23/06
Highway, a two-lane expressway. Sub-segment 18B continues another mile to the Santa Cruzurban limit at P.M. 20.61.
Sub-segment 18B is the main street through west Santa Cruz. It is lined with urban usesincluding numerous retail operations with individual driveway access to the state highway.Residential areas lie north and south of Route 1. Seven signalized intersections control flowalong the sub-segment. Three of the intersecting local roads, Highland/High Street, BayStreet, and Western Drive provide access to the UC campus. Traffic volume averaged 18,800operating at LOS E in 2002. Level of service will fall to F by 2025 when average volumes of26,000 are anticipated.
The City of Santa Cruz also provided analyses of current and anticipated operations of thesignalized intersections on sub-segment 18B. Three of the seven will operate below LOS Dwithin five to eight years.
Signalized Intersection 2004 2009-12Mission/King F EMission/Walnut B CMission/Laurel C EMission/Bay D FMission/Almar/Younglove B CMission/Swift B CRoute 1/Western B C
The City proposes to study the intersections of Mission Street (Route 1) with Chestnut Street insub-segment 18A and Bay Street in sub-segment 18B to evaluate potential improvements andtheir costs. The City’s Circulation Element referenced LOS standards of “F” for theMission/Chestnut intersection and “D” for Mission/Bay, calling for deficiency plans whenoperations reach LOS E or below. Such deficiency plans would prioritize alternativetransportation improvements and transportation system management measures, relying onroad widening/expansion as a last resort.
Segment 19 (P.M. 20.61/37.45) – This 17-mile long segment extends from the north limit ofthe City of Santa Cruz to the Santa Cruz/San Mateo County line, which is also the District’sboundary with District 4. Segment 19 is a two-lane facility with both expressway andconventional stretches. Mile-long passing lanes have been provided in both directions in thevicinity of P.M. 23 to 24. The Santa Cruz Branch rail line which runs parallel to Route 1 northfrom Pajaro terminates at a cement plant just inland from the community of Davenport,located at approximately P.M. 28 in Segment 19. While scattered agricultural fields and beachaccess areas are found along this segment, uncultivated open space predominates.
In 2002 average traffic volume on Segment 19 was 8,000 and the facility operated at LOS D.By the year 2025 ADT of 12,000 is anticipated, with LOS falling to E.
Linkages - State Routes 129, 152, 17 and 9 all connect with Route 1 (south to north) in SantaCruz County.
52

Transportation Concept Report State Route 1 03/23/06
Alternatives to Reduce Demand or Improve Operations
Passenger Rail - Passenger rail is not currently available along the Route 1 corridor in SantaCruz County. However, the Santa Cruz Branch line between the Watsonville junction in Pajaroand Davenport still accommodates freight service. Although specific plans to developpassenger rail service have not been developed, the Santa Cruz County RegionalTransportation Plan includes policies to preserve this and other railroad rights-of way for futurerail or transit use.
Prior to reestablishment of passenger rail service to Santa Cruz on the Union Pacific tracks,additional passenger services will be available at Pajaro Station, just inside Monterey County.First, will be the proposed Coast Daylight service; second, Caltrain service linking Salinas withSanta Clara County, and third, recreational service linking the Monterey Peninsula with SanFrancisco. Each of these services could benefit residents of Santa Cruz County. However,while Monterey County residents will be able to travel to Pajaro Station by train, Santa CruzCounty residents would travel out-of-direction by highway and surface streets for inter-modaltransfers at Pajaro. Anticipated reductions in highway trips would be greater on highways inMonterey County than for Route 1 in Santa Cruz County.
Proposals to develop a tourist train or trolley service on the existing tracks betweenWatsonville and Santa Cruz have not been fully evaluated.
Freight Rail – The Union Pacific Railroad hauls freight three times a week between Pajaro anda sand and gravel operation/cement plant in Davenport. This service is a valuable alternativeto moving this material by truck on the highway. On occasion freight is also moved by rail onthe Santa Cruz/Felton Branch rail line.
Pajaro does not currently have container intermodal facilities. The feasibility of potentialinvestments in goods movement at Pajaro will be studied in the future.
Urban and Inter-city Transit – The Santa Cruz County Metropolitan Transit (Metro) providesbus transit services throughout the County (north as far as Waddell Creek on Route 1) and“over the hill” on the Highway 17 Express Bus service into Santa Clara County.
The Highway 17 Express Bus is a critical element in accommodating and managing traveldemand on Route 1 as well as SR 17. Many trips that originate along the Route 1 corridor endat destinations in the San Francisco Bay Area. The Highway 17 Express is an alternative for thetrip leg into San Jose, allowing the entire trip to be accomplished using transit or transit/rail.The service is continually evaluated and enhanced with new services such as weekend service,services to the reverse commuter, route extension, and improved intermodal facilities. Therecent combination of the Highway 17 Express Bus and the Amtrak Connector Bus function hasresulted in overall efficiencies and added utility for the service.
At the transit center in Watsonville, connections are available for trips into Monterey County viaMonterey-Salinas Transit. Metro also contracts with Community Bridge’s Lift Line Program forpara-transit services to persons with physical limitations and operates the Summer BeachShuttle. The latter addresses parking and congestion issues in beach areas and nearby localstreets.
53

Transportation Concept Report State Route 1 03/23/06
Santa Cruz County residents have historically shown strong support for transit services. SantaCruz falls in the top quartile in a ranking of the nation's counties for local transit rides percapita. The County collects a half-cent sales tax for the exclusive benefit of transit. Commutertransit is supported by park and ride lots, some of which provide parking for bicycles as well asmotor vehicles. The widening of Route 1 in Santa Cruz presents an opportunity to considerincorporating multimodal freeway bus stops with access to park and ride lots and bicyclefacilities.
Efficient transit service is essential for mobility along the Route 1 corridor. Even with additionalcapacity on Route 1 in Santa Cruz County, expansion of Metro’s transit services must beassumed in planning for acceptable future levels of operation for the facility.
Non-motorized Transportation – Santa Cruz County has an extensive network of bike lanes andfacilities for the benefit of commuting workers and students as well as recreational cyclists. InSanta Cruz County, bicycling is a robust alternative to motorized travel. The entire Route 1corridor from the Monterey County/Santa Cruz County line and Watsonville to downtown SantaCruz can be traversed by bicycle via a continuous route consisting of Freedom Boulevard,Soquel Drive, Soquel Avenue, and Water Street. Both Bay Street and High Street providebicycle access from downtown to the University campus. At least one other longer and morecircuitous alternate route can be followed through the Watsonville-Santa Cruz corridor. Anetwork of bike paths and lanes provides opportunities for residents of Aptos, Capitola and theCity of Santa Cruz to negotiate this entire area by bicycle.
Bicycle routes cross Route 1 with most road crossings/interchanges along the Watsonville-Santa Cruz corridor. All highway projects that alter or widen these crossings are designed toaccommodate safe and efficient use by bicyclists. Additionally, the SCCRTC has pursuedgrants and subsidies to encourage installation of bicycle racks and lockers to facilitate inter-modal travel.
Transportation Demand Management – The local community has long recognized that demandmanagement is a critical element in the overall management of the County’s transportationsystem. Commute Solutions, under the direction of the Santa Cruz County RegionalTransportation Commission, Santa Cruz Area Transportation Management Association, andPajaro Valley Transportation Management Association, provides TDM programs and services inSanta Cruz County. The most common TDM strategies are carpooling and vanpooling, whichmatch or “pool” persons who travel to a common employment site or area. These ridesharingalternatives are cheaper than single-occupant vehicle (SOV) driving and faster and more directthan transit, with departure and arrival times often tailored to the pool of participants.Commute Solutions ridesharing signs are posted along Route 1 in Santa Cruz County.Commute Solutions supports other alternatives to solo driving including transit, bicycling,walking, and telecommuting.
Park and ride lots along Route 1 and SR 17 facilitate transit use and participation in carpoolsand vanpools. The Monterey Bay Unified Air Pollution Control District funds an Emergency RideHome program that serves as an incentive/insurance policy for participants in TDMalternatives.
54

Transportation Concept Report State Route 1 03/23/06
In Santa Cruz County, TDM will be an important adjunct to facility improvements such aswidening and traffic control measures. Caltrans supports regional TDM efforts by assisting withfacilities such as park and ride lots and HOV lanes.
Intelligent Transportation Systems (ITS) – Santa Cruz County, formerly part of heavilyurbanized District 4, has the longest experience with Intelligent Transportation Systems andmore ITS elements than any other county in District 5. District 4 installed ITS elements onRoute 1 and SR 17 in the 1990s to help manage the inter-county traffic flow. District 4continues to manage certain elements including closed circuit television cameras, changeableand extinguishable message signs, and highway advisory radio from its TransportationManagement Center (TMC). Continued management by District 4 is warranted by the highvolume traffic flows between Santa Cruz and Santa Clara Counties and the “24/7” operations ofthe District 4 TMC. District 5’s TMC currently operates 12 hours a day, weekdays only.
Additional ITS elements will be installed on Route 1 in Santa Cruz County and management willtransition to District 5 as comparable service can be provided and reliable and seamlesscoordination between the two TMCs assured. When the Central Coast ITS Strategic Plan is fullyimplemented, the following elements will be available on the route:
- System of smart call boxes along route from Monterey/Santa Cruz County line to SantaCruz/San Mateo County line
- Closed circuit television cameras at approximately one mile spacing from FreedomBoulevard ramps to the SR 1/SR 17 interchange
- Ramp metering with mainline loop detectors at ramps from Freedom Boulevard to the SR1/SR 17 interchange
- Surveillance station loops mid-way between ramp meter mainline loop detectors fromFreedom Boulevard to the SR 1/SR 17 interchange
- Permanent Changeable Message Signs on route and nearby local roads- Permanent Highway Advisory Radio at the SR 1/SR 17 interchange- Road Weather Information System with environmental sensors and information
dissemination- Transit Management including vehicle tracking, schedule management, fare collection, and
video surveillance
Freeway Service Patrol – A collision or disabled vehicle on Route 1 can quickly bring traffic to acrawl or a halt. While ITS can detect and convey information quickly, timely arrival of towtrucks to assist the CHP in clearing collisions and debris is another key element in managingtraffic on the highway. The SCCRTC-sponsored Freeway Service Patrol (FSP) provides freeservice to motorists on Route 1 between State Park Drive and SR 9 (Segments 17B, 17C, andpart of 18A) during morning and evening commute hours. The FSP has been found to be aneffective component in minimizing incident-related congestion and maintaining traffic flow onthe highway.
Land Use Planning – In Santa Cruz County unlike the three counties to the south, Route 1 isthe primary transportation facility and the only continuous north-south route. While mountainsand rivers make for difficult access to many parts of this small county, settlements linked byRoute 1 have flourished on the coastal shelf. The pattern of future development and infill thatoccurs between the mountain ridges and the ocean in Santa Cruz County will impact theoperation of this lifeline route.
55

Transportation Concept Report State Route 1 03/23/06
The Santa Cruz County General Plan and the Local Coastal Plan (LCP) policies reflect the valueof co-planning for land use and transportation to avoid the need for automobile trips,especially along the highway. Among the Transportation System Goals are the following:
- Limit the increase in auto usage to minimize adverse impacts.- Increase transit ridership, carpooling, vanpooling, walking and bicycling.- Integrate planning for transportation, land use, and air quality goals.- Manage parking supply to provide reasonably convenient parking for groups such as
shoppers and visitors who are most sensitive to the parking supply levels, whileencouraging alternatives to solo commuting and limiting impacts on neighborhoods.
- Coordinate transportation improvements in area plans with the General Plan, LCP, andregional transportation plans.
The City of Santa Cruz has traditionally recognized the linkages between transportation, landuse and neighborhood quality. Santa Cruz has demonstrated high levels of support for transitand bicycling. By contrast, the City of Watsonville is experiencing rapid growth. Traditionally anagricultural center for some of the state’s most valuable specialized crops, its strategic locationhas attracted significant new urban development in recent years. The convergence of threestate highways in Watsonville have made it a logical place to site housing for Silicon Valleyworkers. Watsonville residents have recognized the need for coordinated land use andtransportation planning. Both Santa Cruz and Watsonville are in the process of updating theirGeneral Plans.
Transportation Concept and Strategies
The current and ever-worsening levels of congestion along Route 1 from Carmel to centralSanta Cruz are fueled and sustained by regional and interregional economic growth andchanging demographics. Satisfactory resolution of these issues will require planning beyondthe scope of a single route TCR or subsequent corridor study. A comprehensive trafficanalysis of the stressed network of state and local transportation facilities that carries trafficbetween US 101 and Route 1 and along Route 1 should be conducted as a preliminary steptowards planning for regional transportation improvements.
To achieve LOS D on Route 1 Segments 16, 17, and 18 in the year 2025, added capacity,operational improvements, and investment in the multi-modal system in concert with effectivelocal land use planning will be required.
Segment 16 - The transportation concept for Segment 16 is LOS D. The facility should bewidened to six freeway lanes north of SR 129 in order to accommodate growth in theWatsonville area. South of SR 129, the concept remains a four-lane freeway. This provides atransition to the Moss Landing area in Monterey County (where Route 1 is currently developedas a two-lane conventional highway).
Recommended strategies for this segment include:
- Install selected additional ITS elements to improve operations.- Improve interchange with Harkins Slough Road- Ensure that any interim improvements to the facility will accommodate the concept facility.- Support local land use decisions that will accommodate the concept facility.
56

Transportation Concept Report State Route 1 03/23/06
- Continue to pursue efforts to increase transit use to reduce demand along the Watsonville-Santa Cruz corridor.
- Continue to support TDMs and intermodal facilities to reduce demand.- Continue to explore opportunities to develop passenger rail between Santa Cruz and
Pajaro and, with Monterey County transportation planners, opportunities to develop lightrail, PRT, ferry service, and other alternatives for environmentally sensitive travel amongactivity centers on the Monterey Bay.
- Continue to explore opportunities to site and develop park and ride lots along corridor.- Investigate feasibility of multi-modal freeway bus stops in conjunction with freeway
widening.
Segment 17 – The transportation concept for Segment 17 is six-lane freeway. As currentlyconceived, the future six-lane facility would include an HOV lane in each direction. Prior toconstruction of additional freeway lanes, operational improvements will improve the flow oftraffic along the Segment.
Transit, car-pooling, bicycling, and other measures to reduce the need to operate singleoccupant vehicles will continue to support the strategy for accommodating heavy trafficvolumes on Segment 17. Recommended strategies for this segment include:
- Improve operations with auxiliary lanes and merge lanes at the SR 1/SR 17 Interchange.- Ensure that any interim improvements to the facility will accommodate the concept facility.- Support local land use decisions that will accommodate the concept facility.- Install additional ITS components to improve operations.- Enhance shuttle/transit service for motels, restaurants, shopping, and beach area
destinations.- Encourage development and use of parallel routes on the local roads system.- Reduce demand by implementing improvements to transit and passenger rail.- Continue to explore opportunities to site and develop park and ride lots along corridor.- Continue to support TDMs and intermodal facilities to reduce demand.- Minimize conflicts with highway operations in siting and developing public access to coastal
and recreational areas from Route 1.- Strive for advance agreements and early design of access and circulation for areas of
future coastal access.- Continue to explore opportunities to develop passenger rail between Santa Cruz and
Pajaro and, with Monterey County transportation planners, opportunities to develop lightrail, PRT, ferry service, and other alternatives for environmentally sensitive travel amongactivity centers on the Monterey Bay.
- Investigate feasibility of multi-modal freeway bus stops in conjunction with freewaywidening.
- Support incident management program to increase safety, mobility, and reliability onRoute 1.
Segment 18 – The concept for Sub-segment 18A will remain 4-lane freeway and conventionalhighway. Operational improvements and improvements to benefit pedestrians should beimplemented for the four-lane portion of sub-segment 18B, after which widening to sixconventional lanes may warrant evaluation.
Recommended strategies for this segment include:
57

Transportation Concept Report State Route 1 03/23/06
- Install additional ITS components to improve operations.- Improve intersection with SR 9 in sub-segment 18A.- Evaluate intersection operations.- Improve pedestrian access.- Employ Context Sensitive Solutions processes to seek balance between local values,
safety, and highway performance.- Minimize and consolidate driveways.- Continue to explore opportunities to site and develop park and ride lots along corridor- Ensure that any interim improvements to the facility will accommodate the concept facility.- Support local land use decisions that will accommodate the concept facility.- Enhance shuttle/transit service for motels, restaurants, shopping, and beach area
destinations.- Continue to support TDMs and intermodal facilities to reduce demand.- Synchronize signals on sub-segment 18B to maintain traffic flow.- Improve local circulation to reduce congestion on Route 1.- Evaluate adding capacity to the four-lane portion of sub-segment 18B.- Support incident management program to increase safety, mobility, and reliability on
Route 1.
Segment 19 – North of Santa Cruz, Route 1 will remain a two-lane conventional highway.Standard lane and shoulder widths should be provided and operational improvements such asturnouts and channelization for turns should be incorporated as needed. New access pointsshould be minimized.
Recommended strategies for this segment include:
- Provide standard width travel lanes and shoulders.- Construct turnouts for slow-moving vehicles.- Provide channelization for turns.- Minimize and consolidate driveways.- Evaluate need for additional passing lanes for continuity with District 4.
ROUTE CONTINUITY
Beyond Segment 19, Route 1 continues as the coast highway into San Mateo County in District4. The TCR for Route 1 in District 4 provides for continuity with the District 5 facility. SegmentA in San Mateo County extends from the Santa Cruz/San Mateo County line to SR 84 (P.M.18.19) This segment will remain a two-lane conventional highway with passing lanes at sixlocations.
Appendix B-4 includes maps, sub-segment data sheets, and summaries of the issues, concepts,and recommended improvements described above for Route 1 in Santa Cruz County.
58

Transportation Concept Report State Route 1 03/23/06
PART THREE: FUTURE CONSIDERATIONS
The appropriate concepts for each segment of Route 1 were identified in Part Two, along withrecommended actions for achieving the 2025 concepts. Part Three addresses additional andfuture considerations including programming responsibilities, environmental factors, andlooking beyond the year 2025, concerns related to the Ultimate Transportation Corridor.
PROGRAMMING CONCEPT FACILITIES
Caltrans will take the lead in undertaking many of the actions to improve the highway includingcontext sensitive solutions, often in partnership with the RTPA. Under SB 45, the RTPAsprogram highway improvements in the urbanized areas while Caltrans is responsible for thenon-urbanized areas. Caltrans is also charged to plan and provide for interregional travel andgoods movement. Caltrans programs and participates in funding projects according to stateand regional priorities, type of project (e.g., capacity increasing or safety and operationsimprovements), location (e.g., metropolitan or rural area), and traffic characteristics (e.g.,local, regional, interregional).
Although not site specific, this TCR supports efforts to implement Transportation DemandManagement (TDM), enhanced transit, and intermodal facilities and services. While regionaland local agencies would have primary responsibility for actions such as these, Caltranssupports inclusion of related provisions in Regional Transportation Plans and other regional andlocal planning and programming documents to maximize the utility and enjoyment of Route 1.
Appendix C identifies major programmed and planned projects along Route 1 that would befunded through the State Transportation Improvement Program (STIP).
ENVIRONMENTAL FACTORS
The purpose of this section is to provide a broad overview of the major environmental issuesto be considered in planning for appropriate transportation facilities along the Route 1 corridorin Department District 5.
Scenic and Aesthetic Resources – The Route 1 corridor presents vistas of great contrast andbeauty. These include spectacular ocean views, stretches of unpopulated open areas, and vastlightly populated agricultural areas. Most of Route 1 in District 5 has been officially recognizedfor scenic beauty under the State Scenic Highway Program; nearly 130 miles of the route inSan Luis Obispo and Monterey Counties has been designated as an All American Road underthe federal Scenic Byways Program. Most of Route 1 also lies within the Coastal Zone wherestringent design criteria and permit requirements apply.
Visual character was a key factor in achieving All American Road designations for twocontiguous stretches of Route 1 in District 5. The Highway 1 San Luis Obispo North CoastCorridor Enhancement Plan includes an improvement plan identifying specific projects toenhance the visual character of the Route 1 corridor from the north end of San Luis Obispo tothe county line. The Coast Highway Management Plan includes Guidelines for CorridorAesthetics that will apply along the Big Sur Coast All American Road.
59

Transportation Concept Report State Route 1 03/23/06
Cultural Resources - The coastal areas through which Route 1 travels are considered verysensitive for archaeological and historical resources. Potential project-related impacts toarchaeological, cultural and historical resources must be evaluated in compliance with theCalifornia Environmental Quality Act (CEQA) and, if federal funds are involved, the NationalEnvironmental Policy Act (NEPA) for a project proposing changes to Route 1. Environmentalcompliance could require a complete assessment of cultural resources through a detailedcultural resources study, further investigation of known cultural sites, as well as redesign of theproject or mitigation of impacts.
Biological Resources - Potential project-related impacts to biological resources must beevaluated in accordance with CEQA and NEPA if a new project is to be undertaken in the Route1 corridor.
The Route 1 corridor in all four counties passes through developed urbanized areas, cultivatedagricultural areas, and natural open space including riparian areas. In San Luis Obispo,Monterey and Santa Cruz Counties, the corridor passes developed and undeveloped coastalareas as well.
Numerous special status plant or animal species identified in the California Natural DiversityData Base (CNDDB) may be found within 5,000 meters of the centerline of the Route 1 right-of-way in District 5. The CNDDB information does not represent all biological resource-relatedconstraints within a given corridor. For example, resources within flood plains and drainagesare protected by federal and state regulations. All drainages within the Coastal Zone areprotected as sensitive coastal resources by the California Coastal Act due to the presence ofwetlands and riparian habitat and associated species of concern.
A complete assessment of environmental constraints can only be determined through detailedenvironmental studies, and depending on its precise location, a new project on Route 1 in anyof the four counties may require consultation and/or permits from the Army Corps ofEngineers, Fish and Wildlife Service, National Marine Fisheries Service, Monterey Bay NationalMarine Sanctuary, Environmental Protection Agency, California Department of Fish and Game,California Regional Water Quality Control Board, California Coastal Commission and/or theCounty (or City) Planning Department.
Air Quality – Any new non-exempt project in the Route 1 corridor will be evaluated for airquality impacts according to regional attainment of air quality standards. The four Route 1counties in District 5 lie in two different air basins. Santa Barbara and San Luis Obispo Countiesare in the South Central Coast Air Basin (SCCAB). The Santa Barbara County Air PollutionControl District and the San Luis Obispo County Air Pollution Control District regulate air qualityin these two counties. Monterey and Santa Cruz Counties lie in the North Central Coast AirBasin (NCCAB) where the Monterey Bay Unified Air Pollution Control District has jurisdictionover air quality.
Currently, under the California Clean Air Act (CCAA), the NCCAB is designated a Moderate Non-Attainment area for ozone. Also under the CCAA, the NCCAB has been designated non-attainment for inhalable particulates (also known as particulate matter smaller than 10 micronsin diameter, or PM10). The NCCAB has been designated either unclassified or in attainment ofall other state and federal ambient air quality standards for criteria pollutants
60

Transportation Concept Report State Route 1 03/23/06
As of June 2005, under the federal CAA all of District 5 was reclassified to attainment of allfederal air quality standards.
Geological Constraints − Slope stability is a major issue along several segments of Route 1,especially Segment 1 south of Lompoc and Segments 11-13 along the Big Sur Coast. Thesesegments are in mountainous areas – the Santa Ynez Montains in Santa Barbara County andthe Coastal Range of the Santa Lucia Mountains in San Luis Obispo and Monterey Counties –where rockslides are not uncommon.
Along Segment 1, the toes of numerous landslides are in the stream bank of El Jaro Creek,which courses adjacent to the roadway. Winter rains provide an additional element of risk tothe roadway. When creek levels are high, the toes of landslides are eroded, freeing earth androcks to translate down slope and to encroach on the roadway.
Factors influencing slope stability along Segments 11-13 are described in detail in the CoastHighway Management Plan: Guidelines for landslide Management and Storm DamageResponse.
Water Quality − Route 1 in District 5 is located within the Central Coast Regional Water QualityControl Board’s (RWQCB) jurisdiction. The design and construction of road projects mustadhere to the requirements found in Caltrans’ National Pollutant Discharge Elimination System(NPDES) permit (Order No. 99-06-DWQ, No. CAS000003), Storm Water Management Plan(SWMP), Project Planning and Design Guide, Construction Site Best Management PracticesManual, and Standard Specifications.
Noise − Any proposal that will change either the horizontal or vertical alignment or increase thenumber of through traffic lanes on portions of Route 1 will require analysis of potential noiseimpacts. If it is determined through the noise analysis that significant impacts may result,mitigation measures may be required. Typical noise mitigation measures include earthenberms and sound walls. Sensitive receptors such as residences, schools and hospitals must bepresent for long-term, highway-related noise impacts to occur.
Hazardous Materials − A hazardous material is any substance, including waste, which mayresult in adverse effects to health, safety, and the environment. It is Caltrans policy tomanage a hazardous materials program to protect its activities, employees, the public, and theenvironment from the injurious effects of hazardous materials and waste. The planning phaseof any proposed project on Route 1 will include an assessment of the potential to encounterhazardous materials. If found, it is Caltrans policy to avoid or fully mitigate the impacts ofthese materials prior to construction.
ULTIMATE TRANSPORTATION CORRIDOR
The ultimate transportation corridor (UTC) is viewed as the maximum development of a statehighway corridor, including parallel facilities, beyond 2025, the 20-year planning horizon. TheUTC is used to identify potential widenings, realignments, future facilities, and rights-of-wayrequired to complete the development of each corridor. This information is critical for workingwith local and regional land use and transportation planning agencies to address right-of-waypreservation and dedication techniques. The determination of the UTC does not considerfunding as a constraint.
61

Transportation Concept Report State Route 1 03/23/06
Neither the 1986 Route Concept Report (RCR) for Route 1 in Santa Barbara, San Luis Obispo,and Monterey Counties, nor the 1987 RCR for Route 1 in Santa Cruz County (then in District4), identified a UTC for the route. Today, an ultimate concept can be proposed for manysegments. However, as the analysis in Part Two indicates, for several segments additionalstudies should be undertaken prior to specifying the ultimate facility type and alignment.
Long-standing local and California coastal policies specify that Route 1 will remain a rural two-lane facility between Cayucos in San Luis Obispo County and Carmel in Monterey County(Segments 9C-13), in northern Monterey County (Segment 15), and north of the City of SantaCruz in Santa Cruz County (Segment 19). In some of these segments, passing lanes andturnouts may be constructed to improve operations. In the following areas, additional studiesshould be undertaken to reach agreement regarding the appropriate facility type in the contextof a larger network of roadways:
1. SB Segment 2 – City of Lompoc2. SLO Segment 5 – Nipomo Mesa area3. SLO Segments 7 and 8 (US 101 to South Bay Boulevard in Morro Bay)4. MON Segments 14 and 15 (Carmel River to Monterey/Santa Cruz County line)5. SCr Segments 16 and 17 (Monterey/Santa Cruz County line to SR1/SR 17
interchange)6. SCr Sub-segment 18B (Mission Street in Santa Cruz)
Beyond the concept year, the rural coastal segments will remain two-lane facilities. Segmentsin the City of San Luis Obispo, along the Monterey Bay, and in the City of Santa Cruz will likelyrequire urban-type facilities of at least six lanes. Right-of-way should be reserved to developthe remaining segments of Route 1 as a four-lane facility. It is likely that between theinterchanges with SR 68 East and SR 156 (Sub-segment 14C), an eight-lane freeway will berequired beyond the 2025 concept year.
CONCLUSION
In preparing this report, Caltrans has used traffic forecasts to determine the future Levels ofService on Route 1. Based on these forecasts and a qualitative analysis of alternatives,Caltrans identified concept levels of service or recommended additional studies for eachhighway segment. The TCR also recommends actions for attaining or maintaining thoseacceptable levels. In several areas, corridor or area studies should be performed to determinethe appropriate level of development for the Route and adjacent routes as well as facilities foralternative modes that will complement use of the facility. Land use patterns and developmentadjacent to the state facility have a substantial impact on LOS. Most alternative transportationmodes and land use changes are in the hands of the local agencies to implement and monitor.District 5 will continue to work with regional and local agencies in planning and programmingtransportation projects to meet demand for safe and efficient travel along the Route 1 corridor.Additionally, in the interest of preserving the safety and operational integrity of the StateHighway, the District’s Development Review/California Environmental Quality Act (CEQA)program will continue to work with local agencies to identify and evaluate transportation issuesat an early stage of planning for new development.
62

Transportation Concept Report State Route 1 03/23/06
SOURCES CONSULTED
General
Caltrans Director’s Policy No. 22, Context Sensitive Solutions, November 2001.
“Interim County Population Projections,” Demographic Research Unit of the CaliforniaDepartment of Finance, June 2001.
1997 California State Highway Log, District 5, Caltrans, in cooperation with the USDepartment of Transportation, Federal Highway Administration, 1997.
2000-2001 California Statewide Household Travel Survey Final Report, Caltrans, June 2002.
2002 Traffic Volumes on California State Highways, Caltrans Traffic Operations Program,June 2003.
Mainstreets: Flexibility in Design and Operations, Caltrans, January 2005.
Planning the Future of Highway 1, Jones and Stokes, summary of May 29, 2003 GuadalupeCommunity Meeting.
Post Mile Book, Caltrans District 5, June 2000.
Route Concept Report for Route 1, Caltrans District 4, Fall 1987.
Route Concept Report, Route 1 in Santa Barbara, San Luis Obispo, and Monterey Counties,Caltrans District 5, 1986, rev. 1990.
Statewide Goods Movement ITS Action Plan, Caltrans, Division of New Technology andResearch, May 2002.
Status of Projects, Central Region, District 5, Caltrans, November 2004.
Santa Barbara County
2004 Metropolitan Transportation Plan, Santa Barbara County Association of Governments,January 2005.
2020 travel forecasts for Santa Barbara County provided by Santa Barbara CountyAssociation of Governments.
Draft Environmental Impact Report for Wye Specific Plan, Appendix H: Traffic Impact Study,Endo Engineering for City of Lompoc, June 2003
Regional Growth Forecast: 2000-2030, Santa Barbara County Association of Governments,March 2002.
63

Transportation Concept Report State Route 1 03/23/06
Regional Transportation Plan 2000-2020, Santa Barbara County Association of Governments,October 2001.
Greg Caresio, Vandenberg Air Force Base New Programs Office, telephone conversation.
(Also see Appendix D for community meetings)
San Luis Obispo County
2001 Regional Transportation Plan, San Luis Obispo Council of Governments.
2020 travel forecasts for San Luis Obispo County projected by Department of TransportationDistrict 5 in cooperation with San Luis Obispo Council of Governments.
Coast Highway Management Plan, Department of Transportation District 5, March 2004.
Highway 1– San Luis Obispo North Coast Byway Enhancement Plan, San Luis Obispo Councilof Governments, February 2002.
Vision 2025: 2005 Regional Transportation Plan for San Luis Obispo County, San Luis ObispoCouncil of Governments, February 2005.
(Also see Appendix D for community meetings)
Monterey County
2005 Monterey County Regional Transportation Plan, Transportation Agency for MontereyCounty, February 2002.
Coast Highway Management Plan, Department of Transportation District 5, March 2004.
(Also see Appendix D for community meetings)
Santa Cruz County
1994 General Plan and Local Coastal Program, Santa Cruz County, 1994.
2005 Santa Cruz County Regional Transportation Plan (Draft), Santa Cruz County RegionalTransportation Commission, February 2005.
Chris Schneiter, City of Santa Cruz public Works Department, telephone conversation,October 2005.
(Also see Appendix D for community meetings)
64

Transportation Concept Report State Route 1 03/23/06
APPENDIX A: Definitions, Acronyms, and Abbreviations

Transportation Concept Report State Route 1 03/23/06
Access Control The condition where the right of owners or occupants of abutting land or otherpersons to access a highway is fully or partially controlled by public authority.
ADA
Americans with Disabilities Act – Landmark 1990 civil rights legislationbarring discrimination against people with disabilities in all major areas of life. Asit relates to provision of transportation services, the ADA requires transportationproviders ensure nondiscriminatory, accessible service for disables individuals,and that public transportation providers operating fixed route bus serviceprovide paratransit service comparable to the fixed routes.
ADTAverage Daily Traffic – The average number of vehicles passing a specificpoint during a 24-hour period. Similarly, Average Annual Daily Traffic is AADT,where the average is further normalized by averaging an entire year’s trafficflows.
Air Basin An area or territory containing similar meteorological and geographic conditions.In California, the Air Resources Board (ARB) has established nine air basins.
ArterialHighway
A general term denoting a highway primarily used for through traffic usually ona continuous route.
AuxiliaryLane
The portion of the roadway for traffic weaving, truck climbing, speed change, orother purposes supplementary to through traffic movement.
Average TravelSpeed (ATS)
One of the performance measures used to estimate level-of-service (LOS) on ahighway. The facility length divided by the average travel time of all vehiclestraversing the facility, including all stopped delay times.
CEQACalifornia Environmental Quality Act (1970) - A law requiringgovernmental decision-makers be provided adequate information about thepotentially significant environmental impacts of proposed projects. CEQA alsomandates ways to avoid or significantly reduce damage to the environment.
Channelization
The separation or regulation of conflicting traffic movements into definite pathsof travel by the use of pavement markings, raised islands, or other suitablemeans to facilitate the safe and orderly movement of both vehicles andpedestrians.
Clear RecoveryZone
An area clear of fixed objects adjacent to the roadway established to provide arecovery zone for vehicles that have left the traveled roadway. Minimumdistances have been established. However, when an object (i.e., a tree) isdesired to be retained, guardrails or some other similar structure are used toprevent head-on collisions with those fixed objects.
Climbing Lane A lane added on an uphill grade for use by trucks, recreational vehicles andother heavy vehicles when their speeds are significantly reduced by the grade.
ConceptA strategy for future improvements that will reduce congestion, improve themobility of people and goods and/or maintain the existing level of service on aspecific route.
ConformityProcess to assess the compliance of any Federally funded or approvedtransportation plan, program, or project with air quality implementation plans.The conformity process is defined by the Clean Air Act.
ContinuousLeft-turn lane
A lane that simultaneously serves left turning vehicles traveling in oppositedirections.

Transportation Concept Report State Route 1 03/23/06
ConventionalHighway
A highway without access control, which may or not be divided by a median.Grade separations at intersections or access controls may be used when justifiedat spot locations.
CMP
Congestion Management Program – A comprehensive program designed toreduce auto-related congestion through roadway improvements, travel demandmanagement (TDM) and coordinated land-use planning among all localjurisdictions. This program is voluntary, but had been required of every countyin the state prior to the implementation of the CMS.
CMS
Congestion Management System – A system required of all TransportationManagement Areas (TMA). Often adopted as a part of the CMP, the CMS isprimarily composed of the principal arterials in the region.
- ALSO -Changeable Message Signs – Electronic signs that can change the message itdisplays and often used along highways to alert and redirect traffic when travelconditions demand or provide “Amber Alert” notifications.
CTC
California Transportation Commission – A body appointed by the governorresponsible for the State Transportation Improvement Program (STIP), thedevelopment of the Regional Transportation Plan Guidelines, and statewidetransportation policy.
CollectorSurface street providing access and traffic circulation within residential,commercial, and industrial areas to adjacent parcels of land.
CoupletA pair of parallel one-way roadways running in opposite directions. This offersthe potential for increasing capacity within tight city blocks where the existingroadway cannot be widened, and a parallel roadway exists that either canaccommodate additional traffic or can be modified to do so.
DesignException
Written record documenting the engineering decision(s) leading to an exceptionto a design standard. Exceptions are possible for both mandatory and advisorydesign standards.
DSMPDistrict System Management Plan – A document prepared by each Caltransdistrict. The DSMP identifies Caltrans priorities for highway system improvementand is used by both Caltrans and external agencies.
Design Speed A speed selected to establish specific minimum geometric (horizontal, vertical,site distance) design elements for a particular segment of road.
Easement A right to use or control the property of another for designated purposes.
EIR/EIS
Environmental Impact Report/Environmental Impact Statement – Ananalysis of the environmental impacts of proposed land development andtransportation projects. An EIR is prepared in response to State requirementsfound in CEQA. An EIS is conducted for federally funded or approved projectsper the National Environmental Policy Act (NEPA – 1969). The normal procedureis to circulate a “draft” document to the public and involved agencies forcomments.
ERMEmergency Response Management – A component of the ITS system, thesesystems enable the rapid deployment of emergency vehicles and personnel tothe scene of a collision.
Expressway An arterial highway with at least partial control of access, which may or may notbe divided or have grade separations at intersections.
FHWA Federal Highway Administration - An agency under the U.S. Department ofTransportation (US DOT) responsible for all federal highway programs.
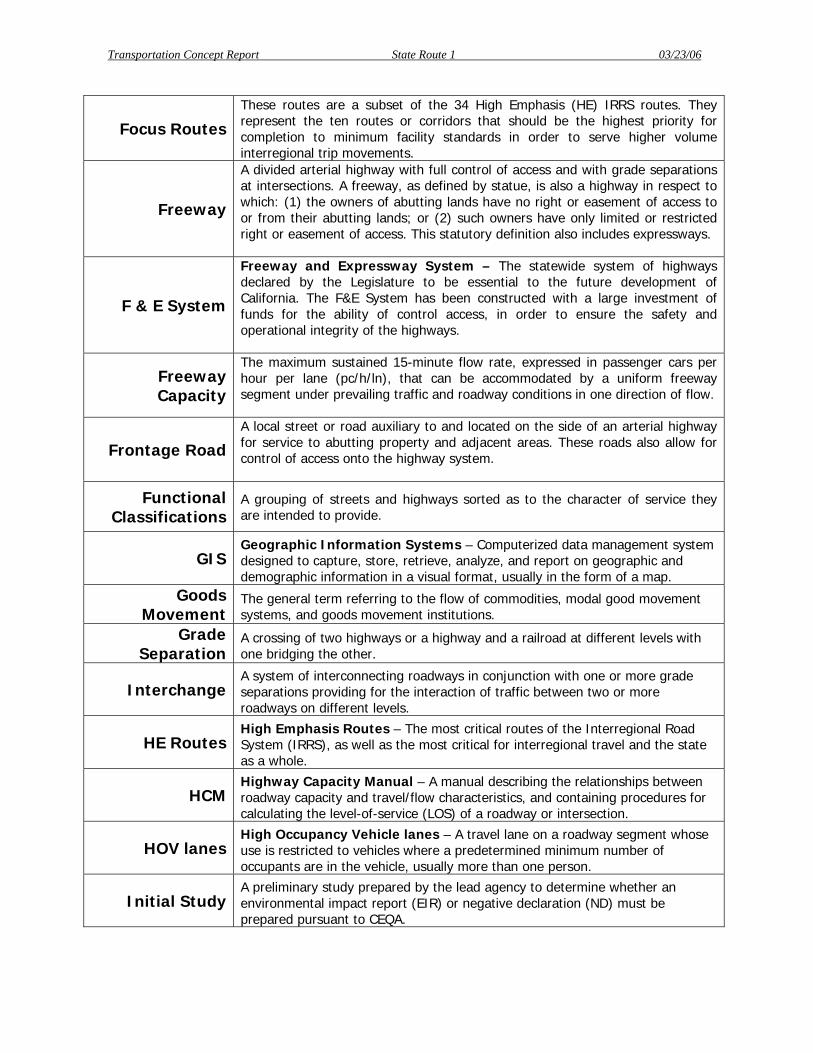
Transportation Concept Report State Route 1 03/23/06
Focus RoutesThese routes are a subset of the 34 High Emphasis (HE) IRRS routes. Theyrepresent the ten routes or corridors that should be the highest priority forcompletion to minimum facility standards in order to serve higher volumeinterregional trip movements.
Freeway
A divided arterial highway with full control of access and with grade separationsat intersections. A freeway, as defined by statue, is also a highway in respect towhich: (1) the owners of abutting lands have no right or easement of access toor from their abutting lands; or (2) such owners have only limited or restrictedright or easement of access. This statutory definition also includes expressways.
F & E System
Freeway and Expressway System – The statewide system of highwaysdeclared by the Legislature to be essential to the future development ofCalifornia. The F&E System has been constructed with a large investment offunds for the ability of control access, in order to ensure the safety andoperational integrity of the highways.
FreewayCapacity
The maximum sustained 15-minute flow rate, expressed in passenger cars perhour per lane (pc/h/ln), that can be accommodated by a uniform freewaysegment under prevailing traffic and roadway conditions in one direction of flow.
Frontage RoadA local street or road auxiliary to and located on the side of an arterial highwayfor service to abutting property and adjacent areas. These roads also allow forcontrol of access onto the highway system.
FunctionalClassifications
A grouping of streets and highways sorted as to the character of service theyare intended to provide.
GISGeographic Information Systems – Computerized data management systemdesigned to capture, store, retrieve, analyze, and report on geographic anddemographic information in a visual format, usually in the form of a map.
GoodsMovement
The general term referring to the flow of commodities, modal good movementsystems, and goods movement institutions.
GradeSeparation
A crossing of two highways or a highway and a railroad at different levels withone bridging the other.
InterchangeA system of interconnecting roadways in conjunction with one or more gradeseparations providing for the interaction of traffic between two or moreroadways on different levels.
HE RoutesHigh Emphasis Routes – The most critical routes of the Interregional RoadSystem (IRRS), as well as the most critical for interregional travel and the stateas a whole.
HCMHighway Capacity Manual – A manual describing the relationships betweenroadway capacity and travel/flow characteristics, and containing procedures forcalculating the level-of-service (LOS) of a roadway or intersection.
HOV lanesHigh Occupancy Vehicle lanes – A travel lane on a roadway segment whoseuse is restricted to vehicles where a predetermined minimum number ofoccupants are in the vehicle, usually more than one person.
Initial StudyA preliminary study prepared by the lead agency to determine whether anenvironmental impact report (EIR) or negative declaration (ND) must beprepared pursuant to CEQA.

Transportation Concept Report State Route 1 03/23/06
IRRSInterregional Road System – A series of interregional state highway routes,outside the urbanized areas, which provides access to, and links between, theState’s economic centers, major recreational centers, and urban and rural areas.
ISTEA
Intermodal Surface Transportation and Efficiency Act – Federaltransportation legislation signed into law in 1991 that substantially changed theway transportation funding decisions are made. The Act emphasized diversity,balance of modes, and the preservation of the existing system. It wassuperseded by TEA 21 in 1998 and SAFETEA–LU in 2005.
IntermodalTransportation
The process of applying a system approach to transportation in which goods andpeople are transported in a continuous and efficient manner between origin anddestination, using two or modes in the most efficient manner.
ITIP
Interregional Transportation Improvement Program – A programprepared biennially by Caltrans that includes interregional highway and intercityrail projects proposed for funding through the STIP. This program represents25% of the total STIP budget, with the other 75% in the RTIP. Sixty percent ofthe ITIP funds are programmed and expended for improvements to statehighways outside the boundaries of urbanized areas (populations greater than50,000) and for intercity rail projects. RTPAs/MPOs may propose projects forconsideration by Caltrans for inclusion in the ITIP.
ITSIntelligent Transportation System – This is a general term to describe arange of advanced electronic and information technologies that can be used toimprove the safety, operational efficiency, and productivity of the transportationsystem.
ITSP
Interregional Transportation Strategic Plan – A plan identifying six keyobjectives for implementing the Interregional Improvement Program (IIP) andstrategies and actions to focus improvements and investments. This documentalso addresses development of the IRRS and intercity rail in California, anddefines a strategy that extends beyond the current STIP.
InterstateHighway System
The system of highways that connects the principal metropolitan areas, cities,and industrial centers of the United States. The Interstate System also connectsthe US to internationally significant routes in Mexico and Canada.
LCPLocal Coastal Plan – A guide for the development of land within the coastalareas of California. The zoning ordinances of the jurisdictions within the regionimplement provision of the LCP.
LOS
Level of Service - Term used to describe the quality of operation of a highwayfacility. It is a qualitative measure of the effect of such factors as speed andtravel time, traffic interruptions, freedom to maneuver, driving comfort,convenience, safety and operation cost. In this report, LOS is based on peaktraffic hours. On urban street systems, the quality of flow is most frequentlycontrolled by traffic conditions at signalized intersections. The flowcharacteristics are defined in six levels of service.
LOS ADescribes a condition of free flow, with low volumes and high speeds. Trafficdensity is low, with speeds controlled by driver desires, speed limits, andphysical roadway conditions.
LOS BThis zone allows stable flow, with operating speeds beginning to be restrictedsomewhat by traffic conditions. Drivers still have reasonable freedom to selecttheir speed and lane of operation.
LOS CThis zone still allows stable flow, but the higher volumes more closely controlspeeds and maneuverability. Most of the drivers are somewhat restricted intheir freedom to select their own speed, change lanes, or pass.

Transportation Concept Report State Route 1 03/23/06
LOS DThis level approaches unstable flow, with tolerable operating speeds beingmaintained though considerably affected by changes in operating conditions.Fluctuations in volumes and temporary restrictions to flow may cause substantialdrops in operating speeds.
LOS EThis level cannot be described by speed alone, but represents operations ateven lower operating speeds than in level D, with volumes at or near thecapacity of the highway. Flow is unstable, and there may be stoppages for briefperiods of time.
LOS F
Describes forced flow operation at low speeds, where volumes are belowcapacity. These conditions usually result from vehicles backing up from arestriction downstream. Speeds are reduced substantially and stoppages mayoccur for short or long periods of time because of the downstream congestion.In the extreme, both speed and volume can drop to zero.
Median The portion of a divided highway separating the traveled ways for traffic inopposite directions.
MPO
Metropolitan Planning Organization – The organization designated by thegovernor as responsible for transportation planning and programming activities,as required under federal law, in an urbanized area. The MPO serves as theforum for cooperative decision making by a regional board made up of localelected officials and city and county staff. The MPO is responsible fordevelopment of the federal long-range transportation plan and multi-yearfunding programs, and the selection and approval of transportation projectsusing federal funds.
NAAQSNational Ambient Air Quality Standards – Standards set by the federal EPAfor the maximum levels of air pollutants that can exist in the outdoor air withoutunacceptable effects on human health or the public welfare.
NEPANational Environmental Policy Act (1969) – Federal legislation establishingthe requirements and procedures for documenting the environmental impacts offederally funded projects, including transportation improvements.
NHS
National Highway System – Required under Section 1006 for ISTEA, the NHSis a 155,000-mile system comprised of major highways serving interstate andinterregional travel, connecting major population centers, ports, airports, publictransportation facilities, major travel destinations, international border crossings,and major military installations.
NTN
National Truck Network – This network is comprised of the National Systemof Interstate and Defense Highways. Sometimes referred to as just NationalNetwork (NN). This network is part of the larger Surface TransportationAssistance Act (STAA) network that also includes Terminal Access (TA) andService Access (SA) routes.
Park and RideLots
Parking lots along highway corridors that allow for drivers to park their car/truckand ride with another individual or use a transit system, reducing the number ofvehicles on the road. Some lots may also offer bicycle lockers.
PlatoonA group of vehicles traveling together as a group, either voluntarily orinvoluntarily because of signal control, geometrics, lack of passing opportunitiesor other factors.
Programming The process of scheduling high-priority projects for development andimplementation.

Transportation Concept Report State Route 1 03/23/06
PID
Project Initiation Document – A document required for all projects before itcan be considered for funding or programming into the STIP or the SHOPP. ThePID may be any of a number of documents including a Project Study Report(PSR), Project Study Report/Project Development Support (PSR/PDS), ProjectScope and Summary Report (PSSR), or a Noise Barrier Scope and Summary(NBSSR).
PTSFPercent time spent following – A performance measure used to estimatelevel of service on a two-lane highway. It is the average percentage of the traveltime that vehicles must travel in platoons behind slower vehicles due to theinability to pass.
PublicParticipation
The active and meaningful involvement of the public in the development oftransportation plans and programs.
Ramp metering
A traffic management strategy that utilizes a system of traffic signals on freewayentrance and connector ramps to regulate the volume of traffic entering afreeway corridor. This is to maximize the efficiency of the freeway and therebyminimize the total delay in the transportation corridor.
Relinquishment A transfer of the State’s rights, title and interest in and to a highway, or portionthereof, to a city or county.
RTP
Regional Transportation Plan – the RTP is a long-range plan (20-yearhorizon) to improve a region’s state highways; local streets, roads and bikeways;airport and marine facilities; transit, paratransit, and passenger rail services. Asa guide for the development of these facilities, the RTP describes the prioritiesfor making investments in a region’s transportation system.
RTPARegional Transportation Planning Agency – The county level, or multi-county level, agency responsible under state law for the preparation of RTPs andallocation of funds. RTPAs can be local transportation commissions, Councils ofGovernments, MPOs, or statutorily created agencies.
Right-of-WayReal estate acquired for transportation purposes, which includes the facility itself(highway, fixed guideway, etc.) as well as associated uses (maintenancestructures, drainage systems, roadside landscaping, etc.).
Roadbed Those portions of the roadway extending from curb line to curb line or shoulderline to shoulder line. Divided highways are considered to have two roadbeds.
RoadwayCharacteristics
The geometric characteristics of the roadway segment under study, includingthe number and width of lanes, right-shoulder lateral clearance,interchange/intersection spacing, vertical alignment, and lane configurations.
RWISRoad Weather Information System – This ITS system collects pavementtemperature, visibility, wind speed and direction, and precipitation data andpresents the data in a usable format to transportation system operators, for thepublic.
Rural An area with a population under 5000.
Rural LocalRoadways that provide access to adjacent lands and provide service to travelover relatively short distances as compared to collectors or other highwaysystems.
Rural OtherPrincipal Arterial
All non-Interstate Principal Arterials which will serve corridor movements havingtrip length and travel density characteristics indicative of substantial statewide orinterstate travel. These roadways will also serve all urban areas of 50,000 andover population and a large majority of those with population of 25,000 andover. They should also provide an integrated network without stub connectionsexcept where unusual geographic or traffic flow conditions dictate otherwise.

Transportation Concept Report State Route 1 03/23/06
SAFE
Service Authority for Freeway Emergencies – State legislation (SB-1199),enacted in 1985, authorized the establishment of local SAFEs for the purposes ofinstalling, maintaining, and operating a network of motorist-aid call boxes. Theprogram is funded by a $1 per year fee on all registered motor vehicles withinthe county.
SAFETEA-LU
The Safe, Accountable, Flexible, Efficient Transportation Equity Act – ALegacy for Users – Federal legislation enacted in 2005. SAFETEA-LU authorizesthe Federal Surface Transportation Programs (FSTP) for highways, highwaysafety, and transit for the 5-year period from 2005-2009. This legislationsuperseded TEA-21, but maintains its basic structure and builds on its keyinitiatives.
Scenic CorridorA band of land that is visible from and generally adjacent to, but outside of, thehighway right-of-way having scenic, historical, or other aestheticscharacteristics.
Scenic Highway
An officially designated portion of the State Highway System traversing areas ofoutstanding scenic beauty and/or historic character. Designations include: AllAmerican Road, National Scenic Byway, U.S. Forest Service Byway, HistoricHighway and State Scenic Highway.
ScopingAn activity of the lead agency in the environmental process ensuring theinclusion of all significant issues and maximum participation for the developmentof the EIR/EIS.
Segment A portion of the highway identified for analysis that is homogenous in nature.
SB-45 (1997)
Senate Bill 45 of the 1997 California State Legislature – State legislationenacted in 1997 that substantially changed the process for allocating state andfederal transportation funds through the STIP. The major changes includeconsolidation of several prior STIP funding programs into two broad programs,increased programming flexibility, authority, and accountability for regionalagencies and full accounting of all project costs in the STIP. SB-45 initiallyshortened the STIP period from 7 to 4 years. However, a five-year program wasestablished with the 2002 STIP under Assembly Bill (AB) 2928.
ShoulderThe portion of the roadway contiguous with the traveled way for accommodatingstopped vehicles, for emergency use, and for lateral support of the roadbed baseand surface courses.
SHOPP
State Highway Operation and Protection Plan – A program of projectsadopted by Caltrans to preserve and protect the state highway system andprovides for its safe operation. SHOPP projects include traffic safety, pavementand bridge rehabilitation, seismic retrofit, earthquake and storm damage repairand traffic operational improvements. These projects are maintained on a four-year list that is updated every two years.
SIP
State Implementation Plan – A document prepared by each State, with inputfrom local Air Pollution Control Districts (APCDs) describing the existing airquality conditions and measures that will be taken to attain and maintainnational ambient air quality standards (NAAQS). In California, the California AirResources Board (CARB or ARB) prepares the SIP.
SRState Route – State highways within the State, other than Interstate and USroutes, which serve interstate and intrastate travel. These highways can befreeways, expressways or conventional highways depending on their accesscontrol.

Transportation Concept Report State Route 1 03/23/06
STAA NetworkSurface Transportation Assistance Act Network – This network wascreated by federal legislation in 1982 and is made up of the National Network(NN), Terminal Access (TA) and Service Access (SA) routes. This legislationrequires states to allow large trucks on these specific routes.
STIP
State Transportation Improvement Program – A statewide program oftransportation projects adopted biennially by the CTC that governs theexpenditure of state revenues for transportation. The STIP consists oftransportation projects proposed in the RTIPs and ITIP, and approved by theCTC.
STRAHNETStrategic Highway Network - a federal designation for the system ofhighways providing access to major U.S. military installations.
TA RouteTerminal Access Route – Portions of State routes and local roads that canaccommodate STAA trucks. TA routes allow STAA trucks to (1) travel betweenNTN routes, (2) reach a truck’s operating facility, or (3) reach a facility wherefreight originates, terminates, or is handled in the transportation process.
TASAS
Traffic Accident Surveillance and Analysis System – A system providing adetailed list or summary of collisions occurring on highways, ramps, orintersections in the State Highway System. Collision histories can be accessed bylocation, highway characteristics, collision data codes or any combination ofthese by State safety engineers for evaluation and recommendations.
TCMTransportation Control Measure – Any strategy to reduce vehicle trips,vehicle use, vehicle miles traveled, vehicle idling, or traffic congestion for thepurpose of reducing motor vehicle emissions.
TDMTransportation Demand Management – The implementation of measuresthat encourage people to change their mode of travel, travel during off-peakperiods, or not make the trip alone at all, e.g., ridesharing, telecommuting,pricing incentives and parking management.
TE
Transportation Enhancements – A program under ISTEA, TEA-21, andSAFETEA-LU, which sets aside a portion of Surface Transportation Program(STP) funds for several categories of projects whose purpose is to enhance thetransportation system. Enhancement funds can be used for bicycle andpedestrian facilities, landscaping and scenic highway programs, restoration ofhistoric rail stations, and various other purposes.
TEA-21
Transportation Equity Act for the 21st Century – Federal legislationenacted in 1998. TEA-21 authorizes the Federal Surface TransportationPrograms (FSTP) for highways, highway safety, and transit for the 6-year periodfrom 1998-2003. This legislation superseded ISTEA, but maintained its basicstructure and built on its key initiatives. TEA-21 has bee superceded bySAFETEA-LU.
TMC
Traffic Management Center – A building, or portion of a building, that servesas a focal point to monitor traffic and road conditions, as well as train and transitschedules, and airport and shipping advisories. From this point, informationabout collisions, road closures and emergency notifications is relayed to thepublic.
TransportationStakeholders
In transportation, stakeholders include FHWA, CTC, RTPA/MPO(s),transportation departments and commissions, cities and counties, NativeAmerican Tribal Governments, economic development and business interests,resource agencies, interest groups, the public, the Legislature, and theGovernor.

Transportation Concept Report State Route 1 03/23/06
TSDPTransportation System Development System – A TSDP identifies areasonable, comprehensive and effective range of transportation improvementson State highways. It is Caltrans statement of priorities for improvements afternegotiating and joint planning efforts with regional agencies.
TSM
Transportation System Management – TSM is (1) a process orientatedapproach to solving transportation problems considering both long and short-range implications, and (2) a services and operations process, in which lowcapital, environmentally-responsive, efficiency-maximizing improvements areimplemented on existing facilities.
TTAC
Technical Transportation Advisory Committee - A regional advisorycommittee that serves as a communication link between a RTPA/MPO and allother transportation agencies within a county or specified area. TTACs reviewand make policy recommendations on fiscal matters, fund allocations, specialstudies, and planning documents for submittal to the appropriate board(s). Thecommittee will usually consist of representatives from the cities, county, transitagencies, APCD, RTPA/MPO, and Caltrans.
Urbanized Area
One or more places and the adjacent densely settled surrounding area thattogether include at least 50,000 people. "Densely settled" means having apopulation density of 1000 persons per square mile (generally) based on censusblocks. Some small portions of an area not reaching the density threshold areincluded for spatial continuity
Urban Collector
The collector street system provides land access service and traffic circulationwithin residential neighborhoods, commercial and industrial areas. It differsfrom the arterial system in that facilities on the collector system may penetrateresidential neighborhoods, distributing trips from the arterials through the areato the ultimate destination. Conversely, the collector street also collects trafficfrom local streets in residential neighborhoods and channels it into the arterialsystem. In the central business district, and in other areas of like developmentand traffic density, the collector system may include the street grid, which formsa logical entity for traffic circulation.
Urban LocalComprised of all facilities not on one of the higher systems. It serves primarilyto provide direct access to abutting land and access to the higher order systems.It offers the lowest level of mobility and usually contains no bus routes. Serviceto through traffic movement usually is deliberately discouraged.
Urban MinorArterial
Interconnects with and augments the urban principal arterial system andprovides service to trips of moderate length at a somewhat lower level of travelmobility than principal arterials. This system also distributes travel togeographic areas smaller than those identified with the higher system. Theminor arterial street system includes all arterials not classified as a principal andcontains facilities that place more emphasis on land access than the highersystem, and offers a lower level of traffic mobility. Such facilities may carry localbus routes and provide intra-community continuity, but ideally should notpenetrate identifiable neighborhoods. This system should include urbanconnections to rural collector roads where such connections have not beenclassified as urban principal arterials.
Urban OtherPrincipal Arterial
This system consists of all non-Interstate principal arterials.
Urban PrincipalArterial – Other
Fwys/Expwys
Connecting links of non-Interstate rural principal arterials. Connecting links ofrural minor arterials.
US Route A network of highways of statewide and national importance. These highwayscan be freeways, expressways, or conventional highways.

Transportation Concept Report State Route 1 03/23/06
APPENDIX B: Maps and Segment Data


Transportation Concept Report State Route 1 03/23/06
APPENDIX B-1: Maps and Segment Data Santa Barbara County

!
! ! ! ! !
! ! ! ! ! ! ! ! ! ! ! !
! ! ! ! ! ! ! ! ! ! ! ! ! !
! ! ! ! ! ! ! ! ! ! ! ! ! ! ! ! ! ! ! ! ! ! ! ! ! ! ! ! ! !
! ! ! ! ! ! ! ! ! ! ! ! ! ! ! ! ! ! ! ! ! ! ! !
! ! ! ! ! ! ! ! !
! ! ! ! ! !
! ! ! ! ! ! ! ! ! ! !
! ! ! ! ! ! ! ! ! ! ! ! ! ! ! ! ! ! ! ! ! ! ! ! !
! ! ! ! ! ! ! ! ! ! ! ! ! ! ! ! ! ! ! ! ! ! ! ! ! ! ! ! ! ! ! ! ! ! !
! ! ! ! ! ! ! ! ! ! ! ! ! ! ! ! ! ! ! ! ! ! ! ! ! ! !
! ! ! ! ! ! ! ! ! ! ! ! ! ! ! ! ! ! ! ! ! ! !
! ! ! ! ! ! ! ! ! ! ! ! ! ! ! ! ! ! ! ! ! ! ! !
! ! ! ! ! ! ! ! ! ! ! ! ! ! ! ! ! ! ! !
! ! ! ! ! ! ! ! ! ! ! !
! ! ! ! ! ! ! ! ! ! ! !
! ! ! ! ! ! ! ! ! ! !
! ! ! ! ! ! ! ! ! ! ! !
! ! ! ! ! ! ! ! ! ! ! ! ! ! ! !
! ! ! ! ! ! ! ! ! ! ! ! ! ! ! !
! ! ! ! ! ! ! ! ! !
! ! ! ! ! !
! ! !
! !
! !
! !
! ! !
! ! !
! ! !
! ! !
! ! !
! !
! !
! ! !
! !
! !
! !
! ! !
! !
! ! !
! ! ! !
! ! ! ! ! !
! ! ! ! ! !
! ! ! ! !
! ! ! ! !
! ! ! ! !
! ! ! ! !
! ! ! !
! ! !
! ! !
! ! !
! ! !
! !
!
! ! ! !
! !
! ! !
! ! ! ! ! !
! ! ! ! ! !
! ! ! ! ! !
! ! ! ! ! !
! ! ! ! !
#*
#*
#*#*#*
Æm
Æm
Æm
Æm
Æm
Æm
%,%,
%,
%,
%,%,
#
Santa Barbara
SantaMaria
Lompoc
Guadalupe
#·
Carpinteria
#·Buellton
#
Goleta#·
#·Los Olivos
#·Solvang
#·
Orcutt
#·Vandenberg Village
#· Mission Hills
Santa Ynez Mountains
Sierra Madre Mountains
San Rafael Mountains
VandenbergAir Force
Base
#·
#·
#·
#·
Cuyama#·
#·New Cuyama
#*
|}154
|}166
tu101
|}1
|}135
|}246
tu101
|}146
|}33
Santa Barbara CountyDevelopment Centers
°0 10 205
Miles
CaltransDistrict 5SystemPlanning
Legend
! ! ! ! !
! ! ! ! !
! ! ! ! !
Coastal Zone #*State Route 1
Military Base
%, Rail Stops
#S Rest Stop
Park & Ride Lots
AirportsÆm
Rail

R O U T E 1 – S A N T A B A R B A R A C O U N T Y - S E G M E N T 1
S E G M E N T S P E C I F I C A T I O N SSegment Begin End Description
1 R0.00 19.25U.S. Route 101 to
SR 246
Segment Concept : LOS D/ 2-laneConventional Highway with Operational
Improvements
S E G M E N T F E A T U R E S
EnvironmentalConstraints:
Scenic and historic resources Special status species/habitat Geologic and seismic
Archaeological and cultural resources Topography Aesthetics
Multimodal Facilities: Clean Air Express Class III Bike Lanes Pacific Coast Bike Route
Land Uses alongCorridor :
Agriculture Open space
Major TrafficGenerators:
Lompoc Vandenberg Air Force Base Jalama Beach County Park
I D E N T I F I E D L E V E L S O F S E R V I C E – E X I S T I N G A N D F U T U R E :
Segment 1 is presently operating at peak LOS D and is projected to remain at LOS D to the year 2025.
R E C O M M E N D E D A C T I O N S :
Construct system-wide operational improvements: passing lanes, turn-outs and channelization for turningmovements, as appropriate.
Provide standard width shoulders for improved bicycling conditions. Stabilize cut slopes along roadway. Install CMS on US 101 and/or SR 246 to warn of lanes blockages on Segment 1. Encourage use of SR 246 as alternative route. Encourage car-pooling or vanpooling for journey to work on South Coast.

State Route 1Santa Barbara CountySegment 1PM R0.00/19.25
Æm
Æm
")!(
LOMPOC
Santa Rosa R d
Jalam
a Rd R0.00
19.25
|}1
|}246
|}1
tu101
0 1 2 3 4 5Miles
° Urban Area
Rail
Segment 1
AirportÆmPark & Ride Lot")Caltrans
District 5SystemPlanning
Signalized Intersection!(

Route 1 1
PM start PM end Length R0.00 19.25 19.25
2 to 4 11 to 14 ft.Rolling 100 to 200 ft.
1 4 to 8 ftClass III 0 to 60 ft.
2002 2025 2002 2025 2002 20257,500 14,300 0.37 0.48 D D
2.85% 60%900 7%
2002 2025 2002 2025
Segment Statewide*Total Collision Rate 0.58 0.85Fatality Collision Rate 0.014 0.030
0.28 0.41
Proposed Transportation Concept
Description
Number of LanesTerrain
Functional Classification:
Lane Width
Shoulder Width
Caltrans District 5 - Segment Data Sheet
Segment/(Sub-segment)Santa Barbara
County
Segment/sub-segment Location
V/C Ratio
Directional Split
Signalized Intersection
Analysis
US 101 to SR 246
Facility Type:
Existing Roadbed Information
Signalized Intersections
Rural Principal Arterial & Urban Principal Arterial
ROW Width
Route Designations
Interregional Road System
Terminal Access RouteNoYes
Median WidthBicycle Facilities
Expressway & Conventional HighwayTrucking Designations
Through-traffic flow Analysis
National Highway System
Peak Hour Volume (2002)
Operating Characteristics
ADT Ann. Growth (2002-2025)
NoFocus Route
Peak Hour Truck
LOS
Comments: Provide passing lanes, turn-outs, and channelization as appropriate; standard width shoulders throughout; use of CMS (on US 101, Segment 2, and/or SR 246) to warn of lane blockages on Segment 1.
3-year period evaluated
Rates are incidents per million vehicle miles from 10/01/00 to 9/30/03
Fatality & Injury Collision Rate
LOS D / 2-lane conventional highway and expressway
Proposed Concept*Average collision rates statewide for this type facility
Location
LOS D in 1997
Accident Data
State Route 246
ADT
LOSDelay Time (seconds)

R O U T E 1 – S A N T A B A R B A R A C O U N T Y - S E G M E N T 2
S E G M E N T S P E C I F I C A T I O N SSegment Begin End Description
2A 19.25 20.57 SR 246 toH St (Lompoc)
2B 20.57 R23.30 H St (Lompoc) toHarris Grade andPurisima Roads
Segment Concept : LOS C/D: Four-laneConventional Highway
S E G M E N T F E A T U R E S
EnvironmentalConstraints:
Historic resources Geologic and seismic
Multimodal Facilities: City of Lompoc Transit (COLT), Clean AirExpress, The Breeze
Lompoc Airport
Park and ride facilities Pacific Coast Bike Route
Land Uses alongCorridor :
Urban commercial, office, industrial
Major TrafficGenerators:
Downtown Lompoc Mission Plaza shopping center Regional destinations to the north and south
I D E N T I F I E D L E V E L S O F S E R V I C E – E X I S T I N G A N D F U T U R E : Segment 2 is presently operating at peak LOS B/D, according to location. Sections of Segment 2B would operate at
LOS C/F by the year 2015 according to a traffic study for a recently approved development at the intersection withHarris Grade and Purisima Roads. This intersection currently operates at LOS B, and would decline to LOS Daccording to that study.
R E C O M M E N D E D A C T I O N S :
Evaluate effects of Central Avenue Extension on segment traffic. Consider improving local circulation with parallel arterial couplets or other patterns to relieve traffic on Ocean and
H streets. Widen east bridge over Santa Ynez River for northbound operations for bicyclists. Improve circulation for bicycle travel through intersection with Harris Grade and Purisima Roads at north end of
segment. Context Sensitive Solutions for State Highway as “Main Street” in Lompoc.

State Route 1Santa Barbara CountySegment 2PM 19.25/R23.30
Æm
")
!(
!(
!(!(!(!(!(
!(
!(
!(
!(
!(!(
!(
!(
LOMPOC
19.25
R23.30
#2A
#2BW. Central Ave.
W. Ocean Ave.
Purisima Rd.
N.
H S
t.
7th
St.
College Ave. A S
t.
W. Pine Ave.
Barton Ave.
E. North Ave.
Harri
s G
rade
Rd.
|}1
|}1
|}1
|}246
0 0.5 1 1.5 2Miles
°Rail
Sub-Segment 2A - PM 19.25/20.57
CaltransDistrict 5SystemPlanning
Urban Area
Sub-Segment 2B - PM 20.57/R23.30
AirportÆmPark & Ride Lot")
Signalized Intersection!(

Route 1 2A
PM start PM end Length 19.25 20.57 1.32
4 11 to 12 ft.Flat 100 ft.
4 6 to 16 ft.Class III 0 to 14 ft.
2002 2025 2002 2025 2002 202516,500 25,700
1.95% 55%1,600 4%
2002 2025 2002 2025
Segment Statewide*Total Collision Rate 4.22 2.83Fatality Collision Rate 0.042 0.018
1.39 1.24
Proposed Transportation Concept
~ No Data ~~ No Data; nearing capacity ~
Comments: Evaluate effects of Central Avenue extension; consider designation of parallel arterials as directional couplets
3-year period evaluated
Rates are incidents per million vehicle miles from 10/01/00 to 9/30/03
Accident Data
LOS C / 4-lane conventional highway
*Average collision rates statewide for this type facility
Segment/sub-segment Location
Operating Characteristics
Route Designations
Existing Roadbed Information
No
Lane Width
7th, A, GH
Fatality & Injury Collision Rate
Signalized Intersection
Analysis
LocationLOSDelay Time (seconds)
Proposed Concept
Caltrans District 5 - Segment Data Sheet
Description
Number of lanes
Segment/(Sub-segment)
TerrainSignalized IntersectionsBicycle Facilities
State Route 246 to H Street Lompoc
ADT Ann. Growth (2002-2025)
Yes
ROW WidthShoulder WidthMedian Width
V/C Ratio
Urban Principal Arterial Functional Classification
LOS
Trucking DesignationsConventional Highway
Advisory: KPRA over 36 feet not advisedNo
Directional SplitPeak Hour Truck
Not Applicable
Santa Barbara County
ADT
National Highway System
Focus RouteInterregional Road System
Facility Type:
Through-traffic flow Analysis
Peak Hour Volume (2002)

Route 1 2B
PM start PM end Length
20.57 R23.30 2.73
4 10 to 12 ft.Flat 100 ft.10 2 to 8 ft.
Class III 0 to 14 ft.
2002 2025 2002 2025 2002 202518,100 26,100 B-D C-F
ADT Ann. Growth (2002-2025) 1.60% Directional Split 55%Peak Hour Volume (2002) 1,500 Peak Hour Truck 4%
2002 2025 2002 2025
B CD F
B D
Segment Statewide*Total Collision Rate 6.10 2.02Fatality Collision Rate 0.000 0.018
1.59 0.89
Proposed Transportation Concept
3-year period evaluated
Rates are incidents per million vehicle miles from 10/01/00 to 9/30/03
LOS C/D/ 4-lane conventional highway
*Average collision rates statewide for this type facility
Proposed Concept
Comments: Evaluate effects of Central Avenue extension; consider designation of directional couplets using parallel arterials; widen east bridge over Santa Ynez River and improve operations through intersection with Harris Grade and Purisima Roads for bicycle traffic.
Fatality & Injury Collision Rate
Segment/sub-segment Location
Route Designations
Existing Roadbed Information
No
Signalized Intersections
Lane Width
Urban Principal Arterial
Accident Data
LOSDelay Time (seconds)
CentralMission Plaza Center
Purisima/Harris Grade
~ no data ~
Caltrans District 5 - Segment Data Sheet
Description
Number of lanes
Segment/(Sub-segment)
Terrain
North H Street Lompoc to Harris Grade and Purisima Roads
Functional Classification
Santa Barbara County
ROW WidthShoulder WidthMedian Width
Conventional Highway
Bicycle Facilities
Facility Type:
LOS
Walnut, Chestnut, College, Pine, Barton, Lompoc Shopping Center
Signalized Intersection
Analysis
Location
North Ave.
~ no data ~
V/C Ratio
Focus Route
Through-traffic flow Analysis
ADT
National Highway System
Operating Characteristics
Trucking Designations
NoYes
Advisory: KPRA over 36 feet not advised. No trucks over 3 tons.
Interregional Road System

R O U T E 1 – S A N T A B A R B A R A C O U N T Y - S E G M E N T 3
S E G M E N T S P E C I F I C A T I O N SSegment Begin End Description
3A R23.30 M29.89
HarrisGrade/Purisima
Roads toVandenberg Road
3B M29.89 M36.19Vandenberg Roadto SR 135
3C M36.19 R34.78SR 135 to OrcuttExpressway
Segment Concept : LOS C: Four-laneConventional Highway
S E G M E N T F E A T U R E S
EnvironmentalConstraints:
Scenic and historic resources Special status species/habitat
Geologic and seismic Archaeological and cultural resources
Multimodal Facilities: City of Lompoc Transit (COLT), SMOOTH,Clean Air Express, The Breeze Pacific Coast Bike Route
Land Uses alongCorridor :
Educational Facility Limited residential in Sub-segment 3A Rural, open space, Public lands (Military base)
Major TrafficGenerators:
La Purisima Mission State Historic Park Allan Hancock College Vandenberg Village Mission Hills Vandenberg Air Force Base
I D E N T I F I E D L E V E L S O F S E R V I C E – E X I S T I N G A N D F U T U R E :
Segment 3 is presently operating at peak LOS A and is projected to remain at peak LOS A/B through year 2025.
R E C O M M E N D E D A C T I O N S :
Enhance COLT, Breeze, and Clean Air Express Service as needed. Limit access to highway.

State Route 1Santa Barbara CountySegment 3PM R23.30/R34.78
Æm
Æm
Æm
")
")") ")")
!(
!(!(
!(
SANTAMARIA
LOMPOC
VANDENBERG AIR FORCE BASE
PacificOcean
R23.30
R34.78
#3A
#3B
#3C
|}246
|}246
|}1
|}135
|}135
Hancock Dr.
Timber Ln.
Vandenberg Rd.
0 1 2 3 4 5Miles
°Park & Ride Lot")
Sub-Segment 3C - PM M36.19/R34.78
Sub-Segment 3A - PM R23.30/M29.89
Sub-Segment 3B - PM M29.89/M36.19
Military Base
Urban Area
AirportÆmRail
CaltransDistrict 5SystemPlanning Signalized Intersection!(
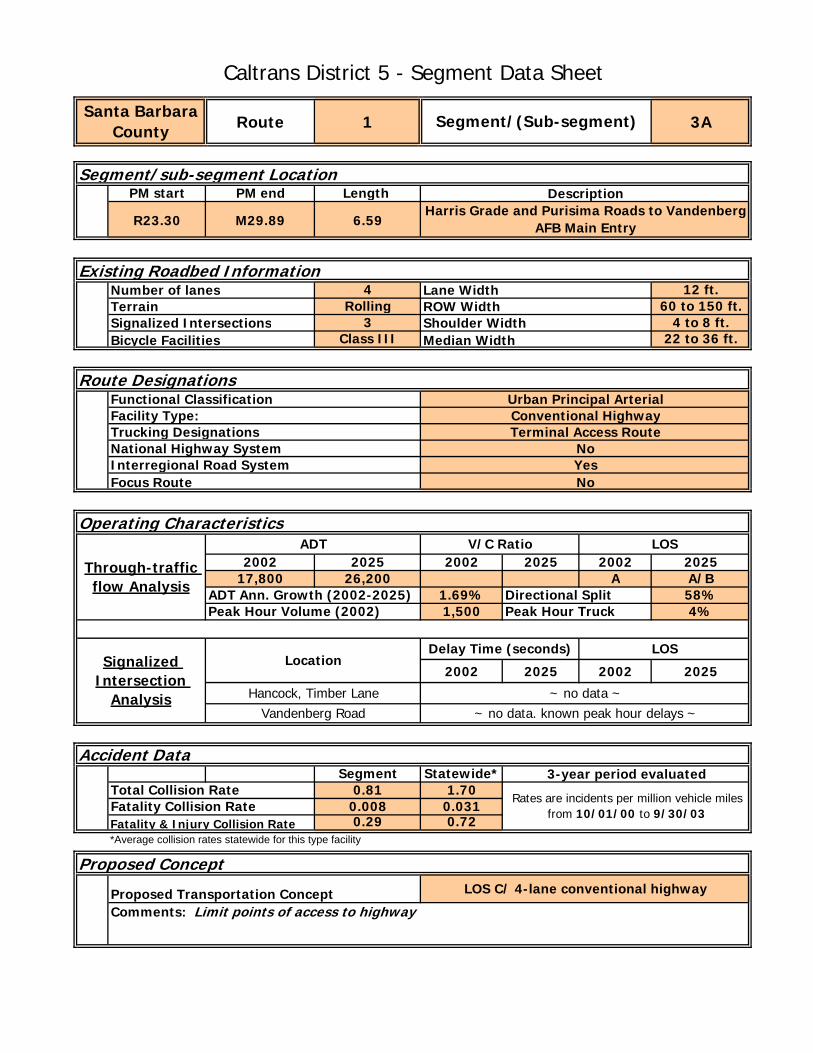
Route 1 3A
PM start PM end Length
R23.30 M29.89 6.59
4 12 ft.Rolling 60 to 150 ft.
3 4 to 8 ft.Class III 22 to 36 ft.
2002 2025 2002 2025 2002 202517,800 26,200 A A/B
ADT Ann. Growth (2002-2025) 1.69% Directional Split 58%Peak Hour Volume (2002) 1,500 Peak Hour Truck 4%
2002 2025 2002 2025
Segment Statewide*Total Collision Rate 0.81 1.70Fatality Collision Rate 0.008 0.031
0.29 0.72
Proposed Transportation Concept
Yes
Route Designations
Santa Barbara County
ADT
National Highway System
Focus RouteInterregional Road System
Facility Type:
ROW Width
Bicycle Facilities
Harris Grade and Purisima Roads to Vandenberg AFB Main Entry
LOS
Functional Classification
Through-traffic flow Analysis
V/C Ratio
Trucking Designations Terminal Access Route
Operating Characteristics
Segment/sub-segment Location
No
Lane Width
Urban Principal ArterialConventional Highway
Shoulder Width
Caltrans District 5 - Segment Data Sheet
Description
Number of lanes
Segment/(Sub-segment)
TerrainSignalized Intersections
Existing Roadbed Information
Median Width
No
Comments: Limit points of access to highway
Vandenberg Road
3-year period evaluated
Rates are incidents per million vehicle miles from 10/01/00 to 9/30/03
Accident Data
LOS C/ 4-lane conventional highway
Proposed Concept
Hancock, Timber Lane
Signalized Intersection
Analysis
LocationLOSDelay Time (seconds)
*Average collision rates statewide for this type facilityFatality & Injury Collision Rate
~ no data ~~ no data. known peak hour delays ~

Route 1 3B
PM start PM end Length M29.89 M36.19 6.30
4 12 ft.Rolling 150 ft.None 8 ft.
Class III 22 to 46 ft.
2002 2025 2002 2025 2002 202513,900 17,700 A A/B
ADT Ann. Growth (2002-2025) 1.05% Directional Split 55%Peak Hour Volume (2002) 1,500 Peak Hour Truck 3%
2002 2025 2002 2025
- - - -
Segment Statewide*Total Collision Rate 0.93 1.67Fatality Collision Rate 0.000 0.022
0.42 0.65
Proposed Transportation Concept
Lane Width
Comments: Limit access to highway
(none)
3-year period evaluated
Rates are incidents per million vehicle miles from 10/01/00 to 9/30/03
Accident Data
Proposed Concept
No
ROW WidthShoulder WidthMedian WidthBicycle Facilities
Urban Principal Arterial & Rural Principal Arterial
Segment/sub-segment Location
LOS C/ 4-lane conventional highway
Fatality & Injury Collision Rate
Signalized Intersection
Analysis
LocationLOS
Route Designations
Existing Roadbed Information
Delay Time (seconds)
*Average collision rates statewide for this type facility
Caltrans District 5 - Segment Data Sheet
Description
Number of lanes
Segment/(Sub-segment)
TerrainSignalized Intersections
Vandenberg AFB Main Entry to SR 135
Functional Classification
LOS
Trucking DesignationsConventional HighwayTerminal Access Route
Yes
V/C Ratio
Yes
Operating Characteristics
Santa Barbara County
ADT
National Highway System
Focus RouteInterregional Road System
Facility Type:
Through-traffic flow Analysis

Route 1 3C
PM start PM end Length M36.19 R34.78 3.34
4 12 ft.Rolling 150 ft.None 8 ft.
Class III 46-99 ft.
2002 2025 2002 2025 2002 202515,000 17,800 A A
ADT Ann. Growth (2002-2025) 74.00% Directional Split 55%Peak Hour Volume (2002) 1,500 Peak Hour Truck 2%
2002 2025 2002 2025
- - - -
Segment Statewide*Total Collision Rate 0.66 0.61Fatality Collision Rate 0.000 0.016
0.32 0.28
Proposed Transportation Concept
Through-traffic flow Analysis
Rural Principal ArterialFunctional Classification
LOS
Bicycle Facilities
Route Designations
Expressway
Santa Barbara County
ADT
National Highway System
Focus RouteInterregional Road System
Facility Type:
Operating Characteristics
Trucking Designations
Caltrans District 5 - Segment Data Sheet
Description
Number of lanes
Segment/(Sub-segment)
TerrainSignalized Intersections
Median Width
Segment/sub-segment Location
LOS C/ 4-lane expressway
SR 135 to Orcutt Expressway
LOSDelay Time (seconds)
Terminal Access RouteYesYes
V/C Ratio
*Average collision rates statewide for this type facility
Location
Existing Roadbed Information
No
Lane WidthROW WidthShoulder Width
Proposed Concept
Comments: Minimize access to highway
(none)
3-year period evaluated
Rates are incidents per million vehicle miles from 10/01/00 to 9/30/03
Accident Data
Fatality & Injury Collision Rate
Signalized Intersection
Analysis

R O U T E 1 – S A N T A B A R B A R A C O U N T Y - S E G M E N T 4
S E G M E N T S P E C I F I C A T I O N SSegment Begin End Description
4A R 34.78 49.20 Orcutt Expressway toSR 166
4B 49.20 50.61 SR 166 toSanta Barbara/SanLuis Obispo County
Line
Segment Concept : LOS C: Two- andFour-Lane Conventional Highway
S E G M E N T F E A T U R E S
EnvironmentalConstraints: Scenic and historic resources
Special status species/habitat Geologic and seismic
Archaeological and cultural resources Topography Aesthetics
Multimodal Facilities: SMOOTH, Clean Air Express, GuadalupeFlyer/Shuttle
Pacific Coast Bike Route Rail Station in Guadalupe
Land Uses alongCorridor :
Rural, open space, agriculture Urban (City of Guadalupe)
Major TrafficGenerators:
Community of Orcutt Agricultural operations City of Guadalupe
I D E N T I F I E D L E V E L S O F S E R V I C E – E X I S T I N G A N D F U T U R E :
Segment 4 is presently operating at peak LOS D and is projected to remain at peak LOS D through year 2025.
R E C O M M E N D E D A C T I O N S :
Widen lanes and shoulders to meet standards. Add passing lanes or turnouts to improve operations. Provide channelization for turns. Improve local circulation in Guadalupe. Provide elevated railroad crossing on SR 166 or a parallel alignment in Guadalupe for reliable access between Route
1 and Santa Maria Widen Santa Maria River Bridge north of Guadalupe.

State Route 1Santa Barbara CountySegment 4PM R34.78/50.61
Æm
")") ")")
SANTA MARIA
GUADALUPE
SLO CO.
SB CO.
R34.78
50.61
#4A
#4B
|}1
|}1
|}1
|}166
|}135
tu101
Brown Rd
Blac
k R
d
0 1 2 3 4 5Miles
° Sub-Segment 4B - PM 49.20/50.61
Sub-Segment 4A - PM R34.78/49.20
Park & Ride Lot")
Urban Area
AirportÆmRail
CaltransDistrict 5SystemPlanning

Route 1 4A
PM start PM end Length R34.78 49.20 14.42
2 to 4 11 to 12 ft.Flat 60 to 100 ft.
None 1 to 8 ft.Class III 0 to 99 ft.
2002 2025 2002 2025 2002 20253,200 3,800 C C
ADT Ann. Growth (2002-2025) 0.75% Directional Split 55%Peak Hour Volume (2002) 400 Peak Hour Truck 5%
2002 2025 2002 2025
- - - -
Segment Statewide*Total Collision Rate 1.19 1.11Fatality Collision Rate 0.094 0.041
0.56 0.53
Proposed Transportation Concept
Santa Barbara County
ADT
National Highway System
Focus RouteInterregional Road System
Facility Type:
ROW Width
Segment/sub-segment Location
V/C Ratio
Trucking Designations CA Legal 40' KPRANoYes
Operating Characteristics
Caltrans District 5 - Segment Data Sheet
Description
Number of lanes
Segment/(Sub-segment)
TerrainSignalized IntersectionsBicycle Facilities
Orcutt Expressway to SR 166
Existing Roadbed Information
No
Fatality & Injury Collision Rate
Signalized Intersection
Analysis
Location
Shoulder WidthMedian Width
Urban Minor Arterial & Rural Minor ArterialExpressway and Conventional Highway
Accident Data
Route Designations
LOSDelay Time (seconds)
Through-traffic flow Analysis
LOS
Functional Classification
LOS C / 4-lane conventional highway
*Average collision rates statewide for this type facility
Lane Width
Proposed Concept
Comments: Widen non-standard travel lanes and shoulders; provide passing lanes or turn-outs; provide acceleration and deceleration lanes at intersecting roads
(none)
3-year period evaluated
Rates are incidents per million vehicle miles from 10/01/00 to 9/30/03

Route 1 4B
PM start PM end Length
49.20 50.61 1.41
2 to 4 12 ft.Flat 100 ft.
None 2 to 9 ft.Class II/III 0 ft.
2002 2025 2002 2025 2002 20255,000 6,000 A A
ADT Ann. Growth (2002-2025) 0.80% Directional Split 55%Peak Hour Volume (2002) 500 Peak Hour Truck 4%
2002 2025 2002 2025
- - - -
Segment Statewide*Total Collision Rate 1.52 2.87Fatality Collision Rate 0.000 0.032
0.13 1.27
Proposed Transportation Concept
Rural Minor Arterial and Urban Principal Arterial Conventional Highway
ROW WidthShoulder Width
Functional ClassificationRoute Designations
Facility Type:
Interregional Road SystemNo
Proposed Concept
(none)
3-year period evaluated
Rates are incidents per million vehicle miles from 10/01/00 to 9/30/03
Accident Data
*Average collision rates statewide for this type facility
V/C Ratio
Through-traffic flow Analysis
CA Legal 40' KPRANoYes
LOS
Trucking Designations
Operating Characteristics
National Highway System
Focus Route
LOS C /2 and 4-lane conventional highway
Fatality & Injury Collision Rate
Signalized Intersection
Analysis
Location
Comments: Improve local circulation; provide standard width shoulders; widen Santa Maria River bridge at Guadalupe.
LOSDelay Time (seconds)
Signalized IntersectionsBicycle Facilities
Segment/sub-segment Location
Existing Roadbed Information
SR 166 to Santa Barbara/San Luis Obispo County Line
Lane Width
Median Width
ADT
Caltrans District 5 - Segment Data Sheet
Description
Number of lanes
Segment/(Sub-segment)
Terrain
Santa Barbara County

Transportation Concept Report State Route 1 03/23/06
APPENDIX B-2: Maps and Segment Data San Luis Obispo County

Æm
Æm
Æm
#*
#*
#*
#*
#*
#*
#*
#*
#*
#*#*
!(
%,
%,
%,
|}58
|}41
|}46
tu101
|}46
|}41
tu101
|}1
|}1
|}1
|}229
|}166
tu101
Nipomo
San Luis Obispo
Arroyo Grande
Pismo Beach
Morro Bay
Los Osos
Cambria
Paso Robles
Atascadero
Carrizo PlainCaliente Range
La Panza Range
Temblor Range
Santa Lucia Range
CampRoberts
!R
!RCayucos
!R
!R
!R
!R!R
!R
!R
!R
CampS. L. O.
San Luis Obispo County Development Centers
°0 10 20 305
Miles
CaltransDistrict 5SystemPlanning
Legend
! ! ! ! !
! ! ! ! !
! ! ! ! !
Coastal Zone
Military Base
State Route 1 Park & Ride Lots
#S Rest Stop
#*
%,Rail Stops
Rail
AirportsÆm

R O U T E 1 – S A N L U I S O B I S P O C O U N T Y - S E G M E N T 5
S E G M E N T S P E C I F I C A T I O N SSegment Begin End Description
5A 0.00 5.07Santa Barbara/San LuisObispo County Line to
Willow Road
5B 5.07 10.90Willow Road to Halcyon
Road
Segment Concept : LOS C/D: Two-laneConventional Highway
S E G M E N T F E A T U R E S
EnvironmentalConstraints:
Coastal Zone requirements Scenic and historic resources Special status species/habitat Geologic and seismic
Archaeological and cultural resources Topography Aesthetics
Multimodal Facilities: Central Coast Area Transit Amtrak Stations in Guadalupe and Grover
Beach Pacific Coast Bike Route
Land Uses alongCorridor :
Agriculture Eucalyptus groves Scattered home sites
Major TrafficGenerators:
Guadalupe Oil Field Agricultural operations Urban-type development Union Oil
I D E N T I F I E D L E V E L S O F S E R V I C E – E X I S T I N G A N D F U T U R E :
Segment 5 is presently operating at peak LOS C, but is projected to reach peak LOS D by year 2025.
R E C O M M E N D E D A C T I O N S :
Improve vertical and horizontal alignments. Provide standard width travel lanes and shoulders Consolidate driveways to limit access points. Provide channelization for turns Support extension of area county road(s) to US 101. Widen Santa Maria River Bridge north of Guadalupe.
Æm
Willow Rd.
Division St.
Oso Flaco Lake Rd.V
alley Rd.
Los Berros Rd.
Halcyon
Rd.
|}1
tu101
|}1
!5B
!5A
GUADALUPE
SLO CO.
SB CO.
NIPOMO
SANTAMARIA
OCEANO
PacificOcean
0.00
10.90
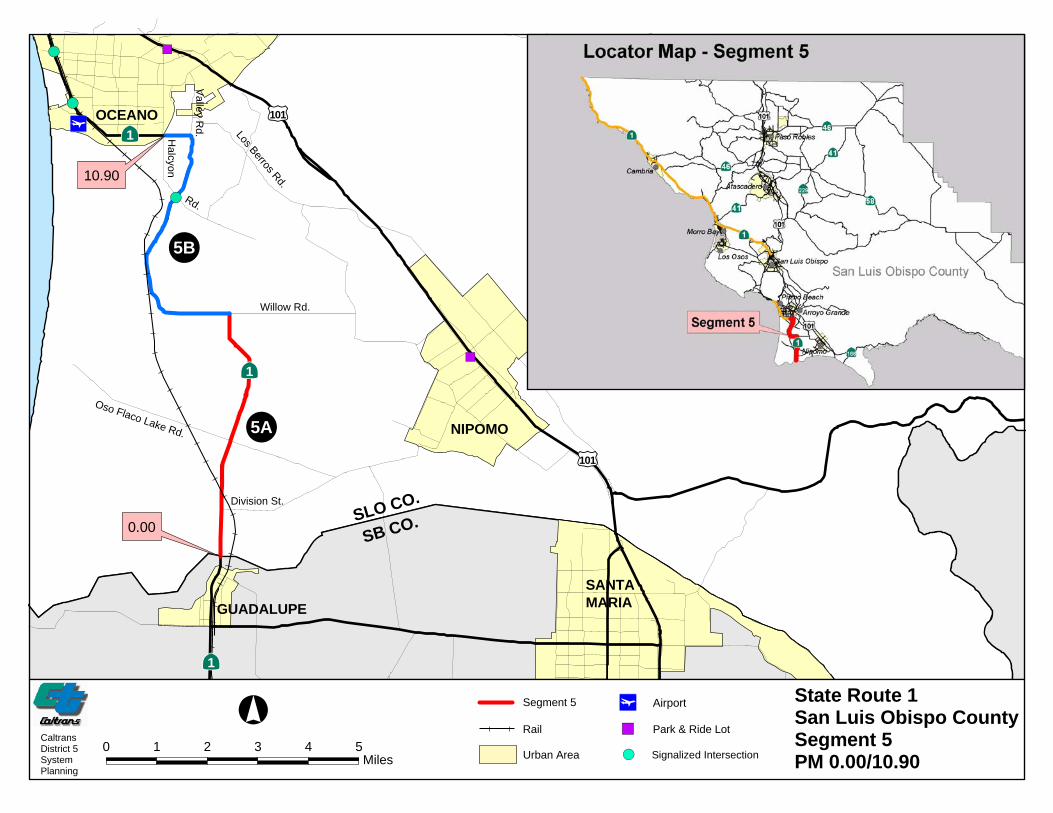
Æm
")
")
!(
!(
!(
GUADALUPE
SLO CO.
SB CO.
NIPOMO
SANTAMARIA
OCEANO
0.00
10.90
Willow Rd.
Division St.
Oso Flaco Lake Rd.
Valley R
d. Los Berros Rd.
Halcyon
Rd.
|}1
|}1
|}1
tu101
tu101
!5B
!5A
State Route 1San Luis Obispo CountySegment 5PM 0.00/10.90
°CaltransDistrict 5SystemPlanning
0 1 2 3 4 5Miles Signalized Intersection!(
AirportÆmPark & Ride Lot")
Urban Area
Rail
Segment 5

Route 1 5A
PM start PM end Length
0.00 5.07 5.07
2 10 to 14 ft.Flat/Rolling 60 ft.
None 0 to 9 ft.Class III 0 ft.
2002 2025 2002 2025 2002 20255,500 9,000 0.20 0.33 C C
ADT Ann. Growth (2002-2025) 1.02% Directional Split 60%Peak Hour Volume (2002) 500 Peak Hour Truck 11%
2002 2025 2002 2025
- - - -
Segment Statewide*Total Collision Rate 1.29 1.37Fatality Collision Rate 0.068 0.030
0.48 0.66
Proposed Transportation Concept
Facility Type:Trucking Designations
Through-traffic flow Analysis
National Highway System
Focus RouteInterregional Road System
Caltrans District 5 - Segment Data Sheet
Description
Number of lanes
Segment/(Sub-segment)
TerrainSignalized IntersectionsBicycle Facilities
San Luis Obispo County
LOS C/ 2-lane conventional highway
LOSDelay Time (seconds)
NoYes
Proposed Concept
V/C Ratio LOSADT
Segment/sub-segment Location
Operating Characteristics
Route Designations
Roadbed Information
No
Lane Width
Comments: Improve vertical and horizontal alignments; provide standard width travel lanes and shoulders; provide channelization for turns; minimize points of access to highway.
(none)
3-year period evaluated
Rates are incidents per million vehicle miles from 10/01/00 to 9/30/03
Accident Data
*Average collision rates statewide for this type facilityFatality & Injury Collision Rate
Signalized Intersection
Analysis
Location
Rural Minor Arterial Functional Classification
Santa Barbara/San Luis Obispo County Line to Willow Road
ROW WidthShoulder WidthMedian Width
Conventional HighwayAdvisory KPRA under 30' & CA Legal 40' KPRA
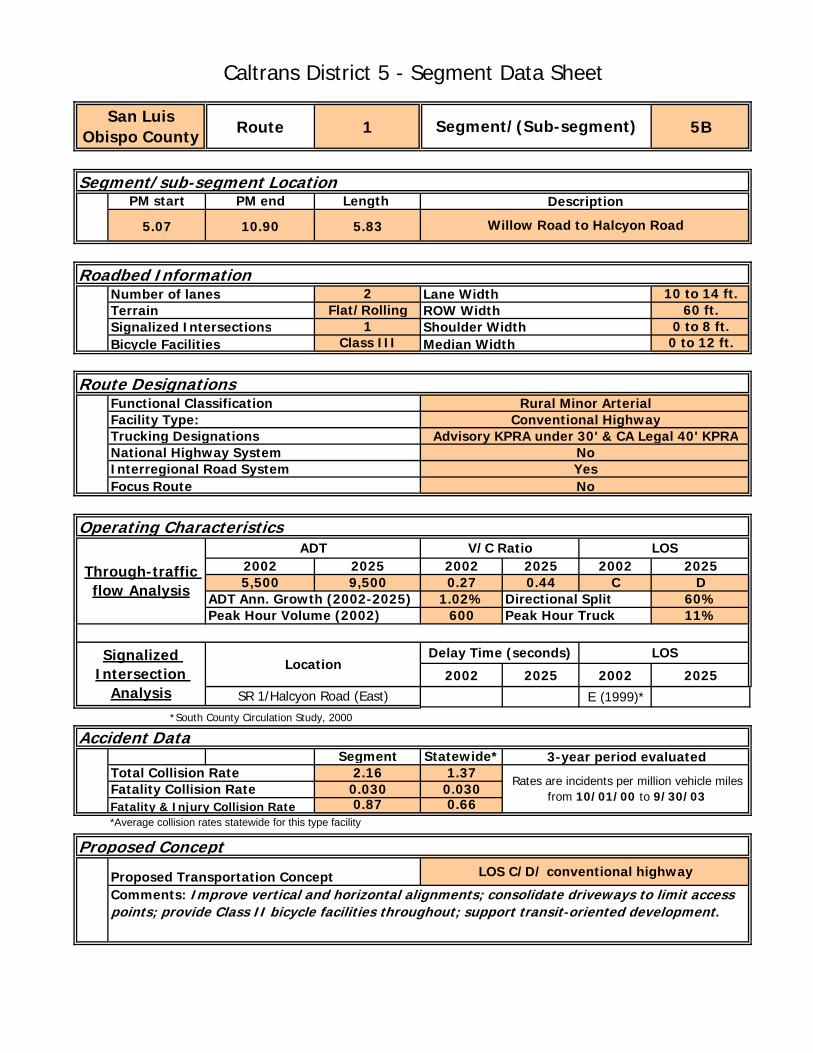
Route 1 5B
PM start PM end Length
5.07 10.90 5.83
2 10 to 14 ft.Flat/Rolling 60 ft.
1 0 to 8 ft.Class III 0 to 12 ft.
2002 2025 2002 2025 2002 20255,500 9,500 0.27 0.44 C D
ADT Ann. Growth (2002-2025) 1.02% Directional Split 60%Peak Hour Volume (2002) 600 Peak Hour Truck 11%
2002 2025 2002 2025
E (1999)**South County Circulation Study, 2000
Segment Statewide*Total Collision Rate 2.16 1.37Fatality Collision Rate 0.030 0.030
0.87 0.66
Proposed Transportation Concept
Advisory KPRA under 30' & CA Legal 40' KPRA
Delay Time (seconds)
NoYes
Facility Type:
V/C Ratio
Willow Road to Halcyon Road
ROW WidthShoulder WidthMedian Width
SR 1/Halcyon Road (East)
3-year period evaluated
Rates are incidents per million vehicle miles from 10/01/00 to 9/30/03
Accident Data
*Average collision rates statewide for this type facilityFatality & Injury Collision Rate
Signalized Intersection
Analysis
Location
Route Designations
Roadbed Information
No
Lane Width
Rural Minor ArterialFunctional Classification
Bicycle Facilities
Conventional Highway
Caltrans District 5 - Segment Data Sheet
Description
Number of lanes
Segment/(Sub-segment)
TerrainSignalized Intersections
Segment/sub-segment Location
San Luis Obispo County
Comments: Improve vertical and horizontal alignments; consolidate driveways to limit access points; provide Class II bicycle facilities throughout; support transit-oriented development.
Trucking Designations
Through-traffic flow Analysis
National Highway System
Focus RouteInterregional Road System
LOS C/D/ conventional highway
LOS
LOS
Proposed Concept
ADTOperating Characteristics

R O U T E 1 – S A N L U I S O B I S P O C O U N T Y – S E G M E N T 6
S E G M E N T S P E C I F I C A T I O N S
Segment Begin End Description6 10.90 16.77 Halcyon Rd to
US Route 101 in PismoBeach
Segment Concept : LOS C/D: Two- tofour-lane Conventional Highway
S E G M E N T F E A T U R E S
EnvironmentalConstraints:
Coastal Zone requirements Scenic and historic resources Special status species/habitat Geologic and seismic
Archaeological and cultural resources Topography Aesthetics
Multimodal Facilities: Central Coast Area Transit AMTRAK at Grover Beach Pacific Coast Bike Route
Land Uses alongCorridor :
Agricultural Urban transitional Recreational Urban Commercial
Major TrafficGenerators:
Agricultural Operations Oceano Dunes State Vehicular Recreation Area Pismo Beach State Beach Urban Activities in Oceano, Grover Beach, and Pismo Beach
I D E N T I F I E D L E V E L S O F S E R V I C E – E X I S T I N G A N D F U T U R E :
Segment 6 is presently operating at peak LOS E and is projected to reach LOS F by year 2025.
R E C O M M E N D E D A C T I O N S :
Widen to four lanes where feasible. Improve local circulation and parking. Minimize and consolidate access points. Provide Class II bike lanes throughout. Improve pedestrian access. Provide standard width travel lanes and shoulders.

State Route 1San Luis Obispo CountySegment 6PM 10.90/16.77
Æm
")
")
!(
!(
!(
!(
!(
!(
OCEANO
GROVER BEACH
PISMOBEACH
10.90
16.77
PacificOcean
Hal
cyon
Rd.
Grand Ave.
Val
ley
Rd.
Pric
e C
yn. R
d.
Pier Ave.
Hinds A
ve.
Pomero
y Ave
.
Mattie
Rd.
Coast
Village
|}1
|}1 tu101
tu101
!6
CaltransDistrict 5SystemPlanning
0 0.5 1 1.5 2Miles
° Segment 6
Rail Park & Ride Lot")
Urban Area
AirportÆm
Signalized Intersection!(

Route 1 6
PM start PM end Length
10.90 16.77 5.87
2 10 to 13 ft.Flat/Rolling 60 ft.
6 4 to 15 ft.Class II/III 0 to 14 ft.
2002 2025 2002 2025 2002 202512,200 24,300 0.52 >1.00 E F
ADT Ann. Growth (2002-2025) 3.04% Directional Split 60%Peak Hour Volume (2002) 1,400 Peak Hour Truck 8%
2002 2025 2002 2025
Segment Statewide*Total Collision Rate 2.01 2.99Fatality Collision Rate 0.000 0.013
0.87 1.20* Average collision rates statewide for this type facility
Proposed Transportation Concept
Accident Data
Fatality & Injury Collision Rate
Signalized Intersection
Analysis Pier, Grand, Coast Village, Hinds, Pomeroy, Mattie
~ No data. No significant issues. ~
Comments: Widen to four lanes where feasible; improve local circulation to reduce congestion on SR 1; provide Class II bicycle facilities along entire segment; improve pedestrian access; enhance shuttle service for motels, restaurants, shopping, and beach area destinations.
3-year period evaluated
Rates are incidents per million vehicle miles from 10/01/00 to 9/30/03
Roadbed Information
No
Urban Principal Arterial & Urban Minor ArterialRoute Designations
Median Width
Yes
Conventional HighwayFacility Type:
Signalized Intersections
Proposed Concept
Lane WidthROW WidthShoulder Width
Trucking Designations
Bicycle Facilities
Location
National Highway System
Halcyon Road to South Junction with US Route 101(Pismo Beach)
LOS C/D 2 to 4-lane conventional highway
LOSDelay Time (seconds)
CA Legal 40' KPRANo
Functional Classification
Caltrans District 5 - Segment Data Sheet
Description
Number of lanes
Segment/(Sub-segment)
Terrain
San Luis Obispo County
Segment/sub-segment Location
Focus RouteInterregional Road System
Through-traffic flow Analysis
Operating CharacteristicsLOSV/C RatioADT

R O U T E 1 – S A N L U I S O B I S P O C O U N T Y - S E G M E N T 7
S E G M E N T S P E C I F I C A T I O N SSegment Begin End Description
7 16.77 17.80
U.S. Route 101 Ramps atSanta Rosa Street in SanLuis Obispo to CityLimits at Highland Drive
Segment Concept : LOS D: (SeeRecommended Actions, below)
S E G M E N T F E A T U R E S
EnvironmentalConstraints:
Coastal Zone requirements Scenic and historic resources Special status species/habitat Geologic and seismic
Archaeological and cultural resources Topography Aesthetics
Multimodal Facilities: Central Coast Area Transit SLO Transit Pacific Coast Bike Route
Land Uses alongCorridor :
Urban Commercial and Office Hospital
Major TrafficGenerators:
California State Polytechnic University Restaurants, Professional Offices, and other Urban Facilities Sierra Vista Hospital Route 101 Ramps
I D E N T I F I E D L E V E L S O F S E R V I C E – E X I S T I N G A N D F U T U R E :
Segment 7 is presently operating at peak LOS E and is projected to operate at peak LOS F by the year 2025.
R E C O M M E N D E D A C T I O N S : Evaluate potential for widening to six lanes Evaluate potential for grade separation at Foothill Boulevard intersection Improve US 101 interchange Evaluate bypass/relinquishment of Segments 7 and 8A (alternate route from Route 101 to Cuesta College) Improve pedestrian access Reduce demand by encouraging and improving alternative modes of transportation. Improve local circulation. Synchronize traffic signals. Consider local CSS proposals. Consider CMS and HAR on US 101 re: SR 1 road conditions. Implement Intelligent Transportation System components from Central Coast Deployment Plan

State Route 1San Luis Obispo CountySegment 7PM 16.77/17.80
!(
!(
!(
!(
!(
SANLUISOBISPO
16.77
17.80
Cal Poly
E. Foothill Blvd.
Highland Dr.
Santa Rosa St.
Olive St.
Walnut St.
Murray St.
|}1
|}1
tu101
tu101
!7
0 0.1 0.2 0.3Miles
°CaltransDistrict 5SystemPlanning
Rail
Segment 7
Cal Poly
Urban Area
Signalized Intersection!(

Route 1 7
PM start PM end Length
16.77 17.80 1.03
4 11 to 17.5 ft.Flat/Rolling 100 ft.
Five 7 to 8 ft.Class II/III 4 to 25 ft.
2002 2025 2002 2025 2002 2025
41,000 46,500ADT Ann. Growth (2002-2025) 2.69% Directional Split 60%Peak Hour Volume (2002) 3,100 Peak Hour Truck 3%
2002 2025 2002 2025
Segment Statewide*Total Collision Rate 6.56 2.11Fatality Collision Rate 0.000 0.015
2.25 0.94* Average collision rates statewide for this type facility
Proposed Transportation Concept
Not applicable. Intersections control LOS.*
Through-traffic flow Analysis
Operating Characteristics
~ no data ~
* SLOCOG's Vision 2025 indicates segment LOS "E" in 2004, with LOS "F" forecast for 2025.
Location
Facility Type:
LOSV/C RatioADT
Caltrans District 5 - Segment Data Sheet
Description
Number of lanes
Segment/(Sub-segment)
Terrain
San Luis Obispo County
Segment/sub-segment Location
Santa Rosa Street from US Route 101 North (San Luis Obispo) to Highland Drive
LOS D
LOSDelay Time (seconds)
Terminal Access RouteNo
Roadbed Information
No
Signalized Intersections
Proposed Concept
Lane Width
Walnut, Olive, Murray, Highland
ROW WidthShoulder Width
Trucking Designations
Bicycle Facilities
Conventional Highway
Signalized Intersection
Analysis
Urban Minor Arterial & Urban Principal ArterialRoute Designations
Median Width
Yes
Functional Classification
Focus RouteInterregional Road SystemNational Highway System
Comments: Evaluate potential for widening to 6 lanes with grade separation at Foothill Boulevard intersection; improve interchange with US 101; evaluate by-pass/relinquishment; improve pedestrian access; improve local circulation; synchronize signals; consider CMS or HAR for NB US 101 to advise of road conditions; consider locally-sponsored CSS projects.
Foothill
3-year period evaluated
Rates are incidents per million vehicle miles for 3-year period from:
Accident Data
Fatality & Injury Collision Rate
~ LOS E - known peak hour delay ~

R O U T E 1 – S A N L U I S O B I S P O C O U N T Y - S E G M E N T 8
S E G M E N T S P E C I F I C A T I O N SSegment Begin End Description
8A 17.8 22.65 San Luis Obispo CityLimits to Cuesta Collegeat Education Drive
8B 22.65 27.88 Cuesta College atEducation Drive to SouthBay Boulevard in MorroBay
Segment Concept : LOS C: Four-laneExpressway and Four-lane Freeway
S E G M E N T F E A T U R E S
EnvironmentalConstraints:
Coastal Zone requirements Scenic and historic resources Special status species/habitat Geologic and seismic
Archaeological and cultural resources Topography Aesthetics
Multimodal Facilities: Central Coast Area Transit Pacific Coast Bike Route
Land Uses alongCorridor :
Educational Facilities Public Facilities
Military Base Recreation Agriculture
Major TrafficGenerators:
Cuesta College Camp San Luis Regional Park and Golf Course
School District Offices City of Morro Bay
I D E N T I F I E D L E V E L S O F S E R V I C E – E X I S T I N G A N D F U T U R E :
Segment 8 is presently operating at peak LOS A/B and is projected to decline slightly to LOS A/B to B by the year2025.
R E C O M M E N D E D A C T I O N S :
Minimize and consolidate access points. Convert conventional to expressway and expressway to freeway where feasible. Enhance intermodal facilities and services (Central Coast Area Transit). Reduce demand by encouraging and improving alternative modes of transportation. Cooperate in implementation of San Luis Obispo North Coast Byway Enhancement Plan where feasible. Evaluate relinquishment of Segments 7 and 8A and adoption of alternative route from Route 101 to Cuesta College.

State Route 1San Luis Obispo CountySegment 8PM 17.80/27.88
!(
!(!(
!(!(
")
")
MORROBAY
LOSOSOS
BAYWOOD PARK
Cal Poly
Cuesta College
SAN LUIS OBISPO
#8A
#8B
27.88
17.80
Los Osos Valley Rd.
O'Connor Way
Foothill Blvd.
Educ
ation
Dr.
Kans
as A
ve.
Men's
Colony
O'Con
nor W
ay|}1
|}41
tu101
0 1 2 3Miles
°CaltransDistrict 5SystemPlanning
Signalized Intersection!(
Urban AreaSub-Segment 8A - PM 17.80/22.65
Sub-Segment 8B - PM 22.65/27.88
Rail Park & Ride Lot")

Route 1 8A
PM start PM end Length
17.80 22.65 4.85
4 11 to 16 ft.Flat/Rolling 150 ft.
4 8 ft.Class III 6 to 25 ft.
2002 2025 2002 2025 2002 202523,800 30,900 A/B B
ADT Ann. Growth (2002-2025) 1.14% Directional Split 60%Peak Hour Volume (2002) 2,200 Peak Hour Truck 3%
2002 2025 2002 2025
Segment Statewide*Total Collision Rate 0.94 1.65Fatality Collision Rate 0.032 0.017
0.34 0.61* Average collision rates statewide for this type facility
Proposed Transportation Concept
~ no data ~~ no data ~~ no data ~~ no data ~
Proposed Concept
Comments: Minimize and consolidate access points; convert conventional to expressway and expressway to freeway where feasible.
Education Drive
3-year period evaluated
Rates are incidents per million vehicle miles for 3-year period from:
Accident Data
LOS C/ 4-lane expressway
O'Connor WayKansas Avenue
Fatality & Injury Collision Rate
Signalized Intersection
Analysis
Location
California Men's Colony
LOSDelay Time (seconds)
ADT
Through-traffic flow Analysis
V/C Ratio LOS
Focus RouteInterregional Road System
Terminal Access Route
Rural Minor Arterial Functional Classification
Caltrans District 5 - Segment Data Sheet
Description
Number of lanes
Segment/(Sub-segment)
Terrain
Highland Drive to Education Drive (Cuesta College)
San Luis Obispo County
Signalized Intersections
Segment/sub-segment Location
Route Designations
Roadbed InformationLane WidthROW WidthShoulder WidthMedian Width
Yes
Operating Characteristics
Bicycle Facilities
Facility Type:Trucking Designations
Conventional Highway & Expressway
National Highway System No
No

Route 1 8B
PM start PM end Length
22.65 27.88 5.23
4 11 to 16 ft.Flat/Rolling 150 ft.
None 7 to 8 ft.Class III 6 to 25 ft.
2002 2025 2002 2025 2002 202518,000 22,900 A/B A/B
ADT Ann. Growth (2002-2025) 0.65% Directional Split 60%Peak Hour Volume (2002) 1,700 Peak Hour Truck 3%
2002 2025 2002 2025
- - - -
Segment Statewide*Total Collision Rate 0.50 0.62Fatality Collision Rate 0.000 0.016
0.19 0.28* Average collision rates statewide for this type facility
Proposed Transportation Concept
National Highway System
San Luis Obispo County
Segment/sub-segment Location
Lane Width
Route Designations
Roadbed Information
ADT
Through-traffic flow Analysis
Functional ClassificationConventional Highway & Expressway
Trucking DesignationsFacility Type:
Operating Characteristics
Comments: Upgrade to 4-lane freeway as needed
3-year period evaluated
Caltrans District 5 - Segment Data Sheet
Description
Number of lanes
Segment/(Sub-segment)
TerrainSignalized IntersectionsBicycle Facilities
LOS C/4-lane freeway
LOSDelay Time (seconds)
NoYes
V/C Ratio
Proposed Concept
Interregional Road SystemNo
Education Drive (Cuesta College) to South Bay Boulevard (Morro Bay)
ROW WidthShoulder WidthMedian Width
Terminal Access Route
Rates are incidents per million vehicle miles for 3-year period from:
Accident Data
Rural Minor Arterial
Fatality & Injury Collision Rate
Signalized Intersection
Analysis
Location
(none)
LOS
Focus Route

R O U T E 1 – S A N L U I S O B I S P O C O U N T Y - S E G M E N T 9
S E G M E N T S P E C I F I C A T I O N SSegment Begin End Description
9A 27.88 32.10 South Bay Boulevard toN/O Yerba BuenaStreet in Morro Bay
9B 32.10 R36.80 N/O Yerba BuenaStreet in Morro Bay toN/O Cayucos CreekRoad
9C R36.80 45.99 N/O Cayucos CreekRoad to SR 46
Segment Concept : LOS C/D: Four-lanefreeway/expressway and two-lane
expressway
S E G M E N T F E A T U R E S
EnvironmentalConstraints:
Coastal Zone requirements Scenic and historic resources Special status species/habitat
Geologic and Seismic Archaeological and cultural resources Aesthetics
Multimodal Facilities: Central Coast Area Transit Pacific Coast Bike Route
Land Uses alongCorridor :
Residential Commercial
Agricultural Open Space
Major TrafficGenerators:
Morro Bay Beaches Cayucos
Residential Recreational
I D E N T I F I E D L E V E L S O F S E R V I C E – E X I S T I N G A N D F U T U R E :
Segment 9 is presently operating at peak LOS A/D and is projected to remain at peak LOS A/D through year 2025.
R E C O M M E N D E D A C T I O N S :
Sub-segments 9A and 9B: consolidate access to convert 4-lane expressway sections to freeway. Improve interchange with SR 41 (and Main Street) in Morro Bay Sub-segment 9C: minimize new access and consolidate existing access where feasible. Sub-segment 9C: continue to evaluate need for passing lanes Reduce demand by encouraging and improving alternative modes of transportation. Cooperate in implementation of San Luis Obispo North Coast Byway Enhancement Plan where feasible. Provide CMS south of SR 46 to advise of SR 1 conditions between Cambria and Carmel.
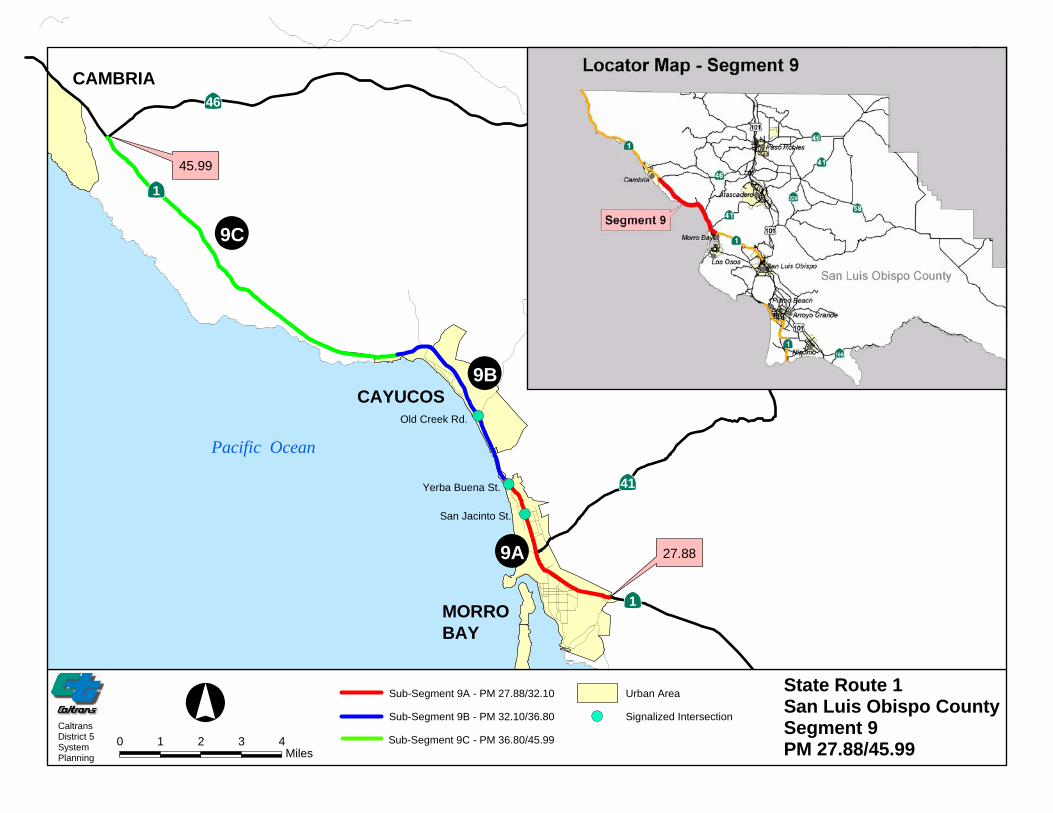
State Route 1San Luis Obispo CountySegment 9PM 27.88/45.99
!(
!(
!(
MORROBAY
Pacific Ocean
CAMBRIA
#9B
#9C
CAYUCOS
#9A
Old Creek Rd.
Yerba Buena St.
San Jacinto St.
|}1
|}1
|}41
|}46
45.99
27.88
0 1 2 3 4Miles
°CaltransDistrict 5SystemPlanning
Sub-Segment 9A - PM 27.88/32.10
Sub-Segment 9B - PM 32.10/36.80
Sub-Segment 9C - PM 36.80/45.99
Signalized Intersection!(
Urban Area

Route 1 9A
PM start PM end Length
27.88 32.10 4.22
4 12 ft.Flat 150 ft.
2 5 to 8 ft.Class III 22 ft.
2002 2025 2002 2025 2002 202518,900 23,000 A A
ADT Ann. Growth (2002-2025) 0.86% Directional Split 60%Peak Hour Volume (2002) 1,800 Peak Hour Truck 2%
2002 2025 2002 2025
Segment Statewide*Total Collision Rate 0.68 0.92Fatality Collision Rate 0.023 0.011
0.27 0.37
Proposed Transportation Concept
Terminal Access RouteNo
Freeway & Expressway Urban Minor Arterial
Signalized IntersectionsBicycle Facilities Median Width
Trucking Designations
San Luis Obispo County
ADT
National Highway System
Focus RouteInterregional Road System
Facility Type:
South Bay Boulevard (Morro Bay) to Morro Bay North Urban Limits
Functional Classification
Segment/sub-segment Location
LOS
Route Designations
Roadbed Information
Operating Characteristics
No
Caltrans District 5 - Segment Data Sheet
Description
Number of lanes
Segment/(Sub-segment)
TerrainLane WidthROW WidthShoulder Width
Yes
V/C Ratio
Fatality & Injury Collision Rate
Signalized Intersection
Analysis
LocationLOS
San Jacinto/Indigo, Yerba Buena
3-year period evaluated
Rates are incidents per million vehicle miles from 10/01/00 to 9/30/03
~ No Data ~
Comments: Consolidate access to convert expressway sections to freeway
Delay Time (seconds)
Through-traffic flow Analysis
LOS C, 4-lane freeway/expressway
Accident Data
Proposed Concept* Average collision rates statewide for this type facility

Route 1 9B
PM start PM end Length
32.10 R36.80 4.70
4 12 ft.Rolling 150 ft.
1 5 to 8 ft.Class III 22 ft.
2002 2025 2002 2025 2002 202511,900 13,400 A A
ADT Ann. Growth (2002-2025) 0.52% Directional Split 55%Peak Hour Volume (2002) 1,300 Peak Hour Truck 2%
2002 2025 2002 2025
Segment Statewide*Total Collision Rate 0.56 0.65Fatality Collision Rate 0.035 0.020
0.28 0.30
Proposed Transportation Concept
~ No Data ~
Comments: Consolidate access to convert expressway sections to freeway.
Delay Time (seconds)
Through-traffic flow Analysis
LOS C/ 4-lane freeway/expressway
Accident Data
Proposed Concept* Average collision rates statewide for this type facility
Yes
V/C Ratio
Fatality & Injury Collision Rate
Signalized Intersection
Analysis
LocationLOS
Old Creek/Studio
3-year period evaluated
Rates are incidents per million vehicle miles from 10/01/00 to 9/30/03
Caltrans District 5 - Segment Data Sheet
Description
Number of lanes
Segment/(Sub-segment)
TerrainLane WidthROW WidthShoulder Width
Segment/sub-segment Location
LOS
Route Designations
Roadbed Information
Operating Characteristics
No
San Luis Obispo County
ADT
National Highway System
Focus RouteInterregional Road System
Facility Type:
Morro Bay North Urban Limits to Freeway End N/O Cayucos
Functional Classification
Terminal Access RouteNo
Expressway & FreewayRural Minor Arterial
Signalized IntersectionsBicycle Facilities Median Width
Trucking Designations

Route 1 9C
PM start PM end Length
R36.80 45.99 9.19
2 12 ft.Flat/Rolling 100 ft.
None 8 ft.Class III 0 ft.
2002 2025 2002 2025 2002 20257,300 7,900 D D/E
ADT Ann. Growth (2002-2025) 0.35% Directional Split 65%Peak Hour Volume (2002) 1,000 Peak Hour Truck 5%
2002 2025 2002 2025
- - - -
Segment Statewide*Total Collision Rate 0.49 0.60Fatality Collision Rate 0.053 0.023
0.22 0.28
Proposed Transportation Concept
(none)
* Average collision rates statewide for this type facility
Accident Data
Fatality & Injury Collision Rate
Signalized Intersection
Analysis
LocationLOSDelay Time (seconds)
Functional Classification Rural Minor Arterial
Comments: Continue to evaluate need for passing lanes; consolidate access points; improve vertical and horizontal alignments; install CMS to advise of delays ahead; consider actions in SLONC Enhancement Plan
3-year period evaluated
Rates are incidents per million vehicle miles from 10/01/00 to 9/30/03
LOS C/D/ 2-lane expressway
Proposed Concept
ROW WidthShoulder WidthMedian Width
Expressway
V/C Ratio LOSOperating Characteristics
Through-traffic flow Analysis
Freeway End N/O Cayucos to SR 46
Terminal Access RouteNoYes
Route Designations
Roadbed Information
No
Lane Width
Caltrans District 5 - Segment Data Sheet
Description
Number of lanes
Segment/(Sub-segment)
TerrainSignalized IntersectionsBicycle Facilities
Segment/sub-segment Location
San Luis Obispo County
ADT
National Highway System
Focus RouteInterregional Road System
Facility Type:Trucking Designations

R O U T E 1 – S A N L U I S O B I S P O C O U N T Y - S E G M E N T 1 0
S E G M E N T S P E C I F I C A T I O N SSegment Begin End Description
10A 45.99 48.24 SR 46 to Main Street Exitin Cambria
10B 48.24 58.24 Main Street Exit inCambria to Entrance to
Hearst Monument10C 58.24 71.34 Entrance to Hearst
Monument to SanCarpoforo Creek
Segment Concept : LOS D: Two-laneExpressway and Two-lane Conventional
Highway
S E G M E N T F E A T U R E S
EnvironmentalConstraints:
Coastal Zone requirements Scenic and historic resources Special status species/habitat Geologic and seismic
Archaeological and cultural resources Topography Aesthetics
Multimodal Facilities: Central Coast Area Transit Pacific Coast Bike Route California Coastal Trail
Land Uses alongCorridor :
Agricultural Urban residential and commercial
Open space Recreational
Major TrafficGenerators:
Cambria San Simeon State Park
William R. Hearst Memorial State Beach Hearst San Simeon State Historic
Monument
I D E N T I F I E D L E V E L S O F S E R V I C E – E X I S T I N G A N D F U T U R E :
Segment 10 is presently operating at peak LOS C/D and is projected to operate at peak LOS D through year 2025.
R E C O M M E N D E D A C T I O N S :
Construct system-wide operational improvements. Realign highway where threatened by coastal erosion. Reduce demand by encouraging and improving alternative modes of transportation. Cooperate in implementation of San Luis Obispo North Coast Byway Enhancement Plan where feasible.

State Route 1San Luis Obispo CountySegment 10PM 45.99/71.34
!(!(
!(
CAMBRIA
Pacific Ocean
SAN SIMEON
#10B
#10A
#10C
|}1
|}1
|}46
HearstCastle
PiedrasBlancasLighthouse
Santa Rosa Creek Rd
Ardath Dr.Main St.
Burton Dr.Windsor Blvd
.
0 1 2 3 4 5Miles
°CaltransDistrict 5SystemPlanning
Signalized Intersection!(
Urban AreaSub-Segment 10A - PM 45.99/48.24
Sub-Segment 10B - PM 48.24/58.24
Sub-Segment 10C - PM 58.24/71.34

Route 1 10A
PM start PM end Length 45.99 48.26 2.25
2 12 ft.Flat/Rolling 100 ft.
1 8 ft.Class III 0 ft.
2002 2025 2002 2025 2002 20259,000 11,500 0.52 0.59 D D
ADT Ann. Growth (2002-2025) 1.07% Directional Split 65%Peak Hour Volume (2002) 1,400 Peak Hour Truck 5%
2002 2025 2002 2025
Segment Statewide*Total Collision Rate 0.71 0.60Fatality Collision Rate 0.045 0.023
0.40 0.28* Average collision rates statewide for this type facility
Proposed Transportation Concept
Proposed Concept
Functional Classification
National Highway System
~ No Data ~
Fatality & Injury Collision Rate
Through-traffic flow Analysis
Focus Route
Location
Facility Type: Expressway
Comments: Consider actions in SLONC Enhancement Plan
Ardath/Main
3-year period evaluated
Rates are incidents per million vehicle miles from 10/01/00 to 9/30/03
Accident Data
LOS D / 2-lane expressway
Signalized Intersection
Analysis
Rural Minor Arterial
SR 46 to Main Street in Cambria
ROW WidthShoulder WidthMedian Width
LOSDelay Time (seconds)
Terminal Access RouteNoYes
V/C Ratio LOSOperating Characteristics
Interregional Road System
ADT
Caltrans District 5 - Segment Data Sheet
Description
Number of lanes
Segment/(Sub-segment)
TerrainSignalized IntersectionsBicycle Facilities
San Luis Obispo County
Segment/sub-segment Location
Trucking Designations
Route Designations
Roadbed Information
No
Lane Width

Route 1 10B
PM start PM end Length 48.26 58.24 9.98
2 12 ft.Rolling 100 ft.
2 8 ft.Class III 0 ft.
2002 2025 2002 2025 2002 20256,100 8,500 0.35 0.43 D D
ADT Ann. Growth (2002-2025) 1.45% Directional Split 55%Peak Hour Volume (2002) 900 Peak Hour Truck 1%
2002 2025 2002 2025
Segment Statewide*Total Collision Rate 0.61 0.70Fatality Collision Rate 0.014 0.031
0.23 0.33* Average collision rates statewide for this type facility
Proposed Transportation Concept
San Luis Obispo County
Median Width
Interregional Road System
Trucking Designations
Bicycle Facilities
Facility Type:Urban Minor Arterial & Rural Minor Arterial
Roadbed InformationLane Width
Caltrans District 5 - Segment Data Sheet
Description
Number of lanes
Segment/(Sub-segment)
TerrainSignalized Intersections
Segment/sub-segment Location
LOS D / 2-lane expressway
Main Street Exit Cambria to San Simeon
LOSDelay Time (seconds)
Terminal Access RouteNoYes
V/C Ratio
Proposed Concept
Expressway
ROW WidthShoulder Width
Route Designations
Focus Route
Functional Classification
National Highway System
No
Comments: Realign where threatened by coastal erosion.
Burton, Windsor
3-year period evaluated
Rates are incidents per million vehicle miles from 10/01/00 to 9/30/03
Accident Data
Signalized Intersection
Analysis
Fatality & Injury Collision Rate
Location
Through-traffic flow Analysis
~ No Data ~
LOSOperating Characteristics
ADT

Route 1 10C
PM start PM end Length 58.24 71.34 13.10
2 9 to 12Rolling 60 to 100 ft.None 4 to 8 ft.
Class III 0 ft
2002 2025 2002 2025 2002 20253,200 5,200 0.22 0.35 C D
ADT Ann. Growth (2002-2025) 1.30% Directional Split 60%Peak Hour Volume (2002) 500 Peak Hour Truck 7%
2002 2025 2002 2025
- - - -
Segment Statewide*Total Collision Rate 0.51 1.42Fatality Collision Rate 0.048 0.031
0.26 0.68* Average collision rates statewide for this type facility
Proposed Transportation Concept
Through-traffic flow Analysis
LOSOperating Characteristics
ADT
Conventional Highway
Comments: Minimize and consolidate access; provide standard width travel lanes and shoulders; improve vertical and horizontal alignment where feasible; realign where threatened by coastal erosion.
(none)
3-year period evaluated
Rates are incidents per million vehicle miles from 10/01/00 to 9/30/03
Accident Data
Fatality & Injury Collision Rate
Signalized Intersection
Analysis
Proposed Concept
Location
Interregional Road System
Lane WidthROW WidthShoulder WidthMedian Width
National Highway System
Focus Route
LOS D / 2-lane conventional highway
San Simeon to San Carpoforo Creek
LOSDelay Time (seconds)
NoYes
V/C Ratio
Route Designations
Facility Type:
Caltrans District 5 - Segment Data Sheet
Description
Number of lanes
Segment/(Sub-segment)
TerrainSignalized IntersectionsBicycle Facilities
San Luis Obispo County
Segment/sub-segment Location
Trucking Designations
Functional Classification Rural Minor Arterial
Terminal Access Route & Advisory KPRA < 30'
Roadbed Information
No

R O U T E 1 – S A N L U I S O B I S P O C O U N T Y - S E G M E N T 1 1
S E G M E N T S P E C I F I C A T I O N SSegment Begin End Description
11 71.34 74.32 San Carpoforo Creek toSan Luis Obispo/Monterey County line
Segment Concept : LOS D: Two-laneConventional Highway
S E G M E N T F E A T U R E S
EnvironmentalConstraints:
Coastal Zone requirements Scenic and historic resources Special status species/habitat Geologic and seismic
Archaeological and cultural resources Topography Aesthetics
Multimodal Facilities: Pacific Coast Bike Route California Coastal Trail
Land Uses alongCorridor :
Open space Recreation Commercial
Major TrafficGenerators:
Big Sur Coast All American Road Ragged Point
I D E N T I F I E D L E V E L S O F S E R V I C E – E X I S T I N G A N D F U T U R E :
Segment 11 is presently operating at peak LOS C and is projected to operate at peak LOS D by year 2025.
R E C O M M E N D E D A C T I O N S :
Provide standard width travel lanes and 4-foot shoulders where possible. Minimize and consolidate access. Evaluate need and provide operational improvements including turn-outs and channelization for turning. Implement recommendations of the Coast Highway Management Plan where feasible. Cooperate in implementation of San Luis Obispo North Coast Byway Enhancement Plan where feasible. Accommodate California Coastal Trail in right-of-way as circumstances require.

State Route 1San Luis Obispo CountySegment 11PM 71.34/74.32
MON CO.
SLO CO.
Ragged Point
Pacific Ocean
Southern Boundary of CoastHighway Management Plan Area
|}1
|}1
|}1
71.34
74.32
!11
CaltransDistrict 5SystemPlanning
0 0.25 0.5 0.75 1Miles
°Segment 11

Route 1 11
PM start PM end Length
71.34 74.32 2.98
2 10 ft.Mountainous 60 ft.
None 1-2 ft.Class III 0 ft.
2002 2025 2002 2025 2002 20252,600 4,200 0.15 0.24 C D
ADT Ann. Growth (2002-2025) 2.09% Directional Split 60%Peak Hour Volume (2002) 400 Peak Hour Truck 1%
2002 2025 2002 2025
Segment StatewideTotal Collision Rate 1.65 1.80Fatality Collision Rate 0.118 0.038
1.18 0.91* Average collision rates statewide for this type facility
Proposed Transportation Concept Comments: Standard width travel lanes and 4-foot shoulders where possible; minimize and consolidate access; implement CHMP actions
Proposed Concept
Fatality & Injury Collision Rate
Accident Data
LOSOperating Characteristics
ADT
Through-traffic flow Analysis
3-year period evaluated
Rates are incidents per million vehicle miles from 10/01/00 to 9/30/03
Signalized Intersection
Analysis
Location
- -(none) - -
No
Lane WidthROW WidthShoulder WidthMedian Width
Conventional HighwayFunctional Classification
National Highway System
Focus Route
LOS D / 2-lane conventional highway
San Carpoforo Creek to San Luis Obispo/Monterey County Line
LOSDelay Time (seconds)
Advisory KPRA <30No Yes
V/C Ratio
Caltrans District 5 - Segment Data Sheet
Description
Number of lanes
Segment/(Sub-segment)
TerrainSignalized IntersectionsBicycle Facilities
San Luis Obispo County
Segment/sub-segment Location
Trucking Designations
Rural Minor ArterialRoute Designations
Roadbed Information
Facility Type:
Interregional Road System

Transportation Concept Report State Route 1 03/23/06
APPENDIX B-3: Maps and Segment DataMonterey County

!!
!!
!!
!
!!
!!
!!
!!
!!
!!
!!
!!
!
!!
!!
!!
!!
!!
!!
!!
!!
!!
!!
!!
!
!!
!!
!!
!!
!!
!!
!!
!!
!!
!
!!
!!
!!
!
!!
!!
!!
!
!!
!!
!!
!!
!!
!!
!!
!!
!!!
!!!
!!
!!!
!!
!
!!
!!
!!
!!
!!
!!
!
!!
!!
!!
!!
!!
!!
!!
!
!!
!!
!!
!!
!!
!!
!!
!!
!!
!!
!!
!!
!!
!!
!!
!!
!!
!
!!
!!
!!
!
!!
!!
!!
!!
!!
!!
!!
!!
!!
!!
!!
!!
!!
!!
!!
!!
!!
!
!!
!!
!!
!!
!!
!!
!!
!!
!!
!!
!!
!!
!
!!
!!
!!
!!
!!
!!
!!
!!
!!
!
!!
!!
!!
!!
!!
!!
!!
!
!!
!!
!!
!!
!!
!!
!
!!
!!
!!
!!
!!
!!
!!
!!
!!
!
!!
!!
!!
!
!!
!!
!!
!!
!!
!!
!!
!!!
!!
!!!
!!!
!!
!!
!!
!!!
!!
!!!
!!
!!!
!!
!!!
!!!
!!
!!!
!!
!!
!!
!!
!!
!!
!
!!
!
!
!
!!
!
!
!
!
!!
!!
!!
!!
!!
!!
!!
!!!
!!
!!
!!
!!
!!
!!
!!
!!
!!
!!
!!
!!
!!
!!
!!
!!
!!
!!
!!
!
!!
!!
!!
!!
!!
!!
!!
!!
!!
!!
!
!!
!!
!!
!!
!!
!!
!!
!!
!
#*
#*
#*
!(!(
%,
Æm
Æm
Æm Æm
tu101
|}1
|}1
tu101
FortHunterLiggett
CampRoberts
|}68
|}183
|}68
|}156
|}1 tu101
Santa Lucia Range
Gabilan Range
Sierra De Salinas
Gabilan Range
|}146
|}25
|}198
|}198
!R
!R
!RSalinas
Monterey
Carmelby theSea
!RSeaside
!RMarina
!R
Castroville
Prunedale
Pajaro
!RPacific Grove
!R
!R
!R
Big Sur
%,
12A
12B
12C
13
14A14B
14C
15
Monterey CountyDevelopment Centers
0 10 20 305
Miles
°
CaltransDistrict 5SystemPlanning
Legend
#S
State Route 1
Rail
! ! ! ! !
! ! ! ! !
Coastal Zone
Military Base
Park & Ride Lots
Rest Stops
#*
%, Rail StopAirportsÆm

R O U T E 1 – M O N T E R E Y C O U N T Y - S E G M E N T 1 2
S E G M E N T S P E C I F I C A T I O N SSegment Begin End Description
12A 0.00 43.10
San LuisObispo/Monterey
County Line to CastroCanyon Bridge
12B 43.10 51.20Castro Canyon Bridge
to Andrew MoleraState Park
12C 51.20 67.90 Andrew Molera StatePark to Malpaso Creek
Bridge
Segment Concept : LOS D: Two-laneConventional Highway
S E G M E N T F E A T U R E S
EnvironmentalConstraints:
Coastal Zone requirements Scenic and historic resources Special status species/habitat Geologic and seismic
Archaeological and cultural resources Topography Aesthetics
Multimodal Facilities: Monterey–Salinas Transit (south to Big
Sur) Pacific Coast Bike Route California Coastal Trail
Land Uses alongCorridor :
Rural, open space, recreation
Major TrafficGenerators:
Julia Pfeiffer Burns State Park Big Sur Andrew Molera State Park Garrapata State Park
I D E N T I F I E D L E V E L S O F S E R V I C E – E X I S T I N G A N D F U T U R E :
Segment 12 is presently operating at peak LOS C/E and is projected to LOS C/F by year 2025.
R E C O M M E N D E D A C T I O N S :
Provide standard width travel lanes and 4-foot shoulders where possible. Minimize and consolidate access. Evaluate need and provide operational improvements including turn-outs and channelization for turning. Implement CHMP actions. Accommodate California Coastal Trail in right-of-way, as circumstances require.

State Route 1Monterey CountySegment 12PM 0.00/67.90
Æm
SLO CO.
MON CO.
Lucia
Gorda
Pacific Ocean
Big Sur
FortHunterLiggett
CampRoberts
Carmelby theSea
!12A
!12B
!12C
0.00
67.90
|}1
|}1
tu101
tu101
0 5 10 15 20Miles
°CaltransDistrict 5SystemPlanning
Sub-Segment 12C - PM 51.20/67.90
Rail
Sub-Segment 12B - PM 43.10/51.20
Sub-Segment 12A - PM 0.00/43.10 Urban Area
Military Base

Route 1 12A
PM start PM end Length
0.00 43.10 43.10
2 10-14 ft.Rolling/
Mountainous100 ft.
None 0-10 ft.Class III 0 ft.
2002 2025 2002 2025 2002 20252,900 3,400 0.24 0.25 C/E C/F
ADT Ann. Growth (2002-2025) 0.66% Directional Split 62%Peak Hour Volume (2002) 500 Peak Hour Truck 1%
2002 2025 2002 2025
- - - -
Segment Statewide*Total Collision Rate 0.95 1.80Fatality Collision Rate 0.031 0.038
0.48 0.90* Average collision rate statewide for this type facility
Proposed Transportation Concept
Accident Data
Fatality & Injury Collision Rate
Signalized Intersection
Analysis (none)
Delay Time (seconds)
Proposed Concept
3-year period evaluated
Rates are incidents per million vehicle miles from 10/01/00 to 9/30/03
Lane Width
ROW Width
Shoulder WidthMedian Width
Through-traffic flow Analysis
National Highway System
Conventional HighwayAdvisory KPRA <30
No
LOS D/ 2-lane conventional highway
Facility Type:
LOSOperating Characteristics
ADT
Comments: Standard width travel lanes and 4-foot shoulders where possible; minimize and consolidate access; implement CHMP actions
YesNo
LOSLocation
Interregional Road System
V/C Ratio
Focus Route
Caltrans District 5 - Segment Data Sheet
Description
Number of lanes
Segment/(Sub-segment)
Terrain
Signalized IntersectionsBicycle Facilities
Monterey County
Segment/sub-segment Location
Trucking Designations
Route Designations
Existing Roadbed Information
San Luis Obispo/Monterey County Line to Castro Canyon Bridge
Rural Minor ArterialFunctional Classification

Route 1 12B
PM start PM end Length
43.10 51.20 8.10
Two 10-14 ft.Rolling 100 ft.None 2-6 ft.
Class III 0 ft.
2002 2025 2002 2025 2002 20254,700 6,300 0.24 0.32 C/E D/E
ADT Ann. Growth (2002-2025) 1.25% Directional Split 60%Peak Hour Volume (2002) 600 Peak Hour Truck 1%
2002 2025 2002 2025
- - - -
Segment Statewide*Total Collision Rate 1.76 1.48Fatality Collision Rate 0.054 0.035
0.92 0.73* Average collision rate statewide for this type facility
Proposed Transportation Concept
Focus RouteInterregional Road System
Segment/sub-segment Location
Trucking DesignationsConventional Highway
Advisory KPRA <30
Existing Roadbed Information
No
Caltrans District 5 - Segment Data Sheet
Description
Number of lanes
Segment/(Sub-segment)
TerrainSignalized IntersectionsBicycke Facilities
Monterey County
Castro Canyon Bridge to Andrew Molera State Park Entrance Drive
LOSDelay Time (seconds)
No Yes
V/C Ratio
Route Designations
Lane WidthROW Width
Rural Minor Arterial
Comments: Standard width travel lanes and 4-foot shoulders where possible; minimize and consolidate access; implement CHMP actions
(none)
3-year period evaluated
Rates are incidents per million vehicle miles from 10/01/00 to 9/30/03
Accident Data
Fatality & Injury Collision Rate
LOS D/ 2-lane conventional highway
Signalized Intersection
Analysis
Location
Proposed Concept
Shoulder WidthMedian Width
Facility Type:Functional Classification
National Highway System
Through-traffic flow Analysis
LOSOperating Characteristics
ADT

Route 1 12C
PM start PM end Length
51.20 67.90 16.70
Two 10-12 ft.Rolling 100 ft.None 1-8 ft.
Class III 0 ft.
2002 2025 2002 2025 2002 20255,800 7,500 0.29 0.35 C/ D/
ADT Ann. Growth (2002-2025) 1.13% Directional Split 60%Peak Hour Volume (2002) 750 Peak Hour Truck 7%
2002 2025 2002 2025
- - - -
Segment Statewide*Total Collision Rate 1.03 1.37Fatality Collision Rate 0.022 0.037
0.46 0.67* Average collision rate statewide for this type facility
Proposed Transportation Concept
Segment/sub-segment Location
Trucking Designations
Existing Roadbed Information
Andrew Molera State Park Entrance Drive to Malpaso Creek Bridge
Route Designations
Lane Width
Monterey County
Conventional HighwayAdvisory KPRA <30
No
National Highway System
Focus RouteInterregional Road System
No Yes
V/C Ratio
Caltrans District 5 - Segment Data Sheet
Description
Number of lanes
Segment/(Sub-segment)
Terrain ROW Width
Rural Minor Arterial
Comments: Standard width travel lanes and 4-foot shoulders where possible; minimize and consolidate access; implement CHMP actions
(none)
3-year period evaluated
Rates are incidents per million vehicle miles from 10/01/00 to 9/30/03
Accident Data
Fatality & Injury Collision Rate
LOS D/ 2-lane conventional highway
Signalized Intersection
Analysis
Location
Proposed Concept
LOSDelay Time (seconds)
Shoulder WidthMedian Width
Facility Type:Functional Classification
Signalized IntersectionsBicycle Facilities
Through-traffic flow Analysis
LOSOperating Characteristics
ADT

R O U T E 1 – M O N T E R E Y C O U N T Y – S E G M E N T 1 3
S E G M E N T S P E C I F I C A T I O N SSegment Begin End Description
13 67.90 72.30 Malpaso Creek Bridgeto Carmel River Bridge
Segment Concept : LOS D: Two-laneConventional Highway
S E G M E N T F E A T U R E S
EnvironmentalConstraints:
Coastal Zone requirements Scenic and historic resources Special status species/habitat Geologic and seismic
Archaeological and cultural resources Topography Aesthetics
Multimodal Facilities: Monterey–Salinas Transit Pacific Coast Bike Route California Coastal Trail
Land Uses alongCorridor :
Rural, open space, recreation
Major TrafficGenerators:
Garrapata State Park Point Lobos State Reserve Carmel River State Beach Monterey Peninsula
I D E N T I F I E D L E V E L S O F S E R V I C E – E X I S T I N G A N D F U T U R E :
Segment 13 is presently operating at peak LOS D/F and is projected to decline to LOS E/F by the year 2025.
R E C O M M E N D E D A C T I O N S :
Provide standard width travel lanes and 4-foot shoulders where possible. Minimize and consolidate access. Evaluate need and provide operational improvements including turn-outs and channelization for turning. Implement CHMP actions. Accommodate California Coastal Trail in right-of-way, as circumstances require.

State Route 1Monterey CountySegment 13PM 67.90/72.30
72.30
67.90
Pacific Ocean
Northern Boundaryof Coast HighwayManagement Plan Area
CarmelBy The Sea
!13
|}1
|}1
|}68 |}1
°0 1 2 3
Miles
CaltransDistrict 5SystemPlanning
Segment 13
Rail
Urban Area
AirportÆm

Route 1 13
PM start PM end Length
67.90 72.30 4.40
Two 12-13 ft.Rollling 100 ft.
None 4-8 ft.Class III 0-11 ft.
2002 2025 2002 2025 2002 202513,200 16,400 0.51 0.63 D/F E/F
ADT Ann. Growth (2002-2025) 0.95% Directional Split 60%Peak Hour Volume (2002) 1,400 Peak Hour Truck 2%
2002 2025 2002 2025
- - - -
Segment Statewide*Total Collision Rate 1.10 1.41Fatality Collision Rate 0.019 0.030
0.40 0.67* Average collision rates statewide for this type facility
Proposed Transportation Concept
Through-traffic flow Analysis
LOSOperating Characteristics
ADT
Shoulder WidthMedian Width
Facility Type:Functional Classification
LOS D/ 2-lane conventional highway
Signalized Intersection
Analysis
Location
Accident Data
ROW Width
Rural Minor Arterial
Comments: Standard width travel lanes and 4-foot shoulders where possible; minimize and consolidate access; implement CHMP actions
(none)
3-year period evaluated
Rates are incidents per million vehicle miles from 10/01/00 to 9/30/03
Accident Data
Fatality & Injury Collision Rate
LOSDelay Time (seconds)
No Yes
V/C Ratio
Caltrans District 5 - Segment Data Sheet
Description
Number of lanes
Segment/(Sub-segment)
TerrainSignalized IntersectionsBicycle Facilities
Monterey County
Conventional HighwayAdvisory KPRA <30
No
National Highway System
Focus RouteInterregional Road System
Segment/sub-segment Location
Trucking Designations
Existing Roadbed Information
Malpaso Creek Bridge to Carmel River Bridge
Route Designations
Lane Width

R O U T E 1 – M O N T E R E Y C O U N T Y – S E G M E N T 1 4
S E G M E N T S P E C I F I C A T I O N SSegment Begin End Description
14A 72.30 75.14Carmel River
Bridge to SR 68West
14B 75.14 R78.12SR 68 West to SR
68 East
14C R78.12 R90.98SR 68 East to SR
156 West
Segment Concept : LOS D: Four- and Six-lane Conventional Highway and Six-lane
Freeway
S E G M E N T F E A T U R E S
EnvironmentalConstraints:
Coastal Zone requirements Scenic and historic resources Special status species/habitat Geologic and seismic
Archaeological and cultural resources Topography Aesthetics
Multimodal Facilities: Monterey–Salinas Transit Pacific Coast Bike Route
Land Uses alongCorridor :
Open Space Urban Commercial and Industrial and Residential Educational Agricultural
Major TrafficGenerators:
Carmel by-the-Sea, Pacific Grove, Monterey, Seaside, Sand City, and Marina: TouristDestinations, Urban Activities, and Employment Centers
Employment and Government Centers in Monterey and in Salinas via SR 68 California State University Monterey Bay Marina State Beach
I D E N T I F I E D L E V E L S O F S E R V I C E – E X I S T I N G A N D F U T U R E :
Segment 14 is presently operating at peak LOS E/F and is projected to operate at LOS F by the year 2025.
R E C O M M E N D E D A C T I O N S :
Widen 2-lane to 4-lane and 4-lane to 6-lane Consolidate access points where feasible south of SR 68 West (Sub-segment 14A. Install operational improvements Widen to 6-lanes north of SR 68 West. Install ITS elements to improve operations. Pursue commuter and inter-city rail extension to Monterey Peninsula for commuter and interregional travel. Pursue non-highway mobility measures (rail, transit, and bicycling) for regional travel among Monterey Bay
destinations.

State Route 1Monterey CountySegment 14PM 72.30/R90.98
Æm
Æm
Æm
")
")!(
!(
!(
!(
Pacific Ocean
!14A
!14B
!14C
72.30
R90.98
|}1
|}1
|}68
|}68
|}183
|}156
tu101
tu101
SALINAS
PACIFICGROVE
CARMELBY THESEA
MONTEREY
SEASIDE
MARINA
CASTROVILLE
SAND CITY
Rio Rd.Carmel Valley Rd.
Ocean Ave.
Carpenter St.
0 1 2 3 4 5Miles
°CaltransDistrict 5SystemPlanning Rail
Sub-Segment 14C - PM R78.12/R90.98
Sub-Segment 14B - PM 75.14/R78.12
Sub-Segment 14A - PM 72.30/75.14
Signalized Intersection!(
Park & Ride Lot")
AirportÆm
Urban Area

Route 1 14A
PM start PM end Length
72.30 75.14 2.84
2 to 4 10-15 ft.Rolling 100-200 ft.
Four 3-16 ft.Class III 0-46 ft.
2002 2025 2002 2025 2002 202546,000 63,000 F F
ADT Ann. Growth (2002-2025) 1.38% Directional Split 60%Peak Hour Volume (2002) 4,500 Peak Hour Truck 3%
Segment Statewide*Total Collision Rate 1.99 1.96Fatality Collision Rate 0.000 0.020
0.57 0.81* Average collision rates statewide for this type facility
Proposed Transportation Concept
2002Signalized Intersection
Analysis
Through-traffic flow Analysis
2025
Comments: Limit and consolidate access; widen 2-lane to 4-lane and 4-lane to 6-lane; add turn lanes to improve turning operations; install ITS elements to aid operations.
3-year period evaluated
Rates are incidents per million vehicle miles from 10/01/00 to 9/30/03
Fatality & Injury Collision Rate
Terminal Access Route
Proposed Concept
Rio Road, Carmel Valley Road, Ocean Avenue, and Carpenter
Street~ no data; observed to be LOS F ~
Accident Data
Operating CharacteristicsADT
Street2002 2025
Monterey County
LOS D/ 4 and 6-lane conventional highway
Carmel River Bridge to SR 68 West
LOSDelay Time (seconds)
YesYes
V/C Ratio
Route Designations
Segment/sub-segment Location
Signalized IntersectionsBicycle Facilities
LOS
Functional Classification
National Highway System
No
Urban Minor Arterial
Shoulder WidthMedian Width
Conventional Highway
Caltrans District 5 - Segment Data Sheet
Description
Number of lanes
Segment/(Sub-segment)
Terrain
Focus RouteInterregional Road System
Trucking Designations
Existing Roadbed Information
Facility Type:
Lane WidthROW Width

Route 1 14B
PM start PM end Length 75.14 R78.12 2.98
4 to 6 11-12 ft.Flat/Rolling 200 ft.
None 5-8 ft.Prohibited 22-46 ft.
2002 2025 2002 2025 2002 202557,500 72,500 F F
ADT Ann. Growth (2002-2025) 0.99% Directional Split 70%Peak Hour Volume (2002) 5,300 Peak Hour Truck 2%
2002 2025 2002 2025
- - - -
Segment Statewide*Total Collision Rate 1.31 0.86Fatality Collision Rate 0.005 0.009
0.37 0.31* Average collision rates statewide for this type of facility
Proposed Transportation Concept
Urban Principal ArterialFacility TypeFunctional Classification
National Highway System
Focus Route
Terminal Access Route
Interregional Road System
Segment/sub-segment Location
Trucking DesignationsFreeway
Existing Roadbed Information
No
Lane Width
Caltrans District 5 - Segment Data Sheet
Description
Number of lanes
Segment/(Sub-segment)
TerrainSignalized IntersectionsBicycle Facilities
Monterey County
LOS D / 6-lane freeway
SR 68 West to SR 68 East
LOSDelay Time (seconds)
YesYes
V/C Ratio
Route Designations
ROW WidthShoulder WidthMedian Width
Comments: Install ITS elements to aid operations: (loops, radar, CMS, HAR, ramp meters); pursue commuter and intercity rail extension to Monterey Peninsula for commuter and interregional travel; pursue non-highway mobility measures (rail, transit, and bicycling) for regional travel among Monterey Bay destinations.
(none)
3-year period evaluated
Rates are incidents per million vehicle miles from 10/01/00 to 9/30/03
Accident Data
Through-traffic flow Analysis
LOSOperating Characteristics
ADT
Proposed Concept
Fatality & Injury Collision Rate
Signalized Intersection
Analysis
Location

Route 1 14C
PM start PM end Length
R78.12 R90.98 12.86
4-6 12 ft.Flat 200-250 ft.
None 8-13 ft.Class I 46-99 ft.
2002 2025 2002 2025 2002 202566,000 91,500 E/F F
ADT Ann. Growth (2002-2025) 1.39% Directional Split 70%Peak Hour Volume (2002) 6,500 Peak Hour Truck 3%
2002 2025 2002 2025
- - - -
Segment Statewide*Total Collision Rate 0.47 0.71Fatality Collision Rate 0.001 0.013
0.18 0.27* Average collision rates statewide for this type facility
Proposed Transportation Concept
Principal ArterialFacility Type:Functional Classification
National Highway System
Focus RouteInterregional Road System
Segment/sub-segment Location
Trucking DesignationsFreeway
Terminal Access Route
Existing Roadbed Information
No - (High Emphasis Route)
Caltrans District 5 - Segment Data Sheet
Description
Number of lanes
Segment/(Sub-segment)
TerrainSignalized IntersectionsBicycle Facilities
Monterey County
LOS D / 6-lane freeway
SR 68 East to SR 156 West
LOSDelay Time (seconds)
YesYes
V/C Ratio
Route Designations
Lane WidthROW WidthShoulder WidthMedian Width
Comments: Provide operational improvements including auxiliary lanes, cameras and loop detectors, ramp meters, CMS, and HAR; pursue commuter and intercity rail extension to Monterey Peninsula for commuter and interregional travel; pursue non-highway mobility measures (rail, transit, and bicycling) for regional travel among Monterey Bay destinations.
(none)
3-year period evaluated
Rates are incidents per million vehicle miles from 10/01/00 to 9/30/03
Accident Data
Fatality & Injury Collision Rate
Proposed Concept
Through-traffic flow Analysis
LOSOperating Characteristics
ADT
Signalized Intersection
Analysis
Location

R O U T E 1 – M O N T E R E Y C O U N T Y - S E G M E N T 1 5
S E G M E N T S P E C I F I C A T I O N SSegment Begin End Description
15 R90.98 R102.03 SR 156 West toMonterey/Santa
Cruz County
Segment Concept : LOS D: Four-laneConventional, Expressway, and Freeway
S E G M E N T F E A T U R E S
EnvironmentalConstraints:
Coastal Zone requirements Scenic and historic resources Special status species/habitat Geologic and seismic
Archaeological and cultural resources Topography Aesthetics
Multimodal Facilities: Monterey–Salinas Transit Rail Station at Pajaro Pacific Coast Bike Route
Land Uses alongCorridor :
Agricultural operations Scattered Convenience Commercial, Industrial Open Space/Wildlife Preserve/Recreational
Major TrafficGenerators:
Access to SR 156 Salinas River State Beach Duke Energy Power Facility Moss Landing State Beach/Elkhorn Slough Zmudowski State Beach Rail Access at Pajaro
I D E N T I F I E D L E V E L S O F S E R V I C E – E X I S T I N G A N D F U T U R E :
Segment 15 is presently operating at peak LOS F and is projected to remain at peak LOS F through year 2025.
R E C O M M E N D E D A C T I O N S :
Construct 4-lane expressway or equivalent capacity in bypass, light rail, and/or other modes. Consolidate access points where feasible. Pursue commuter and inter-city rail extension to Monterey Peninsula for commuter and interregional travel. Pursue non-highway mobility measures (rail, transit, and bicycling) for regional travel among Monterey Bay
destinations. Provide standard width shoulders.

State Route 1Monterey CountySegment 15PM R90.98/R102.03
")
")
")
Pacific
Ocean
CASTROVILLE
PRUNEDALE
PAJARO
SBT CO.
MON CO.
SCR CO.
R90.98
R102.03
|}1
|}1|}129
|}156
|}183
|}152
tu101
tu101
!15
0 1 2 3 4 5Miles
°CaltransDistrict 5SystemPlanning
Rail
Segment 15
Park & Ride Lot")
Urban Area

Route 1 15
PM start PM end Length
R90.98 R102.03 12.46
2 to 4 12-15 ft.Flat/Rolling 100-250 ft.
None 6-13 ft.Class III 0-99 ft.
2002 2025 2002 2025 2002 202534,800 38,000 F F
ADT Ann. Growth (2002-2025) 0.36% Directional Split 65%Peak Hour Volume (2002) 3,900 Peak Hour Truck 6%
2002 2025 2002 2025
- - - -
Segment Statewide*Total Collision Rate 1.01 0.85Fatality Collision Rate 0.014 0.031
0.35 0.41* Average collision rates statewide for this type facility
Proposed Transportation Concept
Proposed Concept
Fatality & Injury Collision Rate
Signalized Intersection
Analysis
Location
Focus Route
Through-traffic flow Analysis
LOSOperating Characteristics
No - (High Emphasis Route)
ADT
Functional Classification Principal Arterial
National Highway System
Comments: Add capacity; limit and consolidate access; pursue commuter and intercity rail extension to Monterey Peninsula for commuter and interregional travel; pursue non-highway mobility measures (rail, transit, and bicycling) for regional travel among Monterey Bay destinations.
(none)
3-year period evaluated
Rates are incidents per million vehicle miles from 10/01/00 to 9/30/03
Accident Data
Lane WidthROW WidthShoulder WidthMedian Width
Freeway/Expressway/Conventional
LOS D / 4-lane conventional/expressway/ freeway
SR 156 West to Monterey/Santa Cruz County Line
LOSDelay Time (seconds)
Terminal Access RouteYesYes
V/C Ratio
Caltrans District 5 - Segment Data Sheet
Description
Number of lanes
Segment/(Sub-segment)
TerrainSignalized IntersectionsBicycle Facilities
Monterey County
Segment/sub-segment Location
Trucking Designations
Route Designations
Existing Roadbed Information
Facility Type
Interregional Road System

Transportation Concept Report State Route 1 03/23/06
APPENDIX B-4: Maps and Segment DataSanta Cruz County

! !
! !
! ! !
! ! ! !
! ! ! ! !
! ! ! ! ! ! !
! ! ! ! ! ! ! ! !
! ! ! ! ! ! ! ! !
! ! ! ! ! ! ! ! !
! ! ! ! ! ! ! ! !
! ! ! ! ! ! ! ! ! !
! ! ! ! ! ! ! ! !
! ! ! ! ! ! ! ! ! !
! ! ! ! ! ! ! !
! ! ! ! ! ! !
! ! ! ! !
! ! ! ! !
! ! ! ! ! ! !
! ! ! ! ! ! ! ! ! ! ! ! ! ! ! !
! ! ! ! ! ! ! ! ! ! ! ! ! ! ! ! ! ! ! ! !
! ! ! ! ! ! ! ! ! ! ! ! ! ! ! ! ! ! ! ! ! ! ! ! ! !
! ! ! ! ! ! ! ! ! ! ! ! ! ! ! ! ! ! ! ! ! ! ! ! ! ! !
! ! ! ! ! ! ! ! ! ! ! ! ! ! ! ! ! ! ! ! ! !
! ! ! ! ! ! ! ! ! ! ! ! ! ! ! ! !
! ! ! ! ! ! ! ! ! ! ! ! !
! ! ! ! ! ! ! ! ! ! ! ! ! !
! ! ! ! ! ! ! ! ! ! ! ! ! ! ! !
! ! ! ! ! ! ! ! ! ! ! ! ! ! ! ! !
! ! ! ! ! ! ! ! ! ! ! ! ! ! ! ! !
! ! ! ! ! ! ! ! ! ! ! ! ! ! ! ! ! !
! ! ! ! ! ! ! ! ! ! ! ! ! ! ! ! ! !
! ! ! ! ! ! ! ! ! ! ! ! ! ! ! ! ! ! !
! ! ! ! ! ! ! ! ! ! ! ! ! ! ! ! ! !
! ! ! ! ! ! ! ! ! ! ! ! ! ! ! ! !
! ! ! ! ! ! ! ! ! ! ! ! ! ! ! ! ! !
! ! ! ! ! ! ! ! ! ! ! ! ! ! ! ! ! !
! ! ! ! ! ! ! ! ! ! ! ! ! ! ! ! ! !
! ! ! ! ! ! ! ! ! ! ! ! ! ! ! ! ! !
! ! ! ! ! ! ! ! ! ! ! ! ! ! ! ! !
! ! ! ! ! ! ! ! ! ! ! ! ! ! ! ! !
! ! ! ! ! ! ! ! ! ! ! ! ! ! ! !
! ! ! ! ! ! ! ! ! ! ! ! ! ! ! !
! ! ! ! ! ! ! ! ! ! ! ! ! ! ! !
! ! ! ! ! ! ! ! ! ! ! ! ! ! !
! ! ! ! ! ! ! ! ! ! ! ! ! ! ! !
! ! ! ! ! ! ! ! ! ! ! ! ! ! !
! ! ! ! ! ! ! ! ! ! ! ! ! ! !
! ! ! ! ! ! ! ! ! ! ! ! ! !
! ! ! ! ! ! ! ! ! ! ! ! ! !
! ! ! ! ! ! ! ! ! ! ! ! ! !
! ! ! ! ! ! ! ! ! ! ! ! !
! ! ! ! ! ! ! ! ! ! ! ! ! !
! ! ! ! ! ! ! ! ! ! ! ! !
! ! ! ! ! ! ! ! ! ! ! ! !
! ! ! ! ! ! ! ! ! ! ! ! !
! ! ! ! ! ! ! ! ! ! ! !
! ! ! ! ! ! ! ! ! !
! ! ! ! ! ! ! !
! ! ! ! ! !
! ! ! ! !
Æm Watsonville
!R
Aptos
Capitola
SantaCruz
|}1
|}9
|}152
|}1
|}236
|}129
|}17ScottsValley
#*
#* #*
#*
#*#* #*
|}35
!R
!R
!R
!R
Santa Cruz MountainsDavenport
!R
Santa Cruz CountyDevelopment Centers
0 5 10
Miles
°
CaltransDistrict 5SystemPlanning
Legend
Ü Ü Ü Ü Ü
Ü Ü Ü Ü Ü
Ü Ü Ü Ü Ü
Coastal Zone State Route 1
#* Park & Ride Lots
AirportÆm Rail
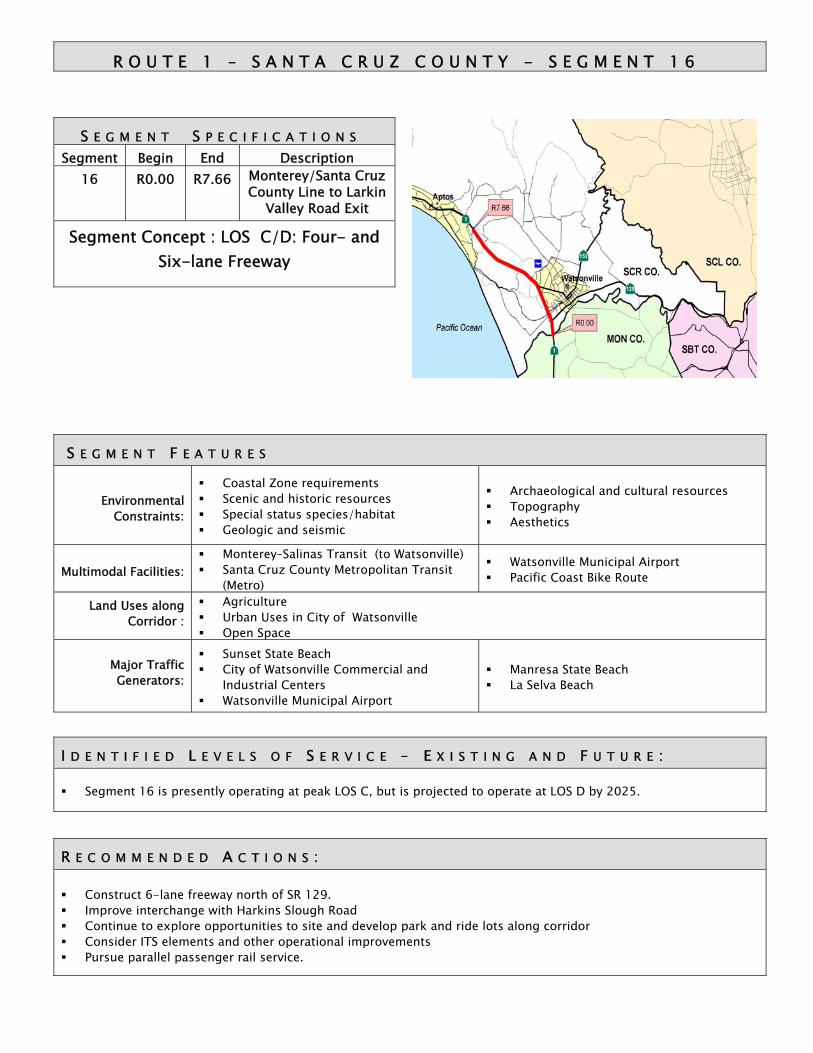
R O U T E 1 – S A N T A C R U Z C O U N T Y - S E G M E N T 1 6
S E G M E N T S P E C I F I C A T I O N SSegment Begin End Description
16 R0.00 R7.66 Monterey/Santa CruzCounty Line to Larkin
Valley Road Exit
Segment Concept : LOS C/D: Four- andSix-lane Freeway
S E G M E N T F E A T U R E S
EnvironmentalConstraints:
Coastal Zone requirements Scenic and historic resources Special status species/habitat Geologic and seismic
Archaeological and cultural resources Topography Aesthetics
Multimodal Facilities: Monterey–Salinas Transit (to Watsonville) Santa Cruz County Metropolitan Transit
(Metro)
Watsonville Municipal Airport Pacific Coast Bike Route
Land Uses alongCorridor :
Agriculture Urban Uses in City of Watsonville Open Space
Major TrafficGenerators:
Sunset State Beach City of Watsonville Commercial and
Industrial Centers Watsonville Municipal Airport
Manresa State Beach La Selva Beach
I D E N T I F I E D L E V E L S O F S E R V I C E – E X I S T I N G A N D F U T U R E :
Segment 16 is presently operating at peak LOS C, but is projected to operate at LOS D by 2025.
R E C O M M E N D E D A C T I O N S :
Construct 6-lane freeway north of SR 129. Improve interchange with Harkins Slough Road Continue to explore opportunities to site and develop park and ride lots along corridor Consider ITS elements and other operational improvements Pursue parallel passenger rail service.

Æm
")
|}152
|}1
|}1
|}129
MON CO.
SCR CO.
Pacific Ocean
R0.00
R7.66
APTOS
WATSONVILLE
!16
State Route 1Santa Cruz CountySegment 16PM R0.00/R7.66
0 1 2 3Miles
°CaltransDistrict 5SystemPlanning
Rail
Segment 16
Urban Area
AirportÆmPark & Ride Lot")

Route 1 16
PM start PM end Length
R0.00 R7.66 7.66
4 to 5 12 ft.Flat/Rolling 200-220 ft.
None 5-10 ft.Prohibited 36-99 ft.
2002 2025 2002 2025 2002 202546,000 56,000 C D
ADT Ann. Growth (2002-2025) 0.84% Directional Split 60%Peak Hour Volume (2002) 4,500 Peak Hour Truck 4%
2002 2025 2002 2025
Segment Statewide*Total Collision Rate 0.43 0.62Fatality Collision Rate 0.010 0.010
0.15 0.24
Proposed Transportation Concept
Santa Cruz County
Facility Type:
Segment/sub-segment Location
Monterey/Santa Cruz County Line to Larkin Valley Road Exit
Existing Roadbed Information
ADT
National Highway System
Focus RouteInterregional Road System
Caltrans District 5 - Segment Data Sheet
Description
Number of lanes
Segment/(Sub-segment)
TerrainSignalized IntersectionsBicycle Facilities
Route Designations
LOSDelay Time (seconds)
Terminal Access RouteYesYes
V/C Ratio
No
Trucking Designations
Lane WidthROW WidthShoulder WidthMedian Width
FreewayPrincipal Arterial
Comments: Install ITS elements to improve operations (pavement detectors, CCTV cameras, CMSs, ramp meters); support TDMs and intermodal facilities to reduce/manage demand; improve I/C with Harkins Slough Road.
(none)
3-year period evaluated
Rates are incidents per million vehicle miles from 10/01/00 to 9/30/03
Accident Data
Fatality & Injury Collision Rate
Signalized Intersection
Analysis
LOS C/D / 4-lane Freeway to SR 129; 6-lane Freeway north of SR 129
Location
Proposed Concept* Average collision rates statewide for this type facility
Functional Classification
Through-traffic flow Analysis
LOSOperating Characteristics

R O U T E 1 – S A N T A C R U Z C O U N T Y - S E G M E N T 1 7
S E G M E N T S P E C I F I C A T I O N SSegment Begin End Description
17A R7.66 10.54San Andreas
Rd/Larkin Valley Rd toState Park Road
17B 10.54 15.82State Park Road to
Morrissey Boulevard
17C 15.82 16.82Morrissey Boulevard
to SR1/SR 17 Junction
Segment Concept : LOS D / 6-lane freeway
S E G M E N T F E A T U R E S
EnvironmentalConstraints:
Coastal Zone requirements Scenic and historic resources Special status species/habitat Geologic and seismic
Archaeological and cultural resources Topography Aesthetics
Multimodal Facilities: Santa Cruz County Metropolitan Transit
(Metro) Park and Ride Lots
Pacific Coast Bike Route
Land Uses alongCorridor :
Public Lands: Screening Landscaping Urban Residential and Commercial
Major TrafficGenerators:
La Selva Beach, Rio Del Mar, Aptos, Soquel, Capitola, and Santa Cruz: Tourist Destinations Urban Activities, and Employment Centers Campuses of Cabrillo College and UCSC Access to SR 17 State Beaches: Seacliff, New Brighton, and Twin Lakes Forest of Nisene Marks State Park
I D E N T I F I E D L E V E L S O F S E R V I C E – E X I S T I N G A N D F U T U R E :
Segment 17 is presently operating at peak LOS E/F and is projected to remain at peak LOS F through year 2025.
R E C O M M E N D E D A C T I O N S :
Widen to six lanes. Support intermodal connectivity among highway, rail, bicycle. Continue to explore opportunities to site and develop park and ride lots along corridor Implement Intelligent Transportation System components to aid operations: loops, CCTV cameras, CMS, ramp
meters. Support TDMs and intermodal facilities to reduce/manage demand. Pursue parallel passenger rail service. Support incident management program to increase safety, mobility, and reliability.

")
")
")")
")
!17A
!17B!17C
CAPITOLA
APTOS
SCOTTSVALLEY
R7.66
16.82
SANTA CRUZ
|}17
|}1
|}1
|}9
State Route 1Santa Cruz CountySegment 17PM R7.66/16.82
0 0.5 1 1.5 2 2.5Miles
°CaltransDistrict 5SystemPlanning
Sub-Segment 17A - PM R7.66/10.54
Sub-Segment 17B - PM 10.54/15.82
Sub-Segment 17C - PM 15.82/16.82
Rail
Park & Ride Lot")
Urban Area

Route 1 17A
PM start PM end Length R7.66 10.54 2.68
4 12 ft.Rolling 200 ft.None 6-10 ft.
Prohibited 12-70 ft.
2002 2025 2002 2025 2002 202577,000 83,000 E E
ADT Ann. Growth (2002-2025) 0.32% Directional Split 55%Peak Hour Volume (2002) 6,900 Peak Hour Truck 2%
2002 2025 2002 2025
- - - -
Segment Statewide*Total Collision Rate 0.89 1.02Fatality Collision Rate 0.008 0.013
0.28 0.38
Proposed Transportation Concept
Segment/sub-segment Location
Trucking Designations
Route Designations
Existing Roadbed Information
No
Lane Width
Caltrans District 5 - Segment Data Sheet
Description
Number of lanes
Segment/(Sub-segment)
TerrainSignalized IntersectionsBicycle Facilities
Santa Cruz County
Larkin Valley Road to State Park Drive
LOSDelay Time (seconds)
Terminal Access RouteYesYes
V/C Ratio
ROW WidthShoulder WidthMedian Width
FreewayUrban Principal Arterial
Comments: Install ITS elements to improve operations (pavement detectors, CCTV cameras, CMSs and/or HAR, ramp meters); pursue commuter and intercity rail extension to Santa Cruz for commuter and interregional travel; support TDMs and intermodal facilities to reduce/manage demand; pursue non-highway mobility measures (rail, transit, and bicycling) for regional travel among Monterey Bay destinations.
(none)
3-year period evaluated
Rates are incidents per million vehicle miles from 10/01/00 to 9/30/03
Accident Data
LOS D / 6-lane freeway
Signalized Intersection
Analysis
Location
Focus Route
Through-traffic flow Analysis
Fatality & Injury Collision Rate
Proposed Concept* Average collision rates statewide for this type facility
LOSOperating Characteristics
ADT
Functional Classification
National Highway System
Facility Type:
Interregional Road System

Route 1 17B
PM start PM end Length 10.54 15.82 5.28
4 12 ft.Flat/Rolling 200 ft.
None 8 ft.Prohibited 6-36 ft.
2002 2025 2002 2025 2002 2025103,300 121,000 F F
ADT Ann. Growth (2002-2025) 0.66% Directional Split 55%Peak Hour Volume (2002) 8,900 Peak Hour Truck 2%
2002 2025 2002 2025
- - - -
Segment Statewide*Total Collision Rate 0.93 1.32Fatality Collision Rate 0.002 0.015
0.27 0.49
Proposed Transportation Concept
Segment/sub-segment Location
Trucking Designations
Route Designations
Existing Roadbed Information
No
Lane Width
Caltrans District 5 - Segment Data Sheet
Description
Number of lanes
Segment/(Sub-segment)
TerrainSignalized IntersectionsBicycle Facilities
Santa Cruz County
State Park Drive to Morrissey Boulevard
LOSDelay Time (seconds)
Terminal Access RouteYesYes
V/C Ratio LOSOperating Characteristics
ROW WidthShoulder WidthMedian Width
FreewayUrban Principal Arterial
Comments: Also, add auxiliary lanes, as needed; install ITS elements to improve operations (pavement detectors, CCTV cameras, CMSs and/or HAR, ramp meters); pursue commuter and intercity rail extension to Santa Cruz for commuter and interregional travel; support TDMs and intermodal facilities to reduce/manage demand; pursue non-highway mobility measures (rail, transit, and bicycling) for regional travel among Monterey Bay destinations.
(none)
3-year period evaluated
Rates are incidents per million vehicle miles from 10/01/00 to 9/30/03
Accident Data
LOS D / 6-lane freeway
* Average collision rates statewide for this type facility
Signalized Intersection
Analysis
Functional Classification
National Highway System
Facility Type:
Interregional Road System
Proposed Concept
Fatality & Injury Collision Rate
Location
Focus Route
Through-traffic flow Analysis
ADT

Route 1 17C
PM start PM end Length 15.82 16.82 1.00
4 12 ft.Flat/Rolling 200 ft.
None 8 ft.Prohibited 22 ft.
2002 2025 2002 2025 2002 2025109,400 137,000 F F
ADT Ann. Growth (2002-2025) 0.98% Directional Split 55%Peak Hour Volume (2002) 9,400 Peak Hour Truck 2%
2002 2025 2002 2025
- - - -
Segment Statewide*Total Collision Rate 1.83 1.48Fatality Collision Rate 0.000 0.016
0.49 0.54
Proposed Transportation Concept
Segment/sub-segment Location
Trucking Designations
Route Designations
Existing Roadbed Information
No
Lane Width
Caltrans District 5 - Segment Data Sheet
Description
Number of lanes
Segment/(Sub-segment)
TerrainSignalized IntersectionsBicycle Facilities
Santa Cruz County
LOS D / 6-lane freeway
Morrissey Boulevard to SR 17
LOSDelay Time (seconds)
Terminal Access RouteYesYes
V/C Ratio
ROW WidthShoulder Width
Signalized Intersection
Analysis
Location
Median Width
FreewayFunctional Classification
National Highway System
Facility Type:
Operating CharacteristicsADT
Comments: Also, add auxiliary lanes, as needed; install ITS elements to improve operations (pavement detectors, CCTV cameras, CMSs and/or HAR, ramp meters); pursue commuter and intercity rail extension to Santa Cruz for commuter and interregional travel; support TDMs and intermodal facilities to reduce/manage demand; pursue non-highway mobility measures (rail, transit, and bicycling) for regional travel among Monterey Bay destinations.
(none)
3-year period evaluated
Rates are incidents per million vehicle miles from 10/01/00 to 9/30/03
Accident Data
Fatality & Injury Collision Rate
Interregional Road System
Urban Principal Arterial
Proposed Concept
Through-traffic flow Analysis
* Average collision rates statewide for this type facility
Focus Route
LOS

R O U T E 1 – S A N T A C R U Z C O U N T Y - S E G M E N T 1 8
S E G M E N T S P E C I F I C A T I O N SSegment Begin End Description
18A 16.82 18.14 SR1/SR17 Junction toChestnut St
18B 18.14 20.61 Chestnut Avenue toSanta Cruz City Limits
Segment Concept : LOS D /Sub-segment18A: Four-lane freeway/conventional;
Sub-segment 18B: See below
S E G M E N T F E A T U R E S
EnvironmentalConstraints:
Coastal Zone requirements Scenic and historic resources Special status species/habitat Geologic and seismic
Archaeological and cultural resources Topography Aesthetics
Multimodal Facilities: Santa Cruz County Metropolitan Transit
(Metro) Pacific Coast Bike Route
Land Uses alongCorridor :
Landscaped Open Space Urban Commercial, Residential, Educational, Offices
Major TrafficGenerators:
UC Santa Cruz Main Campus Santa Cruz Recreational Activities: Beach and Boardwalk State Beaches: Lighthouse Field and Natural Bridges Urban Activities and Employment Centers UC Santa Cruz Marine Lab
I D E N T I F I E D L E V E L S O F S E R V I C E – E X I S T I N G A N D F U T U R E :
Segment 18 is presently operating at peak LOS D/E and is projected to fall to LOS E/F by the year 2025.
R E C O M M E N D E D A C T I O N S : Improve channelization where possible. Evaluate intersections at Mission/Chestnut and Mission/Bay for improvements Minimize new access and consolidate existing points of access to highway Improve pedestrian access Continue to explore opportunities to site and develop park and ride lots along corridor Synchronize signals Evaluate potential for widening 4-lane sections to 6 lanes Support incident management program to increase safety, mobility, and reliability.

")
")")
")
!(
!( !(!(
!(
!(
!(
!(
!18B
!18A
16.82
20.61
Pacific Ocean
CAPITOLA
SANTA CRUZ
|}1
|}9
|}17
|}1
Western D
r.
Swift St.
Younglove Ave.
Bay St.
Laurel St.
Walnut St.
King St.
State Route 1Santa Cruz CountySegment 18PM 16.82/20.610 0.5 1 1.5 2
Miles
°CaltransDistrict 5SystemPlanning
Sub-Segment 18A - PM 16.82/18.14
Sub-Segment 18B - PM 18.14/20.61
Rail
Park & Ride Lot")
Signalized Intersection!(
Urban Area

Route 1 18A
PM start PM end Length 16.82 18.14 1.32
4 12 ft.Flat/Rolling 165 ft.
2 8 ft.Prohibited /
Class III 10-99 ft.
2002 2025 2002 2025 2002 202555,000 60,000 D E
ADT Ann. Growth (2002-2025) 1.00% Directional Split 70%Peak Hour Volume (2002) 4,400 Peak Hour Truck 3%
2002 2025 2002 2025D F
2004 2009-12 2004 2009-1254.3 D 114.2 F
* Data provided by City of Santa Cruz Public Works Department
Segment Statewide*Total Collision Rate 2.51 1.60Fatality Collision Rate 0.024 0.014
0.80 0.65
Proposed Transportation Concept
Proposed Concept
SR 9
Comments: Improve intersection with SR 9; evaluate intersection at Mission/Chestnut for improvements; improve pedestrian access.
Mission/Chestnut *
3-year period evaluated
Rates are incidents per million vehicle miles from 10/01/00 to 9/30/03
Accident Data
Fatality & Injury Collision Rate
No
Lane WidthROW WidthShoulder Width
Freeway to Conventional Highway
Focus Route
LOS D /4-lane freeway/conventional
SR 17 to Mission Street
LOSDelay Time (seconds)
Terminal Access RouteNoYes
V/C Ratio
Signalized Intersection
Analysis
Caltrans District 5 - Segment Data Sheet
Description
Number of lanes
Segment/(Sub-segment)
TerrainSignalized Intersections
Functional Classification
Bicycle Facilities
Santa Cruz County
Segment/sub-segment Location
Existing Roadbed Information
Median Width
Trucking Designations
Urban Minor ArterialRoute Designations
Facility Type:
Interregional Road SystemNational Highway System
Operating CharacteristicsADT
* Average collision rates statewide for this type facility
Through-traffic flow Analysis
LOS
Location

Route 1 18B
PM start PM end Length
18.14 20.61 2.47
4-2 12-16.5 ft.Flat 65-165 ft.
7 0-8 ft.Class III 0-11 ft.
2002 2025 2002 2025 2002 202518,800 26,000 E F
ADT Ann. Growth (2002-2025) 2.09% Directional Split 60%Peak Hour Volume (2002) 2,000 Peak Hour Truck 5%
2004 2009-12 2004 2008-1291 F 70.5 E
16.2 B 24.3 C
28.2 C 79.5 E45.3 D 203.4 F16.9 B 31.3 C15.2 B 32.9 C14.5 B 20.7 C
* Data provided by City of Santa Cruz Public Works Department
Segment Statewide*Total Collision Rate 3.27 2.38Fatality Collision Rate 0.027 0.021
1.12 1.02
Proposed Transportation Concept
Bicycle Facilities
Route Designations
Existing Roadbed Information
Conventional Highway/ExpresswayTerminal Access RouteTrucking Designations
National Highway System
Focus RouteInterregional Road System
No
NoYes
Caltrans District 5 - Segment Data Sheet
Description
Number of lanes
Segment/(Sub-segment)
Terrain
Santa Cruz County
Urban Minor ArterialFunctional Classification
Segment/sub-segment Location
Facility Type:
Mission Street to Santa Cruz North Urban Limit at UCSC Marine Lab
Signalized Intersections
Lane WidthROW WidthShoulder WidthMedian Width
LOS D (See comments)
Location
Proposed Concept* Average collision rates statewide for this type facility
LOS*Delay Time (seconds)*
Comments: Provide left turn pockets at signalized intersections; evaluate intersection at Bay Street for further improvements; improve pedestrian access; synchronize signals; evaluate potential for widening 4-lane sections to 6 lanes.
3-year period evaluated
Rates are incidents per million vehicle miles from 10/01/00 to 9/30/03
Accident Data
Fatality & Injury Collision Rate
Signalized Intersection
AnalysisLaurelBay
Almar/Younglove
Western
King
Walnut
Swift
ADT
Through-traffic flow Analysis
LOSOperating Characteristics
V/C Ratio

R O U T E 1 – S A N T A C R U Z C O U N T Y - S E G M E N T 1 9
S E G M E N T S P E C I F I C A T I O N SSegment Begin End Description
19 20.61 37.45 Santa Cruz City Limitsto Santa Cruz/SanMateo County Line
Segment Concept : LOS D: Two-laneConventional
S E G M E N T F E A T U R E S
EnvironmentalConstraints:
Coastal Zone requirements Scenic and historic resources Special status species/habitat Geologic and seismic
Archaeological and cultural resources Topography Aesthetics
Multimodal Facilities: Santa Cruz County Metropolitan Transit
(Metro) Pacific Coast Bike Route California Coastal Trail
Land Uses alongCorridor :
Agricultural Open space Commercial (Davenport)
Major TrafficGenerators:
Wilder Ranch State Park Henry Cowell Redwoods State Park Davenport Big Basin Redwoods State Park
I D E N T I F I E D L E V E L S O F S E R V I C E – E X I S T I N G A N D F U T U R E :
Segment 19 is presently operating at peak LOS D and is projected to decline to peak LOS E by the year 2025.
R E C O M M E N D E D A C T I O N S :
Minimize and consolidate access. Improve channelization.

")
")
") ")
")
SCR CO.SM CO.
SANTA CRUZ
SCOTTSVALLEY
20.61
37.45
Pacific Ocean
!19 |}9|}1
|}17
|}1
State Route 1Santa Cruz CountySegment 19PM 20.61/37.450 1 2 3 4
Miles
°CaltransDistrict 5SystemPlanning
Segment 19
Rail Park & Ride Lot")
Urban Area

Route 1 19
PM start PM end Length
20.61 37.45 16.84
2 11-12 ft.Flat/Rolling 165-180 ft.
None 4-28 ft.Class III 0-11 ft.
2002 2025 2002 2025 2002 20258,000 12,000 D E
ADT Ann. Growth (2002-2025) 1.86% Directional Split 65%Peak Hour Volume (2002) 1,300 Peak Hour Truck 3%
2002 2025 2002 2025
Segment Statewide*Total Collision Rate 0.62 1.18Fatality Collision Rate 0.043 0.030
0.35 0.57
Proposed Transportation Concept
Operating CharacteristicsADT
Through-traffic flow Analysis
* Average collision rates statewide for this type facility
LOS
Signalized Intersection
Analysis
Minor ArterialRoute Designations
Facility Type:
Interregional Road SystemFocus Route No
Functional Classification
Santa Cruz County
Segment/sub-segment Location
Trucking Designations
Existing Roadbed InformationLane WidthROW WidthShoulder WidthMedian Width
Expressway to Conventional Highway
Caltrans District 5 - Segment Data Sheet
Description
Number of lanes
Segment/(Sub-segment)
TerrainSignalized IntersectionsBicycle Facilities
LOS D / 2-lane Conventional Highway
Santa Cruz North Urban Limit at UCSC Marine Lab to Santa Cruz/San Mateo County Line
LOSDelay Time (seconds)
Terminal Access RouteNoYes
V/C Ratio
Location
National Highway System
Proposed Concept
Comments: Consolidate access and provide channelization improvements; provide standard width travel lanes and shoulders.
(none)
3-year period evaluated
Rates are incidents per million vehicle miles from 10/01/00 to 9/30/03
Accident Data
Fatality & Injury Collision Rate

Transportation Concept Report State Route 1 03/23/06
APPENDIX C: Comments and Issues Identified in Community Meetings

Transportation Concept Report State Route 1 03/23/06
Comments and Issues Identified in Community Meetings
SANTA BARBARA COUNTYSegment 1: US 101 to SR 246
Local transportation planners, community representatives, residents, and members of the BikeCoalition and Lompoc Valley Cycling Club identified the following concerns:
1. Increasing use by commuters2. Capacity of NB 101 off-ramp to Route 1(vehicle stacking on US 101))3. High speed traffic4. Unstable cut slopes along route: erosion and potential for slides and rock falls5. Wash outs/ponding/road closures north of Ytias Creek following heavy rains6. Traffic impacts when SR 246 (alternative route) closed for repairs7. Need for pull-offs for slow-moving farm equipment8. Need for improved/extended passing lanes on grades near Santa Rosa Road9. Need for additional passing lanes along segment10. Non-standard shoulders on two bridges across El Jaro Creek impact bicyclists11. Need for southbound deceleration and acceleration lanes at Jalama Road (roadway
curves near intersection)12. Need for four-lanes from Santa Rosa Road (P.M. 17.78) to SR 246.13. Desire for inexpensive commuter rail system linking North County centers with
South Coast centers
Segment 2 – SR 246 to Harris Grade and Purisima Roads
Local transportation planners, community representatives, residents, and members of the BikeCoalition and Lompoc Valley Cycling Club identified the following concerns:
1. Impacts of Home Depot/other new/planned commercial development on sub-segment 2A
2. Need for continuous sidewalks3. Sub-segment 2A not bicycle friendly4. Main Street vs. State Highway conflicts5. Sub-segment 2B having highest volume of vehicular traffic in Lompoc area6. Heavy commercial traffic7. Need for wider turn lanes to accommodate truck turning movements at Ocean
Avenue/H Street intersection8. Maintenance9. Evacuation route10. Need SB high-speed approach ramp to Santa Ynez River Bridge and Class I path
realignment south of bridge11. Need for additional bike lanes in/through Lompoc12. Need motion-sensitive vehicle sensors at traffic signals to detect bicycles13. Need for bus turn-outs on H Street14. Provide 13’ right turn lanes from I Street to 7th Avenue15. Traffic reduction for downtown Lompoc with extension of Central Avenue16. Impacts of future development approvals

Transportation Concept Report State Route 1 03/23/06
17. Aesthetics: trash and absence of median planting near north city limits18. Traffic operations at Harris Grade Road intersection (consider traffic circle and/or
reconfigured bicycle lanes)
Segment 3 – Harris Grade and Purisima Roads to Orcutt Expressway
Local transportation planners, community representatives, residents, and members of the BikeCoalition and Lompoc Valley Cycling Club identified the following concerns:
1. Impacts of new development on roadway and intersection operations at and northof intersection with Harris Grade and Purisima Roads
2. Safety of access to Allan Hancock College3. Aesthetics: trash and absence of median planting near north city limits4. Need for improvements at Santa Lucia for access to federal prison
Segment 4: Orcutt Expressway to Santa Barbara/San Luis Obispo County Line
A public meeting held April 29, 2003 at the Guadalupe City Council Chambers in the City ofGuadalupe generated comments regarding a wide range of regional transportation issues onState Route 1 and nearby facilities in Santa Barbara and San Luis Obispo Counties.
City of Guadalupe officials and residents identified the following concerns:
1. Non-standard travel lanes (11-12’), shoulders (0-2’) and bridges in sub-segment 4A2. Need for passing lanes and tractor pull-outs along sub-segment 4A3. Improvements for turns at Black Road and Brown Road junctions4. Difficult SB transition from Route 1 onto SR 1355. Flooding6. Impacts of potential development at SW corner SR 1/SR 1667. Main Street vs. State Highway conflicts in Guadalupe8. Safety for children and adult pedestrians: Need for traffic lights at intersections
with W. Main Street (SR 166) and 11th Street9. Need for crosswalks in downtown Guadalupe10. Proximity of SR 1/SR 166 at-grade intersection to SR 166/RR at-grade crossing11. At SR1/166: need for larger stop signs and flashing light, caution light south of
intersection, turn lanes to prevent vehicles backing up on through lanes12. Overloaded produce trucks that shake historic brick buildings along Route 1
(Reroute trucks to San Simas and 11th Streets)13. Desire for better signage on Route 1 in San Luis Obispo County directing traffic to
Guadalupe as a tourist destination14. Need for improved bicycle accommodations possibly including a cantilever bicycle
bridge for bicycles and pedestrians across Santa Maria River north of Guadalupe15. Consideration for developing Guadalupe train station into multi-modal
transportation center16. In Guadalupe along Route 1, improper placement of manhole covers, natural gas
boxes, water boxes, asphalt patching, concrete blocking around tree, and firehydrants; absent lift caps in water boxes; improper dimensions for steps anddriveway lips, and drain inlet; and improper material (asphalt) for gutters.
17. Need for improved road maintenance in Guadalupe

Transportation Concept Report State Route 1 03/23/06
SAN LUIS OBISPO COUNTYGeneral
1. Possibilities for bus rapid transit on Route 12. Need for pedestrian grade separation where highway crossing is difficult and
conflicts with vehicular traffic
Segment 5: Santa Barbara/San Luis Obispo County Line to Halcyon Road
Regional transportation planners and area residents identified the following concerns:
1. Poor visibility over vertical undulations in roadway2. Poor visibility around school bus stop near Nipomo Mesa mobile home park3. Non-standard shoulder widths impact bicyclists4. Slow-moving agricultural vehicles5. Impacts of Woodlands project and other development near Mesa: need for
developer fees to fund related traffic improvements6. Pedestrian crossings7. Provision of multi-use trails separated from highway8. Channelization at intersection as needed to maintain/improve operations as
development occurs9. Consider additional traffic signals10. Improvements at Willow Road: curve realignment, signalization, extension to US
10111. Bridge replacement at Halcyon Road12. Possibilities for realignments to Halcyon and/or Valley Roads with
swaps/relinquishments13. Drainage and flooding
Segment 6: Halcyon Road to US 101 in Pismo Beach
Regional transportation planners identified the following concerns:
1. Need for improved pedestrian access to Grover Beach rail station2. Routing of truck traffic off Halcyon Road3. Multiple access points including non-standard intersection with 4th Street at south
end of railroad crossing in Oceano4. Consider park and ride lot for Pismo Beach5. Need standard shoulder widths for bicycling6. Slow-moving agricultural vehicles7. Consider bicycle-sensitive loops at traffic signals for through and left turn
movements (e.g., Grand Avenue)8. Consider additional signs for Pacific Coast Bicycle Route (PCBR) to remind motorists
to share the road9. Consider signing Mattie Road as PCBR10. Options for congestion relief in Pismo Beach11. Potential ITS applications in high traffic areas: CMS, HAR12. CSS amenities including medians and sidewalks13. Alignment for bike trail14. DeAnza Trail designation
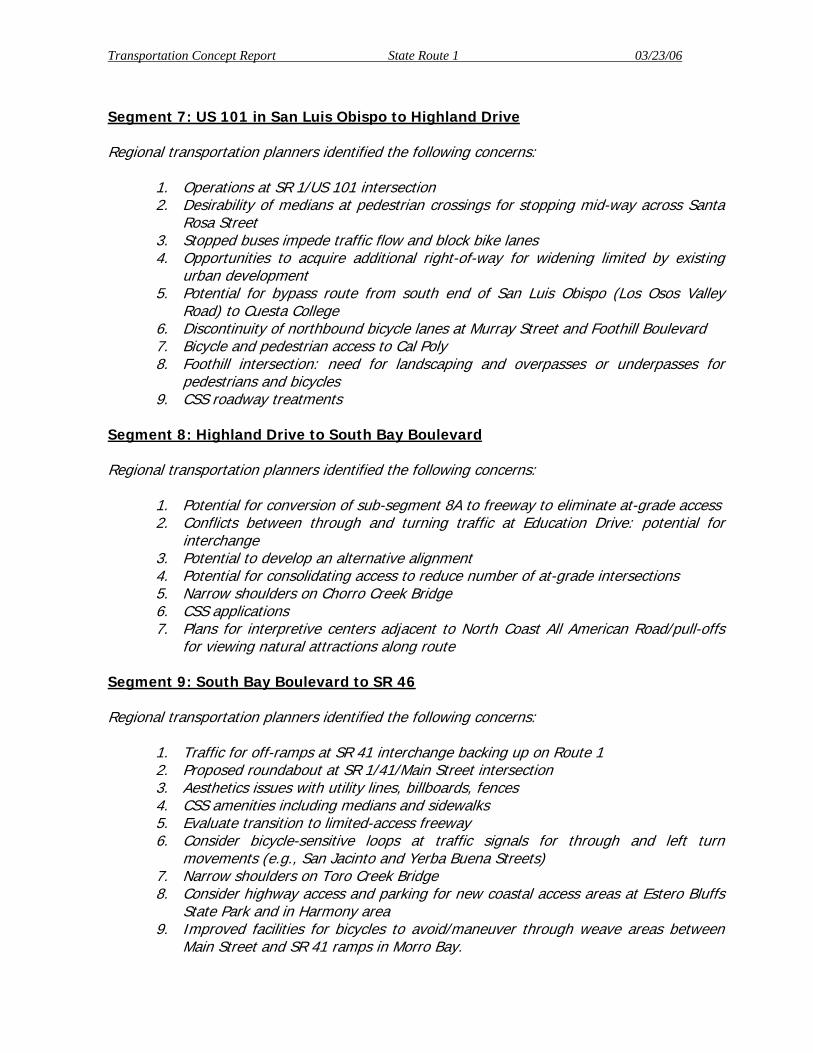
Transportation Concept Report State Route 1 03/23/06
Segment 7: US 101 in San Luis Obispo to Highland Drive
Regional transportation planners identified the following concerns:
1. Operations at SR 1/US 101 intersection2. Desirability of medians at pedestrian crossings for stopping mid-way across Santa
Rosa Street3. Stopped buses impede traffic flow and block bike lanes4. Opportunities to acquire additional right-of-way for widening limited by existing
urban development5. Potential for bypass route from south end of San Luis Obispo (Los Osos Valley
Road) to Cuesta College6. Discontinuity of northbound bicycle lanes at Murray Street and Foothill Boulevard7. Bicycle and pedestrian access to Cal Poly8. Foothill intersection: need for landscaping and overpasses or underpasses for
pedestrians and bicycles9. CSS roadway treatments
Segment 8: Highland Drive to South Bay Boulevard
Regional transportation planners identified the following concerns:
1. Potential for conversion of sub-segment 8A to freeway to eliminate at-grade access2. Conflicts between through and turning traffic at Education Drive: potential for
interchange3. Potential to develop an alternative alignment4. Potential for consolidating access to reduce number of at-grade intersections5. Narrow shoulders on Chorro Creek Bridge6. CSS applications7. Plans for interpretive centers adjacent to North Coast All American Road/pull-offs
for viewing natural attractions along route
Segment 9: South Bay Boulevard to SR 46
Regional transportation planners identified the following concerns:
1. Traffic for off-ramps at SR 41 interchange backing up on Route 12. Proposed roundabout at SR 1/41/Main Street intersection3. Aesthetics issues with utility lines, billboards, fences4. CSS amenities including medians and sidewalks5. Evaluate transition to limited-access freeway6. Consider bicycle-sensitive loops at traffic signals for through and left turn
movements (e.g., San Jacinto and Yerba Buena Streets)7. Narrow shoulders on Toro Creek Bridge8. Consider highway access and parking for new coastal access areas at Estero Bluffs
State Park and in Harmony area9. Improved facilities for bicycles to avoid/maneuver through weave areas between
Main Street and SR 41 ramps in Morro Bay.

Transportation Concept Report State Route 1 03/23/06
10. Exiting traffic back-ups at SR 41 related to slow clearing I/C at SR 41, Main Streetand Route 1 ramps
11. Plans for Class I bikeway parallel to sub-segment 9B12. Possible need for longer NB left-turn pocket at 24th Street exit in Cayucos
Segment 10: SR 46 to San Carpoforo Creek
Regional transportation planners identified the following concerns:
1. Parallel cross-town bike and pedestrian trail in Cambria Flood control project2. Consider bicycle-sensitive loops at traffic signals for through and left turn
movements (e.g., Windsor Boulevard)3. Bike/pedestrian trail in San Simeon4. CSS amenities including medians and sidewalks5. San Simeon Acres: Main Street America/ Access under bridge/improved
landscaping6. Transit use7. Potential development of Hearst Ranch lands8. Address highway access and parking for coastal areas along Hearst Ranch coastline9. Need standard shoulder widths for bicycling10. Need paved shoulders free of weeds, sand, and gravel for bicycling11. Safe access to off-road attractions: elephant seal colony and Piedras Blancas
Lighthouse12. Realignment of road to east away from surf13. Additional pedestrian and bicycle paths where roadway abandoned for new
alignment
Segment 11: San Carpoforo Creek to San Luis Obispo/ Monterey County Line
Stakeholders in the Coast Highway Management Plan process identified the following concernsregarding Segments 12 and 13:
1. Safety, related to landslides; highway repair and maintenance activities; pedestrianand bicycle access; and access to turnouts, vista points, pullouts and roadsideparking opportunities
2. Unstable cut slopes along route: erosion and potential for slides and rock falls3. Importance of keeping the highway open: clearing slide materials and repairing
storm damage as quickly and efficiently as possible4. Effects of slow-moving visitor-driven vehicles, bicyclists, and pedestrians on traffic
flow5. Narrow travel lanes and narrow or absent paved shoulders6. Spread of invasive exotic plant species7. Aesthetics: minimizing introduction of new man-made elements in the viewshed,
including Caltrans’ construction work and equipment as well as structures visiblefrom the highway
8. Facilities for use, comfort, and safety of travelers: turnouts, vista points, pullouts,paved shoulders of adequate width for use by bicyclists
9. Provide adequate measures for bicyclists during maintenance and reconstructionwork. Incident related by stakeholder: The signal controlling access to one-way

Transportation Concept Report State Route 1 03/23/06
traffic lane did not provide adequate time for southbound cyclist to ride throughbefore northbound traffic entered the lane.
10. Highway access and parking for coastal access at mouth of San Carpoforo Creek.
MONTEREY COUNTYSegment 12: San Luis Obispo/Monterey County Line to Malpaso Creek Bridge, andSegment 13: Malpaso Creek Bridge to Carmel River Bridge
Stakeholders in the Coast Highway Management Plan process identified the following concernsregarding Segments 12 and 13:
1. Safety, related to landslides; highway repair and maintenance activities; pedestrianand bicycle access; and access to turnouts, vista points, pullouts and roadsideparking opportunities
2. Unstable cut slopes along route: erosion and potential for slides and rock falls3. Importance of keeping the highway open: clearing slide materials and repairing
storm damage as quickly and efficiently as possible4. Effects of slow-moving visitor-driven vehicles, bicyclists, and pedestrians on traffic
flow5. Narrow travel lanes and narrow or absent paved shoulders6. Spread of invasive exotic plant species7. Aesthetics: minimizing introduction of new man-made elements in the viewshed,
including Caltrans’ construction work and equipment as well as structures visiblefrom the highway
8. Facilities for use, comfort, and safety of travelers: turnouts, vista points, pullouts,paved shoulders of adequate width for use by bicyclists
9. Additional roadside parking near Salmon Creek, Soda Spring, Cruickshank, NorthPrewitt, and Kirk Creek trailheads and Nathaniel Owings Memorial Redwood Grove
Segment 14: Carmel River Bridge to SR 156
1. Intense local and regional traffic in addition to through traffic bound for Big SurCoast and recreational attractions
2. Long waits for turns at intersections with Rio and Carmel Valley Roads3. Stretches where visual character dominated by large trees and ornamental
plantings4. High rate of rear-end collisions along northbound uphill stretch north of Rio Road5. High level of controversy between Carmel residents who oppose widening in
existing alignment and preferred now-abandoned plans for Hatton Canyon Bypassand environmental community that opposed Bypass
Segment 15: SR 156 to Monterey/Santa Cruz County Line
1. Coastal Act policies supporting widening or realignment only as last resort2. Environmentally sensitive habitat areas3. Evaluate proposed improved intersections with Route 1 to avoid growth
inducement/traffic inducement4. Preference for addressing congestion with alternative modes of transportation

Transportation Concept Report State Route 1 03/23/06
5. Effects of widening on endangered Santa Cruz long-toed salamander: habitatfragmentation, infringement on breeding sites and increased road kill
6. Provision of recreational support facilities such as parking and access roads fromhighway
7. Areas to accommodate bicycle users/completion of trail system8. Rural character of highway: minimizing urban-type improvements9. Congestion/turning movements at Salinas Road10. Option to reroute Route 1 to railroad alignment11. Option to improve G-12 as an alternate route for some trips12. Caltrain access at Pajaro13. Upgrade other routes to carry traffic from US 101 to Santa Cruz while avoiding
Segment 1514. Evaluate entire system of state and local roads between Route 1 and US 101 in
Castroville/Pajaro/Watsonville area to avoid impacts to rural character of coastalarea
15. Heavy congestion during major events/festivals in Monterey or Santa Cruz Counties16. Segment congestion: a two-county issue
SANTA CRUZ COUNTYNote: A public meeting held October 22, 2003 at Watsonville High School in the City of
Watsonville generated comments regarding a wide range of regional transportationissues on State Route 1 and nearby facilities in Santa Cruz and Monterey Counties.
Segment 16: Monterey/Santa Cruz County Line to Larkin Valley Road
1. Segment congestion: a two-county issue2. Heavy traffic at Riverside Road (SR 129) interchange since opening of school west
of Route 13. Environmental sensitivity4. Noise and air quality impacts to humans and wildlife if highway widened5. Need for highway access at Green Valley Road6. Freeway ramp congestion spilling over to local road system7. Purchase of parallel branch rail line for modal alternative to highway travel8. Caltrain access at Pajaro
Segment 17: Larkin Valley Road to SR 17
1. Widening to 6 lanes needed2. Need for forward signing to indicate incident/congestion in vicinity of Freedom
Boulevard interchange3. Freeway ramp congestion spilling over to local road system4. Access to Cabrillo College5. Purchase of parallel branch rail line for modal alternative to highway travel6. Plan for intermodal facilities for access to future parallel passenger rail by bicycle,
bus, automobile7. Heavy congestion from SR 1/SR 17 interchange and south for several miles8. Large trucks on the highway between 6-9:00 a.m. and between 5-7:00 p.m.
Reroute trucks or provide separate truck lane

Transportation Concept Report State Route 1 03/23/06
9. Consider a handicapped-accessible PRT system for cost, efficiency, and congestionrelief
10. Increased noise levels and emissions if highway widened11. Potential impacts to Santa Cruz long-toed salamander if highway widened
Segment 18: SR 17 to Santa Cruz North Urban Limit
1. UCSC-related traffic2. Mix of local, regional and interregional (tourist) traffic3. Non-standard intersections and sharp turns on route4. Uncontrolled access: multiple residential driveways and parking lot entries to strip
commercial and office uses
Segment 19: Santa Cruz North Urban Limit to Santa Cruz/San Mateo County Line
1. Non-standard lane and shoulder widths2. Improve and manage public access to coastal areas for recreational use (adequate
parking)3. Need for channelization for turns4. Inadequate shoulder widths for bicycles

Transportation Concept Report State Route 1 03/23/06
APPENDIX D: Programmed and Planned Projects

MAJOR PROJECTS FOR STATE ROUTE 1(STIP Projects and Additional Constrained and Unconstrained Projects Shown in RTPs)
County Location(Postmiles) EA Project
Programmed Projects
Mon 72.3/75.2 101-0000-0236 Construct additional climbing lane; modify intersection; enhance turnmovements (oversight)
Mon 100.4/R101.5 0032G Widen to four-lane freeway and construct new interchange at Salinas RoadSCr 2.3/2.5 44130K Reconstruct Harkins Slough interchangeSCr 15.8/17.6 129101 Construct northbound and southbound merge lanes
Additional Financially Constrained Projects (shown in Regional Transportation Plans)SLO Rural South County Widen to provide 8-foot shouldersSLO Halcyon (north) Construct new bridge; realign intersection to eliminate offsetSLO San Luis Obispo Evaluate improving operations and/or widening Santa RosaSLO SR 41 Modify intersectionSLO Harmony Grade Construct passing lanes and turn channelization as warrantedSLO Cambria Drive Install traffic signalSLO Piedras Blancas Realign highwayMon Various ITS: CMS, CCTV cameras, HAR, ramp metering, loop detectorsMon Big Sur: Pitkin’s Curve Realign curveMon Sand City Corridor Widen highway from Fremont Avenue to Canyon Del Rey or beyondSCr Soquel to Morrissey Construct Auxiliary LanesSCr Soquel to Morrissey Environmental Review for Widening/HOV lanes
SCr Park-Bay, 41st -Soquel, Soquel-Morrissey, State Park-Park Construct auxiliary lanes
SCr San Lorenzo Bridge Widen bridge
SCr North Coast Construct paved pull out and parking area and left-turn channelization, widenshoulders

MAJOR PROJECTS FOR STATE ROUTE 1, cont’d
Additional Projects without Funding (shown in Regional Transportation Plans)
SB Clark Avenue to SR 166 Widen travel lanes and shouldersSB Santa Maria River (Guadalupe) Widen bridge; provide Class II bike lanes
Mon Carmel River Bridge to CarpenterStreet
Construct two additional lanes with at-grade or grade-separated interchangeimprovements
Mon SR 68 west Improve interchangeMon Seaside: Monterey Road Construct new interchange between Fremont and Lightfighter DriveMon Imjin Parkway Construct new interchangeMon Reservation Road Install new traffic signals at rampsMon SR 156 Construct ramp connectors at interchange
Mon Espinosa Road Construct new interchange with to-be-constructed Espinosa Expressway (onnew alignment)
Mon Merritt Street-Artichoke Avenue Improve interchange/intersection – Phases I and IIMon Moss Landing Widen to four lanes
SCr Park-Bay, 41st -Soquel, Soquel-Morrissey, State Park-Park Construct auxiliary lanes
SCr Various interchanges Modify interchange ramps to accommodate future widening alternatives