transportation & infrastructure finance · the highway trust fund, created by congress in 1956...
TRANSCRIPT
TRANSPORTATION & INFRASTRUCTURE FINANCE
a csg national report
by Sean Slone


1
TRANSPORTATION & INFRASTRUCTURE FINANCE
a csg national report
by Sean Slone
Introduction ................................................................................2
Chapter 1— Defining the Problem ...........................................................4
Chapter 2— Fuel Taxes .....................................................................................8
Chapter 3— Vehicle Fees ............................................................................. 12
Chapter 4— Other Tax & Fee Mechanisms ........................................ 16
Chapter 5— Debt Financing to Reduce Project Development Costs ............................................................ 18
Chapter 6— State Infrastructure Banks ................................................20
Chapter 7— Alternative Transportation Funding Mechanisms.........................................................22
Chapter 8— Assessing Funding Mechanisms & Implementing Them ..........................................................36
tab
le o
f co
nte
nts
2 3
In the summer of 2008, Kansas Gov. Kathleen Sebelius announced she was creating a
transportation task force. In doing so, she was facing a political reality of the present,
while trying to look toward her state’s future.
INTRODUCTION
“With current fuel prices at all-time highs, I can-not support any increase in motor fuel taxes and ask that the task force look to other approaches,” Sebelius said in her charge to the task force. “The state will be best served if the task force reviews a range of transportation investment scenarios and considers approaches that could be implemented in stages if necessary.”1
Sebelius told the 30-member task force to look at new financing methods including user fees, the creation of transportation development districts, and the leveraging of federal, state and local fund-ing.1 The idea of expanded tolling was mentioned as a possibility as well, though some questions ex-isted as to whether the state had too many alternate routes available that would allow drivers to avoid paying the tolls.2 The state has only one toll road—the Kansas Turnpike.3
Besides holding public meetings around the state, the task force is soliciting public opinion in a more unique way. A task force Web site has a calculator that allows users to develop their own transporta-tion program and determine its costs and funding options.1
Both the state’s current $13 billion, 10-year trans-portation program and its predecessor relied on in-creasing motor fuels and sales taxes and borrowing.1
The task force, Transportation-Leveraging In-vestments in Kansas (T-LINK for short), will de-velop a set of recommendations for the new trans-portation program. Sebelius asked members that their recommendations be shaped by the following priorities:
A commitment to keeping roads and bridges fsafe and in good repair;
A collaborative project selection process that faligns Kansas’ transportation investments with the state’s economic priorities; and
A new approach that reflects today’s fiscal re- falities, but also creates a framework to prepare Kansas for the future.4
Kansas’ Long Range Transportation Plan, re-leased in June, noted that the state will need $2.9 billion a year for the next 20 years to meet its fu-ture transportation needs. But the state is only ex-pected to take in about $1.4 billion a year in state, federal and local revenues to fund transportation under current revenue conditions.
The long-range plan identified the following prin-ciples to analyze potential funding approaches:
Adequacy f —Will the mechanism generate sub-stantial funding?
Stability f —Will the revenue stream it produces be stable and reliable?
Efficiency f —Is the ratio of administrative costs to revenues low?
Fairness f —Do the system’s users compensate the system in proportion to their use of it, and in proportion to their contribution to its need for maintenance or replacement?
Equity f —Is the mechanism even-handed to all income groups and residents of all geographic areas?

2 3
Inflation-Neutral f —Will the mechanism pro-duce revenues that increase along with or faster than the growth in construction costs?
Diversification f —Does the mechanism help ex-pand and diversify the sources of state transpor-tation funding?
Viability f —What legal, institutional, political or other types of barriers could stand in the way of implementation? How hard will it be to over-come them?3
Kansas is not alone in considering these issues. Most states have begun to look at and even imple-ment innovative ways to fund transportation. Their efforts come with the realizations that raising fuel taxes is politically difficult and that the future rev-enue yield from existing funding sources will be inadequate to maintain the nation’s existing trans-portation systems and to increase capacity for the future.
This report examines the transportation funding issues states are faced with, the finance options available to them, and how states can decide which options best fit into their transportation plans. It draws on the work of two federal commissions created by Congress—the National Surface Trans-portation Infrastructure Financing Commission and the National Surface Transportation Policy and Revenue Study Commission—as well as the research and assessment of numerous other trans-portation, law and tax policy analysts, expert pan-els, and state and federal officials.
Most states have begun to look at and even implement innovative ways to fund transportation. Their efforts
come with the realizations that raising fuel taxes is politically difficult and that the future revenue yield from existing funding sources will be inadequate to
maintain the nation’s existing transportation systems and to increase capacity for the future.

4 5
America’s infrastructure is aging and needs rehabilitation. The American Society of Civil
Engineers graded the nation’s infrastructure in 2005 and found deteriorating conditions
approaching dangerous levels of disrepair, with needs outpacing allocated funds.
ChAPTER 1: DEFINING ThE PROBLEM
They estimate that $1.6 trillion is needed over a five-year period to bring the nation’s roads to good condition.5 Some 13,000 Americans die each year on the nation’s highways due to inadequate road-way maintenance.6 Moreover, the Government Ac-countability Office in 2008 concluded in a report that the federal bridge program “is not sustainable given the anticipated deterioration of the nation’s bridges and the declining purchasing power of funding currently available.”7
At the same time, traffic congestion is clogging the nation’s roadways, making travel for business or pleasure a chore, and pointing to the need for ex-panded roads and additional transportation options. The number of vehicle miles traveled per capita by Americans in 2006 was more than 10,000,8 twice that of many European countries.9 The Texas Trans-portation Institute estimates that congestion around urban areas costs the nation more than $78 billion annually, not to mention more than 4 billion hours lost to delays and nearly 3 billion gallons of wasted fuel.10 U.S. city officials rank traffic congestion as the fastest deteriorating condition in America’s cit-ies, ahead of education and health care.11
Unfortunately, finding the money to improve and expand the transportation system is a significant challenge facing state governments.
“Maintenance costs of existing transportation as-sets are competing for the same funds needed to expand our transportation system,” Mark Florian, the head of Infrastructure Banking for Goldman Sachs, told a Congressional committee in June 2008. “Many states do not have sufficient funds to maintain their roads, much less add needed capac-
ity.”12
In addition, numerous 21st century factors have exposed flaws in the way the U.S. funds transportation.
The Highway Trust Fund, created by Congress in 1956 to provide a dedicated source of federal funding for highways, relies on receipts from fed-eral excise taxes on motor fuels and truck-related taxes.13 But the federal gas tax has not been raised in more than 10 years and investment in trans-portation has not grown as quickly as the nation’s transportation needs over the last three decades. The buying power of fuel taxes has been eroded by inflation and Americans are paying less fuel taxes due both to fuel efficiency improvements on automobiles and cutbacks on driving as gas prices have increased in recent years. And as the National Surface Transportation Infrastructure Financing Commission pointed out in its 2008 interim report, “increasing mobility, a greatly expanded economy and population, regional transportation challeng-es, and inflation in the costs of construction have rendered the current levels of the (Highway Trust Fund) taxes grossly inadequate for funding even the maintenance, much less the improvement, of the system.”14
The commission’s report also observed that cur-rent funding mechanisms and levels of revenue are not closely linked to actual use of the transporta-tion system, which has allowed demand and costs to grow faster than revenue. Individual drivers pay only about 3 cents in tax revenue per each vehicle mile traveled. The actual costs of using a highway during congested conditions are on average 10 to

4 5
29 cents per vehicle mile traveled.12
Moreover, the commission points out that the weak link between driving and fees paid primar-ily in fuel and vehicle taxes does little to promote efficient use of the transportation system. More directly linked funding mechanisms such as toll-ing, congestion pricing and fees for vehicle miles traveled may be more effective in this regard.12 These mechanisms are explored in detail later in this report.
Some also worry that decisions about transporta-tion projects are being made unwisely.
“We are choosing the wrong projects to build,” said Everett Ehrlich, who served as the executive director of the Center for Strategic and International Studies’ Commission on Public Infrastructure. As he told members of Congress in June, “(The high-way program) turns money over to states and tells them that whatever they pick will be funded by the feds using a predetermined percentage … That is not infrastructure policy. That is revenue sharing.”
Ehrlich said while that may have been a good system for building the national highway system, that job was completed more than 30 years ago.
“Today, the same selection process means that we favor new road construction over non-struc-tural solutions, whether they mean variable speed limits, flexible traffic flow patterns, or congestion fees,” he said.15
It also means that while some carefully chosen congressional districts receive earmarks for pet proj-ects, others are left without the funds to maintain the existing transportation infrastructure. The $286 mil-lion 2005 transportation authorization bill known as SAFETEA-LU is a case in point, critics contend.16
“The term ‘earmark’ would not be in the public vocabulary today, were it not for the last transporta-tion bill and its bridge to nowhere,” Ehrlich said.13
As the members of the National Surface Trans-portation Infrastructure Finance Commission stated in their interim report, “we need not only more investment in our system, but more intelli-gent investment complemented by better operation of the system.”
Of course, in addition to getting people from point A to point B, America’s transportation sys-tem is also responsible for the movement of goods all around the country.
“Our transportation system is the backbone of our economy,” Pete Ruane, the president of the American Road and Transportation Builders Asso-
“Our transportation system is the backbone
of our economy. It undergirds everything we do economically in our national productivity.
And we’re dealing with major competitive issues
as other nations are investing more in infrastructure.”
—Pete Ruanepresident, American Road and Transportation Builders Association
6 7
State Total Highway Transit Air Water
Alabama ........................................................... $ 1,032 $ 867 $ 7 $ 71 $ 87Alaska ................................................................. 329 174 5 107 43Arizona .............................................................. 1,264 923 39 302 ZArkansas ........................................................... 699 659 2 37 1California .......................................................... 11,534 7,046 1,603 1,799 1,087
Colorado ........................................................... 1,647 981 74 591 ZConnecticut ................................................... 839 769 36 33 1Delaware .......................................................... 393 349 10 6 28Florida ................................................................ 7,149 5,195 208 1,403 343Georgia .............................................................. 2,058 1,290 114 506 149
Hawaii ................................................................ 722 368 44 228 81Idaho ................................................................... 393 360 1 30 1Illinois ................................................................. 5,479 3,993 740 729 17Indiana ............................................................... 1,499 1,343 29 121 6Iowa ..................................................................... 943 878 16 49 <0.5
Kansas ................................................................ 737 705 3 29 ZKentucky .......................................................... 936 746 15 159 16Louisiana .......................................................... 1,046 779 43 119 105Maine .................................................................. 472 442 1 27 2Maryland .......................................................... 2,047 1,691 126 135 95
Massachusetts .............................................. 2,442 1,496 459 423 64Michigan .......................................................... 2,641 2,198 59 384 <0.5Minnesota ....................................................... 1,648 1,322 11 275 39Mississippi ....................................................... 653 581 2 29 42Missouri ............................................................ 1,389 1,079 50 257 2
Montana ........................................................... 411 384 1 26 ZNebraska .......................................................... 513 441 6 66 ZNevada .............................................................. 1,015 663 49 304 ZNew Hampshire .......................................... 361 315 4 42 ZNew Jersey ...................................................... 2,830 2,164 631 13 22
New Mexico ................................................... 476 403 4 68 ZNew York .......................................................... 10,382 4,184 4,050 1,987 161North Carolina .............................................. 2,285 1,967 35 248 35North Dakota ................................................ 197 183 1 13 ZOhio ..................................................................... 3,296 2,881 98 296 20
Oklahoma ........................................................ 1,293 1,202 5 82 4Oregon .............................................................. 1,323 941 97 207 78Pennsylvania ................................................. 4,509 3,544 459 498 8Rhode Island.................................................. 289 201 28 60 <0.5South Carolina ............................................. 969 737 13 80 138
South Dakota ................................................ 213 202 1 10 ZTennessee ........................................................ 1,548 1,284 27 234 3Texas.................................................................... 6,697 5,278 151 1,052 217Utah ..................................................................... 708 507 18 183 ZVermont ............................................................ 173 157 3 13 Z
Virginia .............................................................. 2,533 1,641 71 598 224Washington .................................................... 2,424 1,543 206 410 265West Virginia .................................................. 511 489 5 17 ZWisconsin ........................................................ 1,613 1,445 60 103 6Wyoming ......................................................... 158 145 <0.5 13 Z
District of Columbia ................................. 732 69 663 Z Z
United States, total ......................... $97,449 $69,203 $10,383 $14,471 $3,393
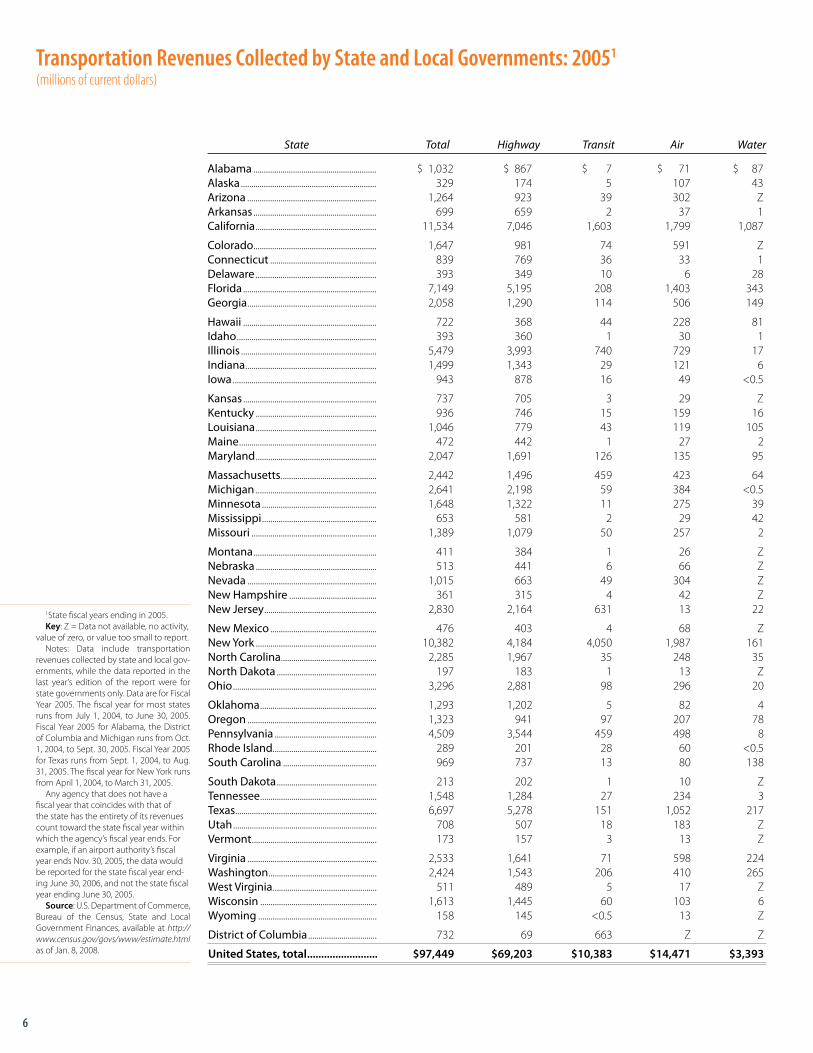
Transportation Revenues Collected by State and Local Governments: 20051 (millions of current dollars)
1State fiscal years ending in 2005.Key: Z = Data not available, no activity,
value of zero, or value too small to report.Notes: Data include transportation
revenues collected by state and local gov-ernments, while the data reported in the last year’s edition of the report were for state governments only. Data are for Fiscal Year 2005. The fiscal year for most states runs from July 1, 2004, to June 30, 2005. Fiscal Year 2005 for Alabama, the District of Columbia and Michigan runs from Oct. 1, 2004, to Sept. 30, 2005. Fiscal Year 2005 for Texas runs from Sept. 1, 2004, to Aug. 31, 2005. The fiscal year for New York runs from April 1, 2004, to March 31, 2005.
Any agency that does not have a fiscal year that coincides with that of the state has the entirety of its revenues count toward the state fiscal year within which the agency’s fiscal year ends. For example, if an airport authority’s fiscal year ends Nov. 30, 2005, the data would be reported for the state fiscal year end-ing June 30, 2006, and not the state fiscal year ending June 30, 2005.
Source: U.S. Department of Commerce, Bureau of the Census, State and Local Government Finances, available at http://www.census.gov/govs/www/estimate.html as of Jan. 8, 2008.

6 7
$0
$50
$100
$150
$200
$250
$300
$350
$400
2007 2008 2009 2010 2011 2012 2013 2014 2015 2016 2017
Billio
ns of
Year
-of-E
xpen
ditur
es D
ollar
s
Cost to Improve Cost to Maintain Total Revenues
The Projected Funding Gap
ciation, told Environment and Energy TV in 2008. “It undergirds everything we do economically in our national productivity. And we’re dealing with major competitive issues as other nations are in-vesting more in infrastructure.”
Ruane cites increased infrastructure investment in China, India and the European Union.
“Even Vietnam has plans for a high-speed pas-
senger rail system,” Ruane said.17
Analysts believe one key to enhancing American competitiveness is integrating the U.S. transpor-tation system with those of Canada and Mexico to form one North American system and market. That will take a huge infusion of capital and a vi-sion for the future.
Source: Future Financing Options to Meet Highway and Transit Needs, NCHRP Web-Only Document 102, National Cooperative Highway Research Program, Transportation Research Board of the National Academies, Submitted December 2006, 2–5, A–10.
8 9
About 82 percent of federal funds for transportation come from federal fuel taxes. At
the state level, 38 percent of revenues for highways come from state fuel taxes.18
ChAPTER 2: FUEL TAXES
While the federal gas tax has not been raised since 1997, at least 15 states have increased their gas taxes over the last 12 years. But most observers believe that if gas prices return to the levels seen in 2008, lawmakers will have considerable difficulty raising either tax in the future.10 Raising the fuel tax could generate an estimated $1.9 billion nation-ally for each 1 cent increase.19
As Rudolph Penner of the Urban Institute told Congress in 2008, “it is generally agreed that the current rate of (federal) tax of 18.4 cents per gallon is not sufficient to finance conservatively estimat-ed investment needs or to cover the spending levels authorized in 2005.”20
And as Goldman Sachs’ Florian said, “the fuel tax … has served our country well since 1956. Nevertheless, this source of funds is no longer sufficient to meet the large and growing needs for transportation infrastructure development in the United States.”10
Many believe indexing the gas tax to some agreed-upon measure such as the Consumer Price Index could better account for inflation. Simple inflation as measured by the CPI would have in-creased gas taxes to $2.94 per gallon today.10 Yet Americans pay only 18 cents per gallon in federal
gas tax and on average 31 cents per gallon in state fuel taxes.21
But Florian also points out that the cost of labor and construction materials for road projects has ac-celerated even more quickly than the CPI. So index-ing the tax to a measure of construction cost might be even more accurate.10 Others say converting to a gasoline sales tax could help in this regard.17
The National Surface Transportation Policy and Revenue Study Commission pointed out in its fi-nal report that fuel taxes have been the revenue generator of choice at both the state and federal level for a number of reasons. Public acceptance of this mechanism, its ability to raise considerable revenues, relative stability and predictability, ease of implementation and its low administrative and compliance costs are among its advantages.17
“I suspect that the (political) resistance is less than with other taxes because taxpayers have a better idea what they are getting for their money,” Penner said.
Yet many believe that linking user payments even more closely to actual road use with such instru-ments as tolls, congestion fees and vehicle miles traveled charges would make more sense and have even greater public support.

8 9

10 11
Liquefied State Gasoline Diesel petroleum gas Gasohol
Alabama ........................................................... 18.00 19.00 17.00 18.00Alaska ................................................................. 8.00 8.00 0.00 8.00Arizona .............................................................. 18.00 26.00 18.00 18.00Arkansas ........................................................... 21.70 22.70 16.50 21.70California .......................................................... 18.00 18.00 6.00 18.00
Colorado ........................................................... 22.00 20.50 20.50 22.00Connecticut ................................................... 25.00 26.00 0.00 25.00Delaware .......................................................... 23.00 22.00 22.00 23.00Florida ................................................................ 15.30 15.30 14.50 15.30Georgia .............................................................. 7.50 7.50 7.50 7.50
Hawaii ................................................................ 16.00 16.00 8.10 16.00Idaho ................................................................... 25.00 25.00 18.10 22.50Illinois ................................................................. 19.00 21.50 19.00 19.00Indiana ............................................................... 18.00 16.00 0.00 18.00Iowa ..................................................................... 21.00 22.50 20.00 19.00
Kansas ................................................................ 24.00 26.00 23.00 24.00Kentucky .......................................................... 19.70 16.70 19.70 19.70Louisiana .......................................................... 20.00 20.00 16.00 20.00Maine .................................................................. 26.80 27.90 0.00 17.80Maryland .......................................................... 23.50 24.25 24.25 23.50
Massachusetts .............................................. 21.00 21.00 23.90 21.00Michigan .......................................................... 19.00 15.00 15.00 0.00Minnesota ....................................................... 20.00 20.00 15.00 20.00Mississippi ....................................................... 18.40 18.40 17.00 18.40Missouri ............................................................ 17.00 17.00 17.00 17.00
Montana ........................................................... 27.75 27.75 0.00 27.75Nebraska .......................................................... 27.10 27.10 26.10 27.10Nevada .............................................................. 24.80 27.70 22.00 24.80New Hampshire ................................... 19.50 19.50 0.00 0.00New Jersey ...................................................... 10.50 13.50 5.25 10.50
New Mexico ................................................... 18.88 22.88 12.00 18.88New York .......................................................... 24.65 22.85 8.05 0.00North Carolina .............................................. 30.15 30.15 27.10 30.15North Dakota ................................................ 23.00 23.00 23.00 23.00Ohio ..................................................................... 28.00 28.00 28.00 28.00
Oklahoma ........................................................ 17.00 14.00 17.00 17.00Oregon .............................................................. 24.00 24.00 18.50 24.00Pennsylvania ................................................. 30.00 38.10 22.80 31.20Rhode Island.................................................. 30.00 30.00 30.00 30.00South Carolina ............................................. 16.00 16.00 0.00 16.00
South Dakota ................................................ 22.00 22.00 20.00 20.00Tennessee ........................................................ 21.40 18.40 14.00 20.00Texas.................................................................... 20.00 20.00 15.00 20.00Utah ..................................................................... 24.50 24.50 24.50 24.50Vermont ............................................................ 20.00 26.00 0.00 20.00
Virginia .............................................................. 17.50 16.00 16.00 17.50Washington .................................................... 34.00 34.00 34.00 34.00West Virginia .................................................. 31.50 31.50 27.00 31.50Wisconsin ........................................................ 30.90 30.90 22.60 30.90Wyoming ......................................................... 14.00 14.00 14.00 14.00
District of Columbia ................................. 20.00 20.00 20.00 20.00
Federal tax ...................................................... 18.40 24.40 13.60 13.20
State Motor-Fuel Tax Rates: 2006(cents per gallon)
1Tax rates for gasoline blended with 10 percent ethanol.
Notes: Tax rates in effect as of Jan. 1, 2006. The following states have tax rates changed as of Jan. 1, 2007: gasoline: Flori-da, and New York; diesel: Florida, New York and West Virginia; liquefied petroleum gas: Massachusetts; gasohol: Florida and West Virginia. The tax rates for Nebraska for diesel and gasohol are effective as of July 1, 2007.
Source: U.S. Department of Transpor-tation, Federal Highway Administration, Highway Statistics 2006, Washington, D.C.: 2008, Table MF-121T.
10 11
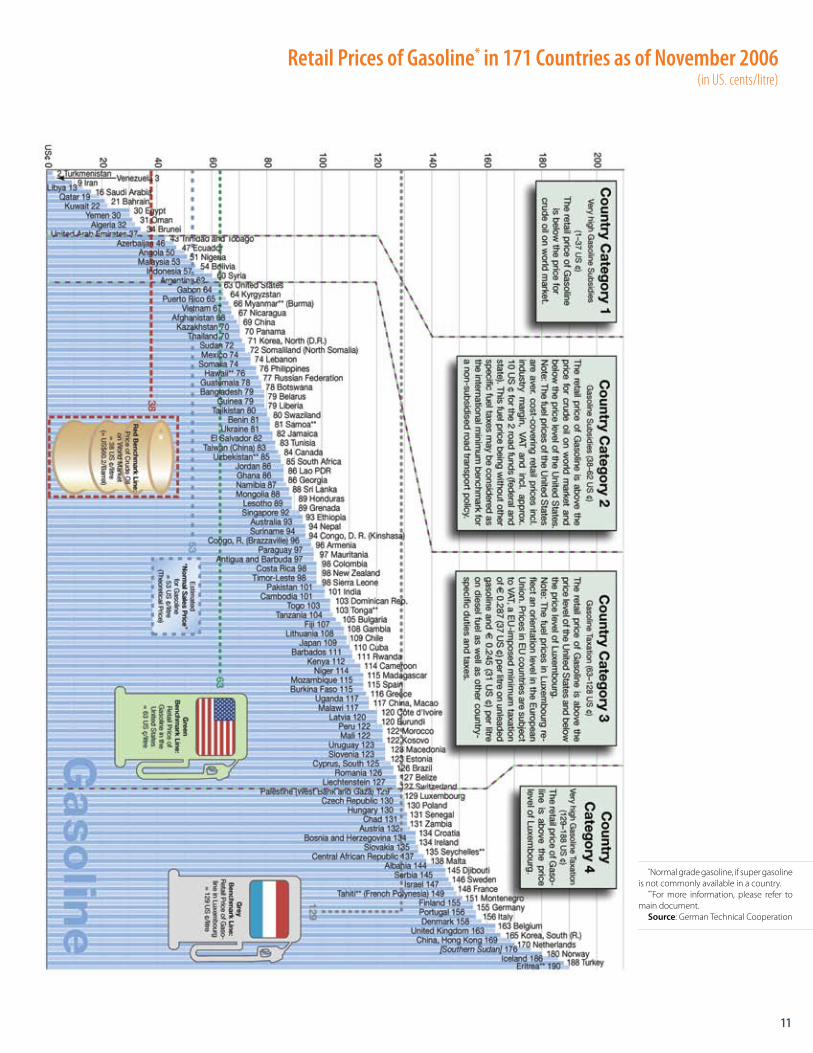
Retail Prices of Gasoline* in 171 Countries as of November 2006(in US. cents/litre)
*Normal grade gasoline, if super gasoline is not commonly available in a country.
**For more information, please refer to main document.
Source: German Technical Cooperation
12 13
Idaho’s transportation system is faced with a common problem. The state needs at
least $200 million more annually to build and maintain its roads. But many of the op-
tions for raising that revenue don’t seem palatable for a citizenry that already feels over-
burdened with taxes and fees.
ChAPTER 3: VEhICLE FEES
In early 2008, Idaho Gov. C.L. “Butch” Otter of-fered a plan to address the situation and raise $202 million. The governor wanted to raise registration fees on passenger vehicles from the current $24 to $48 range to a flat rate of $150 and establish a rental car tax of 4 percent a day. Another proposal from two state senators would have reassessed registration fees for trucks and brought in an ad-ditional $50 million. To explain his support for the increased registration fees, the governor cited polling data that showed opposition to an increase in the state’s gas tax. Seventy-two percent of Ida-hoans were opposed, while 58 percent supported increased registration fees.22
But the governor was forced to withdraw his proposal to raise vehicle registration fees after the plan received a critical reception from the public and legislators. A proposal offered by members of the state House of Representatives that would have raised only about $68 million prompted the gov-ernor to remark, “you might as well just get out of town.” Idaho’s legislative session ended without lawmakers addressing the $200 million annual shortfall.23
Observers concluded at the end of the session that an increase across multiple revenue sources is more likely to win favor from the public than one that hits one source or one particular group harder than others.24
But states are clearly looking to vehicle registra-tion fees and other highway user taxes to be a part of their revenue equation.
All states have registration fees for light vehicles and somewhat higher and graduated fees for heavy vehicles. These fees are relatively inexpensive to administer in relation to potential yield, can be var-ied by vehicle size, and can be set in rough relation to highway cost responsibility. The Transportation Research Board’s National Cooperative Highway Research Program categorizes registration fee ad-justments as “very promising” as both a short- and long-term option for funding highways. Perhaps most importantly in light of the growing popular-ity of hybrid and other fuel-saving vehicles, reg-istration fees allow for collections from vehicles using alternative fuels without establishing new mechanisms for collection.25
In its interim report, the National Surface Trans-portation Infrastructure Financing Commission identified vehicle registration, heavy vehicle user taxes, sales taxes, and tire taxes as potential trans-portation funding mechanisms.12
Heavy-truck fees are imposed at the federal and state level on trucks with five or more axles and weighing between 50,000 and 100,000 pounds. These taxes are imposed primarily through a fed-eral tax on diesel fuels and state registration fees based on truck weight. Oregon and New York are among the states that impose a fee based on the weight of the vehicle and the distance traveled in the state. The goal of these efforts is to tie fees more closely to actual costs imposed on the sys-tem. Heavy trucks currently pay about 6 cents per mile in federal and state fees, though the actual
12 13

14 15
$1.4 $6.5 $3.8 $31.9
$6.6 $8.6 $7.6 $70.0
$8.9 $11.6 $10.1 $94.3
$1.8 $6.4 $4.0 $33.4
$6.2 $8.4 $7.2 $66.6
$9.0 $12.0 $10.5 $108.8
$0.2 $2.4 $1.1 $8.9
Index state motor fuel taxes
Increase state motor fuel taxes to catch up for inflation losses since 2000
Implement motor fuel sales taxes
Raise motor vehicle registration fees to keep up with inflation
Use vehicle sales tax for transpor-tation
Portion of state sales tax dedicated to transportation
Increase tolling/pricing revenues (above current 5 percent per year increase)
VMT fees (future); transition from short term toll/pricing innovation
If all states indexed fuel taxes by 2010.
If all states were to catch up for inflation losses by 2010; results in average 5.2 cent increase.
Three percent assumed dedicat-ed to transportation.
If all states were to raise in concert with inflation starting in 2007.
If all states who have sales tax dedicate at least 3 percent of ve-hicle sales tax to transportation.
Assume one-half percent dedica-tion.
Estimate based on aggressive use of tolling and pricing opportuni-ties in SAFETEA-LU.
High potential but widespread deployment assumed after 2015.
State Revenue Options
Revenue Revenue Revenue Average Generation Generation Generation Revenue Cumulative Short-Term Funding Mechanisms 2010 2017 2010 to 2017 2007 to 2017 Comments
Potential Contribution of Short-Term Funding Mechanisms to Federal, State and Local Highway and Transit NeedsYears of Expenditure Dollars (in billions of dollars)
cost in terms of wear and tear on roads and high-ways may be as high as 14 cents per mile for the heaviest trucks.26
At least 12 states collect excise taxes on vehicle sales and dedicate those taxes for transportation. These taxes are normally levied as a percentage of the sales price of a vehicle when it is purchased or first registered in a state. In Nebraska, 100 percent of vehicle sales taxes are dedicated to transporta-tion with the Highway Allocation Fund for local governments and the Nebraska Department of Roads splitting the revenues. In Missouri, half of the revenues from a 4 percent sales tax are distrib-uted among the Missouri Department of Transpor-tation, cities and counties for transportation spend-ing.23 Analysts believe sales taxes on vehicles have substantial potential to raise revenue and can be fairly progressive. However, some states require all sales tax revenues be deposited into general
revenue accounts, which can provide a barrier to designating and dedicating these revenues for transportation needs. Missouri had to amend its state constitution to redirect a portion of its sales tax levies to the State Road Bond Fund to make debt service payments.23
Some states and localities have personal property taxes on vehicles that are essentially registration fees based on the value of the vehicle. Such fees are adjusted with inflation since the value of the ve-hicles owned has continued to increase and, unlike other taxes, the fees are deductible for taxpayers who itemize their federal income taxes. But recent years have seen efforts in states such as Virginia and Washington to reduce or eliminate these fees. The tax was a highly visible target because unlike gas taxes collected at the pump, taxpayers must write a separate check to pay the personal property tax.23
Source: Future Financing Options to Meet Highway and Transit Needs, Table ES.2. Transportation Research Board’s National Cooperative Highway Research Program.

14 15
• • • • H
• • • • H
• • • • H
• • • • H
• • • H
• • • M
• • • H
• • • • M
• • • • • L
• • • • M
• • • • • H
• • H
• • • M
• • • • • H
• • • L
• • • • M
• • • • H
• • • • M
• • • • H
• • • • M
• • • • • H
• • • • L
• • • • H
Motor fuel excise (per gallon) tax
Indexing of the motor fuel tax (can be indexed to inflation or to other factors)
Sales tax on motor fueld
Petroleum franchise or business taxes
Vehicle registration and license fees
Vehicle personal property taxes
Excise tax on vehicle sales dedicated to transportation
Tolling new roads and bridges
Tolling existing roads
HOT lanes, express toll lanes, truck toll lanes
VMT fees
Transit fees (fares, park-and-ride fees, other)
Container fees, customs duties, etc.
Dedicated property taxes
Beneficiary charges/value capture (im-pact fees, tax increment financing, mort-gage recording fees, lease fees, etc.)
Permitting Local Option Taxes for Highway Improvements:
• Localoptionvehicleorregistrationfees
• Localoptionsalestaxes
• Localoptionmotorfueltaxes
Permitting local option taxes for transit:
• Localoptionsalestaxes
• Localoptionincomeorpayrolltax
Dedicate portion of state sales tax
Miscellaneous transit taxes (lottery, cig-arette, room tax, rental car fees, etc.)
General Revenue
All states , Federal
FL, IA, KY, ME, NE, NC, PA, WV
CA, GA, HI, IL, IN, MI, NY
NY, PA
All states
CA, KS, VA
CT, IA, KS, MD, MI, MN, MO, NC, NE, OK, SD, VA; Federal for heavy trucks
About half of states (e.g., TX, FL, VA)
VA proposed, others considering
CA, CO, GA, MN, TX
OR testing; recommended by 15 state-pooled fund study
All transit agencies
CA
Many local governments
Many states and localities (e.g., CA, FL, OR, NY)
AK, CA, CTb, CO, HI, ID, IN, MSb, MO, NE, NV, NH, NY, OH, SC, SD, TNb, TX, VAb, WA, WI
AL, AZ, AR, CA, CO, FL, GA, IA, KS, LA, MN, MO, NE, NV, NM, NYb, OH, OK, SC, TN, UT, WY
AL, AKb, FL, I, IL, MS, NV, OR, VA, WA
AL, AZ, CA, CO, FL, GA, IL, LA, MO, NV, NM, NY, NC, OH, OK, TX, UT, WA
IN, KY, OH, OR, WA
AZ, CA, IN, KS, MA, MS, NY, PA, UT, VA
Various states and localities
Most states and localities
Fuel Taxes
Vehicle Registration & Related Fees
Tolling, Pricing & Other User Fees
Beneficiary Charges & Local Option
Other Dedicated Taxes
General Revenue Sources
Specific Revenue Tool Pres
erva
tion,
Main
tena
nce
New
Capa
city
Oper
ation
s, M
ainte
nanc
e
Capit
al
Prog
ram
Proje
ct
Pote
ntial
a Yield
Highway/Bridge
Transit
Modes Scope Yield
Locations Used
Candidate Revenue Sources
aPotential Yield; H = High, M = Medium, L = Low
bRevenues go into General Fund but can be earmarked or used for transporta-tion.
cFor purposes of this report, the lever-aging of tax subsidies through tax credit bonds and investment tax credits is treat-ed effectively as producing revenue from general fund sources fro transportation.
dIn some states, revenues from sales taxes on motor fuel are not dedicated or only partially dedicated to fund transpor-tation needs.
Source: Future Financing Options to Meet Highway and Transit Needs, Table ES.1. Transportation Research Board’s National Cooperative Highway Research Program
16 17
States and localities can also rely on specialized state and local sales taxes and so-called
value capture fees. In 2004, those mechanisms provided $15.4 billion for highways and
$9.5 billion for transit at all levels of government.
ChAPTER 4: OThER TAX & FEE MEChANISMS
Revenues from them are dedicated to transporta-tion purposes usually with the approval of voters. These specialized taxes and fees include:
Development Impact Fees f —fees levied by lo-cal governments on new developments to pay for the construction or expansion of capital im-provements and infrastructure that are necessi-tated and benefit the new development. Impact fee laws exist in 26 states.27
Special Assessments f —taxes apportioned by lo-cal governments to recover the costs of public infrastructure improvements such as new roads in geographic areas in which the market value of real estate is higher due to the improvements.23
Tax Increment Financing f —a technique in which bonds are issued to finance public infra-structure improvements and repaid with dedi-cated revenues from the increment in property taxes as a result of the improvements. Arizona is the only state that has not enacted laws allowing tax increment financing. It has been used exten-sively in states such as Illinois, Minnesota and Wisconsin.23
Community Facilities Districts f —mecha-nisms where residential and commercial prop-erty owners are charged an annual fee for the
benefit of infrastructure in their area. Used in California and to a lesser extent elsewhere, these mechanisms are well-suited to regional projects and programs since they are not tied to a spe-cific facility. Analysts believe they may have the potential to play a bigger role in future revenue generation.23
In addition, states rely on a number of other spe-cialized taxes for a portion of their transportation funding. They include:
Rental Car Taxes f —These taxes are a key fund-ing source for public transportation projects in Wisconsin. A portion of the tax is dedicated for transit in Arkansas, Florida and Pennsylvania as well. New York dedicates its rental car tax-es to the Dedicated Highway and Bridge Trust Fund.23
Cigarette Taxes f —Oregon and Pennsylvania are among the states that have derived transit revenue from these taxes.23
Gambling revenue is also used to some extent for state transportation expenses. For instance, casino revenues are used to fund elderly and disabled pro-grams, including transit, in New Jersey. A portion of lottery revenues are dedicated for transit in Or-egon and Pennsylvania.23

16 17
18 19
With state governments facing significant political challenges to raising gasoline and other taxes and fees for transportation needs, a way of financing new roads from an-other era is receiving renewed attention. Debt financing, more commonly known as borrowing, is being used more widely to provide capital for projects up front, acceler-ate construction and reduce total project costs.
ChAPTER 5: DEBT FINANCING TO REDUCE PROJECT DEVELOPMENT COSTS
There are now a number of financial tools states can take advantage of to support debt financing. They include:
State Credit Assistance f —States can use a portion of their federal transportation funds to capitalize state infrastructure banks, which loan funds to projects with dedicated revenue streams at lower cost than private capital mar-kets. Florida and South Carolina are among the leading states in this area. More than 30 states have entered into more than $5 billion in loan agreements under the program.
Federal Credit Assistance f —With the Trans-portation Infrastructure Finance and Innovation Act of 1998, Congress brought the state infra-structure bank concept to the federal level. The act provides direct federal loans, loan guaran-tees and lines of credit to projects of regional or national significance and helps reduce the risk and interest rates on debts. The program has pro-vided more than $3.6 billion in credit assistance to projects since 1999 to fund more than $16 billion in infrastructure investment including such large-scale projects as the SR-91 Express Lanes and South Bay Expressway in California, the Miami International Center in Florida, the Camino Colombia Toll Road in Texas and the Dulles Greenway in Virginia.25
GARVEE Bonds f —Grant Anticipation Rev-enue Vehicles allow states to issue debt backed by future federal gas tax apportionments. States, political subdivisions or public authorities can incur debt through a variety of mechanisms in-cluding bonds, leases and mortgages and reserve a portion of future federal-aid highway funds to
service the debt. Arkansas, California and Ohio are among the leading GARVEE states. Through 2005, 14 states, Puerto Rico and the Virgin Is-lands had issued $4.8 billion in GARVEE debt.28 In Oklahoma, a $799 million program to finance 12 “corridors of economic significance” was au-thorized by the state’s legislature in 2000. The state expected to fund $500 million of that with GARVEE bonds. Examples of proposed projects in the program included extensions of U.S. 77 in Oklahoma City, I-44 in Tulsa and U.S. 183 in southwest Oklahoma.25
Section 129(a) Loans f —States are authorized to loan a portion of their federal-aid funding to projects that generate tolls or some other dedi-cated revenue stream. The states must receive a pledge that the project sponsor (usually a po-litical subdivision or local government) will use toll revenues to repay the loan.26
Private Activity Bonds f —Under SAFETEA-LU, the 2005 federal authorization for highway programs, states are now allowed to have private participation in tax-exempt facility bonds, while still maintaining the tax exempt status of the bonds. The law authorizes $15 billion in exempt facility bonds for qualified highway or surface freight facilities.29
All of these tools have the common purpose of attracting more private capital into transportation finance and are emblematic of a shift in the tradi-tional roles of the federal and state governments in transportation finance. As detailed in Chapter 7, states are also taking advantage of private capital in expanded tolling, long-term leases of transpor-tation assets and other innovative mechanisms.

18 19
20 21
In 1998, Arizona established the Highway Expansion and Extension Loan Program, a
state infrastructure bank that provides loans or credit enhancement for eligible projects.
ChAPTER 6: STATE INFRASTRUCTURE BANKS
A seven member advisory committee accepts loan applications, reviews and evaluates requests for fi-nancial assistance and makes recommendations to the state transportation board on loan and financial assistance requests. The program is one of the most active state infrastructure banks in the country and has approved 55 loans worth nearly $600 million and dispersed $510 million for projects in 14 of Ari-zona’s 15 counties as of the end of 2007.30
Initially authorized by Congress in 1995, state in-frastructure banks are in 32 states and Puerto Rico. All states, territories and the District of Columbia are currently authorized to enter into cooperative agreements with the secretary of transportation to establish revolving funds eligible to be capitalized with federal transportation funds. These revolving funds allow for the leveraging of federal and state resources by lending rather than granting federal-aid funds and can be used to attract non-federal public and private investment.23
But not all state infrastructure banks are struc-tured exclusively as loan revolving funds capital-ized with federal grants and state match. Arizona’s infrastructure bank and others rely principally on borrowing through the tax-exempt bond market to obtain lendable funds. Loan repayments then are used to retire the debt that has been issued, rather than being recycled into a second round of project loans.23
Puerto Rico has also taken the state infrastruc-ture bank concept in a slightly different direction. There, money for the bank is leveraged to support the issuance of highway bonds. The bank used $15 million in combined federal and state seed money to establish a trust fund that was used as partial se-
curity for a $75 million bond issue. That bond issue was used to finance highway and bridge projects throughout Puerto Rico.31
Any private or public entity may apply for credit assistance from a state infrastructure bank, as long as the project to be financed is eligible to receive federal aid. Eligible projects include highway projects such as roads, traffic signals, intersection improvements and bridges; transit capital projects such as buses, equipment and maintenance or pas-senger facilities; bikeway or pedestrian access projects on highway right-of-way land.32
State infrastructure banks around the country vary widely in size, from less than $1 million to more than $100 million.
These banks offer several advantages to borrow-ers including:
The interest rate is set by the state. f
The maximum loan term is 35 years. f
The state may be willing to take more risk than fa commercial bank would for a project with sig-nificant public benefits.
A state infrastructure bank loan can make a flarge project affordable by allowing for smaller annual payments.30
But state governments do face challenges in set-ting up and operating state infrastructure banks. Managing a revolving loan program is a complex process. In a 2002 Federal Highway Administration review of state infrastructure bank programs, sev-eral states cited obstacles or challenges that slowed progress in implementing programs. Among those obstacles:
20 21
Many states lacked the legislative authority to fleverage their funds and thereby increase the capitalization level of the state infrastructure bank. This constrains the maximum loan size and loan portfolio. Additional federal and state capital could alleviate these limitations.
Some states cited the complexity of federal re- fquirements as an obstacle to state infrastructure bank activity, particularly for transit projects.
Several project sponsors noted that federal re- fquirements for smaller projects can significantly delay construction schedules and increase over-all project costs.
A few states said there was insufficient demand ffor loans to make the program a success but some believe that may be attributed to limited marketing efforts.33
The concept of the infrastructure bank is also being considered on the federal level. U.S. Sens. Chris Dodd and Chuck Hagel in 2007 proposed a national infrastructure bank through which the fed-eral government could finance infrastructure proj-ects of regional or national significance with public and private capital.34 President Barack Obama has expressed his support for the proposal.
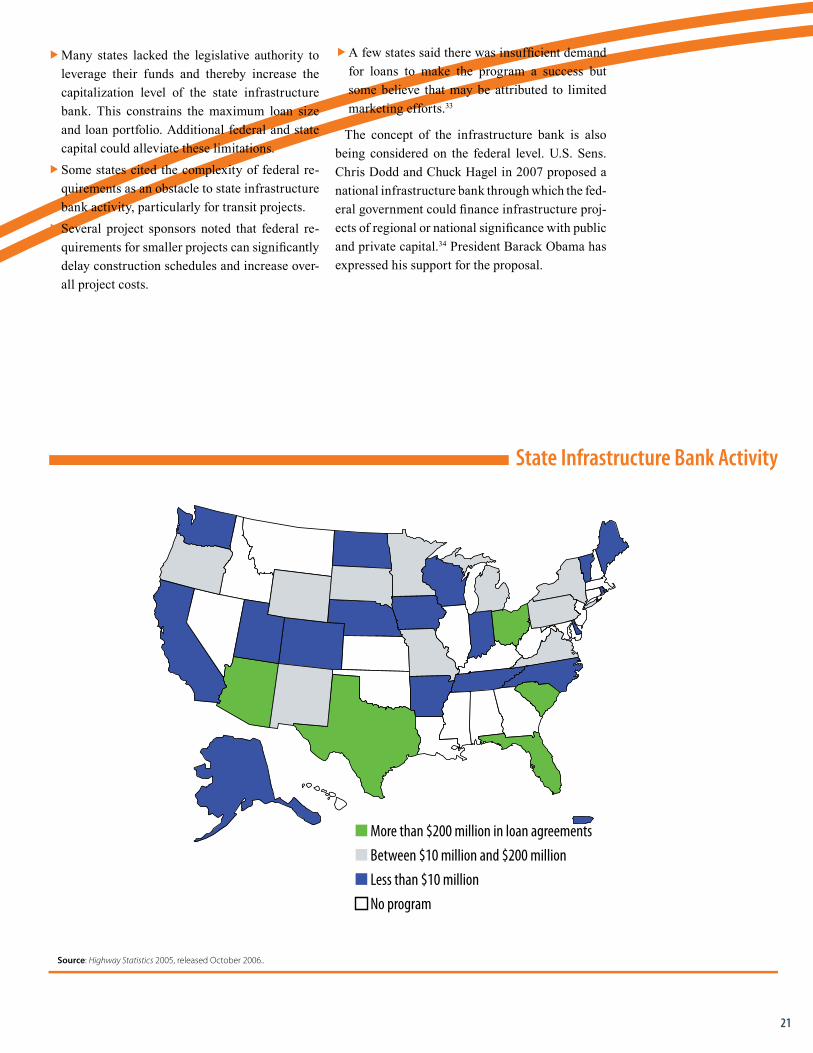
State Infrastructure Bank Activity
Source: Highway Statistics 2005, released October 2006..
■ More than $200 million in loan agreements■ Between $10 million and $200 million■ Less than $10 million
No program
22 23
Taxation and debt financing mechanisms are clearly only part of the revenue equation,
state governments are increasingly concluding. Most states are now also taking ad-
vantage of new thinking, new technology and new partners to try to ensure the future
viability of their transportation systems. This chapter will examine how public-private
partnerships and direct user fees such as tolling, congestion pricing and vehicle miles
traveled charges may reshape America’s transportation future as well as the challenges
states face in implementing them.
ChAPTER 7: ALTERNATIVE TRANSPORTATION FUNDING MEChANISMS
Public-Private PartnershipsIn the fall of 2008, New York Gov. David Pat-
erson announced he would create an 11-member state commission to recommend ways the state can raise or save money through the use of public-pri-vate partnerships involving state assets. With the price of construction commodities such as asphalt and steel increasing, the governor said it was now time to develop new ways to build and pay for in-frastructure projects.
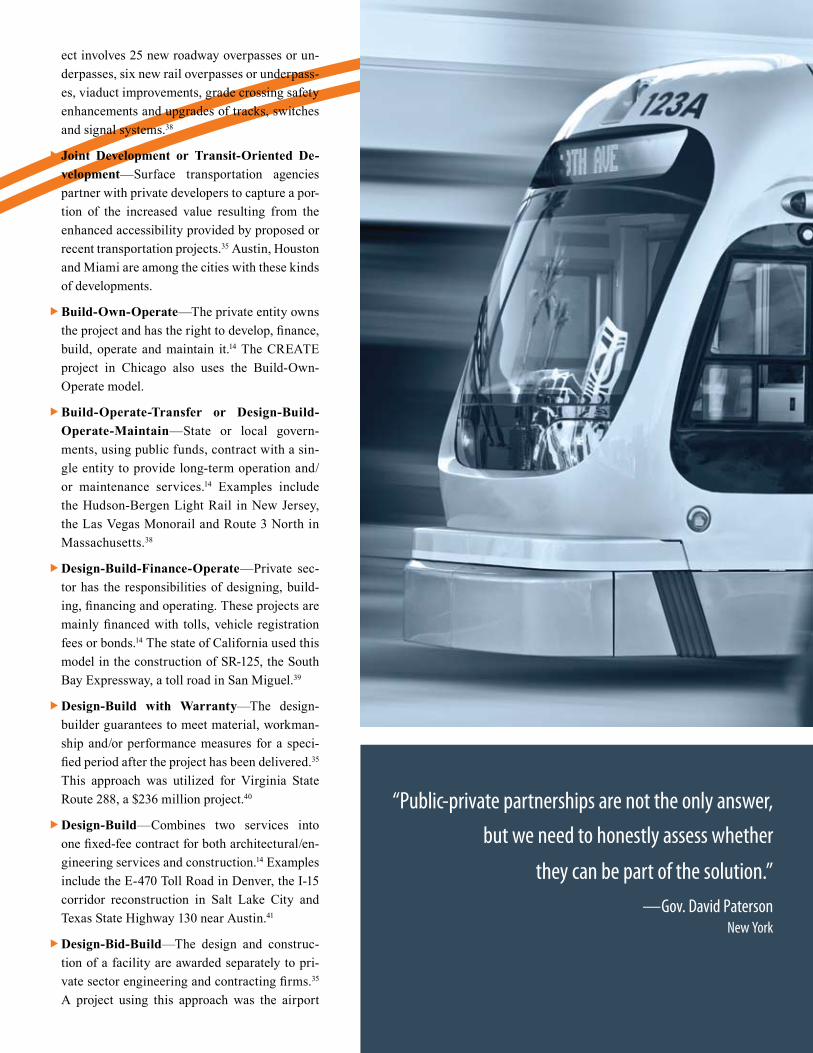
“Public-private partnerships are not the only answer, but we need to honestly assess whether they can be part of the solution,” Paterson said in a statement.35
Numerous states have already gone down the public-private road in recent years and their expe-riences provide much food for thought for states like New York that are only beginning to study the concept.
Public-private partnerships, also known as P3s, are collaborations between governments and pri-vate companies that aim to improve public services and infrastructure by capturing efficiencies associ-ated with private sector involvement while main-taining the public accountability of government involvement.36
Public-private partnerships can take many dif-ferent forms in transportation but long-term P3s is the type that has received perhaps the most scru-
tiny. Long-term P3s involve a private company in-vesting risk capital to design, finance, construct, operate and/or maintain a roadway for a specific number of years during which it collects toll rev-enues from the users. Sometimes the private toll company pays the public agency an upfront fee as part of the agreement. In some cases, the public and private partners share the revenue generated from the road.34
The list of types of P3s includes:
Full-Service Long-Term Concession or Lease f—An existing toll road facility is leased to a private party for a specified number of years. During this period, the private party can col-lect tolls but must maintain the facilities and in some cases make improvements.14 Examples of this type include the Chicago Skyway and the Indiana Toll Road, which are detailed later in this chapter.
Multimodal Agreement f —These partnerships include transportation projects that involve more than one mode of transportation, such as park and ride lots, express lanes with Bus Rapid Transit services, airport transit extensions or truck/rail transfer facilities.37 An example of this type is the CREATE project in Chicago, which aims to maximize the use of five train transpor-tation corridors, four handling freight and one primarily handling passenger traffic. The proj-
22 23
ect involves 25 new roadway overpasses or un-derpasses, six new rail overpasses or underpass-es, viaduct improvements, grade crossing safety enhancements and upgrades of tracks, switches and signal systems.38
Joint Development or Transit-Oriented De- fvelopment—Surface transportation agencies partner with private developers to capture a por-tion of the increased value resulting from the enhanced accessibility provided by proposed or recent transportation projects.35 Austin, Houston and Miami are among the cities with these kinds of developments.
Build-Own-Operate f —The private entity owns the project and has the right to develop, finance, build, operate and maintain it.14 The CREATE project in Chicago also uses the Build-Own-Operate model.
Build-Operate-Transfer or Design-Build- fOperate-Maintain—State or local govern-ments, using public funds, contract with a sin-gle entity to provide long-term operation and/or maintenance services.14 Examples include the Hudson-Bergen Light Rail in New Jersey, the Las Vegas Monorail and Route 3 North in Massachusetts.38
Design-Build-Finance-Operate f —Private sec-tor has the responsibilities of designing, build-ing, financing and operating. These projects are mainly financed with tolls, vehicle registration fees or bonds.14 The state of California used this model in the construction of SR-125, the South Bay Expressway, a toll road in San Miguel.39
Design-Build with Warranty f —The design-builder guarantees to meet material, workman-ship and/or performance measures for a speci-fied period after the project has been delivered.35 This approach was utilized for Virginia State Route 288, a $236 million project.40
Design-Build f —Combines two services into one fixed-fee contract for both architectural/en-gineering services and construction.14 Examples include the E-470 Toll Road in Denver, the I-15 corridor reconstruction in Salt Lake City and Texas State Highway 130 near Austin.41
Design-Bid-Build f —The design and construc-tion of a facility are awarded separately to pri-vate sector engineering and contracting firms.35 A project using this approach was the airport
“Public-private partnerships are not the only answer, but we need to honestly assess whether
they can be part of the solution.”—Gov. David Paterson
New York
24 25
tunnels portion of the Hiawatha Light Rail Transit linking downtown Minneapolis with the Minneapolis-St. Paul Airport and the Mall of America.39
Construction Manager at Risk f —The construc-tion manager is brought into the project develop-ment process under a separate contract during the design phase to minimize risk for all par-ties involved by combining the experience of the engineering design and construction manager firms with the client’s understanding of the proj-ect requirements.35 Several transit megaprojects in Utah and Oregon have used this approach.
Fee-Based Contract Services & Mainte- fnance—The public sector contracts with the private sector in this case usually for operations and maintenance such as snow removal, grass mowing or repairs.14 Washington, D.C., used this approach to finance the maintenance of city streets, tunnels, pavements, bridges, roadside features, pedestrian bridges, roadside vegeta-tion, guardrails, barriers, impact attenuators and signs.39
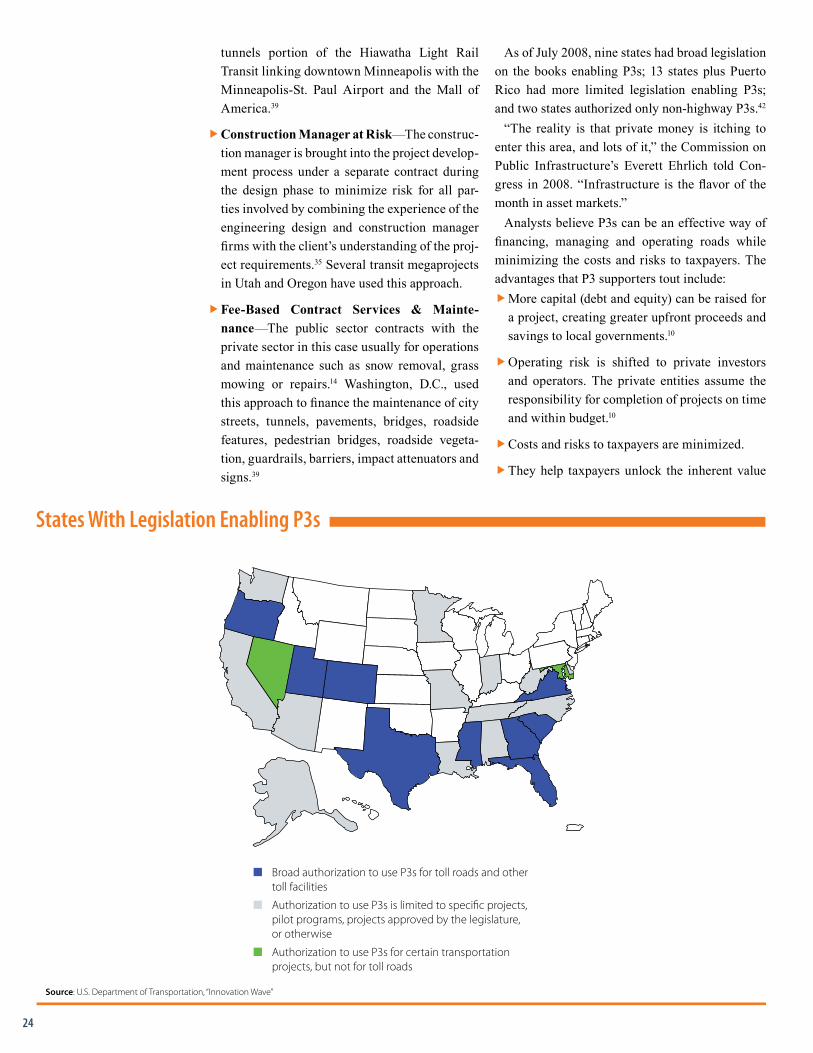
As of July 2008, nine states had broad legislation on the books enabling P3s; 13 states plus Puerto Rico had more limited legislation enabling P3s; and two states authorized only non-highway P3s.42
“The reality is that private money is itching to enter this area, and lots of it,” the Commission on Public Infrastructure’s Everett Ehrlich told Con-gress in 2008. “Infrastructure is the flavor of the month in asset markets.”
Analysts believe P3s can be an effective way of financing, managing and operating roads while minimizing the costs and risks to taxpayers. The advantages that P3 supporters tout include:
More capital (debt and equity) can be raised for fa project, creating greater upfront proceeds and savings to local governments.10
Operating risk is shifted to private investors fand operators. The private entities assume the responsibility for completion of projects on time and within budget.10
Costs and risks to taxpayers are minimized. f
They help taxpayers unlock the inherent value f
States With Legislation Enabling P3s
Source: U.S. Department of Transportation, “Innovation Wave”
■ Broad authorization to use P3s for toll roads and other toll facilities
■ Authorization to use P3s is limited to speci�c projects, pilot programs, projects approved by the legislature, or otherwise
■ Authorization to use P3s for certain transportation projects, but not for toll roads
24 25
in toll roads lost under government ownership.
They maximize the strengths of both the public fand private sectors.
They take advantage of the more businesslike fapproach of private sector firms.43 This includes professional business management, greater op-erating efficiency, lower operating and main-tenance costs, better customer service, less political patronage, shareholders who will hold management accountable and opportunities for network economies by operating across state lines.40
Private firms are quicker to adopt cost-saving fand customer-service oriented technology and specialized products and services.
They take advantage of the private sector’s di- fversified knowledge and awareness of new methods in design, construction, operations and maintenance.34
Case Studies of Public-Private Partnerships
Examples from Illinois, Indiana and other states reveal much about the promise and perils of public-private partnerships in transportation.
Chicago Skyway
The city of Chicago entered into an agreement in 2005 with a private consortium to operate and maintain the Chicago Skyway, an eight mile toll road that connects the Dan Ryan Expressway on Chicago’s South Side with the Indiana Toll Road. The consortium, which was made up of Spanish and Australian toll road developers, paid the city $1.8 billion upfront and agreed to operate and maintain the road for 99 years. They will collect all toll revenue during the period to fund the road’s operation and maintenance, to repay the debt that financed the $1.8 billion upfront payment and to provide a reasonable return on its members’ con-tribution of equity. The agreement fixes annual toll rate increases through 2017 and caps them thereaf-ter at the greater of 2 percent, the consumer price index or per capita gross domestic product.36
The city used the $1.8 billion concession pay-ment for a variety of purposes including $465 mil-lion to redeem outstanding debt on the Skyway. The payment highlights the amounts of private capital available for investment in transportation infrastructure in the United States.36
Indiana Toll Road
Shortly after the Chicago Skyway transaction was complete, Indiana launched a competitive bidding process for a concession to operate and maintain the Indiana Toll Road, which runs for 157 miles in northern Indiana between the Chicago Skyway and the Ohio Turnpike. The same Span-ish/Australian consortium in Chicago’s deal won that bidding process as well and in 2006 made an upfront payment of $3.8 billion. The group agreed to operate and maintain the toll road for 75 years and collect all toll revenue during the term. Toll rates have similar maximum limits to the Skyway agreement.36
The $3.8 billion has allowed Indiana to address a $1.8 billion transportation funding gap and fund a 10 year improvement plan known as the Major Moves program. It supports about 200 new con-struction and 200 major preservation projects around the state.44
The Chicago Skyway and Indiana Toll Road are perhaps the two best-known examples of public-private partnerships involving long-term conces-sions of existing assets. But the model followed in these agreements is not necessarily one that will work in every case. The two roads were both old-er facilities with existing traffic, which provided comfort to the private consortium that there is a group of customers who will continue to use the road and pay tolls. Other roads around the country have been in operation for only a few years and don’t necessarily have the same proven customer base. In other states, public-private partnerships have been explored not to seek a large upfront pay-ment, but to help bridge a gap in a project’s fund-ing. Virginia’s Pocahontas Parkway and Colorado’s Northwest Parkway are two examples of this type of P3.36
Over the past 15 years, the private sector has also built several new toll roads under long-term fran-chise agreements with state governments, includ-ing facilities in Orange County, Calif., San Diego, northern Virginia and near Laredo, Texas.34
Concerns about Public-Private Partnerships
The leasing of toll roads has not been without controversy. As Everett Ehrlich told Congress in 2008, “It’s a bad deal if the government agrees that no new roads will compete with the one (involved in the partnership), or if it makes a 99-year deal for a road that will only last 40 or 50 years. It’s a bad

26 27
Chicago Skyway Illinois Closed Long-term concession to operate and maintain 7.8-mile toll road in Chicago
Indiana Toll Road Indiana Closed Long-term concession to operate and maintain 157-mile toll road in northern Indiana
Pocahontas Parkway Virginia Closed Long-term concession to operate and maintain 14-mile toll road outside of Richmond and to build Richmond Airport Connector
Northwest Parkway Colorado Closed Long-term concession to operate and maintain 11-mile toll road outside of Denver and funding commitment for future expansions
Dulles Greenway Virginia Closed Refinancing long-term concession to operate and maintain 14-mile toll road between Leesburg and the Dulles International Airport
Pennsylvania Turnpike Pennsylvania RFQ Issued Long-term concession to operate and maintain 531-mile turnpike (requires legislative approval)
Greenville Southern Connector South Carolina RFQ Issued Long-term concession to operate and maintain 16-mile toll road in Greenville, S.C.
Alligator Alley Florida RFQ Issued Long-term concession to operate and maintain 78-mile toll road in South Florida.
Project Location Status Type of P3
P3s for the Operation and Maintenance of Existing Toll Facilities in the United States(January 2005–May 2008)
Source: U.S. Department of Transporta-tion, Innovation Wave
Benchmark P3 Transactions
Source: Future Financing Options to Meet Highway and Transit Needs, NCHRP Web-Only Document 102, National Cooperative Highway Research Program, Transportation Research Board of the National Academies.
Las Vegas Monorail
▲ Tacoma Narrows Bridge
Reno Rail Corridor
▲ Dulles Greenway▲ Pocahontas Parkway
▲ Southern Connector
▲ Osceola Parkway
Miami Intermodal Center
Jamaica JFK Airtrain Hudson Bergen Light Rail Line Camden Trenton Light Rail Line
▲ Chicago Skyway Asset Lease
▲ Indiana Toll Road Asset Lease
CREATE
Hiawatha Light Rail Line
▲ Denver E-470▲ Northwest Parkway
▲ Central Texas Turnpike▲ Trans Texas Corridor
▲ NM 44 (US 550)
▲ AZ-17▲ SR 125 Toll Road
▲ San Joaquin Hills Toll Road
▲ Foothill Eastern Toll Road
▲ I-15 Reconstruction
Alameda Corridor
Intermodal Projects ▲ Highway Projects Transit Projects

26 27
deal if the government could have simply securi-tized its future tolls receipts instead of selling the right to impose them.”
While the Chicago City Council passed the Chicago Skyway lease with little opposition, the Indiana state legislature approved legislation for the Indiana Toll Road lease on a close vote. When several Indiana lawmakers were defeated for re-election in November 2006, some attributed it to their votes supporting the deal. Also showing op-position, in early 2007 the Texas legislature passed a bill to impose a two-year moratorium on toll road concessions following several controversial agree-ments for new projects in the state.45 Legislators were concerned the state’s authorizing statute gave the Texas Department of Transportation too much authority when entering into P3s, including sole authority to negotiate all the terms of the agree-ments. Indiana has also sought to bring balance to the contracting process by giving oversight of any contract entered into between the state and a pri-vate entity to two separate review committees.14
The concerns about public-private partnerships that have been raised by critics include the following:
As is the case in Illinois and Indiana, many fof the private toll road companies are foreign companies. That’s because until recently the United States has used only public-sector agen-cies to build and operate toll roads. That means a private toll road operator industry has not had an opportunity to grow, although domestic toll road companies have begun to emerge in recent years. Still, the companies with the most competence and a track record of long-term development, operation and management are from Europe and Australia, which have been using transportation public-private partnerships for decades.46
Some wonder whether the length of the agree- fments is too long and whether state govern-ments are committing future generations when the transportation needs of tomorrow can’t be predicted. Indeed the lengths of the Indiana and Chicago agreements—75 and 99 years respectively—are long. Much can change during that time, including the viability of the roads and their usage. But state governments al-ready commit taxpayers for long periods when they use bonding to pay for infrastructure or when they change pension benefits. Concession
agreements can be written with detailed provi-sions to permit changes during their term.40
Some concession agreements contain con- ftroversial non-compete clauses to prevent the construction or improvement of parallel, non-tolled roads which could provide compe-tition. These clauses evolved after outright bans on alterative roads proved flawed, unnecessary and unpopular. More recent agreements more widely define what the state may build and gen-erally allow the construction of everything in its current long-range transportation plan.40
Toll road leasing can lead to higher tolls f . That is sometimes true, analysts say. However, toll rates may have been too low when the road was under state control. In Indiana’s case, tolls had not been increased in 20 years and the impact of inflation meant the cost of collecting the toll was greater than the amount of the toll payment. State governments usually resist toll increases so as not to upset constituents. But when a fi-nancial crisis becomes apparent, they are forced to increase tolls by as much as 30 percent or 40 percent. Private toll companies can raise tolls each year by a single digit percentage to keep up with inflation, which is ultimately less dis-ruptive for regular toll payers. Most recent toll road leases place a cap on toll increases based on the consumer price index, the growth in national productivity or other inflation index.40
Some question whether they should have to fpay a private company through tolls for roads they already paid for through taxes. However, most toll roads were actually financed with little or no tax-based grant money but instead with borrowings based on prospective toll revenues. Moreover, analysts point out, roads are never fully paid for because they require periodic maintenance, reconstruction and widening.40
Some are concerned about states ceding control fof the highways to private interests. But roads built using long-term concessions are not pri-vately owned. The state retains ownership of the roadway and protects the public interest through negotiating and enforcing the terms of the conces-sion agreement.47 The private firms are selected according to their expertise and their bids to take over the business functioning of toll roads.40
28 29
Protecting the Public Interest in Public-Private Partnerships
According to the Reason Foundation, a libertar-ian public policy research organization, states can protect the public interest in concession agree-ments by incorporating enforceable, detailed pro-visions and requirements into the contract to cover the following:
Who pays for future road expansions, repairs fand maintenance;
How decisions on the scope and timing of those fprojects will be reached;
What performance will be required of the pri- fvate toll company;
How the contract can be amended fairly for both fparties;
How to deal with failures to comply with the fagreement;
Provisions for early termination of the agreement; f
What protections, if any, will be provided to the fcompany from state-funded competing routes; and
What limits on toll rates or rate of return there fwill be.40
In its final report, the National Surface Transpor-tation Policy and Revenue Study Commission rec-ommended the following conditions be met when states use P3s on the interstate system:
Transparency and public participation should be fkey elements in all aspects of the process. Plan-ning and environmental requirements should also be met.
Concessions or other payments to public entities fshould be used to improve and expand the tolled facilities and to expand capacity on transporta-tion alternatives within the same corridor. They should not be used for non-transportation pur-poses or to subsidize transportation improve-ments in other parts of the state.
Conflicts of interest involving any parties to the fagreement should be prohibited.
The private sector financing should provide bet- fter value for the money than if the concession were financed using public funds.
Also, the terms of the agreement should include the following provisions:
The private partner must adequately maintain fthe condition and performance of the facility over the life of the agreement and return the fa-cility in good repair to the state at the end of the agreement.
There are no non-compete clauses that prohibit fthe construction or improvement of adjacent fa-cilities. Provisions that require the public entity to compensate private operators for lost rev-enues when improvements are made to adjacent facilities are acceptable.
Should the private partner enter into bankrupt- fcy, become insolvent or fail to meet all terms and conditions of the agreement, the facility will revert to the state.
To protect customers’ interests, the rate of in- fcrease in tolls would be capped at the level of the CPI minus an adjustment factor for productivity improvements.
Revenue-sharing provisions should be included fin the lease agreement to ensure the public sec-tor shares in the rewards if toll revenues are higher than projected.
Concession agreements will not exceed a rea- fsonable term. States should seek public input and undertake review before agreements are re-newed following their initial term.17
Former U.S. Transportation Secretary Mary Pe-ters and the Bush Administration promoted and encouraged states to enter into public-private part-nerships. The Federal Highway Administration even offers model legislation on its Web site that lawmakers can modify to authorize the use of P3s in their states. States must have the authority to lease or sell their transportation assets to a private entity before entering into these agreements. The model legislation allows the state’s department of transportation to “solicit, receive, consider, evalu-ate and accept a proposal” for a P3. It establishes the following criteria for evaluating and selecting a bid or proposal to enter into a public-private ini-tiative:
The ability of the transportation facility to im- fprove safety, reduce congestion, increase capac-ity and promote economic growth;
The proposed cost of and financial plan for the ftransportation facility;
The general reputation, qualifications, industry f

28 29
experience and financial capacity of the private entity;
The proposed design, operation and feasibility fof the transportation facility;
Comments from local residents and affected ju- frisdictions;
Benefits to the public; and f
The safety record of the private entity. f 48
But other sectors of government have urged cau-tion in state implementation of P3s. In May 2007, the chairmen of the U.S. House Transportation and Infrastructure Committee and its Highways and Transit Subcommittee warned in a letter to the nation’s governors that the federal govern-ment may seek to undo any state P3 agreements that “don’t fully protect the public interest and the integrity of the national (transportation) system.” Reps. James Oberstar and Peter DeFazio wrote in the letter: “Although we invite all financing op-tions be on the table as we evaluate opportunities to increase investment in our nation’s infrastruc-ture, we strongly caution you against rushing into PPPs that do not fully protect the public interest, the integrity of the national system and which do not constitute a sustainable national system of transportation financing.”
The letter also expresses concerns about non-compete clauses and the length of concession agreements.
Moreover, Oberstar and DeFazio wrote: “Short-sighted and unbalanced PPPs that mortgage our nation’s surface transportation infrastructure for generations to come may favor parochial and pri-vate interests to the detriment of an improved 21st Century national transportation system.”49
Texas Gov. Rick Perry was among those who re-sponded to the letter from Oberstar and DeFazio with a letter of his own. “I encourage you to ex-amine the fundamental question of why the states are looking to engage the private sector in the first place,” Perry wrote. “I will tell you that the answer in Texas is that we could no longer wait for anyone else to solve our problems. The states have looked to Presidents and Congressional leaders from both parties for years to help us improve transportation, but the assistance we need has not arrived … As we move forward with our own solutions, I would hope that the federal government would encourage innovation and not stifle it.”50
Direct User FeesAs states consider new mechanisms to solve
shortfalls in financing transportation infrastruc-ture, many agree one issue that should be consid-ered is whether it would be more beneficial to link user payments more closely to actual road use.
“One of the problems with the current set of funding mechanisms is that they are not perceived to be closely linked to direct use of the transporta-tion system; allowing demand and costs for a given asset to grow faster than the revenue that funds it,” Florian, the head of infrastructure banking at Goldman Sachs, told Congress in 2008.10
Examples of direct user fees include tolling, con-gestion pricing and vehicle miles traveled charges.
TollingTolling comes in many variations today. The pre-
vious model was to build a road with money from bonds, put up some toll booths, collect money for 30 years to pay down the bonds and then remove the tolls. But tolling today is used not just as a way to raise revenue but as a way to optimize perfor-mance of transportation systems.
The old concept of traffic backups at toll plazas is in many cases a thing of the past as well. Electronic toll collection technology allows tolls to be charged at full highway speeds in open-road conditions.51
These technological advances, which include EZ passes and photo imaging, now make more exten-sive use of tolling possible while greatly reducing both the cost of collection and the inconvenience imposed on motorists.
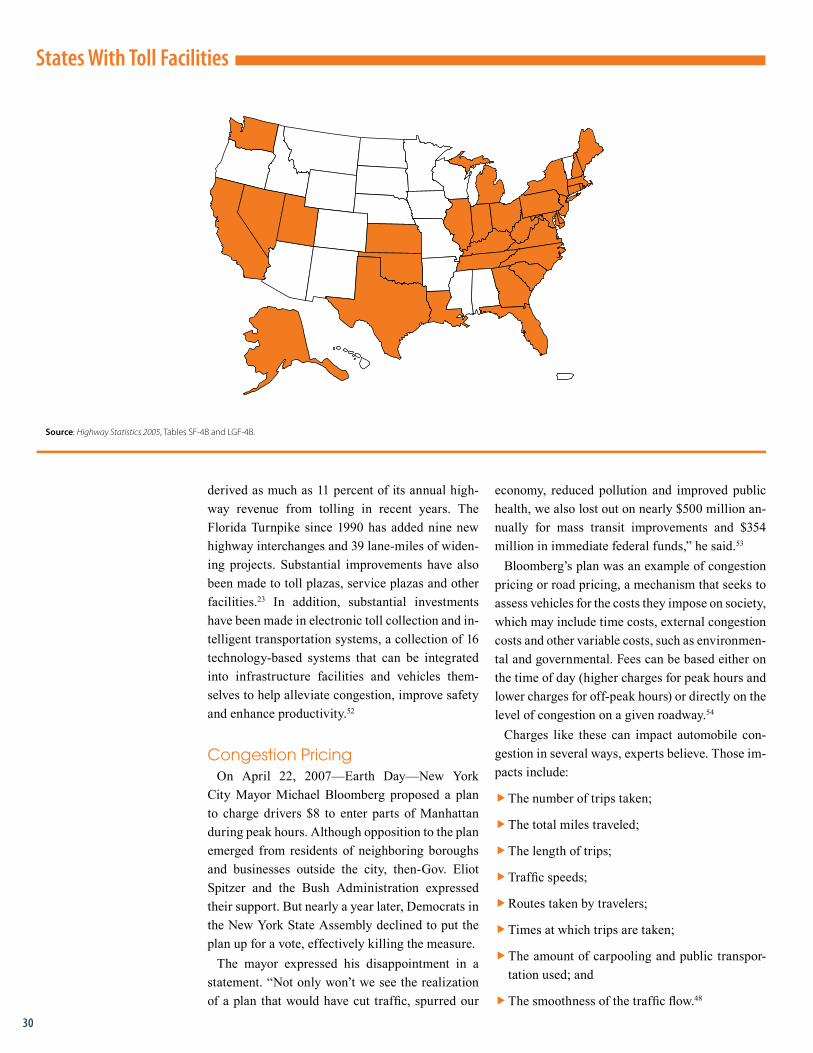
More than 5,000 miles of roads, bridges and tun-nels in the United States are tolled. State and local governments used $6.6 billion in toll revenues for highway investments in 2004. That’s an estimated 7 percent of total revenues used for highways at the state and local levels. Experts believe that while in-creasing tolling on existing roads is a challenging proposition and is mostly prohibited on the inter-state system, tolling on new roads or when adding additional lanes to existing roads hold potential for generating new revenue. Texas, for example, has decided to refrain from tolling existing lanes in the state but is funding new limited-access high-way capacity partially through tolls. Several other states have also either established that as policy or have considered it.23
With an extensive network of toll roads, Florida
30 31
derived as much as 11 percent of its annual high-way revenue from tolling in recent years. The Florida Turnpike since 1990 has added nine new highway interchanges and 39 lane-miles of widen-ing projects. Substantial improvements have also been made to toll plazas, service plazas and other facilities.23 In addition, substantial investments have been made in electronic toll collection and in-telligent transportation systems, a collection of 16 technology-based systems that can be integrated into infrastructure facilities and vehicles them-selves to help alleviate congestion, improve safety and enhance productivity.52
Congestion PricingOn April 22, 2007—Earth Day—New York
City Mayor Michael Bloomberg proposed a plan to charge drivers $8 to enter parts of Manhattan during peak hours. Although opposition to the plan emerged from residents of neighboring boroughs and businesses outside the city, then-Gov. Eliot Spitzer and the Bush Administration expressed their support. But nearly a year later, Democrats in the New York State Assembly declined to put the plan up for a vote, effectively killing the measure.
The mayor expressed his disappointment in a statement. “Not only won’t we see the realization of a plan that would have cut traffic, spurred our
economy, reduced pollution and improved public health, we also lost out on nearly $500 million an-nually for mass transit improvements and $354 million in immediate federal funds,” he said.53
Bloomberg’s plan was an example of congestion pricing or road pricing, a mechanism that seeks to assess vehicles for the costs they impose on society, which may include time costs, external congestion costs and other variable costs, such as environmen-tal and governmental. Fees can be based either on the time of day (higher charges for peak hours and lower charges for off-peak hours) or directly on the level of congestion on a given roadway.54
Charges like these can impact automobile con-gestion in several ways, experts believe. Those im-pacts include:
The number of trips taken; f
The total miles traveled; f
The length of trips; f
Traffic speeds; f
Routes taken by travelers; f
Times at which trips are taken; f
The amount of carpooling and public transpor- ftation used; and
The smoothness of the traffic flow. f 48
States With Toll Facilities
Source: Highway Statistics 2005, Tables SF-4B and LGF-4B.
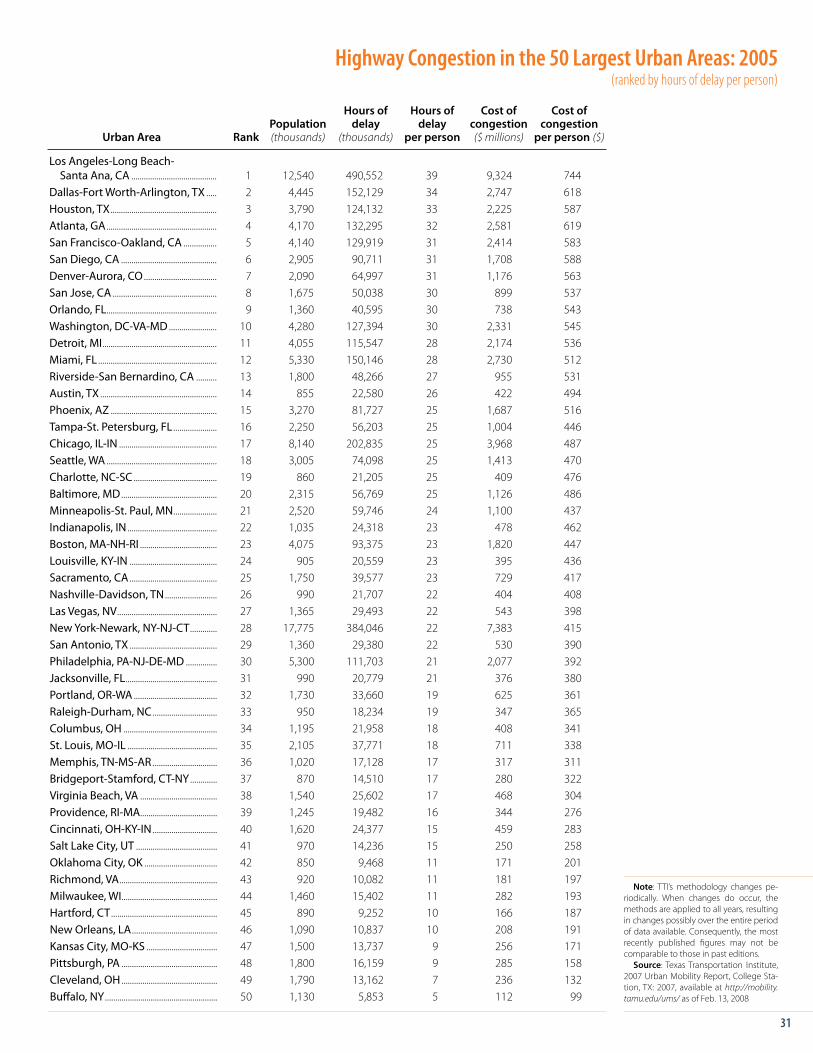
30 31
Hours of Hours of Cost of Cost of Population delay delay congestion congestion Urban Area Rank (thousands) (thousands) per person ($ millions) per person ($)
Los Angeles-Long Beach- Santa Ana, CA ......................................... 1 12,540 490,552 39 9,324 744
Dallas-Fort Worth-Arlington, TX ..... 2 4,445 152,129 34 2,747 618Houston, TX ................................................... 3 3,790 124,132 33 2,225 587Atlanta, GA ..................................................... 4 4,170 132,295 32 2,581 619San Francisco-Oakland, CA ................ 5 4,140 129,919 31 2,414 583San Diego, CA .............................................. 6 2,905 90,711 31 1,708 588Denver-Aurora, CO ................................... 7 2,090 64,997 31 1,176 563San Jose, CA .................................................. 8 1,675 50,038 30 899 537Orlando, FL ..................................................... 9 1,360 40,595 30 738 543Washington, DC-VA-MD ....................... 10 4,280 127,394 30 2,331 545Detroit, MI ....................................................... 11 4,055 115,547 28 2,174 536Miami, FL ......................................................... 12 5,330 150,146 28 2,730 512Riverside-San Bernardino, CA .......... 13 1,800 48,266 27 955 531Austin, TX ........................................................ 14 855 22,580 26 422 494Phoenix, AZ ................................................... 15 3,270 81,727 25 1,687 516Tampa-St. Petersburg, FL ..................... 16 2,250 56,203 25 1,004 446Chicago, IL-IN ............................................... 17 8,140 202,835 25 3,968 487Seattle, WA ..................................................... 18 3,005 74,098 25 1,413 470Charlotte, NC-SC ........................................ 19 860 21,205 25 409 476Baltimore, MD .............................................. 20 2,315 56,769 25 1,126 486Minneapolis-St. Paul, MN ..................... 21 2,520 59,746 24 1,100 437Indianapolis, IN ........................................... 22 1,035 24,318 23 478 462Boston, MA-NH-RI ..................................... 23 4,075 93,375 23 1,820 447Louisville, KY-IN .......................................... 24 905 20,559 23 395 436Sacramento, CA .......................................... 25 1,750 39,577 23 729 417Nashville-Davidson, TN ......................... 26 990 21,707 22 404 408Las Vegas, NV ................................................ 27 1,365 29,493 22 543 398New York-Newark, NY-NJ-CT ............. 28 17,775 384,046 22 7,383 415San Antonio, TX .......................................... 29 1,360 29,380 22 530 390Philadelphia, PA-NJ-DE-MD ............... 30 5,300 111,703 21 2,077 392Jacksonville, FL ............................................ 31 990 20,779 21 376 380Portland, OR-WA ........................................ 32 1,730 33,660 19 625 361Raleigh-Durham, NC ............................... 33 950 18,234 19 347 365Columbus, OH ............................................. 34 1,195 21,958 18 408 341St. Louis, MO-IL ........................................... 35 2,105 37,771 18 711 338Memphis, TN-MS-AR ............................... 36 1,020 17,128 17 317 311Bridgeport-Stamford, CT-NY ............. 37 870 14,510 17 280 322Virginia Beach, VA ..................................... 38 1,540 25,602 17 468 304Providence, RI-MA..................................... 39 1,245 19,482 16 344 276Cincinnati, OH-KY-IN ............................... 40 1,620 24,377 15 459 283Salt Lake City, UT ....................................... 41 970 14,236 15 250 258Oklahoma City, OK ................................... 42 850 9,468 11 171 201Richmond, VA ............................................... 43 920 10,082 11 181 197Milwaukee, WI .............................................. 44 1,460 15,402 11 282 193Hartford, CT ................................................... 45 890 9,252 10 166 187New Orleans, LA ......................................... 46 1,090 10,837 10 208 191Kansas City, MO-KS .................................. 47 1,500 13,737 9 256 171Pittsburgh, PA .............................................. 48 1,800 16,159 9 285 158Cleveland, OH .............................................. 49 1,790 13,162 7 236 132Buffalo, NY ...................................................... 50 1,130 5,853 5 112 99
Highway Congestion in the 50 Largest Urban Areas: 2005(ranked by hours of delay per person)
Note: TTI’s methodology changes pe-riodically. When changes do occur, the methods are applied to all years, resulting in changes possibly over the entire period of data available. Consequently, the most recently published figures may not be comparable to those in past editions.
Source: Texas Transportation Institute, 2007 Urban Mobility Report, College Sta-tion, TX: 2007, available at http://mobility.tamu.edu/ums/ as of Feb. 13, 2008

32 33
There are several types of congestion pricing. They include:
Facility Pricing f —Charging fees for the use of a bridge, tunnel or small segment of road.
Road Pricing f —Assessing a fee along a specific roadway, usually a road connecting two or more densely populated areas. One variation to road pricing which has become popular in recent years is to open high occupancy vehicle lanes used by carpoolers to paying commuters who may be driving solo. That helps spread traffic more evenly among available lanes and further decreases highway congestion, some contend.
Cordon Pricing f —Establishing a series of con-gestion toll collection stations in a ring around a congested urban area. Commuters are charged a fee as they enter the area.48
Current technology for congestion pricing is relatively easy to implement and makes these pricing schemes both affordable and feasible ad-ministratively. It also has made enforcement more effective. Surveillance cameras can be used to photograph the license plates of violators or those who don’t have adequate funds to pay the toll.48 Sticker tags, battery-operated tags, video tolls, GPS-based tolls and cash cards are used in the tolling process. Cameras and automatic license plate recognition are used to enforce the rules of the tolling.55
In setting up a congestion pricing scheme, states can either fund the operation themselves or enlist the services of a private firm.48 The Federal High-way Administration provides funding to support studies and implementation of congestion pricing programs in states.56 In the absence of federal as-sistance, state and local governments can support pricing projects through the issuance of revenue bonds that are payable from the funds generated by the congestion tolls.48
State Road 91 in Orange County, Calif., is an ex-ample of a road pricing scheme that is operated by a private firm. The state contracted with the Cali-fornia Private Transportation Company in 1995 to build and operate four new express lanes along 10 miles in the median of the highway. Automobiles with three or more passengers may use the express lanes for free, but all others pay a toll ranging from $1.15 during off-peak hours to $9.25 during peak periods. Revenues from tolling exceeded $30 mil-
lion in 2004 and the popularity of the express lanes has continued to grow.48
Elsewhere in California, San Diego is using a similar road pricing system to address burgeon-ing traffic. The system, called FasTrak, allows solo drivers to pay a per trip fee to use existing high oc-cupancy vehicles lanes along an eight mile stretch of I-15. When these drivers enter onto a FasTrak lane, they must pass through a particular lane where a transponder inside the car signals a ground-based sensor and a deduction in the amount of the posted fee is made from the user’s prepaid account. Car-poolers have their own marked lane and don’t have to pay. The impact of the program has been to more than double the average daily traffic on the high occupancy vehicles lanes and to double the num-ber of daily carpools as well. Congestion charge revenues pay for the $750,000 in operating costs each year and provide $60,000 for enforcement by the California Highway Patrol.48
Advantages of Congestion Pricing
In their final report, the members of the National Surface Transportation Policy and Revenue Study Commission identified several major additional advantages of congestion pricing compared with conventional tolling. Among the advantages:
Congestion pricing manages demand on con- fgested facilities, thereby reducing traffic.
It can generate additional revenues that could be fused to expand highway and transit capacity in the corridor to further reduce congestion.
It encourages the use of other routes and other fmodes of travel, such as public transportation.17
But analysts believe there is another advantage of congestion pricing, which should be of great inter-est to state governments.
Rudolph Penner of the Urban Institute told Con-gress in 2008 that “the collection of congestion fees provides a very useful indicator for allocating highway spending. High collections from a par-ticular area provide a pretty good indicator that in-vestments in expanding capacity in that area would be worthwhile, whereas low collections would sug-gest that investment is not badly needed.”
Moreover, Penner said congestion fees and toll-ing both have the potential to provide very large amounts of revenue while improving the efficiency of the transportation system.18

32 33
Concerns about Congestion Pricing
There are, however, some important issues that have affected support for congestion pricing schemes. They include issues of inequity and po-litical viability.
With regard to inequity, some argue that if all ve-hicles of the same type are charged the same fees during the same periods, these fees will be a more significant barrier to travel for lower-income com-muters who often have little or no flexibility in set-ting their schedules. Those with low incomes are also more likely to live far from the city-center and their destination is more often located outside the city’s core where public transportation is poor.48
But a recent study by researchers at UCLA and USC concluded that tolls are actually a fairer way of raising money to build road capacity than most other funding schemes. The study examined the high-occupancy toll lanes on Orange County’s SR 91. It found that the express lanes are dispropor-tionately used by middle- and upper-middle-in-come households. But the researchers then consid-ered hypothetically how people of different income levels would be affected if the four express lanes had instead been financed with sales tax revenues. They found the very poorest residents would have paid more than $3 million more under a sales tax than they actually did under the current toll system. Although tolls, like sales and fuel taxes, may be a regressive form of taxation; using sales taxes to fund roadways actually creates substantial savings to drivers by shifting some of the costs of driving from them to consumers at large. In that process, sales taxes disproportionately favor the more afflu-ent at the expense of the poor.
The researchers do have some suggestions for policymakers who may be worried about low-in-come, peak-period commuters paying tolls. One is to provide discounted pricing based on income lev-els, as is done by utility companies, or to provide travel credits to lower-income commuters. They also suggest using toll revenues to enhance transit services along the tolled corridors so the lower-income commuters have an alternative to driving on them.57
Other studies point out that those with low in-comes stand to receive disproportionate benefits from reduced traffic congestion that can result from congestion pricing, including fewer pedes-trian deaths and less air and noise pollution.48
The political viability-related concerns about congestion pricing include the following:
Many drivers are unable to accept the notion that fthey should be charged for congestion and don’t want to pay for roads that are currently free.
Commuters don’t see themselves as part of fa larger problem, but as victims of conges-tion. They feel they already pay for congestion through delays and stress.
Some commuters don’t consider traffic condi- ftions to be bad enough to warrant congestion pricing.48
This lack of public support appears to have trans-lated into a lack of support among elected officials as well, analysts say. Their concerns highlight the need for more public awareness and communica-tion as congestion pricing plans are considered.
Urban planning researchers at UCLA recently proposed a way to create political support for con-gestion pricing on urban freeways. They suggest distributing toll revenue to cities with the tolled freeways. The idea is that receiving the revenue will convince local elected officials to become po-litical champions of congestion pricing. The rea-soning behind this, the researchers say, is that the absence of advocates for congestion pricing is a far greater hindrance than the presence of opponents. Congestion pricing currently lacks a constituency that derives concentrated benefits from the tolled roadways. The researchers point out that some have suggested rebates for toll revenue directly to motorists might be a better idea. But they contend drivers make poor recipients for congestion toll revenue because they are too difficult to organize in support of the issue. Cities, on the other hand, have lobbyists and elected officials who can be ef-fective advocates at the state and national level.58
Other concerns about congestion pricing include the belief by some that drivers act without regard to road charges so that congestion pricing will not change their behavior—they won’t or can’t switch the times they drive; they won’t begin to carpool; and they won’t take public transportation. But data from successful congestion pricing schemes—including one that has been in place in Singapore since 1975—appears to contradict that belief.48
But some are uneasy with the technologies for electronic tolling technologies saying government tracking of an individual’s car trips could lead to
34 35
invasions of privacy. Others point out the potential benefits for law enforcement of being able to check alibis of suspected criminals or track down the lo-cation of a stolen vehicle. But there are technologi-cal solutions to privacy concerns, including sys-tems that erase information about place and time from the record as soon as appropriate charges are deducted.48
Another fear is that revenues from congestion pricing will not be used to further alleviate con-gestion but instead might become an easy rainy-day fund when additional tax revenue is needed for other programs. Regulations or state laws mandat-ing the revenues be used only for transportation or urban social programs is one way to prevent this from happening. As mentioned earlier, private firms can also be brought in to collect the tolls and decide how the revenue is distributed.48
Vehicle Miles Traveled ChargesBeginning in April 2006, the Oregon Department
of Transportation launched a yearlong pilot pro-gram to test the technological and administrative feasibility of replacing the gas tax with a mileage-based fee based on miles driven in the state, which would be collected at gas stations. The program included 285 volunteer vehicles, 299 motorists and two Portland service stations.59
The mileage-fee based experiment worked like this: A GPS-based receiver was used to estimate miles driven in different zones. Mileage data was then transmitted wirelessly on a short-range radio frequency to receivers at gas stations. Participants were charged 1.2 cents per mile. In addition, some were charged premiums for traveling during peak periods to determine if such charges would impact travel behavior.17
The key findings of the pilot project included the following:
The mileage-fee concept is viable f . Existing technology can be used in new ways to imple-ment a mileage fee to replace the gas tax as the principal revenue source for road funding. It worked so well that at the conclusion of the pilot, 91 percent of participants said they would agree to continue paying the mileage fee in lieu of the gas tax if the program were extended statewide.
Paying at the pump works f . The pilot program demonstrated the mileage fee could be paid at the pump, with minimal difference in process or
administration for motorists, when compared to how they pay the gas tax.
The mileage fee can be phased in f . Because retrofitting all vehicles in the state with mile-age-calculating equipment would require con-siderable money and time, it is significant that the study showed that the mileage fee could be phased in gradually alongside the gas tax. Ve-hicles not equipped with the technology could continue to pay the gas tax, while equipped ve-hicles could pay the mileage fee.
Integration with current systems can be fachieved. The mileage fee can integrate well with both the gas station point-of-sale system and the gas tax collection system.
Congestion and other pricing options are vi- fable. The concept allows different pricing zones to be established electronically and the assigned fees charged for driving in each zone, even at particular times of day. That means it could be used to support not only congestion pricing but also assessment and collection of local revenues from different zones. The area pricing strategy applied in the pilot program also did have an impact on driver behaviors and congestion. It produced a 22 percent decline in driving during peak periods.
Privacy is protected f . Under the pilot program no specific vehicle point location or trip data could be stored or transmitted and all on-vehicle device communication had to be short range. Also, the only centrally stored data needed to assess mileage fees were vehicle identification, zone mileage totals for each vehicle and the amount of fuel purchased.
The system would place minimal burden on fbusiness. Distributors and gas stations would bear some new accounting burdens. But admin-istration is essentially automated and can be integrated easily into existing transaction pro-cesses.
Potential for evasion of the fees is minimal f . If a motorist attempts to tamper with the on-vehicle device, it can be engineered such that it would result in default payment of the gas tax. The degree to which equipment tampering will occur will depend on the eventual fee level, on-vehicle engineering, fee structure, fuel tax rates and penalties for tampering.
34 35
Cost of implementation and administration is flow. Gas station capital costs include installing the mileage reading equipment while operating costs include communications of the mileage information with a central database in order to calculate mileage fees and modifications to the station’s point-of-sale system. On-vehicle capital costs will be determined by auto manufacturers and included in the price of new vehicles. The state department of transportation incurs oper-ating costs for auditing and providing technical assistance to gas stations and motorists.53
As the National Surface Transportation Policy and Revenue Study Commission points out in its final report, three major studies in recent years have all identified some form of Oregon’s vehicle miles traveled fee as the most promising mecha-nism to serve as a long-term replacement for the fuel tax. But numerous technical and institutional questions remain. As Oregon continues to tout its success, Washington state and the University of Iowa have conducted mileage-based fee pilot proj-ects of their own, which may help answer some of those questions.17
The study commission identifies several potential strengths of a mileage-based fee. They include:
The fee could readily be converted to a conges- ftion pricing charge or a weight-distance fee that would better reflect the impact of the vehicle on road wear and tear.
The revenues directly reflect the amount of trav- fel, which is a key factor affecting the costs of supplying, operating and maintaining highway services.
Revenues can be collected from vehicles regard- fless of the type of fuel they use.17
Challenges of Implementing
Vehicle Miles Traveled
But the commission concluded the technologi-cal and institutional challenges are significant and must be resolved before a mileage-based system can be implemented. The technological challenges include:
Identifying a method for calculating the mileage ftraveled in each taxing jurisdiction;
Identifying the way this mileage informa- ftion would be transmitted to the tax collection agency;
Identifying the way the system would deal with fequipment failures as a result of either malfunc-tion or tampering;
Establishing policies for dealing with evasion of fVehicle Miles Traveled fees;
Making sure communication of the data is seam- fless; and
Convincing motorists that detailed information fon their travel patterns will not be accessible to others.17
The institutional challenges identified by the commission include:
Developing mechanisms for administering a Ve- fhicle Miles Traveled fee, both in the short run when only a few states will have such systems and in the long run when all states would be ex-pected to have such systems.
Determining how to phase in Vehicle Miles fTraveled charges over time due to the cost of outfitting all vehicles on the road with on-board computers, GPS receivers and wireless communications.
Identifying how to limit the increase in the bur- fden for federal and state tax collection agencies, which would receive frequent payments from operators of every registered vehicle. Many Vehicle Miles Traveled fee concepts assume a third-party collection agency would actually receive information on mileage traveled in each jurisdiction, bill the motorist and distribute the funds among the jurisdictions based on miles traveled and the appropriate tax rate.
Developing broader consensus on the basic ar- fchitecture and formula for creating a Vehicle Miles Traveled fee.17
The study commission concludes that “a VMT fee has many promising features; but, until more is known about collection and administrative costs, ways to minimize evasion, and the acceptability of such a mechanism to the taxpayers, it is premature to rule out other types of taxes and fees to supple-ment traditional fuel tax revenues.”17

36 37
The interim report of the National Surface Transportation Infrastructure Financing
Commission listed 19 potential transportation funding mechanisms the panel identi-
fied along with a preliminary list of 15 criteria for evaluating them.
ChAPTER 8: ASSESSING FUNDING MEChANISMS & IMPLEMENTING ThEM
These criteria may be useful for state governments as they consider funding options. They include:
Revenue Potential f —How does the mecha-nism’s revenue potential at various politically acceptable rates match investment needs?
Sustainability f —Can the mechanism be adjust-ed easily by system operators or policymakers to meet needs?
Political Viability f —How easy is it to gain po-litical acceptance of the mechanism compared to other mechanisms?
Ease/Cost of Implementation f —How easy and costly is it to implement and administer com-pared to other mechanisms?
Ease of Compliance f —To what extent does the mechanism minimize evasion compared to others?
Ease/Cost of Administration f —To what extent is the mechanism a cost-effective means of rais-ing revenue?
Level of Government f —Which level of govern-ment is appropriate for the mechanism?
Promotes Efficient Use f —To what extent will the mechanism incentivize efficient use of the system?
Promotes Efficient Investment f —To what ex-tent does the mechanism incentivize infrastruc-ture investments based on transparent and per-formance-based criteria?
Promotes Safe and Effective System Opera- ftions/Management—To what extent does the
mechanism incentivize owners and operators of transportation infrastructure to more effectively and efficiently operate and manage?
Address Externalities f —To what extent does the mechanism improve the way the funding system takes into account beneficial and harm-ful side effects, including pollution, noise and economic development?
Minimize Distortions f —To what extent does the mechanism affect other markets or public policies, such as energy independence?
Promotes Spatial Equity f —To what extent does the mechanism help fund system improvements in places that are economically or geographical-ly disadvantaged or that suffer disproportionate use?
Promotes Social Equity f —To what extent does the mechanism limit costs for those who face the most difficulty in paying?
Promotes Generational Equity f —To what ex-tent does the mechanism charge current and fu-ture users for current and future benefits?
The commission points out that any funding mechanism is unlikely to score well on all the cri-teria, so the choice of an optimal approach will re-quire value judgments to be made by policymakers on the goals they most want to advance.12
Ultimately, the most significant item in this list for many policymakers may be political viability. Regardless of how a funding mechanism may look on paper, decisions about how to enhance revenue to fund transportation are never made in a vacuum. Po-
36 37
litical considerations always play an important role in determining the direction a state ultimately takes.
Nevertheless, drawing on important lessons learned over the years in many states, a consensus appears to have emerged about the steps necessary to successfully propose and enact new or enhanced revenue measures to fund transportation.
As the Transportation Research Board’s National Cooperative Highway Research Program points out in a 2007 report, most funding initiatives come about either through legislative actions or through ballot initiatives and referenda. But regardless of how they are generated, the same steps are re-quired to achieve success. They include:
Developing a consensus on the scope of current fand future transportation needs and on the im-portance of acting to address them;
Developing a specific plan and program of in- fvestments for which additional funding is need-ed and demonstrating what benefits are expected from the proposed investments;
Identifying clearly established roles, responsi- fbilities and procedures for executing the plan and implementing the proposed improvements;
Describing the revenue sources in detail and fproviding the rationales for their use;
Designing and carrying out a public education fand advocacy plan and campaign;
Developing sustained leadership and demon- fstrable, sustained support; and
Planning for and laying out a clear and reason- fable timetable.23
Assessing the political landscape, researching the options, educating the electorate and imple-menting new revenue-enhancing measures will occupy a substantial amount of time for state gov-ernments in the next few years. The choices and the efforts they make will determine whether our nation’s transportation system ends up on the road to success.
—Sean Slone is a transportation policy analyst at The Council of State Governments.
Regardless of how a funding mechanism may look
on paper, decisions about how to enhance
revenue to fund transportation are never made
in a vacuum. Political considerations always play
an important role in determining the
direction a state ultimately takes.
38 39
REFERENCES
1Scott Rothschild. “Sebelius assigns transportation task force, says no to motor fuels tax increase.” Law-rence Journal World and News. (August 14, 2008). Accessed from: http://www2.ljworld.com/news/2008/aug/14/sebelius_assigns_transportation_task_ force_says_no/ September 11, 2008
2Transportation-Leveraging Investments in Kansas (T-LINK). Task Force Kick-Off Meeting Summary. Au-gust 27, 2008. Accessed from: http://www.kansastlink.com/downloads/TLINK%20Meeting%20Summary_Au-gust%2027%202008.pdf September 11, 2008.
3Kansas Long Range Transportation Plan. Accessed from: http://www.kansaslrtp.org/ September 11, 2008.
4Office of the Governor. Press Release. “Governor announces transportation task force.” Accessed from: http://www.kansastlink.com/press-release-announcing-t-link-task-force September 11, 2008.
5American Society for Civil Engineers. “Report Card for America’s Infrastructure.” Accessed from: http://www.asce.org/reportcard/2005/index.cfm September 12, 2008.
6Center for Strategic & International Studies Com-mission on Public Infrastructure. “Guiding Principles for Strengthening America’s Infrastructure.” March 27, 2006. Accessed from: http://www.csis.org/media/csis/pubs/060327_infrastructure_ principles.pdf September 15, 2008.
7Government Accountability Office. “Highway Bridge Program: Clearer Goals and Performance Measures Needed for a More Focused and Sustainable Program.” September 10, 2008. Accessed from: http://www.gao.gov/new.items/d081043.pdf September 12, 2008.
8Bureau of Transportation Statistics. “Table 5-3: High-way Vehicle-Miles Traveled (VMT).” Accessed from: http://www.bts.gov/cgi-bin/breadcrumbs/PrintVersion.cgi?date=07155735 November 7, 2008.
9Giuliano, Genevieve and Hanson, Susan. “The Geog-raphy of Urban Transportation.” Guilford Press. 2004.
10Texas Transportation Institute. “2007 Annual Urban Motility Report.” Accessed from: http://mobility.tamu.edu/ums/ September 12, 2008.
11National League of Cities. “The State of America’s Cities: The Annual Opinion Survey of Municipal Of-ficials.” 2005. Accessed from: http://www.nlc.org/ASSETS/706BAF36511F4FF58A5FF34D617DC713/rmp-soacbrf05.pdf September 12, 2008.
12Testimony of Mark Florian. Hearing on Investment in Transportation Infrastructure before the House Commit-tee on Transportation and Infrastructure. June 10, 2008. Accessed from: http://transportation.house.gov/Media/File/Full%20Committee/20080610/2008.06.10%20Flo-rian.pdf September 16, 2008.
13Government Accountability Office. “Highway Trust Fund: Overview of Highway Trust Fund Estimates.” April 4, 2006. Accessed from: http://www.gao.gov/cgi-bin/getrpt?GAO-06-572T September 12, 2008.
14National Surface Transportation Infrastructure Fi-nancing Commission. “The Path Forward: Funding and Financing Our Surface Transportation System.” Feb-ruary 1, 2008. Accessed from: http://financecommis-sion.dot.gov/Documents/Interim%20Report%20-%20The%20Path%20Forward.pdf September 12, 2008.
15Testimony of Everett Ehrlich. Hearing on Investment in Transportation Infrastructure before the House Com-mittee on Transportation and Infrastructure.” June 10, 2008. Accessed from: http://transportation.house.gov/Media/File/Full%20Committee/20080610/ehrlich.pdf September 16, 2008.
16Farber, Nicholas J. “Avoiding the Pitfalls of Pub-lic Private Partnerships: Issues to Be Aware of When Transferring Transportation Assets.” Transportation Law Journal. 35 (2008): 24–44. Accessed from: http://law.du.edu/pdfdocuments/transpoarchive/v35.pdf Sep-tember 16, 2008.
17“Transportation: Builders’ lobby urges candidates, policymakers to make infrastructure top-tier issue.” Transcript of Interview with Pete Ruane. E&E TV’s “On Point.” June 25, 2008. Accessed from: http://www.eenews.net/tv/transcript/827 September 16, 2008
18U.S. Department of Transportation. “2006 Status of the Nation’s Highways, Bridges and Transit: Conditions and Performance Report.” Accessed from: http://www.fhwa.dot.gov/policy/2006cpr/
19National Surface Transportation Policy and Revenue Study Commission. “Transportation for Tomorrow: Report of the National Surface Transportation Policy and Revenue Study Commission.” December 2007. Ac-cessed from: http://www.transportationfortomorrow.org/final_report/ September 17, 2008.
20Testimony of Rudolph Penner. Hearing on Invest-ment in Transportation Infrastructure before the House Committee on Transportation and Infrastructure. June 10, 2008. Accessed from: http://transportation.house.gov/Media/File/Full%20Committee/20080610/Penner.pdf September 17, 2008.
21American Petroleum Institute. “Gasoline Taxes.” July 2008. Accessed from: http://www.api.org/statis-tics/fueltaxes/upload/July_2008_gasoline_and_die-sel_summary_ pages.pdf September 17, 2008.
22“Otter Aide: Vehicle Fees to Fund Transportation Needs, Shortfall.” Idaho Business Review (March 3, 2008) Accessed from: http://www.idahobusiness.net/ar-chive.htm/2008/03/03/Otter-aide-Vehicle-fees-to-fund-transportation-needs-shortfall September 19, 2008.
38 39
23John Miller. “Transportation Feud, Private Jet Rides Marked 2008 Idaho Legislative Session.” As-sociated Press/The Argus Observer (April 4, 2008). Accessed from: http://www.argusobserver.com/arti-cles/2008/04/04/news/doc47f66843049b9703426258.txt September 19, 2008.
24Idaho Press-Tribune Editorial Board. “Road Fund-ing Must Increase.” Idaho Press Tribune (March 15, 2008). Accessed from: http://www.idahoptv.org/idreports/showEditorial.cfm?StoryID=33140 Septem-ber 19, 2008.
25National Cooperative Highway Research Program. “Future Financing Options to Meet Highway and Tran-sit Needs.” December 2006. Accessed from: http://www.trb.org/news/blurb_detail.asp?ID=7313 September 29, 2008.
26Committee for the Study of the Long-Term Viability of Fuel Taxes for Transportation Finance. “The Fuel Tax and Alternatives for Transportation Funding.” Trans-portation Research Board Special Report 285 (2006). Accessed from: http://www.trb.org/news/blurb_detail.asp?id=5810 September 29, 2008.
27ImpactFees.com. “FAQ.” Accessed from: http://www.impactfees.com/faq/general.php# September 30, 2008.
28Federal Highway Administration. “Innovative Fi-nance Primer.” April 2002. Accessed from: http://www.fhwa.dot.gov/innovativefinance/ifp/index.htm Septem-ber 30, 2008
29U.S. House of Representatives. “H.R. 3: The Safe, Accountable, Flexible, Efficient Transportation Equity Act.” 2005. Accessed from: http://thomas.loc.gov/cgi-bin/cpquery/T?&report=hr203&dbname=cp109& Sep-tember 30, 2008.
30Arizona Department of Transportation. “Highway Expansion and Extension Loan Program.” Annual Re-port 2007. Accessed from: http://www.dot.state.az.us/Inside_ADOT/help/PDF/helprprt07.pdf October 6, 2008.
31Federal Highway Administration. “Innovative Fi-nance Primer.” Accessed from: http://www.fhwa.dot.gov/innovativefinance/ifp/credass.htm October 6, 2008.
32West Coast Diesel. “State Infrastructure Banks (SIB) Fact Sheet.” Accessed from: http://www.westcoastdie-sel.org/files/sector_trucking/SIBfactsheet.pdf. October 6, 2008.
33Federal Highway Administration. “State Infrastruc-ture Bank Review.” February 2002. Accessed from: http://www.fhwa.dot.gov/innovativefinance/sibreview/index.htm October 6, 2008.
34Office of Sen. Chris Dodd. “National Infrastructure Bank Act of 2007.” Fact Sheet. Accessed from: http://dodd.senate.gov/multimedia/2007/080107_Infrastruc-turePacket.pdf October 6, 2008.
35“Paterson wants new commission to create public-private partnerships.” The Business Review (Albany, NY). September 30, 2008. Accessed from: http://www.bizjournals.com/albany/stories/2008/09/29/daily20.html?t=printable October 6, 2008
36Gilroy, Leonard C.; Poole, Jr., Robert W.; Samuel, Peter; and Segal, Geoffrey. “Building New Roads Through Public-Private Partnerships: Frequently Asked Questions.” Reason Foundation. Policy Brief No. 58. Accessed from: http://www.reason.org/pb58_building_new_roads.pdf October 6, 2008.
37Federal Highway Administration. Office of Policy and Governmental Affairs. “Case Studies of Transpor-
tation Public-Private Partnerships Around the World.” July 7, 2007. Accessed from: http://www.fhwa.dot.gov/ppp/pdf/int_ppp_case_studies_ final_report_7-7-07.pdf October 8, 2008.
38Federal Highway Administration. “Public Private Partnerships: Case Studies: CREATE.” Accessed from: http://www.fhwa.dot.gov/ppp/case_studies_create.htm November 10, 2008.
39Yusuf, Juita-Elena; Wallace, Candice Y.; and Hack-bart, Merl. “Privatizing Transportation Through Public-Private Partnerships: Definitions, Models and Issues.” Kentucky Transportation Center. May 2006. Accessed from: http://www.e-archives.ky.gov/Pubs/transporta-tion/TC_Rpt/KTC_06_09_SPR_302_05_2F.pdf No-vember 10, 2008.
40Testimony of Shirley Ybarra. “Private Sector Par-ticipation in Transportation.” Hearing of the House Committee on Government Reform Subcommittee on Energy Policy, Natural Resources and Regulatory Af-faris. September 30, 2004. Accessed from: http://www.ncppp.org/councilinstitutes/ybarra_testimony.pdf No-vember 10, 2008.
41Federal Highway Administration. “Public Private Partnerships: Case Studies.” Accessed from: http://www.fhwa.dot.gov/ppp/case_studies.htm. November 10, 2008.
42U.S. Department of Transportation. “Innovation Wave: An Update on the Burgeoning Private Sector Role in U.S. Highway and Transit Infrastructure.” July 18, 2008. Accessed from: http://www.ncppp.org/coun-cilinstitutes/dotpppreport_20080718.pdf October 7, 2008.
43Pennsylvania Economy League/IssuesPA “Investing in Transportation: The Role of Public Private Partner-ships in Funding Transportation.” October 2006. Ac-cessed from: http://www.issuespa.net/articles/21612?p=1 October 6, 2008.
44Government Accountability Office. “Highway Public-Private Partnerships: More Rigorous Up-Front Analysis Could Better Secure Potential Benefits and Protect the Public Interest.” February 2008. Accessed from: http://www.gao.gov/new.items/d0844.pdf October 9, 2008.
45Reason Foundation. “Annual Privatization Re-port 2007.” Accessed from: http://rds.yahoo.com/_ylt=A0geu9GDF.5I0p8Aj1JXNyoA;_ ylu=X3oDMTEzaDYzOX Y4BHNlYwNzcgRwb3MDMwRjb2xvA2FjMgR2dGlkA0Y5MTlf MTIx/SIG=12cdbmavs/EXP=1223649539/**ht tp%3a//www.reason.org/apr2007/surface_transportation.pdf October 9, 2008.
46Samuel, Peter. “Leasing State Toll Roads: Frequently Asked Questions.” Reason Foundation Policy Brief No. 60. Accessed from: http://www.reason.org/pb60_leas-ing_state_toll_roads.pdf October 9, 2008.
47Poole Jr., Robert W. “Tolling and Public-Private Part-nerships in Texas: Separating Myth from Fact.” Reason Foundation Working Paper May 2007. Accessed from: http://www.reason.org/TX_toll_roads_working_ paper.pdf October 13, 2008.
48Federal Highway Administration. “Public-Private Partnerships: Model Legislation Working Draft.” Ac-cessed from: http://www.fhwa.dot.gov/ppp/legis_model.pdf October 13, 2008.
49U.S. House of Representatives Committee on Trans-portation and Infrastructure. “Letter to Governors.” May 10, 2007. Accessed from: http://www.dot.state.tx.us/publications/government_and_ public_affairs/
40
perry_letter.pdf October 13, 2008.50Office of Gov. Rick Perry. “Letter to Reps. Oberstar
and DeFazio.” July 2, 2007. Accessed from: http://www.dot.state.tx.us/publications/government_and_ public_affairs/perry_letter.pdf October 13, 2008.
51Cambridge Systematics. “Tolling and Road Pricing.” Accessed from: http://www.camsys.com/kb_hotissue_tolling.htm October 14, 2008.
52Research and Innovative Technology Administra-tion. “Intelligent Transportation Systems: ITS Over-view.” Accessed from: http://www.its.dot.gov/its_over-view.htm October 14, 2008.
53Nicholas Confessore. “Congestion Pricing Plan Dies in Albany.” New York Times (April 7, 2008). Accessed from: http://cityroom.blogs.nytimes.com/2008/04/07/congestion-pricing-plan-is-dead-assembly-speaker-says/?hp October 14, 2008.
54Schuitema, Michael. “Road Pricing as a Solution to the Harms of Traffic Congestion.” Transportation Law Journal 34 (2007): 81–112. Accessed from: http://law.du.edu/pdfdocuments/transpoarchive/v34.pdf October
14, 2008.55Augustine, John. “The Case for Congestion Pricing.”
Briefing to the National Conference of State Legisla-tors (PowerPoint Presentation) June 13, 2008. Accessed from: http://www.ncsl.org/print/standcomm/sctran/Au-gustine061308.pdf October 14, 2008.
56Federal Highway Administration. “Tolling and Pric-ing Program: Value Pricing Pilot Program.” Accessed from: http://ops.fhwa.dot.gov/tolling_ pricing/value_pricing/index.htm October 14, 2008.
57Schweitzer, Lisa and Taylor, Brian D. “Just Pricing: the distributional effects of congestion pricing and sales taxes.” Transportation. 35(2008): 797–812.
58King, David; Manville, Michael; and Shoup, Donald. “For Whom the Road Tolls: The Politics of Congestion Pricing.” Access 31(2007):2–7
59Oregon Department of Transportation. “Oregon’s Mileage Fee Concept and Road User Fee Pilot Program: Final Report.” November 2007. Accessed from: http://www.oregon.gov/ODOT/HWY/RUFPP/docs/RUFPP_fi-nalreport.pdf October 15, 2008.


Headquarters Washington East Midwest South West
Lexington, Ky. Washington, D.C. New York, N.Y. Lombard, Ill. Atlanta, Ga. Sacramento, Calif. 859.244.8000 202.624.5460 212.482.2320 630.925.1922 404.633.1866 916.553.4423 www.csg.org www.csg.org www.csgeast.org www.csgmidwest.org www.slcatlanta.org www.csgwest.org
The Council of State Governments