transportation customer survey - missouri · the existing system of roads and allocation of...
TRANSCRIPT

Research, Development and Technology
MoDOT
RDT 05-002
Transportation Customer Survey
January, 2005
RI 97-34C
University of Missouri-Columbia

Final Report
RI 97-034C/RDT 05-002
Transportation Customer Survey Part 1 — Statewide Analysis
MISSOURI DEPARTMENT OF TRANSPORTATION RESEARCH, DEVELOPMENT AND TECHNOLOGY
By: Kenneth E. Pigg, Ph.D. Associate Professor
Sara Jo Brown
Research Associate
University of Missouri – Columbia College of Agriculture, Food and Natural Resources
Department of Rural Sociology
Jefferson City, Missouri October 2004
The opinions, findings and conclusions expressed in this publication are those of the principal investigators. They are not necessarily those of the U.S. Department of Transportation, Federal Highway Administration or the Missouri Department of Transportation: Research, Development and Technology. This report does not constitute a standard or regulation.

2
TECHNICAL REPORT DOCUMENTATION PAGE 1. Report No.: RDT 05-002 2. Government Accession No. 3. Recipient's Catalog No. 4. Title and Subtitle 5. Report Date: October 2004
6. Performing Organization Code
Transportation Customer Survey Part I: Statewide Analysis
7. Author(s): Kenneth E. Pigg, Sara J. Brown 8. Performing Organization Report No. 9. Performing Organization Name and Address 10. Work Unit No.
RDT 05-002/RI 97-034C 11. Contract or Grant No.
University of Missouri-Columbia Department of Rural Sociology 106 Gentry Hall Columbia, MO 65211
12. Sponsoring Agency Name and Address 13. Type of Report and Period Covered Final Report April 2003-April 2004 14. Sponsoring Agency Code
Missouri Department of Transportation (MoDOT) Research, Development and Technology Division P.O. Box 270 Jefferson City, MO 65102
15. Supplementary Notes The research was conducted in cooperation with the U.S. Department of Transportation, Federal Highway Administration. All opinions and conclusions contained herein are those of the authors, not FHWA or MoDOT. 16. Abstract: In 2003 the University of Missouri-Columbia implemented the Transportation Customer Survey. This study replicates research previously reported as the Constituent Service Quality Survey (conducted in 2000). The survey collected responses from 4,000 residents of Missouri aged 18 and over, with 400 responses for each of the ten MoDOT districts. The survey was intended to provide a discrepancy analysis of the fit between citizen/customer levels of current satisfaction with MoDOT’s work and the amount of attention they believe the agency should place on these same aspects of work in the future. The TCS updated the CSQS and used the initial study as a benchmark from which to identify areas of work showing improved performance.
The central findings of the research are as follows: (1) Missourians generally feel MoDOT is performing satisfactorily at present, but there are many areas in which the agency could improve performance; (2) compared to the benchmark measures of 2000, the agency’s efforts show marginal, but positive improvements in the majority of areas of performance measured; (3) primary areas of performance where agency shows needs for improved performance involve maintenance of the existing system of roads and allocation of financial resources; (4) Missourians assign highest priority to existing system maintenance compared to new construction, safety or congestion management; (5) respondents do not know if the agency is currently receiving sufficient resources to carry out its responsibilities and show little consensus regarding preferred ways of acquiring new revenues; (6) Missourians generally trust MoDOT to fulfill its responsibilities in a number of areas with sixty percent or more respondents indicating that they trust MoDOT to perform as desired in each of six areas of performance. There are few patterns in the responses according to respondent characteristics that would provide the agency with directions as to which type of customer to address with performance improving actions. 17. Key Words: Customer satisfaction, performance 18. Distribution Statement: No Restrictions. management, service quality This document is available through National Technical
Information Center, Springfield, VA 22161. 19. Security Classification (of this report) 20. Security Classification (of this
page) 21. No. of Pages 132
22. Price
Unclassified Unclassified
Form DOT F 1700.7 (06/98)

3
TABLE OF CONTENTS TABLE OF CONTENTS ............................................................................................................................................3 INDEX OF TABLES AND FIGURES.......................................................................................................................5 EXECUTIVE SUMMARY .........................................................................................................................................8 CHAPTER 1: MISSOURI DEPARTMENT OF TRANSPORTATION CUSTOMER SURVEY (TCS) .........12
CONTEXT FOR SURVEY DESIGN: MISSOURI TRANSPORTATION ISSUES....................................................................12 STATEWIDE SURVEY OF CONSTITUENT SATISFACTION WITH SERVICE QUALITY.....................................................12 DEVELOPING THE SURVEY INSTRUMENT .................................................................................................................13 REPORT OUTLINE ....................................................................................................................................................16
CHAPTER 2: STUDY METHODOLOGY AND DATA PRESENTATION.......................................................17 RESEARCH SAMPLING DESIGN.................................................................................................................................17 SURVEY IMPLEMENTATION......................................................................................................................................17 DESCRIPTIVE ANALYSIS AND SIGNIFICANCE TESTING.............................................................................................21 SAMPLE SUBGROUPS ...............................................................................................................................................22 SUMMARY ...............................................................................................................................................................22
CHAPTER 3: SOCIAL, DEMOGRAPHIC AND TRANSPORTATION CHARACTERISTICS OF THE MODOT SURVEY SAMPLE...................................................................................................................................24
GENERAL DEMOGRAPHIC AND SOCIAL CHARACTERISTICS......................................................................................24 COMPARISONS OF MODOT SURVEY SAMPLE CHARACTERISTICS WITH STATE POPULATION ..................................25 RESPONDENT TRANSPORTATION CHARACTERISTICS ...............................................................................................25
CHAPTER 4: FINDINGS OF THE SURVEY: PERCEPTIONS OF MODOT PERFORMANCE..................28 OVERALL SATISFACTION .........................................................................................................................................28 CURRENT SATISFACTION WITH ASPECTS OF MODOT’S TRANSPORTATION WORK .................................................35 FUTURE ATTENTION ................................................................................................................................................42 SUMMARY ...............................................................................................................................................................48
CHAPTER 5: ANALYZING DISCREPANCIES TO GUIDE PERFORMANCE MANAGEMENT...............49 DISCREPANCY ANALYSIS.........................................................................................................................................49 DISCREPANCY ANALYSIS OF TCS DATA .................................................................................................................51 SUMMARY ...............................................................................................................................................................54
CHAPTER 6: RESPONDENTS’ VIEWS ON RESOURCE PRIORITIES AND TRUST IN MODOT ...........59 ALLOCATION OF FUEL TAX REVENUES ...................................................................................................................59 CURRENT FUNDING GENERALLY INADEQUATE—NO CONSENSUS REGARDING SOURCES.......................................63 MODOT GENERALLY TRUSTED TO PERFORM .........................................................................................................67 SOURCES OF INFORMATION USED BY RESPONDENTS...............................................................................................69 DISTRIBUTION OF FUEL TAX REVENUES..................................................................................................................70 SUMMARY OF FINDINGS ..........................................................................................................................................71
CHAPTER 7: COMPARISON OF 2003 TCS WITH BENCHMARK.................................................................72 RESULTS SHOW MODEST IMPROVEMENT IN PERCEIVED CURRENT SATISFACTION..................................................72 COMPARISONS OF RATINGS OF DESIRED FUTURE ATTENTION, 2000-2003..............................................................73 DISCREPANCY SCORES SHOW MODEST IMPROVEMENTS .........................................................................................78 PRESERVATION AND MAINTENANCE INCREASINGLY IMPORTANT ...........................................................................80 MASS MEDIA REMAINS IMPORTANT AS SOURCE FOR INFORMATION.......................................................................80 BENCHMARK COMPARISONS SHOW MODEST IMPROVEMENTS, 2000 - 2003............................................................81
4
APPENDIX A.1..........................................................................................................................................................84 TRANSPORTATION CUSTOMER SURVEY METHODOLOGY.........................................................................................84 OVERVIEW...............................................................................................................................................................84 SAMPLE DESIGN ......................................................................................................................................................85 SAMPLE CONSTRUCTION .........................................................................................................................................85 SELECTION OF RESPONDENT WITHIN HOUSEHOLD ..................................................................................................86 INITIAL CONTACT ....................................................................................................................................................87 REFUSAL CONVERSION............................................................................................................................................88 FIELD OUTCOMES....................................................................................................................................................88 SAMPLE WEIGHTING................................................................................................................................................97 PRECISION OF SAMPLE ESTIMATES ..........................................................................................................................99 ESTIMATING STATISTICAL SIGNIFICANCE..............................................................................................................101
APPENDIX A.2........................................................................................................................................................103 TRANSPORTATION CUSTOMER SATISFACTION SURVEY (MISSOURI 2003)...........................................103
APPENDIX B...........................................................................................................................................................113 DETAILED DATA SUMMARY FOR TRANSPORTATION CUSTOMER SURVEY 2003 ....................................................113
APPENDIX C...........................................................................................................................................................130 STAKEHOLDER LIST...............................................................................................................................................130
5
Index of Tables and Figures
FIGURE 1.1: COMPUTATION METHOD FOR DISCREPANCY INDICATOR ........................................... 14 TABLE 1.1: LISTING OF 34 ITEMS INCLUDED IN THE SURVEY......................................................... 15 FIGURE 2.1: MAP OF MODOT DISTRICTS (BASIS OF SAMPLING FRAME)....................................... 18 TABLE 2.1: SAMPLE DESIGN .......................................................................................................... 19 TABLE 2.2: COMPOSITION OF SUBGROUPS ..................................................................................... 23 TABLE 3.1: SOCIAL AND DEMOGRAPHIC CHARACTERISTICS OF THE SURVEY SAMPLE .................. 24 TABLE 3.2: COMPARISONS OF MISSOURI CENSUS DATA AND MODOT SURVEY SAMPLE.............. 25 TABLE 4.1: PERCENT RESPONSES BY RESPONSE CATEGORY FOR GENERAL SATISFACTION
QUESTIONS IN TCS ................................................................................................................ 29 FIGURE 4.1: PERCENT OF RESPONDENTS EXPRESSING OVERALL SATISFACTION WITH MODOT
PERFORMANCE BY AGE CATEGORY ....................................................................................... 30 FIGURE 4.2: RATINGS OF SATISFACTION WITH AVAILABLE TRANSPORTATION OPTIONS BY AGE
CATEGORY............................................................................................................................. 30 FIGURE 4.3: RESPONDENTS’ RATINGS OF SATISFACTION WITH TRANSPORTATION OPTIONS IN
MISSOURI BY EDUCATIONAL ATTAINMENT CATEGORY......................................................... 31 FIGURE 4.4: PERCENT OF RESPONDENTS EXPRESSING OVERALL SATISFACTION WITH MODOT IN
MISSOURI BY EDUCATIONAL ATTAINMENT CATEGORY......................................................... 32 TABLE 4.2: STATEWIDE FREQUENCIES OF OVERALL SATISFACTION BY MILES DRIVEN ................ 32 TABLE 4.3. RESPONDENTS’ OVERALL RATINGS OF MODOT COMPARED TO DRIVING EXPERIENCES
IN OTHER STATES .................................................................................................................. 33 FIGURE 4.5: MEAN LEVELS OF OVERALL SATISFACTION WITH MODOT AND AVAILABLE
TRANSPORTATION OPTIONS CONTRASTED WITH SATISFACTION IN MEETING NEEDS AFTER DIRECT MODOT CONTACT ................................................................................................... 34
TABLE 4.4: RANKING OF MEAN LEVEL OF CURRENT SATISFACTION ............................................. 38 TABLE 4.5: PERCENTAGE OF RESPONDENTS INDICATING "SATISFIED" OR "EXTREMELY SATISFIED"
WITH CURRENT MODOT PERFORMANCE STATEWIDE ........................................................... 39 TABLE 4.6: SIGNIFICANCE OF MEANS BETWEEN CURRENT SATISFACTION RATINGS AND
RESPONDENT CHARACTERISTICS ........................................................................................... 40 TABLE 4.7: FACTORS INFLUENCING RATINGS OF PERCEIVED SATISFACTION WITH CURRENT
MODOT PERFORMANCE........................................................................................................ 41 TABLE 4.8: PERCENTAGE OF SURVEY RESPONDENTS INDICATING A DESIRE FOR "MORE" OR "A LOT
MORE" FUTURE ATTENTION ON PERFORMANCE ITEMS ......................................................... 43 TABLE 4.9: RANKING OF MEAN LEVEL OF FUTURE ATTENTION STATEWIDE................................. 45 TABLE 4.10: FACTORS INFLUENCING RATINGS OF FUTURE ATTENTION REGARDING MODOT
PERFORMANCE....................................................................................................................... 46 TABLE 4.11: SIGNIFICANCE OF MEANS BETWEEN FUTURE ATTENTION RATINGS AND RESPONDENT
CHARACTERISTICS ................................................................................................................. 47 FIGURE 5.1: ANALYTICAL FRAMEWORK FOR UNDERSTANDING DISCREPANCY SCORES ................ 50 TABLE 5.1: MEAN VALUES OF DIFFERENCES BETWEEN CURRENT SATISFACTION AND FUTURE
PRIORITY RESPONSES ............................................................................................................ 52 FIGURE 5.2: COMPARISON OF DIFFERENCES—CURRENT SATISFACTION AND FUTURE ATTENTION
BY SIZE OF DIFFERENCE (DISCREPANCY)............................................................................... 56 FIGURE 5.3: PLOT OF CURRENT SATISFACTION AND FUTURE ATTENTION SCORES ........................ 57

6
TABLE 5.2: COMPARISON RESPONDENT CHARACTERISTICS AND DISCREPANCIES SHOW INDICATIONS OF SIGNIFICANCE.............................................................................................. 58
TABLE 6.1: RESPONDENTS’ SUGGESTED ALLOCATION OF STATE FUEL TAX REVENUES COLLECTED ANNUALLY ($200 BASE) ........................................................................................................ 60
FIGURE 6.1: OVERALL SATISFACTION WITH MODOT PERFORMANCE AND PREFERENCES FOR ALLOCATION OF STATE FUEL TAXES..................................................................................... 60
FIGURE 6.2: AGE DIFFERENCES MATTER REGARDING DISTRIBUTION OF FUEL TAXES.................. 61 TABLE 6.2: COMPARING ALLOCATIONS OF FUEL TAXES BY RESPONDENT CHARACTERISTICS ...... 62 FIGURE 6.3: RESPONDENT EDUCATION HAS LIMITED EFFECT ON RECOMMENDED DISTRIBUTION OF
FUEL TAXES........................................................................................................................... 63 TABLE 6.3: PERCENT RESPONDENTS BELIEVING MODOT RECEIVES ENOUGH MONEY PRESENTLY
............................................................................................................................................... 63 TABLE 6.4: COMPARISON OF RESPONDENT CHARACTERISTICS AND PERCEPTIONS THAT MODOT
CURRENTLY RECEIVES ENOUGH MONEY TO DO ITS JOB ........................................................ 64 FIGURE 6.4: RESPONDENTS’ PREFERENCES FOR INCREASING FINANCIAL RESOURCES FOR MODOT
............................................................................................................................................... 66 TABLE 6.5: PREFERRED FUNDING SOURCES COMPARED WITH RESPONDENT CHARACTERISTICS.. 67 FIGURE 6.5: RESPONSES TO SURVEY REGARDING PERCEIVED TRUST IN MODOT......................... 69 FIGURE 6.6: THREE IMPORTANT SOURCES OF INFORMATION ABOUT MODOT USED BY TCS
RESPONDENTS........................................................................................................................ 70 TABLE 6.6: PREFERENCES REGARDING DISTRIBUTION OF FUEL TAX REVENUES........................... 71 TABLE 7.1: RESULTS OF 2000 AND 2003 SURVEYS COMPARED BY MEANS FOR PERFORMANCE
ITEMS..................................................................................................................................... 75 TABLE 7.2: RESULTS OF 2000 AND 2003 SURVEYS COMPARED BY RANKING OF MEANS FOR
PERFORMANCE ITEMS ............................................................................................................ 76 FIGURE 7.1: COMPARISONS OF MEANS FOR CURRENT SATISFACTION RATINGS, 2000 AND 2003 .. 77 TABLE 7.3: MEAN VALUES AND RANK ORDER CORRELATIONS INDICATE LITTLE CHANGE 2000 TO
2003....................................................................................................................................... 78 FIGURE 7.2: COMPARISONS OF MEANS FOR FUTURE ATTENTION RATINGS 2000 AND 2003 .......... 79 FIGURE 7.3: COMPARISONS OF DISCREPANCY SCORES, 2000 AND 2003 ........................................ 83 FIGURE A-1: WITHIN HOUSEHOLD SELECTION PROCEDURE .......................................................... 88 FIGURE A-2: SAMPLE DISPOSITION CATEGORIES........................................................................... 90 FIGURE A-3: FINAL SAMPLE DISPOSITION ..................................................................................... 91 FIGURE A-4: SAMPLE WEIGHTS..................................................................................................... 98 FIGURE A-5: EXPECTED SAMPLING ERROR.................................................................................. 100 FIGURE A-6: POOLED SAMPLING ERROR—EXPRESSED AS PERCENTAGES FOR GIVEN SAMPLE
SIZES (ASSUMING P=Q)....................................................................................................... 102 TABLE B.1: SIGNIFICANT DIFFERENCES AMONG 34 MODOT PERFORMANCE ITEMS COMPARED TO
GENDER ............................................................................................................................... 114 TABLE B.2A: SIGNIFICANT DIFFERENCES—CURRENT SATISFACTION MEANS COMPARED TO
RESPONDENT’S AGE FOR MODOT PERFORMANCE ITEMS ................................................... 115 TABLE B.2B: SIGNIFICANT DIFFERENCES—MEANS FOR DESIRED FUTURE ATTENTION COMPARED
TO RESPONDENT’S AGE FOR MODOT PERFORMANCE ITEMS .............................................. 116 TABLE B.3: SIGNIFICANT DIFFERENCES AMONG MEANS OF 34 MODOT PERFORMANCE ITEMS
COMPARED TO EDUCATIONAL LEVELS ................................................................................ 118
7
TABLE B.4: SIGNIFICANT DIFFERENCES AMONG 34 MODOT PERFORMANCE ITEMS COMPARED TO AVERAGE NUMBER OF MILES DRIVEN................................................................................. 119
TABLE B.5: SIGNIFICANT DIFFERENCES OF MEANS FOR COMMERCIAL VS. NON-COMMERCIAL DRIVERS FOR 34 MODOT PERFORMANCE ITEMS................................................................. 120
TABLE B.6: SIGNIFICANCE OF AGE CATEGORIES ON RATINGS OF CURRENT SATISFACTION ........ 121 TABLE B.7: SIGNIFICANCE OF AGE CATEGORIES ON RATINGS OF FUTURE ATTENTION ............... 122 TABLE B.8: SIGNIFICANCE OF AGE CATEGORIES ON DISCREPANCY SCORES ............................... 123 TABLE B.9: SIGNIFICANT DIFFERENCES IN RATINGS OF CURRENT SATISFACTION WITH MODOT
PERFORMANCE COMPARED TO ANNUAL MILEAGE DRIVEN BY RESPONDENTS.................... 124 TABLE B.10: SIGNIFICANT DIFFERENCES IN RATINGS OF FUTURE ATTENTION COMPARED TO
ANNUAL MILEAGE DRIVEN BY RESPONDENTS..................................................................... 125 TABLE B.11: SIGNIFICANT DIFFERENCES IN DISCREPANCY SCORES COMPARED TO ANNUAL
MILEAGE DRIVEN BY RESPONDENTS ................................................................................... 126 TABLE B.12: SIGNIFICANT DIFFERENCES IN MEAN RATINGS OF CURRENT SATISFACTION
COMPARED TO NUMBER OF YEARS LIVED IN MISSOURI OF RESPONDENTS.......................... 127 TABLE B.13: SIGNIFICANT DIFFERENCES IN MEAN RATINGS OF FUTURE ATTENTION COMPARED TO
NUMBER OF YEARS LIVED IN MISSOURI OF RESPONDENTS.................................................. 128 TABLE B.14: SIGNIFICANT DIFFERENCES IN MEAN DISCREPANCY SCORES COMPARED TO NUMBER
OF YEARS LIVED IN MISSOURI OF RESPONDENTS................................................................. 129
8
Transportation Customer Survey 2003
Executive Summary This Transportation Customer Survey (TCS), undertaken from May-June 2003, replicates and
expands the Constituent Service Quality Survey conducted in 2000 by the University of
Missouri-Columbia. The study sample for TCS was comprised of 4,000 respondents with four
hundred respondents in each of the ten MoDOT regional districts. This level of sampling
provides valid and reliable data in each of the districts, as well as for the state as a whole with a
sampling error of +/- 3 percent at the 95 percent level of confidence. The survey was
implemented under contract with a commercial survey firm, and the process achieved an
excellent 67.1 percent rate of response.
With input from MoDOT stakeholders, some changes were made in the questions from the 2000
survey instrument to reflect MoDOT priorities and recent contextual changes. Between the two
surveys, a baseline of thirty-one items reflecting areas of MoDOT performance was retained for
an analysis of improvement. Additional data is analyzed and summarized at the statewide level
and for district management.
Missouri citizens express overall satisfaction with MoDOT’s performance and available
transportation system options.
Over two-thirds of the statewide sample respondents expressed satisfaction with MoDOT and
more than three-quarters were satisfied with their transportation options. Among respondents
claiming to be dissatisfied, about five percent claimed “extreme” dissatisfaction with their
transportation options and roughly seven percent cited serious discontent overall with MoDOT.
Older and younger respondents tended to give MoDOT higher satisfactory ratings regarding their
overall satisfaction than did the middle-aged respondents, with respondents aged 45-54 more
likely to rate MoDOT dissatisfactory on this question than other groups.
The oldest respondents tended to give MoDOT more satisfactory ratings regarding their
transportation options than did the younger age respondents, with those respondents 45-54 years
old more likely to rate MoDOT dissatisfactory on this question than all other groups.
Respondents with an eighth grade education or less gave MoDOT the highest percentage of
satisfactory ratings on the question of overall performance and transportation options. Those

9
with a high school education or less were more likely to give MoDOT satisfactory ratings on
both questions.
Most citizens satisfied with MoDOT performance in variety of specific areas of
performance.
Thirty of the thirty-four items regarding MoDOT’s current performance received either
“satisfied” or “extremely satisfied” ratings by more than half the respondents surveyed. The
mean rating for almost all thirty-four items in the survey was above 2.50, the mid-point of the
scale used. The specific items with the highest ratings of satisfaction reflect technical aspects of
highway management, while those items with the lowest ratings are those related to pavement
quality and resource management. The ratings display many significant differences among
respondent characteristics meaning the overall ratings cannot be widely generalized to all
citizens.
Most citizens feel there is room for improvement in MoDOT’s performance in many
specific areas of work.
All thirty-four areas of performance were ranked as needing “more” or “a lot more” future
attention by over half the TCS respondents. The areas of greatest need for future attention were
those concerning pavement quality maintenance and meeting future demands on the highway
system. Respondents’ opinions about where future attention should be placed were quite strong,
with twenty-nine of thirty-four items having a mean rating of over 3.0 (on a 4.0 scale). As with
ratings of current satisfaction, respondent characteristics generally matter in understanding the
nature of future attention ratings.
MoDOT perceived to be a strong performer but with significant differences between
current satisfaction and ratings of need for future attention.
Constituents feel that, for the kinds of things they see and experience daily on the highways and
in other transportation experiences, MoDOT is a strong performer. Discrepancy scores for some
items exceed –1.0 while, for many items, the difference between ratings of current satisfaction
and future attention is less than –0.5. All characteristics of respondents investigated make some
difference regarding the discrepancy indicators and some, like age and education make a
significant difference in nearly all the resulting differences.
10
TCS respondents do not have a clear preference for sources to increase MoDOT’s fiscal
base.
Only about thirty-six percent of the respondents believe that MoDOT receives enough money to
do what is expected of it. Respondents were asked to consider which sources of additional
revenue they would support for increasing MoDOT funding. They were given a number of
possible choices and asked to rank their preferences. The results show that there is no consensus
as to how additional funding should or could be provided to MoDOT, suggesting that some
combination of sources may be most acceptable, although perhaps more complicated to arrange.
When given four possible choices, respondents allocated about twice as much of the fuel tax
revenues to maintenance of the current system as to new construction.
Respondents allocated, on average, forty-two percent of the total fuel tax revenue to maintenance
of the existing system. New construction attracted an average allocation of twenty-three percent
with safety improvements and reducing congestion each attracting less than twenty percent of the
tax revenues collected. As the level of overall satisfaction with MoDOT’s performance declines,
respondents generally allocated more funds to maintaining the current system. These additional
funds were taken from those allocated to safety. Not only does age of the respondent make a
significant difference (in three of the four choices), but all respondent characteristics show some
degree of significant difference in the related response pattern.
TCS respondents generally indicated a high to moderate level of trust in MoDOT to
perform as desired.
In all six areas posed to respondents (e.g., spending public funds efficiently, allocating funds
fairly, providing a quality transportation system, completing highway projects on time and other
related activities), the reactions indicate over sixty percent of respondents indicate they trust
MoDOT to perform at least “to some degree” or “to a great degree.” The tendency is clearly
toward the trusting “to a great degree” end of the distribution rather than trusting “not at all.”
Trust in MoDOT is not related to the number of years a respondent has lived in Missouri.
However, the higher the mileage driven annually by respondents the higher the level of trust
assigned to MoDOT by the respondent for most of the six survey items. Even for commercial
drivers, only one of the six areas showed any significant difference. The general pattern of
responses for commercial drivers is quite similar to that for the total sample. Most all the items

11
indicate that sixty percent or more of commercial drivers feel they can trust MoDOT to perform
in the areas investigated.
There is little support among TCS respondents for continuing to distribute fuel tax to other
state agencies.
The results of TCS interviews indicate that there is little support for the statute that mandates
distributing fuel tax to other state agencies. At the same time, respondents indicate substantial
support for continuing to distribute a portion of these revenues to city and county governments.
Compared to the results of the 2000 survey, MoDOT has made modest progress in
improving its performance.
Thirty-one items from the 2000 CSQS survey were repeated in the TCS and the majority of the
items show small amounts of absolute improvement in current satisfaction with MoDOT’s
performance, reduction in the amount of future attention MoDOT needs to spend to address
specific performance areas and smaller discrepancy scores. The trend is positive even though the
absolute magnitude is not yet substantial, and only three years have expired since the baseline
was established—a very short time in the context of the department’s work.
TCS sample generally reflects the demographics of the state with only minor variations.
The MoDOT statewide sample is largely representative of the state as a whole and deviates from
the overall state population only in minor ways by gender, age and education. The MoDOT
sample under-represents respondents in the two youngest age categories and over-represents
people in the 55 to 64-age group. Almost two-thirds of respondents are employed and twenty-
one percent are retired. The sample contains fewer respondents without a high school diploma
than is characteristic of the state population. About seventy-four percent have been state
residents for at least twenty-one years. Six hundred ninety-six respondents have special
transportation needs due to their own disability or caring for someone with a disability. Twelve
surveys were conducted in Spanish.
The next statewide transportation customer survey is planned for 2006.

12
Chapter 1: Missouri Department of Transportation Customer Survey (TCS)
Acquiring reliable citizen input for decision-making in state agencies is a continuing
challenge, one compounded by recent administrative policies that require agencies also to
measure and base decisions on “performance” of their programs. The level of citizen satisfaction
with the services provided by state agencies is generally considered a useful supplement to other
measures of agency performance. The Transportation Customer Survey (TCS) and its
predecessor, Constituent Service Quality Survey—CSQS, were designed to provide this kind of
input for Missouri Department of Transportation (MoDOT) decision-makers.
Context for Survey Design: Missouri Transportation Issues In July 1997, the Missouri Total Transportation Commission (TTC) was formed to
review MoDOT’s 15-Year Highway Plan, formulated in 1992. The TTC studied all modes of
transportation, reviewed needs and funding sources and recommended a number of actions to
increase agency accountability. Increased accountability recommendations included improved
evaluation and oversight of its performance.1 These improvements can be supported by assessing
the level of taxpayers’ satisfaction with the quality of services provided and systematically
gathering reliable data on taxpayer preferences for infrastructure management decisions.
Citizen input provides useful measures of satisfaction with agency performance in
delivery of services that, when combined with other measures of performance (such as annual
number of bridges repaired or reconstructed), can help establish public accountability for
transportation officials. Citizen input that reflects taxpayer perceptions of needs and priorities
regarding public investment decisions in transportation is also useful to help guide agency
personnel in meeting their management responsibilities.
Statewide Survey of Constituent Satisfaction with Service Quality In order to gauge public needs, values and perceptions on MoDOT performance items
and other variables related to transportation in Missouri, the agency contracted with the
1 Italics added for emphasis. Also included in the recommendations were changes in the manner in which highway improvements are funded, better cost controls implemented within MoDOT and detailed base budget reviews conducted annually.
13
University of Missouri-Columbia (UMC) to undertake a statewide survey of Missouri taxpayers.2
The first such study (Constituent Service Quality Survey—CSQS) was completed in 2000. Three
years later, MoDOT requested that UMC replicate this study so that a comparison of
performance satisfaction measures and perceived priorities for management could be made. After
consultation with MoDOT staff and several stakeholders, a few minor changes were made to the
original survey. A survey firm was hired to gather and provide the data to be analyzed. UMC
completed the data analysis, compared the 2003 results with those from 2000 and reports the
results in this document. As before, the focus is on measuring perceived levels of satisfaction of
MoDOT constituents with present performance and expectations regarding future attention given
to specific performance aspects of MoDOT’s work.
The approach used measures both expectations and perceptions to determine where there
are gaps relevant to agency performance. These include gaps (determined by subtracting ratings
of future priority from ratings of current satisfaction) such as the difference between
constituents’ expectations and their perceptions of the service received. Over the long term,
narrowing the gaps defined by these data provides important indicators of agency performance.
These differences represent useful benchmarks to help define areas of improvement in
performance. The approach provides valuable short-term feedback to MoDOT that is useful and
reliable.
Developing the Survey Instrument Initially, discussions were held with MoDOT representatives who formed the TCS
Advisory Committee for this study. This committee is comprised of representatives from various
units within MoDOT including: district offices, general headquarters, public information,
planning, and research development and technology. With the assistance of this group, a review
of the specific performance areas identified for assessment that correspond to the work
performed and decisions made by MoDOT was completed. These areas were used as the basic
measures of agency performance. When combined with a four-point scale that asked respondents
to rate their level of satisfaction with MoDOT performance in these areas (from “extremely
satisfied” to “extremely dissatisfied”), the data collected can be used as reliable indicators for
2 For the purposes of this report, the initial definition of MoDOT “constituent” will be the taxpayer and the terms “customer,” “citizen,” “taxpayer” and “constituent” are used interchangeably. Operationally, this will mean the respondent definition is based on “households” (as telephone surveys can be most efficiently conducted using random digit dialing of telephone exchanges in Missouri that are tied to households rather than individuals.)

14
measuring perceived performance. The same items were used in the survey instrument in a
second section (with the same four-point scale) asking respondents to indicate the level of
attention they felt MoDOT should assign these areas in the future. The final step in the analysis
involves creating indicators by subtracting the scale scores assigned by each respondent for
current satisfaction and future priority as indicated in Figure 1.1.
Figure 1.1: Computation Method for Discrepancy Indicator
These thirty-four areas are listed in Table 1.1 and include items related to safety, maintenance,
new highway construction, multi-modal issues and management of resources. An additional
listing is also located on the inside of the back cover for easy reference. (Those items new to the
2003 survey are noted with an asterisk.)
Another source of information was a series of key stakeholder interviews conducted by
the research team. The MoDOT TCS Advisory Committee identified stakeholders representing
various interested parties in the state including public transportation services, community
governments, emergency service providers, planning and development councils, and state
legislators (see Appendix C). Successful face-to-face interviews were conducted with twenty of
these individuals, and information was obtained about many “issues” the stakeholders felt should
be addressed by the study. Many stakeholders felt strongly that constituent perceptions of
MoDOT’s management of its resources, and planning and priority-setting procedures should be
included in the study as they were in the original study.
Information from these sources was assembled and a final draft instrument was reviewed
with the TCS Advisory Committee. Upon approval by this group, a Request for Proposals was
issued by UMC for “telephone survey services” to about twenty potential providers. Ten bids
were received and evaluated by the Principal Investigator and MoDOT Research, Development
and Technology (RDT) staff. A contract was established with SRBI based on the reasonableness
of the price quoted, the technical quality of its bid and its experience in transportation related
survey work. Once SRBI had prepared a draft of the survey for implementation, the Principal
Investigator traveled to the survey center to supervise a test of the instrument. This test honed the
(Level of current satisfaction in area) — (Level of future priority to assign to area) DISCREPANCY =

15
Table 1.1: Listing of 34 Items Included in the Survey
Item # Item Description
1 Using electronic message boards to advise drivers of delays or construction areas 2 Placing yellow warning signs to assure sufficient response time 3 Removing snow/ice efficiently 4 Having signs that can be easily seen at night or in bad weather 5 Building bridges that last a long time 6 Providing useful information about construction, repairs or road conditions 7 Providing lanes that are wide enough for safe driving 8 Communicating with the public in easy to understand language 9 Building bridges that are wide enough to feel safe
10* Providing the ability to see far ahead on highways and have unobstructed views at intersections 11 Striping center lines and road edges to ensure safety 12 Lighting interchanges and bridges 13 Providing crosswalks and signals for pedestrians to cross the highway safely 14 Treating highway surfaces to resist skidding in wet weather 15* Managing traffic flow in construction zones to minimize delays to drivers 16 Providing enough passing opportunities on two-lane highways 17 Providing pavement markings that can be easily seen in wet weather 18 Providing passenger light rail routes that meet your needs 19 Building new highways to meet future demand 20 Providing the public with adequate opportunities for input in project planning 21 Providing sufficient transportation for those who don't or can't drive 22 Honoring commitments to provide and maintain Missouri's transportation system 23 Planning a project in a reasonable amount of time 24 Completing road and bridge construction and repairs in a timely manner 25 Providing shoulders that are wide enough to pull off the road safely 26 Providing Amtrak passenger rail service to meet your needs 27 Improving existing highways to meet increasing traffic demands 28* Acting on recommendations from the public 29 Providing pedestrian/bicycle pathways on or next to highways that are safe 30 Providing pavement that lasts a long time 31 Using public funds in a cost-effective manner 32 Repairing pavement surface promptly 33 Distributing transportation funds fairly to all areas of the state 34 Maintaining the pavement so it provides a smooth ride
Note: New performance items for TCS 2003 are marked with an asterisk.
questions removing any items that were confusing and determining where item wording should
be changed. Several minor changes were made to facilitate implementation. The Principal
Investigator approved the final instrument in April 2003, and the data collection commenced.

16
Data were collected over a five-week period, ending about June 5, 2003. SRBI provided a
cleaned data set and technical report on the survey methodology used to the Principal
Investigator in early July 2003.
Report Outline The following chapters in this report present the research methodology, survey
respondents, and survey results and research findings. Chapter 2 provides an orientation to the
data collection methodology, as well as an introduction to the kinds of analyses and subgroup
comparisons used throughout the data discussion. Chapter 3 presents data on various
characteristics of the survey sample. The first sections examine respondent social and
demographic characteristics. Later portions focus on transportation and driving habits of the
sample, including such variables as annual miles driven, license types and service usage.
Chapter 4 presents respondent ratings of thirty-four MoDOT performance dimensions ranging
from safety to the effective use of public funds. The focus in this chapter is on respondents’
ratings of satisfaction and their opinions about the level of future attention that various activities
ought to receive. Chapter 5 presents the description and analysis of differences between
respondents’ ratings of satisfaction and their opinions about future attention. Chapter 6 moves
from the analysis of survey items to other aspects of customer satisfaction with MoDOT
operations such as attitudes towards resource allocation. Chapter 7 compares the results of the
TCS with the baseline created in the CSQS in 2000 and a more integrated discussion of the
implications of the survey data for MoDOT management and planning.
The Appendices to this report includes additional information on the TCS team and
stakeholders consulted in this project, the complete methods discussion used in the TCS and a
complete set of statewide results for survey variables. Part 2 of this report contains the summary
results for each MoDOT district.

17
Chapter 2: Study Methodology and Data Presentation
This chapter presents information on the research design, sample and collection
methodology, as well as an introduction to the general types of analyses contained in this report.
Data for this project were collected through telephone surveys of 400 randomly chosen telephone
listings in each of the ten MoDOT districts in the state (see Figure 2.1).
Research Sampling Design MoDOT representatives requested data on a statewide and district basis. The overall
sample size was determined according to a binomial percentage distribution of 60/40 on a
hypothetical dependent variable with a sampling error of plus or minus 2.9 percent at a ninety-
five percent level of confidence. In essence, the goal was to maintain a maximum sampling error
of plus or minus three percent for each district and the state as a whole. Using these criteria, and
building in a modest statistical buffer, the goal was to collect 4,000 interviews statewide from
residents aged eighteen years and above. Table 2.1 shows the overall sampling design numbers
and total usable surveys collected.
Survey Implementation Data collection was completed by SRBI, a commercial firm specializing in telephone
surveys. SRBI selected respondents through use of a procedure called “list-assisted random-digit
dialing.” This method efficiently takes advantage of the availability of large computer databases
of telephone directory information. The random digit aspect of the sample selection avoids
response bias and provides representation of both listed and unlisted numbers (including not-yet-
listed). The design of the sample ensured this representation by random generation of the last
two digits of telephone numbers selected on the basis of their area code, telephone exchange and
bank number. A working bank is defined as 100 contiguous telephone numbers containing three
or more residential listings. Although this process takes longer because it does not exclude
unused numbers, businesses, fax/modems or other unusable listings, it is the most random of all
approaches. Telephone numbers were generated by random selection within zip codes
encompassed in each district.

18
Figure 2.1: Map of MoDOT Districts (Basis of Sampling Frame)

19
Table 2.1: Sample Design
North West
North Central
North East St. Louis Central Kansas City
South West Springfield
South Central
South East Total
District Population Size 152,952 135,488 148,247 1,431,466 344,975 830,286 242,861 394,075 191,869 295,300 4,167,519
% of State Population 3.7 3.3 3.6 34.3 8.3 19.9 5.8 9.5 4.6 7.1 100%
Sample Size 400 400 400 400 400 400 400 400 400 400 4,000
Completed and Usable Cases 401 402 399 401 400 401 402 400 401 403 4,010**
Sample Weight 0.366 0.323 0.356 3.426 0.828 1.982 0.580 0.946 0.459 0.703 N/A
Proportional Sample Size* 146.77 129.85 142.40 1373.83 331.20 796.76 233.16 378.40 184.06 283.31 3,999.73
% of Total Sample, Weighted 4% 3% 4% 34% 8% 20% 6% 9% 5% 7% 100%
*Proportional Sample Size represents the number of “good numbers” actually derived from the random sample of phone numbers available when business/government, cell phone, fax, etc., phone numbers are eliminated. Respondents only include individuals age 18 years and older. The population from which the sample was drawn includes all Missouri residents over 18 years of age. The proportional sample size does not equal 4,000 exactly due to the fractional components resulting from application of the weighting factors shown in the table. These have been rounded to the closest hundredths. For the analysis herein, each of these numbers is rounded to the nearest whole number.
**This number does not reflect the two surveys that were coded by hand rather than the automated system used by SRBI. See Appendix A.1 for a reference to this procedure. The total sample of completed interviews is 4,012.

20
SRBI used the Trodahl-Carter-Bryant (T-C-B) respondent selection method to select
eligible respondents from households randomly contacted for the study. The T-C-B method
requires the interviewer to ask two questions shortly after the introductory statements, “How
many adults aged eighteen or over live in your household, including yourself?” and “How many
of them are women/men?” Based on the answers to the two questions, the interviewer can
objectively select the most appropriate respondent using the selection matrix that appears on
their computer screen. The likelihood of within-sampling-unit non-coverage error is thus
minimized because all eligible respondents in a household are equally considered by the
selection method.
SRBI enumerators made at least five attempts to reach “ring, no answer” numbers before
dropping that number from the sample list. The calls are scheduled each day between 4:30 pm
and 9:30 pm (CDT) to maximize the chances of making contact with a potential respondent. All
refusals are contacted at least one additional time in order to (attempt) to convert them to
completed surveys.
The data was collected in May and June 2003. Interviews lasted an average of 20.1
minutes. Twelve surveys were conducted in Spanish. Overall, the response rate was 67.1 percent.
The total number of refusals was 303 among potential respondents. Given the topic and length
of the survey, the response rate is exceptional and constitutes a sufficiently high percentage to
maintain specified confidence intervals. The survey sample was compared to the state
population as a whole to examine possible demographic and social biases, and these comparisons
are reported in Chapter 3.
The final usable total sample includes 4,012 respondents distributed as shown in Table
2.1. Given the initial “buffer” built into the original targeted survey numbers, the final statewide
and region sample numbers satisfy statistical requirements that the data contain a less than +/- 3
percent sampling (or other random) error with a 95 percent confidence interval. As indicated in
Table 2.1, the original sample of 4,012 respondents does not accurately represent the state as a
whole as the same number of respondents in each district is not proportional to the population
found in each district. So, in order to eliminate the bias in the original sample, the results were
weighted. The weighting factors (shown in Table 2.1) were calculated. The calculation was
based on the ratio of district to state population. This sample weight for each district produces a
number of respondents (for the statewide analysis) that is proportional to the population in each

21
district (as of 2000). The resulting “proportional sample size” is equivalent to this proportion as
noted in the last row of Table 2.1. A complete review of the study methods is provided in
Appendix A.
Descriptive Analysis and Significance Testing Most of the data discussions in the following chapters include descriptive statistics on
each survey item, including mean scores and respondent percentages within categories. Where
mean scores are presented, readers will typically find mention of the scale endpoints (e.g., “scale
of 1-4”) and a descriptor of the value at each endpoint (e.g., “1=very dissatisfied, 4=very
satisfied”). By far, the most commonly utilized scale in this research is a four-point Likert scale.
For example, satisfaction levels are rated along the following points: 1=extremely dissatisfied,
2=dissatisfied, 3=satisfied and 4=extremely satisfied. Similarly, ratings of future attention that
ought to be devoted to various performance items are given as 1=a lot less, 2=less, 3=more and
4=a lot more. With the use of four-point scales, the mean score that would represent a mid-point
of respondent evaluations (e.g., as dissatisfied/satisfied) is 2.50. The four-point scale was used
throughout the survey to ease comparative research and to provide respondents (and readers)
with an unambiguous ordinality of response categories.
The analysis of the MoDOT data includes both univariate and bivariate analysis.
Univariate analysis focuses on examination of the distribution of cases on one variable at a time.
In most cases, the format is solely one of frequency distributions of grouped data, e.g.,
percentage of respondents who answered “yes” or “no” to a particular question, or percentages of
respondents selecting each point on an ordinal scale. The “mean” (or average response) is also
reported on many items. Bivariate analysis is used for inferential analysis of subgroup
comparisons (e.g., between sample regions). In making inter- or intra-group comparisons, only
tests of statistical significance are considered. The most common procedure used in reporting
the data is significance testing of mean scores between subgroups of the survey sample. In
essence, a designation of significant difference in this report denotes that the reported differences
between groups will occur by chance or sampling error in only five of every one hundred
instances. The second test of significance used is that of chi square (X2) analysis, which
examines the observed distribution of values on two separate variables and computes the
conjoint distribution that would be expected if there were no relationship between the variables.
Chi square analysis compares the expected and actual distribution of cases and determines the

22
probability that any discovered differences could have resulted from sampling error alone. As
with means testing, only chi square analyses with a probability value (or p-value) of <. 05 are
reported as significant.
Sample Subgroups A major dimension of the analysis of the MoDOT data is subgroup analysis. In
accordance with preferences communicated by the Transportation Customer Survey (TCS)
Advisory Committee, many survey items have been subjected to comparative analysis based on
gender, age, education, income, annual miles driven and possession of a commercial driving
license. Table 2.2 shows the composition of each subgroup and the basis of its derivation.
Throughout this report, references to comparative analysis of any subgroup refer to the
categories noted in this table. Primarily, subgroup analysis is performed on the statewide or total
sample (e.g., gender differences statewide). In Part 2, each district’s summary report is provided.
Summary In summary, a systematic random telephone survey was implemented in May-June 2003.
Trained enumerators collected 4,012 usable surveys, including approximately 400 surveys from
each MoDOT district. Statewide and district sample size ensures a sampling error of no more
than plus or minus 2.9 percent at a 95 percent level of confidence.
The survey data were subjected to both univariate and bivariate analyses. Comparative
subgroup analysis involved testing for significant difference based on respondent geographic
region, gender, age, education, 2000 household income, annual miles driven and whether or not
respondents had a commercial driving license. All references to statistically “significant”
difference are cases where the level of statistical significance is .05 or greater.

23
Table 2.2: Composition of Subgroups
Subgroup Category Number (n) Basis of categorization Total Sample Size Total 3,999.73 Total after application of weighting factors to actual number of
telephone interviews (4,012). Zip code associated with telephone prefix. In cases where a prefix crossed regional lines, regional location was determined by the zip code's primary geographic location.
Gender Male 1,911.00 Female 2,089.00
As noted by interviewer.
Age 18-24 345.204 25-34 609.615 35-44 826.155 45-54 810.711 55-64 663.494 65 or older 730.138
Self-reported by respondents at time of their interviews. Responses were categorized into the following categories at the time of the interview.
Education High School Diploma or Less 1,428.180
At least some college 2,559.991
Self-reported by respondents at time of their interviews. Education levels were reported in seven categories.
Miles driven (2002)
<10,000 miles 1058.085
10,000-20,000 miles 1377.683
>20,000 miles 1248.531
Self-reported by respondents at time of their interviews. Miles driven were reported as continuous variable and categorized for analysis.
Years Lived in Missouri < 10 years 464.129 10-19 years 457.904 20-29 years 677.013 30 years or more 2392.827
Self-reported by respondents at time of interviews. Years lived in Missouri were reported as actual years and categorized for analysis.
Commercial Driving Yes 411.277 No 3586.968 Self-reported by respondents at time of their interviews. *The number (N) for each category does not always total 4,000 (total weighted sample) due to missing/refusal responses. The missing/refusal Ns are as follows: age (14.413), education (11.559), miles driven (315.431), years lived in Missouri (7.857) and possession of a commercial license (1.485). In following sections, all numbers are rounded to the nearest whole number to facilitate presentation (i.e., 3,999.73 = 4,000).

24
Chapter 3: Social, Demographic and Transportation Characteristics of the MoDOT Survey Sample
This section describes general social, demographic and transportation characteristics of
the total MoDOT survey sample. The first section discusses basic demographic and social traits;
the second portion presents information on the transportation characteristics, particularly items
linked to driving habits.
General Demographic and Social Characteristics
The objective of this section is to describe some of the basic social and demographic
characteristics of the statewide sample.
Table 3.1: Social and Demographic Characteristics of the Survey Sample
Characteristics % of Total
Characteristics
% of Total
Age Years in Missouri 18-24 8.6 Less than 6 years 7.6 25-34 15.2 6-20 years 18.2 35-44 20.7 21 or more years 74.2 45-54 20.3 Employment Status 55-64 16.6 Employed Full Time 54.0 65 or older 18.3 Employed Part Time 9.0 Gender Unemployed 2.7 Male 47.8 Retired 21.4 Female 52.2 Student 2.7 Education Homemaker 7.1 Less than HS Graduate 6.8 Disabled 2.1 High School/GED 28.9 Other 1.0 Some College/No Degree 26.4 College Graduate 22.1 Post Grad/Prof.-Bus. School 15.5
Numbers in characteristics categories may not add to 100 due to missing data or non-responses.
Respondents between 35 and 54 years of age account for about forty percent of the sample.
Individuals age 35 to 44 years comprise the largest single group. The overall respondent pool is
52.2 percent female. The educational profile of the total sample includes about 35.7 percent with
a high school education or less, approximately one-quarter with some college and the remaining
37.6 percent with a completed college education or an advanced degree. The total sample shows
little inter-state mobility, with just under three-quarters claiming residence in Missouri for more

25
than twenty years. Approximately two-thirds of respondents are employed, the majority with
full-time work. Twenty-one percent of the sample is retired.
Comparisons of MoDOT Survey Sample Characteristics with State Population Differences between the MoDOT survey population and state population as a whole are
minor. The MoDOT survey respondents are slightly older, slightly more frequently female and
more highly educated. In terms of age, the MoDOT sample under-represents respondents
Table 3.2: Comparisons of Missouri Census Data and MoDOT Survey Sample
State of Missouri* MoDOT Survey Sample** Age 18-24 12.9% 8.6% 25-34 17.7% 15.2% 35-54 39.1% 40.9% 55-64 12.2% 16.6% 65 or older 18.1% 18.3% Gender Male 48.6% 47.8% Female 51.4% 52.2% Education Less than HS Graduate 31.5% 6.8% High School/GED 27.6% 28.9% Some College/No Degree 22.8% 26.4% College Graduate 18.2% 37.6% * State totals based on the 2000 Census. ** The missing/refusal Ns are as follows: age (13), education (14). Totals may not add to 100 due to missing/refusals that are not counted.
in the two youngest age categories and over-represents people in the 55-64 age group. The
MoDOT sample is about fifty-two percent female, slightly higher than the proportion of females
in the state population. Finally, the survey sample contains far fewer respondents without a high
school diploma than is characteristic of the state population as a whole. The two groups are
similar in terms of high school graduations, but the MoDOT group has significantly more people
with at least some years of college education.
Respondent Transportation Characteristics Respondents were asked, “Approximately how many miles do you drive per year,
including miles driven for both pleasure and business?” The average number of miles driven

26
was 17,735. The largest percentage of respondents (34.0 percent, N=1,378) drives 10,000-
20,000 miles per year. When the number of miles driven per year was analyzed statewide across
five demographic variables (age, gender, education, income and commercial driver status) all
were statistically significant. Males were more likely to drive 10,000 or more miles per year
than females. Females were more likely to drive less than 10,000 miles per year or not to drive.
Those aged 65 and older were more likely not to drive or to drive less than 10,000 miles
per year than those under the age of sixty-five. Respondents aged 35-44 were more likely to
drive 20,000 or more miles per year than other age groups. Respondents with a high school
education or less were more likely to drive 10,000 miles annually or less. Commercial and
professional drivers were twice as likely to drive 20,000 miles or more per year than non-
commercial drivers.
All respondents were read a list of five common reasons people drive or made trips and
asked to indicate whether or not they drove or make trips for each reason. The five reasons are
commuting to or from work or school, personal or family errands (shopping, doctor’s
appointments, church, etc.), work related trips (sales calls, business meetings, etc.), pleasure or
recreation trips (vacations, visiting friends or relatives, etc.), or farm and agricultural trips. The
data indicate that the most frequent reason for making trips or driving was commuting (66.9
percent, N=2676) and that the least frequent reason for making trips was for farm or agricultural
reasons (0.1 percent, N=6).
Respondents were asked, “Do you do any commercial or professional driving?” Of the
4,000 respondents, 10.2 percent (N=411) responded, “Yes.” Commercial/professional drivers
drive significantly more miles per year than non-commercial drivers; commercial drivers average
33,627 miles; non-commercial drivers average 15,920 miles. Commercial drivers were more
likely to be male, less than 65 years of age and to drive 20,000 or more miles per year.
Respondents were asked, “Are you or anyone who relies on you for transportation
disabled?” Only 17.4 percent (N=696) of the respondents answered, “Yes.” Those with special
transportation needs due to a disability were statistically more likely to be 55-64 years of age or
older than those 18-34 years old. Respondents with special transportation needs were
statistically more likely to drive less than 10,000 miles per year. There are also statistically
significant differences between respondents with special transportation needs and those without
special needs when examined by gender, education or years lived in Missouri.

27
Respondents were asked, “Do you currently hold a valid driver’s license?” More than
ninety-five percent (3,804 respondents) indicated “Yes.” Respondents with a valid driver’s
license were statistically more likely to have completed “some college or more” for education, be
45-54 years of age, male, and to drive 10,000 or more miles per year. Commercial drivers were
more likely to have a valid driver’s license than non-commercial drivers.
In summary, the MoDOT statewide sample is largely representative of the state as a
whole and deviates from the overall state population only in minor ways by gender, age and
education. The largest proportion of survey respondents was between 35-54 years of age and is
about fifty-two percent female and forty-eight percent male. A majority has a least some college
education, with slightly more than thirty-five percent ending their formal education with a high
school diploma or less. Almost two-thirds of respondents are employed, and about twenty-one
percent of respondents are retired. While a small percentage (twelve percent) has lived in
Missouri less than ten years, slightly more than seventy-seven percent have been state residents
for at least twenty-one years.
The sample is somewhat comprised of respondents who annually drive less than 10,000
miles, that make up 26.5 percent of the sample (N=1058); respondents who drive between
10,000 and 20,000 miles that make up 34.4 percent of the sample (N=1378) and those who drive
more than 20,000 miles who represent 31.0 percent of the sample (N=1248). About five percent
have no driver’s license (N=190), while slightly more than ten percent report commercial or
professional driving (N=411). Almost sixty-seven percent commute to work (N=2676) while
only twenty-four percent (N=940) drive principally for personal and family reasons. Six hundred
and ninety-six respondents have special transportation needs due to a disability or because they
care for someone with a disability.
28
Chapter 4: Findings of the Survey: Perceptions of MoDOT Performance
The performance of Missouri’s Department of Transportation was measured in several
ways. Using multiple approaches provides greater confidence that the evidence gathered is
reliable and accurate, especially when using perception data from telephone surveys.
Constituents who agreed to be interviewed were asked questions about how they would rate their
satisfaction with current department performance in accomplishing a number of aspects of
transportation-related work. Constituents were also asked to rate each of these same items
regarding their perception about the degree of future attention that the department should give to
each aspect. These two dimensions—current satisfaction and future attention—were used to
compute discrepancy measures that are discussed in Chapter 5. Constituents were also asked a
broad question about their general level of satisfaction with MoDOT performance in providing
transportation services. These results are presented and discussed in this chapter.
Modifications made to this version of the survey involved eliminating performance items
(from the CSQS) on which MoDOT was considered to be performing well in 2000. Therefore, it
was considered unnecessary to ask customers of their perceptions on these items. Ten of the
original forty-one items were removed for this reason. Three new items that were added to the
instrument reflect aspects of MoDOT activities related to the management of construction sites
and congested traffic flow. The wording of two other items was modified to more accurately
reflect MoDOT efforts and make responses more accurate.
Overall Satisfaction Respondents were asked two general questions concerning their overall satisfaction with
transportation in Missouri. One inquiry asked them to give an overall rating of their satisfaction
with MoDOT as a provider of transportation services and a second solicited respondents’ ratings
of satisfaction with their available transportation options. Statewide, mean levels of satisfaction
are higher for transportation options (2.79, on a scale from 1=extremely dissatisfied to
4=extremely satisfied) than for MoDOT’s overall performance (mean of 2.66), and the mean
difference between the two issues is significant. The total number of respondents selecting each
of the satisfaction categories is shown in Figure 4.1.
Over two-thirds of the statewide sample expressed general satisfaction with MoDOT’s
overall performance. Over sixty-seven percent responded “satisfied” or “extremely satisfied.”

29
The responses to the question regarding satisfaction with available transportation options show
that seventy-six percent (Table 4.1) were either satisfied or extremely satisfied. Among
respondents claiming to be dissatisfied, about five percent claimed extreme dissatisfaction with
their transportation options and roughly seven percent cited extreme dissatisfaction with MoDOT
performance overall.
Table 4.1: Percent Responses by Response Category for General Satisfaction Questions in TCS
Satisfaction with Transportation Options
Overall Satisfaction with MoDOT Performance
Response Categories Percent Extremely Dissatisfied 4.7% 6.8% Dissatisfied 19.3% 25.5% Satisfied 68.0% 62.6% Extremely Satisfied 8.0% 5.1% Total 100.0% 100.0% TOTAL SATISFACTION Satisfied + Extremely Satisfied 76.0% 67.7%
There are several significant subgroup differences in overall satisfaction scores for both
questions. Age and education subgroups statewide show significant variance in ratings of overall
satisfaction for MoDOT. In terms of age differences, more respondents in the youngest age
category (18-24 years) and those over sixty-five gave MoDOT satisfactory ratings than did
respondents in the middle-aged groups (Figure 4.1). Respondents aged 18-24 and 65 and over
gave MoDOT the highest level of satisfaction ratings among all age categories for overall
satisfaction.
A somewhat similar age difference is found in respondent ratings of satisfaction with the
available transportation options. Figure 4.2 indicates that, as before, the oldest-aged group (65
and over) has a significantly higher number of respondents answering “satisfied” on this question
than other age groups. However, younger respondents tended to give MoDOT higher satisfactory
ratings regarding their transportation options than did the older age respondents except for the 65
and over group. As noted above, respondents more frequently expressed satisfaction than
dissatisfaction with their transportation options. Respondents aged 45-54 more frequently gave a
“dissatisfied” or “extremely dissatisfied” response than other age groups.

30
Figure 4.1: Percent of Respondents Expressing Overall Satisfaction with MoDOT Performance by Age Category
0 20 40 60 80
18-24
25-34
35-44
45-54
55-64
65 or olderAg
e of R
espo
nden
t
Percent of Respondents
Extremely SatisfiedSatisfiedDissatisfiedExtremely Dissatisfied
Figure 4.2: Ratings of Satisfaction with Available Transportation Options by Age Category
0 10 20 30 40 50 60 70 80
18-24
25-34
35-44
45-54
55-64
65 or older?
Age o
f Res
pond
ents
Percent of Respondents
Extremely SatisfiedSatisfiedDissatisfiedExtremely Dissatisfied
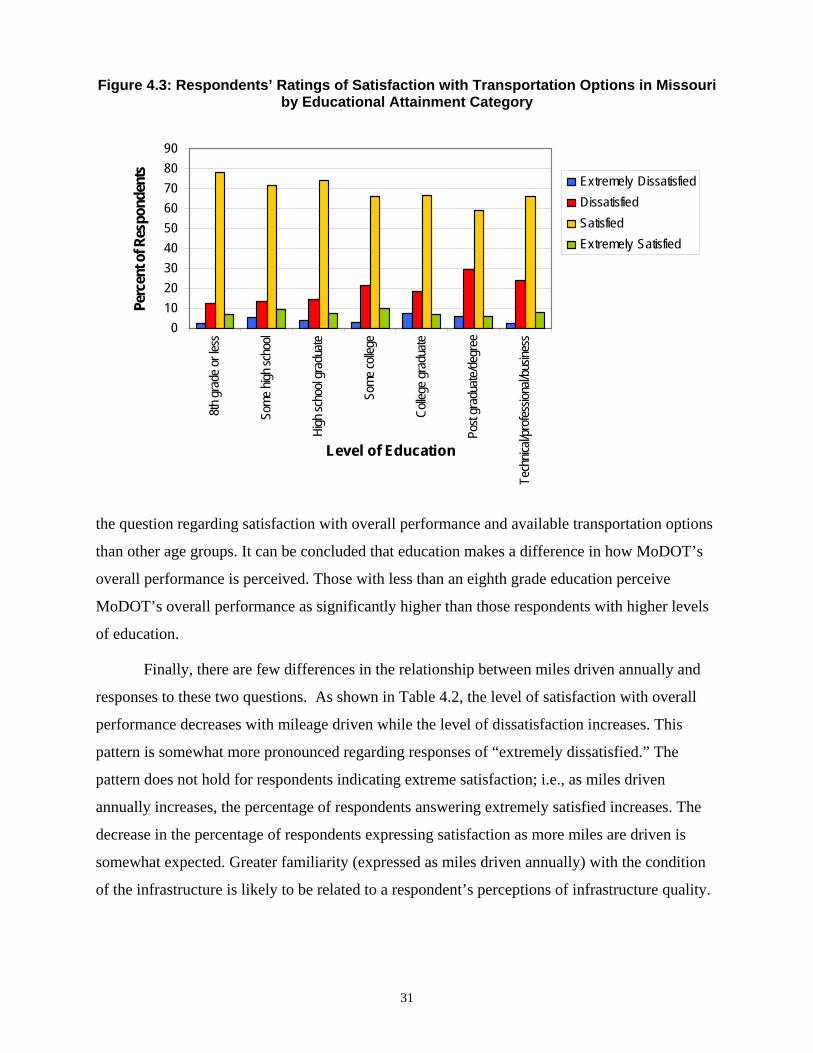
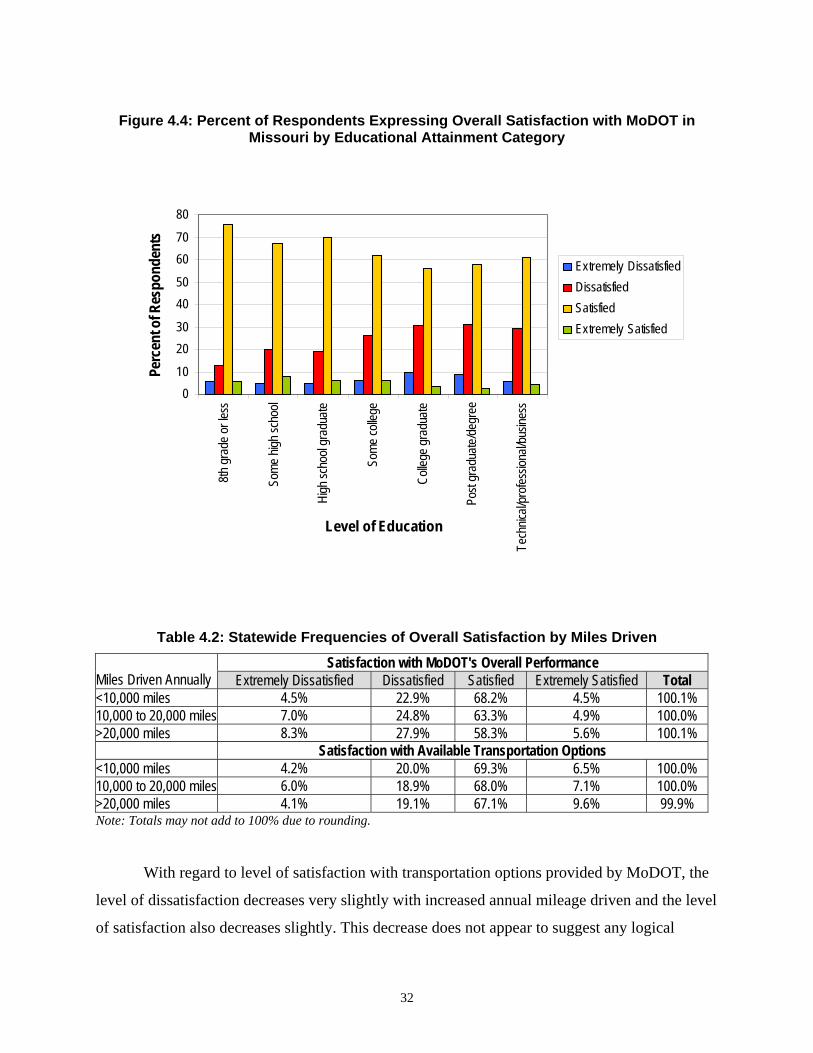
When examined by education levels, respondents with a 8th grade education or less gave
MoDOT the highest percentage of satisfactory ratings on the questions of overall performance
and transportation options (Figures 4.3 and 4.4). Those with a post graduate education were less
likely to give MoDOT satisfactory ratings on available transportation options, and those with a
college degree were less likely to give MoDOT satisfactory ratings on overall performance. The
difference between educational attainment groups is statistically significant. Those respondents
with “some college” education and college graduates more often responded “dissatisfied” to
31
Figure 4.3: Respondents’ Ratings of Satisfaction with Transportation Options in Missouri by Educational Attainment Category
0102030405060708090
8th gr
ade o
r less
Some
high
scho
ol
High
scho
ol gr
adua
te
Some
colle
ge
Colle
ge gr
adua
te
Post
grad
uate/
degr
ee
Tech
nical/
profe
ssion
al/bu
sines
s
Level of Education
Perc
ent o
f Res
pond
ents Extremely Dissatisfied
DissatisfiedSatisfiedExtremely Satisfied
the question regarding satisfaction with overall performance and available transportation options
than other age groups. It can be concluded that education makes a difference in how MoDOT’s
overall performance is perceived. Those with less than an eighth grade education perceive
MoDOT’s overall performance as significantly higher than those respondents with higher levels
of education.
Finally, there are few differences in the relationship between miles driven annually and
responses to these two questions. As shown in Table 4.2, the level of satisfaction with overall
performance decreases with mileage driven while the level of dissatisfaction increases. This
pattern is somewhat more pronounced regarding responses of “extremely dissatisfied.” The
pattern does not hold for respondents indicating extreme satisfaction; i.e., as miles driven
annually increases, the percentage of respondents answering extremely satisfied increases. The
decrease in the percentage of respondents expressing satisfaction as more miles are driven is
somewhat expected. Greater familiarity (expressed as miles driven annually) with the condition
of the infrastructure is likely to be related to a respondent’s perceptions of infrastructure quality.
32
Figure 4.4: Percent of Respondents Expressing Overall Satisfaction with MoDOT in Missouri by Educational Attainment Category
010
2030
4050
6070
808th
gra
de o
r less
Som
e high
scho
ol
High
scho
ol gr
adua
te
Some
colle
ge
Colle
ge gr
adua
te
Post
grad
uate/
degr
ee
Tech
nical/
profe
ssion
al/bu
sines
sLevel of Education
Perc
ent o
f Res
pond
ents
Extremely DissatisfiedDissatisfiedSatisfiedExtremely Satisfied
Table 4.2: Statewide Frequencies of Overall Satisfaction by Miles Driven
Satisfaction with MoDOT's Overall Performance Miles Driven Annually Extremely Dissatisfied Dissatisfied Satisfied Extremely Satisfied Total <10,000 miles 4.5% 22.9% 68.2% 4.5% 100.1% 10,000 to 20,000 miles 7.0% 24.8% 63.3% 4.9% 100.0% >20,000 miles 8.3% 27.9% 58.3% 5.6% 100.1% Satisfaction with Available Transportation Options <10,000 miles 4.2% 20.0% 69.3% 6.5% 100.0% 10,000 to 20,000 miles 6.0% 18.9% 68.0% 7.1% 100.0% >20,000 miles 4.1% 19.1% 67.1% 9.6% 99.9% Note: Totals may not add to 100% due to rounding.
With regard to level of satisfaction with transportation options provided by MoDOT, the
level of dissatisfaction decreases very slightly with increased annual mileage driven and the level
of satisfaction also decreases slightly. This decrease does not appear to suggest any logical

33
relationship except that additional options are considered desirable as more miles are driven. As
in the example above, the percentage of respondents answering extremely satisfied increases
with miles driven. In addition, the percentage of those answering satisfied with overall
performance is about the same as those expressing satisfaction with transportation options.
Another outcome of the analysis is found in a comparison of respondents’ ratings of
satisfaction with MoDOT’s overall performance and how they compare Missouri’s roadways to
those in other states (Table 4.3). Respondents were asked if they had driven in other state(s) in
the past year. All those who responded yes (seventy-seven percent, N=3083) were asked to rate
Missouri’s roads as “about the same,” “better,” or “worse” than those in the other state(s) in
which they had recently driven. Those respondents who rated Missouri’s roads “better” or “about
the same” compared to those in other states, were very likely to give MoDOT satisfactory ratings
on overall performance. Those respondents who rated Missouri’s roads “worse” were more
likely to rate MoDOT’s overall performance dissatisfactory. With regard to satisfaction with
transportation options available, respondents who rated Missouri’s roads as “better,” “worse” or
“about the same” as those in other states were more likely to give MoDOT satisfactory ratings.
These results were statistically significant. Thus, the only area in which respondents were
dissatisfied with available options or overall performance, based on their assessment of driving
experiences in other states was for those respondents who felt Missouri’s roads were “worse”
Table 4.3. Respondents’ Overall Ratings of MoDOT Compared to Driving Experiences in Other States
Satisfaction with Overall MoDOT Performance Ratings of Highway Conditions in Other States
Extremely Dissatisfied Dissatisfied Satisfied
Extremely Satisfied Row Total
Better 0.5% 12.7% 74.4% 12.4% 100.00% Worse 15.1% 42.5% 41.2% 1.2% 100.00% About the same 1.6% 16.7% 76.1% 5.6% 100.00% Don't know 7.5% 19.4% 61.2% 11.9% 100.00% Refused 0.0% 0.0% 100.0% 0.0% 100.00% Satisfaction with Available Transportation Options Better 3.0% 17.9% 63.9% 15.2% 100.00% Worse 6.4% 27.3% 61.0% 5.3% 100.00% About the same 4.4% 14.3% 73.0% 8.3% 100.00% Don't know 6.1% 24.2% 63.6% 6.1% 100.00% Refused 0.0% 0.0% 100.0% 0.0% 100.00%
than those in other states in which they had driven in the past year. Overall it appears that
respondents were as satisfied with MoDOT’s performance in providing a quality driving
experience as with that of the transportation agencies in other states.

34
Additionally, respondents were asked if they had contacted MoDOT in the past year
seeking information or assistance. About five percent of the respondents (N=221) had contacted
MoDOT for either reason. Respondents who contacted MoDOT were also asked if they were
successful in obtaining the information or assistance they needed. If respondents replied “yes” to
the question regarding their success in obtaining information or assistance, they were more likely
to rate MoDOT’s overall performance as satisfactory than those who had been unsuccessful
(mean scores of 2.50 vs. 1.90). This difference in means was significant at the 0.05 level.
Similarly, respondents were asked if they were satisfied or not with the response provided by
MoDOT in regard to the response meeting their needs (Figure 4.5). Except for respondents
answering “extremely satisfied,” the pattern of responses is as expected: as the number of
respondents who were satisfied with the response they got from MoDOT when they sought
information or assistance increases, their level of overall satisfaction also increases.
These results suggest a possible interpretation: respondents in this survey were fairly
thoughtful and discriminating in their judgments. Specifically, these results suggest they were
able to separate a general judgment regarding overall performance from specific instances in
which they considered how Missouri’s highways compared to those in other states. Additionally,
age and education both made a difference in the pattern of responses to overall satisfaction
questions. The number of miles driven annually did not make a clear difference in the response
pattern.
Figure 4.5: Mean Levels of Overall Satisfaction with MoDOT and Available Transportation Options Contrasted with Satisfaction in Meeting Needs after Direct MoDOT Contact
01020304050607080
Extremely Dissatisfied Dissatisfied Satisfied Extremely Satisfied
Satisfaction with Performance
Num
ber o
f Res
pond
ents
Who
se
Need
s Met
by M
oDOT
Con
tact
OverallOptions

35
Current Satisfaction with Aspects of MoDOT’s Transportation Work Survey respondents were asked “How satisfied are you with MoDOT’s current performance in
[item]” on thirty-four items related to aspects of the department’s transportation work on a four-
point scale (1= extremely dissatisfied, 2= dissatisfied, 3= satisfied and 4= extremely satisfied).
No midpoint rating was provided to encourage respondents to make a rating in one direction or
another. The thirty-four items covered topics on signage and signals, bridges, road maintenance,
bicycle and pedestrian issues, railroads, safety and customer service as presented in Table 4.4.
Using these responses, average rating scores were computed as indicators for each of the thirty-
four areas of performance. The same procedure was followed, using the same items, to secure
information from respondents regarding their expectations for future priorities to be placed on
these items by MoDOT. The scores are presented in graphic form for better analysis of areas in
which MoDOT performance may be managed and also analyzed for patterns correlating with
respondent characteristics.
MoDOT constituents surveyed in this study were moderately satisfied in their perceptions
of current agency performance. As shown in Table 4.4, the mean rating for all but seven of the
thirty-four items in the survey was above 2.50, meaning that those who rated current
performance satisfactory or extremely satisfactory did so more frequently than those who rated
current performance as unsatisfactory.3 However, the highest ranked item, Item #1, received a
rating of 2.98 just below the level of “satisfied.” Besides Item #1, twenty-five other performance
items received a mean score between 3.00 and 2.50. In other words, these results indicate that
most of the respondents were only slightly more satisfied than dissatisfied with the performance
of MoDOT with regard to the specific areas of performance.
As shown in Table 4.4, respondents in the total sample rated Item #1 “using electronic
message boards to advise drivers of delays or construction areas,” highest in satisfactory
performance. The four other items ranked in the top five statewide include: “placing yellow
warning signs to assure sufficient response time” (Item #2), “removing snow and ice efficiently”
(Item #3), “having signs that can be easily seen at night or in bad weather” (Item #4), and
“providing lanes that are wide enough for safe driving” (Item #7). MoDOT activities related to
promoting safety appear to receive the most satisfactory ratings.
3 Each item was assigned a number as shown in Table 1.1. The number assigned to an item is used throughout all the tables in this report. Thus, item number one is always “using electronic message boards to advise drivers of delays or construction areas” and item number thirty-four is always “maintaining the pavement so it provides a smooth ride.”

36
The item with which respondents were least satisfied was Item #34 “maintaining the
pavement so it provides a smooth ride.” This result was nearly matched by ratings given to Item
#32, “repairing pavement surface promptly.” The fourth least satisfactory item was Item #31
“using public funds in a cost-effective manner.” The third and fifth least satisfactory items were
Item #33, “distributing transportation funds fairly to all areas of the state” and Item # 30
“providing pavement that lasts a long time.” Therefore, three out of the five least satisfactorily
rated items deal with pavement maintenance. The remaining two of five least satisfactorily rated
items deal with fiscal responsibility, as constituents view it.
The thirty-four items were also ranked according to the percentage of respondents
responding as either satisfied or extremely satisfied with current performance. These results are
shown in Table 4.5. These results indicate that, for all but four of the items in the survey, more
than half the respondents surveyed rated the items regarding MoDOT’s current performance
“satisfied” or “extremely satisfied.” Consistent with the results of ranking by mean rating in
Table 4.4, this table further illustrates the level of respondent satisfaction with MoDOT’s current
performance. Many of the lowest rated items of performance deal with pavement maintenance
issues with an exception found in item (#33), “distributing transportation funds fairly to all areas
of the state.”
There are many significant subgroup differences in the mean current satisfaction scores
for all of the thirty-four items, especially as it regards age, education, years lived in Missouri and
the number of miles driven annually. A summary table of these items with significant subgroup
differences can be found in Table 4.6. For some of the items reflecting aspects of MoDOT’s
work, all the respondent characteristics examined make a significant difference, e.g., Item # 2,
“placing yellow warning signs to assure sufficient response time.” In others, only two or three
make a difference. In other words, for three of the respondent categories—age, education, and
years lived in Missouri, the respondents’ responses were significantly related to their
characteristic. Only gender and miles driven annually do not appear to have such a broad effect.
It should be noted that when there are no significant differences among respondents on a specific
item of performance, it can be concluded that the ratings of the general population are essentially
the same. So, the fact that there are many cases in which the responses do show significant
differences means that respondent characteristics are important factors to consider. Another
factor to consider is the large sample size (4,000) which means that, in most cases it is highly
likely that statistically significant differences will be found. So, a finding of “no significant

37
difference,” is somewhat unexpected and notable. Appendix B contains detailed figures and
tables with additional data on the differences between subgroups.
The ratings of current satisfaction items were examined to determine if there were any
underlying patterns (factors) in the responses provided. This analysis returned results as
indicated in Table 4.7. The method employed is called “factor analysis,” and uses multiple
mathematical comparisons in an iterative procedure to determine if any of the individual items
are related to any others in some consistent pattern. Using this procedure we determined that
there are four underlying patterns or factors represented in the responses to the current
satisfaction items (Table 4.7). These groups of items (factors) seem to reflect ideas about: (1)
safety, (2) responsive and responsible performance, (3) alternate transportation, and (4)
relationships with constituents. These four underlying factors account for over fifty percent of
the variance in the overall rating responses. With regard to current satisfaction with MoDOT’s
performance, these four factors likely capture much of what were respondents’ concerns and may
“drive” opinions overall.
(Remainder of page intentionally left blank.)
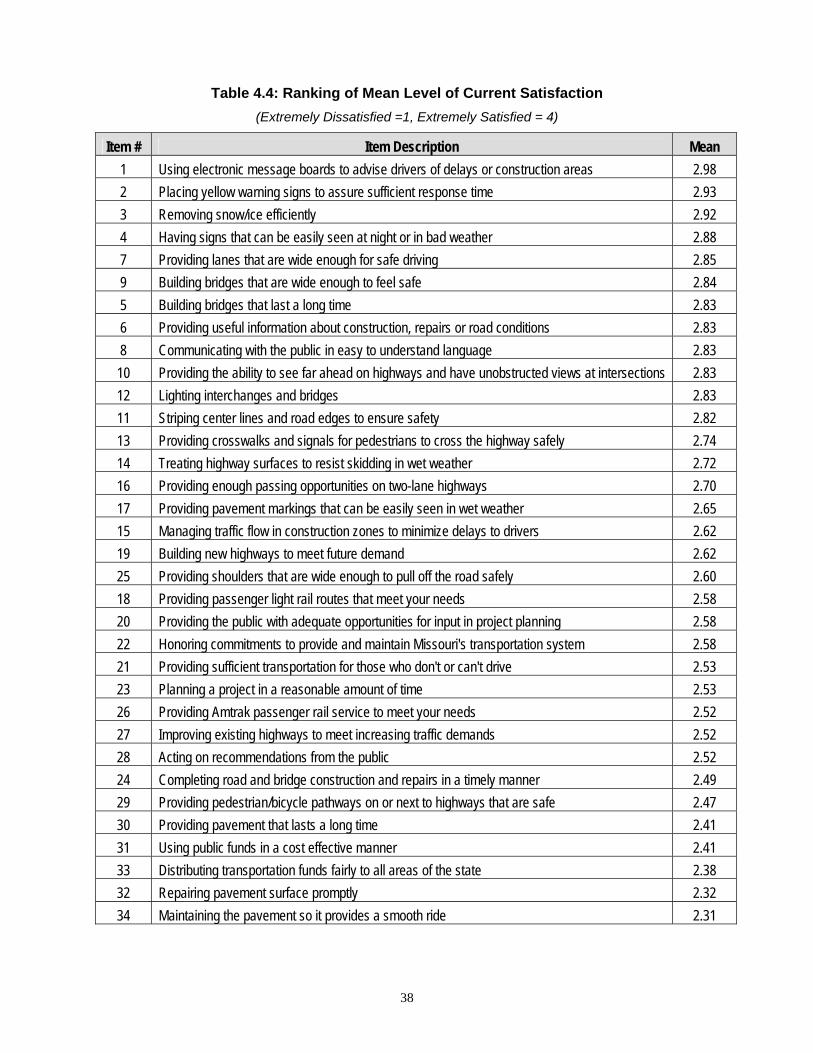
38
Table 4.4: Ranking of Mean Level of Current Satisfaction (Extremely Dissatisfied =1, Extremely Satisfied = 4)
Item # Item Description Mean 1 Using electronic message boards to advise drivers of delays or construction areas 2.98 2 Placing yellow warning signs to assure sufficient response time 2.93 3 Removing snow/ice efficiently 2.92 4 Having signs that can be easily seen at night or in bad weather 2.88 7 Providing lanes that are wide enough for safe driving 2.85 9 Building bridges that are wide enough to feel safe 2.84 5 Building bridges that last a long time 2.83 6 Providing useful information about construction, repairs or road conditions 2.83 8 Communicating with the public in easy to understand language 2.83 10 Providing the ability to see far ahead on highways and have unobstructed views at intersections 2.83 12 Lighting interchanges and bridges 2.83 11 Striping center lines and road edges to ensure safety 2.82 13 Providing crosswalks and signals for pedestrians to cross the highway safely 2.74 14 Treating highway surfaces to resist skidding in wet weather 2.72 16 Providing enough passing opportunities on two-lane highways 2.70 17 Providing pavement markings that can be easily seen in wet weather 2.65 15 Managing traffic flow in construction zones to minimize delays to drivers 2.62 19 Building new highways to meet future demand 2.62 25 Providing shoulders that are wide enough to pull off the road safely 2.60 18 Providing passenger light rail routes that meet your needs 2.58 20 Providing the public with adequate opportunities for input in project planning 2.58 22 Honoring commitments to provide and maintain Missouri's transportation system 2.58 21 Providing sufficient transportation for those who don't or can't drive 2.53 23 Planning a project in a reasonable amount of time 2.53 26 Providing Amtrak passenger rail service to meet your needs 2.52 27 Improving existing highways to meet increasing traffic demands 2.52 28 Acting on recommendations from the public 2.52 24 Completing road and bridge construction and repairs in a timely manner 2.49 29 Providing pedestrian/bicycle pathways on or next to highways that are safe 2.47 30 Providing pavement that lasts a long time 2.41 31 Using public funds in a cost effective manner 2.41 33 Distributing transportation funds fairly to all areas of the state 2.38 32 Repairing pavement surface promptly 2.32 34 Maintaining the pavement so it provides a smooth ride 2.31

39
Table 4.5: Percentage of Respondents Indicating "Satisfied" or "Extremely Satisfied" with Current MoDOT Performance Statewide
(1=Extremely Dissatisfied; 4=Extremely Satisfied)
Item # Item Description Percent 2 Placing yellow warning signs to assure sufficient response time 88.6 1 Using electronic message boards to advise drivers of delays or construction areas 85.8 3 Removing snow/ice efficiently 83.0 4 Having signs that can be easily seen at night or in bad weather 82.9 7 Providing lanes that are wide enough for safe driving 82.0 8 Communicating with the public in easy to understand language 81.3 12 Lighting interchanges and bridges 81.1 9 Building bridges that are wide enough to feel safe 80.8 6 Providing useful information about construction, repairs or road conditions 79.9 5 Building bridges that last a long time 79.8 10 Providing the ability to see far ahead on highways and have unobstructed views at intersections 79.3 11 Striping center lines and road edges to ensure safety 78.5 13 Providing crosswalks and signals for pedestrians to cross the highway safely 74.0 14 Treating highway surfaces to resist skidding in wet weather 71.5 16 Providing enough passing opportunities on two-lane highways 71.5 17 Providing pavement markings that can be easily seen in wet weather 65.7 15 Managing traffic flow in construction zones to minimize delays to drivers 65.4 19 Building new highways to meet future demand 64.6 18 Providing passenger light rail routes that meet your needs 62.7 22 Honoring commitments to provide and maintain Missouri's transportation system 62.4 25 Providing shoulders that are wide enough to pull off the road safely 61.6 20 Providing the public with adequate opportunities for input in project planning 59.9 28 Acting on recommendations from the public 57.9 23 Planning a project in a reasonable amount of time 57.7 21 Providing sufficient transportation for those who don't or can't drive 57.6 26 Providing Amtrak passenger rail service to meet your needs 57.3 24 Completing road and bridge construction and repairs in a timely manner 56.3 27 Improving existing highways to meet increasing traffic demands 55.9 29 Providing pedestrian/bicycle pathways on or next to highways that are safe 52.3 31 Using public funds in a cost effective manner 50.3 30 Providing pavement that lasts a long time 48.5 33 Distributing transportation funds fairly to all areas of the state 48.5 34 Maintaining the pavement so it provides a smooth ride 42.2 32 Repairing pavement surface promptly 41.5

40
Table 4.6: Significance of Means between Current Satisfaction Ratings and Respondent Characteristics
Item # Item Description Years Lived in MO Miles Driven Annually Age Education Gender
1 Using electronic message boards to advise drivers of delays or construction areas 0.0015 0.0039 0.1014 0.0004 0.0258 2 Placing yellow warning signs to assure sufficient response time 0.0022 0.0085 0.0087 0.0042 0.0036 3 Removing snow/ice efficiently 0.0001 0.0006 0.0000 0.0025 0.0000 4 Having signs that can be easily seen at night or in bad weather 0.0254 0.0001 0.0014 0.1530 0.0000 5 Building bridges that last a long time 0.0000 0.0560 0.0000 0.0001 0.5758 6 Providing useful information about construction, repairs or road conditions 0.0000 0.4766 0.0811 0.0013 0.4269 7 Providing lanes that are wide enough for safe driving 0.0014 0.0746 0.0252 0.1151 0.1904 8 Communicating with the public in easy to understand language 0.0000 0.0813 0.0000 0.0090 0.0999 9 Building bridges that are wide enough to feel safe 0.0000 0.2560 0.0143 0.0002 0.1742 10 Providing the ability to see far ahead on highways and have unobstructed views at intersections 0.0000 0.0079 0.0000 0.6187 0.0023 11 Striping center lines and road edges to ensure safety 0.0000 0.1410 0.0006 0.0143 0.0011 12 Lighting interchanges and bridges 0.0003 0.0790 0.0000 0.0771 0.0347 13 Providing crosswalks and signals for pedestrians to cross the highway safely 0.0000 0.0108 0.1221 0.0000 0.0006 14 Treating highway surfaces to resist skidding in wet weather 0.0017 0.4404 0.0000 0.0001 0.0215 15 Managing traffic flow in construction zones to minimize delays to drivers 0.0000 0.0673 0.0000 0.0000 0.2157 16 Providing enough passing opportunities on two-lane highways 0.0001 0.0222 0.0000 0.0000 0.8860 17 Providing pavement markings that can be easily seen in wet weather 0.0008 0.0103 0.0001 0.0000 0.3481 18 Providing passenger light rail routes that meet your needs 0.0000 0.0129 0.0000 0.0000 0.6590 19 Building new highways to meet future demand 0.0000 0.0001 0.0000 0.0000 0.0129 20 Providing the public with adequate opportunities for input in project planning 0.0001 0.9298 0.0701 0.0000 0.0149 21 Providing sufficient transportation for those who don't or can't drive 0.0015 0.8349 0.0000 0.0000 0.0021 22 Honoring commitments to provide and maintain Missouri's transportation system 0.0000 0.0926 0.0000 0.0000 0.0001 23 Planning a project in a reasonable amount of time 0.0001 0.0614 0.0000 0.0000 0.2021 24 Completing road and bridge construction and repairs in a timely manner 0.0000 0.1475 0.0002 0.0000 0.0000 25 Providing shoulders that are wide enough to pull off the road safely 0.0001 0.4258 0.0000 0.0113 0.0092 26 Providing Amtrak passenger rail service to meet your needs 0.0000 0.0016 0.0000 0.0000 0.3990 27 Improving existing highways to meet increasing traffic demands 0.0000 0.0000 0.0000 0.0000 0.0016 28 Acting on recommendations from the public 0.0000 0.1540 0.0094 0.0000 0.2360 29 Providing pedestrian/bicycle pathways on or next to highways that are safe 0.0000 0.0386 0.1533 0.0000 0.0632 30 Providing pavement that lasts a long time 0.0000 0.0336 0.0000 0.0000 0.2291 31 Using public funds in a cost effective manner 0.0000 0.3025 0.0000 0.0000 0.1111 32 Repairing pavement surface promptly 0.0001 0.0217 0.0000 0.0000 0.9250 33 Distributing transportation funds fairly to all areas of the state 0.0000 0.0712 0.0000 0.0000 0.0782 34 Maintaining the pavement so it provides a smooth ride 0.0000 0.0000 0.0000 0.0000 0.2487 Note: Table cells contain the computed levels of significance (chi square procedure) and shaded cells represent relationships that are significant at 0.05 or higher.

41
Table 4.7: Factors Influencing Ratings of Perceived Satisfaction with Current MoDOT Performance
Factor Item # Item Description
Safety
Responsive & Responsible Performance
Alternate Transportation
Relationships with Constituents
11 Lighting interchanges and bridges 0.679 0.152 0.123 0.222 9 Building bridges that are wide enough to feel safe 0.671 0.329 0.129 0.023
11 Striping center lines and road edges to ensure safety 0.663 0.098 0.222 0.246 4 Having signs that can be easily seen at night or in bad weather 0.643 0.150 0.074 0.228 5 Building bridges that last a long time 0.636 0.302 0.106 0.280 7 Providing lanes that are wide enough for safe driving 0.634 0.389 0.157 0.013 3 Removing snow/ice efficiently 0.617 0.147 0.171 0.115
14 Treating highway surfaces to resist skidding in wet weather 0.600 0.338 0.221 0.291 10 Providing the ability to see far ahead on highways and have unobstructed views at intersections 0.596 0.225 0.144 0.200 25 Providing shoulders that are wide enough to pull off the road safely 0.530 0.401 0.199 0.151 32 Repairing pavement surface promptly 0.317 0.748 0.157 0.061 34 Maintaining the pavement so it provides a smooth ride 0.363 0.701 0.122 0.155 27 Improving existing highways to meet increasing traffic demands 0.131 0.687 0.245 0.197 31 Using public funds in a cost effective manner 0.216 0.631 0.275 0.343 22 Honoring commitments to provide and maintain Missouri's transportation system 0.207 0.619 0.292 0.273 33 Distributing transportation funds fairly to all areas of the state 0.288 0.610 0.286 0.268 30 Providing pavement that lasts a long time 0.347 0.597 0.219 0.189 26 Providing Amtrak passenger rail service to meet your needs 0.125 0.228 0.820 0.123 18 Providing passenger light rail routes that meet your needs 0.199 0.217 0.815 0.086 21 Providing sufficient transportation for those who don't or can't drive 0.241 0.180 0.667 0.334 29 Providing pedestrian/bicycle pathways on or next to highways that are safe 0.219 0.252 0.574 0.108 8 Communicating with the public in easy to understand language 0.220 0.251 0.208 0.700 6 Providing useful information about construction, repairs or road conditions 0.356 0.160 0.092 0.693
20 Providing the public with adequate opportunities for input in project planning 0.184 0.400 0.317 0.612 15 Managing traffic flow in construction zones to minimize delays to drivers 0.286 0.385 0.138 0.549
Four factors account for 54 percent of total variance in the twenty-five indicators of performance.

42
Future Attention Survey respondents were next asked to respond to the question “How much attention should
MoDOT place on [item] in the future?” for the same thirty-four items on a four-point scale (1= a lot
less attention, 2= less attention, 3= more attention and 4= a lot more attention). In general, those
aspects of transportation work that MoDOT constituents feel the agency should give more attention
in the future addressed maintenance of transportation infrastructure (e.g., roads and bridges).
Table 4.8 presents a ranking by the percentage of respondents answering “more” or “a lot
more” attention (highest to lowest) for each of these thirty-four items. Items with identical or “tie”
mean scores were assigned the next number in sequence. As seen in Table 4.8, “honoring
commitments to provide and maintain Missouri’s transportation system,” (Item # 22), “repairing
pavement surface promptly” (Item #32), “maintaining the pavement so it provides a smooth ride”
(Item #34), “providing pavement that lasts a long time” (Item #30), “using public funds in a cost-
effective manner” (Item 31), and “improving existing highways to meet increasing traffic demands”
(Item #27) all ranked very high among respondents who indicated that MoDOT should place
“more” or “a lot more” future attention on their performance in these areas. Of somewhat lower
priority appears to be such items as Item #26, “providing Amtrak passenger rail service to meet
your needs,” and Item #29, “providing pedestrian/bicycle pathways on or next to highways that are
safe.” As can be seen, none of the thirty-four items fell below a seventy percent response rate for
future attention as perceived by respondents.
Table 4.9 lists these same items and ranks them according to the mean response given to
each item. In this table, it can be seen that Item #32, “repairing pavement surface promptly;” Item
#31, “using public funds in a cost-effective manner;” and Item #30, “providing pavement that lasts a
long time,” scored the highest of all items among respondents in their perceptions of the need for
MoDOT to provide “more” or “a lot more” future attention to these thirty-four items. In fact, the
ratings given to all but five of the thirty-four items are above 3.0 on a 4-point scale, meaning that
respondents generally were quite strongly representing their perceptions about where future
attention should be placed. Unfortunately, placing much more attention on any of these items will
likely require some difficult decisions by MoDOT about resource allocation.

43
Table 4.8: Percentage of Survey Respondents Indicating a Desire for "More" or "A lot More" Future Attention on Performance Items
(A lot Less =1, A lot More = 4)
Item # Item Description Percent 32 Repairing pavement surface promptly 96.2 31 Using public funds in a cost effective manner 95.7 27 Improving existing highways to meet increasing traffic demands 95.2 30 Providing pavement that lasts a long time 94.9 34 Maintaining the pavement so it provides a smooth ride 94.9 22 Honoring commitments to provide and maintain Missouri's transportation system 94.9 24 Completing road and bridge construction and repairs in a timely manner 93.9 33 Distributing transportation funds fairly to all areas of the state 92.7 28 Acting on recommendations from the public 91.9 23 Planning a project in a reasonable amount of time 91.6 15 Managing traffic flow in construction zones to minimize delays to drivers 90.6 14 Treating highway surfaces to resist skidding in wet weather 89.9 20 Providing the public with adequate opportunities for input in project planning 89.7 17 Providing pavement markings that can be easily seen in wet weather 89.6 19 Building new highways to meet future demand 89.5 5 Building bridges that last a long time 89.3 25 Providing shoulders that are wide enough to pull off the road safely 87.1 21 Providing sufficient transportation for those who don't or can't drive 86.9 6 Providing useful information about construction, repairs or road conditions 86.5 11 Striping center lines and road edges to ensure safety 85.7 10 Providing the ability to see far ahead on highways and have unobstructed views at intersections 85.0 7 Providing lanes that are wide enough for safe driving 85.0 4 Having signs that can be easily seen at night or in bad weather 85.0 9 Building bridges that are wide enough to feel safe 84.9 3 Removing snow/ice efficiently 84.5 2 Placing yellow warning signs to assure sufficient response time 83.5 8 Communicating with the public in easy to understand language 83.4 1 Using electronic message boards to advise drivers of delays or construction areas 82.8 13 Providing crosswalks and signals for pedestrians to cross the highway safely 82.4 12 Lighting interchanges and bridges 82.0 16 Providing enough passing opportunities on two-lane highways 81.2 18 Providing passenger light rail routes that meet your needs 77.8 29 Providing pedestrian/bicycle pathways on or next to highways that are safe 75.9 26 Providing Amtrak passenger rail service to meet your needs 71.4

44
It is useful to consider the differences between the ratings given MoDOT’s performance
regarding current satisfaction versus future attention (i.e., compare Table 4.4 and Table 4.9). A
simple investigation of the differences in these means indicates that respondents were generally
satisfied with current performance by MoDOT, but weakly so, and their responses and the ratings
for desired levels of future attention indicate that respondents think the agency should devote more
attention to nearly every aspect of operations. Clearly, respondents believe that even better
performance is possible than at present. An investigation of the computed differences (i.e.,
discrepancies) can help sort out where some possible priorities may lie.
As with the responses to ratings of current satisfaction items, the ratings of future attention
items were analyzed to determine if there were any underlying patterns (factors) in the responses
provided. This analysis returned results as indicated in Table 4.10. Like the satisfaction items, there
are four underlying patterns in the responses to the future attention items. These are similar to the
patterns found in the previous investigation (but not identical) and seem to reflect ideas about: (1)
safety, (2) responsive and responsible performance, (3) alternate transportation, and (4) recognition
of future infrastructure expansion needs. These four underlying factors account for over fifty
percent of the variance in the rating responses. With regard to future attention that MoDOT should
pay to its performance, these four factors likely capture much of what are respondents’ concerns.
There are a number of significant subgroup differences in overall mean future attention
scores for the thirty-four items. A summary table of these items with significant subgroup
differences can be found in Table 4.11. Characteristics like years lived in Missouri, education and
gender were significant with regard to almost every performance area while miles driven annually
and age also made some significant difference in many of the thirty-four items. In one case, ratings
of Item 23, “planning a project in a reasonable amount of time,” only two of the respondent
characteristics display significant differences (years lived in Missouri and miles driven annually).
As with the satisfaction ratings, this analysis indicates that for nearly all the items, respondent
characteristics matter with regard to their ratings. Appendix B contains detailed figures and tables
with additional data on the differences between subgroups.

45
Table 4.9: Ranking of Mean Level of Future Attention Statewide (A Lot Less =1, A Lot More= 4)
Item # Item Description Mean 32 Repairing pavement surface promptly 3.34 31 Using public funds in a cost effective manner 3.34 30 Providing pavement that lasts a long time 3.32 34 Maintaining the pavement so it provides a smooth ride 3.30 27 Improving existing highways to meet increasing traffic demands 3.28 24 Completing road and bridge construction and repairs in a timely manner 3.27 33 Distributing transportation funds fairly to all areas of the state 3.27 22 Honoring commitments to provide and maintain Missouri's transportation system 3.22 23 Planning a project in a reasonable amount of time 3.18 28 Acting on recommendations from the public 3.18 15 Managing traffic flow in construction zones to minimize delays to drivers 3.18 19 Building new highways to meet future demand 3.16 17 Providing pavement markings that can be easily seen in wet weather 3.15 21 Providing sufficient transportation for those who don't or can't drive 3.15 20 Providing the public with adequate opportunities for input in project planning 3.14 14 Treating highway surfaces to resist skidding in wet weather 3.14 25 Providing shoulders that are wide enough to pull off the road safely 3.14 5 Building bridges that last a long time 3.13
11 Striping center lines and road edges to ensure safety 3.08 4 Having signs that can be easily seen at night or in bad weather 3.05 9 Building bridges that are wide enough to feel safe 3.04
10 Providing the ability to see far ahead on highways and have unobstructed views at intersections 3.04 7 Providing lanes that are wide enough for safe driving 3.03 3 Removing snow/ice efficiently 3.03 8 Communicating with the public in easy to understand language 3.02 6 Providing useful information about construction, repairs or road conditions 3.02
13 Providing crosswalks and signals for pedestrians to cross the highway safely 3.01 18 Providing passenger light rail routes that meet your needs 3.01 16 Providing enough passing opportunities on two-lane highways 3.00 1 Using electronic message boards to advise drivers of delays or construction areas 2.97
12 Lighting interchanges and bridges 2.97 2 Placing yellow warning signs to assure sufficient response time 2.97
29 Providing pedestrian/bicycle pathways on or next to highways that are safe 2.96 26 Providing Amtrak passenger rail service to meet your needs 2.90

46
Table 4.10: Factors Influencing Ratings of Future Attention Regarding MoDOT Performance
Factor
Item # Item Description Safety
Responsive & Responsible Performance
Alternate Transportation
Future Infrastructure
Expansion 7 Providing lanes that are wide enough for safe driving 0.753 0.217 0.043 0.012 9 Building bridges that are wide enough to feel safe 0.695 0.135 0.087 0.206 16 Providing enough passing opportunities on two-lane highways 0.673 0.251 0.074 -0.107 10 Providing the ability to see far ahead on highways and have unobstructed views at intersections 0.662 0.290 0.238 0.064 4 Having signs that can be easily seen at night or in bad weather 0.658 0.116 0.239 0.192 25 Providing shoulders that are wide enough to pull off the road safely 0.634 0.135 0.156 0.177 2 Placing yellow warning signs to assure sufficient response time 0.618 0.107 0.262 0.291 20 Providing the public with adequate opportunities for input in project planning 0.188 0.670 0.339 -0.097 28 Acting on recommendations from the public 0.206 0.659 0.223 -0.073 31 Using public funds in a cost effective manner 0.130 0.640 0.027 0.115 34 Maintaining the pavement so it provides a smooth ride 0.197 0.623 -0.018 0.305 32 Repairing pavement surface promptly 0.201 0.616 -0.017 0.303 22 Honoring commitments to provide and maintain Missouri's transportation system 0.142 0.611 0.074 0.198 30 Providing pavement that lasts a long time 0.164 0.562 0.096 0.360 26 Providing Amtrak passenger rail service to meet your needs 0.147 0.073 0.858 0.082 18 Providing passenger light rail routes that meet your needs 0.231 0.144 0.781 0.074 21 Providing sufficient transportation for those who don't or can't drive 0.220 0.123 0.720 0.181 27 Improving existing highways to meet increasing traffic demands 0.118 0.301 0.170 0.750 19 Building new highways to meet future demand 0.220 0.194 0.134 0.741
Four factors account for 56 percent of total variance in these nineteen indicators of performance.

47
Table 4.11: Significance of Means between Future Attention Ratings and Respondent Characteristics
Item # Item Description Years Lived in MO Miles Driven Annually Age Education Gender 1 Using electronic message boards to advise drivers of delays or construction areas 0.0000 0.1797 0.0610 0.0078 0.0004 2 Placing yellow warning signs to assure sufficient response time 0.0000 0.0001 0.0130 0.0000 0.0000 3 Removing snow/ice efficiently 0.0000 0.0005 0.0000 0.0000 0.0000 4 Having signs that can be easily seen at night or in bad weather 0.0000 0.0003 0.0002 0.0000 0.0000 5 Building bridges that last a long time 0.0000 0.0000 0.0000 0.0055 0.0030 6 Providing useful information about construction, repairs or road conditions 0.0000 0.0001 0.0263 0.0000 0.0047 7 Providing lanes that are wide enough for safe driving 0.0000 0.0000 0.0009 0.0000 0.0003 8 Communicating with the public in easy to understand language 0.0000 0.0001 0.0000 0.0004 0.0723 9 Building bridges that are wide enough to feel safe 0.0000 0.0000 0.0000 0.0002 0.0000 10 Providing the ability to see far ahead on highways and have unobstructed views at intersections 0.0000 0.0005 0.0000 0.0000 0.0000 11 Striping center lines and road edges to ensure safety 0.0000 0.0143 0.0010 0.0002 0.0000 12 Lighting interchanges and bridges 0.0000 0.0057 0.0002 0.0132 0.0000 13 Providing crosswalks and signals for pedestrians to cross the highway safely 0.0000 0.0000 0.6882 0.0000 0.0000 14 Treating highway surfaces to resist skidding in wet weather 0.0030 0.0015 0.0574 0.0000 0.0000 15 Managing traffic flow in construction zones to minimize delays to drivers 0.0000 0.0003 0.0000 0.0363 0.0008 16 Providing enough passing opportunities on two-lane highways 0.0000 0.0002 0.0000 0.0054 0.0034 17 Providing pavement markings that can be easily seen in wet weather 0.0000 0.0000 0.6877 0.0144 0.0000 18 Providing passenger light rail routes that meet your needs 0.0017 0.0022 0.2659 0.0081 0.0000 19 Building new highways to meet future demand 0.0046 0.0000 0.0005 0.2830 0.9560 20 Providing the public with adequate opportunities for input in project planning 0.0023 0.0098 0.0945 0.0000 0.0000 21 Providing sufficient transportation for those who don't or can't drive 0.0210 0.0001 0.3594 0.0426 0.0000 22 Honoring commitments to provide and maintain Missouri's transportation system 0.0000 0.0006 0.0000 0.0000 0.7076 23 Planning a project in a reasonable amount of time 0.0005 0.0044 0.0916 0.1002 0.9108 24 Completing road and bridge construction and repairs in a timely manner 0.0004 0.0000 0.0054 0.0000 0.0013 25 Providing shoulders that are wide enough to pull off the road safely 0.0000 0.0186 0.0000 0.0000 0.0005 26 Providing Amtrak passenger rail service to meet your needs 0.0000 0.0000 0.4853 0.0100 0.0000 27 Improving existing highways to meet increasing traffic demands 0.0000 0.0141 0.0070 0.0027 0.0200 28 Acting on recommendations from the public 0.0000 0.0522 0.2655 0.0051 0.0000 29 Providing pedestrian/bicycle pathways on or next to highways that are safe 0.0000 0.0000 0.1091 0.0000 0.0000 30 Providing pavement that lasts a long time 0.0000 0.0000 0.0001 0.0047 0.0222 31 Using public funds in a cost effective manner 0.0000 0.1189 0.0000 0.0000 0.2389 32 Repairing pavement surface promptly 0.0000 0.0000 0.0000 0.0004 0.0770 33 Distributing transportation funds fairly to all areas of the state 0.0000 0.0981 0.0000 0.0585 0.0000 34 Maintaining the pavement so it provides a smooth ride 0.0000 0.0019 0.0000 0.0005 0.2855
Note: Table cells contain the computed levels of significance (using chi-square procedure), and shaded cells represent relationships that are significant at 0.05 or higher.

48
Summary
Respondents to the TCS were asked for their perceptions regarding an overall rating of
MoDOT performance and with their available transportation options. Respondents were also
asked to rate their perceived satisfaction with thirty-four different aspects of MoDOT’s work and
the amount of future attention they believe MoDOT should give to these same thirty-four items.
Taken together, these different views of performance provide a broad assessment of the way
Missouri citizens view the department and its priorities for the future.
First, both overall satisfaction with the department and the ratings respondents provided
regarding their assessment of current performance indicate a fairly moderate level of satisfaction.
The majority of respondents rated MoDOT’s overall performance and their available
transportation options as satisfactory. Most of the thirty-four specific performance items were
rated as satisfactory with regard to current performance, but only moderately. There were many
significant differences in these results among the various demographic categories used to analyze
the data. Respondents with a high school education level and those 35-44 years of age generally
gave MoDOT higher satisfaction ratings than did respondents with more or less education or
younger or older than this group. Analyzed as a group, the thirty-four performance areas may be
strongly influenced by four broad factors: safety, responsive and responsible performance,
alternative transportation, and relationships with constituents.
Second, as current ratings of satisfaction were relatively modest, citizens perceive that the
current performance status should be improved. All the thirty-four items related to MoDOT’s
specific work aspects were rated as needing more (or a lot more) attention in the future. In fact,
nearly all the mean ratings for the thirty-four items were above three indicating at least “more”
attention should be given these areas of work. There were some significant differences in these
findings among the demographic categories used for data analysis. Those demographic
categories where there were many significant differences included annual miles driven,
education and gender categories. When analyzed as a group, the thirty-four performance areas
seem to be strongly influenced by four factors with regard to the needs for future attention:
safety, responsive and responsible performance, alternative transportation and recognition of
future expansion needs.

49
Chapter 5: Analyzing Discrepancies to Guide Performance Management
Discrepancy analysis is commonly used in helping make decisions about priorities for
improving the performance of organizations. As managers survey the broad scope of their
activities and responsibilities, they often find it difficult to assemble information that is relevant
to the decisions posed by performance management requirements. Re-engineering the
organization usually begins with a full understanding of the management and implementation
processes currently being used and their impact. These impacts include how the audience served
evaluates the outcomes of those processes. Besides objective measures of performance in
producing such services, perceptual data from constituents that quantify their evaluation of these
services in comparison to their expectations is very helpful. In addition, such data can be useful
for comparison to benchmarks to determine if progress is being made and is being perceived in
the experiences of constituents. The discrepancy between evaluation of current status
(satisfaction) and expectations of performance in the future is the indicator on which to focus in
this chapter. The overall results of computing discrepancy scores are discussed here (based on
the equation in Figure 1.1 reproduced below), as well as the broader implications that can be
drawn from analysis of this computation.
Discrepancy Analysis Figure 5.1 represents a graphical view used to plot the results of the multi-item
discrepancy analysis conducted in the TCS for MoDOT. Each axis of the graphic plot represents
one of the two dimensions of constituent perception investigated in this study. The vertical axis
of the graphic presents the plot of the average ratings for the amount of future attention
constituents expected MoDOT to give to different areas of performance. The horizontal axis
represents the average ratings given to current satisfaction for each of the same items. Since both
satisfaction and future attention perceptions were measured on a four-point scale (1-4), the value
of 2.50 represents the midpoint value of each axis and scale.
(Level of current satisfaction in area) — (Level of future priority to assign to area) DISCREPANCY =

50
When the ratings given to current satisfaction and desired future priority for each item are
plotted in this graphic, the items can be arranged into four quadrants. In Quadrant 1, where future
attention ratings exceed current levels of satisfaction, MoDOT should be concerned that
constituents perceive performance is not as high as expected. In Quadrant 4 where ratings of
current satisfaction exceed expected levels of future attention, MoDOT is considered to be
Figure 5.1: Analytical Framework for Understanding Discrepancy Scores
overachieving in its performance. In Quadrant 3, the comparison of ratings of future attention
and current satisfaction generally indicate that MoDOT is a strong performer. Which quadrant
1.0 2.5 4.0
1.0
2.5
4.0
Am
ount
of F
utur
e A
ttent
ion
Level of Current Satisfaction
Quadrant 2 Quadrant 4
Quadrant 1 Quadrant 3
Neutral Area Area of Over Achievement
Area of Concerns Area of Strengths
51
the rating falls in depends upon the absolute rating given to expected future attention; higher
ratings show strength while lower average ratings show over-achievement. Where ratings for
future attention and current satisfaction are both comparatively low (Quadrant 2), the agency
should consider constituent attitudes to be mostly neutral about the specific areas rated.
By using this graphic display, agency managers can determine where resources may be
directed to improve performance. Assuming no new resources are available, current resource
levels devoted to areas of strength or over-achievement could be redirected to areas of concern.
Alternatively, new resources could be primarily directed toward areas of concern while efforts
continue in those areas where the agency’s performance is considered to be strongest. The
specific nature of the area rated should also be considered; in some cases, education efforts may
be necessary to change constituent perceptions or changes in procedures could make a difference
with few additional resources required. Finally, perceptual information should always be
combined with other performance indicators to assist management decision making. For
example, a performance audit could determine the actual (average) time from project initiation to
completion and compare these data to constituent perceptions of this area of performance. If the
agency was perceived as strong in this area, a management priority would be maintaining
performance on this aspect of work.
Discrepancy Analysis of TCS Data Discrepancy information is presented in three ways in the following discussion. First the
information is presented in tabular form, next in graphic form and finally in a different tabular
form that permits the study of differences in the discrepancy ratings by respondent characteristic.
Each form of presentation provides some additional information to consider in decision making.
Readers should note that the computation of differences (discrepancy analysis) uses a computer-
based system that eliminates all cases from the calculation of the mean where either the response
to the question on current satisfaction or desired level of future attention is considered missing.
This means that subtracting the figures for each performance item in Tables 4.4 and 4.9 will not
provide the same result as the figures in Table 5.1. The use of this procedure is consistent with
the procedures used in the 2000 CSQS study.
Table 5.1 presents the thirty-four items contained in the survey ranked by the size of the
discrepancy. The size and sign of the discrepancy is important. As shown in the computation

52
method in Figure 1.1, when the respondents’ ratings for expectation of future attention are larger
than their ratings of current satisfaction, the discrepancy sign is negative. These results show
Table 5.1: Mean Values of Differences between Current Satisfaction and Future Priority Responses
Item No. Item Description Mean 32 Repairing pavement surface promptly -1.0609 34 Maintaining the pavement so it provides a smooth ride -1.0261 33 Distributing transportation funds fairly to all areas of the state -1.0052 31 Using public funds in a cost effective manner -0.9799 30 Providing pavement that lasts a long time -0.9370 24 Completing road and bridge construction and repairs in a timely manner -0.8296 27 Improving existing highways to meet increasing traffic demands -0.7877 28 Acting on recommendations from the public -0.7270 21 Providing sufficient transportation for those who don't or can't drive -0.7164 23 Planning a project in a reasonable amount of time -0.7104 22 Honoring commitments to provide and maintain Missouri's transportation system -0.6894 26 Providing Amtrak passenger rail service to meet your needs -0.6257 20 Providing the public with adequate opportunities for input in project planning -0.6131 15 Managing traffic flow in construction zones to minimize delays to drivers -0.6099 18 Providing passenger light rail routes that meet your needs -0.5907 29 Providing pedestrian/bicycle pathways on or next to highways that are safe -0.5889 19 Building new highways to meet future demand -0.5722 25 Providing shoulders that are wide enough to pull off the road safely -0.5666 17 Providing pavement markings that can be easily seen in wet weather -0.5352 14 Treating highway surfaces to resist skidding in wet weather -0.4443 16 Providing enough passing opportunities on two-lane highways -0.3432 13 Providing crosswalks and signals for pedestrians to cross the highway safely -0.3134 5 Building bridges that last a long time -0.3133 11 Striping center lines and road edges to ensure safety -0.2847 10 Providing the ability to see far ahead on highways and have unobstructed views at intersections -0.2248 9 Building bridges that are wide enough to feel safe -0.2181 8 Communicating with the public in easy to understand language -0.2134 6 Providing useful information about construction, repairs or road conditions -0.2018 7 Providing lanes that are wide enough for safe driving -0.1929 4 Having signs that can be easily seen at night or in bad weather -0.1820 12 Lighting interchanges and bridges -0.1639 3 Removing snow/ice efficiently -0.1404 2 Placing yellow warning signs to assure sufficient response time -0.0486 1 Using electronic message boards to advise drivers of delays or construction areas 0.0013

53
that all but one of the thirty-four items have negative discrepancies, ranging from 0.00 to –1.06.
Looking at the table reveals that nineteen of the items have a discrepancy value of -0.50 or
higher.
In other words, the MoDOT constituents who participated in the survey feel that overall
the agency has room for improvement, and in some items, there is substantial room for
improvement. These latter items include many of the same items discussed in Chapter 4 where
the ratings for the amount of future attention to be given these areas was discussed — areas of
highway maintenance, fiscal decision making and alternative forms of travel. In fact, seven of
the ten highest discrepancy items addresses responsive and responsible maintenance concerns.
The items on the lower end of the distribution of discrepancies relate to safety needs. Figure 5.2
portrays this table of information in a graphic form to enhance understanding.
The graphic display presented in Figure 5.2 is reproduced with the actual plots for the
entire state survey population results in Figure 5.3. The graphic display demonstrates the nature
of the overall response pattern. Respondents generally rated the desired level of future attention
higher than current satisfaction with differences in these scores ranging from just over –1.0 to
0.00. The exact differences calculated are identified in Table 5.1 and discussed above. It should
be noted that the differences calculated do not indicate the level of responses provided by
respondents. That is, a difference of –1.0 can be achieved using any number of combinations of
ratings and a difference between 2.0 and 1.0 produces the same difference score as 4.0 minus
3.0. So, these responses were plotted in two-dimensions resulting in Figure 5.3.
Nearly all of the thirty-four items in the survey are plotted in the “Strengths” quadrant in
Figure 5.3. Clearly, the respondents surveyed for this study perceive MoDOT to be relatively
strong in producing expected levels of performance as the levels of current satisfaction and
ratings for future attention appear to be very consistent (as was demonstrated in Chapter 4).
Seven of the thirty-four items of performance are plotted in the “Concerns” quadrant. These
represent areas in which current satisfaction is relatively low and desired levels of future
attention is relatively high. Most of these items are found at the top of the list in Table 5.1 and to
the right end of the graphic display in Figure 5.2. In sum, it appears that constituents feel that, for
the kinds of things they see and experience daily on the highways and in other transportation
experiences, MoDOT has quite a few strengths, or performance areas where both current

54
satisfaction and desired future attention is high. Obviously, MoDOT management can use this
information to help guide future performance management decisions.
Further analysis of the discrepancy indicators was conducted to determine if subgroup
factors had any effect on the pattern of responses. Table 5.2 presents a summary of all significant
subgroup differences identified for each of the thirty-four performance items. All characteristics
of respondents investigated seem to make some difference regarding the discrepancy indicators
and some, like years lived in Missouri and age, make a significant difference in nearly all the
resulting differences. Other respondent characteristics, including gender, miles driven annually
and education, seemed to make less difference in the responses given, although there were many
instances where these characteristics are associated with significant differences in the
discrepancy rating. As with the current satisfaction and future attention ratings discussed in
Chapter 4, in those items where a specific respondent characteristic does not make a significant
difference, one can assume the characteristic does not affect the responses given to the survey.
Summary As indicated elsewhere in this report, discrepancy analysis is useful for helping decision-
makers judge their agency’s performance. In the eyes of respondents, the discrepancy between
their perceived satisfaction with current performance and their expectations for future
performance can provide useful guides to assist agency managers and staff. These data are not
sufficient, however, for making decisions given the complexities of situations faced by decision-
makers, both technical and political. The discrepancy information provided by constituents
regarding performance can be very helpful in priority setting when matched with performance
data such as related agency records in meeting technical specifications and cost-effectiveness of
management procedures.
The results of the analysis of discrepancy information computed from these survey data
indicate that, MoDOT’s performance in many aspects of its work is considered strong, and
perceived discrepancies are small. Seven of the thirty-four items included in the survey
indicated, when plotted on a decision matrix, aspects of MoDOT’s performance that could be
considered serious concerns. These items fell in the “concerns” quadrant with the remaining
items placed in the “strengths” quadrant.
The specific items included in the “concerns” quadrant related to maintenance of durable
pavement surfaces, timeliness of repairs and construction planning, and the procedures used in

55
managing resources in the broad context. Even though most constituents are unlikely to be very
familiar with the agency’s policies and procedures at the highest levels of decision making and
have information only from mass media, these kinds of items were most often of concern to
respondents who participated in the survey. Those work aspects most likely to be carried out at
the district level directly affect constituents and those aspects constituents typically rated as
agency “strengths.” Nevertheless, MoDOT now has indicators consistent with specific
benchmarks established in 2000 to use in measuring progress in changing perceptions where it
appears necessary or desirable and has a better idea of specific measures that could be taken to
address concerns.
Further, conclusions that one may draw from the discrepancy analysis are that (1)
respondents generally feel that MoDOT has lots of areas of performance that are strong, and (2)
those respondents that are likely to be the primary stakeholders in agency performance — those
who pay the majority of the taxes — tend to feel MoDOT can perform better yet. There are some
clues as to how this potential problem may be addressed in Chapter 6. However, it appears clear
that MoDOT faces a substantial challenge in changing the perceptions of its most critical
stakeholders -- those constituents who feel they provide the majority of the financial resources
and the best informed about transportation affairs and infrastructure conditions.

56
Figure 5.2: Comparison of Differences—Current Satisfaction and Future Attention by Size of Difference (Discrepancy)
Item # Performance Indicator Item # Performance Indicator Item # Performance Indicator
1 Using electronic message boards to advise drivers of delays or construction areas 13 Providing crosswalks and signals for pedestrians to cross the
highway safely 25 Providing shoulders that are wide enough to pull off the road safe
2 Placing yellow warning sighs to assure sufficient response time 14 Treating highway surfaces to resist skidding in wet weather 26 Providing Amtrak passenger rail service to meet your needs
3 Removing snow/ice efficiently 15 Managing traffic flow in construction zones to minimize delays to drivers 27 Improving existing highways to meet increasing traffic demands
4 Having signs that can be easily seen at night or in bad weather 16 Providing enough passing opportunities on two lane highways 28 Acting on recommendations from the public
5 Building bridges that last a long time 17 Providing pavement markings that can be easily seen in wet weather 29 Providing pedestrian/bicycle pathways on or next to highways
that are safe 6 Providing useful information about construction, repairs or road conditions 18 Providing passenger light rail routes that meet your needs 30 Providing pavement that lasts a long time 7 Providing lanes that are wide enough for safe driving 19 Building new highways to meet future demand 31 Using public funds in a cost-effective manner
8 Communicating with the public in easy-to-understand language 20 Providing the public with adequate opportunities for input in project planning 32 Repairing pavement surface promptly
9 Building bridges that are wide enough to feel safe 21 Providing sufficient transportation for those who don’t or can’t drive 33 Distributing transportation funds fairly to all areas of the state
10 Providing the ability to see far ahead on highways and have unobstructed views at intersections 22 Honoring commitments to provide and maintain Missouri’s
transportation system 34 Maintaining the pavement so it provides a smooth ride
11 Striping center lines and road edges to ensure safety 23 Planning a project in a reasonable amount of time
12 Lighting interchanges and bridges 24 Completing road and bridge construction and repairs in a timely manner
-1.2000
-1.0000
-0.8000
-0.6000
-0.4000
-0.2000
0.0000
0.2000
1 2 3 12 4 7 6 8 9 10 11 5 13 16 14 17 25 19 29 18 15 20 26 22 23 21 28 27 24 30 31 33 34 32
Performance Item Number
Mean
Diff
eren
ce

57
Figure 5.3: Plot of Current Satisfaction and Future Attention Scores
2.30 2.40 2.50 2.60 2.70 2.80 2.90 3.00
Current Satisfaction
2.90
3.00
3.10
3.20
3.30
Futu
re A
ttent
ion
^ ^
^
^
^^
^
^
^
^
^
^
^
^
^
^^
^
^
^
^
^
^
^̂
^
^
^
^
^ ^
^
^
^
12
34
56
9
7
10
8
11
12
13
14
15
1618
17
21
19
20
22
23
24 26
25
27
28
29
3031
32
33
34
Concerns Strengths

58
Table 5.2: Comparison Respondent Characteristics and Discrepancies Show Indications of Significance
Item # Item Description Miles Driven Annually Years Lived in MO Gender Education Age 1 Using electronic message boards to advise drivers of delays or construction areas 0.0020 0.0000 0.6779 0.0392 0.0840 2 Placing yellow warning signs to assure sufficient response time 0.0017 0.0000 0.0000 0.0014 0.0092 3 Removing snow/ice efficiently 0.0024 0.0000 0.0000 0.0000 0.0000 4 Having signs that can be easily seen at night or in bad weather 0.0000 0.0004 0.0000 0.0005 0.0002 5 Building bridges that last a long time 0.0086 0.0000 0.4418 0.0038 0.0000 6 Providing useful information about construction, repairs or road conditions 0.2991 0.0000 0.1600 0.0000 0.0358 7 Providing lanes that are wide enough for safe driving 0.0824 0.0000 0.0054 0.0331 0.0001 8 Communicating with the public in easy to understand language 0.2095 0.0000 0.9497 0.0099 0.0000 9 Building bridges that are wide enough to feel safe 0.1922 0.0002 0.0018 0.3817 0.0000 10 Providing the ability to see far ahead on highways and have unobstructed views at intersections 0.0004 0.0000 0.0000 0.0226 0.0000 11 Striping center lines and road edges to ensure safety 0.1113 0.0000 0.0000 0.0393 0.0000 12 Lighting interchanges and bridges 0.0327 0.0000 0.0000 0.8114 0.0000 13 Providing crosswalks and signals for pedestrians to cross the highway safely 0.0000 0.0000 0.0000 0.1000 0.6123 14 Treating highway surfaces to resist skidding in wet weather 0.1332 0.0022 0.0000 0.0030 0.0000 15 Managing traffic flow in construction zones to minimize delays to drivers 0.1811 0.0000 0.0128 0.0000 0.0000 16 Providing enough passing opportunities on two-lane highways 0.0165 0.0000 0.1324 0.1171 0.0000 17 Providing pavement markings that can be easily seen in wet weather 0.1618 0.0066 0.0037 0.3510 0.0203 18 Providing passenger light rail routes that meet your needs 0.1646 0.0000 0.0260 0.0000 0.0000 19 Building new highways to meet future demand 0.0007 0.0003 0.0272 0.0000 0.0000 20 Providing the public with adequate opportunities for input in project planning 0.5538 0.0000 0.0001 0.0008 0.0020 21 Providing sufficient transportation for those who don't or can't drive 0.1960 0.0051 0.0000 0.0000 0.0005 22 Honoring commitments to provide and maintain Missouri's transportation system 0.3300 0.0000 0.0067 0.0000 0.0000 23 Planning a project in a reasonable amount of time 0.4619 0.0023 0.2661 0.0000 0.0000 24 Completing road and bridge construction and repairs in a timely manner 0.4302 0.0023 0.0000 0.0000 0.0010 25 Providing shoulders that are wide enough to pull off the road safely 0.1954 0.0000 0.0017 0.3480 0.0000 26 Providing Amtrak passenger rail service to meet your needs 0.0740 0.0000 0.0000 0.0000 0.0020 27 Improving existing highways to meet increasing traffic demands 0.0000 0.0000 0.4632 0.0000 0.0000 28 Acting on recommendations from the public 0.3875 0.0000 0.0001 0.1004 0.0030 29 Providing pedestrian/bicycle pathways on or next to highways that are safe 0.0015 0.0000 0.0000 0.0000 0.0779 30 Providing pavement that lasts a long time 0.3246 0.0000 0.0709 0.0000 0.0000 31 Using public funds in a cost effective manner 0.0871 0.0000 0.1311 0.0000 0.0000 32 Repairing pavement surface promptly 0.3928 0.0002 0.4064 0.0000 0.0000 33 Distributing transportation funds fairly to all areas of the state 0.0441 0.0000 0.0006 0.0012 0.0000 34 Maintaining the pavement so it provides a smooth ride 0.0050 0.0000 0.6418 0.0000 0.0000
Note: Table cells contain the computed levels of significance (using chi-square), and shaded cells represent relationships that are significant at 0.05 or higher.

59
Chapter 6: Respondents’ Views on Resource Priorities and Trust in MoDOT
Respondents to the TCS were asked a number of questions regarding the current
allocation of fuel tax revenues, preferences for increasing revenues for transportation and their
trust in the agency to perform certain tasks. The results indicate that respondents were very
concerned that maintenance of the existing system of roads and bridges receive top priority.
While they do not have much guidance for the agency as to how to acquire additional resources,
few respondents believe that MoDOT receives sufficient funds to do the job expected of them.
Of all the fiscal tools available to the state to support additional revenues, respondents perceive
that some combination of tools will be most desirable. Over sixty percent of the 4,000
respondents to the Transportation Customer Survey express trust in MoDOT to do their job.
Allocation of Fuel Tax Revenues MoDOT staff has calculated that the average motorist in Missouri spends about $200
annually in state fuel taxes. Survey respondents were informed of this and asked, “if they had the
chance,” how they would advise MoDOT to allocate the $200 they spend each year. They were
given four choices in which to allocate funds and told their allocation must total $200. The
results are shown in Table 6.1. Respondents indicated that maintenance of the current system
was twice as important as new construction. Respondents allocated, on average, $83.49 or forty-
two percent of the total amount to maintenance of the existing system. New construction
attracted an average of $46.21 or twenty-three percent with safety improvements and reducing
congestion each attracting less than twenty percent of the tax revenues collected. It is likely that,
in practice, expenditures for both safety and traffic congestion measures are included in those
expenditures planned for both maintenance and new construction by MoDOT, so that these
amounts could be allocated to the amounts for maintenance and new construction. This could
mean respondents felt that over sixty percent of the taxes collected should be allocated to
maintenance of the current system.
The distribution of tax revenue allocations was compared to the overall satisfaction of
respondents with MoDOT’s performance. As shown in Figure 6.1, as the level of satisfaction
declines, respondents generally allocated more funds to maintaining the current system. These
additional funds were taken from those allocated to safety. The recommended allocations for

60
new construction and congestion management were relatively unchanged with levels of
satisfaction with MoDOT’s overall performance.
Table 6.1: Respondents’ Suggested Allocation of State Fuel Tax Revenues Collected Annually ($200 base)
Note: Amount does not add up to $200.00 due to rounding.
Figure 6.1: Overall Satisfaction with MoDOT Performance and Preferences for Allocation
of State Fuel Taxes
On the other hand, respondent characteristics show significant differences in the
responses to the question of preferred resource allocations. For example, in Figure 6.2 the effect
of age on the response pattern is shown. Here there is a significant and visible difference in
preferences with age showing a relationship with increasing allocations to maintaining the
current system while holding constant funding for building new highways and reducing the
funding for both improved safety and reducing time spent in traffic jams.
Response Mean $ Amount Taking care of the existing highways and bridges $83.49 Expanding and building new highways $46.21 Improving highway safety $37.44 Reducing time spent in traffic jams $32.93 Total $200.07
0.00 10.00 20.00 30.00 40.00 50.00 60.00 70.00 80.00 90.00
100.00
Extremely Dissatisfied
Dissatisfied Satisfied Extremely Satisfied
Overall Satisfaction
Allo
catio
n of
Fue
l Tax
es
Taking care of the existing highways and bridges
Expanding and building new highways
Improving highway safety
Reducing time spent in traffic jams
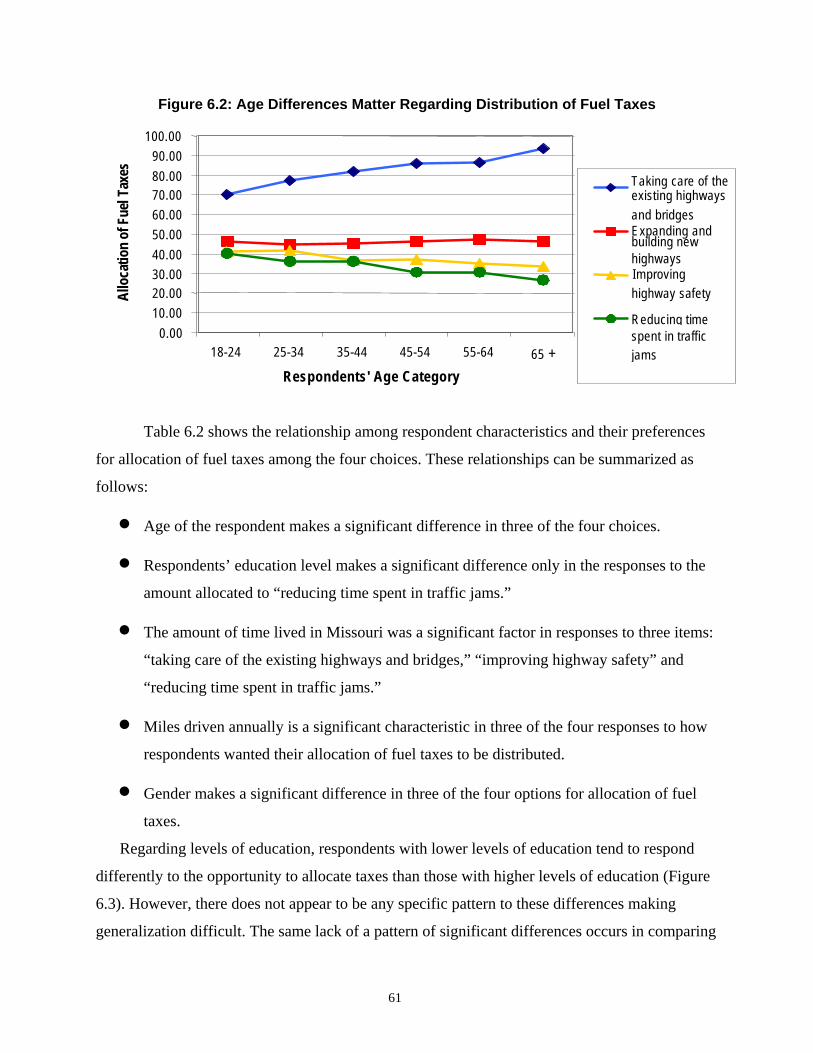
61
Figure 6.2: Age Differences Matter Regarding Distribution of Fuel Taxes
0.00 10.00 20.00 30.00 40.00 50.00 60.00 70.00 80.00 90.00
100.00
18-24 25-34 35-44 45-54 55-64 65 +Respondents' Age Category
Allo
catio
n of
Fue
l Tax
es
Taking care of theexisting highways and bridges Expanding and building new highways Improving highway safety
Reducing timespent in traffic jams
Table 6.2 shows the relationship among respondent characteristics and their preferences
for allocation of fuel taxes among the four choices. These relationships can be summarized as
follows:
• Age of the respondent makes a significant difference in three of the four choices.
• Respondents’ education level makes a significant difference only in the responses to the
amount allocated to “reducing time spent in traffic jams.”
• The amount of time lived in Missouri was a significant factor in responses to three items:
“taking care of the existing highways and bridges,” “improving highway safety” and
“reducing time spent in traffic jams.”
• Miles driven annually is a significant characteristic in three of the four responses to how
respondents wanted their allocation of fuel taxes to be distributed.
• Gender makes a significant difference in three of the four options for allocation of fuel
taxes.
Regarding levels of education, respondents with lower levels of education tend to respond
differently to the opportunity to allocate taxes than those with higher levels of education (Figure
6.3). However, there does not appear to be any specific pattern to these differences making
generalization difficult. The same lack of a pattern of significant differences occurs in comparing

62
allocation choices and miles driven annually. Certainly the clearest trends in the data are those
that are shown in comparisons of age and years lived in Missouri with allocation preferences.
Further details may be found in the analysis provided in Appendix B.
Table 6.2: Comparing Allocations of Fuel Taxes by Respondent Characteristics Mean Amounts Assigned to Options for Allocating Fuel Taxes by TCS Respondents Respondent Characteristic
Taking care of the existing highways
and bridges
Expanding and building new
highways Improving
highway safety Reducing time spent in traffic
jams TOTAL*
AGE 18-24 $70.45 $46.46 $41.56 $40.24 $198.71 25-34 $77.21 $45.17 $42.09 $36.14 $200.61 35-44 $81.61 $45.49 $36.65 $36.50 $200.25 45-54 $85.64 $46.31 $37.61 $30.81 $200.37 55-64 $86.54 $47.68 $35.12 $30.59 $199.93 65+ $93.34 $46.54 $33.66 $26.61 $200.15
GENDER Male $88.67 $47.01 $32.63 $31.42 $199.73 Female $78.59 $45.46 $41.97 $34.36 $200.38
EDUCATION 8th grade or less $87.37 $45.83 $41.81 $26.76 $201.77 Some high school $85.88 $39.72 $42.71 $31.23 $199.54 High school grad $84.84 $45.75 $37.22 $32.45 $200.26 Some college $80.27 $46.45 $37.97 $35.00 $199.69 College grad $82.61 $47.11 $37.04 $33.50 $200.26 Post grad $85.79 $47.47 $35.36 $31.62 $200.24 Tech/professional school $90.21 $47.01 $37.83 $25.89 $200.94
YEARS LIVED IN MISSOURI >10 years $78.10 $44.23 $40.11 $38.64 $201.08 10-19 years $79.26 $43.65 $43.07 $33.49 $199.47 20-29 years $80.24 $46.74 $36.77 $36.43 $200.18 30+ years $86.39 $46.93 $36.00 $30.64 $199.96
MILES DRIVEN ANNUALLY >10,000 miles $85.45 $41.80 $40.01 $32.95 $200.21 10,000 – 19,999 miles $81.66 $47.66 $36.47 $34.41 $200.20 <20,000 miles $83.82 $47.83 $36.61 $31.62 $199.88
Note: Response differences are significant at .05 levels or above as indicated by the shading in the cells of the table. *Total does not add to $200.00 due to rounding function and substantially different number of respondents in individual cells of table.

63
Figure 6.3: Respondent Education Has Limited Effect on Recommended Distribution of Fuel Taxes
0.00 10.00 20.00 30.00 40.00 50.00 60.00 70.00 80.00 90.00
100.00 <8
th gr
ade
Some
high
scho
ol
High
scho
ol gr
ad
Some
colle
ge
Colle
ge gr
ad
Post
grad
Tech
/profe
ssion
al sc
hool
Respondent Level of Education
Allo
catio
n of
Fue
l Tax
es
Taking care of the existinghighways and bridgesExpanding and building newhighways Improving highway safety
Reducing time spent in t ffijams
Current Funding Generally Inadequate—No Consensus Regarding Sources The level of current funding for MoDOT is a rather large amount of money in actual
terms — about $2 billion annually. This money comes from a variety of sources. To most
Missourians, it likely sounds like a lot of money. However, only about thirty-six percent of the
respondents overall believe that MoDOT receives enough money at present to do what is
expected of it (Table 6.3). Thirty-five percent of the respondents answered “No” and almost
thirty percent answered “Don’t know” to this question. This indicates that there may be
substantial potential support available to mobilize in favor of increasing revenues for MoDOT’s
work.
Table 6.3: Percent Respondents Believing MoDOT Receives Enough Money Presently
Total Number of respondents does not add to 4,000 due to rounding procedure used.
Response Frequency Percent Yes 1,424 35.6 No 1,397 34.9 Don't know 1,171 29.3 Refused/Missing 7 0.2 Total 3,999 100.0

64
The responses to this question are statistically related to the number of miles driven annually as
well as age and gender of the respondent and years lived in Missouri at the 0.05 level or above.
Table 6.4: Comparison of Respondent Characteristics and Perceptions That MoDOT Currently Receives Enough Money to do its Job
Percent Responding Respondent Characteristic YES NO DON’T KNOW
Age 18-24 11.8 7.0 6.9 25-34 14.5 15.6 16.0 35-44 21.7 21.0 19.4 45-54 20.6 20.0 20.2 55-64 15.0 18.2 16.9 65+ 16.6 18.2 20.6 Total 100.2 100 100
Gender Male 52.2 51.3 38.1 Female 47.8 48.7 61.9 Total 100 100 100
Education 8th grade or less 1.7 1.4 2.6 Some high school 5.7 3.6 5.9 High school grad 32.7 23.7 30.6 Some college 27.1 25.5 27.1 College grad 20.1 25.5 20.5 Post grad 10.3 18.0 11.2 Tech/professional school 2.4 2.3 2.1 Total 100 100 100
Years Lived In Missouri <10 years 10.1 11.1 13.9 10-19 years 11.2 12.2 11.0 20-29 years 17.2 16.8 16.9 30+ years 61.5 59.9 58.2 Total 100 100 100
Miles Driven Annually <10,000 miles 28.7 25.5 32.5 10,000 – 19,999 miles 36.3 37.3 39.0 >20,000 miles 34.9 37.2 28.5 Total 99.9 100 100
Note: Shaded cells in table denote comparisons of statistically significant differences at 0.05 level of analysis. Totals may not add to 100% due to rounding procedures used.
These differences are fully displayed in Table 6.4 in which the percent responding “Yes” and
“No” and “Don’t Know” is shown.
If they answered “No” or “Don’t Know” to the question regarding their perception of
whether or not MoDOT receives enough money currently to do its job, respondents were also

65
asked what other sources of revenue they would be most likely to support for increasing support
for MoDOT. They were given a number of choices and asked to rank them, naming the most
favored source first, the next most favored second and so on until they had ranked all the
choices. Figure 6.4 shows the results of the top four preferences and a summary ranking. The
most favored choice among the first responses was “a combination” of sources with “a dedicated
sales tax” a close second. On the second response, the most favored source was an increase in the
fuel tax. Increasing user fees was the most popular response on the third choice, and revenue
bonds were the most popular choice in the fourth selection. By examining the results for all four
rankings together (top row in the bar chart), data show that respondents do not have a clear
preference for sources to increase MoDOT’s fiscal base. Some combination of sources is the
most likely approach, even though this preference was chosen only slightly more often by
respondents in all four rounds than the other choices combined. After the defeat of the statewide
proposal in 2002 for increasing sales taxes to support MoDOT, a lot of work is likely if a suitable
coalition of citizens is to be mobilized around some combination of sources that will be
acceptable to a majority.
Preferred funding sources (only first responses to this question were used for these
comparisons) showed differences according to different respondent characteristics based on a
cross-tabulation analysis (Table 6.5).4 These differences can be summarized as below:
• Age differences are significantly related to preferences in funding sources with
respondents aged 18-24 having a mean response lower than other age groups.
• Gender is significantly related to preferences in funding sources.
• Educational level is significantly related to differences in the responses.
• The length of time respondents had lived in Missouri was not a significant factor in the
respondents’ selection of preferences.
• Responses were not significantly related to the number of miles respondents had driven
annually.
4 Cross-tabulation analysis compares the actual number of observations in each cell of a table composed of the categories of responses and respondent characteristics with the expected number of observations in each cell of the table. If the two numbers are fairly close, the hypothesis that the two factors are unrelated is rejected.
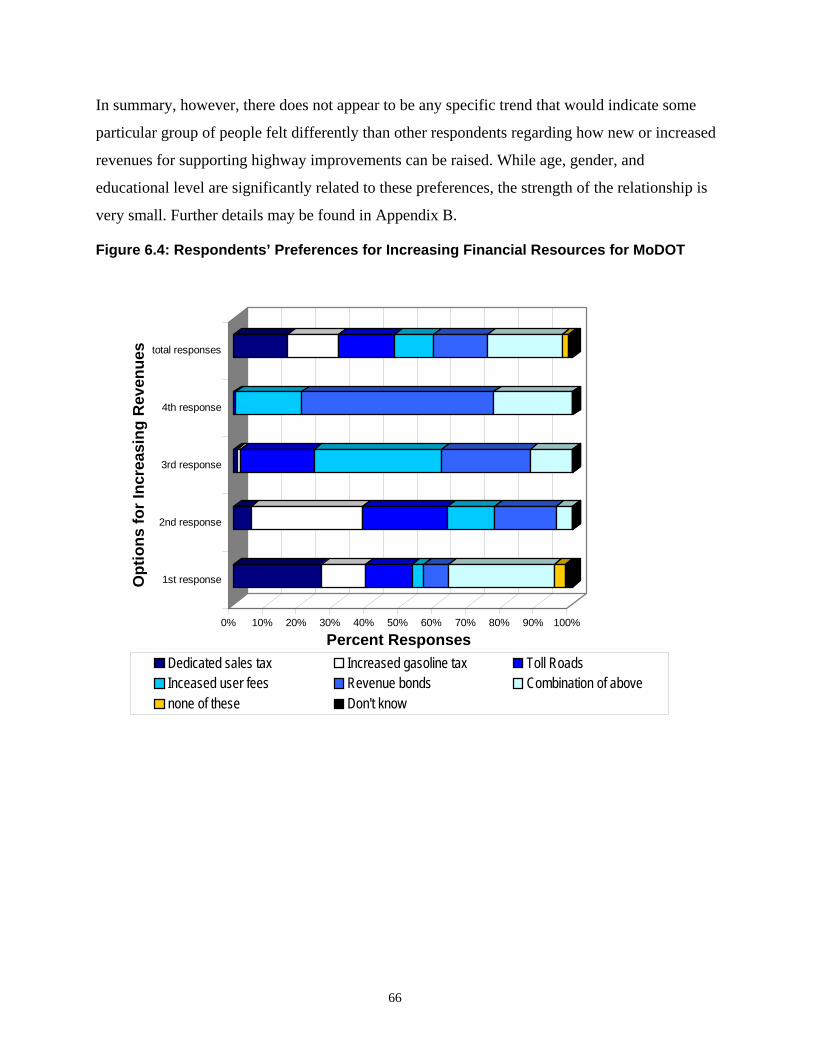
66
In summary, however, there does not appear to be any specific trend that would indicate some
particular group of people felt differently than other respondents regarding how new or increased
revenues for supporting highway improvements can be raised. While age, gender, and
educational level are significantly related to these preferences, the strength of the relationship is
very small. Further details may be found in Appendix B.
Figure 6.4: Respondents’ Preferences for Increasing Financial Resources for MoDOT
0% 10% 20% 30% 40% 50% 60% 70% 80% 90% 100%
Percent Responses
1st response
2nd response
3rd response
4th response
total responses
Opt
ions
for I
ncre
asin
g R
even
ues
Dedicated sales tax Increased gasoline tax Toll RoadsInceased user fees Revenue bonds Combination of abovenone of these Don't know
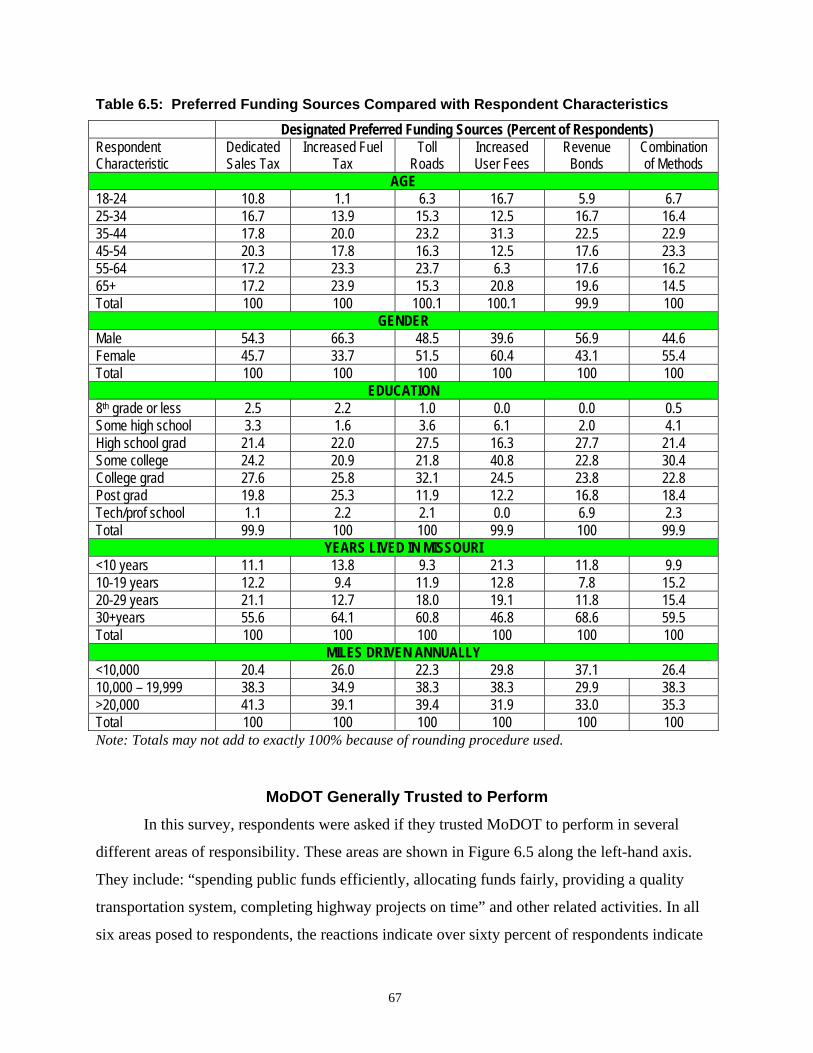
67
Table 6.5: Preferred Funding Sources Compared with Respondent Characteristics
Designated Preferred Funding Sources (Percent of Respondents) Respondent Characteristic
Dedicated Sales Tax
Increased Fuel Tax
Toll Roads
Increased User Fees
Revenue Bonds
Combination of Methods
AGE 18-24 10.8 1.1 6.3 16.7 5.9 6.7 25-34 16.7 13.9 15.3 12.5 16.7 16.4 35-44 17.8 20.0 23.2 31.3 22.5 22.9 45-54 20.3 17.8 16.3 12.5 17.6 23.3 55-64 17.2 23.3 23.7 6.3 17.6 16.2 65+ 17.2 23.9 15.3 20.8 19.6 14.5 Total 100 100 100.1 100.1 99.9 100
GENDER Male 54.3 66.3 48.5 39.6 56.9 44.6 Female 45.7 33.7 51.5 60.4 43.1 55.4 Total 100 100 100 100 100 100
EDUCATION 8th grade or less 2.5 2.2 1.0 0.0 0.0 0.5 Some high school 3.3 1.6 3.6 6.1 2.0 4.1 High school grad 21.4 22.0 27.5 16.3 27.7 21.4 Some college 24.2 20.9 21.8 40.8 22.8 30.4 College grad 27.6 25.8 32.1 24.5 23.8 22.8 Post grad 19.8 25.3 11.9 12.2 16.8 18.4 Tech/prof school 1.1 2.2 2.1 0.0 6.9 2.3 Total 99.9 100 100 99.9 100 99.9
YEARS LIVED IN MISSOURI <10 years 11.1 13.8 9.3 21.3 11.8 9.9 10-19 years 12.2 9.4 11.9 12.8 7.8 15.2 20-29 years 21.1 12.7 18.0 19.1 11.8 15.4 30+years 55.6 64.1 60.8 46.8 68.6 59.5 Total 100 100 100 100 100 100
MILES DRIVEN ANNUALLY <10,000 20.4 26.0 22.3 29.8 37.1 26.4 10,000 – 19,999 38.3 34.9 38.3 38.3 29.9 38.3 >20,000 41.3 39.1 39.4 31.9 33.0 35.3 Total 100 100 100 100 100 100 Note: Totals may not add to exactly 100% because of rounding procedure used.
MoDOT Generally Trusted to Perform In this survey, respondents were asked if they trusted MoDOT to perform in several
different areas of responsibility. These areas are shown in Figure 6.5 along the left-hand axis.
They include: “spending public funds efficiently, allocating funds fairly, providing a quality
transportation system, completing highway projects on time” and other related activities. In all
six areas posed to respondents, the reactions indicate over sixty percent of respondents indicate

68
they trust MoDOT to perform at least “to some degree.” Further, the tendency is clearly toward
the trusting “to a great degree” end of the distribution rather than trusting “not at all.”
Since there are six items in this set of responses dealing with trust in the agency, it was
useful to determine if all of these items were inter-related and addressing the same idea as was
intended. An analysis was conducted to determine this and, as desired, all the items were highly
enough inter-related empirically to conclude that they collectively and individually, address the
same idea: trust in the agency.
Responses to the set of questions regarding trust in MoDOT show significant differences
with regard to age and education level of respondent. Trust in MoDOT is not related to the
number of years a respondent has lived in Missouri. However, the higher the mileage driven
annually by respondents the higher the level of trust assigned to MoDOT by the respondent for
most of the six survey items. This is not true for two of the six items where mileage driven shows
no significant effect. Further, when the number of miles driven is related to the composite trust
factor (i.e., all six items taken together), there is no relationship at all.
It is possible that respondents who held a commercial driver’s license hold different
perceptions of trust regarding MoDOT’s performance. This could be that they are more familiar
with highway conditions in Missouri and in comparison to other states because they drive so
many more miles than people without commercial licenses. When the responses on the six trust
questions were examined by the respondents who possessed a commercial driver’s license, only
two of the six showed that holding a commercial license made any significant difference:
“allocate funds fairly” and “pay attention to public input.” In addition, the general pattern of
responses is quite similar to that for the total sample, and all the items indicate that 60 percent or
more of commercial drivers feel they can trust MoDOT “to a great degree” or “to some degree”
to perform in the areas indicated.

69
Figure 6.5: Responses to Survey Regarding Perceived Trust in MoDOT
0 10 20 30 40 50 60 70
complete highway improvement projects on time
complete highway projects as planned
allocate funds fairly
provide a quality transportation system
pay attention to public input on planned projects
spend public funds efficiently
To a great degree Some Not very much Not at all
Sources of Information Used by Respondents Missouri’s citizens can obtain information about the things in which they have an interest from
a variety of sources. These sources might include: watching television, listening to radio broadcasts,
reading the newspaper, searching for information on the Internet, or making a personal contact with a
MoDOT employee or other civic official or using the toll-free customer service phone number to
solicit information. TCS respondents were given the opportunity to indicate where they received
information about MoDOT. Respondents were given a series of options, similar to the list above, and
asked which source they most often used. They were also asked which sources they used in addition to
their first source and were permitted to make up to seven choices, including “other” in which they were
asked to supply a specific response. The responses were recorded in order of selection by respondents.
The results of this procedure are presented in Figure 6.6 and show that television, radio and
Do yo
u tru
st M
oDOT
to:
Percent of Respondents

70
newspapers are the most frequently used sources of information about MoDOT and its activities. Since
only sixteen percent of respondents named more than three sources, these first three choices are
highlighted in Figure 6.6. At this point in time, conventional sources of information are far more
important to Missourians than newer forms of information.
Figure 6.6: Three Important Sources of Information about MoDOT Used by TCS Respondents
0% 20% 40% 60% 80% 100%
Percent Responding
First Choice
Second Choice
Third Choice
Choi
ces m
ade b
y Res
pond
ents
for
Sour
ces o
f Inf
orm
atio
n
TV Radio NewspaperThe Internet Toll-free phone number Public MeetingPersonal contact Other
Distribution of Fuel Tax Revenues It may not be well known that revenue from the fuel sales tax is distributed by statute to a
number of places besides the Missouri Department of Transportation. The statute diverts about half the
total revenue stream to city and county government units and other executive branch departments in
equal portions (about 25 percent each). The TCS interviewers informed each respondent of this
statutory requirement and asked for their opinions regarding the continuation of this procedure. The
results are summarized in Table 6.6 and indicate that there is little support for continuing to distribute
fuel taxes to other state agencies. At the same time, respondents indicate substantial support for
continuing to distribute a portion of these revenues to city and county governments. It is reasonable to
assume that, if the tax is imposed on fuel, it is considered a “dedicated tax” for transportation purposes

71
and that respondents recognize that MoDOT shares some of the responsibility with city and county
governments for the general transportation system.
Table 6.6: Preferences Regarding Distribution of Fuel Tax Revenues
Do you favor continuing to distribute these funds to city and county governments?
Do you favor continuing to distribute these funds to other state
departments? Percent Responding Percent Responding Yes 76.1 31.4 No 15.5 57.3 Don't know 8.3 11.1 Refused 0.1 0.2 Total 100.00 100.00
Summary of Findings The four questions from the TCS discussed in this chapter represent important concerns for
MoDOT with regard to recent political events. Questions of adequacy of resources to do the job, how
fuel tax money should be allocated to specific outcomes and trust in the agency to do its job well all
relate to how MoDOT is perceived and what manner of political challenges agency managers face.
These results show that: (1) a majority of respondents feel that maintaining the current transportation
system is the most important of four outcome choices given respondents and twice as important as the
next highest rated outcome (in terms of assigning a portion of the fuel taxes received); (2) that there
appears to be no consensus about how to increase revenues for MoDOT’s work in transportation
system development and maintenance; (3) there is a general level of trust in the agency to do its
assigned job by respondents; and (4) the distribution of tax money to local governments should be
continued according to a large majority, but the distribution to other state agencies is not supported by
respondents.

72
Chapter 7: Comparison of 2003 TCS with Benchmark In 2000, a benchmark survey was conducted that was essentially identical to the TCS survey
conducted in 2003. This survey, known as the Constituent Service Quality Survey (CSQS), used a
telephone survey methodology to interview over 1,500 Missouri residents (over 18 years of age).
While the CSQS used forty-one items in its survey of elements of work related to MoDOT
performance instead of thirty-four, there are thirty-one elements of work that are the same in both
surveys in the survey sections related to ratings of current satisfaction and future attention. In both the
CSQS and TCS, the format for asking these questions was identical. This approach was used because it
was anticipated that the basic survey would be replicated at least once, if not more often, as is being
done in a number of other states (e.g., Pennsylvania). The TCS surveyed a larger number of Missouri
residents, but both surveys meet a minimum standard for a confidence interval of +/- 3 percent or less
and a level of significance of at least 95 percent. The TCS meets this standard for both the state and all
the MoDOT districts.
In this chapter, the results of the TCS are compared with the results of the CSQS obtained in
2000 and reported to MoDOT in a previous report. These item-by-item comparisons sometimes show
improvements in the perceived ratings of current satisfaction and, sometimes, no improvement or
diminished ratings. Similarly, the comparisons of ratings of desired future attention show some
instances are rated lower in 2003 than in 2000 and some higher. Finally, the discrepancy scores
computed from the difference between the ratings of future attention and current satisfaction are
compared to show areas in which perceived performance has improved or declined.
As a common reference for the following discussion, the thirty-four items included in the TCS
are listed in Table 7.1 (as they were in Table 4.1) as well as the computed mean ratings for each item
in 2000 and 2003. The discrepancy scores for 2000 and 2003 are similarly compared in this table. In all
the graphics included in this chapter, the same numbers are used for each item, and they are listed
consecutively (re: current satisfaction means in 2003) for consistent reference.
Results Show Modest Improvement in Perceived Current Satisfaction Compared to the results of the CSQS in 2000, the means of current satisfaction in 2003 are
somewhat higher in twenty-five of thirty-four items (Table 7.1). The 2000 CSQS mean scores of
responses to the thirty-four performance items ranged from 2.15 to 2.99. The mean scores for the 2003
TCS ranged from 2.31 to 2.98. In those cases where the means were lower, the difference between the

73
two scores was less than 0.10 on the four-point scale. In those cases where the means were higher, 11
of these showed differences that were less than 0.10. The remaining items showed differences in
means between 0.10 and almost 0.30 on this scale. The comparison shown in Figures 7.1 and 7.2
shows just how small the changes are in mean differences between 2000 and 2003.
An examination of the 2000 and 2003 rankings of current satisfaction items (based on mean
scores) shows very small shifts (up or down) from one year to another. Twenty-five items had mean
scores higher in 2003 than in 2000 (Figure 7.1) and twenty-one of the thirty-four items shifted down in
rank (Table 7.2). To further test the relationship, the rank order correlations for both mean scores and
rank between the CSQS and the TCS were computed (Table 7.3). This statistic shows how closely the
two sets of results are related, with a correlation of zero indicating no relationship at all, and 1.0
showing perfect reproduction of the rankings from 2000 to 2003. The figures in the table indicate that
the means for 2000 and 2003 are correlated at the level of 0.95 and the rankings are also correlated at a
(very high) level of 0.94 (both correlations are statistically significant at the 0.01 level). These figures
indicate a high relationship between the means (and the order of their presentation from highest to
lowest, and a similarly high relationship between the item rankings (based on mean scores). In other
words, there is very little difference in the two sets of item rankings and, as shown in Figure 7.1 and
Table 7.1, only small differences in the means, meaning that only small improvements in perceived
current satisfaction with MoDOT’s performance were measured. However small, the majority of
changes measured are in the desired direction: satisfaction levels are increasing.
Comparisons of Ratings of Desired Future Attention, 2000-2003 The comparisons of means and item rankings (according to their means) for ratings of desired
future attention is also shown in Table 7.1 and Table 7.2. The desired direction of change in this case is
the opposite of that for current satisfaction ratings. The results displayed in Table 7.1 show that
fourteen of the thirty-four items show changes in the desired direction, while fourteen of the thirty-four
items showed changes in the other direction. In almost all cases, the differences are small. This is
shown graphically in Figure 7.2. In the case of the item rankings (based on their means), nine items
showed changes in the desired direction, and, as before, the changes in rank are usually small in
degree. Similar to the results for rankings of current satisfaction, the change in item rankings between
2000 and 2003 are also small, and when the rank order correlation is computed, the correlations are
very high for the rankings and more modest for the means. Again, very little significant difference can

74
be claimed between the two periods. The direction of change in both means and rankings is, however,
in the desired direction.
(Remainder of page intentionally left blank.)

75
Table 7.1: Results of 2000 and 2003 Surveys Compared by Means for Performance Items
Current Satisfaction Future Attention Discrepancy Scores Item # Item Description 2000 Mean 2003 Mean 2000 Mean 2003 Mean 2000 Mean 2003 Mean
1 Using electronic message boards to advise drivers of delays or construction areas 2.93 2.98 2.94 2.97 -0.02 0.00 2 Placing yellow warning signs to assure sufficient response time 2.99 2.93 3.01 2.97 -0.02 -0.05 3 Removing snow/ice efficiently 2.81 2.92 3.18 3.03 -0.37 -0.14 4 Having signs that can be easily seen at night or in bad weather 2.91 2.88 3.18 3.05 -0.27 -0.18 5 Building bridges that last a long time 2.85 2.83 3.27 3.13 -0.42 -0.31 6 Providing useful information about construction, repairs or road conditions 2.78 2.83 2.99 3.02 -0.21 -0.20 7 Providing lanes that are wide enough for safe driving 2.93 2.85 3.08 3.03 -0.15 -0.19 8 Communicating with the public in easy to understand language 2.80 2.83 2.98 3.02 -0.18 -0.21 9 Building bridges that are wide enough to feel safe 2.87 2.84 3.11 3.04 -0.24 -0.22 10 Providing the ability to see far ahead on highways and have unobstructed views at intersections n/a 2.83 n/a 3.04 n/a -0.22 11 Striping center lines and road edges to ensure safety 2.77 2.82 3.14 3.08 -0.37 -0.28 12 Lighting interchanges and bridges 2.74 2.83 3.05 2.97 -0.32 -0.16 13 Providing crosswalks and signals for pedestrians to cross the highway safely 2.55 2.74 2.99 3.01 -0.45 -0.31 14 Treating highway surfaces to resist skidding in wet weather 2.53 2.72 3.20 3.14 -0.68 -0.44 15 Managing traffic flow in construction zones to minimize delays to drivers n/a 2.62 n/a 3.18 n/a -0.61 16 Providing enough passing opportunities on two-lane highways 2.60 2.70 2.98 3.00 -0.38 -0.34 17 Providing pavement markings that can be easily seen in wet weather 2.53 2.65 3.25 3.15 -0.61 -0.54 18 Providing passenger light rail routes that meet your needs n/a 2.58 n/a 3.01 n/a -0.59 19 Building new highways to meet future demand 2.53 2.62 3.15 3.16 -0.73 -0.57 20 Providing the public with adequate opportunities for input in project planning 2.31 2.58 3.04 3.14 -0.73 -0.61 21 Providing sufficient transportation for those who don't or can't drive 2.50 2.53 3.09 3.15 -0.61 -0.72 22 Honoring commitments to provide and maintain Missouri's transportation system 2.51 2.58 3.27 3.22 -0.75 -0.69 23 Planning a project in a reasonable amount of time 2.34 2.53 3.15 3.18 -0.82 -0.71 24 Completing road and bridge construction and repairs in a timely manner 2.33 2.49 3.26 3.27 -0.94 -0.83 25 Providing shoulders that are wide enough to pull off the road safely 2.51 2.60 3.13 3.14 -0.62 -0.57 26 Providing Amtrak passenger rail service to meet your needs 2.38 2.52 2.73 2.90 -0.46 -0.63 27 Improving existing highways to meet increasing traffic demands 2.46 2.52 3.28 3.28 -0.82 -0.79 28 Acting on recommendations from the public n/a 2.52 n/a 3.18 n/a -0.73 29 Providing pedestrian/bicycle pathways on or next to highways that are safe 2.08 2.47 2.71 2.96 -0.67 -0.59 30 Providing pavement that lasts a long time 2.29 2.41 3.34 3.32 -1.06 -0.94 31 Using public funds in a cost effective manner 2.29 2.41 3.37 3.34 -1.06 -0.98 32 Repairing pavement surface promptly 2.15 2.32 3.31 3.34 -1.17 -1.06 33 Distributing transportation funds fairly to all areas of the state 2.30 2.38 3.28 3.27 -0.98 -1.01 34 Maintaining the pavement so it provides a smooth ride 2.22 2.31 3.27 3.30 -1.05 -1.03
Note: As noted in the text (p. 51), subtracting the mean scores for current satisfaction and desired future attention shown above will not yield the same difference as that reported in the discrepancy column because of the method used in the calculation.
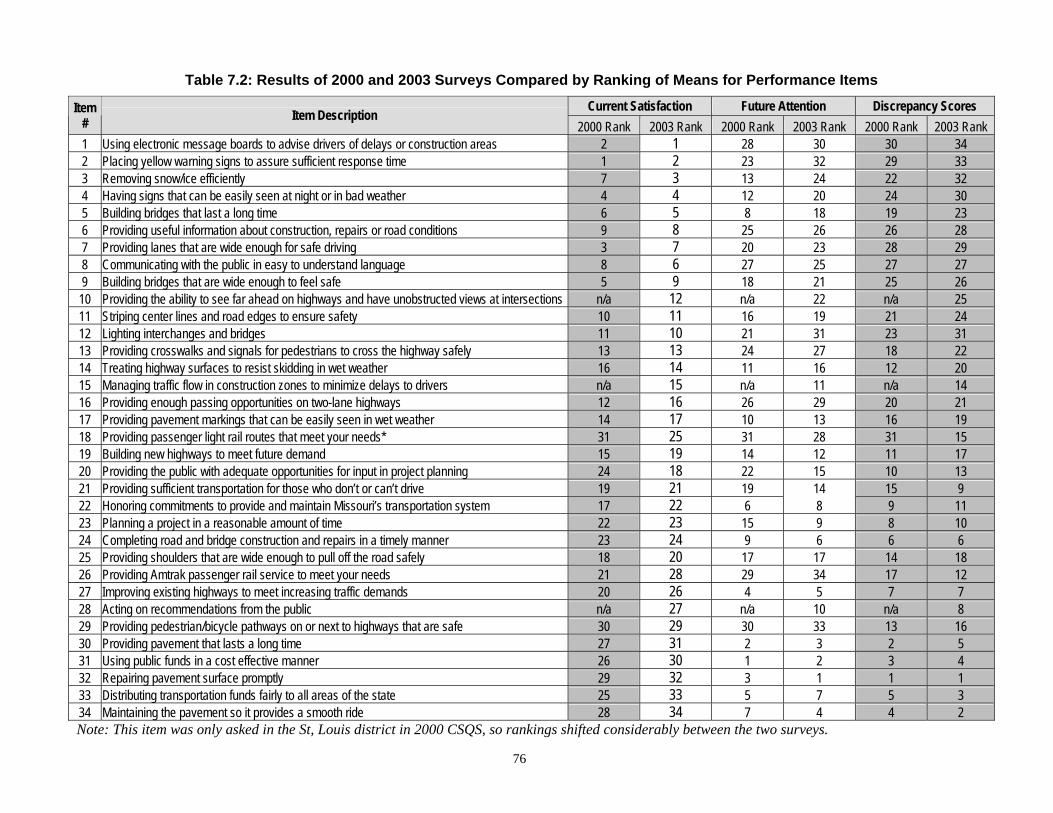
76
Table 7.2: Results of 2000 and 2003 Surveys Compared by Ranking of Means for Performance Items
Current Satisfaction Future Attention Discrepancy Scores Item # Item Description
2000 Rank 2003 Rank 2000 Rank 2003 Rank 2000 Rank 2003 Rank 1 Using electronic message boards to advise drivers of delays or construction areas 2 1 28 30 30 34 2 Placing yellow warning signs to assure sufficient response time 1 2 23 32 29 33 3 Removing snow/ice efficiently 7 3 13 24 22 32 4 Having signs that can be easily seen at night or in bad weather 4 4 12 20 24 30 5 Building bridges that last a long time 6 5 8 18 19 23 6 Providing useful information about construction, repairs or road conditions 9 8 25 26 26 28 7 Providing lanes that are wide enough for safe driving 3 7 20 23 28 29 8 Communicating with the public in easy to understand language 8 6 27 25 27 27 9 Building bridges that are wide enough to feel safe 5 9 18 21 25 26 10 Providing the ability to see far ahead on highways and have unobstructed views at intersections n/a 12 n/a 22 n/a 25 11 Striping center lines and road edges to ensure safety 10 11 16 19 21 24 12 Lighting interchanges and bridges 11 10 21 31 23 31 13 Providing crosswalks and signals for pedestrians to cross the highway safely 13 13 24 27 18 22 14 Treating highway surfaces to resist skidding in wet weather 16 14 11 16 12 20 15 Managing traffic flow in construction zones to minimize delays to drivers n/a 15 n/a 11 n/a 14 16 Providing enough passing opportunities on two-lane highways 12 16 26 29 20 21 17 Providing pavement markings that can be easily seen in wet weather 14 17 10 13 16 19 18 Providing passenger light rail routes that meet your needs* 31 25 31 28 31 15 19 Building new highways to meet future demand 15 19 14 12 11 17 20 Providing the public with adequate opportunities for input in project planning 24 18 22 15 10 13 21 Providing sufficient transportation for those who don’t or can’t drive 19 21 19 14 15 9 22 Honoring commitments to provide and maintain Missouri’s transportation system 17 22 6 8 9 11 23 Planning a project in a reasonable amount of time 22 23 15 9 8 10 24 Completing road and bridge construction and repairs in a timely manner 23 24 9 6 6 6 25 Providing shoulders that are wide enough to pull off the road safely 18 20 17 17 14 18 26 Providing Amtrak passenger rail service to meet your needs 21 28 29 34 17 12 27 Improving existing highways to meet increasing traffic demands 20 26 4 5 7 7 28 Acting on recommendations from the public n/a 27 n/a 10 n/a 8 29 Providing pedestrian/bicycle pathways on or next to highways that are safe 30 29 30 33 13 16 30 Providing pavement that lasts a long time 27 31 2 3 2 5 31 Using public funds in a cost effective manner 26 30 1 2 3 4 32 Repairing pavement surface promptly 29 32 3 1 1 1 33 Distributing transportation funds fairly to all areas of the state 25 33 5 7 5 3 34 Maintaining the pavement so it provides a smooth ride 28 34 7 4 4 2 Note: This item was only asked in the St, Louis district in 2000 CSQS, so rankings shifted considerably between the two surveys.

77
Figure 7.1: Comparisons of Means for Current Satisfaction Ratings, 2000 and 2003
0.00
0.50
1.00
1.50
2.00
2.50
3.00
3.50
1 2 3 4 5 6 7 8 9 10 11 12 13 14 15 16 17 18 19 20 21 22 23 24 25 26 27 28 29 30 31 32 33 34
Item Number
Mean
Sco
res f
or C
urre
nt S
atisf
actio
n
2000 Mean2003 Mean
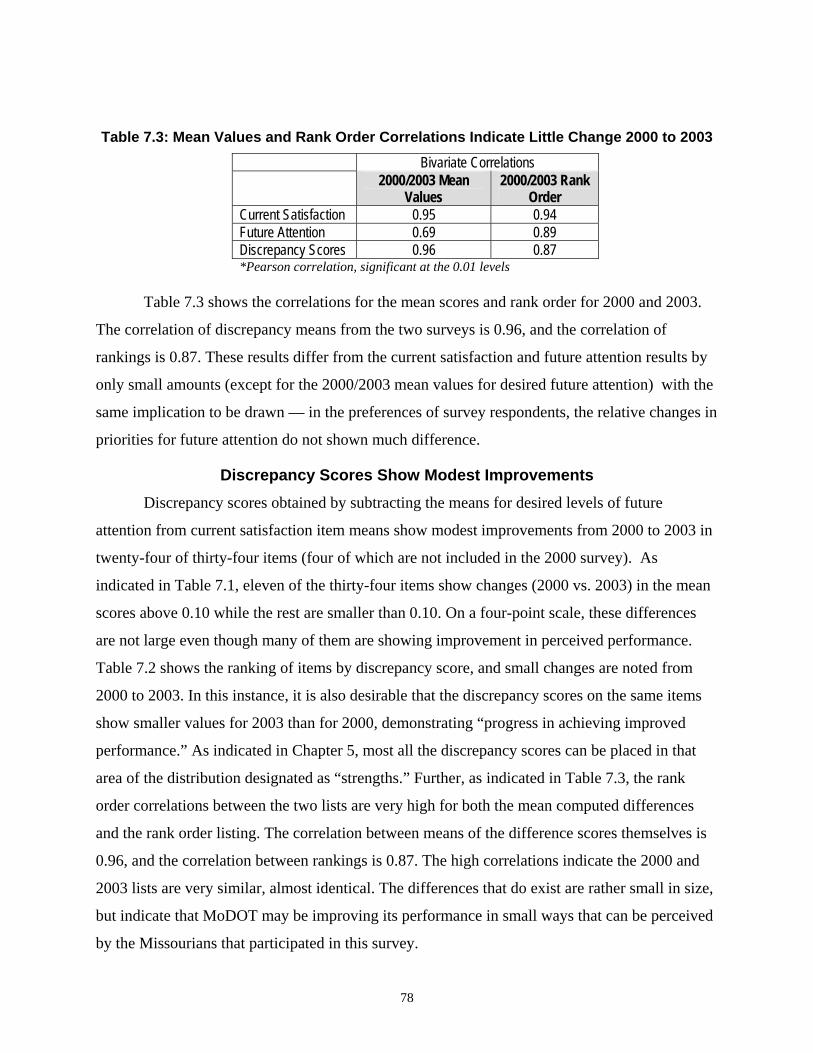
78
Table 7.3: Mean Values and Rank Order Correlations Indicate Little Change 2000 to 2003
Bivariate Correlations
2000/2003 Mean
Values 2000/2003 Rank
Order Current Satisfaction 0.95 0.94 Future Attention 0.69 0.89 Discrepancy Scores 0.96 0.87 *Pearson correlation, significant at the 0.01 levels
Table 7.3 shows the correlations for the mean scores and rank order for 2000 and 2003.
The correlation of discrepancy means from the two surveys is 0.96, and the correlation of
rankings is 0.87. These results differ from the current satisfaction and future attention results by
only small amounts (except for the 2000/2003 mean values for desired future attention) with the
same implication to be drawn — in the preferences of survey respondents, the relative changes in
priorities for future attention do not shown much difference.
Discrepancy Scores Show Modest Improvements Discrepancy scores obtained by subtracting the means for desired levels of future
attention from current satisfaction item means show modest improvements from 2000 to 2003 in
twenty-four of thirty-four items (four of which are not included in the 2000 survey). As
indicated in Table 7.1, eleven of the thirty-four items show changes (2000 vs. 2003) in the mean
scores above 0.10 while the rest are smaller than 0.10. On a four-point scale, these differences
are not large even though many of them are showing improvement in perceived performance.
Table 7.2 shows the ranking of items by discrepancy score, and small changes are noted from
2000 to 2003. In this instance, it is also desirable that the discrepancy scores on the same items
show smaller values for 2003 than for 2000, demonstrating “progress in achieving improved
performance.” As indicated in Chapter 5, most all the discrepancy scores can be placed in that
area of the distribution designated as “strengths.” Further, as indicated in Table 7.3, the rank
order correlations between the two lists are very high for both the mean computed differences
and the rank order listing. The correlation between means of the difference scores themselves is
0.96, and the correlation between rankings is 0.87. The high correlations indicate the 2000 and
2003 lists are very similar, almost identical. The differences that do exist are rather small in size,
but indicate that MoDOT may be improving its performance in small ways that can be perceived
by the Missourians that participated in this survey.

79
Figure 7.2: Comparisons of Means for Future Attention Ratings 2000 and 2003
0
0.5
1
1.5
2
2.5
3
3.5
4
1 2 3 4 5 6 7 8 9 10 11 12 13 14 15 16 17 18 19 20 21 22 23 24 25 26 27 28 29 30 31 32 33 34
Item Number
Mean
Sco
res f
or F
utur
e Atte
ntio
n
2000 Mean2003 Mean

80
Preservation and Maintenance Increasingly Important In the 2000 CSQS study respondents were asked “If you had the opportunity to advise the
Missouri Department of Transportation and could divide its budget between two items, what
percentage of current funding would you recommend they spend on preserving and maintaining
the existing highways and infrastructure (and what would you spend on) expanding and building
new highways?” (In this discussion, the first option is referred to as “preservation” and the
second alternative as “expansion.”) Statewide, citizens expressed preference in 2000 for an
emphasis on preservation, with the average response specifying 58 percent of resources for
preserving and maintaining to 42 percent for expanding and building new highways.
In the 2003 TCS the question was presented to respondents in a different fashion. The
question asked respondents to allocate $200, the estimated average fuel tax expenditure per
licensed driver, among four options instead of two. However, two of these options relate directly
to “preservation” and “expansion”: “taking care of the existing highways and bridges” and
“expanding and building new highways.” Given four options to choose from in 2003 respondents
continued to allocate more funds for maintenance and preservation of existing highways. Almost
$84.00 (42%) was allocated by respondents to “taking care of the existing highways and bridges”
compared to $46.00 (23%) for “expanding and building new highways.” The amounts allocated
to these two activities are important to consider when comparing these results to those obtained
in 2000 and clearly shows that respondents give greater priority to preservation and maintenance
over new construction.
Mass Media Remains Important as Source for Information Traditionally people have relied upon television, radio and newspaper for their
information about governmental activities. In the 2000 CSQS and the 2003 TCS respondents
were asked what sources were important to them for information about MoDOT and its
activities. In 2000 television (42%), newspapers (33%) and radio (16%) were the most important
sources. In 2003 the order changes, but respondents listed the same three sources as the first
choice: television (70%), radio (13%) and newspapers (10%). Most strikingly, the proportion of
people relying on television for their information about MoDOT has nearly doubled, at the
expense of other media forms. While radio was the second choice selected by sixty percent of
respondents in 2003 and newspapers was the clear third choice, again by sixty percent of

81
respondents, this large increase is worth noting. Other sources such as the Internet, toll-free
customer service hot lines, and personal contacts remain very small in their relative importance.
Benchmark Comparisons Show Modest Improvements, 2000 - 2003 As shown in this chapter, the comparison of the 2003 survey results with the benchmark
study of 2000 show modest improvements. The changes, while in the desired direction in a
majority of instances, are generally small in size. Since only three years have passed since the
benchmark was established, only modest improvements should be expected. Means and rankings
(based on percentage of respondents answering “satisfied” and “extremely satisfied”) of thirty-
four items reflecting the work MoDOT does to maintain and improve the transportation system
regarding perceived levels of current satisfaction and desired future attention show small
differences between the benchmark of 2000 and the 2003 results. These differences are generally
in the right direction. Similarly, the discrepancy score differences between the two surveys are
small, but they are generally in the right direction (Figure 7.3). Are these statistically important
differences? That cannot be determined as the two surveys were conducted with different
individuals. Are these differences important enough to get the attention of MoDOT
management? The answer to this question undoubtedly depends on the attitude of managers and
the Missouri Highways and Transportation Commission toward the results.
Benchmarking performance as perceived by the constituents of MoDOT is an important
process for helping management decide upon actions that may possibly improve both perceived
and actual performance. Most of the literature dealing with improving the performance of public
agencies places considerable importance on “customer satisfaction” information as one measure
of performance. While this information should be matched with more objective indicators before
managers make decisions involving priority shifts or allocation of resources to specific areas of
agency activity, most observers recommend significant attention be given to the indicators of
customer satisfaction such as those reported in this report.
MoDOT has taken this general perspective seriously and conscientiously pursued the
measurement of customer satisfaction, as well as perceptions of desired level of future attention
to be given to a number of areas of work performed by the agency. Separate surveys conducted
of Missouri citizens in 2000 and 2003 have assessed the perceptions of current satisfaction and
desired future attention. Further, these results were used to compute difference scores
(representing discrepancies between current and future levels of performance) that help

82
management assess its future actions. The comparisons indicate that, based on customer
perceptions, MoDOT’s performance is improving in appropriate ways, many times giving
emphasis to those areas of concern identified by customers in these surveys.
(Remainder of page intentionally left blank.)

83
Figure 7.3: Comparisons of Discrepancy Scores, 2000 and 2003
34
32
30
28
26
24
22
20
18
16
14
12
10
8
6
2
4
-1.4 -1.2 -1 -0.8 -0.6 -0.4 -0.2 0 0.2
1
3
5
7
9
11
13
15
17
19
21
23
25
27
29
31
33
Item
Num
ber
Discrepancy Scores
2000 Mean 2003 Mean

84
Appendix A.1
Transportation Customer Survey Methodology 2003
MISSOURI DEPARTMENT OF TRANSPORTATION
Conducted by Schulman, Ronca and Bucuvalas, Inc.
8403 Colesville Road, Suite 820 Silver Spring, MD 20906
301-608-3883
Project Directors: John M. Boyle, Ph.D.
Overview The Department of Rural Sociology at the University of Missouri-Columbia commissioned the national survey research organization, Schulman, Ronca and Bucuvalas, Inc. (SRBI) to conduct the 2003 Transportation Customer Survey (TCS) for the Missouri Department of Transportation (MoDOT). The survey asked respondents about their usage of different methods of transportation; satisfaction with and future recommendations for specific aspects of the state transportation system; recent contacts with MODOT; sources of transportation information; opinions about the allocation of the state fuel tax to state and local governments; and a comparison of Missouri highways compared with those in other states to which the respondent had traveled within the past 12 months. Questions about respondent demographic characteristics were also asked in the interview. The survey was conducted with a statewide sample of 4,012 adults in the state of Missouri. Approximately 400 interviews were completed in each of 10 geographic regions of the state: Central, Kansas City, North Central, Northeast, Northwest, St. Louis, Southwest, Springfield area, South Central and Southeast. Interviewing was conducted between May 14 and June 8, 2003, with an average length of 20.1 minutes. The questionnaire was translated into Spanish and 12 interviews were completed in Spanish where respondents were unable to complete the survey in English.
85
The sampling area to be covered by the survey was geographically defined as the entire state of Missouri. Within the geographically defined boundaries of the sample, a series of replicate simple random samples of working residential telephone banks was drawn. Two digits were randomly generated and appended to the residential bank number to produce a full 10 random digit telephone number. The random digit sample was loaded by replicate into a sample management system. These numbers were then systematically dialed by telephone interviewers located in SRBI’s central telephone interviewing facilities. The interviewing protocol called for a total of five contact attempts at sampled numbers to determine whether a household had been reached. Contact attempts were made during the hours that persons are most likely to be home – from 5:30 p.m. to 9:30 p.m. on weekdays and from 10:00 a.m. to 9:30 p.m. on weekends. If no contact had been made after five attempts, the number was dropped. If contact was made with an eligible household, one adult was selected as the designated respondent for the survey using the most recent birthday screen. If the designated respondent was not available to conduct the interview, additional attempts were made to reach and interview the designated respondent. Attempts were made to convert initial refusals beginning 25 hours after the refusal. The sampling and interviewing procedures were identical for all samples in the survey.
Sample Design Because the surveys were conducted by telephone, the study procedures called for the construction of a geographically defined sampling frame of telephone households from which an unbiased population sample could be derived. The sample was stratified by district with equal allocation of completed interviews across the 10 regions, yielding 400 interviews in each of the 10 districts in the state. This approach improved the precision of the sample estimates in eight of the 10 districts where the equal allocation sample is larger than would be expected from a proportionate sample. However, the estimates of statewide totals require geographic sample weights to correct for disproportionate sampling. A probability sample was constructed for the state of Missouri using a multi-stage procedure. The first-stage sample involved the allocation of sample within the 10 specified geographical districts of the state. The second-stage employed a systematic selection of assigned telephone banks within the geographically stratified first-stage sample design. The third-stage in the sampling procedure was to conduct a random digit dialing (RDD) sampling of telephone households within the telephone banks selected in the second- stage. The fourth-stage required the identification and selection of one eligible respondent within each sampled household, so the household sampling frame yielded a population sample of the eligible population.
Sample Construction Most of the statistical formulas associated with sampling theories are based upon the assumption of simple-random sampling. Specifically, the statistical formulas for specifying the sampling precision (estimates of sampling variance), given particular sample sizes, are premised on simple-random sampling. Unfortunately, random sampling requires that all of the

86
elements in the population have an equal chance of being selected. Since no enumeration of the total population of any state is available, all surveys of the general public are based upon an approximation of the actual population and a process closely resembling true random sampling generates survey samples. The samples were based on a modified stratified random digit dialing method, using an area probability/RDD sample rather than a single-stage/RDD sample. There are several important advantages to using an area probability base: (1) it draws the sample proportionate to the geographic distribution of the target population rather than the geographic distribution of telephone households, which is vital to constructing unbiased population estimates from telephone surveys; (2) it allows greater geographic stratification of the sample to control for known geographic differences in non-response rates; and (3) it facilitates the use of Census estimates of population characteristics to weight the completed sample to correct for other forms of sampling bias. The initial stage of the sample construction process required the development of a geographically stratified sample for Missouri, based upon the distribution of the target population for this survey, i.e., the adult population of the state of Missouri. A sample of assigned telephone banks was randomly selected from an enumeration of the Working Residential Hundreds Blocks of the active telephone exchanges within the region. The Working Hundreds Blocks were defined as each block of 100 potential telephone numbers within an exchange that included three or more residential listings. (Exchanges with one or two listings were excluded because in most cases such listings represent errors in the published listings.) In the third-stage sample, computer randomly generated a two-digit number for each Working Residential Hundreds Block selected in the second-stage sample. This third-stage sampling process is the random digit-dialing (RDD) component. Every telephone number within the Hundreds Block has an equal probability of selection, regardless of whether listed or unlisted. SRBI interviewers to determine which were currently working residential household phone numbers then dialed the third-stage RDD sample of telephone numbers. Non-working numbers and non-residential numbers were immediately replaced by other RDD numbers selected within the same stratum in the same fashion as the initial number. Ineligible households (e.g., no adult in the household, language barriers other than Spanish) were also immediately replaced. Non-answering numbers were not replaced until the research protocol (in this study, a five-call protocol) was exceeded. However, one or more open numbers per case were permitted in order to permit the survey to be completed within a reasonable period.
Selection of Respondent within Household
The multi-stage sampling process described in the previous section yielded an unbiased sample of households with telephones, drawn from the 10 geographic regions of the state.

87
A systematic selection procedure was used to select one designated respondent for each household sampled. The "most recent/next birthday method" was used for within household selection among multiple eligibles. The Within Household Selection Procedure is presented in Figure A-1. The CATI system alternated the "most recent" and "next" birthday specification for the selected respondent to avoid a temporal bias for birthdays before (or after) the field period.
Initial Contact Initial telephone contact was attempted during the hours of the day and days of the week that have the greatest probability of respondent contact. The primary interviewing period was from 5:30 p.m. to 9:30 p.m. on weekdays, from 9:00 a.m. to 9:30 p.m. on Saturdays and from 10:00 a.m. to 9:30 p.m. on Sundays (all times are local time). If the interview was not conducted at the time of initial contact, the interview was rescheduled at a time convenient to the respondent. Although initial contact attempts were made on evenings and weekends, daytime interviews were scheduled when necessary. If four telephone contacts on the night and weekend shifts did not elicit a respondent contact, the fifth contact was attempted on a weekday. Interviewers attempted a minimum of five calls to each telephone number. When the household was reached, the interviewer asked to speak to an adult to screen the household for eligibility and to determine the designated respondent. When the designated respondent was reached but an interview at that time was inconvenient or inappropriate, interviewers set up appointments with respondents. When contact was made with the household, but not the designated respondent(s), interviewers probed for appropriate callback times and attempted to set up an appointment.

88
Figure A-1: Within Household Selection Procedure
Adult Cross-Section State: ____________ County: _____________________ Metro Status: _____ Date: ________________ CATI ID: ____________________ Interviewer:_________________________________________ Telephone Number: __________________________________________________________ Time Start: _____________ Time End: _____________ TOTAL TIME: ___________ INTRODUCTION TO BE ADMINISTERED TO ANY HOUSEHOLD MEMBER Hello, my name is ________________and I am calling from SRBI, the national research organization. We are assisting the University of Missouri and the Missouri Department of Transportation in a study of citizen opinion about the quality of the transportation system in Missouri and what future transportation needs might be. (I would like to assure you that we are not selling anything.) . A. In order to select just one person to interview for the study, could I speak to the person
in your household, 18 or older, who (has had the most recent/will have the next) birthday? Respondent is the person.................1 Other respondent comes to phone..............2 Respondent is not available..............3 Refused...................................…………....4
If Respondent is not available: ARRANGE CALLBACK AND RECORD IT, ALONG WITH THE RESPONDENT'S FIRST NAME OR HH POSITION, ON THE SAMPLE SHEET. ATTACH THIS SHEET TOP. TO SAMPLE AFTER FILLING OUT APPLICABLE RESPONDENT INFO AT THE CONCLUSION.
Refusal Conversion
The process of converting terminations and refusals, once they had occurred, involved the following steps. First, there was a diagnostic period, when refusals and terminates were reported on a daily basis and the Project Director and Operations Manager reviewed them after each shift to see if anything unusual was occurring. Second, the Project Director and his staff developed a refusal conversion script. Third, the refusal conversion effort was fielded with re-interview attempts scheduled two to three days after the initial refusal. Finally, the Project Director and Operations Manager received the outcomes of the refusal conversion efforts on a daily basis.
Field Outcomes The status of cases as of the end of the field period are reported using the categories defined in Figure A-2.

89
Using the codes presented in Figure A-2, the disposition for the Missouri Department of Transportation Transportation Customer Survey (TCS) from Figure A-3 would be interpreted as follows:
• A total of 38,818 randomly selected telephone numbers were sampled; • Forty-six percent of the numbers were not active residential phone numbers, including 35
percent not-in-service, 6 percent business or non-residential, and 5 percent computer or fax tones;
• Six percent of the numbers were ring no answer or busy on their last attempt; • Four percent were answering machines; and • One percent was a household in which the designated respondent was not interview able
(away for an extended period, incapacitated or deaf). At the close of the field period, 5,214 cases (about 13 percent) were in callback status. The participation rate represents one of the most critical measures of potential sample bias because it indicates the degree of self-selection by potential respondents into or out of the survey. The participation rate is calculated as the number of completed interviews (including respondents who screen out as ineligible and those who quota-out for gender, set at 52 percent female and 48 percent male) divided by the combined total number of completed interviews, terminated interviews and refusals to interview. (The inclusion of screen-outs in the numerator and denominator are mathematically equivalent to discounting the refusals by the estimated rate of non-eligibility among refusals.) The participation rate in Figure A-3 is based on the following elements:
• 4,010 completed interviews (there were two additional completed interviews which were not recorded by the sample management system and are excluded from this table)
• 620 cases not interviewed because the gender quota had been met, and • 303 refusals to be interviewed.
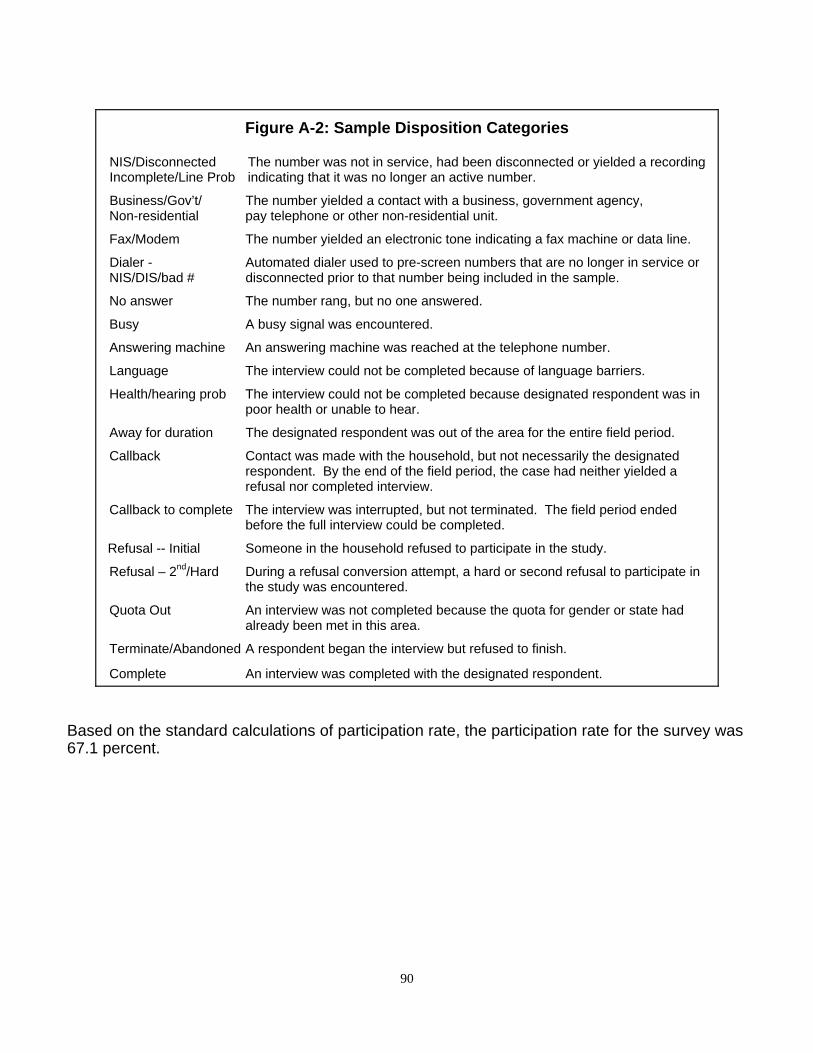
90
Figure A-2: Sample Disposition Categories NIS/Disconnected The number was not in service, had been disconnected or yielded a recording Incomplete/Line Prob indicating that it was no longer an active number.
Business/Gov’t/ The number yielded a contact with a business, government agency, Non-residential pay telephone or other non-residential unit.
Fax/Modem The number yielded an electronic tone indicating a fax machine or data line.
Dialer - Automated dialer used to pre-screen numbers that are no longer in service or NIS/DIS/bad # disconnected prior to that number being included in the sample.
No answer The number rang, but no one answered.
Busy A busy signal was encountered.
Answering machine An answering machine was reached at the telephone number.
Language The interview could not be completed because of language barriers.
Health/hearing prob The interview could not be completed because designated respondent was in poor health or unable to hear.
Away for duration The designated respondent was out of the area for the entire field period.
Callback Contact was made with the household, but not necessarily the designated respondent. By the end of the field period, the case had neither yielded a refusal nor completed interview.
Callback to complete The interview was interrupted, but not terminated. The field period ended before the full interview could be completed.
Refusal -- Initial Someone in the household refused to participate in the study.
Refusal – 2nd/Hard During a refusal conversion attempt, a hard or second refusal to participate in the study was encountered.
Quota Out An interview was not completed because the quota for gender or state had already been met in this area.
Terminate/Abandoned A respondent began the interview but refused to finish.
Complete An interview was completed with the designated respondent.
Based on the standard calculations of participation rate, the participation rate for the survey was 67.1 percent.

91
Figure A-3: Final Sample Disposition
D ia led% D ia led% D ialed% D ialed% D ia led% D ialed%T O T AL NUM BE R S DIALED 3637 100.0% 3983 100.0% 3715 100.0% 3787 100.0% 4030 100.0% 3654 100.0%
BAD NUM BER S (out o f fram e) 1586 43.6% 1754 44.0% 1764 47.5% 2032 53.7% 2113 52.4% 1737 47.5%BU SIN E SS/G O V ER N M E N T N U M B ER /N O N -R ESID EN T 248 6.8% 312 7.8% 168 4.5% 148 3.9% 143 3.5% 152 4.2%C ell Phone 0 0.0% 4 0.1% 1 0.0% 4 0.1% 2 0.0% 1 0.0%Fax/M odem N um ber/C om puter T one 179 4.9% 206 5.2% 155 4.2% 162 4.3% 136 3.4% 132 3.6%Incom plete C all/L ine P roblem s (T em porary) 53 1.5% 18 0.5% 89 2.4% 57 1.5% 60 1.5% 30 0.8%N ot In Service / D isconnec ted 1106 30.4% 1214 30.5% 1351 36.4% 1661 43.9% 1772 44.0% 1422 38.9%
T O T AL G O OD NUM BER S (to tal sam ple fram e) 2051 56.4% 2229 56.0% 1951 52.5% 1755 46.3% 1917 47.6% 1917 52.5%
N O C O N T AC T 384 10.6% 187 4.7% 321 8.6% 269 7.1% 252 6.3% 346 9.5%Liv e Non-C ontacts 384 10.6% 187 4.7% 321 8.6% 269 7.1% 252 6.3% 346 9.5%Busy 6 0.2% 4 0.1% 12 0.3% 5 0.1% 9 0.2% 7 0.2%Fax/M odem /C om puter tone (live) 0 0.0% 0 0.0% 0 0.0% 0 0.0% 0 0.0% 0 0.0%N o answer 320 8.8% 123 3.1% 228 6.1% 197 5.2% 173 4.3% 260 7.1%Live N on C ontac ts - O V ER M A X (m ax set to 6) 58 1.6% 60 1.5% 81 2.2% 67 1.8% 70 1.7% 79 2.2%
T O T AL C ONT AC T S 1667 45.8% 2042 51.3% 1630 43.9% 1486 39.2% 1665 41.3% 1571 43.0%
C O N T AC T S - N O T SC R E EN ED 1093 30.1% 1387 34.8% 1020 27.5% 934 24.7% 1063 26.4% 988 27.0%Dead - Not S creened 124 3.4% 223 5.6% 174 4.7% 151 4.0% 181 4.5% 131 3.6%Away for duration 3 0.1% 1 0.0% 1 0.0% 3 0.1% 2 0.0% 6 0.2%Bad U pdated Phone 0 0.0% 0 0.0% 0 0.0% 0 0.0% 0 0.0% 0 0.0%C allback - C ALL BLO C KIN G (over m ax) 5 0.1% 17 0.4% 2 0.1% 2 0.1% 2 0.0% 0 0.0%C H ILD /T EE N PH O N E 8 0.2% 6 0.2% 1 0.0% 2 0.1% 4 0.1% 0 0.0%Foreign Language - N O N -SP AN IS H 5 0.1% 4 0.1% 0 0.0% 0 0.0% 0 0.0% 2 0.1%H ealth P roblem s - LO N G T E R M 15 0.4% 27 0.7% 21 0.6% 33 0.9% 25 0.6% 19 0.5%H earing P roblem s 21 0.6% 13 0.3% 26 0.7% 16 0.4% 21 0.5% 21 0.6%Poss ible U nass igned N um ber/N o Answer A ll A ttem pts 67 1.8% 155 3.9% 123 3.3% 95 2.5% 127 3.2% 83 2.3%
Liv e - Not Screened 306 8.4% 288 7.2% 187 5.0% 192 5.1% 208 5.2% 187 5.1%Answering M achine/V oice M ail 252 6.9% 123 3.1% 120 3.2% 136 3.6% 134 3.3% 154 4.2%C allB ack - C ALL B LO C KIN G 5 0.1% 10 0.3% 2 0.1% 1 0.0% 1 0.0% 0 0.0%Live N ot Sc reened - O V ER M A X (m ax set to 6) 49 1.3% 155 3.9% 65 1.7% 55 1.5% 73 1.8% 33 0.9%
C allback - Not Screened 465 12.8% 610 15.3% 479 12.9% 421 11.1% 487 12.1% 488 13.4%C allback - AP PO IN T M EN T S 40 1.1% 32 0.8% 19 0.5% 29 0.8% 29 0.7% 41 1.1%C allback - U N SPE C IF IE D 135 3.7% 106 2.7% 114 3.1% 96 2.5% 90 2.2% 115 3.1%C A LLB AC K - W IT H R ES PO N D EN T 0 0.0% 0 0.0% 0 0.0% 0 0.0% 0 0.0% 0 0.0%C B 1 Q U ALIF IE D R ESP / B IR T H D A Y SC R EEN 22 0.6% 13 0.3% 15 0.4% 20 0.5% 21 0.5% 23 0.6%C B 2 Q U ALIF IE D R ESP R EFU SE D T O P AR T IC IP AT E 4 0.1% 2 0.1% 5 0.1% 3 0.1% 3 0.1% 3 0.1%H U N G -U P 0 0.0% 0 0.0% 0 0.0% 0 0.0% 0 0.0% 0 0.0%H ealth P roblem s - SH O R T T E R M 0 0.0% 2 0.1% 3 0.1% 0 0.0% 3 0.1% 2 0.1%Foreign Language - SP AN IS H 2 0.1% 1 0.0% 0 0.0% 0 0.0% 0 0.0% 0 0.0%C allbacks N ot Screened - O VER M AX (m ax set to 6) 262 7.2% 454 11.4% 323 8.7% 273 7.2% 341 8.5% 304 8.3%
North W est S outh C entralC entral K ansas C ity North C entral North East

92
Dialed% Dialed% Dialed% Dialed% Dialed% Dialed%
Refusals - Not Screened 198 5.4% 266 6.7% 180 4.8% 170 4.5% 187 4.6% 182 5.0%Refusal - CALL BLOCKING 1 0.0% 10 0.3% 2 0.1% 1 0.0% 2 0.0% 4 0.1%Refusal - SOFT 50 1.4% 48 1.2% 51 1.4% 51 1.3% 31 0.8% 54 1.5%HUNG-UP 42 1.2% 40 1.0% 35 0.9% 32 0.8% 40 1.0% 47 1.3%Second Soft Refusal 18 0.5% 22 0.6% 16 0.4% 17 0.4% 23 0.6% 13 0.4%Refusal - HARD (Do Not Callback) 50 1.4% 57 1.4% 34 0.9% 29 0.8% 42 1.0% 29 0.8%Refusals Not Screened- OVER MAX (max set to 5) 37 1.0% 89 2.2% 42 1.1% 40 1.1% 49 1.2% 35 1.0%
CONTACTS - SCREENED 574 15.8% 655 16.4% 610 16.4% 552 14.6% 602 14.9% 583 16.0%Screen-Outs 61 1.7% 64 1.6% 50 1.3% 47 1.2% 52 1.3% 53 1.5%NO 18+ IN HOUSEHOLD 14 0.4% 13 0.3% 7 0.2% 9 0.2% 4 0.1% 9 0.2%SCREEN-OUT S2--YES/REFUSED W ORKS FOR MoDOT 26 0.7% 11 0.3% 15 0.4% 17 0.4% 22 0.5% 12 0.3%SCREEN-OUT REFUSED BIRTHDAY SCREEN 17 0.5% 27 0.7% 21 0.6% 15 0.4% 19 0.5% 25 0.7%SCREEN-OUT QUALIFIED RESPONDENT REFUSED TO PARTICIPATE
4 0.1% 13 0.3% 7 0.2% 6 0.2% 7 0.2% 7 0.2%
Quota-Outs 35 1.0% 76 1.9% 72 1.9% 35 0.9% 53 1.3% 59 1.6%Q/O MALE/CENTRAL 0 0.0% 0 0.0% 0 0.0% 0 0.0% 0 0.0% 0 0.0%Q/O FEMALE/CENTRAL 35 1.0% 0 0.0% 0 0.0% 0 0.0% 0 0.0% 0 0.0%Q/O MALE/KANSAS CITY 0 0.0% 0 0.0% 0 0.0% 0 0.0% 0 0.0% 0 0.0%Q/O FEMALE/KANSAS CITY 0 0.0% 76 1.9% 0 0.0% 0 0.0% 0 0.0% 0 0.0%Q/O MALE/NORTH CENTRAL 0 0.0% 0 0.0% 1 0.0% 0 0.0% 0 0.0% 0 0.0%Q/O FEMALE/NORTH CENTRAL 0 0.0% 0 0.0% 71 1.9% 0 0.0% 0 0.0% 0 0.0%Q/O MALE/NORTHEAST 0 0.0% 0 0.0% 0 0.0% 0 0.0% 0 0.0% 0 0.0%Q/O FEMALE/NORTHEAST 0 0.0% 0 0.0% 0 0.0% 35 0.9% 0 0.0% 0 0.0%Q/O MALE/NORTHW EST 0 0.0% 0 0.0% 0 0.0% 0 0.0% 0 0.0% 0 0.0%Q/O FEMALE/NORTHW EST 0 0.0% 0 0.0% 0 0.0% 0 0.0% 53 1.3% 0 0.0%Q/O MALE/SOUTH CENTRAL 0 0.0% 0 0.0% 0 0.0% 0 0.0% 0 0.0% 0 0.0%Q/O FEMALE/SOUTH CENTRAL 0 0.0% 0 0.0% 0 0.0% 0 0.0% 0 0.0% 59 1.6%Q/O MALE/SOUTHEAST 0 0.0% 0 0.0% 0 0.0% 0 0.0% 0 0.0% 0 0.0%Q/O FEMALE/SOUTHEAST 0 0.0% 0 0.0% 0 0.0% 0 0.0% 0 0.0% 0 0.0%Q/O MALE/SOUTHW EST 0 0.0% 0 0.0% 0 0.0% 0 0.0% 0 0.0% 0 0.0%Q/O FEMALE/SOUTHW EST 0 0.0% 0 0.0% 0 0.0% 0 0.0% 0 0.0% 0 0.0%Q/O MALE/SPRINGFIELD 0 0.0% 0 0.0% 0 0.0% 0 0.0% 0 0.0% 0 0.0%Q/O FEMALE/SPRINGFIELD 0 0.0% 0 0.0% 0 0.0% 0 0.0% 0 0.0% 0 0.0%Q/O MALE/ST. LOUIS 0 0.0% 0 0.0% 0 0.0% 0 0.0% 0 0.0% 0 0.0%Q/O FEMALE/ST. LOUIS 0 0.0% 0 0.0% 0 0.0% 0 0.0% 0 0.0% 0 0.0%
Qualified Refusals 27 0.7% 35 0.9% 34 0.9% 23 0.6% 31 0.8% 22 0.6%Mid-Interview Term 0 0.0% 0 0.0% 0 0.0% 0 0.0% 0 0.0% 0 0.0%Qualified Soft Refusal - 1 12 0.3% 10 0.3% 16 0.4% 14 0.4% 14 0.3% 13 0.4%Qualified Second Soft Refusal - 1 4 0.1% 3 0.1% 7 0.2% 3 0.1% 6 0.1% 1 0.0%Qualified Hard Refusal - 1 6 0.2% 14 0.4% 9 0.2% 3 0.1% 8 0.2% 7 0.2%Qualified Refusals - OVER MAX (max set to 6) 5 0.1% 8 0.2% 2 0.1% 3 0.1% 3 0.1% 1 0.0%
North W est South CentralCentral Kansas City North Central North East

93
Dialed% Dialed% Dialed% Dialed% Dialed% Dialed%
Qualified Callbacks 51 1.4% 79 2.0% 52 1.4% 48 1.3% 65 1.6% 48 1.3%Abandoned Interview 0 0.0% 1 0.0% 1 0.0% 0 0.0% 0 0.0% 2 0.1%Qualified Callback - 1 16 0.4% 17 0.4% 15 0.4% 12 0.3% 27 0.7% 16 0.4%Qualified Spanish Callback - 1 0 0.0% 0 0.0% 0 0.0% 0 0.0% 0 0.0% 0 0.0%Qualified Callbacks - OVER MAX (max set to 6) 35 1.0% 61 1.5% 36 1.0% 36 1.0% 38 0.9% 30 0.8%
Total Completes 400 11.0% 401 10.1% 402 10.8% 399 10.5% 401 10.0% 401 11.0%Proceed with interview/Completed Interview 400 11.0% 401 10.1% 402 10.8% 399 10.5% 401 10.0% 401 11.0%
Survey Incidence (Screening Incidence) 89.4% 90.2% 91.8% 91.5% 91.4% 90.9%List Incidence (Dialing Incidence) 14.1% 14.8% 15.1% 13.3% 13.6% 14.5%Cooperation Rate 1 68.8% 64.3% 71.0% 71.4% 69.9% 71.5%Cooperation Rate 2 64.2% 58.7% 66.3% 66.6% 64.1% 67.1%Totals Refusals 11.0% 13.5% 11.0% 11.0% 11.4% 10.6%Response Rate 1 24.2% 24.3% 26.9% 27.4% 26.4% 26.8%Response Rate 2 32.1% 29.7% 36.0% 36.0% 34.1% 35.6%
North West South CentralCentral Kansas City North Central North East
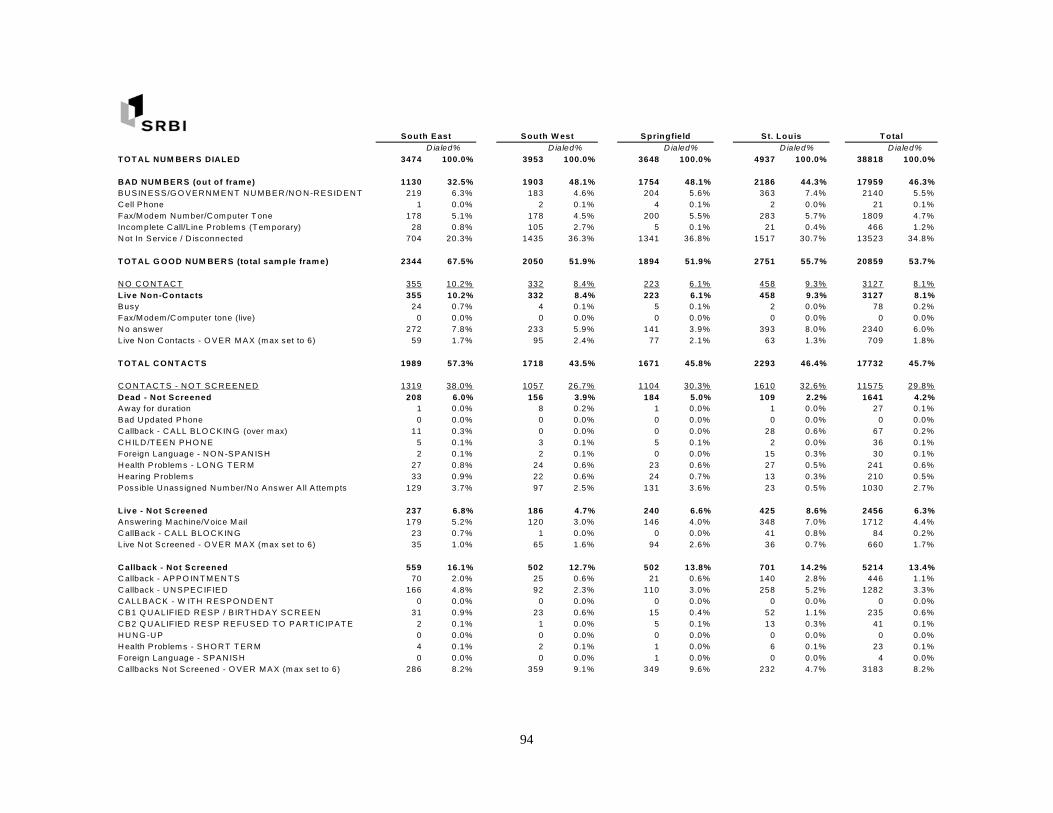
94
D ialed% D ialed% D ialed% D ialed% D ialed%T OT AL NUM BER S DIALED 3474 100.0% 3953 100.0% 3648 100.0% 4937 100.0% 38818 100.0%
BAD NUM BER S (out of fram e) 1130 32.5% 1903 48.1% 1754 48.1% 2186 44.3% 17959 46.3%BU SIN ESS/G O VER N M EN T N U M BER /N O N -R ESID EN T 219 6.3% 183 4.6% 204 5.6% 363 7.4% 2140 5.5%C ell Phone 1 0.0% 2 0.1% 4 0.1% 2 0.0% 21 0.1%Fax/M odem N um ber/C om puter T one 178 5.1% 178 4.5% 200 5.5% 283 5.7% 1809 4.7%Incom plete C all/Line Problem s (T em porary) 28 0.8% 105 2.7% 5 0.1% 21 0.4% 466 1.2%N ot In Service / D isconnected 704 20.3% 1435 36.3% 1341 36.8% 1517 30.7% 13523 34.8%
T OT AL G OOD NUM BER S (to tal sam ple fram e) 2344 67.5% 2050 51.9% 1894 51.9% 2751 55.7% 20859 53.7%
N O C O N T AC T 355 10.2% 332 8.4% 223 6.1% 458 9.3% 3127 8.1%Liv e Non-C ontacts 355 10.2% 332 8.4% 223 6.1% 458 9.3% 3127 8.1%Busy 24 0.7% 4 0.1% 5 0.1% 2 0.0% 78 0.2%Fax/M odem /C om puter tone (live) 0 0.0% 0 0.0% 0 0.0% 0 0.0% 0 0.0%N o answer 272 7.8% 233 5.9% 141 3.9% 393 8.0% 2340 6.0%Live N on C ontac ts - O VER M AX (m ax set to 6) 59 1.7% 95 2.4% 77 2.1% 63 1.3% 709 1.8%
T OT AL C ONT AC T S 1989 57.3% 1718 43.5% 1671 45.8% 2293 46.4% 17732 45.7%
C O N T AC T S - N O T SC R EEN ED 1319 38.0% 1057 26.7% 1104 30.3% 1610 32.6% 11575 29.8%Dead - Not Screened 208 6.0% 156 3.9% 184 5.0% 109 2.2% 1641 4.2%Away for duration 1 0.0% 8 0.2% 1 0.0% 1 0.0% 27 0.1%Bad U pdated Phone 0 0.0% 0 0.0% 0 0.0% 0 0.0% 0 0.0%C allback - C ALL BLO C KIN G (over m ax) 11 0.3% 0 0.0% 0 0.0% 28 0.6% 67 0.2%C H ILD /T EEN PH O N E 5 0.1% 3 0.1% 5 0.1% 2 0.0% 36 0.1%Foreign Language - N O N -SPAN ISH 2 0.1% 2 0.1% 0 0.0% 15 0.3% 30 0.1%H ealth P roblem s - LO N G T ER M 27 0.8% 24 0.6% 23 0.6% 27 0.5% 241 0.6%H earing Problem s 33 0.9% 22 0.6% 24 0.7% 13 0.3% 210 0.5%Poss ible U nass igned N um ber/N o Answer A ll A ttem pts 129 3.7% 97 2.5% 131 3.6% 23 0.5% 1030 2.7%
Liv e - Not Screened 237 6.8% 186 4.7% 240 6.6% 425 8.6% 2456 6.3%Answering M achine/Voice M ail 179 5.2% 120 3.0% 146 4.0% 348 7.0% 1712 4.4%C allBack - C ALL BLO C KIN G 23 0.7% 1 0.0% 0 0.0% 41 0.8% 84 0.2%Live N ot Screened - O VER M AX (m ax set to 6) 35 1.0% 65 1.6% 94 2.6% 36 0.7% 660 1.7%
C allback - Not Screened 559 16.1% 502 12.7% 502 13.8% 701 14.2% 5214 13.4%C allback - APPO IN T M EN T S 70 2.0% 25 0.6% 21 0.6% 140 2.8% 446 1.1%C allback - U N SPEC IF IED 166 4.8% 92 2.3% 110 3.0% 258 5.2% 1282 3.3%C ALLBAC K - W IT H R ESPO N D EN T 0 0.0% 0 0.0% 0 0.0% 0 0.0% 0 0.0%C B1 Q U ALIFIED R ESP / B IR T H D AY SC R EEN 31 0.9% 23 0.6% 15 0.4% 52 1.1% 235 0.6%C B2 Q U ALIFIED R ESP R EFU SED T O PAR T IC IPAT E 2 0.1% 1 0.0% 5 0.1% 13 0.3% 41 0.1%H U N G -U P 0 0.0% 0 0.0% 0 0.0% 0 0.0% 0 0.0%H ealth P roblem s - SH O R T T ER M 4 0.1% 2 0.1% 1 0.0% 6 0.1% 23 0.1%Foreign Language - SPAN ISH 0 0.0% 0 0.0% 1 0.0% 0 0.0% 4 0.0%C allbacks N ot Screened - O VER M AX (m ax set to 6) 286 8.2% 359 9.1% 349 9.6% 232 4.7% 3183 8.2%
Springfield St. Louis T otalSouth East South W est

95
D ia led% D ia led% D ia led% D ia led% D ia led%
R efu sals - No t S creen ed 315 9.1% 213 5.4% 178 4.9% 375 7.6% 2264 5.8%R efusal - C A LL B LO C K IN G 8 0.2% 1 0.0% 0 0.0% 14 0.3% 43 0.1%R efusal - S O F T 83 2.4% 56 1.4% 36 1.0% 78 1.6% 538 1.4%H U N G -U P 125 3.6% 55 1.4% 30 0.8% 169 3.4% 615 1.6%S ec ond S oft R efus al 10 0.3% 25 0.6% 21 0.6% 14 0.3% 179 0.5%R efusal - H A R D (D o N ot C allbac k) 43 1.2% 35 0.9% 40 1.1% 61 1.2% 420 1.1%R efusals N ot S c reened- O V E R M A X (m ax set to 5) 46 1.3% 41 1.0% 51 1.4% 39 0.8% 469 1.2%
C O N T A C T S - S C R E E N E D 670 19.3% 661 16.7% 567 15.5% 683 13.8% 6157 15.9%S creen -O uts 60 1.7% 77 1.9% 47 1.3% 91 1.8% 602 1.6%N O 18+ IN H O U S E H O LD 8 0.2% 5 0.1% 7 0.2% 13 0.3% 89 0.2%S C R E E N -O U T S 2--YE S /R E FU S E D W O R K S F O R M oD O T 10 0.3% 13 0.3% 6 0.2% 10 0.2% 142 0.4%S C R E E N -O U T R E F U S E D B IR T H D A Y S C R E E N 35 1.0% 41 1.0% 27 0.7% 56 1.1% 283 0.7%S C R E E N -O U T Q U A LIF IE D R E S P O N D E N T R E FU S E D T O P A R T IC IP A T E 7 0.2% 18 0.5% 7 0.2% 12 0.2% 88 0.2%
Q u ota-O uts 103 3.0% 83 2.1% 19 0.5% 85 1.7% 620 1.6%Q /O M A LE /C E N T R A L 0 0.0% 0 0.0% 0 0.0% 0 0.0% 0 0.0%Q /O FE M A LE /C E N T R A L 0 0.0% 0 0.0% 0 0.0% 0 0.0% 35 0.1%Q /O M A LE /K A N S A S C IT Y 0 0.0% 0 0.0% 0 0.0% 0 0.0% 0 0.0%Q /O FE M A LE /K A N S A S C IT Y 0 0.0% 0 0.0% 0 0.0% 0 0.0% 76 0.2%Q /O M A LE /N O R T H C E N T R A L 0 0.0% 0 0.0% 0 0.0% 0 0.0% 1 0.0%Q /O FE M A LE /N O R T H C E N T R A L 0 0.0% 0 0.0% 0 0.0% 0 0.0% 71 0.2%Q /O M A LE /N O R T H E A S T 0 0.0% 0 0.0% 0 0.0% 0 0.0% 0 0.0%Q /O FE M A LE /N O R T H E A S T 0 0.0% 0 0.0% 0 0.0% 0 0.0% 35 0.1%Q /O M A LE /N O R T H W E S T 0 0.0% 0 0.0% 0 0.0% 0 0.0% 0 0.0%Q /O FE M A LE /N O R T H W E S T 0 0.0% 0 0.0% 0 0.0% 0 0.0% 53 0.1%Q /O M A LE /S O U T H C E N T R A L 0 0.0% 0 0.0% 0 0.0% 0 0.0% 0 0.0%Q /O FE M A LE /S O U T H C E N T R A L 0 0.0% 0 0.0% 0 0.0% 0 0.0% 59 0.2%Q /O M A LE /S O U T H E A S T 0 0.0% 0 0.0% 0 0.0% 0 0.0% 0 0.0%Q /O FE M A LE /S O U T H E A S T 103 3.0% 0 0.0% 0 0.0% 0 0.0% 103 0.3%Q /O M A LE /S O U T H W E S T 0 0.0% 0 0.0% 0 0.0% 0 0.0% 0 0.0%Q /O FE M A LE /S O U T H W E S T 0 0.0% 83 2.1% 0 0.0% 0 0.0% 83 0.2%Q /O M A LE /S P R IN G FIE LD 0 0.0% 0 0.0% 0 0.0% 0 0.0% 0 0.0%Q /O FE M A LE /S P R IN G FIE LD 0 0.0% 0 0.0% 19 0.5% 0 0.0% 19 0.0%Q /O M A LE /S T . LO U IS 0 0.0% 0 0.0% 0 0.0% 0 0.0% 0 0.0%Q /O FE M A LE /S T . LO U IS 0 0.0% 0 0.0% 0 0.0% 85 1.7% 85 0.2%
Q u alified R efu sals 31 0.9% 37 0.9% 40 1.1% 23 0.5% 303 0.8%M id-In terview T erm 0 0.0% 0 0.0% 0 0.0% 0 0.0% 0 0.0%Q ualif ied S of t R efusal - 1 18 0.5% 14 0.4% 14 0.4% 12 0.2% 137 0.4%Q ualif ied S ec ond S oft R efus al - 1 1 0.0% 7 0.2% 2 0.1% 4 0.1% 38 0.1%Q ualif ied H ard R efusal - 1 9 0.3% 14 0.4% 17 0.5% 5 0.1% 92 0.2%Q ualif ied R efus als - O V E R M A X (m ax s et to 6 ) 3 0.1% 2 0.1% 7 0.2% 2 0.0% 36 0.1%
T otalS outh E ast S o uth W est S p ring fie ld S t. L ou is

96
Dialed% Dialed% Dialed% Dialed% Dialed%
Qualified Callbacks 73 2.1% 62 1.6% 61 1.7% 83 1.7% 622 1.6%Abandoned Interview 1 0.0% 0 0.0% 2 0.1% 0 0.0% 7 0.0%Qualified Callback - 1 43 1.2% 21 0.5% 17 0.5% 44 0.9% 228 0.6%Qualified Spanish Callback - 1 0 0.0% 1 0.0% 0 0.0% 0 0.0% 1 0.0%Qualified Callbacks - OVER MAX (max set to 6) 29 0.8% 40 1.0% 42 1.2% 39 0.8% 386 1.0%
Total Completes 403 11.6% 402 10.2% 400 11.0% 401 8.1% 4010 10.3%Proceed with interview/Completed Interview 403 11.6% 402 10.2% 400 11.0% 401 8.1% 4010 10.3%
Survey Incidence (Screening Incidence) 91.0% 88.4% 91.7% 86.7% 90.2%List Incidence (Dialing Incidence) 17.6% 14.8% 14.3% 12.0% 14.3%Cooperation Rate 1 62.1% 69.2% 68.1% 59.2% 67.1%Cooperation Rate 2 57.5% 64.3% 62.6% 54.5% 62.1%Totals Refusals 14.8% 12.2% 11.5% 14.5% 12.3%Response Rate 1 24.1% 27.4% 24.6% 21.0% 25.1%Response Rate 2 31.8% 36.0% 31.3% 26.4% 32.5%
TotalSouth East South West Springfield St. Louis
97
Sample Weighting The characteristics of a perfectly drawn sample of a population will vary from true population characteristics only within certain limits of sample variability (i.e., sampling error). Unfortunately, social surveys do not permit perfect samples. The sampling frames available to survey research are less than perfect. The absence of perfect cooperation from sampled units means that the completed sample will differ from the drawn sample. In order to correct these known problems of sample bias, the achieved sample is weighted to certain characteristics of the total population. The weighting plan for the Missouri Department of Transportation survey was a multi-stage sequential process of weighting the achieved sample to correct for sampling and non-sampling biases in the final sample. The first step in the weighting was designed to correct the cases in the completed sample for known selection biases in the sampling procedures. At the household selection stage, a random digit dialing process will give households with more than one telephone number an unequal likelihood of selection. Nationally, about 10 percent of households selected by random digit dialing will have more than one telephone number. This selection bias was corrected by giving each household a first-stage weight of 0.5 if there were two or more different telephone numbers in the household. The second step in the weighting process was to correct for selection procedures that yielded unequal probability of selection within sampled households. Although the survey was designed as a population survey, only one eligible person per household could be interviewed (because multiple interviews per household are burdensome and introduce additional design effects into the survey estimates). A respondent's probability for selection is inversely related to the size (number of other eligible adults) of the household. Hence, the second-stage weight was equal to the number of eligible respondents within the household. The previous steps in the sample weighting process were designed to correct the achieved sample for known biases in sample selection. There is also a self-selection bias in sample surveys in which participation is voluntary. The primary self-selection biases involve age, gender and race. A third procedure weighted the sample to the cell distribution of the population by age and gender, using the Census Population Projections for Age and Sex for 2002 (available at www.census.gov). After these corrections were made, no further weighting by other Census characteristics was considered necessary or desirable. The final step in the weighting process was designed to correct for the fact that the total number of cases in the weighted sample was larger than the unweighted sample size because of the use of the number of eligibles weight. In order to avoid misinterpretation of sample size, the total number of cases in the weighted sample to yield a sample-size weight divided the total number of cases in the unweighted sample. The weight adjusts the completed interviews in the achieved sample to correct for known sampling and participation biases.
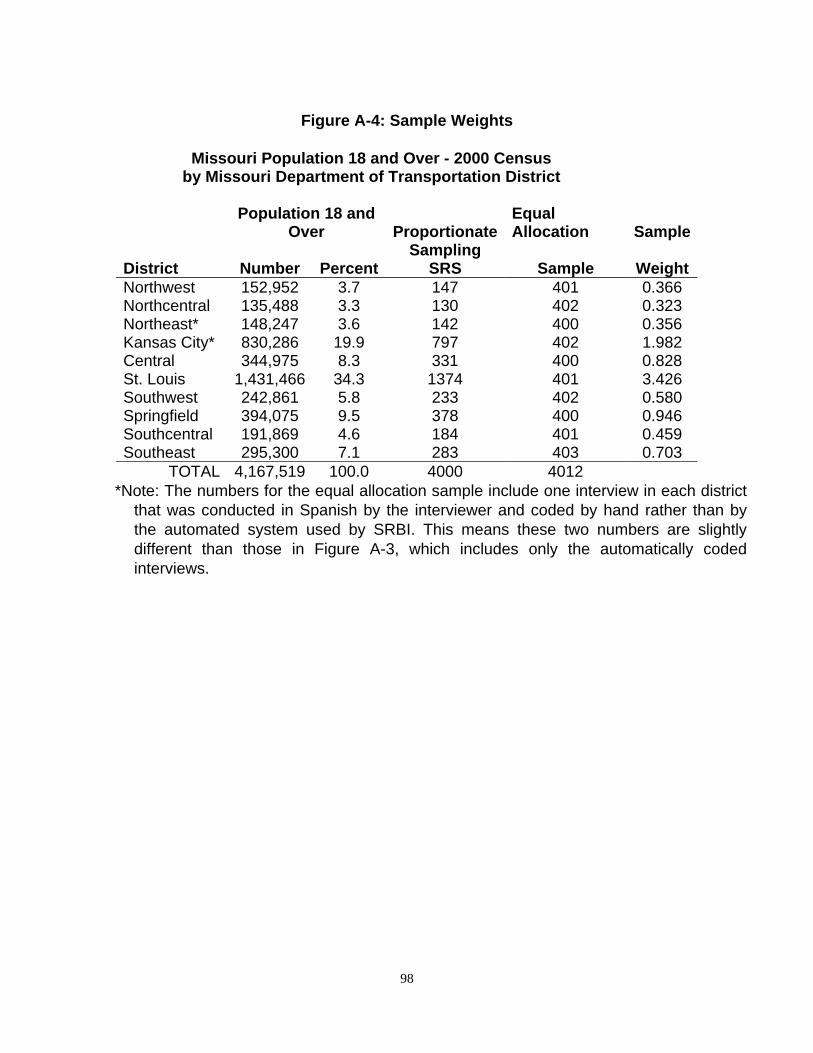
98
Figure A-4: Sample Weights
Missouri Population 18 and Over - 2000 Census
by Missouri Department of Transportation District
Population 18 and
Over Proportionate Equal Allocation Sample
District Number PercentSampling
SRS Sample Weight Northwest 152,952 3.7 147 401 0.366 Northcentral 135,488 3.3 130 402 0.323 Northeast* 148,247 3.6 142 400 0.356 Kansas City* 830,286 19.9 797 402 1.982 Central 344,975 8.3 331 400 0.828 St. Louis 1,431,466 34.3 1374 401 3.426 Southwest 242,861 5.8 233 402 0.580 Springfield 394,075 9.5 378 400 0.946 Southcentral 191,869 4.6 184 401 0.459 Southeast 295,300 7.1 283 403 0.703
TOTAL 4,167,519 100.0 4000 4012 *Note: The numbers for the equal allocation sample include one interview in each district
that was conducted in Spanish by the interviewer and coded by hand rather than by the automated system used by SRBI. This means these two numbers are slightly different than those in Figure A-3, which includes only the automatically coded interviews.

99
Precision of Sample Estimates
The objective of the sampling procedures used on this study was to produce unbiased samples of the target populations. An unbiased sample shares the same properties and characteristics of the total population from which it is drawn, subject to a certain level of sampling error. This means that with a properly drawn sample statements can be made about the properties and characteristics of the total population within certain specified limits of certainty and sampling variability. The confidence interval for sample estimates of population proportions, using simple random sampling without replacement, is calculated by the following formula.
Where:
var (x) = the expected sampling error of the mean of some variable, expressed as a proportion
p = some proportion of the sample displaying a certain
characteristic or attribute
q = (1 - p)
z = the standardized normal variable, given a specified confidence level (1.96 for samples of this size).
n = the size of the sample
The sample size for the survey is large enough to permit estimates for sub-samples of particular interest. Figure A-5, on the next page, presents the expected size of the sampling error for specified sample sizes of 1,200 and less, at different response distributions on a categorical variable. As the figure shows, larger samples produce smaller expected sampling variances, but there is a constantly declining marginal utility of variance reduction per sample size increase.
var (x) = z � [(p*q)/(n-1)]

100
Figure A-5: Expected Sampling Error
At The 95 Percent Confidence Level (Plus Or Minus) (Simple Random Sample) Percentage of the Sample or Sub-Sample Giving a Certain Response or Displaying a Certain Size of Characteristic for Percentages Near: Sample or Sub-Sample 10 or 90 20 or 80 30 or 70 40 or 60 50 1,200 1.7 2.3 2.6 2.8 2.8
1,000 1.9 2.5 2.8 3.0 3.1
900 2.0 2.6 3.0 3.2 3.3
800 2.1 2.8 3.2 3.4 3.5
700 2.2 3.0 3.4 3.6 3.7
600 2.4 3.2 3.7 3.9 4.0
500 2.6 3.5 4.0 4.3 4.4
400 2.9 3.9 4.5 4.8 4.9
300 3.4 4.5 5.2 5.6 5.7
200 4.2 5.6 6.4 6.8 6.9
150 4.8 6.4 7.4 7.9 8.0
100 5.9 7.9 9.0 9.7 9.8
75 6.8 9.1 10.4 11.2 11.4
50 8.4 11.2 12.8 13.7 14.0 ____________________________________________________________________ NOTE: Entries are expressed as percentage points (+ or -).

101
There is relatively little difference in sample estimates between a simple random sample and a stratified proportionate sample. However, the appropriate statistical formula for calculating the allowance for sampling error (at a 95 percent confidence interval) for this type of stratified sample is:
ASE=1.96 � g [Wh
2 {(1-fh) (s2h/nh-1)}]
h1-g Where: ASE = allowance for sampling error at the 95 percent confidence level;
h = a sample stratum; g = number of sample strata; Wh = stratum h as a proportion of total population; fh = the sampling fraction for group h -- the number in the
sample divided by the number in the universe; s2
h = the variance in the stratum h -- for proportions this is equal to ph (1.0 - ph); nh = the sample size for the stratum h. While the earlier figure provides a useful approximation of the magnitude of expected sampling error, precise calculation of allowances for sampling error requires the use of this formula.
Estimating Statistical Significance The estimates of sampling precision presented in the previous section yield confidence bands around the sample estimates, within which the true population value should lie. This type of sampling estimate is appropriate when the goal of the research is to estimate a population distribution parameter. However, the purpose of some surveys is to provide a comparison of population parameters estimated from independent samples (e.g. annual tracking surveys) or between subsets of the same sample. In such instances, the question is not simply whether or not there is any difference in the sample statistics that estimate the population parameter, but rather is the difference between the sample estimates statistically significant (i.e., beyond the expected limits of sampling error for both sample estimates). To test whether or not a difference between two sample proportions is statistically significant, a rather simple calculation can be made. Call the total sampling error (i.e., var (x) in the previous formula) of the first sample s1 and the total sampling error of the second sample s2. Then, the sampling error of the difference between these estimates is sd, which is calculated as:
Any difference between observed proportions that exceeds sd is a statistically significant difference at the specified confidence interval. Note that this technique is mathematically equivalent to generating standardized tests of the difference between proportions.
sd = 1 � (s12 + s22 )

102
An illustration of the pooled sampling error between sub-samples for various sizes is presented in Figure A-6. This figure can be used to indicate the size of difference in proportions between drivers and non-drivers or other sub-samples that would be statistically significant.
Figure A-6: Pooled Sampling Error—Expressed As Percentages For Given Sample
Sizes (Assuming P=Q) Sample Size (Expressed in Percents) 1000
10.3
7.6
6.5
5.8
5.4
5.1
4.8
4.7
4.5
4.4
900
10.4
7.7
6.5
5.9
5.5
5.2
4.9
4.8
4.6
800
10.4
7.8
6.6
6.0
5.6
5.3
5.1
4.9
700
10.5
7.9
6.8
6.1
5.7
5.5
5.2
600
10.6
8.0
6.9
6.3
5.9
5.7
500
10.8
8.2
7.2
6.6
6.2
400
11.0
8.5
7.5
6.9
300
11.4
9.0
8.0
200
12.1
9.8
100
13.9
100
200
300
400
500
600
700
800
900
1000
Sample Size

103
Appendix A.2 Study #9874
May 14, 2003 FINAL
TRANSPORTATION CUSTOMER SATISFACTION SURVEY (Missouri 2003)
State: ____________ County: _____________________ Metro Status: _____ Date: ________________ CATI ID: ____________________ Interviewer:_________________________________________ Telephone Number: __________________________________________________________ Time Start: _____________ Time End: _____________ TOTAL TIME: ___________
Hello, my name is ________________and I am calling from SRBI, the national research organization. We are assisting the University of Missouri and the Missouri Department of Transportation in a study of citizen opinion about the quality of the transportation system in Missouri and what future transportation needs might be. (I would like to assure you that we are not selling anything.) . DUMMY QUESTION FOR BIRTHDAY QUESTIONS
Has had the most recent.......1 Will have the next................2
B. In order to select just one person to interview for the study, could I speak to the person in your
household, 18 or older, who (has had the most recent/will have the next) birthday? Respondent is the person.................1 SKIP TO S1 Other respondent comes to phone..............2 Respondent is not available..............3 ARRANGE CALLBACK Refused...................................…………....4
INT1 (Repeat only if new respondent) Hello, my name is ________________and I am calling from SRBI, the national research organization. We are assisting the University of Missouri and the Missouri Department of Transportation in a study of citizen opinion about the quality of the transportation system in Missouri and what future transportation needs might be. (I would like to assure you that we are not selling anything.) BS1 (Read to all) This survey will cover all types of transportation topics, not just highways and roads. Your participation is entirely voluntary and your responses are entirely confidential. . Your participation in this survey will assist MoDOT (pronounced “Moe Dot”) in establishing future priorities and enable MoDOT to better use its resources. (If asked about survey length) This Survey will take approximately 20 minutes. D4. RECORD GENDER FROM OBSERVATION Male………….1 Female…….2 Unsure………..3

104
Screening Questions I need to ask you a few brief questions about your household. S1. How many adults in your household, including yourself, are you age 18 or older? (RECORD#)_______________________________________
S1a. How many of these adults are… Men (RECORD#)______________________ Women (RECORD#)______________________ S2. Are you or any immediate family member a MoDOT employee? YES………….1 THANK AND END NO……….2 CONTINUE REFUSED…..3 THANK AND END Service Usage Next I will ask you some questions about your use of different methods of transportation and the trips you normally take. Q1. Approximately how many miles do you drive per year? Include both miles driven for business and pleasure. (Your best estimate is fine.)
_________________________________# miles driven
Q2. Do you do any commercial or professional driving? Yes……………..1
No………….2 SKIP TO Q3
Q2a. What type of commercial or professional driving do you do? (READ LIST AND MULTIPLE RECORD)
Taxi, limo, chauffeur…………………..1 Truck……………………………..2 School bus……………………………..3 Public transit bus………………...4 Van, shuttle or delivery service………..5 Other ________.............................6
(DO NOT READ, only code if offered) Q3. Please tell me if you drive or make trips for any of the following reasons.
Do you drive or make trips ….. READ LIST AND MULTIPLE RECORD
a. commuting to and from work or school……..1 b. for work related trips such as sales
calls or driving to meetings and appointments…………………………………..2
c. for personal and family errands and trips (e.g. grocery shopping, doctor appointments, take kids to daycare)………….3

105
d. pleasure or recreational (e.g. vacation, visit friends or relatives)……………..4
e. farm or agricultural related trips……………..5 f. Any other reason (SPECIFY)………………………..6
________________
Q4. Now I’d like to discuss your satisfaction with different aspects of Missouri’s transportation system. Some of my questions apply specifically to state highways – those known by numbers or letters – (e.g. Highway 50 or Route C.) Other questions refer to airports, trains and other methods of transportation. Using a scale of “extremely satisfied”, "satisfied", "dissatisfied" and “extremely dissatisfied,” how satisfied are you with MoDOT’s CURRENT performance with the following areas. If you have no opinion or no experience with an item, you can say “not sure.”
(ROTATE LISTS OF CHARACTERISTICS) (REPEAT INTRO STATEMENT AS NECESSARY OR WHEN RESPONDENT ASKS FOR A QUESTION TO BE REPEATED)
How satisfied are you with MoDOT’s current performance in… Are you…. Ext
Dis Dis Sat
Sat Ext. Sat
NOT SURE
a. Placing yellow warning signs to assure sufficient response time 1 2 3 4 5 b. Providing passenger light rail routes, that meet your needs (if
asked, such as MetroLink in St. Louis) 1 2 3 4 5
c. Providing pedestrian/bicycle pathways on or next to highways that are safe
1 2 3 4 5
d. Completing road and bridge construction and repairs in a timely manner
1 2 3 4 5
e. Providing lanes that are wide enough for safe driving 1 2 3 4 5 f. Removing snow/ice efficiently 1 2 3 4 5 g. Providing the public with adequate opportunities for input in
project planning 1 2 3 4 5
h. Distributing transportation funds fairly to all areas of the state 1 2 3 4 5 i. Using electronic message boards to advise drivers of delays or
construction areas 1 2 3 4 5
j. Building bridges that last a long time 1 2 3 4 5 k. Providing Amtrak passenger rail service to meet your needs 1 2 3 4 5 l. Providing crosswalks and signals for pedestrians to cross the
highway safely 1 2 3 4 5
m. Providing sufficient transportation for those who don’t or can’t drive
1 2 3 4 5
n. Managing traffic flow in construction zones to minimize delays to drivers
1 2 3 4 5
o. Providing the ability to see far ahead on highways and have unobstructed views at intersections
1 2 3 4 5
p. Maintaining the pavement so it provides a smooth ride 1 2 3 4 5 q. Repairing pavement surface promptly 1 2 3 4 5 r. Building new highways to meet future demand 1 2 3 4 5 s. Honoring commitments to provide and maintain Missouri’s
transportation system 1 2 3 4 5
t. Using public funds in a cost-effective manner 1 2 3 4 5 u. Providing enough passing opportunities on two-lane highways 1 2 3 4 5 v. Striping center lines and road edges to ensure safety 1 2 3 4 5 w. Communicating with the public in easy to understand language 1 2 3 4 5

106
x. Building bridges that are wide enough to feel safe 1 2 3 4 5 y. Providing useful information about construction, repairs or road
conditions 1 2 3 4 5
z. Providing pavement that lasts a long time 1 2 3 4 5 aa. Improving existing highways to meet increasing traffic demands 1 2 3 4 5 bb. Planning a project in a reasonable amount of time 1 2 3 4 5 cc. Having signs that can be easily seen at night or in bad weather 1 2 3 4 5 dd. Providing shoulders that are wide enough to pull off the road
safely 1 2 3 4 5
ee. Acting on recommendations from the public 1 2 3 4 5 ff. Lighting interchanges and bridges 1 2 3 4 5 gg. Providing pavement markings that can be easily seen in wet
weather 1 2 3 4 5
hh. Treating highway surfaces to resist skidding in wet weather 1 2 3 4 5

107
Q5. Now I’m going to read the list again. But this time I would like you to think about how much attention MoDOT should place on these items in the FUTURE. Please remember that these questions apply only to state highways and roads marked with numbers or letters. Should each of the following receive "a lot more", "more", "less", or "a lot less" attention from MoDOT in the future? If you have no opinion or no experience with an item, you can say “not sure.”
(ROTATE LISTS OF CHARACTERISTICS) (REPEAT INTRO STATEMENT AS NECESSARY OR WHEN RESPONDENT ASKS FOR A QUESTION TO BE REPEATED)
In the future, how much attention should MoDOT place on improving its performance in…
(Note: change to four-point scale as shown) A lot
less Less More A lot
more NOT
SUREa. Placing yellow warning signs to assure sufficient response
time 1 2 3 4 5
b. Providing passenger light rail routes that meet your needs (if asked - such as MetroLink in St. Louis)
1 2 3 4 5
c. Providing pedestrian/bicycle pathways on or next to highways that are safe
1 2 3 4 5
d. Completing road and bridge construction and repairs in a timely manner
1 2 3 4 5
e. Providing lanes that are wide enough for safe driving 1 2 3 4 5 f. Removing snow/ice efficiently 1 2 3 4 5 g. Providing the public with adequate opportunities for input
in project planning 1 2 3 4 5
h. Distributing transportation funds fairly to all areas of the state
1 2 3 4 5
i. Using electronic message boards to advise drivers of delays or construction areas
1 2 3 4 5
j. Building bridges that last a long time 1 2 3 4 5 k. Providing Amtrak passenger rail service to meet your
needs 1 2 3 4 5
l. Providing crosswalks and signals for pedestrians to cross the highway safely
1 2 3 4 5
m. Providing sufficient transportation for those who don’t or can’t drive
1 2 3 4 5
n. Managing traffic flow in construction zones to minimize delays to drivers
1 2 3 4 5
o. Providing the ability to see far ahead on highways and have unobstructed views at intersections
1 2 3 4 5
p. Maintaining the pavement so it provides a smooth ride 1 2 3 4 5 q. Repairing pavement surface promptly 1 2 3 4 5 r. Building new highways to meet future demand 1 2 3 4 5 s. Honoring commitments to provide and maintain Missouri’s
transportation system 1 2 3 4 5
t. Using public funds in a cost-effective manner 1 2 3 4 5 u. Providing enough passing opportunities on two-lane
highways 1 2 3 4 5
v. Striping center lines and road edges to ensure safety 1 2 3 4 5

108
w. Communicating with the public in easy to understand language
1 2 3 4 5
x. Building bridges that are wide enough to feel safe 1 2 3 4 5 y. Providing useful information about construction, repairs or
road conditions 1 2 3 4 5
z. Providing pavement that lasts a long time 1 2 3 4 5 aa. Improving existing highways to meet increasing traffic
demands 1 2 3 4 5
bb. Planning a project in a reasonable amount of time 1 2 3 4 5 cc. Having signs that can be easily seen at night or in bad
weather 1 2 3 4 5
dd. Providing shoulders that are wide enough to pull off the road safely
1 2 3 4 5
ee. Acting on recommendations from the public 1 2 3 4 5 ff. Lighting interchanges and bridges 1 2 3 4 5 gg. Providing pavement markings that can be easily seen in wet
weather 1 2 3 4 5
hh. Treating highway surfaces to resist skidding in wet weather 1 2 3 4 5 Q7. How satisfied are you overall with MoDOT’s efforts to provide a quality transportation system in
Missouri? Overall, are you Extremely satisfied…………………1 Satisfied…………………….2 Dissatisfied…………………………3
Extremely dissatisfied………4 Q8. How satisfied are you with your available transportation options for getting where you want to go?
Are you
Extremely satisfied…………………1 Satisfied…………………….2 Dissatisfied…………………………3
Extremely dissatisfied………4
Q9. In the past 12 months, have you traveled in states other than Missouri? Yes…………….1 No………..2 SKIP TO Q10
Q9a. In what other states? RECORD
RESPONSE_________________________________(CONTINUE WITH Q9b)
Q9b. Overall, are highway conditions in Missouri, better, worse or about the same as the highway conditions in this (these) other state(s)?
Better………………1 Worse…………2 About the same…….3

109
Q10. Have you personally contacted MoDOT about any issue within the past 12 months?
Yes………..1 No……………..2 SKIP TO Q11
Q10a. Why did you contact MoDOT? (READ AND MULTIPLE RECORD)
Get a Permit (Specify type of permit)……………………1 Obtain road condition information…………………2 Obtain detour or construction area information…………...3 Inform MoDOT of a problem………………………4 Learn more about a specific project……………………….5 Use “Motorist Assist” (KC or St. Louis areas)……..6 Participate in a project planning process…………………..7 Request assistance with a transportation problem….8 Register a complaint………………………………………9 Other (Specify)……………………………………..10
Q10b. Overall, were you successful in obtaining the information or a solution? Yes………………..1 No…………….2 Don’t Know………3 Refused………..4
Q10c. How would you rate your satisfaction with the…..…? Were you :
Q10c_1 Courtesy of MoDOT employee Extremely satisfied…………………1
Satisfied…………………….2 Dissatisfied…………………………3
Extremely dissatisfied………4
Q10c_2 Accuracy of information
Extremely satisfied…………………1 Satisfied…………………….2 Dissatisfied…………………………3
Extremely dissatisfied………4
Q10c_3 Timeliness of response Extremely satisfied…………………1
Satisfied…………………….2 Dissatisfied…………………………3
Extremely dissatisfied………4

110
Q10c_4 Response meeting your need Extremely satisfied…………………1
Satisfied…………………….2 Dissatisfied…………………………3
Extremely dissatisfied………4
Q11. From what news or information sources do you receive your transportation information? (READ
LIST AND MULTIPLE RECORD).
TV………………………………………….1 Radio…………………………………..2 Newspaper…………………………………3 the Internet/website…………………...4 Toll-free customer service phone number…5 Public meeting…………………………6 Personal contact with MoDOT employee….7 Other (SPECIFY)__________...............8
Q12. It has been estimated that the average motorist in Missouri spends about $200 annually in gas
taxes. If you had the opportunity to advise MoDOT, how much of this amount would you recommend they spend on each of the following: Let me read through the list first and then I will go back to ask you how much of the $200 you would spend on each of the four categories (Read through the list before taking responses.)
a. Taking care of the existing highways and bridges ___________(0-200) b. Expanding and building new highways ___________(0-200) c. Improving highway safety ___________(0-200) d. Reducing time spent in traffic jams ___________(0-200)
TOTAL $ (Must total $200)
Q 13. Do you think MoDOT receives enough money at present to take care of existing roads and
transportation facilities and build new facilities? Yes……………….1 SKIP TO Q14
No……………2 CONTINUE WITH Q13a
Q 13a. Which of the following measures would you vote to support to increase funding to MODOT? (Instructions to Interviewer: Read complete list of options below before taking responses.) READ LIST AND MULTIPLE RECORD
a. dedicated sales tax……………….............................1 b. increased fuel tax (user tax)………………………….2 c. toll roads (requiring a constitutional amendment)…3 d. increased user fees (e.g., registration fees)……………….4 e. revenue bonds………………………………………5 f. some combination of the above methods………………..6 g. none of these………………………………………..7
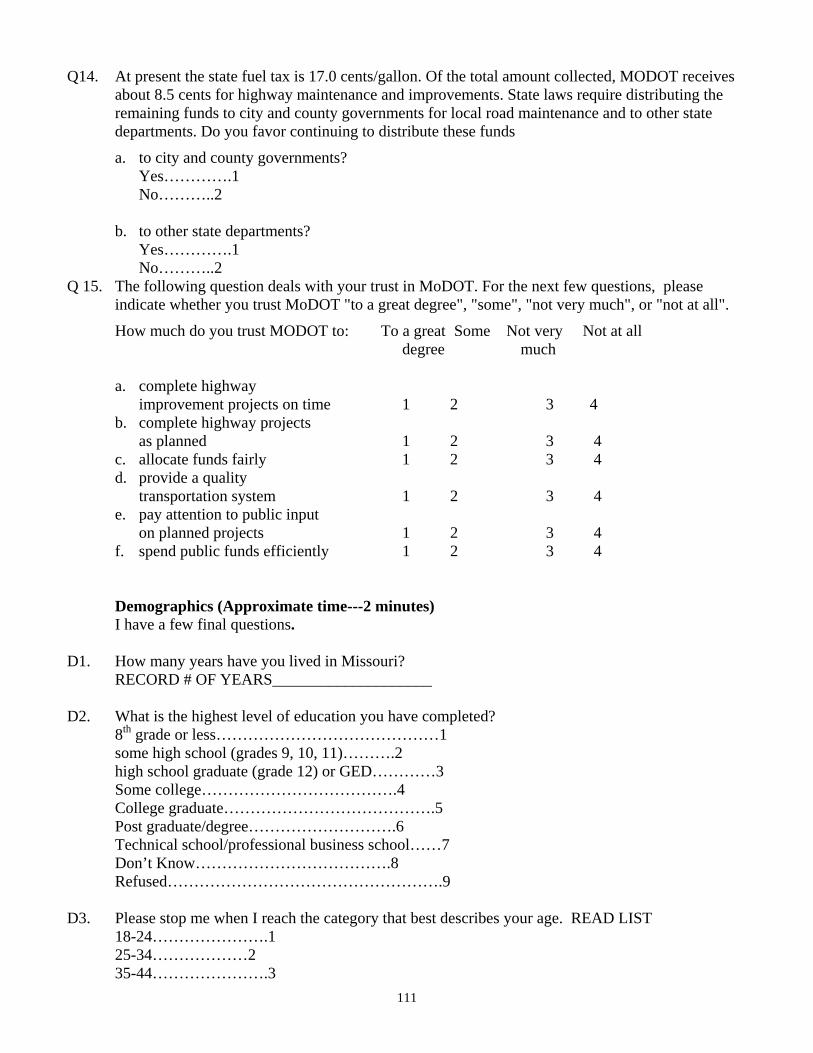
111
Q14. At present the state fuel tax is 17.0 cents/gallon. Of the total amount collected, MODOT receives about 8.5 cents for highway maintenance and improvements. State laws require distributing the remaining funds to city and county governments for local road maintenance and to other state departments. Do you favor continuing to distribute these funds
a. to city and county governments? Yes………….1 No………..2
b. to other state departments? Yes………….1 No………..2
Q 15. The following question deals with your trust in MoDOT. For the next few questions, please indicate whether you trust MoDOT "to a great degree", "some", "not very much", or "not at all".
How much do you trust MODOT to: To a great Some Not very Not at all degree much
a. complete highway
improvement projects on time 1 2 3 4 b. complete highway projects
as planned 1 2 3 4 c. allocate funds fairly 1 2 3 4 d. provide a quality
transportation system 1 2 3 4 e. pay attention to public input
on planned projects 1 2 3 4 f. spend public funds efficiently 1 2 3 4 Demographics (Approximate time---2 minutes) I have a few final questions.
D1. How many years have you lived in Missouri?
RECORD # OF YEARS____________________
D2. What is the highest level of education you have completed? 8th grade or less……………………………………1 some high school (grades 9, 10, 11)……….2 high school graduate (grade 12) or GED…………3 Some college……………………………….4 College graduate………………………………….5 Post graduate/degree……………………….6 Technical school/professional business school……7 Don’t Know……………………………….8 Refused…………………………………………….9
D3. Please stop me when I reach the category that best describes your age. READ LIST 18-24………………….1 25-34………………2 35-44………………….3

112
45-54………………4 55-64………………….5 65 or older…………6 Don’t Know…………..7 REFUSED…………8
D5. Are you or anyone who relies on you for transportation disabled?
Yes………….1 No………..2 Refused……..3
D6. Which of the following categories describes your employment status? (READ AND MULTIPLE RECORD) Employed full-time………………………………...1 Employed part-time……………………….…2 A student……………………………………..……3 Homemaker……………………………….…4 Currently laid off, on strike or unemployed……....5 Retired ……………………………………….6 Something else/other (Record Response_____)….7 Don’t know………………………………….8 Refused……………………………………………9
IF D6 EQUALS 1 OR 2 ASK D6a D6a. What is your occupation? (RECORD)______________________________
D8. Do you currently hold a valid driver’s license?
Yes…………………..1 No………………2 Don’t know…………3 Refused…………4
That is all the questions I have for you. The Missouri Department of Transportation thanks you for your time and input.
D9: Interview was conducted in
1… English 2….Spanish

113
Appendix B
Detailed Data Summary for Transportation Customer Survey 2003
Summary of Data for Each of 34 Performance Items The following tables provide statewide summaries on current performance and future attention, as well as discrepancy scores, for each of the 34 performance items assessed in the TCS. In addition, the tables contain the following information. “T-Test”— tests of significant differences were run between the means of current satisfaction, future attention and discrepancy scores for each of the respondent characteristics on which data were collected. The results are presented in tabular form with shaded table cells indicating where the t-test score showed a level of significance higher than 0.05. These subgroup comparisons indicate the respondent subgroups among which there were significant differences regarding the categories of response chosen in the survey. If all the respondents had answered in the same fashion regardless of their age, gender, level of education and so forth, all the table cells would be un-shaded. This result would indicate that all respondents basically responded the same way. Where there are shaded cells indicated, the categories of respondents are indicated as to where the subgroup differences exist.
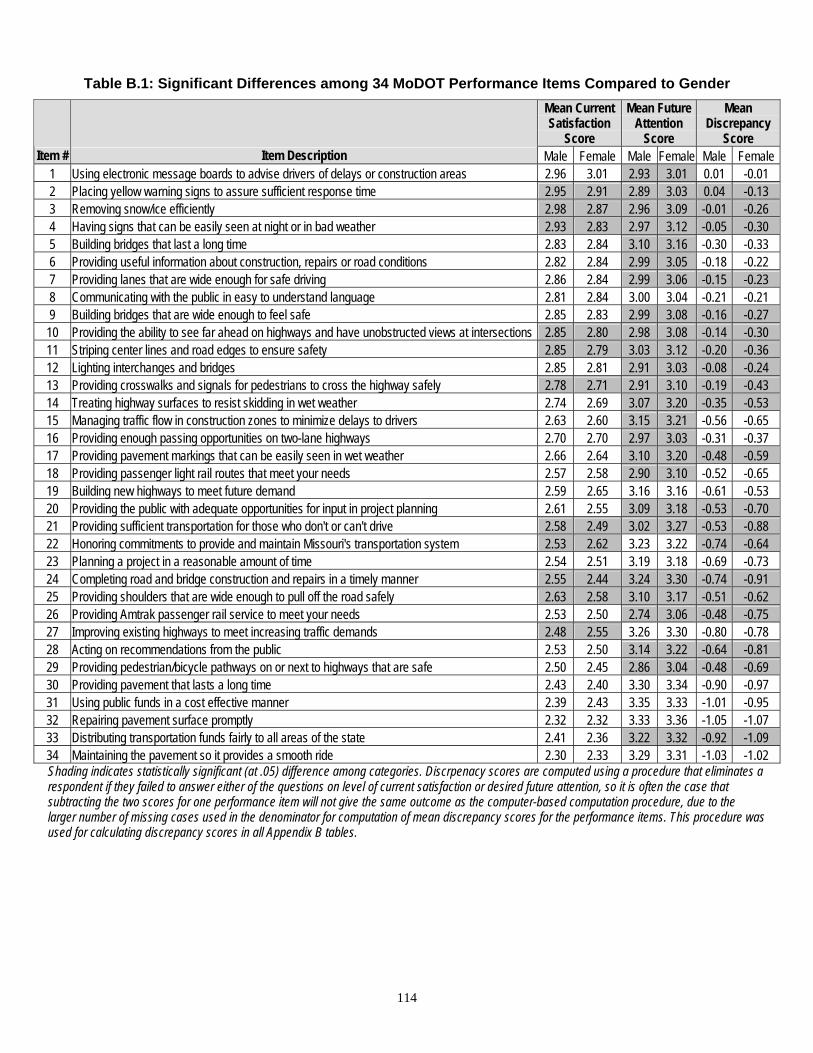
114
Table B.1: Significant Differences among 34 MoDOT Performance Items Compared to Gender Mean Current Satisfaction
Score
Mean Future Attention
Score
Mean Discrepancy
Score Item # Item Description Male Female Male Female Male Female
1 Using electronic message boards to advise drivers of delays or construction areas 2.96 3.01 2.93 3.01 0.01 -0.01 2 Placing yellow warning signs to assure sufficient response time 2.95 2.91 2.89 3.03 0.04 -0.13 3 Removing snow/ice efficiently 2.98 2.87 2.96 3.09 -0.01 -0.26 4 Having signs that can be easily seen at night or in bad weather 2.93 2.83 2.97 3.12 -0.05 -0.30 5 Building bridges that last a long time 2.83 2.84 3.10 3.16 -0.30 -0.33 6 Providing useful information about construction, repairs or road conditions 2.82 2.84 2.99 3.05 -0.18 -0.22 7 Providing lanes that are wide enough for safe driving 2.86 2.84 2.99 3.06 -0.15 -0.23 8 Communicating with the public in easy to understand language 2.81 2.84 3.00 3.04 -0.21 -0.21 9 Building bridges that are wide enough to feel safe 2.85 2.83 2.99 3.08 -0.16 -0.27 10 Providing the ability to see far ahead on highways and have unobstructed views at intersections 2.85 2.80 2.98 3.08 -0.14 -0.30 11 Striping center lines and road edges to ensure safety 2.85 2.79 3.03 3.12 -0.20 -0.36 12 Lighting interchanges and bridges 2.85 2.81 2.91 3.03 -0.08 -0.24 13 Providing crosswalks and signals for pedestrians to cross the highway safely 2.78 2.71 2.91 3.10 -0.19 -0.43 14 Treating highway surfaces to resist skidding in wet weather 2.74 2.69 3.07 3.20 -0.35 -0.53 15 Managing traffic flow in construction zones to minimize delays to drivers 2.63 2.60 3.15 3.21 -0.56 -0.65 16 Providing enough passing opportunities on two-lane highways 2.70 2.70 2.97 3.03 -0.31 -0.37 17 Providing pavement markings that can be easily seen in wet weather 2.66 2.64 3.10 3.20 -0.48 -0.59 18 Providing passenger light rail routes that meet your needs 2.57 2.58 2.90 3.10 -0.52 -0.65 19 Building new highways to meet future demand 2.59 2.65 3.16 3.16 -0.61 -0.53 20 Providing the public with adequate opportunities for input in project planning 2.61 2.55 3.09 3.18 -0.53 -0.70 21 Providing sufficient transportation for those who don't or can't drive 2.58 2.49 3.02 3.27 -0.53 -0.88 22 Honoring commitments to provide and maintain Missouri's transportation system 2.53 2.62 3.23 3.22 -0.74 -0.64 23 Planning a project in a reasonable amount of time 2.54 2.51 3.19 3.18 -0.69 -0.73 24 Completing road and bridge construction and repairs in a timely manner 2.55 2.44 3.24 3.30 -0.74 -0.91 25 Providing shoulders that are wide enough to pull off the road safely 2.63 2.58 3.10 3.17 -0.51 -0.62 26 Providing Amtrak passenger rail service to meet your needs 2.53 2.50 2.74 3.06 -0.48 -0.75 27 Improving existing highways to meet increasing traffic demands 2.48 2.55 3.26 3.30 -0.80 -0.78 28 Acting on recommendations from the public 2.53 2.50 3.14 3.22 -0.64 -0.81 29 Providing pedestrian/bicycle pathways on or next to highways that are safe 2.50 2.45 2.86 3.04 -0.48 -0.69 30 Providing pavement that lasts a long time 2.43 2.40 3.30 3.34 -0.90 -0.97 31 Using public funds in a cost effective manner 2.39 2.43 3.35 3.33 -1.01 -0.95 32 Repairing pavement surface promptly 2.32 2.32 3.33 3.36 -1.05 -1.07 33 Distributing transportation funds fairly to all areas of the state 2.41 2.36 3.22 3.32 -0.92 -1.09 34 Maintaining the pavement so it provides a smooth ride 2.30 2.33 3.29 3.31 -1.03 -1.02 Shading indicates statistically significant (at .05) difference among categories. Discrpenacy scores are computed using a procedure that eliminates a respondent if they failed to answer either of the questions on level of current satisfaction or desired future attention, so it is often the case that subtracting the two scores for one performance item will not give the same outcome as the computer-based computation procedure, due to the larger number of missing cases used in the denominator for computation of mean discrepancy scores for the performance items. This procedure was used for calculating discrepancy scores in all Appendix B tables.

115
Table B.2a: Significant Differences—Current Satisfaction Means Compared to Respondent’s Age for MoDOT Performance Items
Mean Current Satisfaction Score by Age Category Item # Item Description 18-24 25-34 35-44 45-54 55-64 65+
1 Using electronic message boards to advise drivers of delays or construction areas 2.99 2.98 2.99 2.94 3.04 2.97 2 Placing yellow warning signs to assure sufficient response time 2.97 2.93 2.93 2.89 2.90 2.97 3 Removing snow/ice efficiently 2.87 2.88 2.94 2.87 2.92 3.02 4 Having signs that can be easily seen at night or in bad weather 2.96 2.94 2.87 2.85 2.86 2.85 5 Building bridges that last a long time 2.94 2.95 2.84 2.78 2.76 2.79 6 Providing useful information about construction, repairs or road conditions 2.85 2.87 2.84 2.78 2.85 2.82 7 Providing lanes that are wide enough for safe driving 2.92 2.87 2.86 2.81 2.83 2.86 8 Communicating with the public in easy to understand language 2.87 2.92 2.84 2.77 2.78 2.83 9 Building bridges that are wide enough to feel safe 2.86 2.90 2.84 2.81 2.79 2.84 10 Providing the ability to see far ahead on highways and have unobstructed views at intersections 2.89 2.88 2.88 2.77 2.78 2.80 11 Striping center lines and road edges to ensure safety 2.89 2.85 2.86 2.76 2.78 2.83 12 Lighting interchanges and bridges 2.90 2.88 2.85 2.75 2.78 2.86 13 Providing crosswalks and signals for pedestrians to cross the highway safely 2.72 2.76 2.71 2.71 2.78 2.77 14 Treating highway surfaces to resist skidding in wet weather 2.81 2.78 2.68 2.66 2.66 2.78 15 Managing traffic flow in construction zones to minimize delays to drivers 2.55 2.61 2.55 2.57 2.59 2.84 16 Providing enough passing opportunities on two-lane highways 2.81 2.78 2.70 2.64 2.64 2.70 17 Providing pavement markings that can be easily seen in wet weather 2.78 2.69 2.61 2.60 2.63 2.68 18 Providing passenger light rail routes that meet your needs 2.90 2.61 2.53 2.54 2.43 2.61 19 Building new highways to meet future demand 2.90 2.73 2.65 2.56 2.45 2.60 20 Providing the public with adequate opportunities for input in project planning 2.66 2.62 2.59 2.54 2.53 2.58 21 Providing sufficient transportation for those who don't or can't drive 2.71 2.62 2.52 2.40 2.48 2.57 22 Honoring commitments to provide and maintain Missouri's transportation system 2.79 2.67 2.57 2.49 2.44 2.62 23 Planning a project in a reasonable amount of time 2.68 2.56 2.54 2.41 2.48 2.60 24 Completing road and bridge construction and repairs in a timely manner 2.51 2.53 2.48 2.42 2.46 2.59 25 Providing shoulders that are wide enough to pull off the road safely 2.75 2.69 2.62 2.53 2.55 2.57 26 Providing Amtrak passenger rail service to meet your needs 2.76 2.57 2.56 2.43 2.42 2.49 27 Improving existing highways to meet increasing traffic demands 2.84 2.60 2.49 2.42 2.41 2.54 28 Acting on recommendations from the public 2.63 2.57 2.50 2.47 2.47 2.55 29 Providing pedestrian/bicycle pathways on or next to highways that are safe 2.48 2.48 2.45 2.42 2.50 2.53 30 Providing pavement that lasts a long time 2.51 2.40 2.39 2.33 2.39 2.54 31 Using public funds in a cost effective manner 2.63 2.46 2.42 2.32 2.34 2.45 32 Repairing pavement surface promptly 2.37 2.30 2.28 2.25 2.30 2.47 33 Distributing transportation funds fairly to all areas of the state 2.68 2.49 2.34 2.24 2.27 2.44 34 Maintaining the pavement so it provides a smooth ride 2.36 2.33 2.23 2.22 2.33 2.46
Shading indicates statistically significant (at .05) difference between category and 45 to 54 age group.

116
Table B.2b: Significant Differences—Means for Desired Future Attention Compared to Respondent’s Age for MoDOT Performance Items
Mean Future Attention Score by Age Category Item # Item Description 18-24 25-34 35-44 45-54 55-64 65+
1 Using electronic message boards to advise drivers of delays or construction areas 2.96 2.98 2.97 3.03 2.93 2.94 2 Placing yellow warning signs to assure sufficient response time 2.94 2.92 2.94 2.96 3.01 3.02 3 Removing snow/ice efficiently 3.09 3.07 2.98 3.08 3.04 2.92 4 Having signs that can be easily seen at night or in bad weather 2.96 3.02 3.00 3.05 3.12 3.10 5 Building bridges that last a long time 2.94 3.12 3.13 3.17 3.16 3.17 6 Providing useful information about construction, repairs or road conditions 2.95 3.05 3.02 3.06 3.02 2.98 7 Providing lanes that are wide enough for safe driving 2.91 3.03 3.00 3.07 3.06 3.05 8 Communicating with the public in easy to understand language 2.87 2.99 2.97 3.10 3.06 3.07 9 Building bridges that are wide enough to feel safe 2.93 2.98 3.01 3.04 3.10 3.12 10 Providing the ability to see far ahead on highways and have unobstructed views at intersections 2.94 2.96 3.00 3.06 3.10 3.11 11 Striping center lines and road edges to ensure safety 2.98 3.05 3.04 3.12 3.11 3.13 12 Lighting interchanges and bridges 2.83 2.94 2.96 3.00 3.01 3.01 13 Providing crosswalks and signals for pedestrians to cross the highway safely 3.02 3.01 3.02 2.98 3.00 3.04 14 Treating highway surfaces to resist skidding in wet weather 3.09 3.13 3.13 3.18 3.17 3.10 15 Managing traffic flow in construction zones to minimize delays to drivers 3.30 3.21 3.18 3.23 3.14 3.07 16 Providing enough passing opportunities on two-lane highways 2.86 2.90 2.93 3.07 3.07 3.12 17 Providing pavement markings that can be easily seen in wet weather 3.11 3.15 3.15 3.16 3.18 3.16 18 Providing passenger light rail routes that meet your needs 2.92 3.00 3.06 3.01 3.01 2.99 19 Building new highways to meet future demand 3.05 3.17 3.15 3.20 3.23 3.13 20 Providing the public with adequate opportunities for input in project planning 3.10 3.08 3.17 3.17 3.12 3.14 21 Providing sufficient transportation for those who don't or can't drive 3.17 3.19 3.12 3.16 3.16 3.11 22 Honoring commitments to provide and maintain Missouri's transportation system 3.05 3.23 3.25 3.29 3.24 3.17 23 Planning a project in a reasonable amount of time 3.10 3.18 3.19 3.21 3.21 3.16 24 Completing road and bridge construction and repairs in a timely manner 3.35 3.29 3.27 3.30 3.25 3.21 25 Providing shoulders that are wide enough to pull off the road safely 3.04 3.06 3.11 3.18 3.21 3.17 26 Providing Amtrak passenger rail service to meet your needs 2.95 2.89 2.90 2.85 2.96 2.92 27 Improving existing highways to meet increasing traffic demands 3.25 3.28 3.29 3.32 3.32 3.21 28 Acting on recommendations from the public 3.17 3.20 3.21 3.19 3.15 3.15 29 Providing pedestrian/bicycle pathways on or next to highways that are safe 3.03 2.97 3.00 2.93 2.90 2.95 30 Providing pavement that lasts a long time 3.31 3.33 3.35 3.38 3.29 3.24 31 Using public funds in a cost effective manner 3.35 3.36 3.33 3.42 3.33 3.25 32 Repairing pavement surface promptly 3.35 3.35 3.38 3.39 3.32 3.24 33 Distributing transportation funds fairly to all areas of the state 3.17 3.28 3.27 3.38 3.25 3.19 34 Maintaining the pavement so it provides a smooth ride 3.33 3.34 3.35 3.34 3.24 3.21
Shading indicates statistically significant (at .05) difference between category and 45 to 54 age group.

117
Table B.2c: Significant Differences—Means for Disrepancy Scores Compared to Respondent’s Age for MoDOT Performance Items
Mean Discrepancy Score by Age Category Item # Item Description 18-24 25-34 35-44 45-54 55-64 65+
1 Using electronic message boards to advise drivers of delays or construction areas 0.01 -0.01 0.01 -0.09 0.08 0.02 2 Placing yellow warning signs to assure sufficient response time 0.05 -0.01 -0.01 -0.08 -0.15 -0.05 3 Removing snow/ice efficiently -0.25 -0.23 -0.06 -0.25 -0.15 0.07 4 Having signs that can be easily seen at night or in bad weather -0.02 -0.11 -0.13 -0.22 -0.28 -0.25 5 Building bridges that last a long time -0.01 -0.17 -0.29 -0.40 -0.43 -0.41 6 Providing useful information about construction, repairs or road conditions -0.11 -0.18 -0.20 -0.29 -0.20 -0.15 7 Providing lanes that are wide enough for safe driving 0.01 -0.18 -0.15 -0.28 -0.26 -0.20 8 Communicating with the public in easy to understand language -0.01 -0.06 -0.12 -0.35 -0.32 -0.30 9 Building bridges that are wide enough to feel safe -0.09 -0.09 -0.19 -0.26 -0.33 -0.29 10 Providing the ability to see far ahead on highways and have unobstructed views at intersections -0.08 -0.07 -0.13 -0.31 -0.35 -0.33 11 Striping center lines and road edges to ensure safety -0.12 -0.23 -0.19 -0.38 -0.38 -0.33 12 Lighting interchanges and bridges 0.06 -0.09 -0.11 -0.28 -0.29 -0.16 13 Providing crosswalks and signals for pedestrians to cross the highway safely -0.33 -0.29 -0.37 -0.31 -0.29 -0.27 14 Treating highway surfaces to resist skidding in wet weather -0.28 -0.37 -0.48 -0.54 -0.56 -0.32 15 Managing traffic flow in construction zones to minimize delays to drivers -0.75 -0.63 -0.68 -0.71 -0.60 -0.27 16 Providing enough passing opportunities on two-lane highways -0.07 -0.16 -0.27 -0.47 -0.48 -0.47 17 Providing pavement markings that can be easily seen in wet weather -0.37 -0.49 -0.57 -0.59 -0.59 -0.51 18 Providing passenger light rail routes that meet your needs -0.10 -0.51 -0.74 -0.66 -0.80 -0.49 19 Building new highways to meet future demand -0.17 -0.45 -0.54 -0.66 -0.81 -0.59 20 Providing the public with adequate opportunities for input in project planning -0.45 -0.48 -0.61 -0.72 -0.70 -0.60 21 Providing sufficient transportation for those who don't or can't drive -0.47 -0.67 -0.70 -0.88 -0.82 -0.63 22 Honoring commitments to provide and maintain Missouri's transportation system -0.29 -0.58 -0.71 -0.86 -0.84 -0.58 23 Planning a project in a reasonable amount of time -0.46 -0.69 -0.68 -0.86 -0.82 -0.60 24 Completing road and bridge construction and repairs in a timely manner -0.88 -0.82 -0.81 -0.94 -0.87 -0.67 25 Providing shoulders that are wide enough to pull off the road safely -0.32 -0.39 -0.51 -0.69 -0.72 -0.64 26 Providing Amtrak passenger rail service to meet your needs -0.37 -0.45 -0.64 -0.70 -0.83 -0.61 27 Improving existing highways to meet increasing traffic demands -0.41 -0.69 -0.82 -0.92 -0.95 -0.71 28 Acting on recommendations from the public -0.50 -0.67 -0.79 -0.81 -0.77 -0.67 29 Providing pedestrian/bicycle pathways on or next to highways that are safe -0.61 -0.56 -0.69 -0.64 -0.54 -0.48 30 Providing pavement that lasts a long time -0.82 -0.95 -1.00 -1.09 -0.92 -0.75 31 Using public funds in a cost effective manner -0.74 -0.97 -0.96 -1.18 -1.05 -0.82 32 Repairing pavement surface promptly -1.00 -1.09 -1.13 -1.17 -1.07 -0.81 33 Distributing transportation funds fairly to all areas of the state -0.52 -0.94 -1.05 -1.28 -1.13 -0.81 34 Maintaining the pavement so it provides a smooth ride -1.02 -1.04 -1.13 -1.15 -0.95 -0.80
Shading indicates statistically significant (at .05) difference between category and 45 to 54 age group.

118
Table B.3: Significant Differences among Means of 34 MoDOT Performance Items Compared to Educational Levels
Current Satisfaction Score
Future Attention Score Discrepancy Score Item # Item Description
<HS >HS <HS >HS <HS >HS 1 Using electronic message boards to advise drivers of delays or construction areas 2.98 3.03 2.97 3.07 0.01 -0.07 2 Placing yellow warning signs to assure sufficient response time 2.93 2.94 2.96 3.10 -0.04 -0.17 3 Removing snow/ice efficiently 2.93 2.83 3.02 3.17 -0.12 -0.43 4 Having signs that can be easily seen at night or in bad weather 2.88 2.89 3.04 3.15 -0.17 -0.30 5 Building bridges that last a long time 2.83 2.91 3.12 3.25 -0.31 -0.35 6 Providing useful information about construction, repairs or road conditions 2.83 2.85 3.01 3.17 -0.19 -0.36 7 Providing lanes that are wide enough for safe driving 2.85 2.86 3.01 3.22 -0.18 -0.38 8 Communicating with the public in easy to understand language 2.83 2.76 3.01 3.20 -0.20 -0.44 9 Building bridges that are wide enough to feel safe 2.83 2.94 3.03 3.16 -0.22 -0.23 10 Providing the ability to see far ahead on highways and have unobstructed views at intersections 2.83 2.82 3.03 3.14 -0.22 -0.34 11 Striping center lines and road edges to ensure safety 2.82 2.90 3.07 3.19 -0.28 -0.30 12 Lighting interchanges and bridges 2.83 2.89 2.96 3.09 -0.16 -0.24 13 Providing crosswalks and signals for pedestrians to cross the highway safely 2.74 2.82 2.99 3.22 -0.30 -0.44 14 Treating highway surfaces to resist skidding in wet weather 2.71 2.77 3.13 3.24 -0.44 -0.48 15 Managing traffic flow in construction zones to minimize delays to drivers 2.61 2.72 3.18 3.23 -0.61 -0.57 16 Providing enough passing opportunities on two-lane highways 2.69 2.77 2.99 3.15 -0.34 -0.40 17 Providing pavement markings that can be easily seen in wet weather 2.64 2.84 3.14 3.27 -0.54 -0.46 18 Providing passenger light rail routes that meet your needs 2.56 2.81 3.00 3.05 -0.61 -0.34 19 Building new highways to meet future demand 2.61 2.86 3.17 3.13 -0.58 -0.37 20 Providing the public with adequate opportunities for input in project planning 2.56 2.77 3.13 3.17 -0.62 -0.49 21 Providing sufficient transportation for those who don't or can't drive 2.51 2.75 3.14 3.25 -0.73 -0.55 22 Honoring commitments to provide and maintain Missouri's transportation system 2.56 2.75 3.22 3.24 -0.70 -0.52 23 Planning a project in a reasonable amount of time 2.52 2.67 3.19 3.18 -0.72 -0.57 24 Completing road and bridge construction and repairs in a timely manner 2.48 2.66 3.27 3.30 -0.84 -0.69 25 Providing shoulders that are wide enough to pull off the road safely 2.59 2.75 3.13 3.25 -0.57 -0.54 26 Providing Amtrak passenger rail service to meet your needs 2.50 2.74 2.89 3.05 -0.64 -0.47 27 Improving existing highways to meet increasing traffic demands 2.50 2.81 3.28 3.29 -0.81 -0.49 28 Acting on recommendations from the public 2.51 2.66 3.18 3.24 -0.73 -0.68 29 Providing pedestrian/bicycle pathways on or next to highways that are safe 2.46 2.62 2.94 3.17 -0.59 -0.59 30 Providing pavement that lasts a long time 2.40 2.65 3.32 3.35 -0.95 -0.75 31 Using public funds in a cost effective manner 2.40 2.62 3.35 3.29 -1.00 -0.72 32 Repairing pavement surface promptly 2.31 2.50 3.34 3.33 -1.07 -0.87 33 Distributing transportation funds fairly to all areas of the state 2.36 2.69 3.26 3.34 -1.02 -0.75 34 Maintaining the pavement so it provides a smooth ride 2.30 2.56 3.30 3.34 -1.04 -0.84
Shading indicates statistically significant difference at .05.

119
Table B.4: Significant Differences among 34 MoDOT Performance Items Compared to Average Number of Miles Driven
Current Satisfaction Score Future Satisfaction Score Discrepancy Score Item # Item Description
<10,000 10,000-19,999 >20,000 <10,000
10,000-19,999 >20,000 <10,000
10,000-19,999 >20,000
1 Using electronic message boards to advise drivers of delays or construction areas 2.94 2.98 3.02 3.00 2.98 2.95 -0.09 0.00 0.06 2 Placing yellow warning signs to assure sufficient response time 2.90 2.92 2.96 3.00 2.96 2.95 -0.12 -0.06 0.01 3 Removing snow/ice efficiently 2.86 2.96 2.93 3.08 3.01 3.00 -0.25 -0.09 -0.12 4 Having signs that can be easily seen at night or in bad weather 2.83 2.88 2.92 3.10 3.05 3.01 -0.29 -0.20 -0.09 5 Building bridges that last a long time 2.81 2.82 2.86 3.16 3.15 3.10 -0.38 -0.34 -0.25 6 Providing useful information about construction, repairs or road conditions 2.83 2.85 2.82 3.04 3.01 3.02 -0.23 -0.17 -0.21 7 Providing lanes that are wide enough for safe driving 2.82 2.86 2.87 3.04 3.01 3.03 -0.25 -0.17 -0.17 8 Communicating with the public in easy to understand language 2.84 2.85 2.80 3.05 3.01 3.02 -0.24 -0.17 -0.23 9 Building bridges that are wide enough to feel safe 2.84 2.82 2.85 3.06 3.04 3.02 -0.21 -0.26 -0.19 10 Providing the ability to see far ahead on highways and have unobstructed views at intersections 2.81 2.80 2.86 3.08 3.04 3.00 -0.29 -0.26 -0.15 11 Striping center lines and road edges to ensure safety 2.85 2.80 2.82 3.06 3.08 3.10 -0.22 -0.32 -0.30 12 Lighting interchanges and bridges 2.82 2.81 2.85 3.02 2.96 2.95 -0.22 -0.18 -0.11 13 Providing crosswalks and signals for pedestrians to cross the highway safely 2.70 2.75 2.77 3.11 2.99 2.96 -0.47 -0.27 -0.25 14 Treating highway surfaces to resist skidding in wet weather 2.72 2.70 2.73 3.19 3.11 3.12 -0.49 -0.45 -0.41 15 Managing traffic flow in construction zones to minimize delays to drivers 2.66 2.60 2.61 3.18 3.19 3.18 -0.55 -0.64 -0.62 16 Providing enough passing opportunities on two-lane highways 2.75 2.68 2.69 3.03 3.03 2.96 -0.30 -0.42 -0.31 17 Providing pavement markings that can be easily seen in wet weather 2.70 2.61 2.65 3.19 3.16 3.12 -0.54 -0.58 -0.50 18 Providing passenger light rail routes that meet your needs 2.62 2.52 2.61 3.06 3.02 2.95 -0.54 -0.66 -0.56 19 Building new highways to meet future demand 2.70 2.57 2.61 3.12 3.17 3.19 -0.46 -0.62 -0.60 20 Providing the public with adequate opportunities for input in project planning 2.58 2.57 2.58 3.16 3.11 3.14 -0.64 -0.59 -0.62 21 Providing sufficient transportation for those who don't or can't drive 2.54 2.52 2.54 3.24 3.11 3.11 -0.78 -0.67 -0.70 22 Honoring commitments to provide and maintain Missouri's transportation system 2.61 2.58 2.55 3.24 3.21 3.22 -0.69 -0.65 -0.72 23 Planning a project in a reasonable amount of time 2.57 2.53 2.50 3.20 3.18 3.18 -0.68 -0.70 -0.74 24 Completing road and bridge construction and repairs in a timely manner 2.53 2.47 2.49 3.29 3.28 3.25 -0.83 -0.86 -0.80 25 Providing shoulders that are wide enough to pull off the road safely 2.58 2.62 2.60 3.16 3.10 3.15 -0.60 -0.52 -0.58 26 Providing Amtrak passenger rail service to meet your needs 2.55 2.43 2.57 3.04 2.87 2.85 -0.68 -0.68 -0.53 27 Improving existing highways to meet increasing traffic demands 2.61 2.52 2.45 3.25 3.28 3.30 -0.67 -0.78 -0.87 28 Acting on recommendations from the public 2.55 2.53 2.49 3.22 3.16 3.18 -0.74 -0.69 -0.75 29 Providing pedestrian/bicycle pathways on or next to highways that are safe 2.43 2.47 2.51 3.02 3.00 2.87 -0.68 -0.64 -0.49 30 Providing pavement that lasts a long time 2.46 2.38 2.41 3.31 3.31 3.34 -0.89 -0.95 -0.95 31 Using public funds in a cost effective manner 2.45 2.39 2.41 3.31 3.34 3.36 -0.90 -1.00 -1.02 32 Repairing pavement surface promptly 2.37 2.31 2.30 3.33 3.35 3.35 -1.02 -1.07 -1.08 33 Distributing transportation funds fairly to all areas of the state 2.41 2.41 2.34 3.32 3.21 3.29 -1.02 -0.92 -1.06 34 Maintaining the pavement so it provides a smooth ride 2.40 2.30 2.27 3.28 3.30 3.32 -0.93 -1.03 -1.08
Shading indicates statistically significant (at .05) difference between category and 10,000 to 19,999-miles category
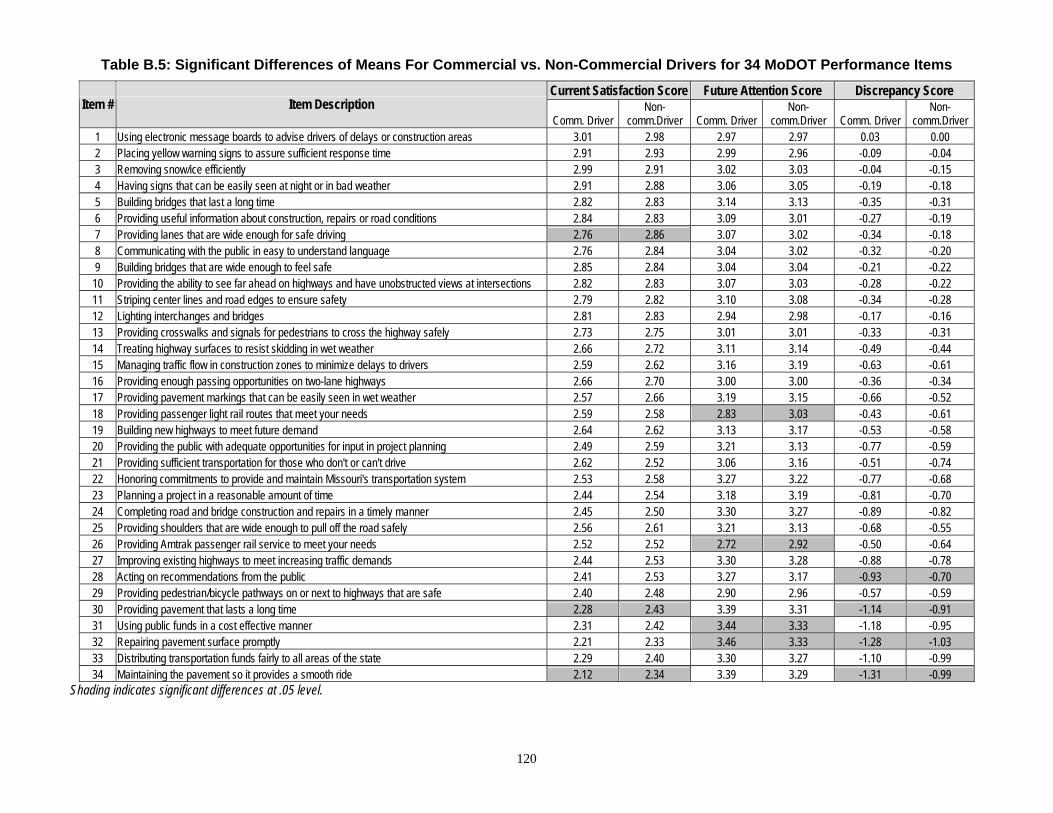
120
Table B.5: Significant Differences of Means For Commercial vs. Non-Commercial Drivers for 34 MoDOT Performance Items
Current Satisfaction Score Future Attention Score Discrepancy Score Item # Item Description
Comm. Driver Non-
comm.Driver Comm. Driver Non-
comm.Driver Comm. Driver Non-
comm.Driver 1 Using electronic message boards to advise drivers of delays or construction areas 3.01 2.98 2.97 2.97 0.03 0.00 2 Placing yellow warning signs to assure sufficient response time 2.91 2.93 2.99 2.96 -0.09 -0.04 3 Removing snow/ice efficiently 2.99 2.91 3.02 3.03 -0.04 -0.15 4 Having signs that can be easily seen at night or in bad weather 2.91 2.88 3.06 3.05 -0.19 -0.18 5 Building bridges that last a long time 2.82 2.83 3.14 3.13 -0.35 -0.31 6 Providing useful information about construction, repairs or road conditions 2.84 2.83 3.09 3.01 -0.27 -0.19 7 Providing lanes that are wide enough for safe driving 2.76 2.86 3.07 3.02 -0.34 -0.18 8 Communicating with the public in easy to understand language 2.76 2.84 3.04 3.02 -0.32 -0.20 9 Building bridges that are wide enough to feel safe 2.85 2.84 3.04 3.04 -0.21 -0.22 10 Providing the ability to see far ahead on highways and have unobstructed views at intersections 2.82 2.83 3.07 3.03 -0.28 -0.22 11 Striping center lines and road edges to ensure safety 2.79 2.82 3.10 3.08 -0.34 -0.28 12 Lighting interchanges and bridges 2.81 2.83 2.94 2.98 -0.17 -0.16 13 Providing crosswalks and signals for pedestrians to cross the highway safely 2.73 2.75 3.01 3.01 -0.33 -0.31 14 Treating highway surfaces to resist skidding in wet weather 2.66 2.72 3.11 3.14 -0.49 -0.44 15 Managing traffic flow in construction zones to minimize delays to drivers 2.59 2.62 3.16 3.19 -0.63 -0.61 16 Providing enough passing opportunities on two-lane highways 2.66 2.70 3.00 3.00 -0.36 -0.34 17 Providing pavement markings that can be easily seen in wet weather 2.57 2.66 3.19 3.15 -0.66 -0.52 18 Providing passenger light rail routes that meet your needs 2.59 2.58 2.83 3.03 -0.43 -0.61 19 Building new highways to meet future demand 2.64 2.62 3.13 3.17 -0.53 -0.58 20 Providing the public with adequate opportunities for input in project planning 2.49 2.59 3.21 3.13 -0.77 -0.59 21 Providing sufficient transportation for those who don't or can't drive 2.62 2.52 3.06 3.16 -0.51 -0.74 22 Honoring commitments to provide and maintain Missouri's transportation system 2.53 2.58 3.27 3.22 -0.77 -0.68 23 Planning a project in a reasonable amount of time 2.44 2.54 3.18 3.19 -0.81 -0.70 24 Completing road and bridge construction and repairs in a timely manner 2.45 2.50 3.30 3.27 -0.89 -0.82 25 Providing shoulders that are wide enough to pull off the road safely 2.56 2.61 3.21 3.13 -0.68 -0.55 26 Providing Amtrak passenger rail service to meet your needs 2.52 2.52 2.72 2.92 -0.50 -0.64 27 Improving existing highways to meet increasing traffic demands 2.44 2.53 3.30 3.28 -0.88 -0.78 28 Acting on recommendations from the public 2.41 2.53 3.27 3.17 -0.93 -0.70 29 Providing pedestrian/bicycle pathways on or next to highways that are safe 2.40 2.48 2.90 2.96 -0.57 -0.59 30 Providing pavement that lasts a long time 2.28 2.43 3.39 3.31 -1.14 -0.91 31 Using public funds in a cost effective manner 2.31 2.42 3.44 3.33 -1.18 -0.95 32 Repairing pavement surface promptly 2.21 2.33 3.46 3.33 -1.28 -1.03 33 Distributing transportation funds fairly to all areas of the state 2.29 2.40 3.30 3.27 -1.10 -0.99 34 Maintaining the pavement so it provides a smooth ride 2.12 2.34 3.39 3.29 -1.31 -0.99
Shading indicates significant differences at .05 level.

121
Table B.6: Significance of Age Categories on Ratings of Current Satisfaction
Age Categories Item # Item Description 18-24 25-34 35-44 55-64 65+ 1 Using electronic message boards to advise drivers of delays or construction areas * 2 Placing yellow warning signs to assure sufficient response time * * 3 Removing snow/ice efficiently * 4 Having signs that can be easily seen at night or in bad weather * * 5 Building bridges that last a long time * * 6 Providing useful information about construction, repairs or road conditions * 7 Providing lanes that are wide enough for safe driving * 8 Communicating with the public in easy to understand language * * * 9 Building bridges that are wide enough to feel safe * 10 Providing the ability to see far ahead on highways and have unobstructed views at intersections * * 11 Striping center lines and road edges to ensure safety * * * 12 Lighting interchanges and bridges * * * * 13 Providing crosswalks and signals for pedestrians to cross the highway safely 14 Treating highway surfaces to resist skidding in wet weather * * * 15 Managing traffic flow in construction zones to minimize delays to drivers * 16 Providing enough passing opportunities on two-lane highways * * 17 Providing pavement markings that can be easily seen in wet weather * * 18 Providing passenger light rail routes that meet your needs * 19 Building new highways to meet future demand * * * * 20 Providing the public with adequate opportunities for input in project planning 21 Providing sufficient transportation for those who don't or can't drive * * * * 22 Honoring commitments to provide and maintain Missouri's transportation system * * * 23 Planning a project in a reasonable amount of time * * * * 24 Completing road and bridge construction and repairs in a timely manner * * 25 Providing shoulders that are wide enough to pull off the road safely * * * 26 Providing Amtrak passenger rail service to meet your needs * 27 Improving existing highways to meet increasing traffic demands * * * 28 Acting on recommendations from the public * 29 Providing pedestrian/bicycle pathways on or next to highways that are safe * 30 Providing pavement that lasts a long time * * 31 Using public funds in a cost effective manner * * * 32 Repairing pavement surface promptly * * 33 Distributing transportation funds fairly to all areas of the state * * * 34 Maintaining the pavement so it provides a smooth ride * * * *
Shaded area indicates statistical significance at the0.05 level between comparison age group (45-54) and category.

122
Table B.7: Significance of Age Categories on Ratings of Future Attention
Age Category Item # Item Description 18-24 25-34 35-44 55-64 65+
1 Using electronic message boards to advise drivers of delays or construction areas * * 2 Placing yellow warning signs to assure sufficient response time 3 Removing snow/ice efficiently * * 4 Having signs that can be easily seen at night or in bad weather 5 Building bridges that last a long time * 6 Providing useful information about construction, repairs or road conditions * 7 Providing lanes that are wide enough for safe driving * 8 Communicating with the public in easy to understand language * * * 9 Building bridges that are wide enough to feel safe * 10 Providing the ability to see far ahead on highways and have unobstructed views at intersections * * 11 Striping center lines and road edges to ensure safety * * 12 Lighting interchanges and bridges * 13 Providing crosswalks and signals for pedestrians to cross the highway safely 14 Treating highway surfaces to resist skidding in wet weather * 15 Managing traffic flow in construction zones to minimize delays to drivers * * 16 Providing enough passing opportunities on two-lane highways * * * 17 Providing pavement markings that can be easily seen in wet weather 18 Providing passenger light rail routes that meet your needs 19 Building new highways to meet future demand * 20 Providing the public with adequate opportunities for input in project planning 21 Providing sufficient transportation for those who don't or can't drive 22 Honoring commitments to provide and maintain Missouri's transportation system * * 23 Planning a project in a reasonable amount of time * 24 Completing road and bridge construction and repairs in a timely manner * 25 Providing shoulders that are wide enough to pull off the road safely * * 26 Providing Amtrak passenger rail service to meet your needs 27 Improving existing highways to meet increasing traffic demands * 28 Acting on recommendations from the public 29 Providing pedestrian/bicycle pathways on or next to highways that are safe 30 Providing pavement that lasts a long time * * 31 Using public funds in a cost effective manner * * * 32 Repairing pavement surface promptly * 33 Distributing transportation funds fairly to all areas of the state * * * * * 34 Maintaining the pavement so it provides a smooth ride * *
Shaded area indicates statistical significance at the 0.05 level between comparison age group (45-54) and category.

123
Table B.8: Significance of Age Categories on Discrepancy Scores Age Category Item # Item Description
18-24 25-34 35-44 55-64 65+ 1 Using electronic message boards to advise drivers of delays or construction areas * 2 Placing yellow warning signs to assure sufficient response time 3 Removing snow/ice efficiently * * 4 Having signs that can be easily seen at night or in bad weather * 5 Building bridges that last a long time * * 6 Providing useful information about construction, repairs or road conditions * * 7 Providing lanes that are wide enough for safe driving * * 8 Communicating with the public in easy to understand language * * * 9 Building bridges that are wide enough to feel safe * * 10 Providing the ability to see far ahead on highways and have unobstructed views at intersections * * * 11 Striping center lines and road edges to ensure safety * * * 12 Lighting interchanges and bridges * * * 13 Providing crosswalks and signals for pedestrians to cross the highway safely 14 Treating highway surfaces to resist skidding in wet weather * * * 15 Managing traffic flow in construction zones to minimize delays to drivers * 16 Providing enough passing opportunities on two-lane highways * * * 17 Providing pavement markings that can be easily seen in wet weather * 18 Providing passenger light rail routes that meet your needs * 19 Building new highways to meet future demand * * * 20 Providing the public with adequate opportunities for input in project planning * * 21 Providing sufficient transportation for those who don't or can't drive * * * 22 Honoring commitments to provide and maintain Missouri's transportation system * * * * 23 Planning a project in a reasonable amount of time * * * * 24 Completing road and bridge construction and repairs in a timely manner * 25 Providing shoulders that are wide enough to pull off the road safely * * * 26 Providing Amtrak passenger rail service to meet your needs * 27 Improving existing highways to meet increasing traffic demands * * * 28 Acting on recommendations from the public * 29 Providing pedestrian/bicycle pathways on or next to highways that are safe 30 Providing pavement that lasts a long time * * * 31 Using public funds in a cost effective manner * * * * 32 Repairing pavement surface promptly * * 33 Distributing transportation funds fairly to all areas of the state * * * * 34 Maintaining the pavement so it provides a smooth ride * *
Shaded area indicates statistical significance at the 0.05 level between comparison age group (45-54) and category.

124
Table B.9: Significant Differences in Ratings of Current Satisfaction with MoDOT Performance Compared to Annual Mileage Driven by Respondents
Item # Item Description <10,000 >20,000 1 Using electronic message boards to advise drivers of delays or construction areas 2 Placing yellow warning signs to assure sufficient response time 3 Removing snow/ice efficiently * 4 Having signs that can be easily seen at night or in bad weather 5 Building bridges that last a long time 6 Providing useful information about construction, repairs or road conditions 7 Providing lanes that are wide enough for safe driving 8 Communicating with the public in easy to understand language 9 Building bridges that are wide enough to feel safe 10 Providing the ability to see far ahead on highways and have unobstructed views at intersections * 11 Striping center lines and road edges to ensure safety 12 Lighting interchanges and bridges 13 Providing crosswalks and signals for pedestrians to cross the highway safely 14 Treating highway surfaces to resist skidding in wet weather 15 Managing traffic flow in construction zones to minimize delays to drivers 16 Providing enough passing opportunities on two-lane highways * 17 Providing pavement markings that can be easily seen in wet weather * 18 Providing passenger light rail routes that meet your needs * * 19 Building new highways to meet future demand * 20 Providing the public with adequate opportunities for input in project planning * 21 Providing sufficient transportation for those who don't or can't drive 22 Honoring commitments to provide and maintain Missouri's transportation system 23 Planning a project in a reasonable amount of time 24 Completing road and bridge construction and repairs in a timely manner 25 Providing shoulders that are wide enough to pull off the road safely 26 Providing Amtrak passenger rail service to meet your needs * * 27 Improving existing highways to meet increasing traffic demands * * 28 Acting on recommendations from the public 29 Providing pedestrian/bicycle pathways on or next to highways that are safe 30 Providing pavement that lasts a long time * 31 Using public funds in a cost effective manner 32 Repairing pavement surface promptly 33 Distributing transportation funds fairly to all areas of the state 34 Maintaining the pavement so it provides a smooth ride *
Shaded area indicates statistically significant (at 0.05) difference between category and 10,000 to 19,999-mile category.
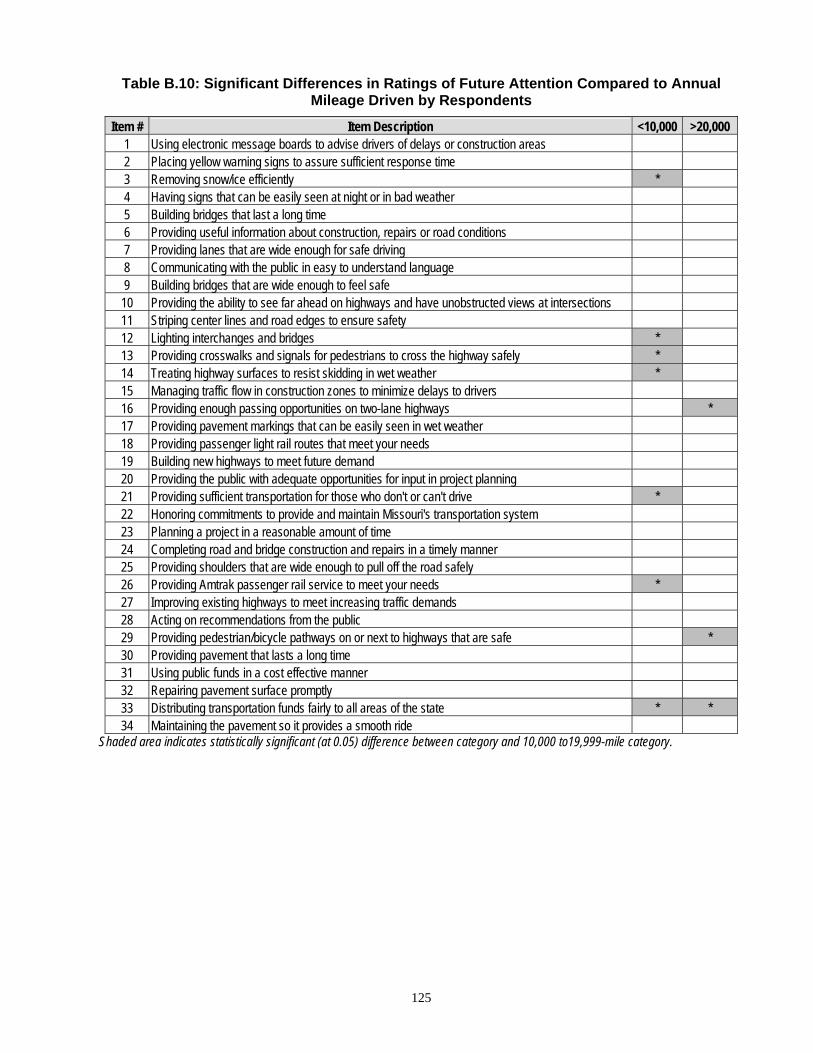
125
Table B.10: Significant Differences in Ratings of Future Attention Compared to Annual Mileage Driven by Respondents
Item # Item Description <10,000 >20,000 1 Using electronic message boards to advise drivers of delays or construction areas 2 Placing yellow warning signs to assure sufficient response time 3 Removing snow/ice efficiently * 4 Having signs that can be easily seen at night or in bad weather 5 Building bridges that last a long time 6 Providing useful information about construction, repairs or road conditions 7 Providing lanes that are wide enough for safe driving 8 Communicating with the public in easy to understand language 9 Building bridges that are wide enough to feel safe 10 Providing the ability to see far ahead on highways and have unobstructed views at intersections 11 Striping center lines and road edges to ensure safety 12 Lighting interchanges and bridges * 13 Providing crosswalks and signals for pedestrians to cross the highway safely * 14 Treating highway surfaces to resist skidding in wet weather * 15 Managing traffic flow in construction zones to minimize delays to drivers 16 Providing enough passing opportunities on two-lane highways * 17 Providing pavement markings that can be easily seen in wet weather 18 Providing passenger light rail routes that meet your needs 19 Building new highways to meet future demand 20 Providing the public with adequate opportunities for input in project planning 21 Providing sufficient transportation for those who don't or can't drive * 22 Honoring commitments to provide and maintain Missouri's transportation system 23 Planning a project in a reasonable amount of time 24 Completing road and bridge construction and repairs in a timely manner 25 Providing shoulders that are wide enough to pull off the road safely 26 Providing Amtrak passenger rail service to meet your needs * 27 Improving existing highways to meet increasing traffic demands 28 Acting on recommendations from the public 29 Providing pedestrian/bicycle pathways on or next to highways that are safe * 30 Providing pavement that lasts a long time 31 Using public funds in a cost effective manner 32 Repairing pavement surface promptly 33 Distributing transportation funds fairly to all areas of the state * * 34 Maintaining the pavement so it provides a smooth ride
Shaded area indicates statistically significant (at 0.05) difference between category and 10,000 to19,999-mile category.

126
Table B.11: Significant Differences in Discrepancy Scores Compared to Annual Mileage Driven by Respondents
Item # Item Description <10,000 >20,000 1 Using electronic message boards to advise drivers of delays or construction areas 2 Placing yellow warning signs to assure sufficient response time 3 Removing snow/ice efficiently * 4 Having signs that can be easily seen at night or in bad weather * 5 Building bridges that last a long time 6 Providing useful information about construction, repairs or road conditions 7 Providing lanes that are wide enough for safe driving 8 Communicating with the public in easy to understand language 9 Building bridges that are wide enough to feel safe 10 Providing the ability to see far ahead on highways and have unobstructed views at intersections * 11 Striping center lines and road edges to ensure safety 12 Lighting interchanges and bridges 13 Providing crosswalks and signals for pedestrians to cross the highway safely * 14 Treating highway surfaces to resist skidding in wet weather 15 Managing traffic flow in construction zones to minimize delays to drivers 16 Providing enough passing opportunities on two-lane highways * 17 Providing pavement markings that can be easily seen in wet weather 18 Providing passenger light rail routes that meet your needs 19 Building new highways to meet future demand * 20 Providing the public with adequate opportunities for input in project planning 21 Providing sufficient transportation for those who don't or can't drive 22 Honoring commitments to provide and maintain Missouri's transportation system * 23 Planning a project in a reasonable amount of time 24 Completing road and bridge construction and repairs in a timely manner 25 Providing shoulders that are wide enough to pull off the road safely 26 Providing Amtrak passenger rail service to meet your needs 27 Improving existing highways to meet increasing traffic demands * 28 Acting on recommendations from the public 29 Providing pedestrian/bicycle pathways on or next to highways that are safe * 30 Providing pavement that lasts a long time 31 Using public funds in a cost effective manner 32 Repairing pavement surface promptly 33 Distributing transportation funds fairly to all areas of the state * 34 Maintaining the pavement so it provides a smooth ride
Shaded area indicates statistically significant (at 0.05) difference between category and 10,000 to 19,999-mile category.

127
Table B.12: Significant Differences in Mean Ratings of Current Satisfaction Compared to Number of Years Lived in Missouri of Respondents
Number of Years Lived in Missouri Item # Item Description <5 years 5-10 years 11-20 years
1 Using electronic message boards to advise drivers of delays or construction areas 2 Placing yellow warning signs to assure sufficient response time 3 Removing snow/ice efficiently * 4 Having signs that can be easily seen at night or in bad weather 5 Building bridges that last a long time * 6 Providing useful information about construction, repairs or road conditions 7 Providing lanes that are wide enough for safe driving * 8 Communicating with the public in easy to understand language * 9 Building bridges that are wide enough to feel safe 10 Providing the ability to see far ahead on highways and have unobstructed views at intersections 11 Striping center lines and road edges to ensure safety * 12 Lighting interchanges and bridges 13 Providing crosswalks and signals for pedestrians to cross the highway safely 14 Treating highway surfaces to resist skidding in wet weather 15 Managing traffic flow in construction zones to minimize delays to drivers 16 Providing enough passing opportunities on two-lane highways 17 Providing pavement markings that can be easily seen in wet weather 18 Providing passenger light rail routes that meet your needs 19 Building new highways to meet future demand 20 Providing the public with adequate opportunities for input in project planning 21 Providing sufficient transportation for those who don't or can't drive 22 Honoring commitments to provide and maintain Missouri's transportation system 23 Planning a project in a reasonable amount of time 24 Completing road and bridge construction and repairs in a timely manner 25 Providing shoulders that are wide enough to pull off the road safely * 26 Providing Amtrak passenger rail service to meet your needs 27 Improving existing highways to meet increasing traffic demands * * 28 Acting on recommendations from the public * 29 Providing pedestrian/bicycle pathways on or next to highways that are safe 30 Providing pavement that lasts a long time * 31 Using public funds in a cost effective manner * 32 Repairing pavement surface promptly 33 Distributing transportation funds fairly to all areas of the state * * 34 Maintaining the pavement so it provides a smooth ride
Highlighted cells indicate significant difference at 0.05 level from those living in MO for >20 Years

128
Table B.13: Significant Differences in Mean Ratings of Future Attention Compared to Number of Years Lived in Missouri of Respondents
Number of Years Lived in Missouri Item # Item Description
<5 years 5-10 years 11-20 years 1 Using electronic message boards to advise drivers of delays or construction areas 2 Placing yellow warning signs to assure sufficient response time * 3 Removing snow/ice efficiently 4 Having signs that can be easily seen at night or in bad weather * 5 Building bridges that last a long time * 6 Providing useful information about construction, repairs or road conditions 7 Providing lanes that are wide enough for safe driving * 8 Communicating with the public in easy to understand language * 9 Building bridges that are wide enough to feel safe 10 Providing the ability to see far ahead on highways and have unobstructed views at intersections * * 11 Striping center lines and road edges to ensure safety 12 Lighting interchanges and bridges 13 Providing crosswalks and signals for pedestrians to cross the highway safely 14 Treating highway surfaces to resist skidding in wet weather 15 Managing traffic flow in construction zones to minimize delays to drivers 16 Providing enough passing opportunities on two-lane highways * * 17 Providing pavement markings that can be easily seen in wet weather 18 Providing passenger light rail routes that meet your needs 19 Building new highways to meet future demand * 20 Providing the public with adequate opportunities for input in project planning 21 Providing sufficient transportation for those who don't or can't drive 22 Honoring commitments to provide and maintain Missouri's transportation system * * 23 Planning a project in a reasonable amount of time 24 Completing road and bridge construction and repairs in a timely manner 25 Providing shoulders that are wide enough to pull off the road safely * 26 Providing Amtrak passenger rail service to meet your needs 27 Improving existing highways to meet increasing traffic demands * 28 Acting on recommendations from the public * 29 Providing pedestrian/bicycle pathways on or next to highways that are safe * 30 Providing pavement that lasts a long time 31 Using public funds in a cost effective manner 32 Repairing pavement surface promptly 33 Distributing transportation funds fairly to all areas of the state * * 34 Maintaining the pavement so it provides a smooth ride
Highlighted cells indicate significant difference at 0.05 level from those living in MO for >20 Years

129
Table B.14: Significant Differences in Mean Discrepancy Scores Compared to Number of Years Lived in Missouri of Respondents
Number of Years Lived in Missouri Item # Item Description <5 years 5-10 years 11-20 years
1 Using electronic message boards to advise drivers of delays or construction areas 2 Placing yellow warning signs to assure sufficient response time 3 Removing snow/ice efficiently * 4 Having signs that can be easily seen at night or in bad weather 5 Building bridges that last a long time * * 6 Providing useful information about construction, repairs or road conditions 7 Providing lanes that are wide enough for safe driving 8 Communicating with the public in easy to understand language * 9 Building bridges that are wide enough to feel safe 10 Providing the ability to see far ahead on highways and have unobstructed views at intersections * 11 Striping center lines and road edges to ensure safety * 12 Lighting interchanges and bridges 13 Providing crosswalks and signals for pedestrians to cross the highway safely * 14 Treating highway surfaces to resist skidding in wet weather 15 Managing traffic flow in construction zones to minimize delays to drivers 16 Providing enough passing opportunities on two-lane highways * * 17 Providing pavement markings that can be easily seen in wet weather 18 Providing passenger light rail routes that meet your needs 19 Building new highways to meet future demand * 20 Providing the public with adequate opportunities for input in project planning * 21 Providing sufficient transportation for those who don't or can't drive 22 Honoring commitments to provide and maintain Missouri's transportation system * 23 Planning a project in a reasonable amount of time 24 Completing road and bridge construction and repairs in a timely manner 25 Providing shoulders that are wide enough to pull off the road safely * * 26 Providing Amtrak passenger rail service to meet your needs 27 Improving existing highways to meet increasing traffic demands * * 28 Acting on recommendations from the public * * 29 Providing pedestrian/bicycle pathways on or next to highways that are safe * 30 Providing pavement that lasts a long time * 31 Using public funds in a cost effective manner 32 Repairing pavement surface promptly 33 Distributing transportation funds fairly to all areas of the state * * 34 Maintaining the pavement so it provides a smooth ride
Highlighted cells indicate significant difference at 0.05 level from those living in MO for >20 Years

130
Appendix C
Stakeholders Interviewed for Transportation Customer Survey 2003 Stakeholder List
Mr. Jerry Blair, Director of Transportation, East-West Gateway Coordinating Council
Mr. Mell Henderson, Director of Transportation, Mid-America Regional Council
Mr. Fred May, Director, Springfield Planning and Development
Mr. Duane Kraft, Associated General Contractors of Missouri
Ms. Linda Yaeger, Executive Director, OATS
Mr. Gary Markenson, Executive Director, Missouri Municipal League
Mr. Charlie Kruse, President, Missouri Farm Bureau Federation
Mr. Dave Smith, Director, Governmental Affairs, Missouri Transportation and Development Council
Mr. Dick Burke, Executive Director, Missouri Association of Counties
Mr. Larry E. Salci, Executive Director, Bi-State Development Agency
Mr. Mark Huffer, General Manager, Kansas City Area Transportation Authority
Mr. Steve Olsen, Fire Chief, Boone County, Missouri
Mr. Harry Rogers, Chair, Missouri Association of Councils of Government
Mr. Andy Clements, St. Joseph Public Works Department
Mr. Bob Crandell, Missouri Pilots Association
Mr. Bob Dickens, Aircraft Owners and Pilots Association
Ms. Carolyn Morris, Missouri State Aviation Council
Mr. Tom Yarbrough, Trailnet
Mr. Jim Anderson, Commissioner, Missouri Highways and Transportation Commission
Mr. W.L. Orscheln, Commissioner, Missouri Highways and Transportation Commission

131
This page intentionally left blank.

132
Listing of 34 Items Included in the Survey5
Item # Item Description 1 Using electronic message boards to advise drivers of delays or construction areas 2 Placing yellow warning signs to assure sufficient response time 3 Removing snow/ice efficiently 4 Having signs that can be easily seen at night or in bad weather 5 Building bridges that last a long time 6 Providing useful information about construction, repairs or road conditions 7 Providing lanes that are wide enough for safe driving 8 Communicating with the public in easy to understand language 9 Building bridges that are wide enough to feel safe
10* Providing the ability to see far ahead on highways and have unobstructed views at intersections 11 Striping center lines and road edges to ensure safety 12 Lighting interchanges and bridges 13 Providing crosswalks and signals for pedestrians to cross the highway safely 14 Treating highway surfaces to resist skidding in wet weather 15* Managing traffic flow in construction zones to minimize delays to drivers 16 Providing enough passing opportunities on two-lane highways 17 Providing pavement markings that can be easily seen in wet weather 18 Providing passenger light rail routes that meet your needs 19 Building new highways to meet future demand 20 Providing the public with adequate opportunities for input in project planning 21 Providing sufficient transportation for those who don't or can't drive 22 Honoring commitments to provide and maintain Missouri's transportation system 23 Planning a project in a reasonable amount of time 24 Completing road and bridge construction and repairs in a timely manner 25 Providing shoulders that are wide enough to pull off the road safely 26 Providing Amtrak passenger rail service to meet your needs 27 Improving existing highways to meet increasing traffic demands 28* Acting on recommendations from the public 29 Providing pedestrian/bicycle pathways on or next to highways that are safe 30 Providing pavement that lasts a long time 31 Using public funds in a cost-effective manner 32 Repairing pavement surface promptly 33 Distributing transportation funds fairly to all areas of the state 34 Maintaining the pavement so it provides a smooth ride
Note: New performance items for TCS 2003 are marked with an asterisk.
5 Table position: Inside Back Cover