transport corporation of india investors presentation fy...
TRANSCRIPT

. . . . . . . . . . . . . . . . . . . . . . . . . . . . . . . . . . . . . . . . . . . . . . . . . . . . . . . . . . . . . . . . . . . . . . . . . .
. . . . . . . .
. . . . . . . . . . . . . . . . . . . . . . . . . . . . . . . . . . . . . . . . . . . . . . . . . . . . . . . . . . . . . . . . . . . . . . . . . .
. . . . . . . . . . . . . . . . . . . . . . . . . . . . . . . . . . . . . . . . . . . . . . . . . . . . . . . . . . . . . . . . . . . . . . . . . .
Transport Corporation of India Investors Presentation FY 2016-17

2
Cautionary Statement
Statements in this “Presentation” describing the Company’s objectives, estimates, expectations or predictions may
be “forward looking statements” within the meaning of applicable securities laws and regulations. Actual results
could differ materially from those expressed or implied. Important factors that could make a difference to the
Company’s operations include global and Indian demand supply conditions, cyclical demand and pricing in the
Company’s principal markets, changes in Government regulations, tax regimes, economic developments within India
and other factors. The Company assumes no responsibility to publicly amend, modify or revise any forward looking
statement, on the basis of any subsequent development, information or events, or otherwise.

Group TCI
3
SBUs & Services
FTL/FCL, LTL & Over-dimensional cargo services through Road, Rail & Sea.
Leading player in Coastal Shipping , NVOCC & Project Cargo
A Single-window solutions enabler from Conceptualization to Implementation
Other Group companies
JV with CONCOR to provideend to end multi modal solutions.
JV with Mitsui & Co for Auto logistics (Toyota India project)
TCI Transportation Company Nigeria Ltd.
A JV between Indorama ElemePetrochemicals Ltd. and TCI.
TDL undertakes development of the properties of TCI. It also develops large scale Warehouses, Logistics Parks etc
Specialized in offering time definite solutions with strength of 2000+ team of professional and 13000+ delivery points.

Group TCI
4
Key Facts
Year of Establishment
Turnover
IT enabled Owned Branches
Vehicles/DayManaged on Road
1958
2.5%
1400
10000
Movementby Value of India GDP
3000 Cr.
Employees Strength 6000
Cold Chain
ConnectingSAARC

TCI Consolidated
5
Key Facts
Turnover
IT enabled Owned Branches
Warehouse Covered Area managed
1950 Cr.
900
8500
5
3500Employees Strength
10 Mn Sqft
New Developments
8 Fulfilment centers with processing
capacity of 1 Lac orders/day
One more ship acquired for
West Coast to connect
Northern States to Southern
States
Incorporation of 100% subsidiary
in Bangladesh as “TCI
Bangladesh Limited”
E-Com
MultiModalSolution
ConnectingSAARC
Vehicles/DayManaged on Road
Cargo Ships
Owned Vehicles1500

Name Designation
Mr. S M Datta Chairman (Non-executive independent director)
Mr. D P Agarwal Vice Chairman & Managing Director
Mr. S N Agarwal Non-executive director
Mr. O S Reddy Non-executive independent director
Mr. K S Mehta Non-executive independent director
Mr. Ashish Bharat Ram Non-executive independent director
Mr. Vijay Sankar Non-executive independent director
Mrs. Urmila Agarwal Non-executive director
Mr. M P Sarawagi Non-executive director
Mr. Chander Agarwal Non-executive director
Mr. Vineet Agarwal Managing Director
Board of Directors
6
Corporate GovernanceCorporate Social ResponsibilityTCI would be taking CSR initiatives through TCI Foundation, TCI Institute of Logistics & TCI Charities underbelow activities:
TCI PoliciesThe company considers its employee as the most important and valuable asset and is committed toprovide conducive, healthy and professional work environment. So the Company establishes the policiesand procedures to protect the rights of employees as well as the enable social & economic environmentwithin the organization. Certain important policies are:HSE Policy , Code of Conduct , Sexual Harassment Policy , CSR Policy , Risk Management Policy.
Listing, Rating & CertificationsTCI is listed in two stock exchange i.e. NSE & BSE whereas having Rating & Certifications form the following:ISO 9001:2008 , CRISIL: AA-/stable for long term , ICRA: A1+ short term , IATA Certificate
7

Logistic FocusLog Focus is a quarterly in housepublication of Group TCI and covers awide spectrum of topics of Logisticsand Supply Chain ranging from CaseStudies, White Papers and Analysis
Study Report & Publications
8
EnrouteEnroute is a quarterly in housepublication of Group TCI. It has varioussections such as Cover Story, IndustrialTrends, Food for thought, Health etcthat take up current issue pertaining toLogistic Industry & for general Interest.
2nd Sustainability ReportTCI has released its second CSR cumSustainability Report for the year2010-14 base on Triple Bottom Line ofProfit-People-Planet. TCI is the firstIndian Logistics Company to come outwith such a report.
A Joint Study Report by TCI & IIM 2014-15Transport Corporation of India (TCI), in collaboration with IIM Calcutta, launched the 3rd editionof the joint study report titled “Operational Efficiency of Freight Transportation by Road in India”.The report is based on the joint survey of road freight transportation along 28 key routes in India.The aim of the study is to explore new ways to increase the operational efficiency of freighttransport by road.

Awards & Recognition
7

Logistics Growth Drivers
Logistics Infrastructure Development
• Creation of additional dedicated road, rail as well as costal capacity, • Will reduce unit cost of Transportation by speeding up freight train operations.• Increased bulk multi modal movement for improved productivity & efficiency• Will result in development of logistic Warehouses in the vicinity of Freight Corridor.
GST
• Rationalizing the impact of taxes on Production, Distribution and Inventory management • Consolidation of warehouses and moving towards Hub-and-spoke model• Multi modal movement between Hubs• Shift of business from unorganized to organized sector
• With increased per capita disposable income, consumption driven sectors will grow.• Sectors like Food services, e-commerce, consumable durables etc. will get a boost and
distribution will become more omni channel.
E-commerce driven growth in
consumption
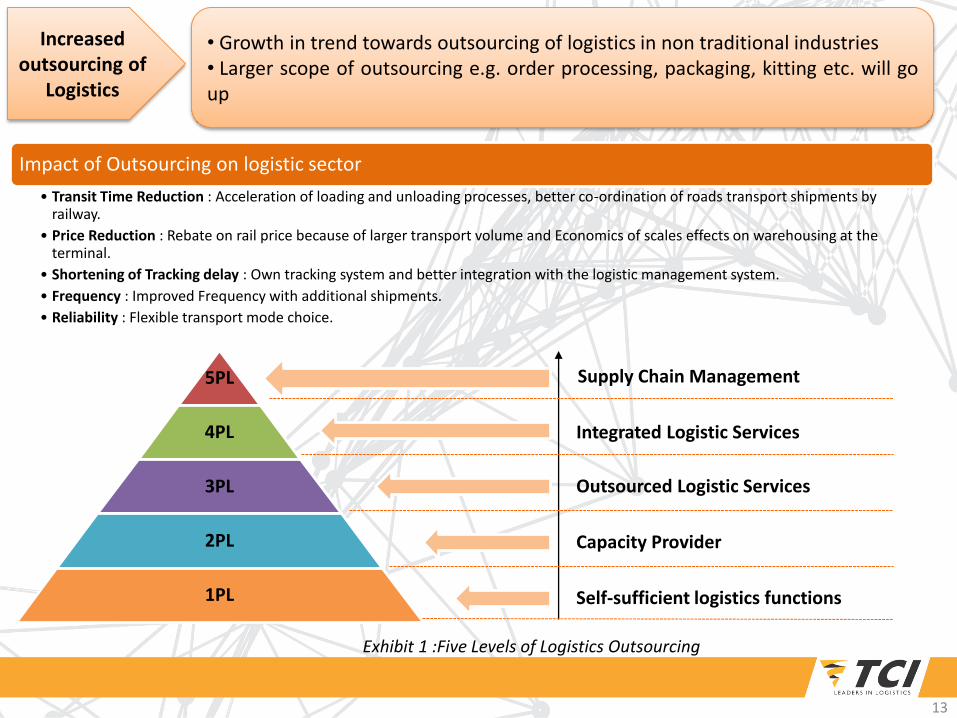
• Growth in trend towards outsourcing of logistics in non traditional industries. • Larger scope of outsourcing e.g. order processing, packaging, kitting etc. will go up
Increased outsourcing of
Logistics
10

Transportation
• Larger Warehouses and borderless movement of goods would leads to increased transportation lot sizes, multimodal movement
• Lesser border checks/paper work would lead to faster movement of trucks. Transit times and cost may shrink by 20-30%
Warehouse
• Network to be determined based on the ambit of Additional Tax.
• Network optimization efforts to commence
• Consolidation of warehousing to commence.
• Emergence of hub and Spoke model
• Larger sizes of warehouses (hubs)
• Warehouses closer to manufacturing and/ or consumption areas.
11
GST
• Rationalizing the impact of taxes on Production, Distribution and Inventorymanagement• Consolidation of warehouses and moving towards Hub-and-spoke model• Multi modal movement between Hubs• Shift of business from unorganized to organized sector

12
Sagar Mala
Bharat Mala
This will connect eastern and western India through 7,000 Km ofNational Highways. It will allow goods to move comfortably acrossthe country and help reduce the cost of passenger and freighttravel. The project will improve road connectivity not just incoastal and border areas, but also provide seamless connectivityalong the borders with Nepal, Bangladesh, China, Pakistan andBhutan, which is crucial for strategic reasons.
Sagar Mala envisages port led development of the country thatwould looks towards transforming the existing Ports into modernworld class Ports and integrate the development of the Ports, andprovide a boost to multimodal logistics
Dedicated Freight Corridors
DFC will give boost to share of railways in carrying domestic freightand strengthening the prospects of multi-modal transportation inIndia.
Logistics Infrastructure Development
• Creation of additional dedicated road, rail as well as costal capacity,• Will reduce unit cost of Transportation by speeding up freight train operations.• Increased bulk multi modal movement for improved productivity & efficiency• Will result in development of logistic Warehouses in the vicinity of FreightCorridor
Increased outsourcing of
Logistics
• Growth in trend towards outsourcing of logistics in non traditional industries• Larger scope of outsourcing e.g. order processing, packaging, kitting etc. will goup
5PL
4PL
3PL
2PL
1PL
Supply Chain Management
Integrated Logistic Services
Outsourced Logistic Services
Capacity Provider
Self-sufficient logistics functions
Exhibit 1 :Five Levels of Logistics Outsourcing
Impact of Outsourcing on logistic sector
• Transit Time Reduction : Acceleration of loading and unloading processes, better co-ordination of roads transport shipments by railway.
• Price Reduction : Rebate on rail price because of larger transport volume and Economics of scales effects on warehousing at the terminal.
• Shortening of Tracking delay : Own tracking system and better integration with the logistic management system.
• Frequency : Improved Frequency with additional shipments.
• Reliability : Flexible transport mode choice.
13

Customers
Companies
Consolidation center
WarehousesDedicate & Shared
Suppliers
1. Marketplace
2. Inventory Based
1. At Supplier
i Supplier Coordination
ii Scheduling
iii Route optimization
2. Inventory / Marketplace / Cross Dock- FC
i Receipts and Bar Coding
ii Quality Check and Put away
iii Order processing on SLA
iv Sortation and Ship+ CUBISCAN
v Return Shipment Management
3. At Customer place
i Doorstep delivery
ii FOD
iii Reverse logistics
~ 200,000 units / day
~ 100,000Orders / day
~ 20,000 Deliveries / day
14
Group Companies & Divisions
Group Companies & Divisions
E-commerce driven growth
in consumption
• With increased per capita disposable income, consumption driven sectors willgrow.• Sectors like Food services, e-commerce, consumable durables etc. will get aboost and distribution will become more omni channel.

• One of India’s premier organized freight services provider with pan India presence• Single window Key Account Management (KAM) solutions for managing information flow and tracking. • Started new service for SAARC region to provide door to door service• Around 2800 trucks and trailers, both owned and leased, provide freight movement services on a daily basis
TCI Freight Division
Over dimensional cargo
Provides logistics solutions for over dimensional, bulk and heavy cargo
Project management
Own hydraulic axles and trailers
Rail
Provides different types of services such as containers, parcel van, wagons and special automotive wagons
Road
Provides full truck load (FTL), less than truck load (LTL) and parcel services
600 owned offices
Large client base
51% equity stake 49% equity stake
Provides end to end multi modal solutions.
Significantly reduces turnaround time
Integration of rail and road cargo movement.
Establishing synergy between two rail and road giants.
15

Key Industry verticals
Range of services
Auto OEM Solutions, Line feeding ,Spares part distribution, Reverse Logistics, Multi-Modal Movement ,Warehousing, Yard Management
FMCG ,Retail and E-commerce
Warehousing ,Packaging & Value Added Service, Last mile Distribution, and E-fulfillment centers
Hi-Tech Supplier Management, Primary Movement, CFA management, Spares management ,Warehousing ,Multi-Modal movement ,Reverse Logistics
Chemical Warehousing ,Packaging & Value Added Services, Bulk Tankers, Hazmat Logistics,ISO Tanktainers movement ,Dry bulk movement in Container liner ,Gas bulk movement
Healthcare Cold Chain
Project movement during harvesting season ,Outbound Transportation ,Specialized DC for Retail,warehousing
• Provides inbound/outbound logistics and supply chain solutions from conceptualization designing network to implementation
TCI Supply Chain Division
49% equity stake
Mitsui & Co. Ltd
51% equity stake
Lead logistics partner for Toyota Kirloskar Motors Ltd. and for other Japanese auto companies in India
Complete logistics solutions from inbound to outbound transportation across India and abroad
16

TCI Seaways Division
Ships Owned
05 domestic ships with capacity of 3500 – 10600 DWT, including Project Ships equipped with own cranes
(Total capacity of 37,360 DWT)
Coastal Shipping Services
Scheduled services on both coasts:
-Mundra to Cochin
-Chennai/Vizag to Andamans
Other Services
Chartering of Vessels
Stevedoring & MTO License
NVOCC with own & leased containers
One new ship of 14000 DWT was acquired in Q-4 to operate on the West Coast
• One of India’s premier organized freight services provider with pan India presence• Provides coastal shipping services for transporting container and bulk cargo along the Western & Eastern coast
of India• Align and help multi-modal solutions
17

Total Total **
Revenue 918.3 736.0 147.9 19.4 1821.9 1614.03
% Growth 9.6% 16.8% 14.8% 10.5% 12.8% 4.1%
EBIDTA 31.3 77.9 50.7 14.1 174.0 148.4
% of Revenue 3.4% 10.6% 34.3% 74.2% 9.6% 9.2%
EBIT 21.3 44.7 38.2 12.0 116.2 97.6
% Growth over LY
30.0% 17.4% 25.8% -6.3% 19.0% 11.3%
Capital Employed
209.5 276.2 220.4 329.3 1035.4 888.0
ROCE % 10.3% 17.7% 20.2% 3.8% 12.1% 11.5%
Performance FY 2016-17 : Stand-alone
18
Energy and Corp.
Figures are in Crs
(2016-17) (2015-16)
** Excluding XPS Undertaking

Divisional Revenue Mix
19
43% 40% 38% 37% 37%
50%
27% 28% 30% 30% 29%
25% 27% 27% 28% 28%
41%
5% 5% 5% 5% 6% 8%
1% 1% 1% 1% 1% 1%
8.1% 7.7% 7.6%8.3% 8.6%
9.6%
0.0%
2.0%
4.0%
6.0%
8.0%
10.0%
12.0%
14.0%
16.0%
0%
20%
40%
60%
80%
100%
FY12 FY 13 FY14 FY15 FY16 FY17
Freight XPS SCS Seaways Others EBIDTA Margin

Capital Expenditure in last 10 years
20
Land & Building 355.9 17.9 50.0
Wind power 9.0 0.0 0.0
Ships 123.7 40.7 0.0
Containers 32.1 24.5 17.0
Trucks & Cars 305.2 27.6 35.3
Others (Equip., IT etc.) 81.0 14.4 27.7
Total 906.9 125.1 130.0
Total
Actual (FY 2006-07 to
2014-15)
2016-17 2017-18
ProposedFigures are in Crs
Estimates of sources of finance for the Capex in FY 2017-18
Rs. In Crores
FY 2017-18 67 0 63 130 0.69
Debt Equity Free Cash Flows TotalDebt Equity
Ratio

Income Statement
Standalone & Consolidated Results
Particulars (Rs in Cr.) 2015-16 2016-172016-17
(CONSOL)
Freight 1415.71 1629.50 1765.37
Other Sales & Services 185.30 177.35 177.35
Other Income 13.00 15.11 12.15
Total Income 1614.03 1821.96 1954.87
Revenue growth % 4.11% 12.88% 12.68%
Operating expenses 1282.41 1454.06 1582.12
Other expenses 183.27 192.72 199.88
Total Expenses 1465.68 1646.78 1782.00
EBITDA 148.35 175.18 172.87
EBITDA Margin % 9.20% 9.61% 8.84%
Interest Expense 22.96 28.61 28.78
Depreciation 50.71 57.81 59.20
Exceptional Item 0.00 0.00 0.00
PBT 74.68 88.75 84.89
Share in Net Profit (loss) of JV 0.00 0.00 15.46
PBT Margin % 4.62% 4.87% 5.13%
Taxes 15.12 18.49 19.10
PAT 59.56 70.26 81.25
PAT Margin % 3.69% 3.85% 4.16%
Balance Sheet
21
Figures in Crs
Note : Figures are restated to extent of IND AS. Above results excludes TCI Express Figures.
Particulars (Rs in Cr.) 2015-16 2016-172016-17
(CONSOL)
1. Non current Assets
Property, plant and equipment 520.55 522.73 531.90
Capital work-in-progress 12.32 56.81 56.81
Intangible assets 0.99 0.68 0.68
Investments 26.56 29.78 89.92
Long term loans and advances 6.42 11.43 11.43
Other non current assets 35.93 65.94 65.94
2. Current Assets
Inventories 1.76 2.51 2.52
Trade Receivables 303.30 331.65 357.00
Cash & cash equivalents 10.40 18.41 18.99
Loans and advances 7.06 10.72 15.61
Other current assets 44.50 81.11 81.12
TOTAL 969.79 1131.77 1231.92
1. Shareholders Funds
Share Capital 15.21 15.32 15.32
Reserves & Surplus 502.90 565.58 638.09
2. Non Current Liabilities
Long term Borrowings 95.76 140.39 142.91
Deferred tax Liabilities (net) 31.88 39.17 39.47
Other long term liabilities 0.00 2.27 2.27
3. Current Liabilities
Short term borrowings 204.28 225.58 236.36
Trade payables 51.64 73.33 84.69
Other current liabilities 61.78 64.89 66.76
Short term provisions 6.34 5.24 6.05
TOTAL 969.79 1131.77 1231.92

Owing to Top ratings AA- , A1+ from Credit Agencies, good financial discipline and high creditworthiness, TCI’s average interest cost is below 9%
Debt – Equity Ratio Earnings per Share (in Rs)
Financial Performance
Debt Service Coverage Ratio # Times 1.92 2.21 2.34
Return on Capital Employed # % 11.6 11.5 12.1
UOM 2014-15 2015-16 2016-17
22
# Re-stated after Excluding XPS undertaking
3.91
5.937.07 7.13 7.13
8.51
10.5011.20
9.15
0.86 0.88
1.000.93
0.85
0.69
0.540.58 0.68
0
0.2
0.4
0.6
0.8
1
1.2

Market SummaryMarket Summary (Rs In Crore)
Market Cap as on 31st March`17 1788.0
Debt 406.0
Enterprise Value 2176.0
P/E 22.0
EV/EBITDA 7.8
52 Week High 388.0
52 Week Low 143.0
Consistent Dividend track trend
23
Stock Performance
2001 Initial Investment 18000/- invested in 1000 Equity shares
2006 Share Split Share Split 5 share of 2/-each for 1 share of 10/-
2011 Demerger of Real Estate Div
Swap ratio one share in TCI developers for 20 shares in TCI
2016 Demerger of XPS Div Swap Ratio one share in TCI Express for 2 shares in TCI
Dividend Rs 72,825 Market Value of Investment Rs. 22,52,813 Investment given 48% CAGR return by MAR’2017
66%
17%
8%3% 6%
0.2%
Shareholding Pattern as on 31st March 2017
PROMOTORS
INDIAN PUBLIC
FOREIGN HOLDINGS
BODY CORPORATE
MUTUAL FUND
OTHERS
40%
45%
50% 50%
65%
75% 75%
55%
16% 15% 16% 16% 18% 18% 16%12%
0%
15%
30%
45%
60%
75%
FY10 FY11 FY12 FY 13 FY14 FY15 FY16 FY17
Dividend Ratio Dividend Payout Ratio

Growth Drivers
• Warehousing • Consumption driven sector like FMCG, Retail , Auto etc.• E-Commerce• Digital Transformation
Cost Drivers• Economies of scale• Operational efficiency key to maintain cost control• Receivables management• Technology adoption
Macro Drivers
• Economic reforms, Implementation of GST and infrastructure• Investment: Logistics sector to be in higher trajectory.• Ambitious Capex and expansion plans in current fiscal
24
Future Outlook
