transparency and coherence in a doctoral study case
TRANSCRIPT

The Qualitative Report The Qualitative Report
Volume 24 Number 3 How To Article 4
3-3-2019
Transparency and Coherence in a Doctoral Study Case Analysis: Transparency and Coherence in a Doctoral Study Case Analysis:
Reflecting on the Use of NVivo within a 'Framework' Approach Reflecting on the Use of NVivo within a 'Framework' Approach
Marjorie Bonello University of Malta, [email protected]
Ben Meehan B.M. QDATRAINING Ltd, [email protected]
Follow this and additional works at: https://nsuworks.nova.edu/tqr
Part of the Higher Education Commons, Life Sciences Commons, and the Quantitative, Qualitative,
Comparative, and Historical Methodologies Commons
Recommended APA Citation Recommended APA Citation Bonello, M., & Meehan, B. (2019). Transparency and Coherence in a Doctoral Study Case Analysis: Reflecting on the Use of NVivo within a 'Framework' Approach. The Qualitative Report, 24(3), 483-498. https://doi.org/10.46743/2160-3715/2019.3823
This How To Article is brought to you for free and open access by the The Qualitative Report at NSUWorks. It has been accepted for inclusion in The Qualitative Report by an authorized administrator of NSUWorks. For more information, please contact [email protected].

Transparency and Coherence in a Doctoral Study Case Analysis: Reflecting on the Transparency and Coherence in a Doctoral Study Case Analysis: Reflecting on the Use of NVivo within a 'Framework' Approach Use of NVivo within a 'Framework' Approach
Abstract Abstract This article describes and reflects on the analytical process undertaken on a qualitative case study analysis exploring the concept of interprofessional education (IPE) in Malta. The analysis which employed the ‘Framework’ approach executed by qualitative data analysis (QDAS) software, specifically NVivo, served to produce an audit trail eliciting how the data, findings, interpretations and subsequent conclusions were all tracked and grounded in the raw data. This paper offers a reflective account of my experience in using NVivo highlighting the potential of this software as facilitating a more rigorous and transparent approach to qualitative data analysis.
Keywords Keywords Framework, QSR * NVivo, Qualitative Case Study, Interprofessional Education, Transparency, Rigour
Creative Commons License Creative Commons License
This work is licensed under a Creative Commons Attribution-Noncommercial-Share Alike 4.0 International License.
This how to article is available in The Qualitative Report: https://nsuworks.nova.edu/tqr/vol24/iss3/4

The Qualitative Report 2019 Volume 24, Number 3, How To Article 1, 483-498
Transparency and Coherence in a Doctoral Study Case Analysis:
Reflecting on the Use of NVivo within a ‘Framework’ Approach
Marjorie Bonello University of Malta, Msida, Malta
Ben Meehan QDA TRAINING Ltd, Dublin, Ireland
This article describes and reflects on the analytical process undertaken on a
qualitative case study analysis exploring the concept of interprofessional
education (IPE) in Malta. The analysis which employed the ‘Framework’
approach executed by qualitative data analysis (QDAS) software, specifically
NVivo, served to produce an audit trail eliciting how the data, findings,
interpretations and subsequent conclusions were all tracked and grounded in
the raw data. This paper offers a reflective account of my experience in using
NVivo highlighting the potential of this software as facilitating a more rigorous
and transparent approach to qualitative data analysis. Keywords: Framework,
QSR * NVivo, Qualitative Case Study, Interprofessional Education,
Transparency, Rigour
Introduction
“The ultimate excitement and terror of a qualitative project is that you can’t know at the start
where you will end” (Richards, 2009, p. 133).
There is much debate surrounding qualitative data analysis software (QDAS) and the
novice researcher is often left bereft and perplexed trying to make sense of it all. It is not the
scope of this paper to go into these debates; suffice to say that on one hand it has been hailed
as invaluable to qualitative data analysis for managing and organising data, querying data,
graphically modelling ideas built from data and reporting from data (Bazeley, 2007; Côté,
Salmela, Baria, & Russell, 1993). On the other hand, it has also been critiqued over
separation/distancing, misrepresentation, mechanisation of the entire data analysis process, and
homogenisation of qualitative approaches to analysis (Bazeley, 2007; Jackson, Paulus, &
Woolf, 2018; Richards & Richards, 1994; Weitzman, 2000). For my master’s degree, I had
used manual methods of analysis, devoting much time to tasks such as cutting, pasting,
mapping and charting. For my doctoral study, I aimed for deeper levels of creative and
reflective analysis combined with rigour and transparency of the entire research process. This
necessitated an extensive electronic audit trail which would ensure that my work would be
dependable—one of the criteria to ensure trustworthiness of qualitative research (Lincoln &
Guba, 1985). The software package NVivo, one of the most popular QDAS, seemed to set the
standard in qualitative data analysis and with its support for ‘Framework’ and personalised
training for my study, I decided to make use of this software package.
This paper starts with a brief overview of the ‘Framework’ approach. It then continues
with a synopsis of the study, explains the methodology used, and is followed by the key stages
of how this approach was executed by NVivo (Versions 9 & 10). It also presents personal
reflections of my experiences in using this software package.

484 The Qualitative Report 2019
‘Framework’ to Synthesise and Interpret Data
The ‘Framework’ Method was developed by Jane Ritchie and Liz Spencer during the
1980’s, from the Qualitative Research Unit at the UK’s largest, independent non-profit research
institute, the National Centre for Social Research (Ritchie & Lewis, 2003). This method
employs a hierarchical thematic framework that is used to classify and organise data according
to key themes, concepts and emergent categories. It identifies a series of main themes
subdivided by a succession of related subtopics and, once deemed to be comprehensive, each
main theme is charted by completing a matrix or table where each case, respondent or
participant has its own row while the columns represent the subtopics. These charts are used to
examine the data for patterns and illustrate the relationships, both by participant and by theme.
‘Framework’ is used by hundreds of researchers in areas such as health research, policy
development, and programme evaluation (Gale, Heath, Cameron, Rashid, & Redwood, 2013);
although it may generate theories, the prime concern of ‘Framework’ is to describe and
interpret what is happening in a particular setting (Ritchie & Spencer, 1994). ‘Framework’ can
also be used for inductive and deductive thematic analysis depending on the research questions
(Gale et al., 2013). My study did not have an a priori theory or hypothesis but anticipated that
meanings would emerge out of the data (Lincoln & Guba, 1985). Hence, the questions required
an inductive approach to data analysis, allowing me as the researcher to explore the context
and to generate themes from open coding of the data.
Focus of the Study
This doctoral study is contextualised at the Faculty of Health Sciences, University of
Malta. It concerns the concept of interprofessional education (IPE) as a possible model of
practice for the education of health care professionals. Interprofessional Education is defined
as “occasions when two or more professions learn with, from and about each other to improve
collaboration and the quality of care” (CAIPE, 2002, p. 1). This study adopts a qualitative case
study approach with the unit of analysis being “IPE at the Faculty of Health Sciences positioned
within the Maltese context.” This faculty is responsible for the education and training of
nursing and allied health professions which at pre-registration level takes place in traditional
educational silos. The specific objectives of the study were to:
explore how academic staff and other stakeholders at the Faculty of Health
Sciences perceive and understand IPE,
explore the perceived barriers and/or enhancers of a possible IPE
undergraduate initiative, and
understand how micro, meso and macro contextual factors could possibly
influence IPE in Malta.
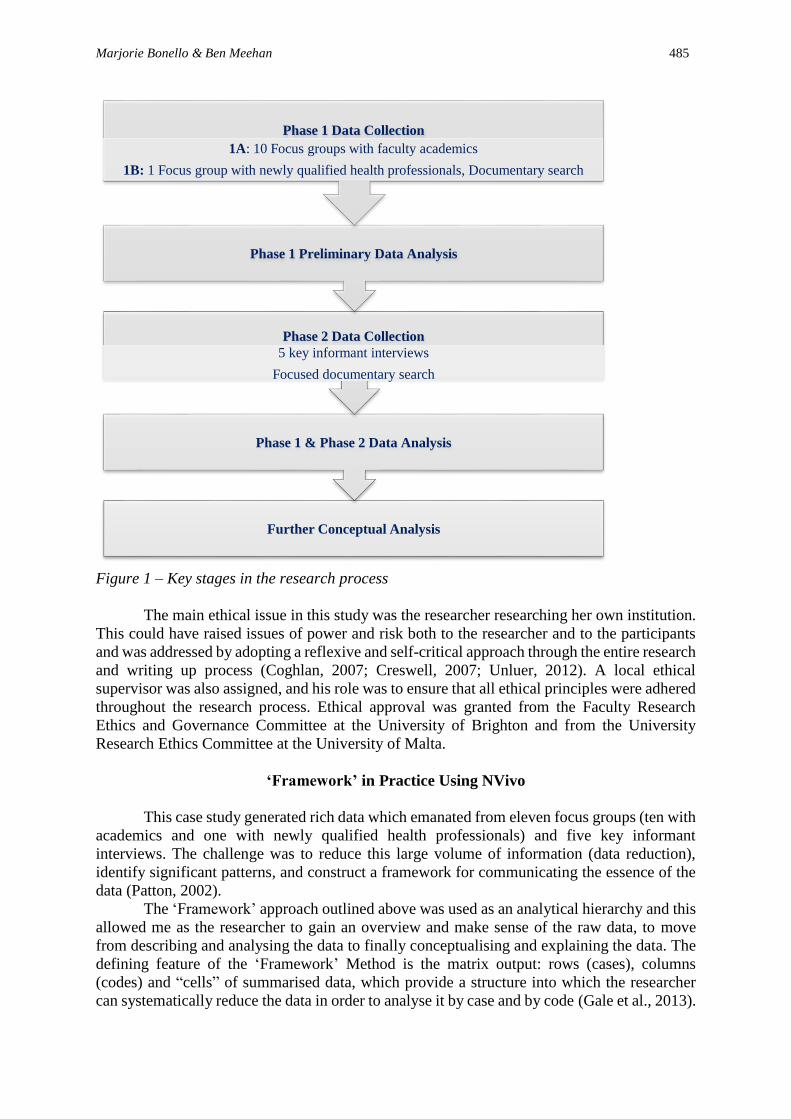
The purposive sample totaled 64 participants and these included academics at the Faculty of
Health Sciences, key informants from the education/health policy sectors, and newly qualified
health professionals. Data was gathered through a combination of focus group discussions,
one-to-one interviews and documentary searches carried out inductively over two phases
(Figure 1).
Marjorie Bonello & Ben Meehan 485
Figure 1 – Key stages in the research process
The main ethical issue in this study was the researcher researching her own institution.
This could have raised issues of power and risk both to the researcher and to the participants
and was addressed by adopting a reflexive and self-critical approach through the entire research
and writing up process (Coghlan, 2007; Creswell, 2007; Unluer, 2012). A local ethical
supervisor was also assigned, and his role was to ensure that all ethical principles were adhered
throughout the research process. Ethical approval was granted from the Faculty Research
Ethics and Governance Committee at the University of Brighton and from the University
Research Ethics Committee at the University of Malta.
‘Framework’ in Practice Using NVivo
This case study generated rich data which emanated from eleven focus groups (ten with
academics and one with newly qualified health professionals) and five key informant
interviews. The challenge was to reduce this large volume of information (data reduction),
identify significant patterns, and construct a framework for communicating the essence of the
data (Patton, 2002).
The ‘Framework’ approach outlined above was used as an analytical hierarchy and this
allowed me as the researcher to gain an overview and make sense of the raw data, to move
from describing and analysing the data to finally conceptualising and explaining the data. The
defining feature of the ‘Framework’ Method is the matrix output: rows (cases), columns
(codes) and “cells” of summarised data, which provide a structure into which the researcher
can systematically reduce the data in order to analyse it by case and by code (Gale et al., 2013).
Further Conceptual Analysis
Phase 1 & Phase 2 Data Analysis
Phase 2 Data Collection
5 key informant interviews
Focused documentary search
Phase 1 Preliminary Data Analysis
Phase 1 Data Collection
1A: 10 Focus groups with faculty academics
1B: 1 Focus group with newly qualified health professionals, Documentary search

486 The Qualitative Report 2019
Analytical
Process
(Ritchie &
Spencer, 1994)
Practical
Application in
NVivo
Strategic Objective Iterative process
throughout analysis
1.
Familiarisation
Stage 1:
Open (free)
Coding
Data Management
(Descriptive)
(Open and hierarchical
free coding of raw data
through NVivo This
process was exploratory,
and participant led.)
Data Interpretation
(Re-ordering, “coding
on” and annotating
through NVivo. This
process involved
interpretation so was
both participant and
researcher led)
Explanatory Accounts –
data abstraction
(Extrapolating deeper
meaning, drafting
summary statements and
analytical memos
through NVivo. This
process moved analysis
from the specific to the
abstract and was
researcher only led)
Assigning data to codes to
capture units of meaning.
(deconstructing data from
original chronology to initial,
non-hierarchal codes).
Reviewing, refining,
merging, renaming distilling
and organising open codes
into broader categories of
codes (reconstructing open
codes to a framework to
address research questions
and aims of the study).
Conceptually mapping and
collapsing categories to a
thematic framework.
Systematically reviewing
thematic framework using
analytical memos
Synthesising analytical
memos to cohere and report
findings
2.
Identifying a
thematic
framework
Stage 2:
Categorisation of
Codes and
Propositional
Statements
3.
Indexing
Stage 3:
Coding on
4.
Charting
Stage 4:
Triangulation
with Key
Informants and
Conceptual
Mapping using
NVivo
5.
Mapping and
interpretation
Stage 5:
Analytical Memos
and Abstraction
of Data
Table 1 – Stages and processes involved in practical application of framework qualitative
analysis. Source: Adapted from Richie & Spencer (1994).

Marjorie Bonello & Ben Meehan 487
The software for conducting this type of analyses was developed by Ritchie and Spencer
through NatCen and known as FrameWork (Ritchie & Lewis, 2003). In 2011, Ritchie and
Spencer decided that their matrices were less effective than those provided by NVivo, a well-
established globally used computer aided QDAS software package developed by QSR
International (QSR International, 1995 - 2019). NatCen thus ceased production of FrameWork
and handed over the production of Framework Matrices to the NVivo developers who have
included Framework Matrices as a feature of NVivo ever since.
I thus used NVivo with its Framework Matrices as a tool to condense large volumes of
data into more manageable quantities. This process required three kinds of activity: data
management, descriptive accounts, and explanatory accounts (Ritchie, Spencer & O’Connor,
2003). This was not a linear process and necessitated going backwards and forwards between
the data and my analytical concepts to reconsider, rework, and refine ideas (Spencer, Ritchie,
O’Connor, Morell, & Ormston, 2014). It also required that I carried out several stages of coding
to ensure a rigorous analytical method.
Table 1 shows how the five key stages outlined in ‘Framework’ were applied with
NVivo stages of analysis to build knowledge out of the data. Each stage will be described in
more detail in the sections to follow.
Familiarisation
At this stage, I familiarised myself with the data gathered from Phase 1 (focus groups
with faculty academics and focus group with newly qualified health professionals) by reading
the transcripts, the observational/field notes, and listening to the audio-tapes innumerable
times. I immersed myself in the overall discourse, slowly becoming aware of recurrent themes
and ideas. I also started to compile my database in NVivo by importing the demographic details
of all the participants (so as to track the contribution to source), the transcripts of the eleven
focus groups, and my reflection notes on each focus group (Figure 2).
Figure 2 – Cases link Participants’ words to their demographic and profiling information
NVivo had the potential to link these sources, thus facilitating quick retrieval and
contextualisation of cases. Cases in NVivo represent units of analysis and observation. They
also support in-case and cross-case analysis, a key element of framework analysis. In this study
people were units of analysis so a case node was created in NVivo for each person containing
their entire commentary from focus groups or interviews, linked in turn to their demographics
and profiling information. Linking qualitative and quantitative information at unit level (a
person being the unit in this study) is important for analysis as it facilitates cross referencing
of attitudes, beliefs, and behaviors coded to thematic nodes with profiling and demographic

488 The Qualitative Report 2019
information stored against participants. Framework matrices allow for consideration of voice
and perspective distribution across inductively coded themes.
At this early phase, I started preliminary exploratory coding. A code refers to a broad
descriptive category or to a more interpretative or analytical concept (Richards, 2009). In this
first stage, coding involved broad-brush or open coding giving rise to free codes. Free codes
are free in that they are non-hierarchical and not bound by the research question but allow for
emergent themes to arise organically out of the data. In NVivo language, codes are also referred
to as “nodes,” providing storage areas for references to coded text (Bazeley, 2007).
Identifying a Thematic Framework
This was the stage in which I started to recognise recurrent themes and ideas arising
from the data, and I started thinking about these themes in a more abstract way. It was a cyclical
process of listing key ideas, making notes, going back to the sources, and repeating the process
over and over again. Being an inductive process, I was mindful that in vivo nodes needed to be
derived directly from the data (Strauss, 1987).
As an interpretative researcher, I also made use of the “constant comparative method”
(Maykut & Morehouse, 1994, p. 126). This is a nonlinear and iterative process in which each
new “unit of meaning” or text segment selected for analysis was compared to all other units of
meaning and categorised and coded with similar nodes. This process allowed me to compare
data looking for similarities and/or differences eventually emerging with the essence of the
data (through themes). I also wrote annotations and electronically attached them to the relevant
documents.
Annotations play an important role in qualitative data analysis as everything is time and
context bound (Miles & Huberman, 1994). Thus, tools that capture and integrate contextual
factors are important as they represent a core value philosophically underpinning the qualitative
paradigm. Annotations were used to capture, field notes and observations, coding assumptions
and researcher’s thoughts and ideas. These annotations were my own comments, reminders
and/or reflections on the text which captured my thinking at that moment in time, reminding
me of particular observation/s. Figure 3 is an example of such an annotation.
Figure 3 – Example of an annotation in NVivo
By this stage, I had finished the preliminary coding of the ten transcripts and ended up
with a substantial number of free nodes. This involved lifting the data from its original textual
context (transcripts) and placing it in these free nodes which were largely descriptive, broad,

Marjorie Bonello & Ben Meehan 489
participant-driven, and stand-alone categories (units of meaning) with no evident relationships
or connections to each other. Due to the subjective nature of this process, each free node was
defined and detailed with a descriptive “rule of inclusion” which was a rule outlining the basis
for including (or excluding) particular text segments (Maykut & Morehouse, 1994). Figure 4
shows this process.
Figure 4 – Initial free coding in NVivo
This process was taken further by writing this “rule of inclusion” as a “propositional
statement” summarising the essence of each code as a “statement of fact the researcher
tentatively proposed, based on the data” (Maykut & Morehouse, 1994, p. 140). My thinking
was shifting from “categorising units of meaning to preparing a statement that reflects the
collective meaning” within each free code (Maykut & Morehouse, 1994, p. 140); this involved
refinement and/or collapsing of free nodes by making numerous assumptions as to the meaning
and significance of the data (Bazeley, 2007; Maykut & Morehouse, 1994). I also started to
identify key issues, concepts and themes from the data, and this signified the emergence of an
early thematic framework. NVivo facilitated this process as I had instant access to read and
cross compare participants’ transcripts.
Indexing
This was the process during which the evolving thematic framework consisting of free
nodes was systematically reviewed. Phases 1 and 2 essentially deconstructed the data from its
original chronology in transcripts to initial non-hierarchical codes. Phase 3, indexing, aimed to
reconstruct the data into a framework that began to make sense in terms of addressing the
research questions and aims of the study (Figure 5).

490 The Qualitative Report 2019
Figure 5 – Example of indexing in NVivo:
The review resulted in some nodes being merged, others being renamed, others being clustered
together into related categories of codes. Gradually, my emerging ideas derived from the data
were being refined (reconstruction of the data) and the flat structured free nodes developed into
a more complex hierarchical structure (tree nodes). Organisational and theoretical patterns
were becoming apparent. Through NVivo, I was checking on my ideas and assumptions by

Marjorie Bonello & Ben Meehan 491
going back and forth between transcripts, audio and observational note sources (Figure 6). This
process reflected my social constructionist epistemology to see how, and in what context
participants were constructing meanings of IPE.
Figure 6 – Example of linking and identifying sources in NVivo
Charting
At the charting stage, data from all participants that had been indexed in the previous
stage (free nodes) were arranged in the appropriate tree nodes with headings and subheadings
(thematic cross-sectional analysis) and situated in the ‘Framework’ matrix. This process
created conceptual order to my coding system. I continued to make use of “propositional
statements” to help me understand the nodes’ contents and refine relationships between them.
This stage of node refinement for all eleven transcripts coincided with the stage of the five key
informant interviews (Phase 2), further reflecting my research approach that each phase would
build on the preceding one. This stage was also one in which a picture of the data as a whole
was starting to emerge.
Once all five key informant interviews had been conducted and transcribed, the stages
of familiarisation, identifying a thematic framework and indexing outlined above could be
similarly carried out on this data set. Although this was a new data set, I started off by coding
on the free codes which I had drawn up for Phase 1A and Phase 1B adding on new codes as
required. I did this because there were many common issues, albeit raised by the different
stakeholder groups (at this stage, the key informants). When this process was completed (which
by then encompassed both the focus group transcripts and key informant interviews), all free
nodes were rechecked for their content, rules for inclusion and re-organised into a re-structured
tree node hierarchy (or in ‘Framework’ terminology, charts). This was a messy stage of
analysis extracted from triangulation of all data and methods, and one which consolidated and
reduced the data. Divergent views were captured, challenging my ideas of emergent patterns.
This stage of ‘Framework’ involved placing the indexed coded data into a grid or
matrix. Figure 7 shows an example of Ritchie and Spencer’s (1994) ‘Framework’ Grid in
NVivo. The purpose of the grid is to reduce data to manageable proportions by writing in-case
and cross case summaries. The first column contains the Case ID and relevant
demographics/profiling information whilst each subsequent column is a theme. Each row
contains the themes from phase 3 “Indexing.” Clicking into any cell for the case “AI” shown
in figure 7 reveals all coded content for A1’s case coded at that theme on the right of the grid.
I then wrote summaries for each theme coded for case “A1” and then systematically
synthesised content for each participant, theme by theme, by writing overall summaries or
memos about each theme into the grid. Reading each row across offered a summarised view of
each case, while reading each column down, offered a summarised view of each indexed theme.

492 The Qualitative Report 2019
This process helped me move beyond what was said in the transcripts (factual descriptions) to
deeper aspects of the discourses (interpretative analysis) (Bazeley, 2007).
Figure 7 – Example of Ritchie & Spencer’s ‘Framework’ Grid in NVivo as applied to my data
Mapping and Interpretation
This stage involved analysis of the key issues as laid out in the charts. It was an iterative,
intuitive, and creative process in which I tried to interpret the data set as a whole “searching
for a structure rather than a multiplicity of evidence” (Ritchie & Spencer, 1994, p. 186). This
phase was dominated by long periods of working deeply and sensitively with the data so as to
try and identify patterns in the data which were at a deeper level than participants’ spoken
discourses. It was only by going through this process that I could understand how “textual level
of work” was interlinked to “conceptual level work” (Richards & Richards, 1994, p. 448). The
former refers to data management methods, such as “code and retrieve” methods to identify
key concepts and map the phenomena, whilst the latter refers to higher order abstraction during
which evidence and arguments are brought to the fore (Richards & Richards, 1994). There were
no hard distinctions between these levels and Richard and Richard’s (1994) explanation of how
conceptualisation takes place, albeit dated, is worthy of note.
And so the web-of code, explore, relate, study the text-grows, resulting in little
explorations, little tests, little ideas hardly worth calling theory but need to be
hung as wholes ... Together they link together with other theories and make the
story, the understanding of the text. The strength of this growing interpretation
lies to a considerable extent in the fine grain size and tight interknittedness of
all these steps: and the job of qualitative data handling (and software) is to help
in the development of such growing interpretations. (Richards & Richards,
1994, p. 448)
Using NVivo at this stage involved going through the data, propositional statements and
memos, verifying whether each node was a true representation of participants’ discourses, so
as to eventually work towards synthesis. This “bottom-up” approach ensured that all the nodes
created in previous stages reflected higher order themes. NVivo has a number of tools that
facilitate this process whilst at the same time providing a comprehensive audit trail of decision-

Marjorie Bonello & Ben Meehan 493
making processes; one of these is writing memos (or thick descriptions) at node level linked to
the conceptual hierarchies and this is illustrated in Figures 8 and 9.
Figure 8 – Example of conceptual hierarchies to aid mapping and interpretation
Figure 9 – Example of an analytical memo linked to coded content
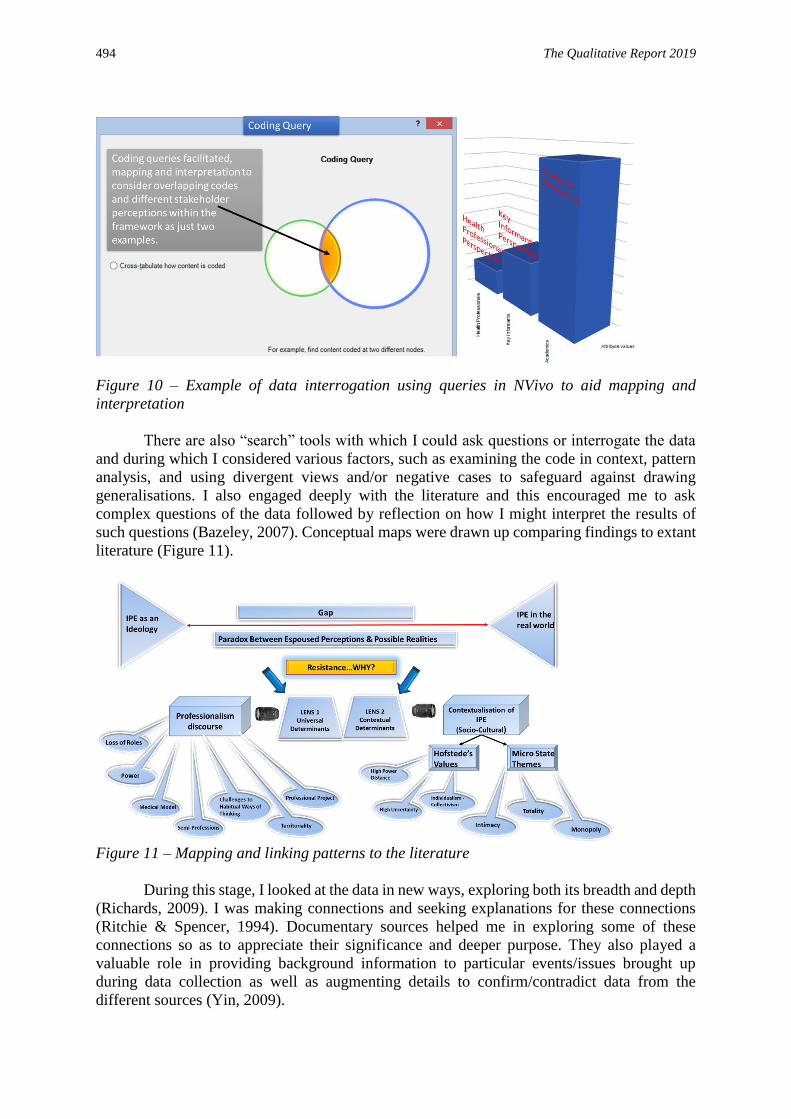
Other NVivo tools such as “visualisations” aided mapping and interpretation as they
allowed for consideration of perspectives within themes (Figure 10).
494 The Qualitative Report 2019
Figure 10 – Example of data interrogation using queries in NVivo to aid mapping and
interpretation
There are also “search” tools with which I could ask questions or interrogate the data
and during which I considered various factors, such as examining the code in context, pattern
analysis, and using divergent views and/or negative cases to safeguard against drawing
generalisations. I also engaged deeply with the literature and this encouraged me to ask
complex questions of the data followed by reflection on how I might interpret the results of
such questions (Bazeley, 2007). Conceptual maps were drawn up comparing findings to extant
literature (Figure 11).
Figure 11 – Mapping and linking patterns to the literature
During this stage, I looked at the data in new ways, exploring both its breadth and depth
(Richards, 2009). I was making connections and seeking explanations for these connections
(Ritchie & Spencer, 1994). Documentary sources helped me in exploring some of these
connections so as to appreciate their significance and deeper purpose. They also played a
valuable role in providing background information to particular events/issues brought up
during data collection as well as augmenting details to confirm/contradict data from the
different sources (Yin, 2009).

Marjorie Bonello & Ben Meehan 495
During this mapping and interpretation stage, I wrote analytical memos (conceptual
synthesis of my findings) for higher order themes and used concept maps and NVivo models
to help me go further with my ideas and arguments and to identify the overriding core themes
and patterns which permeated the data. As my thoughts progressed and my ideas gradually
shifted, my initial concepts were reinterpreted, and I developed different ways how to make
sense of patterns and relationships in the data. With stages of deeper thinking, synthesis, and
revisiting the data with new perspectives, I became confident in knowing which were consistent
issues and patterns in the data and which/ were not. Eventually, I felt I was “above the noise of
the data” (Richards, 2009, p. 143) and was able to see the “bigger picture” (Richards, 2009, p.
173). In so doing, I could present coherent findings and tentative interpretations of the meaning
of those findings for possible IPE in Malta (Figure 12).
Figure 12 – Example of a conceptual map of findings
Reflections on Using NVivo
While thinking about and working with the data, I often asked myself how my analysis
could have been different if I had not used NVivo. Although this remains a hypothetical
question, I believe that using this software improved the rigour and quality of my research
which would not have been possible with a manual process of data analysis. The programme
supported my analysis by enabling me to drive my data through a complex, systematic and
iterative data interrogation process (Bazeley, 2007). The software programme never takes over
the cerebral and intensive process of data analysis; it is merely a tool for making the analysis
process more robust, efficient and transparent.
Critics of NVivo argue that using NVivo could potentially fragment the data and thus
alienate the researcher from the data. Another argument is that the researcher tends to become
too immersed in the data making it difficult to appreciate the bigger picture (Bazeley, 2007). I
would argue that the closeness and distance of the data could equally be compromised by the
use of basic word processing software, other than NVivo, which is commonplace in data

496 The Qualitative Report 2019
analysis. During the entire data analysis process, I felt close to the data as, with a simple mouse
click, I could have an overview of the data, as well as read and hear participants’ excerpts in
context. There was also a continual connection and visibility between the original data and the
classification taking place. In the later stages of the analysis, I continued using NVivo to
confirm and/or question my interpretations in preparation for further synthesis. Eventually, the
closeness to the data became more abstract and distant, enabling me to see the findings from a
broader perspective. My experience reflected current thinking where closeness is required for
familiarity, distance is required for abstraction and synthesis, and the ability to switch between
the two perspectives is recommended (Bazeley, 2007).
Using NVivo software provided me with an audit trail which is visual evidence of the
processes employed during data analysis, such as coding, managing codes through various
iterations, annotation, and memoing content, as well as mapping concepts and themes
developed during analysis. This audit trail provides a transparent account of the use of QDAS
and shows how my analytical strategy was entirely consistent with the philosophical
underpinnings of my methodology and its practical application.
I also question how my emerging core themes might have been different had I not used
NVivo as an analytical tool. Within my relativist ontological position, I could certainly never,
nor would ever wish to claim that my analysis of the data is the only true interpretation that
may be offered. However, although the breadth and depth of my analysis could have been
carried out using a manual method, the thoroughness might have been less. For example, using
this software allowed me to question my data comprehensively which meant that whilst
focusing on the overall picture, I also had access to the various levels of my analysis, right
down to the particular context of participants’ discourses. This simultaneous viewing of the
bigger picture and the more intimate and deep one allowed me to pursue ideas emerging from
the data forming the basis of my conceptual and analytical ideas, which were, in turn, guided
by the research questions. Furthermore, since I did not base my coding on frequency of phrases
in the texts but rather on content and contextualisation of content, it is fair to say that my
conceptual coding would have been similar had I used a manual method of data analysis.
As with all other computer technologies, NVivo needed to be learnt by doing. The fact
that I was motivated and learnt how to use it during the initial stages of my data collection
meant that I achieved a familiarity and a sense of “naturalness” with the software. Moreover,
the availability of ongoing personalised NVivo support meant that I was able to discuss the
iterative data analysis process with knowledgeable experts.
Conclusion
This paper has presented an account of my data analysis using Ritchie and Spencer’s
(1994) hierarchical ‘Framework’ approach. I have shown how the use of NVivo software
facilitated systematic data handling and contributed to a more rigorous and transparent analysis.
Analysing my data was more than just identifying themes; it was a process of “contextualising
and making connections between those themes to build a coherent argument supported by data”
(Bazeley, 2009, p. 21). This ultimately gave me an intimate sense of what was going on in my
data slowly working towards synthesis of this data.

Marjorie Bonello & Ben Meehan 497
References
Bazeley, P. (2007). Qualitative data analysis with NVivo. London, UK: SAGE.
Bazeley, P. (2009). Analysing qualitative data: More than ‘identifying themes’. Malaysian
Journal of Qualitative Research, 2(2), 6-22.
Centre for the Advancement of Interprofessional Education (CAIPE). (2002). Interprofessional
education - A definition. London, UK: CAIPE. Retrieved 30th January 2010, 2010 from
http://caipe.org.uk/resources/defining-ipe
Coghlan, D. (2007). Insider action research: Opportunities and challenges. Management
Research News, 30(5), 335-343.
Côté, J., Salmela, J. H., Baria, A., & Russell, S. J. (1993). Organizing and interpreting
unstructured qualitative data. The Sport Psychologist, 7(2), 127-137.
Creswell, J. W. (2007). Qualitative inquiry & research design: Choosing among five
approaches. Thousand Oaks, CA: Sage Publications, Inc.
Gale, N. K., Heath, G., Cameron, E., Rashid, S., & Redwood, S. (2013). Using the framework
method for the analysis of qualitative data in multi-disciplinary. BMC Medical
Research Methodology, 13(117), 1-8.
Jackson, K., Paulus, T., & Woolf, N. H. (2018). The Walking Dead genealogy: Unsubstantiated
criticisms of Qualitative Data Analysis Software (QDAS) and the failure to put them to
rest. The Qualitative Report, 23(13), 74-91. Retrieved from
https://nsuworks.nova.edu/tqr/vol23/iss13/6
Lincoln, Y. S., & Guba, E. G. (1985). Naturalistic inquiry. Thousand Oaks, CA: Sage
Publications.
Maykut, P., & Morehouse, R. (1994). Beginning qualitative research: A philosophic and
practical guide. London, UK: The Falmer Press.
Miles, M., & Huberman, A. (1994). Qualitative data analysis: An expanded source book (2nd
ed.). Thousand Oakes, CA: Sage
Patton, M. Q. (2002). Qualitative research and evaluation methods. Thousand Oaks, CA: Sage
Publications, Inc.
Richards, L. (2009). Handling qualitative data: A practical guide (2nd ed.). London, UK: Sage
Publications.
Richards, T., & Richards, L. (1994). Using computers in qualitative research. In N. K. Denzin,
& Y.S. Lincoln, (Eds.), Handbook of qualitative research (pp. 445-462). Thousand
Oaks, CA: Sage Pub.
Ritchie, J., & Lewis, J. (2003). Qualitative research practice: A guide for social science
students and researchers. London, UK: Sage.
Ritchie, J., & Spencer, L. (1994). Qualitative data analysis for applied policy research. In A.
Bryman, & R. G. Burges, (Eds.), Analysing qualitative data (pp. 173-194). London,
UK: Routledge.
Ritchie, J., Spencer, L., & O’Connor, W. (2003). Carrying out qualitative analysis. In J. Ritchie,
& J. Lewis. (Eds.), Qualitative research practice: A guide for social science students
and researchers (pp. 219-262). London, UK: Sage.
Spencer, L., Ritchie, J., O’Connor, W., Morell, G. & Ormston, R. (2014). Analysis in practice.
In J. Ritchie, J. Lewis, C. McNaughton Nicholls & R. Ormston (Eds.), Qualitative
research practice: A guide for social science students and researchers (2nd ed., pp. 295-
343). London, UK: Sage
Strauss, A. L. (1987). Qualitative analysis for social scientists. Cambridge, U.K.: Cambridge
Unluer, S. (2012). Being an insider researcher while conducting case study research. The
Qualitative Report, 17(29), 1-14. Retrieved from
https://nsuworks.nova.edu/tqr/vol17/iss29/2

498 The Qualitative Report 2019
Weitzman, E. A. (2000). Software and qualitative research. In N. K. Denzin & Y. S. Lincoln
(Eds.), Handbook of qualitative research (pp. 803-820). London, UK: Sage
Yin, R. K. (2009). Case study research: Design and methods. Thousand Oaks, CA: Sage
Publications.
Author Note
Dr. Marjorie Bonello is Head, Department of Occupational Therapy, Faculty of Health
Sciences, University of Malta. Her research interests focus on interprofessional education,
practice based learning, qualitative methodologies and health policies in small state systems.
Correspondence regarding this article can be addressed directly to:
Ben Meehan is as an independent trainer and consultant in support of computer aided
qualitative data projects (CAQDAS). A graduate of the Irish Management Institute and Dublin
Business School he is also a member of the part-time staff in Trinity College Dublin, NUI
Galway, NUI Maynooth and Dublin City University. He is a QSR certified platinum trainer
and consultant and has worked in all of the major universities and Institutes of Technology in
Ireland and Northern Ireland. He regularly conducts workshops across Europe, the US and
Australia. Correspondence regarding this article can be addressed directly to:
Copyright 2019: Marjorie Bonello, Ben Meehan, and Nova Southeastern University.
Article Citation
Bonello, M., & Meehan, B. (2019). Transparency and coherence in a doctoral case study
analysis: Reflecting on the use of NVivo within a ‘Framework’ approach. The
Qualitative Report, 24(3), 483-498. Retrieved from
https://nsuworks.nova.edu/tqr/vol24/iss3/4