transmitting 4,000 mw of new windpower from north dakota
TRANSCRIPT

FINAL REVIEW DRAFT: 28 Sept 02
Transmitting 4,000 MW of New Windpower from North Dakota to Chicago:
New HVDC Electric Lines or Hydrogen Pipeline DRAFT REPORT: 28 Sept 02 Rev
Prepared by: Geoffrey Keith
Synapse Energy Economics 22 Pearl Street, Cambridge, MA 02139 www.synapse-energy.com 617-661-3248
and William Leighty The Leighty Foundation Box 20993, Juneau, AK 99802 [email protected] 907-586-1426 Prepared for consideration by: Environmental Law and Policy Center 35 East Wacker Dr., #1300, Chicago, IL 60601 www.elpc.org 312-673-6500 January, 2002 Supported by grants from The Energy Foundation and The Leighty Foundation. This report reflects the views of the authors and not necessarily the views of Environmental Law and Policy Center.
1

FINAL REVIEW DRAFT: 28 Sept 02
Table of Contents Executive Summary.......................................................................................................... 4
1. Introduction................................................................................................................. 8 1.1 Methodology................................................................................................... 15
2. Pipeline vs. Electric Lines – Cost Model................................................................. 18 2.1 Wind Generation Costs ................................................................................... 18
2.2 Pipeline Costs.................................................................................................. 18
2.3 HVDC Costs ................................................................................................... 19
3. Pipeline vs. Electric Lines – Profit Model............................................................... 22 3.1 Wind and Market Price Data........................................................................... 22
3.2 Pipeline Revenues........................................................................................... 24
3.3 HVDC Revenues............................................................................................. 26
4. Results ........................................................................................................................ 26 4.1 Delivering Electricity to Chicago ................................................................... 27
4.2 Delivering Hydrogen to Chicago .................................................................... 31
4.3 Assessing the Projects without the PTC ......................................................... 33
4.4 Assessing the Projects With Lower Wind Generator Capital Costs ............... 35
4.5 The Cost of Electricity from Distributed Generation Using Hydrogen from These Projects ................................................................................................. 37
5. The Hydro Firming Opportunity ............................................................................ 41 5.1 Key Issues ....................................................................................................... 41
5.2 Firming Possibilities in North Dakota ............................................................ 43
5.3 Additional Analysis......................................................................................... 45
6. Summary of Findings ................................................................................................. 47
7. Other Considerations................................................................................................ 48 7.1 Energy Security............................................................................................... 48
7.2 Biomass Synergy ............................................................................................ 48
7.3 Coal Synergy................................................................................................... 48
7.4 Carbon Taxes and Internalizing Other Externalities....................................... 49
7.5 International Collaboration ............................................................................. 49
2

FINAL REVIEW DRAFT: 28 Sept 02
7.6 Define “Renewables-Hydrogen Economy” .................................................... 49
8. Recommended Future Work ................................................................................... 50 8.1 National Hydrogen Transmission Test Facility (NHTTF)............................. 51
8.2 Modeling and Research.................................................................................. 53
9. References.................................................................................................................. 57
Appendix A: Total Project Costs with Wind at $950 and $700 per kW*................. 62
Appendix B. Cost Assumptions for Distributed Generation ..................................... 63
Appendix C: Energy Conversion Factors for Hydrogen............................................ 64
Appendix D: Flowcharts: Generation - Transmission Systems................................. 65 D.1. Electricity Transmission
D.2. Hydrogen Transmission
3

FINAL REVIEW DRAFT: 28 Sept 02
Figure 1-A. Assumed location of large North Dakota windplant, transmission corridor to Chicago, and optional Manitoba Hydro HVDC interconnect at the
Dorsey Substation, near Winnipeg
xecutive Summary might profitably collect and transmit, at large scale,
the vast, stranded renewable resources of the Great Plains to distant load center markets.
its entire energy
T)
E We studied how the energy industry
We focused on windpower, mindful of its potential synergy with other energy sources. This energy might displace fossil and nuclear generation on the electricity grid, or might also be largely used to fuel vehicles, as electricity or as hydrogen.
We assumed a single 4,000 Megawatt (MW) generating capacity (nameplate; peak) windplant, on about 350 square miles in North Dakota, delivering output to Chicago, as wholesale electricity or as gaseous hydrogen (GH2), via two alternative transmission systems: HVDC electric lines, or hydrogen pipeline. See Figure 1-A. This 4,000 MW wind energy generation, conversion, transmission (GCmodule is large enough to:
4

FINAL REVIEW DRAFT: 28 Sept 02
a. Fully achieve economies of scale in manufacturing and installing both generation and transmission equipment;
b. Serve as a planning module, for modeling much larger systems, to approach harvesting the entire Great Plains potential of windpower, and perhaps other renewables.
However, 4,000 MW represents less than 2 per cent of North Dakota’s wind energy potential.
We assumed technology and cost improvements likely in year 2010; all modeling is done in $US 2001.
Figure 1-B. Left powerline: The Pacific Direct Current Intertie (PDCI), near Bishop, CA. HVDC, 3,000 MW, +/- 500 kv bipole, 846 miles from Celilo, at The Dalles Dam, OR to Sylmar (NW Los Angeles, CA). Commissioned in 1970 as 1,500 MW line. The right powerline is conventional high voltage AC.
FINDINGS
We find from our Excel cost and profit-loss models that large-scale wind energy, generated in North Dakota and transmitted to a single delivery point in Chicago, via dedicated conversion-transmission system(s), will cost:
1. Delivered as electricity About $ .06 / kWh via HVDC transmission; competitive with generation by a
new combined cycle combustion turbine (CCCT) if natural gas price is $4.30 - 5.30 per mmBtu.
About $ .14 - .18 / kWh via GH2 pipeline transmission, including conversion from electricity to GH2 in North Dakota and from GH2 back to electricity in Chicago.
5
FINAL REVIEW DRAFT: 28 Sept 02
2. Delivered as GH2
About $ .06 - .08 / kWh via GH2 pipeline transmission, including conversion from electricity to GH2 in North Dakota;
Competitive with GH2 made in Chicago from natural gas via steam methane reformation (SMR), a mature and widely-used industrial process, if natural gas price is about $ 11.50 - 19.00 per mmBtu.
We also find:
1. Only one GCT case to be profitable, i.e. where revenues exceed costs, for delivering wholesale electricity in Chicago: HVDC transmission under these optimistic assumptions:
a. Federal production tax credit (PTC) of ~ $ 0.017 / kWh; b. Wind generator total installed capital cost is $ 700 / kW c. Lines for both 2,000 MW HVDC systems are on a single set of towers, on
one ROW; d. Chicago hourly wholesale electricity prices in 2010 are double the 1999
prices. 2. Energy storage in the GH2 pipeline is worth over $100 million per year because
Chicago electricity generation may be always on-peak. Consequently, we should investigate large-scale geologic storage along the pipeline route, to add more value via seasonal-scale GH2 storage.
3. Implications for optimum collection and transmission of all the diverse, diffuse, dispersed, renewable energy resources from the Great Plains to distant markets:
a. seasonal synergy, for harvest, stockpiling, and dispatch; b. sharing transmission to improve its CF, thus project profitability.
We also find that low conversion-transmission system CF is a very large economic burden on delivered North Dakota wind energy because our study assumes that:
1. All conversion and transmission systems are exclusively dedicated to the windplant;
2. Peak capacity rating of the conversion and transmission components equals windplant peak generating capacity; the GCT module is not transmission-limited; wind generation is never deliberately curtailed;
3. The long-term average CF of the wind generators is 40%, reflecting the unusually-energetic North Dakota resource;
4. All collection, conversion, and transmission system components operate at the same CF as the windplant:
a. In the HVDC scenario: AC-DC, DC-AC converters, and transmission line. b. In the GH2 scenario: primarily electrolyzers and compressors, because the
pipelines can be “packed”, for storage.
This low conversion-transmission system CF is a powerful incentive to share transmission with other energy sources-- other renewables and perhaps “really clean coal”, i.e. requiring complete capture and use or sequestration of carbon (C) and carbon
6

FINAL REVIEW DRAFT: 28 Sept 02
dioxide (CO2). We also considered interfacing the 4,000 MW windpower GCT module with two Great Plains hydro systems, WAPA and MH1, to “firm” windpower and improve transmission CF.
We suppose that GH2 pipeline transmission may offer important advantages over electric transmission, but only if a large number of circumstances favorable to GH2 are simultaneously satisfied, as discussed in “Prospects for GH2 Pipelines”, below.
This is a modest beginning study of a large and complex system optimization problem. We present a long list of recommended future technical and economic study, which is justified by the very large, potentially-synergistic, stranded renewable energy resources of the Great Plains.
Figure 1-C. Exporting 20% of North Dakota’s wind energy to Iowa would replace all of Iowa’s present energy sources, and would require 24 new HVDC electric transmission lines of largest-available size, replacing all Iowa’s present energy sources. Graphic by Thomas A. Wind, Wind Utility Consulting, Jefferson, IA.
All of Iowa’s
ElectricityNatural
Gas Petroleum
New +/- 500 kv HVDC ----electric lines
1 Western Area Power Administration (WAPA) embraces the Missouri River system; Manitoba Hydro
(MH) embraces Nelson River and others in Canada, and is a major exporter to USA.
7

FINAL REVIEW DRAFT: 28 Sept 02
1. Introduction Repowering The Midwest, released Feb 01 by Environmental Law and Policy Center of the Midwest proposes 24,500 MW of new wind generation in the ten Midwestern states by year 2020.2 However, despite significant cost reductions in wind generating equipment, with wind energy the lowest-cost renewable energy source, most of this energy is “stranded” for lack of available transmission capacity to bring it to markets in distant load centers.
Five Great Plains states have a combined available, harvestable, average annual wind energy potential of over 5,000 Twh. 3 4 5 North Dakota’s estimated annual wind energy potential, alone, is over 1,200 TWh. For comparison, total USA electric energy consumption in year 2000 was about 3,500 TWh. Exportable Great Plains biomass will significantly increase the total annual renewable energy potential.
At 40 per cent windplant capacity factor (CF), over 300,000 Megawatts (MW) of peak (nameplate) installed windplant generating capacity would be required in North Dakota, to fully harvest this single state’s wind resource. The largest practical long-distance electric transmission line is likely to remain a high voltage direct current (HVDC) line of about 3,000 MW capacity. Thus, about 100 large, new HVDC electric transmission lines would be necessary to export just North Dakota’s wind energy; about 400 new electric lines to export the wind energy from the five windiest Great Plains states.
HVDC lines are generally more compact than HVAC lines. See Figure 1-B. However, routing, siting, and permitting these 400 new electric lines through many “back yards” will be costly, in dollars, permitting delays, and lasting public nuisance. See Figure 1-C, for an example.
Large, new gaseous hydrogen (GH2) pipelines, might offer greater long-term benefit - cost ratio than large, new HVDC electric lines. Installed underground, like natural gas pipelines, GH2 pipelines might be more acceptable to the public, easier to route and permit, and offer greater security from damage or attack.
A 36”-diameter GH2 pipeline, operating at 1,000 psi, has a continuous energy transmission capacity of about 6,000 MW, and the important benefit of energy storage capacity of about 120 GWh.
2 See reference 1: Environmental Law and Policy Center, Chicago, 2001. Repowering The Midwest: The
Clean Energy Development Plan for the Heartland, released February 14, 2001. 3 North Dakota, South Dakota, Kansas, Montana, Texas. See references 3, 4. About half the land area of
each state has been withdrawn from the estimated wind resource base as unavailable or unsuitable: urban, airports, highways, water bodies, etc.
4 These wind resource assessments are currently being revised by the National Renewable Energy Laboratory (NREL), continuously, as new state wind resource maps become available; an interim report to EIA, USDOE, is expected by Mar 03. A work-in-process; format of a new report, if any, TBD. (personal communication, Sept 02)
5 TWh = 1 billion kWh. Total electric energy consumption in USA, in year 2000, was about 3,500 TWh.
8

FINAL REVIEW DRAFT: 28 Sept 02
Thus, instead of 400 new electric lines, 200 new GH2 pipelines would be needed to export the available wind energy from the five windiest Great Plains states. The key question remains: do we intend to deliver North Dakota wind energy to Chicago as electricity or as GH2?
The extant electric transmission system will accommodate only a very small fraction of the Great Plains wind resource. Although significant wind energy from North Dakota and other Great Plains states can be delivered by expanding and upgrading the existing electricity grid, bringing the far larger portion of this available wind resource to markets will require large, new, costly transmission systems. In some cases, this electricity grid expansion will be socially and politically very difficult: public opposition, regulatory processes, and vested interests. Several groups are studying, or advocating for, this grid expansion.6
The full cost of this new transmission must be included in the price for each kWh of wind energy delivered to end users, making wind energy delivered to Chicago very expensive, unless:
1. That new transmission is shared with other energy sources, to improve its capacity factor (CF) above the 40 percent expected for the best windpower plants, and / or
2. Transmission is undersized and windpower production is intentionally curtailed during long periods of high wind energy, to optimize return on investment for the complete GT system.
See Figures A and B: GCT system block diagrams, for the GCT scenarios we studied. See Figure 1-A, the assumed location of the GCT module.
Salient Assumptions 1. Capital equipment technology and costs likely for year 2010:
a. Windplant total installed capital cost at both $950 / kW and $700 / kW (nameplate);
b. Electrolyzers at both $300 and $200 per kWe (kW electrical input). 2. $ US 2001, without inflation adjustment; 3. 4,000 MW (nameplate) wind generating capacity in a single North Dakota
windplant, to achieve the economies of scale expected for the GCT scenarios analyzed;
4. Simple capital recovery factor (CRF) rather than discounted cash flows, for cost and profitability models;
5. Transmission systems are dedicated exclusively to the windplant, and operating at the same CF, assumed to be 40 per cent;
6 Wind On The Wires, www.windonthewires.org; American Wind Energy Association, www.awea.org;
Western Area Power Administration, www.wapa.gov; Midwest Independent System Operator, www.midwestiso.org; National Electric Reliability Council, www.nerc.com; National Wind Coordinating Committee, [email protected], and others. ABB has been commissioned to study North Dakota transmission expansion.
9

FINAL REVIEW DRAFT: 28 Sept 02
6. Revenue from wholesale electricity sales in Chicago is modeled on: a. Actual hourly production from the extant Chandler, MN windplant; b. Corresponding actual hourly wholesale electricity prices in 1999, in the
Chicago market; c. Doubling the prices in (b), to estimate year 2010 prices, for the model
calculations. 7. Profitability is calculated both with and without the extant federal production tax
credit (PTC) for wind generation, now about $ .017 / kWh; 8. By year 2010, a market for GH2 will emerge in Chicago to completely consume
the GCT system output, in the several GH2 transmission scenario cases; 9. In the GH2 transmission scenario, in all cases, the oxygen byproduct of
electrolysis, at the North Dakota windplant, is sold to a presumed adjacent coal gasification plant at $19.17 / ton.
Approach Our study developed:
1. Cost and income Excel models, for nine transmission scenarios, with results calculated for year 2010 construction; we used simple capital recovery factor (CRF) rather than discounted cash flows
2. An extensive list of recommended future study and R+D that must be done before we consider design, finance, and build of high-capacity, long-distance, compressed-gas pipelines designed for transmitting and storing hydrogen from wind and other renewable sources, and perhaps also from “really clean” gasified coal;
3. An initial assessment of the potential for “firming” windpower with hydropower by energy interchange with nearby Western Area Power Administration (WAPA) and Manitoba Hydro (MH) systems.
4. The value of carbon emission taxes that would be required for each case to break even with the cost of electricity from new natural gas fired combined cycle combustion turbines (CCCT);
5. In the GH2 scenarios: a. Selling the oxygen (O2) byproduct of hydrogen production to future
“really clean” coal gasification plants, adjacent to the windplant, to improve project profitability;
b. Seasonal-scale GH2 storage, probably in subterranean geologic formations or numerous, dispersed, manmade structures or vessels, as proposed by Dr. Bent Sorensen, Denmark7, and discussed by W. Amos, NREL8;
7 “Handling Fluctuating Renewable Energy Production by Hydrogen Scenarios”, Prof Bent Sorensen,
Roskilde Univ, Denmark, in Reference 73, http://mmf.ruc.dk/energy/ 8 Reference 72.
10

FINAL REVIEW DRAFT: 28 Sept 02
However, we did not consider, nor include in our economic analysis:
1. Estimating how much extant electricity transmission right-of-way (ROW) capacity can be increased, at “no net increase in perceived or actual public nuisance or danger”; at what cost;
2. Cost and topological optimization of infrastructure for energy gathering, at the North Dakota source, and for energy distribution in Chicago;
3. Estimating size and timing of markets for GH2 fuel in Chicago, for distributed generation of electricity (DG) and / or for vehicles;
4. Discounted cash flows: we used simple capital recovery factor (CRF) for the cost model, which drove the profitability model;
5. Effects of Title IX Energy, in the 2002 Farm Bill; 6. Many other cases based on different sets of assumptions
Prospects for GH2 Pipelines The anticipated “renewables-hydrogen economy” features collection and transmission of large, diverse, dispersed, diffuse renewable energy sources, such as windpower, as pipelined GH2.
The salient differences between HVDC electric and GH2 pipeline transmission:
1. Energy storage: “packing” gas pipelines, by crowding more molecules into the pipe by increasing pipeline pressure, is commonly used in the natural gas transmission industry. Packing the 36” GH2 pipeline, assumed in several cases is this study, to 1,000 psi (~70 bar), then drawing down the pressure to 500 psi, provides ~ 120 GWh of storage: 2 days’ supply at constant 2,500 MW drawdown.
2. Overhead vs. underground location: HVDC electric lines are usually, and most economically, located on towers or poles aboveground. HVDC can be transmitted for an unlimited distance underground or underwater, but at about ten times the cost of overhead. Gas pipelines are usually, and most economically, located underground, with consequent advantages of less aesthetic impact and increased protection from damage or attack.
Although we show, above, that GH2 transmission is economically unattractive, GH2 transmission might expedite large, new transmission capacity for multiple stranded Great Plains renewables, by avoiding the thicket of electricity transmission regulation via FERC, RTO’s, ISO’s, other established electricity industry interests, and permitting jurisdictions. However, energy pipelines are also subject to FERC and other regulation and permitting.
Properly built and well-maintained, steel pipelines have long service lives. Perhaps the energy industry should consider building all new natural gas transmission lines of “hydrogen-capable” line pipe. Then, as the methane is depleted, these pipelines can carry a “Hythane” mixture, increasingly enriched by GH2 from various sources, and eventually 100% GH2.
11

FINAL REVIEW DRAFT: 28 Sept 02
GH2 transmission may provide a larger long-term market for Great Plains wind than electric transmission IF several, or most, of the following occur:
1. A large market emerges for pure GH2 for fuel cell fuel, for transportation-- buses, cars, aircraft-- and for DG (distributed generation) of electricity-- especially in CHP (combined heat and power) installations; thus, wind energy is delivered as hydrogen gas to new terminals and load centers;
2. If wind-generated GH2 can compete in cost and market price, with GH2 from natural gas and gasified coal.
3. Electric transmission upgrade and expansion proves extremely difficult and costly because of public opposition and ROW acquisition cost;
4. GH2 transmission in underground pipelines is more acceptable to the public than overhead electric transmission;
5. ROW access and cost is favorable for H2 transmission in high-capacity, long-distance underground pipelines;
6. We learn, and demonstrate, how to build high-capacity, long-distance, underground, GH2 pipelines operating at variable pressure (at several-day time scale; at 2:1 pressure range). See "NHTTF", Section 8 of report. Hydrogen pipelines have been operated safely for decades, in North America and in Europe, by industrial gas and oil-and-gas companies, but generally are:
a. Confined to established industrial plants and corridors; b. Operating at constant pressure, avoiding hydrogen embrittlement from
cyclic fatigue, from varying pressure; c. Among relatively few acceptance and delivery points, or nodes.
7. Electrolyzers with high-pressure (> 1,000 psi) output, high-efficiency (> 90%), TICC (total installed capital cost) < $250 / kWe input, and low O+M cost (< $0.001 / kWh), in MW-scale modules, become commercially available by about year 2010;
8. GH2 can be stored, at low cost, in very large (seasonal) quantity in either or both: d. Underground geological formations along the H2 pipeline route; natural
gas (NG, primarily methane, CH4) is widely stored underground, but the H2 molecule is far smaller and may leak away;
e. Distributed, in storage vessels aboard vehicles and at stationary sites. 9. Windpower-biomass synergy develops to embrace:
f. Seasonal counter-availability; g. Stockpiling and dispatching generation, on several-day to seasonal time
scale; h. Ease of "distributed collection" from various sizes of biomass-to-hydrogen
plants, at frequent intervals along the H2 pipeline route; a delivery node to an H2 pipeline would be simple and inexpensive, relative to HVDC access, and amenable to a wide range of capacity, probably 100 kW to 1,000 MW:
i. A boss on the mainline pipe;
ii. Shutoff valve (manual and automatic); iii. Delivered-gas quality monitoring and auto-shutoff system; iv. Meter;
12

FINAL REVIEW DRAFT: 28 Sept 02
v. Compressor, if required. 10. Synergy with coal, via "zero emissions" (which shall mean including C and / or
CO2 capture and permanent sequestration) coal gasification plants, develops so that:
i. Coal gasification plus water-shift reaction is a major source of H2 for commingling and pipeline transmission with wind-source H2;
j. The oxygen (O2) byproduct of wind-generated hydrogen, via electrolysis of water, is sold to adjacent coal-gasification plants.
11. Natural gas (NG) price is $15 - 20 / mmBtu, without carbon-emission taxes (C-taxes);
12. C-taxes are applied, raising the effective prices of all fossil fuels; 13. A distribution network for pure H2 is in place at the major markets likely to be
candidate destinations for GH2 transmission pipelines; 14. The “Hindenberg” effect, i.e. public apprehension about the safety of GH2
transmission and utilization, is allayed. Since the world now has no GH2 pipeline systems, designed for collecting and transmitting energy at large scale from remote, diverse, dispersed, diffuse renewable energy sources, we will need a pilot-scale facility if we anticipate the convergence of multiple favorable factors, above. See “National Hydrogen Transmission Test Facility (NHTTF)”, later in this report.
Conclusion This is a modest beginning study of a large and complex system optimization problem. We present a long list of recommended future technical and economic study, which is justified by the very large, potentially-synergistic, stranded renewable energy resources of the Great Plains.
Perhaps neither HVDC nor GH2 transmission is adequate to the task, and we will need to wait for a higher-capacity mode such as the “continental supergrid”, a combination of superconducting (SC) electric and liquid hydrogen transmission, as proposed by EPRI.9 However, superconductive electric transmission may not be suitable for windpower, because of its time-varying power output at daily, even hourly scale; SC transmission has difficulty with changing current rapidly.
System Configurations: Block Diagrams See system flowcharts and block diagrams in Appendix D; two simplified diagrams, Figures A and B, for the two principal scenarios investigated, appear below. See extensive technical discussion of “The Transfer of Electrical Energy to the Supply Grid”, Chapter 4 of S. Heier.10
9 References 61, 62, 63. 10 See reference 71.
13

FINAL REVIEW DRAFT: 28 Sept 02
Figure A. Simplified “Electrical Transmission” Scenario
CollectionSystem
AC to HVDCConverter
Station
HVDC to ACConverter
Station
"STIFF"AC grid End users
WindGenerators
WindGenerators
1,000 miles+ / - 500 kv HVDC
North Dakota Chicago
Figure B. Simplified “Hydrogen Transmission” scenario, delivering electricity in Chicago
Electrolyzers Compressors GeneratorsICE, CT, FC
AC grid
End users
WindGenerators
WindGenerators
1,000 milesHydrogen Gas Pipeline
36" diameter~ 1,000 psi
Storage: 120 GWhat 1000 - 500 psi
Wholesale
Retail
We model the costs and revenues of three of these options; the hydro storage of wind energy we examine only conceptually. The first option listed above is especially attractive because the energy can be stored in the hydrogen pipeline for electricity generation during peak periods. The fourth option is attractive because DG and ground and air transportation in the Chicago area, both public and private, represent a very large potential future market for hydrogen fuel.
14

FINAL REVIEW DRAFT: 28 Sept 02
This project updates and expands an earlier paper comparing the provision of electricity to Chicago via a hydrogen pipeline versus electric transmission lines.11 To expand this work we have collected additional information on pipeline and HVDC costs, considered the value of several benefits of the hydrogen pipeline scenario, and researched the viability of hydro storage of wind energy in the region. Important additional benefits of the hydrogen transmission scenarios we explore here are:
• The energy storage value of the pipeline, and • The sale of byproduct oxygen from electrolyzers to coal-gasification plants.
Other potential benefits of hydrogen pipeline transmission not treated in this study are:
• Relative security of underground pipeline versus overhead wires; • Greater public acceptance and lower cost permitting of a pipeline versus overhead
high voltage power lines; • Lower cost right-of-way (ROW) purchase or lease; • Delivering hydrogen fuel to distributed generation, to displace retail-value
electricity; • Distributed collection, from various hydrogen sources along the route; and • Sharing the transmission system with plants generating hydrogen from coal, while
selling valuable electrolysis-byproduct oxygen to those coal plants.12
See section 8, Recommended Future Work, for further discussion of these issues.
1.1 Methodology To compare the economics of the 4,000 MW-scale pipeline and HVDC transmission scenarios, we constructed two spreadsheet models, one for costs and the other for profit/ loss. With these models we explored nine different scenarios for delivering wholesale electricity to Chicago: six scenarios including a hydrogen pipeline and three with HVDC power lines. All scenarios are assumed to be the year 2010, and we assume technology cost reductions (from current costs) based on this assumption. The pipeline scenarios are based upon:
1. A 1000-mile, 36-inch pipeline with low-pressure electrolyzers and separate compressors;
11 See reference 2: Gibbs and Biewald, Transmitting Windpower from the Dakotas to Chicago: A
Preliminary Analysis of a Hydrogen Transmission Scenario, prepared in conjunction with “Repowering the Midwest…” for Environmental Law and Policy Center, Chicago, Illinois, September 8, 2000. Available at: www.synapse-energy.com.
12 For “zero-emissions” concepts, for coal and other carbon fuels, see: www.netl.doe.gov/scng/news/pdf/NGTworkshops.pdf, www.cleanenergysystems.com/WhatsNew/CorpUpdate.html, www.llnl.gov/llnl/06news/NewsReleases/2001/NR-01-05-11.html, www.llnl.gov/str/June01/Cooper.html, www.zest.org, and www.zeca.org.
15

FINAL REVIEW DRAFT: 28 Sept 02
2. A 1000-mile, 36-inch pipeline with high pressure (1,000 psi output) electrolyzers and no external compression; and
3. A 1000-mile, 18-inch pipeline with high pressure (1,000 psi output) electrolyzers and no external compression.13
Each of these pipeline scenarios is explored with two types of hydrogen-fueled electricity generation in Chicago (yielding the six scenarios):
1. A solid oxide fuel cell (SOFC) with a gas turbine operating on byproduct heat, and
2. A combined cycle combustion turbine (CCCT).
The HVDC scenarios developed for modeling purposes are:
1. Two full HVDC systems, including lines and converters, 2,000 MW each, installed on two sets of towers;
2. The same two systems installed on one set of towers; and 3. The same two systems installed on one set of towers, with the final 100
miles into Chicago installed underground.
The cost model is a simple summation of capital and operating costs collected from an array of literature and industry sources. Detailed information on scenario costs appears in Chapter 2. The revenue model is more complex. We model wind generation using actual hourly wind generation data for an entire year (1999) for both pipeline and HVDC scenarios. Based on the pipeline diameters in the different scenarios (and pressure limitations), we calculate pipeline storage capacity. To calculate revenues from electricity sales in Chicago, we use adjusted 1999 hourly marginal price information from the Commonwealth Edison system.14
To model the sale of electricity, we developed a heuristic to maximize revenues, taking into consideration: (a) pipeline pressure, (b) current and day-ahead electricity prices, and (c) a fixed generating capacity of 2,300 MW in Chicago.15 We assumed electricity was sold into wholesale markets in Chicago.16 The storage capacity of the pipeline allows 13 Note that both pipelines and HVDC systems can simply be paralleled and proliferated to achieve the
desired regional transmission capacity; this may strongly affect pipeline size, transmission economics and transmission mode choice.
14 Because electricity markets in Chicago are not yet fully deregulated, we adjust this price data to simulate competitive market prices. These adjustments are described in Chapter 3.
15 Note that this generating capacity limit is on equipment in Chicago, generating electricity from hydrogen – not on wind generating capacity in North Dakota. The 2,300-MW limit was selected based on iterative model runs to maximize revenue. The figure 2,300 seems a reasonable amount of capacity to service a 4,000 MW windfarm operating at an average 40 percent capacity factor with storage capability. However we have not attempted to optimize the amount of fuel cell or combustion turbine capacity in Chicago taking into account the cost of that capacity.
16 We assumed this because a large energy generating and delivery system such as the one envisioned would be developed by a wholesale energy company (or companies), not by a retail user who could displace the cost of retail electricity. To gauge the cost of delivering Dakotas windpower to distributed generators in Chicago, see our cost estimates for hydrogen-only delivery to Chicago.
16

FINAL REVIEW DRAFT: 28 Sept 02
some portion of total kWhs to be stored from their actual generation hour to higher priced hours. In the HVDC scenarios, there is no energy storage; all electricity generated is sold instantaneously at the current hourly price.
In addition to these scenarios for electricity delivery, we assess the costs of delivering hydrogen gas to Chicago via the pipeline, as fuel for surface vehicles, aircraft, and DG. For this, we simply subtract the cost of electricity generating infrastructure in Chicago and calculate the delivered cost of hydrogen in each of the hydrogen scenarios. We compare this cost to the cost of generating hydrogen in Chicago via steam methane reformation (SMR) of natural gas, to determine the breakeven price for natural gas.
Annual revenues for each scenario are calculated by summing revenues in each hour of the year. Total annual costs are subtracted from total revenues to calculate an annual profit or loss for each scenario.
Our review of potential storage of wind energy in large hydro systems was limited to information collection from staff at two large Midwestern hydro systems: the Western Area Power Administration (WAPA) in the U.S. and Manitoba Hydro (MH) in Canada. We were prevented by time and budget constraints from modeling hydro storage scenarios.
17

FINAL REVIEW DRAFT: 28 Sept 02
2. Pipeline vs. Electric Lines – Cost Model Our cost assumptions for each component of the wind generation, the hydrogen pipeline scenarios and the HVDC electricity scenarios are set forth in the table below, based on projected year 2010 installed capital costs. All costs are in 2001 US dollars.
Table 1. Capital Cost Assumptions for System Components Component Unit Cost
Wind generators $950 and $700 per kW* Electrolyzers $200 – 300 per kW HVDC converters, PCC, per pair $130 per kW HVDC transmission lines, 2 GW $400,000 per mile HVDC underground cable, 4 GW $7.3 million per mile Hybrid Fuel Cell Systems $1,000 per kW Combined-Cycle Combustion Turbines $450 per kW
*We calculate total costs for systems assuming both $700 and $950 per kW for wind generators.
2.1 Wind Generation Costs We assume 4,000 MW of wind generating capacity spread across an area of approximately 400 square miles in central North Dakota. We assume an average capacity factor of 40 percent for these generators, resulting in annual generation of approximately 14 million MWh (14 TWh) in an average year.
Our primary cost assumption for the capital cost of wind generators is a total installed cost of $950 per kW, with operating and maintenance (O&M) costs of $0.008 per kWh.17 Total annual costs of wind generation using these figures are $567 million. We do not expect this figure to decrease significantly during the period 2001 to 2010.18 However, to explore a case in which wind costs do decline significantly, we also calculate total system costs assuming wind turbine total installed capital costs of $700 per kW.
2.2 Pipeline Costs There is much uncertainty about the cost of hydrogen pipelines. Currently, no hydrogen pipeline of the scale and purpose envisioned here exists; we found no recent research or design studies. Although industrial gas companies and oil and gas companies have safely and profitably operated hydrogen pipelines for decades, they are not optimized for large-scale, long-distance, renewable-source energy collection and transmission, nor for energy storage. We have constructed these costs estimates from literature (much of it from 1970’s and 1980’s), through discussions with experts in the gas pipeline industries, and hydrogen researchers.19 Costs are presented here, and performance and revenue modeling is presented in Chapter 3.
17 See reference 6: Malcolm and Hansen, Results from the WindPACT Rotor Design Study, presented at
Windpower 2001, Washington, DC, June, 2001. 18 Personal communication with D.J. Malcolm, November 2001. 19 See references 8 - 33 and 46 - 49.
18
FINAL REVIEW DRAFT: 28 Sept 02
The best source of “benchmark” cost data is the new Alliance Pipeline, running from northeast British Columbia to Chicago, which began service on December 1, 2000.20 This 36-inch natural gas pipeline, 3,200 kilometers in length, operates at a pressure of 1,740 psi. Its capacity is 1.5 billion cubic feet per day (Bcfd). Total capital cost, including gas gathering laterals, compressors and valves, meters and terminals, was $US 3.3 billion. We inferred that 1,600 km of this line (1,000 miles) would have cost $ 1.5 billion, to which we applied a 1.4 multiplier for the expected increased cost of a hydrogen-service pipeline of the same diameter, as approximated by Ogden, and others.21 This 1.4 multiplier is an important assumption, which needs additional analysis. (See section 8, Recommended Future Work.)
Costs for each of the six pipeline scenarios, for delivering wholesale electricity in Chicago, are shown in Table 2. The first two scenarios include a 36-inch pipeline and the third includes an 18-inch line. The names of scenarios are made up of three pieces of information: pipeline diameter (“36” or “18”), the presence or absence of a compression system external to the electrolyzers (“C” or “NC”) and the hydrogen-to-electricity generating technology: fuel cell (“FC”) or combined-cycle gas turbine (“CT”). These names, with brief scenario descriptions, are shown in Table 2.
In the “NC” scenarios, $200 million is deleted from the all-inclusive cost of the pipeline, to back out the capital cost of compressors.
2.3 HVDC Costs The second option we explore for transmitting Dakotas wind energy to Chicago is new HVDC power lines. Costs, benefits, and performance are from current public-domain studies, vendor literature and engineers, and researchers.22 HVDC lines are much better suited to long distance, high capacity (1,000 MW and greater) electricity transmission than the ubiquitous high voltage alternating current (HVAC) power lines because:
• Energy losses over long distance are lower with DC lines; • DC lines are inherently controllable and stable; they have no reactive power; • Energy directional flow can be controlled, avoiding “power loops” on the grid; • The converter stations can supply reactive power support to the HVAC grid; and • Transmission line towers are smaller and less-obtrusive; less costly; require
smaller ROW.
20 See reference 32. 21 See references 24 - 28. 22 See references 35 - 40.
19

FINAL REVIEW DRAFT: 28 Sept 02
Table 2. Assumed Costs of Hydrogen Pipeline Scenarios ($ million) Scenario Capital Cost Annual Cap. Cost Annual O&M Cost Total Annual Cost
36-C-FC (36" pipeline; low-pressure electrolysis with compression; 70% efficient SOFC fuel cells) Wind Generators $3,800 $494 $112 $606 Pipeline $2,300 $299 $35 $334 Electrolyzers $1,200 $156 $36 $192 Fuel Cells $2,300 $299 $42 $341 Compressors (in pipeline) (in pipeline) $37 $37 Total $9,600 $1,248 $262 $1,510 36-C-CT (36" pipeline; low-pressure electrolysis with compression; 60% efficient CC gas turbine) Wind Generators $3,800 $494 $112 $606 Pipeline $2,300 $299 $35 $334 Electrolyzers $1,200 $156 $36 $192 CCCTs $1,035 $135 $27 $162 Compressors (in pipeline) (in pipeline) $37 $37
Total $8,335 $1,084 $248 $1,331 36-NC-FC (36" Pipeline; high-pressure electrolysis; 70% efficient SOFC fuel cells) Wind Generators $3,800 $494 $112 $606 Pipeline $2,100 $273 $35 $308 Electrolyzers $1,200 $156 $36 $192 Fuel Cells $2,300 $299 $42 $341 Compressors $0 $0 $0 $0 Total $9,400 $1,222 $225 $1,447 36-NC-CT (36" Pipeline; high-pressure electrolysis; 60% efficient CC gas turbine) Wind Generators $3,800 $494 $112 $606 Pipeline $2,100 $273 $35 $308 Electrolyzers $1,200 $156 $36 $192 CCCTs $1,035 $135 $36 $171 Compressors $0 $0 $0 $0 Total $8,135 $1,058 $219 $1,277 18-NC-FC (18" Pipeline; high-pressure electrolysis; 70% efficient SOFC fuel cells) Wind Generators $3,800 $494 $112 $606 Pipeline $800 $104 $35 $139 Electrolyzers $800 $104 $36 $140 Fuel Cells $2,300 $299 $44 $343 Compressors $0 $0 $0 $0 Total $7,700 $1,001 $227 $1,228 18-NC-CT (18" Pipeline; high-pressure electrolysis; 60% efficient CC gas turbine) Wind Generators $3,800 $494 $112 $606 Pipeline $800 $104 $35 $139 Electrolyzers $800 $104 $36 $140 CCCTs $1,035 $135 $38 $172 Compressors $0 $0 $0 $0 Total $6,435 $837 $221 $1,058
20

FINAL REVIEW DRAFT: 28 Sept 02
HVDC systems require a costly converter terminal at each end of the line, but the DC lines are less costly than HVAC lines and suffer much lower losses. Thus, HVDC and HVAC system total cost, the sum of long-term capital and O&M costs, are equal at a “break-even distance” of about 400 to 600 miles. HVDC can also be transmitted long distances in underground or undersea cables, at no more loss than in overhead lines. Underground or undersea HVAC transmission losses become severe at more than about 10 to 30 miles. The contemplated transmission of 4,000 MW over 1,000 miles clearly favors the economics of HVDC over HVAC, with the added advantages of the other issues listed above.
Assessing the cost of HVDC lines is challenging at this time, because so few HVDC systems have been built, and because the state and economics of the art are rapidly improving.
We have costed and modeled three HVDC scenarios, named “HVDC-A” through “HVDC-C,” as shown in Table 3 below. Again, costs are presented here, and performance and revenue modeling is presented in Chapter 3. All four scenarios assume two HVDC circuits and four power converter stations (one at each end of each circuit). In scenario HVDC-A the two circuits are mounted on separate sets of towers; in HVDC-B, the two circuits are installed on one set of towers. Less land is required for the ROW in HVDC-B, thus capital costs are lower. Maintenance costs are also lower for HVDC-B. Converter station costs are the same for both HVDC-A and HVDC-B.
In the HVDC-C scenario we assume that the final 100 miles of the transmission system is installed underground, because of line siting challenges in suburban Chicago areas. Permitting new overhead electric lines is increasingly difficult, costly, and time-consuming, especially in congested urban and suburban areas, where ROW cost is also very high. Installing cables underground may not forestall public opposition, but it is a reasonable option to consider if the HVDC lines are to be built. We assume, in HVDC-C, that both circuits are installed on one set of towers and that the final 100 miles are underground. The addition of the underground segment increases construction costs (included in capital costs) and reduces maintenance costs in this scenario relative to the non-underground scenarios. The costs for each of the HVDC scenarios are shown in Table 3 below. Annual capital costs are calculated using a 13-percent annual capital recovery factor.
Underground cables require only 20 to 50 feet of ROW width, while overhead lines require 150 to 200 feet. The O&M cost for underground cable is lower, as underground lines are relatively immune to weather and other hazards. However, underground cable costs four to eight times as much as overhead lines, installed (see figures in Table 3); this cost gap will close somewhat as new cable manufacturing processes (extruded solid polymer dielectric) become popular.
The present practical limit, and likely future limit, of HVDC underground cable system capacity is about 1,000 MW per circuit, at +/- 500 kV. Thus, four complete HVDC cable pairs are required: eight cables in a single trench. Each cable is about six inches in diameter and weighs about 20 pounds per foot.
21

FINAL REVIEW DRAFT: 28 Sept 02
Table 3. Assumed Costs of HVDC Scenarios ($ million) Capital Cost Annual Cap. Cost Annual O&M Cost Total Annual Cost
HVDC-A (two sets of towers) Wind generators $3,800 $494 $112 $606 Lines $936 $122 $9 $131 Converters $520 $68 $10 $78 Total $5,256 $683 $132 $815 HVDC-B (one set of towers) Wind generators $3,800 $494 $112 $606 Lines $568 $74 $6 $80 Converters $520 $68 $10 $78 Total $4,888 $635 $128 $764 HVDC-C (one set of towers; underground final 100 miles) Wind generators $3,800 $494 $112 $606 Lines $1,211 $157 $6 $163 Converters $520 $68 $10 $78 Total $5,531 $719 $128 $847
3. Pipeline vs. Electric Lines – Profit Model To calculate projected revenues and profit or loss, from each scenario, we developed an hourly energy production and sales model.23 Key data elements in the model are a year’s hourly wind data and wholesale market price data, for the year 1999. In addition, the model includes assumptions about the performance of each pipeline and HVDC system. The model’s wind and market price data are described in section 3.1. Treatment of the pipeline and HVDC systems is described in sections 3.2 and 3.3.
3.1 Wind and Market Price Data The wind data in the model is based on actual output data from a 100 MW windplant in Chandler, Minnesota. We have adjusted these data in two ways to simulate wind production from a 4,000 MW project in North Dakota. First, we have smoothed fluctuations in plant output slightly to account for the much larger land area of the Dakota project. This is based on the idea that, as land area increases, wind output becomes less variable. This is because wind activity will be considerably different across a 400 square mile area. Also, as a given weather system moves across a wind facility, it causes turbines at the facility to peak at different times.24 The larger the facility, the more the energy of the wind is distributed in time, smoothing fluctuations in plant output.25
23 See references 53 - 57. 24 For an analysis of these dynamics, see: R. Hudson, B. Kirby and Y. Wan, The Impact of Wind
Generation on System Regulation Requirements, Oak Ridge National Laboratory, Oak Ridge, TN. 25 See reference 51: G. Czisch and B. Ernst, ISET, in Proceedings of Windpower 2001, American Wind
Energy Association (AWEA), Washington, DC, June 4-7, 2001
22

FINAL REVIEW DRAFT: 28 Sept 02
Figure 2. Rolling Average Smoothing of Wind Data
0%10%20%30%40%50%60%70%80%90%
100%
020
040
060
080
010
0012
0014
0016
0018
0020
0022
00
Hour
Cap
acity
Fac
tor
Hourly CF
Rolling Avg.
o adjust the Chandler, MN data to represent a very large wind facility, we applied a ve-hour rolling average to the hourly capacity factor of the windplant. Thus, each ourly capacity factor for the hypothetical Dakota project is the average of five Chandler
data points. Figure 2 illustrates the effect of this adjustment on the Chandler data for a presentative day.
he second adjustment we made was to increase the annual average capacity factor of the indplant from the actual average at Chandler, MN (36.2 percent) to 40 percent expected r the more energetic North Dakota wind resource, for year 2010 wind generators.26 o increase the annual average capacity factor to 40 percent, we simply multiplied each ourly capacity factor by a factor of 1.105.
o develop a set of hourly wholesale prices for the Chicago area, we began with the 1999 ourly marginal costs from the Commonwealth Edison system in Chicago. Market-based
wholesale electricity prices were not published for this region in 1999 (though we expect at a market with published prices will emerge there in the coming years). Thus, we
ave adjusted these hourly marginal costs in two ways, making sure that the result was onsistent with projections for prices in competitive electricity markets in the Chicago
Tfih
re
TwfoTh
Th
thhcarea in 2010:
26 Lessons Learned in the DOE-EPRI Wind Turbine Verification Program (TVP), EPRI, McGowin et al,
2001, p 8
23

FINAL REVIEW DRAFT: 28 Sept 02
Increased the volatility of the Commonwealth Edison marginal costs to be consistent with volatility seen in competitive markets in New England and the Pennsylvania/New Jersey/Maryland (PJM) area.27
in competitive electricity markets in the U.S. Statistical analysis of a large
ver, t.
We hav e data in an effort to make actu d Even afrepresereflecte re used incompar
3.2
O&M
” ith a combustion turbine operating on byproduct heat.
verall electrical efficiency is 70 percent. The combustion turbines in the “CT” bined-cycle gas turbines coupled with heat
t a total efficiency of 60 percent. The operating
function to maximize revenues from electricity sales in Chicago taking into consideration
Increased all hourly prices by a factor of two, making the annual average price consistent with the cost of energy from a new CCCT power plant ($38 to $42 per MWh). Several long-term price forecasts, including that of the Department of Energy in its Annual Energy Outlook, use this price as a proxy for long-term prices, based on the theory that long-term prices will reflect the cost of new capacity.28 In addition this average price range is consistent with recent averageprices number of hourly price data sets was beyond the scope of this project, howethis analysis should be performed as one of the next steps building on this repor
e made these adjustments to the hourly wind and prical ata taken from operating systems better simulate the systems we seek to model.
ter these adjustments, we believe that actual wind variability is still well nted in the wind data, and patterns in daily and seasonal price variations are d in the wholesale price data. Most importantly, the same wind and price data a all modeling scenarios, so the adjustments we have made will not affect our isons of scenarios.
Pipeline Revenues The six pipeline scenarios are constructed by altering different components of the pipeline system, including: the pipeline, the electrolyzers and the Chicago generating capacity. In the “36-C” scenarios, we assume a low-pressure electrolyzer and a separate compressor to bring hydrogen to 1,000 psi at pipeline input. Additional capital and costs are put in the cost calculation for the compressor. In the “36-NC” and “18-NC” scenarios, we assume electrolyzers operating at 1,000 psi output, and thus no need for external compression. The fuel cells in the “FC” scenarios are assumed to be “hybridsolid oxide (SOFC) units, wOscenarios are assumed to be large, comrecovery steam generators operating aparameters in each of the three pipeline scenarios are shown in Table 4.
We model pipeline energy storage by allowing pipeline pressure to fluctuate between 500and 1,000 psi. For the 36-inch pipeline, this provides approximately 122 GWhs of energy storage, and for the 18-inch pipeline, just over 30 GWhs. We developed a simple
27 These are two of three fully deregulated power pools currently operating in the U.S. The third is ISO
California, however prices have been much more volatile in this region than we expect them to be in 2010.
28 See: U.S. DOE, Annual Energy Outlook 2001, DOE/EIA-0383(2001), p. 75. Document available at www.eia.doe.gov/oiaf/aeo.
24

FINAL REVIEW DRAFT: 28 Sept 02
(a) pipeline pressure, (b) current and day-ahead prices and (c) a Chicago generating capacity limit of 2,300 MW.29
The use of day-ahead price information is consistent with information available to tradein competitive power markets. In short, the sales function sells as much electricity apossible during higher-priced periods, within the operating constraints of the pipeligenerating capacity. Revenues in every hour of the year are summed to calculate annurevenues. In the “18-NC…” scenarios, we also assume an electrolyzer efficiency of 90percent, to develop a “most optimistic” case for hydrogen transmission.
rs s
ne and al
The 18-inch
ered pipeline may be undersized, unable to continuously transmit 4,000 MW, perhaps requiring wind generation shedding – an economic optimization strategy not considin this report.
Table 4. Operating Parameters of Pipeline Scenarios
Scenario Pipeline Diameter
Storage C
Overall
(inches) (GWhs) Efficiency Efficiency Efficiency 36-C-FC 36 122 85% 70% 59.7% 36-C-CT 36 122 85% 60% 51.3% 36-NC-FC 36 122 85% 70% 59.7% 36-NC-CT 36 122 85% 60% 51.3% 18-NC-FC 18 30 90% 70% 63.0% 18-NC-CT 18 30 90% 60% 54.0%
For our modeling purposes, we include in total revenue figures for all pipeline scenarios,the value of th
apacity Electrolyzer Generator System
e oxygen (O2) byproduct of the electrolytic conversion of the wind energy
ons steam technology (ZEST) nerate hydrogen, in synergy
wi 30 Ba nver ith erts, te this value at $19.17 per ton O red to plant e wi ctro l produce about 3.1 ion tons of byproduct O typical year, worth $60 ion at the coal plant.
to hydrogen. Coal gasification plants, like the zero-emissidesign, would use this oxygen, plus water feedstock, to ge
th wind. sed on co2 delive
sations w the coal
industry exp gate.31 Th
we estimandplant ele lyzers wil
mill 2 in a .1 mill
capability. However we have not attempted to optimize the amount of fuel cell and combustion turbine capacity in Chicago taking into account the cost of that capacity.
30 Alliance Pipeline information package: system maps with receipt and delivery points; System Update, May and Fall, 1997, Winter/Spring and Summer, 1998, Spring, 1999, 1st, 2nd, 3rd and 4th Quarter, 2000,
31 E15236,
29 Note that this generating capacity limit is on equipment in Chicago, generating electricity from hydrogen– not on wind generating capacity in North Dakota. The 2,300-MW limit was selected based on iterative model runs to maximize revenue. The figure 2,300 seems a reasonable amount of capacity to service a 4,000 MW windfarm operating at an average 40 percent capacity factor with storage
Calgary. stimated: Table ES-2, Parsons Corporation (recent) report, courtesy of Gary J. Stiegel, Product Manager, Gasification Technologies, National Energy Technology Laboratory, Pittsburgh, PA [email protected]
25

FINAL REVIEW DRAFT: 28 Sept 02
3.3 HVDC Revenues The three HVDC scenarios are much more similar to each other than the six pipeline scenarios, for delivering wholesale electricity in Chicago. The performance of the HVDC systems is exactly the same – the only difference is cost. Energy losses in the two onverter stations are assumed to total 1.5 percent (two converter stations are required on
es are 0.4 percent per 100 kilometers, or 6.4 percent efficiency is approximately 92 percent.
ted
• In section 4.1 we assume that the pipeline projects deliver electricity to wholesale markets in Chicago. Under this assumption, the costs and revenues of the
s can be compared on equal terms to the HVDC projects. Under as
some electricity is shifted from its time of generation in North Dakota to higher priced hours in Chicago (as described in section 3.2).
nd
• out the federal production tax credit (PTC) of 1.7 cents per kWh for win
•
enerator costs of $950 per kW, to scenarios with wind costs at $700 per kW.
• scenarios in a retail tors
Note that, throughout Chapter 4, all calculations of revenues and profits/losses include the effects of the federal PTC, except in section 4.3, where results are shown without the P
ceach line). Energy losses in the lintotal line loss. Thus, overall system
While the pipeline can store energy, the HVDC system cannot; thus, each kWh generaat the North Dakota windplant is sold, via HVDC transmission, in Chicago, at the current market-clearing price. Revenues in every hour of the year are summed to calculate annual revenues.
4. Results Below, we analyze cost and revenue data from the scenarios assessed in five different ways.
pipeline projectthis assumption, we can also assess the value of energy storage in the pipeline,
• In section 4.2 we assess the cost of delivering hydrogen to the Chicago area via the six pipeline scenarios. In this analysis we ignore the HVDC scenarios acompare pipeline project costs to the cost of hydrogen generated via SMR in the Chicago area. In section 4.3 we assess project costs and revenues with
d energy. In section 4.4 we assess the sensitivity of these results to the assumed cost of wind generation in 2010. We compare our original scenarios, based on total installed wind g
Finally, in section 4.5, we assess the cost of the pipelinecontext by assessing the total cost of electricity from small, distributed generaoperating on pipeline hydrogen.
TC. No calculations of project costs include the PTC; it is viewed as a revenue stream.
26

FINAL REVIEW DRAFT: 28 Sept 02
4.1 The cost of delivering electricity to Chicago in each of the nine scenarios is shown in Figu 3pipelinepipeline scenarios, between roughly 14 and 18 cents per kWh, is well above year 2000
te that here we value the energy conversion losses in each scenario and show them as ual costs of the other components, ords, the wind generation we
The annual revenues for each HVDC and pipeline scenario are shown in Figure 4, below. Note that revenues for all three HVDC scenarios are the same, because wind generation, conversion losses and energy sales are all the same; the only difference among these scenarios is costs (see Table 3). The HVDC scenarios provide the highest revenues of any scenario. This is primarily because energy losses are much higher in the pipeline scenarios due to the conversion of energy from electricity to hydrogen and back. Overall efficiency is 92 percent in the HVDC scenarios, and it ranges from 51 to 63 percent in the
Delivering Electricity to Chicago
re . A further breakout of costs appears in Table 2, above. Electricity from the scenarios is extremely expensive. The wholesale cost of electricity from the
average retail rates in Chicago (8.8 cents per kWh).32 The HVDC scenarios, all around six cents per kWh, are much less costly, but still well above wholesale market prices during most hours of the year in the Chicago area.
Nocosts in each bar. We do this in order to show the actsuch as wind generation and transmission. (In other wmodel costs an average of 4.32 cents per kW when costs are spread across all kWhs generated, not across kWhs delivered to Chicago.)
Figure 3. Cost of Delivered Electricity in Pipeline and HVDC Scenarios
18
20
0
2
4
6
8
36-C-FC 36-C-CT 36-NC-FC 36-NC-CT 18-NC-FC 18-NC-CT HVDC-A HVDC-B HVDC-C
Cen
t
10
12
14
16
s pe
r kW
h
Wind Gen. Cost Transmission Cost Conversion Losses Chicago Gen. Costs
32 Wholesale electricity prices include only the cost of power generation. Retail prices also include the cost
of transmission and distribution and other utility costs.
27

FINAL REVIEW DRAFT: 28 Sept 02
pipeline scenarios. Figure 4 illustrates the portion of revenues coming from e ic
$0
$100
$200
$300
$400
$500
$600
$700
$800
HVDC 36-C-FC 36-C-CT 36-NC-FC 36-NC-CT 18-NC-FC 18-NC-CT
Milli
on $
200
1
Electricity Oxygen PTC
sales, oxygen sales and the PTC.
Figure 4. Annual Revenues for All Scenarios, including PTC
lectr ity 33
io al number of MWhs sold. In other words, we
Whs sold. The results -NC-
FC to $249 million in both 36-C-CT and 36-NC-CT.
Although the pipelines provide energy storage, and thus greater revenue per MWh, the high capital costs and energy losses of these scenarios are too great a burden. Combining costs with projected revenues shows that none of the projects is profitable. Figure 7 shows the annual losses that would be incurred by each project. With lower project costs and far smaller energy losses, the HVDC scenarios come closer to breaking even than the pipeline scenarios; however our HVDC scenarios would also post annual losses.
However, revenue per MWh of electricity sold is higher for all pipeline scenarios than for the HVDC scenarios. This is because the storage capacity of the pipeline allows a higher percentage of electricity to be sold during high-priced periods than in the HVDC scenarios. Revenue per MWh for all scenarios is shown in Figure 5.
To estimate the value of the pipeline storage capacity in each of the pipeline scenarios, we first look at the difference in revenue per MWh between a given pipeline scenario and the HVDC scenarios, in which no storage was available. Next, for each pipeline scenarwe multiple this difference by the totmultiply the average premium per MWh due to storage by total Mare shown in Figure 6. The value of pipeline storage ranges from $191 million in 18
33 The PTC provides 1.7 cents per kWh of energy produced by a windplant. Because wind generation is
assumed to be the same for all scenarios (14,017,289 MWhs), revenues from the PTC are also the same for all scenarios – $283 million.
28

FINAL REVIEW DRAFT: 28 Sept 02
Figure 5. Revenue per MWh, including PTC
$0
$10
$20
$30
$40
$50
$60
$70
$80
$90
$100
HVDC 36-C-FC 36-C-CT 36-NC-FC 36-NC-CT 18-NC-FC 18-NC-CT
$ 20
01
Figure 6. The Value of Pipeline Storage Capacity, including PTC
$036-C-FC 36-C-CT 36-NC-FC 36-NC-CT 18-NC-FC 18-NC-CT
$20
$40
$60
$80
Mill
ion
$
$100
$120
$140
$160
200
1
29

FINAL REVIEW DRAFT: 28 Sept 02
Figure 7. Annual Losses for Each Project Scenario, including PTC
nother way to put the costs of these scenarios in perspective is to compare them to the
ost of the power generation technologies against which the scenarios would likely in t e U.S. are
Accompete. The vast majority of the new power plants being constructed hCCCTs. These plants are also the wholesale price setters (the marginal plants) during many hours in most power control areas.34 Thus, a CCCT provides an instructive comparison for this purpose.
The Department of Energy’s Annual Energy Outlook, 2001, projects the cost of energy from a new CCCT in 2005 at 4.16 cents per kWh, assuming gas prices of $4.25 per mmBtu. This is well below the total electricity costs in most of our scenarios (ranging from 5.92 to 18.51 cents per kWh). However, two factors could change, causing the cost of electricity from a CCCT to rise without affecting the cost of our wind/hydrogen scenarios: natural gas prices could rise and/or mandatory CO2 reductions could increase the cost of using all fossil fuels.
To see what kind of increase in gas prices would make our scenarios competitive, we increase the natural gas component (2.79 cents per kWh, or about 67 percent) of the total cost figure cited above for a new CCCT. Table 5 shows the gas prices at which electricity from each of our scenarios would break even with a new CCCT. Table 5 also shows the cost of carbon emissions (in terms of dollars per ton of CO2) that would cause each scenario to be competitive with a new CCCT.
34 Recall that we checked to ensure that the wholesale prices in our pipeline model were in the range of the
total cost per MWh of a new CCCT, on the theory that this plant type would set prices over the long term.
(900)
(800)
(700)
(600)
(500)
(400)
(300)
(200)
(100)
-
36-C
-FC
36-C
-CT
36-N
C-F
C
36-N
C-C
T
18-N
C-F
C
18-N
C-C
T
HVD
C-A
HVD
C-B
HVD
C-C
Milli
ons
of $
200
1
30

FINAL REVIEW DRAFT: 28 Sept 02
Table 5. Breakeven Natural Gas Prices and Carbon Taxes for Electricity from CCCT, and for Each Scenario, including PTC
Scenario Breakeven Gas Price
($/mmBtu) Breakeven Carbon Cost
($/ton CO2) 36-C-FC $22.90 $317.90 36-C-CT $23.60 $329.90 36-NC-FC $21.70 $298.10 36-NC-CT $22.40 $310.10 18-NC-FC $16.50 $209.70 18-NC-CT $16.60 $211.30 HVDC-A $5.00 $11.90 HVDC-B $4.30 $1.50 HVDC-C $5.30 $18.40
Predicting natural gas prices is extremely difficult. One undisputable fact is that prices were much higher and more volatile in 2000 and 2001 than in recent history. The annual average price in 2000 was $4.38 per mmBtu, and the average for 2001, based on data through August, was $5.12. A significant factor in the elevated average prices for 2000 and 2001 was the extreme run-up in prices in the Western U.S., associated with the power s lifornia and the eventual bankruptcy of a major utility. (Monthly upply problems in Caaverage prices in December 2000 and January 2001 were $8.23 and $9.47 per mmBtu respectively.) To put these prices in context, during the 25 years prior to 2000 annual average natural gas prices never rose above $3.70 per mmBtu.35
Most analysts agree that gas prices will remain more volatile in the future than they have been; however analysts do not agree on whether prices will be significantly higher average. Year 2010 gas price
on s in the range of $5 to $7 per mmBtu – which would make
the HVDC scenarios competitive – seem conceivable. However prices in the range
O2
been under $5 per ton.
Chapter 2, except we remove the costs and energy losses associated with electricity generation in Chicago. (This reduces the six scenarios to three.) The cost of delivering wind energy as hydrogen for each project is shown in Figure 8. Annual hydrogen production is total wind generation
needed to make the pipeline scenarios competitive – $19 to $26 per mmBtu – are unlikely.
The carbon tax prices needed to make the pipeline scenarios competitive seem more unlikely. Most documents that discuss carbon trading in the context of mandated Creductions envision prices in the range of $5 to $25 per ton of CO2. In most CO2 emission trades to date, prices have
4.2 Delivering Hydrogen to Chicago Given that the pipeline scenarios delivering wholesale electricity are far from profitable, we now investigate the costs of delivering hydrogen to the Chicago area. We assess the same six hypothetical pipeline projects described in
ll prices cited here are for gas delivered to electric utilities. See: Energy Information Administration,Monthl
35 A y Energy Review, January 2002, p. 133. Available at www.eia.doe.gov.
31

FINAL REVIEW DRAFT: 28 Sept 02
(14,017,289 MWhs) less electrolyzer losses. Note that in the more optimistic “18-NC…e assume a more efficient electrolyzer (90 percent
” scenarios w rather than 85 percent).
Note also that the cost of wind 2 igure 8 than in the cost cha h), show cost of delivering electricity to . This is becau ection 4.1, wefor each project, and we included th l PTC as a rev eam (see Figure 4). Because we will not calculate estim hydrogen sales here, we include the federal PTC as a 1.7 cent per kWh credit to wind costs here.
Figure 8. The Cost of Delivering Hydrogen via the Pipeline Scenarios, with PTC
re difficult to project revenues from the sale of hydrogen than to project re
ctly on ogen costs to the cost of
ogen from other sources: how does the cost of hydrogen from this paper’s scenarios compare to the cost of the hydrogen against which it would be competing if large-scale
nd
t R-
tural gas would have to rise significantly. Figure 9 shows the cost of natural gas that would produce SMR hydrogen costs equal to each scenario. These prices are quite similar to the prices that would make the electricity delivery scenarios competitive with a new CCCT p
energy is lower (2.6 cents per kWh) in Frts in section 4.1 (4.32 cents per kW in talg the to Chicago se, in s calculated estimated revenues
e federa enue strated revenues from
It is far mo
036-C 36-NC 18-NC
Wind Generation* Transmission Losses
1
2
3
4
5
6
7
Cen
ts p
er k
Wh
8
9
revenues from electricity sales, because today’s markets for hydrogen, though large, aprimarily confined to oil and gas processing facilities and to nitrogen fertilizer plants. Today’s price of merchant hydrogen, usually made from natural gas, depends direthe price of natural gas. Now, compare these delivered hydrhydr
dema emerged?
Currently the most cost effective method of large-scale hydrogen production is the steam methane reformation (SMR) of natural gas, producing hydrogen at roughly 1.88 cents perkWh (assuming gas priced at roughly $4.00 per mmBtu). The natural gas input to thisprocess is responsible for 88 to 98 percent of total costs, with larger SMR plants falling athe higher end of this range and smaller ones, at the lower. In order for the cost of SMhydrogen to rise to the cost of hydrogen from these pipeline scenarios, the cost of na
ower plant (see Table 5).
32

FINAL REVIEW DRAFT: 28 Sept 02
Figure 9. Natural Gas Costs to SMR Hydrogen Plants that Would Produce Hydrogen Costs Equal to Those in the Pipeline Scenarios, with PTC
4.3 Assessing the Projects without the PTC Sections 4.1 and 4.2 present data assuming that the federal PTC for wind generation remains in effect. We now show results without revenue from the PTC. Figure 10 shows annual losses for each project delivering electricity to Chicago with and withouthe PTC.
0
5
10
36-C 36-NC 18-NC
Gas
Cos
t
t
Figure 10. Annual Losses from Projects, With and Without the Federal PTC
(400)
(200)
-36-C-
FC36-C-
CT36-NC-
FC36-NC-
CT18-NC-
FC18-NC-
CTHVDC-A HVDC-B HVDC-
C
001
(1,200)
(1,000)
(800)
(600)
Mill
ions
of $
2
With PTC Without PTC
15
$/m
20
25m
Btu
) (
33

FINAL REVIEW DRAFT: 28 Sept 02
Table 6 follows the analysis laid out in Table 5, showing the natural gas prices andthat would cause electricity from a new CCCT in the Chicago area to cost
the carbon costs the same as electricity from our scenarios, but without the PTC. (The natural gas prices and carbon taxes shown here are not additive. Either the natural gas price or the carbon cost would cause our scenario to be competitive.)
Table 6. Breakeven Natural Gas Prices and Carbon Taxes, Without the Federal PTC
Scenario Breakeven Gas Price
($/mmBtu) Breakeven Carbon Cost
($/ton CO2) 36-C-FC 25.40 $362.20 36-C-CT 26.20 $374.30 36-NC-FC 24.30 $342.50 36-NC-CT 25.00 $354.50 18-NC-FC 19.10 $254.10 18-NC-CT 19.20 $255.60 HVDC-A 7.60 $56.30 HVDC-B 6.90 $45.90 HVDC-C 7.90 $62.80
Figure 11 shows the natural gas costs to an SMR hydrogen plant that would result in
ydrogen costs equal to our pipeline scenarios. Obviously, both the costs shown in Table and Figure 11 are higher than those in section 4.2, where the effect of the PTC is
Figure 11. Natural Gas Costs to Steam Reforming Hydrogen Plants that Would
h6included.
Produce Hydrogen Costs Equal to Those in the Pipeline Scenarios, Without the Federal PTC
0
5
10
15
20
36-C 36-NC 18-NC
Gas
Cos
t ($/
mm
Btu
)
25
34

FINAL REVIEW DRAFT: 28 Sept 02
4.4 Assessing the Projects With Lower Wind Generator CapitaCosts
Tables 4 through 6 above show data with the installed cost of wind generators at $950 pekW. Although we believe this to be a good predict 36
l
r ion of wind costs in 2010, some
industry analysts expect significant additional cost reductions during this decade. Thus, installed
capital cost of wind turbines is $700 per kW. A breakout of project costs with wind costs at $700 per kW in Ap mption of lower wind costs reduces annual project losses somewhat, bu jects are still far from profitable. One project, however, b es profitable with lower wind costs. The HVDC- (two HVDC ms installed on one set of towers) posts annual revenues of n.
Figure 12. Annual Losses With Wind Capital Costs at $700 per kW, with PTC
a new
)
we have also assessed the costs of all wind scenarios assuming that the total
appears pen seendix A. As in Fig h assuure 12, t et most pro
ecomB scenario syste$45 millio
Table 7 shows the gas prices and the carbon costs that would cause electricity fromCCCT in the Chicago area to cost the same as electricity from our scenarios, with wind at $700 per kW, with PTC. (Again, gas prices and carbon taxes shown here are not additive.) The gas prices necessary to make the HVDC scenarios are below likely future gas prices, and the carbon costs are negative. This tells us that each of these scenarios is projected to provide slightly cheaper electricity (assuming wind costs of $700 per kWthan a new CCCT. The breakeven prices and carbon costs for the pipeline scenarios remain unlikely.
(800)
(700)
(600)
(500)
(400)
-
100
Mill
io00
(200)
(100)36-C-FC 36-C-CT 36-NC-
FC36-NC-
CT18-NC-
FC18-NC-
CTHVDC-A HVDC-B HVDC-C
1
(300)
n $2
36 See references 6, 7.
35

FINAL REVIEW DRAFT: 28 Sept 02
Table 7. Breakeven Natural Gas Prices and Carbon Taxes With Wind Capital Costs at $700/kW, with PTC
Scenario ($/mmBtu) ($/ton CO2) 36-C-FC 20.50 $277.30 36-C-CT 20.80 $282.80 36-NC-FC 19.30 $257.60 36-NC-CT 19.60 $262.90 18-NC-FC 14.30 $171.40 18-NC-CT 14.00 $166.50 HVDC-A 3.40 -$14.40 HVDC-B 2.80 -$24.80 HVDC-C 3.80 -$7.90
Breakeven Gas Price Breakeven Carbon Cost
36

FINAL REVIEW DRAFT: 28 Sept 02
Looking at Figure 12 and Table 7, some readers may conclude that a new CCCT would not be profitable given the hourly prices we have used. After all, scenarios HVDC-A and HVDC-C are not profitable (as seen in Figure 12), and they produce electricity at lower cost per kWh than CCT (shown in Table 7 by the negative breakeven carbon costs). How conclusion is pro incorrect, bec nores the variability of the wind generation and the dispatchability of a CCCT. words, while the HVDC scen per kWh are slightly lower than that of a new CCCT (with wind at $700 per kW CT’s revenues would be much higher, because the plant would only operate her-priced hour wind/HVDC sell all electricity generated at ent price. These projects sell electricity at a loss during urs of the year wh tal project costs per kWh are considered. We did not model the profit/loss of a ne CT, however b the data in Figure 12 and Table 7, it appears that a new CCCT would either post small profits or small losses.
As seen in Figure 13, SMR hydrogen production is projected to be far less costly than our pipeline scenarios, even assuming wind costs at $700 per kW.
Figure 13. Natural Gas Costs to SMR Hydrogen Plants that Would Produce Hydrogen at Costs Equal to Those in the Pipeline Scenarios with Wind Capital Cost at $700 per kW, with PTC
4.5 The Cost of Electricity from Distributed Generation Using Hydrogen from These Projects
In section 4.1 above we present the costs of wholesale electricity delivered via the pipeline and HVDC scenarios. We compare these costs to the cost of electricity from a new CCCT power plant, and, in Table 5, we show that natural gas prices would have to rise to a range of $16 to $23 per mmBtu in order for electricity from the pipeline scenarios to be competitive. However, given the increasing interest in distributed generation (DG), it is useful to consider the implications of our pipeline cost estimates in
a new Cever, this bably ause it ig
In other arios’ cost), the CC during hig s. The projects the time of generation, at the curr many ho en to
w CC ased on
0
5
10
15
20
25
36-C 36-NC 18-NC
Gas
Cos
t ($/
mm
Btu
)
37

FINAL REVIEW DRAFT: 28 Sept 02
a retail setting.37 Part of the attraction of DG is that it avoids the transmission and distribution costs that are paid in retail rates. So, perhaps our pipeline projects would be more cost effective fueling DG units that are competing with retail electricity prices.
To make this comparison, we look again at the cost of hydrogen delivered to Chicago andadd in the estimated total costs (in 2010) of operating selected DG technologies. Before making this comparison, however, an important caveat is necessary. The projects assessed in sections 4.1 and 4.2 are large-scale energy supply projects. It is common for developers of large energy resources, like oil fields or power plants, also to build the transmission infrastructure needed to deliver the energy to wholesale markets.
However, in the deregulated electricity industry of the future, one energy company willbe very unlikely to develop a large-scale resource, a transmission infrastructure, and provide end-use customers with small-scale generating units or retail electricity. The
wholesale and retail sides of this industry are being fully separated by regulators
, DG units are likely to be
Thus, the total cost of operating a DG unit on hydrogen from these pipeline scenarios
concerned about potential anti-competitive behavior of companies involved in both generating and delivering energy. Thus, today and in the futureowned by end users or “energy service companies,” power lines will be owned by transmission and distribution (T&D) companies, and generating resources will be owned by generating companies.
would probably be spread across at least three parties: the owner of the windplant, the owner of the pipeline project and the energy user or service company that purchases and operates the DG unit. The decisions about whether to install a DG unit and what fuel to use would be made by the owner of the DG unit. The pipeline hydrogen would be competing against natural gas and hydrogen from other sources to serve DG units. So the important comparison here is between the cost of hydrogen and natural gas or other fuels, a comparison similar to the one made in section 4.2 above. Here, we show the total costs of operating DG on pipeline hydrogen simply to gauge whether this scenario appears more competitive than the delivery of wholesale electricity (as in section 4.1) or hydrogen (as in section 4.2).
Figure 14 shows the cost of operating three DG technologies on hydrogen from our three pipeline scenarios. Costs for the pipeline scenarios are the same as those presented in section 4.2. The three DG technologies examined are an internal combustion engine (ICE), a microturbine and a fuel cell. Our cost assumptions for the DG technologies, detailed in Appendix B, are based on data in the Distributed Resources Emissions Model,
eveloped by the Natural Resources Defense Council (NRDC). 38 We have adjusted data om that source to simulate cost reductions reasonably expected between now and 2010.
dfr
37 The term “distributed generation” refers to small (less than one MW) generators located close to or at th
point of electricity use, displacing retail-value electricity. Falling costs and advances in technologies such as microturbines and fuel cells have drawn substantial interest to DG and the reliability boffers.
38
e
enefits it
Unpublished.
38

FINAL REVIEW DRAFT: 28 Sept 02
Figure 14. The Cost of Electricity from DG Units Operating on Pipeline Hydrogen from North Dakota Wind Energy
35
0
5
10
36-C 36-NC 18-NC
Ce
ICE Microturbine Fuel Cell Residential Avg.
15
20
25
30
s pe
r kW
hnt
As Figure 14 illustrates, the total cost of operating DG on hydrogen from these pipelinscenarios is much higher than current retail rates in Illinois. For comparison, we show the average year-2000 retail rate paid by residential electricity customers in Illinois (8.8 cents per kWh).39 Residential customers, of course, pay the highest retail rates of any customer class. The most competitive pipeline/DG scenario is a fuel cell operating hydrogen from the 18-inch pipeline. Further, note that these pipeline/DG scenario costs are optimistic in that we have ignored the cost of hydrogen distribution infrastructure in Chicago to deliver the gas from the pipeline hub to the end-use site.
To distinguish between the impacts of the pipeline hydrogen costs and our cost assumptions regarding DG technologies, we present the cost of these technologieoperating on natural gas in Fi
e
on
s gure 15. We use the same electricity generating cost data
here as in Figure 14, and we assume a natural gas price of $4.50 per mmBtu. Note that our assumed 2010 DG costs are 5 to 15 percent lower than Illinois’ average residential rates for 2000.
etail price fi39 R gure is taken from the U.S. Energy Information Administration’s publication, Monthly
available at: www.eia.doe.gov. Retail Rates,
39

FINAL REVIEW DRAFT: 28 Sept 02
Figure 15. The Cost of Electricity from DG Units Operating on Natural G t $4.50 per mmBtu
as a
0
12
34
5
67
89
10
ICE Microturbine Fuel Cell
Cen
ts p
er k
Wh
Nat. Gas Fueled Residenatial Avg.
40

FINAL REVIEW DRAFT: 28 Sept 02
5. The Hydro Firming Opportunity While energy storage in a hydrogen pipeline is one option for “firming” intermittent wind generation, a firming arrangement with a large hydroelectric system represents another strategy. Under this type of arrangement, the windplant would deliver all or a portion of its output to the transmission system of the hydro company. The hydro company would use the energy to serve its customers in real time, and the windplant would be entitled to withdraw the same amount of hydroelectric energy at an agreed-upon time. In a sense, each wind kWh that the hydro company used to serve its load would allow it to generate less energy on its rivers or from its reservoirs. In this way, wind energy could be indirectly stored in the river.
Exactly when the windplant would be entitled to withdraw energy from the river would depend on the terms of the agreement. The windplant might simply want a commitment for firm, baseload energy out of the river – the sale of which would be more valuable than variable wind energy. Or, the windplant might want firm power during peak periods, the most valuable kind of power. If the hydro company were willing to enter into such an agreement, they would have to decide how much to charge the windplant for the “firming service.” The hydro company would be receiving less valuable kWhs and delivering more valuable kWhs.
one scenario, the hydro company might agree to provide firm energy for the windplant in an amount equal to the amount of wind energy they received. Here the hydro company would probably seek to receive a per-kWh charge on the firm energy delivered. In another scenario, the hydro company might require that kWhs be traded based on a ratio that provided them with similar value. For example, they might propose to provide three firm kWhs for every four intermittent kWhs received. These are simply two payment options for the same basic transaction.
Below, we discuss the issues likely to be considered regarding a hydro firming agreement.
5.1 Key Issues Three categories of issues come up when thinking about using a hydroelectric system to “firm” intermittent energy resources such as wind. These categories are:
• The “capacity and energy” profile of the hydro system,
• Constraints on river operation,
• Transmission adequacy, and
• The economics of the transaction.
The first three categories include questions about whether the hydro system can provide firming service, and if so, how much energy it can firm. The fourth category deals with the terms under which the hydro system will be willing to provide the service (assuming it can).
The first category relates to the hydro system’s current resource and load profile. If the system is “capacity constrained,” it must acquire additional resources to meet its peak
In
41

FINAL REVIEW DRAFT: 28 Sept 02
load commitments. It may be able to generate as much (or more)custo ers consume, but it does not have sufficient generating ca
energy annually as its m pacity to meet customer
t,
easons. uld be providing energy, something the hydro system has
ly capture the energy of the river at a certain point.
ty onstraints are in the areas of river navigation,
n these eave power companies with little flexibility in how much water they
move through dams during a given hour. In some instances, these constraints force additional water through dams when they do not need the
nies signific tl slowly in response to multi-ye t a hydro company from en ri (five to ten years), but water levels tend to be stable enough to allow for planning over the near to medium term.
The thi q ydro firming is the availability of transmi o on. While insufficient transmission
a potential hydro firming arrangement.
demand during peak periods. Such a system will have to purchase additional capacity for use during peak periods and/or purchase additional energy to meet peak load. In contrasa system that is “energy constrained” may have enough capacity to meet peak loads with a substantial margin but not have sufficient water flows in the river to serve its customers’ annual energy needs. This kind of system might purchase additional energy during off-peak periods to supplement the output of its dams.
A hydro system that is capacity constrained is not likely to be willing to enter into a firming agreement with an intermittent resource – at least not during its peak use sIn this case, the windplant woenough of, and asking for capacity, something the hydro system is short on. An energy constrained hydro system is more likely to be interested in a firming arrangement. This type of a system could use the revenues from the arrangement to purchase additional energy (or simply use the net kWhs from a ratio trading deal).
Constraints on river operation is the second key factor in determining whether a hydro system can provide firming service. The first issue here is what kind of dams the hydro company has. “Run-of-river” or “low-head” dams do not store large amounts of waterbehind them; they simp“Impoundment” or “high-head” dams do store large amounts of water, and thus energy. A system with a large amount of impoundment capacity is likely to have more flexibility in when it generates power than a system with primarily run-of-river capacity. Moreflexibility in generation probably means an increased willingness to engage in a firming arrangement. But there are other constraints on river operation.
Companies that operate dams are subject to operational constraints that reflect the varieof competing uses of the river. The major cflood control and environmental protection. Constraints adopted to meet goals ithree areas can l
power companies to move additional electricity or hold water back when they need electricity.
Persistent droughts can reduce the generating capabilities of hydro compaan y. However, average water levels in large rivers change ar trends. Thus, uncertainty over water levels might preven
te ng into a very long term contract
rd uestion affecting the potential for hssi n capacity to carry out the transacti
capacity is less prohibitive than mismatches in the first two areas can be, the cost of additional transmission capacity will affect the economics of a hydro firming agreement. In the extreme case, the need to construct new power lines could cause a windplant to abandon
Finally, assuming that the hydro system can provide firming service, there is the questionof terms. As noted, in a firming arrangement the hydro system is trading less valuable
42
FINAL REVIEW DRAFT: 28 Sept 02
kWhs (variable energy) for more valuable kWhs (firm energy). A rough estimate of the value of the windplant’s intermittent energy and the hydro system’s firm energy, (or firm, on-peak energy) can be discerned in the wholesale power markets to which each system has access. The difference between the average short-term (spot market) energy price and the price of firm energy (or firm, on-peak energy if that is what the windplant wants) is the market value of the “firming service” the hydro system could provide.40
5.2 Firming Possibilities in North Dakota For windplants developed in North Dakota, there are two large hydroelectric systems within reasonable transmission distance that could theoretically provide firming service.These are the Western Area Power Administration’s (WAPA) Upper Great Plains systemon the Missouri River in Montana and North and South Dakota, and Manitoba Hydro’s (MH) resources in the Province of Manitoba. Both of these systems have substantial hydroelectric generating capacity (both have over 2,000 MW),
and both have extensive
t
on is approximately
ht
e water releases do hs.42
of
ngineers. This
transmission networks with which to move power.
Below, we describe our initial findings from discussions with WAPA and MH staff aboutheir ability and interest in providing firming service.
5.2.1 Western Area Power Administration (WAPA )
• WAPA’s primary resources in the Upper Great Plains (UGP) region are eight large dams on the Missouri River in Montana and North and South Dakota.41 During periods of adequate precipitation, these dams total approximately 2,200 MW of generating capacity. WAPA’s coincident peak load in this regi1,900 MW. This is a reserve margin of just under 14 percent. Thus, WAPA is not capacity constrained, but this is not a particularly large capacity margin. U.S. utilities have traditionally planned 15 percent capacity margins (although these margins are shrinking now).
• During non-drought years, WAPA is also an energy surplus system; during drougyears, it can be energy constrained. WAPA purchases energy in drought years to meet customer needs and even purchases in surplus years becausnot always match load patterns. In year 2000, WAPA purchased 2,834 GW
• Although WAPA is usually neither capacity nor energy constrained in meeting the peak demand of its customers, it faces significant other constraints on the operation its dams on the Missouri. WAPA operates the UGP dams in accordance with the “Master Water Control Manual,” written by the Army Corp of E
40 Another way to think about this: the wholesale price of firm energy is the hydro company’s opportu
cost – it is what they would lose by providing firm energy to the windplant. The hydro company would get the value of the intermittent wind energy. Subtracting the value of the intermittent energy from tfirm energy leaves the increment that one would have to pay the hydro company to make the two transactions of equal value to them.
nity
he
m.
41 The dams are actually operated by the Army Corps of Engineers. 42 This figure is from WAPA’s 2000 Annual Report on its website at: www.wapa.gov/geninfo/pppsmb.ht
43

FINAL REVIEW DRAFT: 28 Sept 02
document is updated periodically, and is currently undergoing a major revision. The Master Manual lays out operating procedures designed to manage the river in a way that achieves goals in river navigation, flood control, environmental protection, irrigation, water quality, recreation and power production.
• Currently there is considerable uncertainty over what changes this round of revisions to the Master Manual will entail. In addition, litigation of the final revisions is a strong possibility, as several groups have already announced their intentions to sue if
t
n would have to be made simply to
ade, new infrastructure could be ount of
transmission study would
5.2
•
om the north to the Dorsey Sub, within 26 km of Winnipeg. There
• ,
as
• ost
polis area. Much more than WAPA, MH sees wholesale power markets as a source of revenue, and the company commonly purchases electricity off-peak to conserve water
•
operational flexibility than WAPA. However, 86 percent of the company’s hydro rs in question, the company
the revisions do not meet their goals.
• Staff at WAPA are familiar with the wind firming concept but feel that it would nobe useful to explore the idea further until the Master Manual revisions are finalized. WAPA staff believe that, as a result of these revisions, they may have less flexibility in river operations than they have had in the past.
• Transmission capacity is not likely to be a limiting factor in a firming arrangement between North Dakota wind and WAPA. If 4,000 MW of wind capacity were sited iNorth Dakota, significant transmission upgradesinterconnect the new capacity. If the concept of a hydro firming arrangement were considered as these transmission investments were mdeployed in a way that facilitated the arrangement, minimizing the amadditional transmission needed. However a comprehensivebe required to discern the full transmission requirements of such an arrangement.
.2 Manitoba Hydro (MH)
MH is a Crown Corporation, owned by the Province of Manitoba. The utility has roughly 4,800 MW of hydro capacity at 12 dams. Nearly 80 percent of this capacityis in the northern third of the province, hundreds of kilometers from the load centers in the south, such as Winnipeg. Responding to this fact, the company built two 900-km HVDC lines frare three converter stations.
With the HVDC lines, MH is neither capacity nor energy constrained. In FY 2001the company generated over 32,500 GWhs and sold only 20,100 GWhs to end users in Manitoba (an energy surplus of 38 percent). The company’s capacity margin wextremely large as well – over 30 percent.
MH is an active buyer and seller in wholesale power markets. The company exported over 12,000 GWhs (38 percent of its generation) from the province in FY 2001. Mof this energy was exported to the U.S., with a large amount going to the Minnea
for on-peak generation.
Although MH is constrained by the same competing river uses as WAPA, the company has access to far more water than WAPA and thus appears to have more
capacity is run-of-river. Because of the size of the rive
44

FINAL REVIEW DRAFT: 28 Sept 02
does have some ability to control the output of these facilities, but it has far less control over them than do companies with large impoundment dams.
Transmission capacity would have to be enhanced significa• ntly for MH to firm substantial amounts of wind energy from North Dakota. There are only three
o One 500-kV line from Winnipeg to Minneapolis, MN.
parties.
h
• r (500 MW or less) of intermittent wind generation mers in the U.S.) in return for firm, off-peak power.
k
•
5.3Altene to explore this question in the following
comzeronumperdeal on top of its other commitments. And the company would have to be able to do this
So WA ty con l
interconnections between Manitoba and the U.S. (all are HVAC lines): o One 230-kV line from Winnipeg to Grand Forks, ND, o One 230-kV line from Winnipeg to Duluth, MN, and
Currently, these lines are heavily loaded a large portion of the time. During peak periods, the lines are heavily used for MH’s exports to the U.S. Given MH’s interest in U.S. wholesale power markets, one might expect the company to be willing to share the cost of new interties with other interested
Perhaps the North Dakota 4,000 MW windplant, in an electricity transmission scenario, might construct an HVDC line from the windplant to MH’s Dorsey substation, southwest of Winnipeg, as part of the overall windplant transmission system, to exchange energy with the MH system and provide a new transmission patto market for MH hydro energy. An HVDC line to the Dorsey substation would increase the capacity factor of the windplant HVDC line to Chicago.
Without significant transmission expansion, there appears to be the opportunity foMH to accept a limited amount(perhaps delivered to MH custoCurrently, the company could deliver little additional energy to the U.S. during peaperiods, due to transmission line loadings. Interties would have to be enhanced to expand potential wind firming possibilities with MH.
Any expansion of MH hydro generating capacity will be controversial among Manitoba Native tribes and within the Upper Midwest environmental community.
Additional Analysis hough neither hydro system we spoke to was willing to speculate about how much rgy they might be able to firm, we can begin
way. Consider the maximum demand that a firming agreement would place on the hydro partner: this would occur when wind output was at a minimum during the hours the hydro
pany had agreed to deliver firm energy. In this case, (assuming the wind output is ) the hydro system would have to generate the energy to deliver the agreed-upon ber of firm kWhs and meet its other commitments. In other words, during some
iods of the year, the hydro system will have to generate the full amount of the firming
during peak hours.
how much additional firm capacity could each of these systems commit to? In 2000, PA had only 300 MW of capacity in excess of their peak load. In all U.S. electricitrol areas, market participants are prohibited from taking on firm commitments equa
45

FINAL REVIEW DRAFT: 28 Sept 02
to t their firm on the rules of the Mid-Continent Area Power Pool (MAPP), WAPA may currently have very little
Thi staff noted that the in drought years (such as the c e inter, with virtually no oper o
MH cle y ompany had 1,574 MWcomroucom rranging the tran out cosspe
MaUSmahydro-firming.
heir peak load; all companies serving load must contract for capacity in excess of load to contribute to the regional capacity reserve margin. Depending
ability at all to firm intermittent energy.
s rough calculation is consistent with information from WAPA. WAPA flexibility to firm wind energy becomes extremely limited urr nt period). Three of the six dams are fully loaded this wati nal flexibility.
arl has more room to firm wind energy than WAPA. The c more capacity than it needed to serve its Manitoba customers in FY 2001. If the pany also had 500-MW of firm commitments outside of Manitoba, this leaves
ghly 1,000 MW of capacity. Leaving a 10 percent reserve margin, the company could mit to delivering some 500 MW of firm energy. However, asmission for a 500 MW firming arrangement could prove to be impossible withtly new lines. Again, this calculation is roughly consistent with the informal culation of MH staff.
jor capacity upgrades to extant electric transmission systems in the Great Plains of A and Canada may change this hydro-firming analysis in the short term; the gnitude of the total Great Plains wind resource dwarfs the potential for effective
46

FINAL REVIEW DRAFT: 28 Sept 02
6. Summary of Findings • None of the cases studied here is profitable, including the present federal PTC
deliver electricity to the Chicago , to
wholesale market or to deliver hydrogen gas to
ould have to rise to a range of $16 to $23 per mmBtu to make
rbine.
line
stalled wind costs in 2010 are assumed to $700 per kW instead of $950 per kW, projected annual losses are reduced. The HVDC-B scenario becomes profitable under this assumption. The pipeline scenarios remain far from profitable even with reduced wind costs.
• The oxygen byproduct of hydrogen generation by electrolysis, in the hydrogen pipeline scenarios, is valuable if it can be piped a short distance to demand such as new “clean coal” plants in North Dakota.
• Much further study is needed to validate these study results. Further work is especially needed in the areas of hydrogen pipeline costs and HVDC costs.
• Hydrogen pipeline transmission for renewable energy sources faces several obstacles:
1. High capital costs for electrolyzers (and compressors, if 1,000 psi electrolyzers are not available), and for the electricity generating systems at destination;
2. Energy conversion losses in electrolyzers; 3. Low capacity factor of the pipeline; 4. Economic competition from HVDC electrical transmission and point-of-
use hydrogen storage; 5. Hydrogen embrittlement in high pressure, variable-pressure, steel
hydrogen transmission pipelines providing cushioning and storage;
6. Optimizing collection and conversion topology at sources; and 7. Acceptance by the public, and by the insurance and finance industries.
Chicago for distributed generation and vehicle and aircraft fuel.
• The cost of North Dakota wind energy delivered to Chicago as electricity, including all transmission costs, is far from competitive, at 6 to 18 cents per kWh. Natural gas prices welectricity from the pipeline scenarios competitive with electricity from a new combined-cycle combustion turbine. Gas prices of $4.30 to $5.30 would makethe HVDC scenarios competitive with a new combined-cycle combustion tu
• The cost of delivering hydrogen via the pipeline scenarios ranges from 5.8 to 8.1 cents per kWh. Natural gas prices would have to rise to a range of $11.50 to $19.00 to make this hydrogen competitive with hydrogen produced from steam methane reforming (SMR) of natural gas.
• The federal PTC for wind energy is a significant factor on project economics. Removal of the PTC increases project losses by 20 to 30 percent for pipeprojects and more than 100 percent for some HVDC projects.
• If total in
47

FINAL REVIEW DRAFT: 28 Sept 02
7. Other Considerations 7.1The Grconsum al gas and sign c
Howevrenewalines an to sabotagSecurit
Und gpipelin
7.2Energyalong t f the transmission systemare complants d biomass resourc ission system, might rival the 4,000 MW peak wind capacity modeled here.
How vHVDC e convert hydrogen gas transmission pipeline mig bmeter,
7.3 ergy New “clean lant) or hydrogen (ZESthe hydrogen t narios, as discussed above. Coal plant output might synergistic nts, thus improving transmissio er kWh for wind energy delivered to Chicago. S t to adjust, hydrogen transmission may be mopipeline, or in
Energy Security eat Plains wind resource could supply a large part of the USA’s total energy ption, replacing a significant fraction of its imported oil and natur
ifi antly reducing its CO2 emissions.
er, economical collection, concentration, and transmission of wind and other ble-source energy will necessarily result in new, large-scale electric transmission d / or hydrogen pipelines (or other systems) which are vulnerable, more or less, e, as Amory Lovins warns in “Brittle Power: Energy Strategy for National y”. 43
er round systems, such as the hydrogen pipeline or the superconducting “energy e” 44 in 8.2.5, would probably be less vulnerable than overhead HVDC lines.
Biomass Synergy generation from biomass, as either electricity or hydrogen, at frequent points he transmission route, may greatly improve the capacity factor o. Both wind energy and biomass energy availability vary seasonally; perhaps they plementary. Some biomass resources might be stockpiled, feeding generation ispatched to supplement wind energy fed to the transmission system. The e, along the 1,000 mile length of the transm
e er, energy delivery nodes on an HVDC system will be costly at small capacity; equipment vendors suggest 500 MW as a minimum size, for low cost / kW for ther stations. Energy delivery nodes on a large
ht e simple and economical, even at low capacity: a boss on the pipe, a valve, a perhaps a compressor, and perhaps a small building.
Coal Syn coal” plants in North Dakota may produce either electricity (ZECA p
T plant). Either plant may benefit from purchase of byproduct oxygen, in ransmission sce
ally share the transmission system with windplan capacity factor and lowering the cost pince coal plant output is probably difficulre advantageous, because hydrogen can be compressed and stored in the
other media.
43 See referen44 See referen
ce 42. ces 62 - 64.
48

FINAL REVIEW DRAFT: 28 Sept 02
7.4 Carbon Taxes and Internalizing Other Externalities Large national and international taxes to discourage anthropogenic emissions of CO2
o internalize other externalities of fossil fuels, may be ains
e community and various renewable-source interest groups should ”, ote
enewables to distant markets. For example, shall Great Plains wind energy be ansmitted as electricity or as hydrogen, to distant markets like Chicago?
from fossil fuel combustion, and tnecessary to close the large market price gap, shown in this report, between Great Plwind energy and fossil energy sources delivered to end-users.
7.5 International CollaborationSeveral collaborative opportunities, especially with Japan, Germany, and Canada, forhydrogen transmission technical and economic study, should be pursued.45
7.6 Define “Renewables-Hydrogen Economy” The hydrog ncollaborate to define, and estimate expectations for, a “renewables-hydrogen economyespecially pertaining to collection and transmission of diverse, dispersed, diffuse, remrtr
45 See reference 43.
49

FINAL REVIEW DRAFT: 28 Sept 02
8. Recommended Future Work 8.1 National Hydrogen Transmission Test Facility (NHTTF) One salient feature of the nascent “renewables-hydrogen economy” is collecting energy from diverse, dispersed, diffuse, remote, renewable energy sources as hydrogen, and
ant markets, on regional, national, international, or intercontinental scales.
ydrogen Community does not know how to build such systems, optimized for energy collection
ransmission, and l with
ke now.
ully realizing the “renewables-hydrogen economy” opportunity requires pipelines that:
• Are capable of carrying pure hydrogen at high pressure and flow rate; • Accommodate time-varying, somewhat unpredictable, inputs; • Accommodate continuously-varying pressure, over a wide but limited range,
providing valuable cushioning and energy storage; • Overcome the severe hydrogen-embrittlement problem, 48 or establish strict operating
limits and protocols for transmission components and systems; this may limit or defeat the storage value in 3, above;
• Accept hydrogen delivery at frequent (roughly 5-15 km) intervals along the source end, providing “distributed collection” from the “distributed generation” sources;
• Are fitted with compressors, meters, fittings, terminals, and safety systems optimized for hydrogen;
• Are proven safe, i.e. amenable to high-confidence monitoring, inspection, and repair, based on years of pilot-scale operating experience in typical field conditions;
• Are economically attractive in capital and O&M costs, competitive with high voltage direct current (HVDC) collection, transmission, and storage systems (hydro-firming);
• Can share capacity with hydrogen produced from “clean” coal gasification.
The “renewables-hydrogen economy” also requires:
transporting it via high-capacity pipelines to dist
However, no GW-scale hydrogen pipeline system exists in the world. The H
from renewable sources, from very large land areas, and for storage, tdelivery -- the backbone of the nascent “hydrogen economy” -- nor how to deahydrogen embrittlement in such large and complex systems.46 A pilot-plant facility, a 10 to 100 MW scale transmission test facility, will be needed; it is on the critical path to deployment of 4,000 MW-scale systems as contemplated in this study. It will taseveral years and about $30-50 million47 to build; the process should begin
F
46 See references 42, 43. 47 A rule-of-thumb estimate for the installed cost of complete, large, natural gas (NG) pipeline systems is
$25 per inch diameter per meter length. Thus, a small, 50-mile-long, 8” diameter NG pipeline would cost > $16 million. The “hydrogen service” multiplier of 1.4 increases this to > $22.4 million. The NHTTF would need other capital equipment and facilities, and perhaps a longer pipeline.
19, 44, 45. 48 See references 18,
50

FINAL REVIEW DRAFT: 28 Sept 02
• Public acceptance of routing and permitting for hydtheir “neighborhood”, as part of the energy infrastru
rogen pipelines, installed in cture upon which they
• Optimized topology for energy generation, collection, and conversion -- typically
hydrogen collection and transmission systems for renewables, as total cost per MWh delivered via long-distance transmission;
erhaps
8.2
1. for hydrogen, to find the economic optimum
).
with very different time constants and other characteristics.
to
pe; interface voltage, frequency, and possibility of using a voltage source converter (VSC) feeding the HVDC system;
• number and spacing of entry points to the transmission system; geometric array of rs upon the land;
depend;
from electricity to hydrogen in electrolyzers -- but also from thermal biomass, photolysis, and other renewable sources, and perhaps from coal gasification;
• Accurately estimating the costs of
• Insurance and finance industry acceptance and participation, which in turn will require safety and business standards and codes, and substantial successful field experience.
A pilot-scale research, development and demonstration facility, an NHTTF, will help to make clear the technical, institutional, business, and public perception challenges of hydrogen pipeline transmission, so that optimized “renewables-hydrogen economy”systems can be more effectively considered for adoption in the future.
Perhaps this should be an International Hydrogen Transmission Test Facility (IHTTF), built in the Midwest, in collaboration with Japan, Canada, Germany, and pothers.49
Modeling and Research 8.2.1 Modeling and Systems Study at GW scale
Build two models, for electricity and (profit maximizing) ratio of nameplate (peak) wind generation capacity to rated transmission capacity, balancing enhanced transmission system capacity factor withenergy production lost to generation shedding (to prevent overloading transmissionBoth electricity and hydrogen systems, by nature, include allowed short-term overloads, but
2. Build two models, for electricity and for hydrogen, for the source-end energy collection and conversion system interfacing wind generators to transmission, minimize costs and energy losses, and to maximize wind generator capacity factor. Embrace both technology and topology of the collection-conversion system, including:
• wind generator electrical generating system ty
wind generato
ee: W. Leighty, National Hydrogen Transmission Test Facility (NHTTF): 49 S
ct 2001 Concept and Rationale, 15 O
51

FINAL REVIEW DRAFT: 28 Sept 02
• electrolyzer size and location; output pressure and piping to transmission line.
ld a model, embracing both electricity and hydrogen, to find the economic imum mod
3. Buiopt ular generation capacity for a Great Plains wind generation-
4,0
4. Run
•
a,
• lysis of a large number of hourly price data sets (see 3.1, Wind and
rom other
geothermal, solar power satellite receiving stations, 50 and perhaps others.
• Include diurnal and seasonal effects, and dispatchability of some renewables
r production, and increasing
• “really clean” (including carbon sequestration and near-zero emissions) coal
6. all o, and
7. 51),
y grid.
8. Update PNL-7789, An Assessment of … Wind Energy Potential in the Contiguous
• sted on p. 60 of the report;
• ia, and a wider range of exclusion scenarios.
transmission system. Include modeling for optimizing geographic positioning of 00 MW of wind generators upon the land.
the models used in this report under these conditions:
at 10 times and 100 times the generation scale considered in this report.
• for other wholesale electricity markets: for example, Denver, northern Californisouthern California, Tokyo;
statistical anaMarket Price Data, above)
• with delivery point at Minneapolis - St Paul, as well as at Chicago.
5. Expand model to include integration of electricity and/or hydrogen fsources:
• other renewables: biomass, PV, light-driven molecular or cellular systems,
• generation, for smoothing aggregate powetransmission capacity factor (CF);
plants; and
• cogeneration of electricity and hydrogen in new high-temperature, gas-cooled nuclear reactor designs, like the PBMR (pebble bed modular reactor).
Model renewables resource assessment and transmission planning, integratinglikely renewable sources, at continental scale, to include Canada and MexicAlaska renewables.
Emulate the pan-European (including North Africa) wind energy study by ISET (to discover the smoothing effect of time-varying windpower output over very large catchment areas in North America, when integrated into the continental energ
United States, 1991,51 to improve its accuracy and relevance:
as sugge
• with updated meteorological data;
with updated exclusionary criter
50 See reference 43. 51 See reference 3.
52

FINAL REVIEW DRAFT: 28 Sept 02
9. her d lost.
10.
8.2
1. MW efficiency, at <$300 / kW installed, at 1,000 psi
l edire
2. F r of renewable-uating
will be required, we need absolute and complete confidence that hydrogen-b 53
3. To drogen an
s e
4. For an areas, we need lower-cost underground
eco dardized installation procedures will help.
5. r out vide
y
1. hydrogen gas pipeline:
tural gas transmission pipelines, at up to 20 % concentration by energy, as a short-term transition
Model transmission sharing, including wind, to improve transmission CF: for example, wind might use 40% of transmission capacity, paying 50% of cost; otsources use 40% of capacity, paying 50% of cost; 20% of capacity is unused an
Model a shorter transmission path, for both electricity and hydrogen, perhaps withMinneapolis-St.Paul as destination.
.2 Technology Developments Needed
For acceptable cost of energy conversion from electricity to hydrogen, we need -scale electrolyzers, at >90%
output pressure, with very low long-term O+M cost. Proton Energy announced, in at 2001, a kW-scale, PEM electrolyzer with 2,000-psi output,52 a step in that
ction.
o credible consideration of long-distance, high-capacity transmission source energy by hydrogen pipelines, and for the NHTTF, where high and fluctpressuresem rittlement of steel can be prevented and detected.
lower pipeline capital cost and prevent hydrogen-embrittlement or other hyservice degradation, we need to investigate transmission pipeline materials other th te l: composites, including continuously-fabricated, in-situ method; include
hydrogen-impermeable or hydrogen-storing internal pipeline coatings.
HVDC electric transmission in urbcables at 500 kV, 1000 MW; extruded solid-polymer dielectric construction and
nomical, stan
For HVDC transmission at the source end, we need VSCs of higher capacity, higheput voltage, lower energy conversion loss, and lower capital cost, to pro
impedance matching, and VAR support and control, to diverse renewable electricitsources.
8.2.3 Hydrogen Transmission at GW scale
Consider other hydrogen transmission systems, as alternatives to a compressed
• “Hythane”: mixing hydrogen with natural gas, in extant na
strategy; 54
52 See reference 52.
587-91; 44, 45. 53 See references 19, pp54 See reference 46.
53

FINAL REVIEW DRAFT: 28 Sept 02
• Closed-cycle chemical, via liquid pipeline(s): cyclohexane-benzene; methylcyclohexane-toluene; sodium borohydride, etc;
• Open-cycle chemical, via liquid pipeline: methanol, ethanol, hydrazine, etc.
• Liquid hydrogen, via cryogenic railcars or pipeline; a pipeline could contain a superconducting electric transmission line, as in 8.2.5, below.
• Closed-cycle solids: storage in particulate solids; transportation of the solids to rn of solid to source(s). 55
ith fluid mechanics and hydraulic engineering equations;
ly try points.
4.
s) with electrolyzer: variable-speed; voltage and frequency; impedance matching. This is interactive with 5, below. (see 8.2.1.2, above; 8.2.4.3, below)
optimum conversion and collection infrastructure topology and designs, to minimize long-term COE.
6. options and costs for end users of hydrogen in Chicago; consider several introduction scenarios and markets: ground vehicles, aircraft, DG.
7. Val from hydrogen in Chicago; value byproduct heat from other prime-movers for converting hydrogen to electricity in Chicago.
8. Survey other hydrogen storage opportunities and estimate costs per kWh-day:
• along the transmission route, especially geologic;
destination(s), release of hydrogen gas, retu
2. Develop an Excel model, with Word text “design and operating manual” and assumptions, for designing and costing large-scale, long-distance hydrogen transmission pipeline systems, optimized for collection from diverse renewable energy sources:
• Begin w
• Include capital and O&M costs for all components, including electrolyzers and compressors;
• Include pipelines up to 56” diameter;
• Include compression system design optimization and energy cost;
• Make all variables accessible, well-cataloged and identified;
• Include a variety of charting for model results: inputs and outputs;
• Include an adjunct model for energy conversion and collection infrastructure: location and capacity of electrolyzers; size and cost of piping; feedwater suppsystem; optimum capacity and design of transmission en
3. Run the model, in 2, to improve accuracy of the pipeline analysis in this report;
Investigate lowering wind-hydrogen transmission system long-term COE by integrating and optimizing wind turbine electric generating system (type and specification
5. Run the model, in 2, with results of 4, to suggest
Estimate the distribution
ue the byproduct heat and distilled water from fuelcells producing electricity
55 See references 67 - 70.
54

FINAL REVIEW DRAFT: 28 Sept 02
• reversible fuel cells with associated distributed storage devices, and
distributed storage in ground vehicle, aircraft, and DG o• n-site fuel tanks.
9. B g
8.2
1. Dev try points stems,
2. cture, ign, connecting the wind generator array to electric transmission
3. t
in:
line, as the capacity of each VSC will be ne; this may
m;
uency, with
• s;
erter
candidate Chicago-area delivery point(s); calculate all capital and O+M costs.
5.
ind energy export; run the cost and profit models
e in the design process for an NHTTF, or International HTTF. (See 8.1, above)
.4 Electric Transmission at GW scale
elop a model to find optimum number and capacity of transmission enfor large Great Plains windplants, for both HVAC and HVDC transmission syboth PCC and VSC converters and FACTS controllers. 56
Develop a model to optimize collection, conversion and transformation infrastrutopology and deslines.
Consider and model (both technically and economically) VSC, as the source-end electric energy collection and conversion device, for HVDC systems. This will resul
• Multiple delivery points to the HVDC limited to about 500 MW, about one-fourth capacity of the HVDC lihelp optimize topology design for the 4,000 MW source syste
• Connecting the wind turbines to an AC bus of ideal voltage and freqcomplete VAR control, to minimize complexity and cost of the individual wind turbine generating systems and control systems;
The wind turbines may be equipped with robust and low-cost squirrel-cage induction motors as the generators, with minimum power electronic
• Higher energy conversion losses, in the VCS than in phase commutated conv(PCC) of “conventional” HVDC transmission systems;
• The introduction of mixed HVDC systems, with multi-terminal VSC at source end, and PCC at destination end.
4. Design a complete 4,000 MW HVDC transmission system, including the design options in this report, from a candidate North Dakota source area to
Estimate capacity potential for upgrading extant electric transmission systems, in extant ROW corridors, for North Dakota, and for the entire Great Plains wind resource area. Consider HVDC, especially for long-distance, high-capacity wind energy. Consider “energy pipeline” (below). Estimate cost of several such upgrades especially beneficial to large-scale w(37, 38).
56 See reference 59.
55

FINAL REVIEW DRAFT: 28 Sept 02
8.2
Ele ic ed
ipeline” could also deliver energy as LH2. Combined electricity and hydrogen power , totaling 200 GW. Two such energy d generation capacity of North Dakota.
roupow t even large ones spanning
Alt ly zero, even over long distances, these energy pipelines will require refrigeration and
Thestability, security, and maintenance access. Such TBM-drilled tunnels cost approximately $30
These pabout 4 incompressible, so p v scenari 2 consu es about o . Much research, and pilot-scale projects, will be needed to commercialize this transmission tech
.5 “Energy Pipeline” Superconducting Transmission
ctr Power Research Institute (EPRI), Palo Alto, CA, has conceptually propossuperconducting cables for long-distance, high-capacity (100 GW) low voltage DC (LVDC) electric transmission. 57 With liquid hydrogen (LH2) coolant, this “energy pcapacity might be 100 GWe plus 100 GW as LH2pipelines could accommodate the entire peak win
However, such a pipeline has not been built; capital and O&M costs have been only ghly estimated. 58 Hysteresis energy losses may make such pipelines unsuitable for er levels varying at hourly time scale, as from windplan s –
an entire state. 59
hough steady state DC electric transmission energy loss in a superconductor is near
vacuum-insulation systems, which will consume a fraction of the input energy.
se pipelines may best, or necessarily, be located in tunnels drilled in bedrock, for
0 per ft. 60
ipelines would apparently also suffer the adverse economics of CF limited to 0%, if sized to equal windplant peak generation capacity. LH2 is
ro ides no energy storage in the pipeline, as do the gaseous hydrogen (GH2) pipelineos analyzed in this report. Liquefying hydrogen, from GH2 to LH , mne-third of the energy in the GH2 input – a very costly conversion
nology, which may prove useful for export of Great Plains wind energy.
See references 61, p 4, 6, 28, 31; 62, 63.
58 See references 62 - 64. 59 See reference 64, p 540.
57
60 See reference 66.
56

FINAL REVIEW DRAFT: 28 Sept 02
9. References 1. Environmental Law and Policy Center, Chicago, 2001. Repowering The Midwes
The Clean Energy Development Plan for the Heartland, released February 14, 200
2. B. Gibbs and B. Biewald, Transmitting Windpower from the Dakotas to Chicago: A Preliminary Analysis of a Hydrogen Transmission Scenario, prepared in conjunctionwith “Repowering the Midwest…” for Environmental Law and Policy Center,
t: 1.
a
l and G.L. Gower for PNL, PNL-7789 / NTIS no. DE91018887,
TIS no.
6. D.J. Malcolm and C. Hansen, Results from the WindPACT Rotor Design Study,
Volume II Transmission and Storage, 1977,
Volume III Hydrogen Properties, 1975,
Volume IV Utilization of Hydrogen,
Volume V Implications of Hydrogen Energy.
9. American Gas Association, A Hydrogen - Energy System, 1973.
10. T. N. Veziroglu, editor, Hydrogen Energy, Part A and Part B, Proceedings of the Hydrogen Economy Miami Energy (THEME) Conference, March 18-20, 1974, Plenum Press, NY and London, 1975.
11. Institute of Gas Technology, Hydrogen For Energy Distribution, symposium papers, 24-28 July 78, Chicago.
12. C.A. McAuliffe, Hydrogen and Energy, Gulf Publishing Company, Houston, Texas, 1980.
13. Dr-Ing G. Geghi, editor, Hydrogen: Energy Vector of the Future, Graham & Trotman
Chicago, Illinois, September 8, 2000. At www.synapse-energy.com
3. Pacific Northwest Laboratory 1991. An Assessment of the Available Windy Land Areand Wind Energy Potential in the Contiguous United States, prepared by D.L. Elliott, L.L. Wende l, September.
4. Pacific Northwest Laboratory 1993. Wind Energy Potential in the United States,prepared by D.L. Elliott and M.N. Schwartz for the PNL, PNL-SA-23109 / NDE94001667, September.
5. NREL / WAPA 2000. Dakotas Wind Study, February.
presented at Windpower 2001, Washington, DC, June, 2001.
7. Personal communication with D.J. Malcolm (6), Nov 01.
8. K.E. Cox and K.D. Williams, editors, Hydrogen: Its Technology and Implications, CRC Press, Inc, Cleveland, Ohio:
Volume I Hydrogen Production Technology, 1977,
Limited (English), 1983.
57

FINAL REVIEW DRAFT: 28 Sept 02
14. T.N. Veziroglu and J.B. Tayloof the Fifth World Hydrogen E
r, editors, Hydrogen Energy Progress V: Proceedings nergy Conference, Toronto, Canada, 15-20 July 84. 4
15.
16. Standards,
17.
18. r, C.L. Pierce, and R. Hooper, The Design and Engineering of Cross-
19. and A. Murray, Pipeline Design and Construction: A
21. E / GO-10095-099.
s of the DOE Hydrogen
23. oretical and Engineering Solutions, Kluwer Aca
4. G. R tegrated, Renewable Hydrogen Uti drogen Program Review.
NREL / CP-570-26938.
5. J.M g a Hydrogen Energy Infrastructure, Annual Rev -279.
ansportation of
27. gen,
3.
unlight, Wind, and Biomass Energy, presented at the Renewable and Advanced
30. nd W.A. Amos (NREL), 1999. Studies on the Production and Delivery of Hydrogen from Renewable Resources, presented at the U.S. DOE Hydrogen Program Review. NREL / CP-570-26938.
volumes.
R.P. Dahiya, editor, Progress in Hydrogen Energy: Proceedings of the National Workshop on Hydrogen Energy, New Delhi, July 4-6, 1985, D. Reidel Publishing Company, 1987.
The American Society of Mechanical Engineers, Proceedings of the First International Pipeline Conference, Volume 1: Regulations, Codes, andCurrent Issues, Materials, Corrosion and Integrity, 1996.
E. W. McAllister, editor, Pipe Line Rules of Thumb Handbook, Gulf Publishing Company, Houston, Texas, 1998.
M. MohitpouCountry Hydrogen Pipelines, Journal of Energy Resources Technology, Vol. 110,Pages 203-207, December 1988.
M. Mohitpour, H. Golshan,Practical Approach, ASME Press, NY, 2000.
20. M. Mohitpour, Nov 01, personal communication.
DOE 1995. Hydrogen, The Fuel for the Future, by NREL, DO
22. DOE 1999. Report to Congress on the Status and ProgresProgram, February.
T.O. Saetre, Hydrogen Power: Thedemic Publishers, MA, 1998.
2 ambach (Desert Research Institute), 1999. Inlity Systems, presented at the U.S. DOE Hy
2 . Ogden, 1999. Prospects for Buildiniew of Energy and the Environment, v24: 227
26. R.A. Reynolds and W.L. Slager, General Electric Co. Pipeline TrHydrogen, in (10), pp 533-543
G. Beghi and J. Dejace, Economics of Pipeline Transport for Hydrogen and Oxyin (10), pp 545-560.
28. J.D. Pottier, Hydrogen Transmission for Future Energy Systems, Hydrogen Energy Systems, 1995, pp 181-19
29. M.K. Mann and P.L. Spath, 1999. The Economic Feasibility of Producing Hydrogen from SEnergy Systems for the 21st Century Conference in Lahaina, Maui, Hawaii, April.
M.K. Mann, P.L. Spath, a
58

FINAL REVIEW DRAFT: 28 Sept 02
31. NREL 1999. Survey of the Economics of Hydrogen Technologies, Prepared by C.E.G. Padro and V. Putsche for NREL (U.S. DOE), NREL / TP-570-27079, September.
by
33. Partners), 1999. Integrated Renewable Hydrogen Utility System, 6938.
34. www.netl.doe.gov/scng/news/pdf/NGTworkshops.pdf
sReleases/2001/NR-01-05-11.html
35. ts; 97, Winter/Spring and Summer, 1998, Spring, 1999,
st nd rd th
36. son, J.R. Stewart, J.L. Fink, HVDC ak Ridge National Laboratory
Operating Conference, Yichang, China, September, 2001; also
on, at http://www.electranix.com/Papers/CIGRE-
32. NREL 2000. Blueprint for Hydrogen Fuel Infrastructure Development, PreparedJ. Ohi for NREL (U.S. DOE), NREL / MP-540-27770, January.
F. Barbir (Energypresented at the U.S. DOE Hydrogen Program Review. NREL / CP-570-2
For “zero-emissions” concepts, for coal and other carbon fuels, see:
www.cleanenergysystems.com/WhatsNew/CorpUpdate.html www.llnl.gov/llnl/06news/New
www.llnl.gov/str/June01/Cooper.html, www.zest.org, www.zeca.org
Alliance Pipeline information package: system maps with receipt and delivery poinSystem Update, May and Fall, 191 , 2 , 3 and 4 Quarter, 2000, Calgary.
R.L. Hauth, P.J. Tatro, B.D. Railing, B.K. JohnPower Transmission Technology Assessment, for O(ORNL/Sub/95-SR893/1), April, 1997.
37. K. Sobrink, P.L. Sorensen, E. Joncquel, D. Woodford, VSC Transmission for Wind Farm Integration into Power Systems Study and Practical Experiences, The 4th International HVDC published as Feasibility Study Regarding Integration of the LAESO SYD 160 MWWind Farm Using VSC Transmissi2001-VSCWind.pdf
38. f Electric ions, Electranix Corp for Manitoba HVDC Research Centre
and Manitoba Hydro International, Winnipeg, Manitoba, July 5, 2001.
39. ommunication.
ion.
MA ISBN 0-931790-28-X
44.
45.
D. Woodford, Alberta North-South Transmission Review: an Evaluation oPower Transmission Opt
ABB, Mike Bahrman, Sales Engineer, Nov 01, personal c
40. Siemens, Wilfried Breuer, Christl Norbert, Sales Engineers, Nov 01, personal communication.
41. Nexans, High Voltage and Submarine Cable, Cam Dowlat, Sales Engineer, Nov 01, personal communicat
42. A.B. and L.H. Lovins, Brittle Power: Energy Strategy for National Security, 1982, 2001, Brick House, Andover,
43. Science 294, 1273 (2001), Japan Looks for Bright Answers to Energy Needs.
A.R. Troiano, The Role of Hydrogen and Other Interstitials on the Mechanical Behaviour of Metals, from Transactions of American Society for Metals, AmericanSociety for Metals, Vol 52, 1960, Pages 54-80.
C.G. Interrante, Basic Aspects of the Problems of Hydrogen in Steels, American Society for Metals, Ohio, 1982.
59

FINAL REVIEW DRAFT: 28 Sept 02
46. J.M. Ogden and J.W. Strohbehn, Draft 1/18/95 2.0. Assessment of the Feasibilit
G.F. Steinme
y of Using Hydrogen Blends and Pure Hydrogen in the Existing Natural Gas System
47. tz, Review Presentation for Transmission, Distribution and Bulk Storage
ssociation,
WEA),
53. t
55. 56. 57. 58. ceedings of The International Conference on
59. Wind Versus , August 24, 2001.
Oct 01
99
62. ahl, Longitude 122 West, Inc., System Study of Long le,
Physicist, Nov-Dec 2001, pp 22-23.
64. ,
ANS Winter Meeting, Nov. 13, 2001, Reno, Nevada
of Hydrogen Relative to Natural Gas Supplementation, Baltimore Gas and Electric Company, Maryland, in (14, pp 1187-1200 )
48. Proceedings of HYFORUM: The International Hydrogen Energy Forum, Munich, Germany, September 11-15, 2000.
49. Proceedings of the 12th Annual Meeting of the National Hydrogen AWashington, DC, March 6-8, 2001.
50. Proceedings of Windpower 2001, American Wind Energy Association (AWashington, DC, June 4-7, 2001.
51. G. Czisch and B. Ernst, ISET, Universitat Gesamthochschule Kassel, Germany, High Wind Power Penetration by the Systematic Use of Smoothing Effects Within Huge Catchment Areas Shown in a European Example, in (50).
52. “UNIGEN” system; www.protonenergy.com; http://biz.yahoo.com/prnews/011119/cgm022_1.html
CostSummary….xls; available by reques
54. BreakevenGasCost….xls; available by request
ModelRuns….xls; available by request
O2value….xls; available by request
NREL-WindResReview….xls; available by request
The Japan Hydrogen Forum, ProHydrogen Age of Asia, Tokyo, 27-28 Nov 01.
Science 293, 1438 (2001), M.Z. Jacobson and G.M. Masters, ExploitingCoal
60. W. Leighty, National Hydrogen Transmission Test Facility (NHTTF), 15
61. Electric Power Research Institute (EPRI), Electricity Technology Roadmap: 19
Summary and Synthesis, CI-112677-V1, July 1999
S. Schoenung, W. Hassenz Distance Low Voltage Transmission Using High Temperature Superconducting Cab for Electric Power Research Institute, report WO8065-12, March 1997.
63. P. Grant, Electric Power Research Institute, Will MgB2 Work?, The Industrial
R. Garwin, J. Matisoo, Superconducting Lines for the Transmission of Large Amounts of Electrical Power over Great Distances, Proceedings of the IEEE, Vol. 55 No. 4, April 1967
65. C. Starr, President Emeritus, EPRI, National Energy Planning for the Century,
60

FINAL REVIEW DRAFT: 28 Sept 02
66. J. Friant, Colorado School of Mines, for The American Physical Society, Report on Pipetron Tunnel Construction Issues, July 8, 1996
67. V. Pecharsky, V. Balema, USDOE Ames Laboratory and Iowa State University, Mechanochemically Induced Solid-state Transformations of Complex Aluminohydrides, EPD Congress, The Minerals, Metals & Materials Society, 2002
formation in LiAlH4 During High-energy Ball
69. . Pruski, V. Pecharsky, USDOE Ames
High-energy Ball Milling, Journal of alloys and
70.luminohydride, Chem.
71. Systems, John Wiley & Sons, pter 4, pp 181-264, “The Transfer of
Electrical Energy to the Supply Grid”
oring Hydrogen, NREL/TP-570-25106,
73. , 14 World Hydrogen Energy Conference, Montreal, 9-13 June 02
68. V. Balema, V. Pecharsky, K. Dennis, USDOE Ames Laboratory and Iowa State University, Solid State Phase TransMilling, Journal of alloys and Compounds, 313 (2000) 69 - 74
V. Balema, J. Wiench, K. Dennis, MLaboratory and Iowa State University, Titanium Catalyzed Solid-state Transformations in LiAlH4 DuringCompounds, 329 (2001) 108 - 114
V. Balema, K. Dennis, V. Pecharsky, Rapid Solid-state Transformation of Tetrahedral [AlH4]- into Octahedral [[AlH6]3- in Lithium ACommun., 2000, 1665 - 1666
S. Heier, Grid Integration of Wind Energy Conversion1998, ISBN 0 471 97143 X, especially Cha
72. W. Amos, Costs of Transporting and StNov 98
Proceedings th
61

FINAL REVIEW DRAFT: 28 Sept 02
Appendix A: Total Project Costs with Wind at $950 and $700 per kW*
Percent Scenario
Total Annual Costs Wind at $950 per kW
Total Annual Costs Wind at $700 per kW Reduction
36-C-FC Wind Energy $566,824,494 $436,824,494 22.93%
ipeline $334,000,000 $334,000,000 lectrolyzer $192,000,000 $192,000
P E ,000 Fuel Cells $340,853,157 $340,853,157 Compressor $37,300,000 $37,300,000
otal $1,470,977,651 $1,340,977,651 -C-CT
ind Energy $556
T 8.84% 36 W ,591,434 $426,591,434 23.36% Pipeline $334,000,000 $334,000,000 Electrolyzer $192,000,000 $192,000,000
uel Cells $161,888,787 $161,888,787 ompressor
F C $37,300,000 $37,300,000 Total $1,281,780,222 $1,151,780,222 10.14% 36-NC-FC
ind Energy $566,824,494 $436,824,494 22.9ipeline $308,000
W 3% P ,000 $308,000,000 Electrolyzer $192,000,000 $192,000,000 Fuel Cells $340,853,157 $340,853,157
ompressor C $0 $0 Total $1,407,677,651 $1,277,677,651 9.24% 36-NC-CT Wind Energy $556,591,434 $426,591,434 23.36% Pipeline $308,000,000 $308,000,000 Electrolyzer $192,000,000 $192,000,000 Fuel Cells $170,522,089 $170,522,089 Compressor $0 $0 Total $1,227,113,523 $1,097,113,523 10.59% 18-NC-FC Wind Energy $570,882,356 $440,882,356 22.77% Pipeline $139,000,000 $139,000,000 Electrolyzer $140,000,000 $140,000,000 Fuel Cells $343,185,262 $343,185,262 Compressor $0 $0 Total $1,193,067,617 $1,063,067,617 10.90% 18-NC-CT Wind Energy $559,915,032 $429,915,032 23.22% Pipeline $139,000,000 $139,000,000 Electrolyzer $140,000,000 $140,000,000 Fuel Cells $172,432,202 $172,432,202 Compressor $0 $0 Total $1,011,347,234 $881,347,234 12.85%
*Figures shown are annualized costs. Annual wind costs are calculated as total installed costs multiplied by a 12-percent annual capital recovery factor, plus annual O&M costs.
62
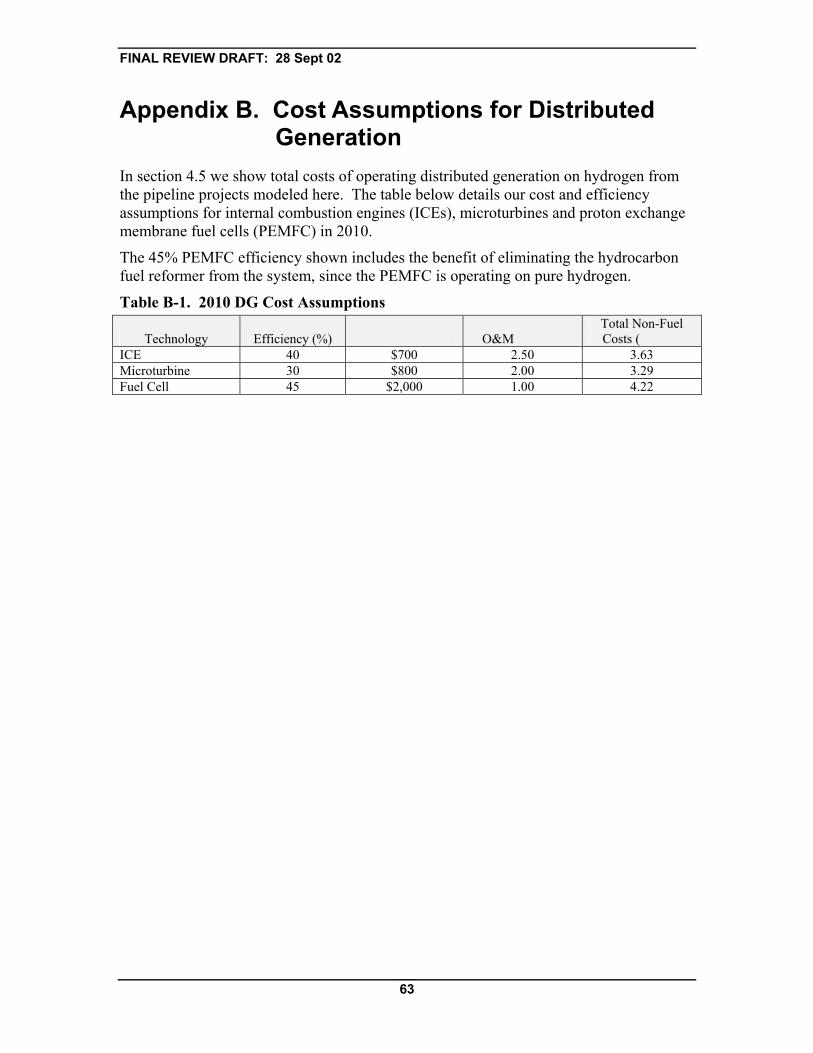
FINAL REVIEW DRAFT: 28 Sept 02
Appendix B. Cost Assumptions for DistributedGeneration
In section 4 5 we show tot g distrib hydro the pipeline projects mod below effica ns for interna combustion engines (ICEs), microturbines and proton exchange m cells (PEMFC) in 20
T FC efficiency shown benefit of eli h drocarbon f r from the system, since the PEMFC is operating on pure hydrogen.
T -1. 2010 DG Cost Assum
. al costs of operatin uted generation on gen fromiency eled here. The table details our cost and
ssumptio l embrane fuel 10.
he 45% PEM includes the minating the yuel reforme
able B ptions
Technology Capital ($/kW) (¢/kWh) To
¢/kWh) CE $700 .50
icroturbine $800 .00 uel Cell $2,000 .00
Efficiency (%) O&Mtal Non-Fuel
Costs (I 40 2 3.63 M 30 2 3.29 F 45 1 4.22
63

FINAL REVIEW DRAFT: 28 Sept 02
Appendix C: Energy Conversion Factors for Hydrogen
100 68.9 b ater
10.5 scf per10,500 scf p r = 297. er hr = 3.6 GJ per hr
GW = 10.5 Mscf per hr = 297,500 Nm3 per hr = 3,600 GJ per hr 1 TW = 10.5 Bscf per hr = 297.5 MNm3 per hr = 1 Mscf per hr = 327 mmBtu per hr Energy 1 GJ = 277.8 kWh = 2,915 scf = 75.36 Nm3 = 10^9 J 1 kWh = 10.5 scf = 0.298 Nm3 = 0.95 mmBtu 1 MWh = 10,500 scf = 297.5 Nm3 = 3.6 GJ 1 GWh = 10.5 Mscf = 297,500 Nm3 = 3,600 GJ = 3,430 mmBtu 1 TWh = 10.5 Bscf = 297.5 MNm3 = 3.6 PJ 1 kg H2 = 11.08 NM3 = 128.8 MJ (HHV) = 135,100 Btu = 375.6 scf 10^6 scf = 343 GJ = 26,850 Nm3 1 lb H2 = 5.04 Nm3 = 0.0585 GJ (HHV) = 16.26 kWh = 187.8 scf 1 Nm3 H2 = 0.09 kg = 3.361 kWh 1 scf H2 = 343 kJ = 325 Btu (HHV) 1 kWh = 3,410 Btu 1 scf natural gas = 1,010 Btu Kilo = 10^3, Mega = 10^6, Giga = 10^9, Tera = 10^12, Peta = 10^15, Quad = 10^15, Exa = 10^18
Volume 1 Nm3 = 35.315 cubic ft (scf) Pressure 1 Mpa = 145 psi = 9.9 atm 1 atm = 14.696 psi = 1.01325 bar
0 psi = ar = 68.05 m Pow1 kW = hr 1 MW = er h 5 Nm3 p1
64

FINAL REVIEW DRAFT: 28 Sept 02
Appendix D: Generation - Transmission Systems
D.1. Electricity Transmission (see also reference 71)
Figure D-1. Simplified “Electrical Transmission” Scenario
Flowcharts
n HVDC to ACerte End users
1,000 miles+ / - 500 kv HVDC
ak Chicago
WindGenerators
North D ota
CollectioSystem Converter Conv r "STIFF"
AC grid
AC to HVDC
Station Station
WindGenerators
Figure D “Electrical ansmission” S rio HV-2. Tr cena DC-C, with eastern 100
ing urbmiles underground, to facilitate permitting and ROW acquisition approach Chicago an area
CollectionSystem Converter
StationConverter
Station
"STIFF"AC grid End users
WindGenerators
1,000 miles+ / - 500 kv HVDC
kota Chicago
ilesunderground
Wind Last 100 mGenerators
North Da
AC to HVDC HVDC to AC
65

FINAL REVIEW DRAFT: 28 Sept 02
Figure D-3. “Electrical Transmission” Scenario requires two, parallel, 2000 MW circuits for 4000 MW total capacity; 3000 MW is the highest practical
HVDC circuit. capacity for a single
CollectionSystem
AC to HVDCConverter
Station
HVDC to ACConverter
Station"STIFF"AC grid End users
Wind
WindGenerators
1,000 miles+ / - 500 kv HVDC
4,000 MW
North Dakota Chicago
2,000 MWAC to HVDC
ConverterStation
2,000 MWHVDC to AC
ConverterStation
2,000 MW 2,000 MWGenerators
Figure D-4. “Conventional” HVDC bipole transmission detail. Line-ommutated Converters (LCC), 60 Hz collection buses in ND. Power lectronics control variable speed, power factor, and harmonics.
CE
LCCHVDC - AC
LCCAC - HVDC
PE
PE
"STIFF"AC grid
North Dakota Chicago
1,000 miles HVDC lineLine-commutated converter stations,
1 - 3 GW eachPE = Power Electronics
60 Hz buses
+ 500 kv
- 500 kv
66

FINAL REVIEW DRAFT: 28 Sept 02
Figure D-5. “Conventional” HVDC Bipole transmission with multiple input nodes via multiple Line-Commutated Converter (LCC) stations.
LCCHVDC - AC
LCC #1AC - HVDC
PE
PE
North Dakota Chicago
1,000 miles HVDC line+ / - 500 kv60 Hz buses
LCC #2AC - HVDC
LCC #3AC - HVDC
PE
LCC = Line-Commutated Converter
"STIFF"AC grid
Figure D-6. Voltage-Source Converters (VSC) at ND source may allow wind enerators to operate with simple squirrel-cage induction generators,
without power electronics, grouped on independent variable voltage, variable-frequency buses
g
LCCHVDC - AC
VSCVv, Vf
AC - HVDC
"STIFF"AC grid
North Dakota Chicago
Variable-voltage,Variable-frequency
buses
+ 500 kv
- 500 kv
1,000 miles HVDC lines
Squirrel-cageInduction
Generators
Voltage-Source Converter(VSC) stations in ND,300 - 500 MW eachLine-Commutated Converter (LCC) station in Chicago,1 - 3 GW each
67

FINAL REVIEW DRAFT: 28 Sept 02
Figure D-7. HVDC Bipole transmission with multiple input nodes via multiple “VSC” Voltage-Source Converter stations in ND, feeding “conventional” LCC converter stations in Chicago.
LCCHVDC - AC
VSC #1Vv, Vf
AC - HVDC
"STIFF"AC grid
North Dakota Chicago
Voltage-Source Converter stations in ND, 300 - 500 MW eachLine-Commutated Converter station in Chicago, 1 - 3 GW
Variable-voltage,Variable-frequency
buses
+/- 500 kv
1,000 miles HVDC line
Squirrel-cageInduction
Generators
VSC #2Vv, Vf
AC - HVDC
D.2. Hydrogen Transmission Figure D-8. Simplified “Hydrogen Transmission” scenario, delivering electricity in Chicago
Electrolyzers Compressors GeneratorsICE, CT, FC
AC gridWholesale
End usersRetail
WindGenerators
WindGenerators
1,000 milesHydrogen Gas Pipeline
36" diameter~ 1,000 psi
Storage: 120 GWhat 1000 - 500 psi
68

FINAL REVIEW DRAFT: 28 Sept 02
Figure D-9. Simplified “Hydrogen Transmission” scenario, delivering
ydrogen in Chicago to various users h
Electrolyzers Compressors
GeneratorsICE, CT, FC
AC gridWholesale
End usersRetail
WindGenerators
WindGenerators
1,000 milesHydrogen Gas
Pipeline18 - 36" diameter
~ 1,000 psi
Cars, Buses,Trucks, Trains
Liquefy Aircraft Fuel
Storage: 120 GWh
Figure D-10. “Hydrogen Transmission” scenario, delivering hydrogen in hicago to various users, with several potential storage resources in ddition to pipeline storage
Ca
Electrolyzers Compressors
GeneratorsICE, CT, FC
AC gridWholesale
End usersRetail
WindGenerators
WindGenerators
1,000 miles Hydrogen GasPipeline 18 - 36" diameter ~ 1,000 psi
Cars, Buses,Trucks, Trains
Liquefy Aircraft Fuel
36" Pipeline Storage = 120 GWh
GeologicStorage ?
Storage
Storage
Storage
69

FINAL REVIEW DRAFT: 28 Sept 02
Figure D-11. “Hydrogen Transmission” scenario, synergy with coal asification plants near wind energy source, using byproduct oxygen from g
electrolyzers C
Electrolyzers Compressors
GeneratorsICE, CT,
FC
AC gridWholesale
End usersRetail
WindGenerators
WindGenerators
1,000 milesHydrogen Gas
Pipeline18 - 36" diameter
~ 1,000 psi
Cars, Buses,Trucks, Trains
Liquefy Aircraft Fuel
H 2
CoalGasification
Plant
O 2
Syngas
CT, ICE Generator Grid
Reactors Chemicals
Water-shiftReactionH 2
CO 2
O 2
Sequestration ?
H20
CO 2 Sequestration ?
Sequestration ?
H20
H20
Figure D-12. High pressure output electrolyzers eliminate compressorpipeline input, saving capital
s at cost and energy. Mid-line compression may
be required. This scenario shows electricity delivery in Chicago.
ElectrolyzersGeneratorsICE, CT, FC
AC gridWholesale
End usersRetail
WindGenerators
WindGenerators
1,000 milesHydrogen Gas Pipeline
18 - 36" diameter~ 1,000 psi
Compressors
O 2
H 2
Byproduct Heat and WaterByproduct heat
H20
70

FINAL REVIEW DRAFT: 28 Sept 02
Figure D-13. In Hydrogen Transmission scenario, hydrogen may bdelivered to the pipeline, anywhere along it, from numerous and varied sources, via n
e
odes of widely varying capacity: perhaps 1 - 500 MW ea.
Low-pressureElec CompressorPE
Low-pressureElectrolyzer CompressorPE
ND Windplant
MN Windplant
BiomassDigester CompressorMN Biomass
CoalGasification CompressorND Coal
O2
Chicago:DG fuelGround Trans FuelAircr
Hydrogen Gas Pipeline18 - 36 " diam, 1000 psi
PE High-pressureElectrolyzer
IA Windplant
trolyzer
aft Fuel
Figure D-14. Delivery nodes to hydrogen pipeline may be simple, of widely-varying capacity, located anywhere along the pipeline.
Compressor
Meter
Compressor
Meter
Pipe Boss Pipe Boss
H2 H2
ShutoffValve
ShutoffValve
Hydrogen Gas Pipeline
10 MWWindplant +Electrolyzers
5 MWBiomass
Plant
71

FINAL REVIEW DRAFT: 28 Sept 02
Figure D-15. Collection topology options for hydrogen transmission: a combination of electric wiring and piping for water, hydrogen, and oxygen (if latter is to be sold near windplants). Electrolyzers may be located at individual wind generators or grouped. Power electronics is required to rectify AC to DC required by electrolyzers.
Electrolyzer
H2O
H2
O2
Electrolyzer
H2O
H2
O2PE
PETo Compressor orHydrogen Pipeline
To Compressor orHydrogen Pipeline
PE: Power Electronics
Electrolyzer
72

FINAL REVIEW DRAFT: 28 Sept 02
Figure D-16. Conceptually, energy may be stored as oxygen in geologicformations in North Dakota for use by coal gasification plants when windplant output is low. However, this has not been studied nor tested;oxidation of subterranean formations may quickly destroy the reservoir.
Electrolyzers Compressors
GeneratorsICE, CT,
FC
AC gridWholesale
End usersRetail
WindGenerators
WindGenerators
1,000 milesHydrogen Gas
Pipeline
Cars, Buses,Trucks, Trains
Liquefy Aircraft Fuel
H 2
CoalGasification
Plant
O 2
Syngas
CT, ICE Generator Grid
Reactors Chemicals
Water-shiftReactionH 2
CO 2
CO 2
Sequestration ?
H20
CO 2 Sequestration ?
Sequestration ?
H20
H20
Geologic Hydrogen storage ?Geologic Oxygen storage in ND ?
73