transmission planning process and · pdf file2. 230 kv transmission planning process ... 9 9....
TRANSCRIPT

A subsidiary of Pinnacle West Capital Corporation
TRANSMISSION PLANNING
PROCESS AND GUIDELINES
APS Transmission Planning January 2014

i
Table of Contents I. INTRODUCTION AND PURPOSE ...................................................................................................... 3 II. PLANNING METHODOLOGY ....................................................................................................... 3
A. General .............................................................................................................................................. 3 B. Transmission Planning Process ......................................................................................................... 4
1. EHV Transmission Planning Process ............................................................................................ 4 2. 230 kV Transmission Planning Process ........................................................................................ 5 3. Transmission Facilities Required for Generation/Resource Additions ......................................... 5
C. Ten Year Transmission System Plans ............................................................................................... 5 D. Regional Coordinated Planning ......................................................................................................... 5
1. Western Electricy Coordinating Council (WECC) ....................................................................... 6 2. Technical Task Force and ad-hoc Work Groups ........................................................................... 6 3. Sub-Regional Planning Groups ..................................................................................................... 6 4. WestConnect ................................................................................................................................. 7 5. Joint Studies .................................................................................................................................. 7
E. Generation Schedules ........................................................................................................................ 7 F. Load Projections ................................................................................................................................ 8 G. Alternative Evaluations ..................................................................................................................... 8
1. General .......................................................................................................................................... 8 2. Power Flow Analyses.................................................................................................................... 8 3. Transient Stability Studies ............................................................................................................ 9 4. Short Circuit Studies ..................................................................................................................... 9 5. Reactive Power Margin Analyses ................................................................................................. 9 6. Losses Analyses ............................................................................................................................ 9 7. Transfer Capability Studies ........................................................................................................... 9 8. Subsynchronous Resonance (SSR) ............................................................................................... 9 9. FACTS (Flexible AC Transmission System ............................................................................... 10 10. Economic Evaluation .................................................................................................................. 10
III. PLANNING ASSUMPTIONS ........................................................................................................ 10 A. General ............................................................................................................................................ 10
1. Loads ........................................................................................................................................... 10 2. Generation and Other Resources ................................................................................................. 10 3. Normal Voltage Levels ............................................................................................................... 10 4. Sources of Databases .................................................................................................................. 11 5. Voltage Control Devices ............................................................................................................. 11 6. Phase Shifters .............................................................................................................................. 11 7. Conductor Sizes .......................................................................................................................... 11 8. 69 kV System Modeling ............................................................................................................. 12 9. Substation Transformers ............................................................................................................. 12 10. Switchyard Arrangements ........................................................................................................... 13 11. Series Capacitor Application....................................................................................................... 14 12. Shunt and Tertiary Reactor Application ...................................................................................... 14
B. Power Flow Studies ......................................................................................................................... 14 1. System Stressing ......................................................................................................................... 14 2. Displacement ............................................................................................................................... 15
C. Transient Stability Studies ............................................................................................................... 15 1. Fault Simulation .......................................................................................................................... 15

ii
2. Margin ......................................................................................................................................... 15 3. Unit Tripping .............................................................................................................................. 15 4. Machine Reactance Representation ............................................................................................ 15 5. Fault Damping ............................................................................................................................ 15 6. Series Capacitor Switching ......................................................................................................... 16
D. Short Circuit Studies ....................................................................................................................... 16 1. Generation Representation .......................................................................................................... 16 2. Machine Reactance Representation ............................................................................................ 16 3. Line Representation .................................................................................................................... 16 4. Transformer Representation ........................................................................................................ 16 5. Series Capacitor Switching ......................................................................................................... 16
E. Reactive Power Margin Studies ...................................................................................................... 17 IV. SYSTEM PERFORMANCE ........................................................................................................... 17
A. Power Flow Studies ......................................................................................................................... 17 1. Normal (Base Case Conditions) .................................................................................................. 17 2. Single and selected Double Contingency Outages ...................................................................... 18
B. Transient Stability Studies ............................................................................................................... 20 1. Fault Simulation .......................................................................................................................... 20 2. Series Capacitor Switching ......................................................................................................... 20 3. System Stability .......................................................................................................................... 20 4. Re-closing ................................................................................................................................... 21 5. Short Circuit Studies ................................................................................................................... 21 6. Reactive Power Margin Studies .................................................................................................. 21

3
I. INTRODUCTION AND PURPOSE
The Transmission Planning Process and Guidelines (Guidelines) are used
by Arizona Public Service Company (APS) to assist in planning its Extra High
Voltage (EHV) transmission system (345 kV and 500 kV) and High Voltage
transmission system (230 kV and 115 kV). In addition to these Guidelines, APS
follows the Western Electricity Coordinating Council’s (WECC) System
Performance Criteria (TPL-001-WECC-CRT-02) in addition to NERC Table 1.
II. PLANNING METHODOLOGY
A. General
APS uses a deterministic approach for transmission system planning.
Under this approach, system performance should meet certain specific criteria
under normal conditions (all lines in-service), for any single contingency
condition and for selected double contingency conditions as defined under TPL-
001-WECC-CRT-02. In general, an adequately planned transmission system will:
• Provide an acceptable level of service that is cost-effective for normal,
single and selected double contingency conditions.
• Maintain service to all firm loads for any single or selected double
contingency outages; except for radial loads.
• Not result in overloaded equipment or unacceptable voltage conditions for
single or selected double contingency outages.
• Not result in cascading for single or selected double contingency outages.
• Provide for the proper balance between the transmission import capability
and local generation requirements for an import limited load area.
Although APS uses a deterministic approach for transmission system
planning, the WECC reliability planning criteria provides for exceptions based on
methodologies provided by the WECC RPEWG. Historical system reliability
performance is analyzed on a periodic basis and the results are used in the design
of planned facilities.
These planning methodologies, assumptions, and guidelines are used as
the basis for the development of future transmission facilities. Additionally,
4
consideration of potential alternatives to transmission facilities (such as
distributed generation or new technologies) is evaluated on a case-specific basis.
As new planning tools and/or information become available revisions or
additions to these guidelines will be made as appropriate.
B. Transmission Planning Process
APS’ transmission planning process consists of an assessment of the
following needs:
• Provide adequate transmission to access designated network resources
in-order to reliably and economically serve all network loads.
• Support APS’ and other network customers’ local transmission and
sub-transmission systems.
• Provide for interconnection to new resources.
• Accommodate requests for long-term transmission access.
During this process, consideration is given to load growth patterns, other
system changes affected by right-of-way, facilities siting constraints, routing of
future transportation corridors, and joint planning with neighboring utilities,
governmental entities, and other interested stakeholders (see APS OATT
Attachment (E)).
1. EHV Transmission Planning Process
APS’ EHV transmission system, which consists of 500 kV and 345 kV, has
primarily been developed to provide transmission to bring the output of large
base-loaded generators to load centers, such as Phoenix. Need for new EHV
facilities may results from any of the bullet items described above. APS’ annual
planning process includes an assessment of APS’ transmission capability to
ensure that designated network resources can be accessed to reliably and
economically serve all network loads. In addition, Reliability Must-Run (RMR)
studies are selectively performed to ensure that proper balance between the
transmission import capability and local generation requirements for an import
limited load area are maintained.
5
2. 230 kV Transmission Planning Process
APS’ 230 kV transmission system has primarily been developed to provide
transmission to distribute power from the EHV bulk power substations and local
generators to the distribution system and loads throughout the load areas.
Planning for the 230 kV system assesses the need for new 230/69 kV
substations to support local sub-transmission and distribution system growth and
the reliability performance of the existing 230 kV system. This process takes into
account the future land use plans that were developed by government agencies,
Landis aerial photo maps, master plans that were provided by private developers,
and APS’ long-range forecasted load densities per square mile for residential,
commercial, and industrial loads.
3. Transmission Facilities Required for Generation/Resource Additions
New transmission facilities may also be required in conjunction with
generation resources due to (1) a “merchant” request by an Independent Power
Producer (IPP) for generator interconnection to the APS system, (2) a “merchant”
request for point-to-point transmission service from the generator (receipt point)
to the designated delivery point, or (3) designation of new resources or re-
designation of existing units to serve APS network load (including removal of an
older units’ native load designation). These studies/processes are performed
pursuant to the APS Open Access Transmission Tariff (OATT).
C. Ten Year Transmission System Plans
Each year APS uses the planning process described in section B to update
the Ten Year Transmission System Plan. The APS Ten Year Transmission
System Plan identifies all new transmission facilities, 115 kV and above, and all
facility replacements/upgrades required over the next ten years to reliably and
economically serve the load.
D. Regional Coordinated Planning

6
1. Western Electricy Coordinating Council (WECC)
APS is a member of the WECC. The focus of the WECC is promoting the
reliability of the interconnected bulk electric system. The WECC provides the
means for:
• Developing regional planning and operating criteria.
• Coordinating future plans.
• Establishing new or modifying existing WECC Path Ratings through
procedures.
• Compiling regional data banks, including the BCCS, for use by the
member systems and the WECC in conducting technical studies.
• Assessing and coordinating operating procedures and solutions to regional
problems.
• Establishing an open forum with interested non-project participants to
review the plan of service for a project.
• Through the WECC Transmission Expansion Policy Committee,
performing economic transmission congestion analysis.
APS works with WECC to adhere to these planning practices.
2. Technical Task Force and ad-hoc Work Groups
Many joint participant projects in the Desert Southwest rely on technical study
groups for evaluating issues associated with their respective projects. These
evaluations often include studies to address various types of issues associated
with transfer capability, interconnections, reliability and security. APS actively
participates in many of these groups such as the Western Arizona Transmission
System Task Force, Four Corners Technical Task Force and the Eastern Arizona
Transmission System Task Force.
3. Sub-Regional Planning Groups
Southwest Area Transmission Planning (SWAT) and other sub-regional
planning groups provide a forum for entities within a region, and any other
interested parties, to determine and study the needs of the region as a whole. It
also provides a forum for specific projects to be exposed to potential partners and
allows for joint studies and participation from interested parties.

7
4. WestConnect
APS and the other WestConnect members executed the WestConnect Project
Agreement for Subregional Transmission Planning in May of 2007. This
agreement promotes coordination of regional transmission planning for the
WestConnect planning area by formalizing a relationship among the WestConnect
members and the WestConnect area sub-regional planning groups including
SWAT. The agreement provides for resources and funding for the development
of a ten year integrated regional transmission plan for the WestConnect planning
area. The agreement also ensures that the WestConnect transmission planning
process will be coordinated and integrated with other planning processes within
the Western Interconnection and with the WECC planning process.
5. Joint Studies
In many instances, transmission projects can serve the needs of several
utilities and/or IPPs. To this end, joint study efforts may be undertaken. Such
joint study efforts endeavor to develop a plan that will meet the needs and desires
of all individual companies involved.
E. Generation Schedules
For planning purposes, economic dispatches of network resources are
determined for APS’ system peak load in the following manner:
• Determine base generation available and schedule these units at maximum
output.
• Determine resources purchased from other utilities, IPPs, or power
marketing agencies.
• Determine APS’ spinning reserve requirements.
• Schedule intermediate generation (oil/gas steam units) such that the
spinning reserve requirements, in section (c) above, are met.
• Determine the amount of peaking generation (combustion turbine units)
required to supply the remaining system peak load.

8
Phoenix area network resources are dispatched based on economics and
any existing import limitations. When possible, spinning reserve will be carried
on higher cost Phoenix area network generating units.
Generation output schedules for interconnected utilities and IPPs are based
upon consultation with the neighboring utilities and IPPs or as modeled in the
latest data in WECC coordinated study cases.
F. Load Projections
APS substation load projections are based on the APS Corporate Load
Forecast. Substation load projections for neighboring interconnected utilities or
power agencies operating in the WECC area are based on the latest data in WECC
coordinated study cases. Heavy summer loads are used for the Ten Year
Transmission System Plans.
G. Alternative Evaluations
1. General
In evaluating several alternative plans, comparisons of power flows, transient
stability tests, and fault levels are made first. After the alternatives are found that
meet the system performance criteria in each of these three areas comparisons
may be made of the losses, transfer capability, impact on system operations, and
reliability of each of the plans. Finally, the costs of facility additions (capital cost
items), costs of losses, and relative costs of transfer capabilities are determined.
A brief discussion of each of these considerations follows.
2. Power Flow Analyses
Power flows of base case (all lines in-service) and single contingency
conditions are tested and should conform to the system performance criteria set
forth in Section IV of these Guidelines. Double or multiple contingencies are also
examined in the context of common mode and common corridor outages. Normal
system voltages, voltage deviations, and voltage extreme limitations are based
upon operating experience resulting in acceptable voltage levels to the customer.

9
Power flow limits are based upon the thermal ratings and/or sag limitations of
conductors or equipment, as applicable.
3. Transient Stability Studies
Stability guidelines are established to maintain system stability for single
contingency, three-phase fault conditions. Double or multiple contingencies are
also examined in the context of common mode and common corridor outages.
4. Short Circuit Studies
Three-phase and single-phase-to-ground fault studies are performed to ensure
the adequacy of system protection equipment to clear and isolate faults.
5. Reactive Power Margin Analyses
Reactive Power Margin analyses are performed when steady-state analyses
indicate possible insufficient voltage stability margins. V-Q curve analyses are
used to determine post-transient voltage stability.
6. Losses Analyses
A comparison of individual element and overall transmission system losses
are made for each alternative plan being studied. The losses computed in the
power flow program consist of the I2R losses of lines and transformers and the
core losses in transformers, where represented.
7. Transfer Capability Studies
In evaluating the relative merits of one or more EHV transmission plans, non-
simultaneous ratings are determined using methodologies consistent with WECC
Path Rating Procedures as defined in the WECC Project Coordination and Path
Rating Processes manual and NERC Standard MOD-029-1. In addition,
simultaneous relationships are identified that can either be mitigated through use
of nomograms, operating procedures or other methods.
8. Subsynchronous Resonance (SSR)
SSR phenomenon result from the use of series capacitors in the network
where the tuned electrical network exchanges energy with a turbine generator at
one or more of the natural frequencies of the mechanical system. SSR
countermeasures are applied to prevent damage to machines as a result of
transient current or sustained oscillations following a system disturbance. SSR

10
studies are not used directly in the planning process. SSR countermeasures are
determined after the transmission plans are finalized.
9. FACTS (Flexible AC Transmission System
FACTS devices are a recent application of Power Electronics to the
transmission system. These devices make it possible to use circuit reactance,
voltage magnitude and phase angle as control parameters to redistribute power
flows and regulate bus voltages, thereby improving power system operation.
FACTS devices can provide series or shunt compensation. These devices can
be used as a controllable voltage source in series or as a controllable current
source in shunt mode to improve the power transmission system operations.
FACTS will be evaluated as a means of power flow control and/or to provide
damping to dynamic oscillations where a need is identified and it is economically
justified. Examples include DSTATCOM for powerfactor correction and the
DVR for dynamic voltage regulation for distribution loads.
10. Economic Evaluation
In general, an economic evaluation of alternative plans consists of a
cumulative net present worth or equivalent annual cost comparison of capital
costs.
III. PLANNING ASSUMPTIONS
A. General
1. Loads
Loads used for the APS system originate from the latest APS Corporate Load
Forecast. In most cases, the corrected power factor of APS loads is 99.5% at 69
kV substations.
2. Generation and Other Resources
Generation dispatch is based on firm power and/or transmission wheeling
contracts including network resources designations.
3. Normal Voltage Levels
11
Nominal EHV design voltages are 500 kV, 345 kV, 230 kV, and 115 kV.
Nominal EHV operating voltages are 535 kV, 348 kV, 239 kV, and 119 kV, with
exceptions to certain buses.
4. Sources of Databases
APS currently relies on WECC cases and internal data listings as their
depository of EHV and HV system data and models. WECC has chosen to pursue
a relational database (i.e. Base Case Coordination System) to maintain data and
models for its members in addition to using WECC base cases. APS will begin to
use the BCCS as the system becomes available.
5. Voltage Control Devices
Devices which can control voltages are shunt capacitors, shunt reactors, tap-
changing-under-load (TCUL) and fixed-tap transformers, static Volt Ampere
Reactive (VAR) compensators, and machine VAR capabilities. If future voltage
control devices are necessary, these devices will be evaluated based upon
economics and the equipment’s ability to obtain an adequate voltage profile on
the EHV and HV systems. Currently, APS has TCULs on only its 500 kV
autotransformers except for a few transformers. Other than operator control, the
TCUL transformers do not automatically regulate voltages.
6. Phase Shifters
For pre-disturbances scenarios, phase shifters may be used to hold flows
depending on the objectives of the study. For post-disturbance scenarios, the
phase shifters are assumed to not hold flows and are not automatically regulated.
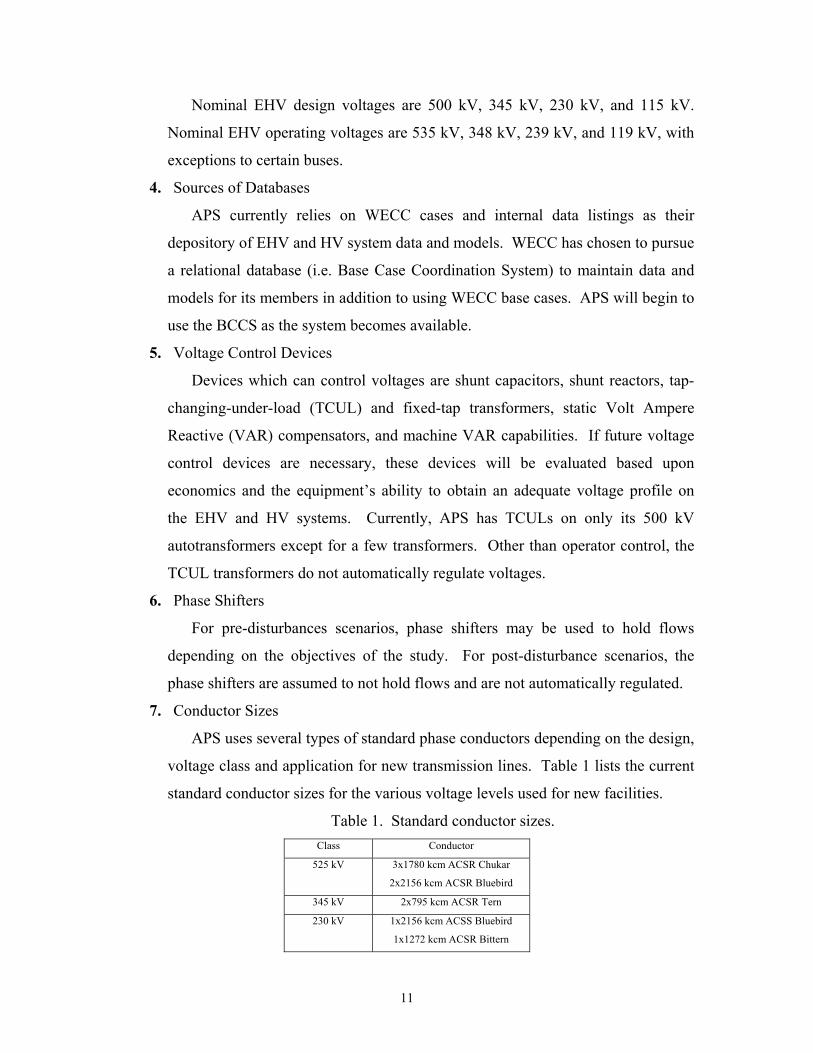
7. Conductor Sizes
APS uses several types of standard phase conductors depending on the design,
voltage class and application for new transmission lines. Table 1 lists the current
standard conductor sizes for the various voltage levels used for new facilities.
Table 1. Standard conductor sizes.
Class Conductor
525 kV 3x1780 kcm ACSR Chukar
2x2156 kcm ACSR Bluebird
345 kV 2x795 kcm ACSR Tern
230 kV 1x2156 kcm ACSS Bluebird
1x1272 kcm ACSR Bittern

12
1x795 kcm ACSR Tern
115 kV (same as 230 kV construction)
69 kV 1x795 kcm ACSS Tern
1x795 kcm AA Arbutus
1x336 kcm ACSR Linnet
8. 69 kV System Modeling
230 kV facility outages may impact the underlying 69 kV system due to the
interconnection of those systems. For this reason, power flow cases may include
a detailed 69 kV system representation. Solutions to any problems encountered
on the 69 kV system are coordinated with the subtransmission planning engineers.
9. Substation Transformers
• 500 kV and 345 kV Substations
Bulk substation transformer banks may be made up of one three-phase or
three single-phase transformers, depending upon bank size and economics.
For larger banks where single-phase transformers are used, a fourth (spare)
single-phase transformer will be used in a jack-bus arrangement to improve
reliability and facilitate connection of the spare in the event of an outage of
one of the single-phase transformers.
TCULs are typically used on the 525 kV transformers generally with a
range of plus or minus 10% of nominal voltage. Primary voltages will be 525
kV or 345 kV, and secondary voltages will be 230 kV or 69 kV and tertiary
voltages will be 34.5 kV, 14.4 kV or 12.47 kV.
• 230 kV Substations
For high-density load areas, both 230/69 kV and 69/12.5 kV transformers
can be utilized. 230/69kV transformers will be rated at 113/150/188 MVA
with a 65οC temperature rise, unless otherwise specified. 69/12.5kV
transformers will be rated at 25/33/41 MVA with a 65οC temperature rise,
unless otherwise specified.
With all elements in service, a transformer may be loaded up to its top
Forced Air (ONAF) rating without sustaining any loss of service life. For a
single contingency outage (loss of one transformer) the remaining new

13
transformer or transformers may be loaded up to 25% above their top ONAF
rating, unless heat test data indicate a different overload capability. The loss
of service life sustained will depend on the transformer pre-loading and the
outage duration. No-load tap setting adjustment capabilities on 230/69 kV
transformers will be ±5% from the nominal voltage setting (230/69 kV) at
2½% increments.
10. Switchyard Arrangements
• 500 kV and 345 kV Substations Existing 345 kV switchyard arrangements use breaker-and-one-half, main-
and-transfer, or modified paired-element circuit breaker switching schemes.
Because of the large amounts of power transferred via 500 kV switchyards
and the necessity of having adequate reliability, all 500 kV circuit breaker
arrangements are planned for an ultimate breaker-and-one-half scheme. If
only three or four elements are initially required, the circuit breakers are
connected in a ring bus arrangement, but physically positioned for a breaker-
and-one-half scheme. The maximum desired number of elements to be
connected in the ring bus arrangement is four. System elements such as
generators, transformers, and lines will be arranged in breaker-and-one-half
schemes such that a failure of a center breaker will not result in the loss of two
lines routed in the same general direction and will minimize the impact of
losing two elements.
• 230 kV Substations Future 230/69 kV substations should be capable of serving up to 452
Megavolt-Amps (MVA) of load. 400 MVA has historically been the most
common substation load level in the Phoenix Metropolitan area. Future,
typical 230/69 kV substations should accommodate up to four 230 kV line
terminations and up to three 230/69 kV transformer bays. Based upon costs,
as well as reliability and operating flexibility considerations, a breaker-and-
one-half layout should be utilized for all future 230/69 kV Metropolitan
Phoenix Area substations, with provision for initial development to be a ring
bus. Any two 230/69 kV transformers are to be separated by two breakers,

14
whenever feasible, so that a stuck breaker will not result in an outage of both
transformers.
11. Series Capacitor Application
Series capacitors are planned according to the needs of their associated
transmission projects and are typically a customized design. Benefits resulting
from the installation of series capacitors include but are not limited to improved
transient stability, voltage regulating capability and reactive capability. A new
series capacitor installation will currently include MOV protection that mitigates
fault current levels through the series capacitor for internal faults. A bank will
typically bypass for internal faults because there is no benefit to requiring that the
bank remain in service when the line is tripped. Depending on the required
impedances and ampacity level, new series capacitor banks may be either one to
three segment units. The bank ratings should be based upon line’s ultimate uses.
At a minimum bank should be upgradable to higher ampacity needs in the future.
Most 500 kV banks in APS system have a continuous rating of either 1750 A or
2200 A. ANSI standard require that the 30 minutes emergency rating be 135% of
the continuous.
12. Shunt and Tertiary Reactor Application
Shunt and/or tertiary reactors may be installed to prevent open end line
voltages from being excessive, in addition to voltage control. The open end line
voltage must not be more than 0.05 per unit voltage greater than the sending end
voltage. Tertiary reactors may also be used for voltage and VAR control as
discussed above. EHV reactors are used to adjust pre-disturbance voltages if
controlled through a breaker, circuit switcher or motor operated disconnect
switch. APS currently does not automatically control its EHV or HV reactors or
capacitors.
B. Power Flow Studies
1. System Stressing
Realistic generation capabilities and schedules should be used to stress the
transmission system in order to maximize the transfer of resources during the

15
maximum load condition or path rating studies. Existing WECC or regional path
ratings and facilities ratings will not be violated pre- or facility ratings post-
disturbance.
2. Displacement
In cases where displacements (due to power flow opposite normal generation
schedules) may have an appreciable effect on transmission line loading, a
reasonable amount of displacement (Generation Units) may be removed in-order
to stress a given transmission path. Alternately, no fictitious generation sources
may be used to stress paths.
C. Transient Stability Studies
1. Fault Simulation
When studying system disturbances caused by faults, two conditions will be
simulated:
• Three-phase-to-ground faults with normal clearing.
• Single-line-to-ground faults with a stuck circuit breaker in one phase with
delayed clearing.
2. Margin
• Generation margin may be applied for the contingencies primarily
affected by generation.
• Power flow margin may be applied for the contingencies primarily
affected by power flow
3. Unit Tripping
Generator unit tripping may be allowed in-order to increase system stability
performance if part of a proposed or existing remedial action scheme.
4. Machine Reactance Representation
For transient stability studies, the unsaturated transient reactance of machines
with full representation will be used.
5. Fault Damping
Fault damping will be applied to the generating units adjacent to faults. Fault
damping levels will be determined from studies that account for the effect of

16
generator amortisseur windings and the SSR filters. Fault damping will be
applied on the buses listed in Table 2 for faults on the nearest EHV or HV bus.
Table 2. Fault damping levels.
Fault location Affected units Percent Damping
Palo Verde 500 kV 1-3 7.25%
Four Corners 500 & 345 kV 4&5 10%
Coronado 500 kV 1&2 12.5%
Cholla 500 kV 2-4 10%
6. Series Capacitor Switching
For APS designed banks, a MOV/by-pass model is employed in transient
stability analysis.
D. Short Circuit Studies
Three-phase and single-phase-to-ground faults will be evaluated.
1. Generation Representation
All generation will be represented.
2. Machine Reactance Representation
The saturated subtransient reactance (X”d) values will be used.
3. Line Representation
Unless previously calculated as part of APSs requirement for MOD-032, the
transmission line zero sequence impedance (Z0) is assumed to be equal to three
times the positive sequence impedance (Z1). If a new transmission impedance is
required, APS utilizes the CAPE line constant program for determining sequence
values.
4. Transformer Representation
The transformer zero sequence impedance (X0) is assumed to be equal to the
positive sequence impedance (X1). Bulk substation transformers are modeled as
auto-transformers. The two-winding model is that of a grounded-wye
transformer. The three-winding model is that of a wye-delta-wye with a solid
ground.
5. Series Capacitor Switching

17
Series capacitors, locations to be determined from short circuit studies, will be
flashed and reinserted as appropriate.
E. Reactive Power Margin Studies
Using Q-V curve analyses, APS assesses the interconnected transmission
system to ensure there are sufficient reactive resources located throughout the
electric system to maintain post-transient voltage stability for system normal
conditions and certain contingencies.
IV. SYSTEM PERFORMANCE
A. Power Flow Studies
1. Normal (Base Case Conditions)
• Voltage Levels
a. General
i. 500 kV bus voltages will be maintained between 1.05
and 1.08 pu on a 500 kV base.
ii. 345 kV bus voltage will be maintained between .99 and
1.04 pu on a 345 kV base.
iii. 500 kv and 345 kV system voltages are used to
maintain proper 230 kV voltages.
iv. Voltage on the 230 kV and 115 kV system should be
between 1.01 and 1.05 pu.
v. Tap settings for 230/69 kV and 345/69 kV transformers
should be used to maintain low side (69 kV) voltages
between 1.03 and 1.04 pu. Seasonal tap changes may
be required.
b. Specific Buses
i. APS Pinnacle Peak 230 kV bus voltage should be
between 1.025 and 1.035 pu.
ii. Saguaro 115 kV bus voltage will be approximately
1.035 pu.
18
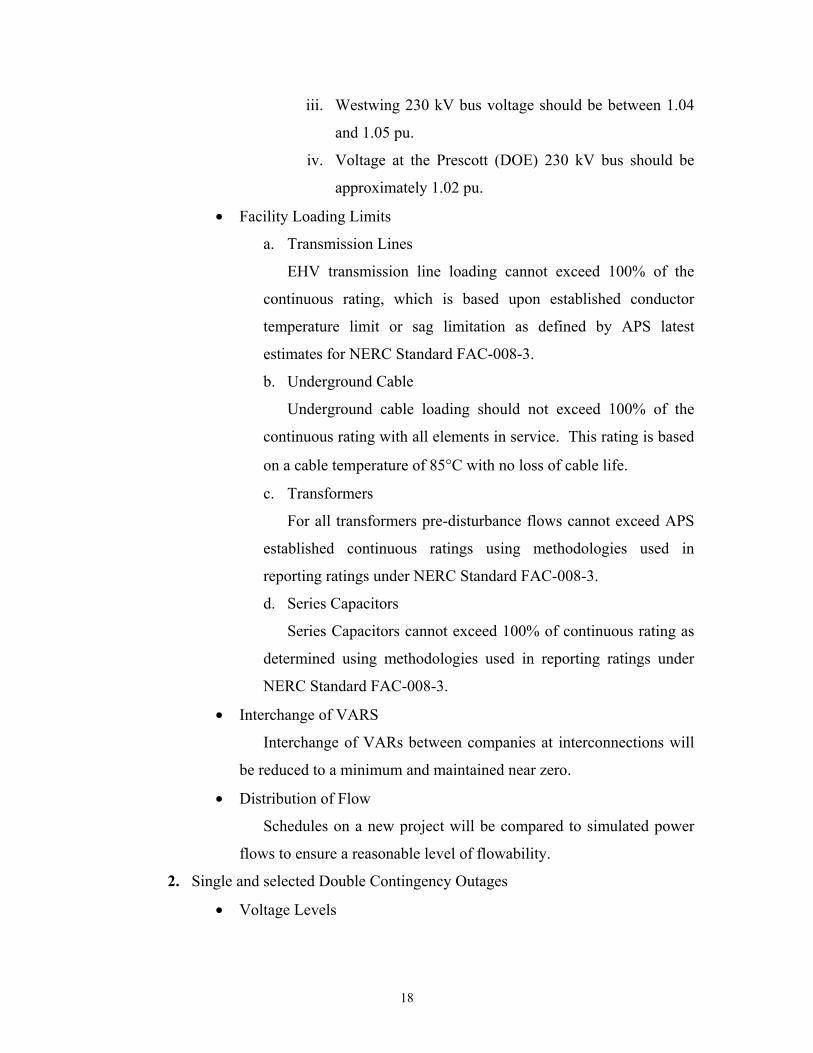
iii. Westwing 230 kV bus voltage should be between 1.04
and 1.05 pu.
iv. Voltage at the Prescott (DOE) 230 kV bus should be
approximately 1.02 pu.
• Facility Loading Limits
a. Transmission Lines
EHV transmission line loading cannot exceed 100% of the
continuous rating, which is based upon established conductor
temperature limit or sag limitation as defined by APS latest
estimates for NERC Standard FAC-008-3.
b. Underground Cable
Underground cable loading should not exceed 100% of the
continuous rating with all elements in service. This rating is based
on a cable temperature of 85°C with no loss of cable life.
c. Transformers
For all transformers pre-disturbance flows cannot exceed APS
established continuous ratings using methodologies used in
reporting ratings under NERC Standard FAC-008-3.
d. Series Capacitors
Series Capacitors cannot exceed 100% of continuous rating as
determined using methodologies used in reporting ratings under
NERC Standard FAC-008-3.
• Interchange of VARS
Interchange of VARs between companies at interconnections will
be reduced to a minimum and maintained near zero.
• Distribution of Flow
Schedules on a new project will be compared to simulated power
flows to ensure a reasonable level of flowability.
2. Single and selected Double Contingency Outages
• Voltage Levels

19
Maximum voltage deviation on APS’ major buses cannot exceed 5% for
single contingencies and 10% for selected double contingencies. APS uses the
following formulae to calculate voltage deviations for post-disturbance
conditions. % = 100 ( − )
• Facilities Loading Limits
a. Transmission Lines
Transmission line loading cannot exceed 100% of the lesser of
the sag limit or the emergency rating (30-minute rating) which is
based upon established conductor temperature limits.
b. Underground Cable
Underground cable loading should not exceed the emergency
rating during a single-contingency outage. This rating is based on
a cable temperature of 105°C for two hours of emergency
operation with no loss of cable life.
c. Transformers
For all transformers post-disturbance flows cannot exceed APS
established emergency ratings using methodologies used in
reporting ratings under NERC Standard FAC-008-3.
d. Series Capacitors
Series Capacitors cannot exceed 100% of emergency rating as
determined using methodologies used in reporting ratings under
NERC Standard FAC-008-3.
• Generator Units
Generator units used for controlling remote voltages will be modified
to hold their base case terminal voltages.
• Impact on Interconnected System
Single and selected double contingency outages will not cause
overloads upon any neighboring transmission system.
20
B. Transient Stability Studies
Transient stability studies are primarily performed on the 500 kV and 345
kV systems but may be performed on lower voltage systems depending on the
study objectives.
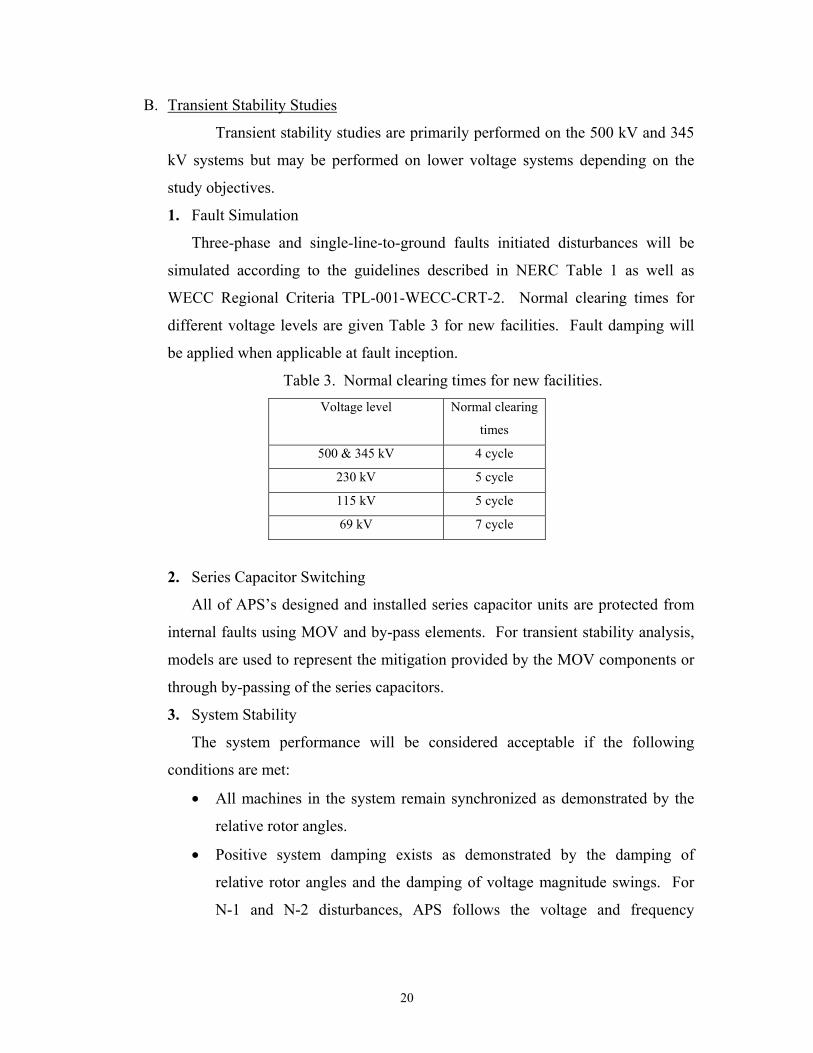
1. Fault Simulation
Three-phase and single-line-to-ground faults initiated disturbances will be
simulated according to the guidelines described in NERC Table 1 as well as
WECC Regional Criteria TPL-001-WECC-CRT-2. Normal clearing times for
different voltage levels are given Table 3 for new facilities. Fault damping will
be applied when applicable at fault inception.
Table 3. Normal clearing times for new facilities.
Voltage level Normal clearing
times
500 & 345 kV 4 cycle
230 kV 5 cycle
115 kV 5 cycle
69 kV 7 cycle
2. Series Capacitor Switching
All of APS’s designed and installed series capacitor units are protected from
internal faults using MOV and by-pass elements. For transient stability analysis,
models are used to represent the mitigation provided by the MOV components or
through by-passing of the series capacitors.
3. System Stability
The system performance will be considered acceptable if the following
conditions are met:
• All machines in the system remain synchronized as demonstrated by the
relative rotor angles.
• Positive system damping exists as demonstrated by the damping of
relative rotor angles and the damping of voltage magnitude swings. For
N-1 and N-2 disturbances, APS follows the voltage and frequency

21
performance guidelines as described in NERC’s Table 1 and WECC
Regional Criteria TPL-001-WECC-CRT-2.
• Cascading does not occur for any category contingency.
4. Re-closing
Automatic re-closing of circuit breakers controlling EHV facilities is not
utilized.
5. Short Circuit Studies
Fault current shall not exceed 100% of the applicable breaker fault current
interruption capability for three-phase or single-line-to-ground faults.
6. Reactive Power Margin Studies
For system normal conditions or single contingency conditions, post-transient
voltage stability is required with a path or load area modeled at a minimum of
105% of the path rating or maximum planned load limit for the area under study,
whichever is applicable. For multiple contingencies, post-transient voltage
stability is required with a path or load area modeled at a minimum of 102.5% of
the path rating or maximum planned load limit for the area under study,
whichever is applicable.