transmission electron microscope tomography of ... lin ming... · kent ridge digital labs ip ......
TRANSCRIPT

Delivered by Ingenta toKent Ridge Digital Labs
IP 19212213120Mon 30 Apr 2012 074608 A
RTIC
LECopyright copy 2011 by American Scientific Publishers
All rights reserved
Printed in the United States of America
Journal of Nanoengineering and NanomanufacturingVol 1 pp 257ndash264 2011(wwwaspbscomjnan)
Transmission Electron Microscope Tomography ofNanostructured MaterialsMing Lin1lowast Hui Ru Tan1 Joyce Pei Ying Tan1 Chris Boothroyd2
Yong Lim Foo1 and Chao Bin He1
1Institute of Materials Research and Engineering AlowastSTAR (Agency for ScienceTechnology and Research) 3 Research Link S117602 Singapore2Center for Electron Nanoscopy Technical University of Denmark DK-2800 Kongens Lyngby Denmark
ABSTRACT
Controlled fabrication and advanced characterization are the two foundations of advanced materials researchWith the decreasing size of nano-engineered devices and increasing complexity of chemically synthesizednanomaterials in recent years there is an increasing demand for high-resolution and three-dimensional analysisand characterization of those complicated structures at the nanometer scale Electron tomography is the mostpowerful tool for studying nano-engineered materials in three-dimensions at the nanometer scale In this paperwe introduce the theory basic functions capabilities and limitations of electron tomography as well as give twoexamples of its applications on characterizing nanostructured materialsmdashmetallic PtSn supported on SBA-15catalysts and clay-epoxy nanocomposites Based on bright-field TEM tomographic analysis of the PtSnSBA-15catalyst we find that all the PtSn particles prefer to nucleate inside mesopores Using high angle annular darkfield scanning TEM tomography we reveal the interaction between the clay layers and the epoxy matrix atdifferent locations in the clay-epoxy composite
KEYWORDS Electron Tomography Artifacts Nanocomposite
1 INTRODUCTION
The comprehensive characterization of materialsrsquo struc-ture is important and challenging in materials researchAmong all the characterization tools the transmissionelectron microscope (TEM) is routinely used for ana-lyzing the structures of materials at atomic resolution1ndash3
TEM images illustrate the shape morphology and inter-nal structure of materials diffraction patterns determinethe crystal structure and analytical microscopy such asElectron Energy Loss Spectroscopy (EELS) and Energydispersive X-ray spectroscopy (EDX) can provide elec-tronic and chemical structural information and phase map-ping at high spatial solution Although many remarkableimages have been obtained with atomic resolution by thelatest state-of-the-art electron microscopes conventionalTEM images mostly present two dimensional (2D) projec-tions of three dimensional (3D) specimens Since the elec-tron beam penetrates through the samples and generatessuperimposed 2D projections on the camera it is difficultto determine the structure present in the third dimension
lowastAuthor to whom correspondence should be addressedEmail m-linimrea-staredusgReceived 18 May 2011Accepted 4 August 2011
such as different layers stacked on each other locationsof defects and small particles that are lying parallel to theincident electron beam This makes it difficult to unam-biguously determine the internal structure of multiphaseand nano-engineered materials including devices polymernanocomposites supported catalysts etcTomography can be implemented to address the shortfall
of conventional 2D images by reconstructing the 3D struc-ture from a series of 2D images4 The most well knownapplication of tomography is X-ray computed tomography(CT scanner) which was first built in 1971 and now iswidely used in hospitals all over the world The applicationof electron tomography was inaugurated by life-science sci-entists in 19685ndash7 and has been well accepted for the studyof cells and virus in life scientific research In recent yearswe have seen its progressive application for the charac-terization of 3D structures of nanostructured materials inthe materials science field Kosher et al8 firstly reportedthe 3D structures of zeolite using bright field TEM (BF-TEM) tomography Later Midgley from the Universityof Cambridge presented the 3D distribution of nanosizedmetal particles on a mesoporous support by reconstruct-ing from a series of high-angle annular dark field Scan-ning TEM (HAADF-STEM) images9 He also successfullydemonstrated a 3D volume reconstructed from a series
J Nanoeng Nanomanuf 2011 Vol 1 No 3 2157-932620111257008 doi101166jnan20111028 257
Delivered by Ingenta toKent Ridge Digital Labs
IP 19212213120Mon 30 Apr 2012 074608
Electron Tomography of Nanostructured Materials Lin et alARTIC
LEof energy-filtered TEM (EFTEM) images10 Recently 4Delectron tomography where time resolution is integratedwith 3D reconstructions was reported by Zewail to dis-play the mechanical motions and morphological dynamicsof a multiwalled carbon nanotube1112 Meanwhile variousmaterials systems13ndash34 such as porous structures1314 sup-ported catalysts15ndash20 polymer nanocomposites21 organicsolar cells2223 nanocrystals24ndash30 and transistor devices18
have been studied extensively by electron tomography inorder to correlate the structures to their chemical and phys-ical propertiesIn theory a 3D volume can be reconstructed from a
series of 2D TEM images which have been acquiredby tilting the sample to different angles As depicted inFigure 1 each 2D TEM image in real space correspondsto a central slice in 3D Fourier space31 We can thereforeobtain the corresponding 3D structure by assembling allthe slices in Fourier space The real 3D structure can thenbe restored by taking the inverse Fourier transform of thisassembly In practice typically four steps are required forelectron tomography1719
(1) acquisition of a tilt series of projections(2) alignment of the images obtained(3) reconstruction from the aligned series and(4) visualization of the 3D volume
Tilt series of images are usually recorded from minus70
to +70 with 05ndash5 tilt increments in the TEM Imageacquisition including the tilting of the sample the correct-ing of the sample shift and image focus and the takingof pictures can be done manually or automatically usingsoftware programs According to the theory of tomogra-phy all acquired images should fulfill the projection cri-terion which means that the signal from each pixel in 2Dimage should vary monotonically with mass thickness ofthe sample Therefore it should satisfy1826
I prop tZx
where I is the intensity of the image t is the sample thick-ness is the density and Z is the atomic number of atomswith exponential growth of xThree imaging modes BF-TEM HAADF-STEM and
EFTEM are used for samples with various structures in
Fig 1 Schematic illustration of the theory of tomography
electron tomography BF-TEM imaging is usually appliedto amorphous materials or nanocrystals with weak diffrac-tion contrast (lt10 nm) in which the image intensityincreases exponentially with the sample mass thick-ness HAADF-STEM imaging is applied to all kinds ofmaterials ranging from amorphous to highly crystallinestructures17ndash19 EFTEM images are formed by selectingthe electrons with characteristic energy loss correspond-ing to the atomic inner-shell ionization edges of the ele-ment of interest The contrast observed in backgroundsubtracted EFTEM images is then proportional to theamount of atomic species in the sample However elemen-tal maps only show a monotonic signal-thickness behaviorfor thin specimens usually less than 30 nm The signaldecreases dramatically with increasing sample thicknessthus limiting the usage of this type of imaging mode fortomography18 The duration for tomographic image acqui-sition is approximately 05sim4 hours Once the data hasbeen acquired the series of images has to be aligned accu-rately in order to bring all images to one rotation axis Thealignment is a key step to obtain accurate reconstructionresults In this paper the alignment is carried out usingcross-correlation method which calculates and compen-sates the shift of the images by comparing adjacent pairsof images in the seriesThe aligned 2D images are then reconstructed using
either a back-projection method or the SimultaneousIterative Reconstruction Technique (SIRT) In the back-projection process each 2D image is projected back into3D space along its original tilt angle The superpositionof all back-projected images from different directions willresult in a reconstructed 3D volume The original resultsfrom back-projection method usually present a blurredreconstruction due to non-uniform sampling in whichlow frequencies are enhanced and higher frequencies arereduced during the reconstruction process By applyinga weighting filter the sampling balance can be com-plemented by enhancing the information from high spa-tial frequencies and reducing that from the low spatialfrequencies1731 However the weighted back-projectionmethod is seriously affected by artifacts In comparisonwith weighted back projection technique SIRT gives betterreconstructed result In the SIRT process the reconstructedvolume is re-projected back into 2D images along the orig-inal projection angle and the re-projections are comparedwith the original 2D images The reconstructed volumeis then corrected iteratively until the best fit between there-projections and original images is obtainedThe reconstructed 3D object can be visualized through
three approaches slicing surface rendering and voxel ren-dering In some cases a segmentation process is appliedto better interpret the tomographic results and identify thesurface structures27ndash29 The segmentation process is a pre-requisite for the surface model generation of an object as awhole and visualization of individual parts of a multiphase
258 J Nanoeng Nanomanuf 1 257ndash264 2011
Delivered by Ingenta toKent Ridge Digital Labs
IP 19212213120Mon 30 Apr 2012 074608
Lin et al Electron Tomography of Nanostructured MaterialsARTIC
LEobject separately The resolution of the tomogram aftersegmentation is typically lower than that of the originalreconstruction due to the application of a surface smooth-ing function Although resolution has to be compromisedthe structures after segmentation are found to be almost thesame as the original results29 In this paper followed by theintroduction of the theory of electron tomography we willdiscuss the limitations and subsequent artefacts of electrontomography Two examples Pt catalyst particles supportedon SBA-15 and clay-epoxy nanocomposites reconstructedby BF TEM and HAADF-STEM images respectively arediscussed to present tomographic reconstruction of differ-ent nanostructured samples and to reveal the influence ofthe support on the structures of the supported metallic cat-alysts and the exfoliation mechanism of the clay layers inepoxy
2 EXPERIMENTAL DETAILS
21 PtSnSBA-15 Catalysts
04 wt Pt and 06 wt Sn (SnPt atomic ratio = 24)loaded on a mesoporous SBA-15 substrate was preparedby impregnation method35 The SBA-15 support wasimpregnated with a H2PtCl6 and SnCl4 aqueous solutiondried at 120 C and then calcined in air at 500 C for 4 hThe powders obtained were de-chlorinated in air contain-ing water vapor at 500 C for 4 h to remove any remainingchlorine on the sample surfaceThe prepared catalysts were dispersed in ethanol and
dropped onto a 100 mesh copper grid coated with a layerof carbon film (SPI) Electron tomography was carried outon a JEOL 2100 TEM operated at 200 kV A total of121 BF TEM images were recorded automatically overa tilt range of minus60 to +60 with a tilt step of 1 usingthe JEOL TEMograhy program The magnification was25000 times corresponding to 0512 nm per pixel Thefinal tilt series data was aligned and reconstructed byweighted-back projection using the reconstruction programComposer The 3D volume was then visualized by voxelrendering using the software Visulizer
22 Clay-Epoxy Nanocomposites
The preparation of clay-epoxy was modified from ref39 and 40 Epoxy DER 332 with an epoxide equivalentweight of 171ndash175 gequiv and Ethacure 100-LC was usedas the polymer matrix and curing agent 4 g clay was dis-persed in 120 ml water and stirred at room temperature for24 h The suspension was mixed and washed with acetonethree times The white precipitate was then mixed withepoxy resin and acetone was evaporated in a vacuum ovenat 50 C The resulting mixture was stirred with a curingagent and dried at 75 C for 60 min Finally the clay-epoxy nanocomposite was prepared by curing the sampleat 100 C for 2 h and post-cured at 180 C for 5 h
TEM specimens were prepared using an ultramicro-tome Typically polymer sections of thickness from 300to 500 nm are prepared in order to ensure that the inor-ganic fillers remain intact in the epoxy and to minimizethe cutting damage to the clay-epoxy interface 3D elec-tron tomography of the nanocomposites was performedon a FEI Titan STEM operated at an accelerating voltageof 300 kV A total of 141 HAADF-STEM images wereacquired automatically using the FEI Xplore 3D tomog-raphy software with a tilt range of minus70 to +70 and atilt step of 1 The magnification was 20000 times cor-responding to 785 nm per pixel The acquisition time forone 1024times1024 sized image was 20 s The final tilt seriesdata was aligned and reconstructed using SIRT (30 itera-tions) with FEI Inspect3D The 3D volume was then visu-alized and analyzed by voxel rendering and orthogonalslices using Amira 41
3 RESULTS AND DISCUSSION
31 Limitations of TEM TomographymdashMissingWedge Artifacts
In theory a high-resolution and perfect 3D tomogram canbe achieved when the sample is tilted over the full rangewith a tilt increment as small as possible1726 Howeverin practice the tilt steps chosen are usually between 05
to 5 in order to shorten the total acquisition time mini-mize beam damage to the samples and reduce the build-upof contaminants on the specimen surface under prolongedbeam irradiation The perfect tomography reconstructionalso requires the full range of tilt images recorded fromminus90 to 90 In electron microscopes the geometry of thepolepiece limits the tilt range of the sample holder andelectrons are also blocked by the sample holder and thecopper grid bars when the specimen is tilted to high anglesSome research groups have employed a specially designed360 on-axis tomography holder to obtain the full range oftilt images30 However only micro-pillar shaped samplesprepared by focused ion beam milling can be used in theseholders which limits their applications on certain mate-rials only The lack of projections from high angles (ieminus90 to minus70 and 70 to 90 results in ldquomissing wedgerdquoartifacts which can lead to erroneous estimation of sizeshape and volume of the reconstructed tomogramThe missing wedge artifact can be clearly demonstrated
by a spherical sample such as SiO2 hollow spheres TheSiO2 particles are perfectly spherical with a diameter of200 nm and 20 nm thick walls as seen in conventionalTEM image in Figure 2(a) Figures 2(bndashd) show the recon-structed 3D volume of SiO2 spheres using STEM tomog-raphy A total of 141 HAADF-STEM images were col-lected for reconstruction with a tilt range of minus70 to 70
and a 1 tilt step On one hand the missing wedge arti-fact can result in the elongation of the object along theincident electron beam direction (z direction) as shown
J Nanoeng Nanomanuf 1 257ndash264 2011 259
Delivered by Ingenta toKent Ridge Digital Labs
IP 19212213120Mon 30 Apr 2012 074608
Electron Tomography of Nanostructured Materials Lin et alARTIC
LE
Fig 2 An example of missing wedge artifacts in electron tomographicreconstruction is demonstrated by SiO2 hollow spheres The original tiltseries was from 70 to minus70 (a) BF TEM image of SiO2 hollow spheres(b) elongation observed along the incident beam direction due to missingwedge effects (c) volume artifacts indicated by the arrows (d) a 3Dtomogram showing nearly perfect SiO2 spheres
in Figure 2(b) It is interesting to note that the elongationonly occurs in the missing wedge area (indicated by twolines within 2times 90minus angle area) and the other partsare still present as a perfectly spherical shape The miss-ing frequencies from those angles lead to the distortion inthose directions The elongation factor () depends on themaximum tilt angle 18
=radic
+SintimesCosminusSintimesCos
Table I lists the elongation factors for commonly used tiltranges Considering that the typical tilt range of the sam-ple in TEM is from 70 to minus70 the elongation factoris 13 for the part of the SiO2 sphere along the z direc-tion On the other hand the missing wedge effect can giverise to some volume artifacts because the missing informa-tion at the high tilt angles makes part of the reconstructedobject to be missing For example the lack of projectionsfrom high angle ranges leads to an invisible part alongthe z direction as indicated by arrows in Figure 2(c) Thelarger the missing wedge the more severe these artifactsThe distortion (elongation or missing part) caused by
missing wedge artifacts indicates that we need to bevery cautious when taking analysis in the z-directionof the 3D volume For better visual presentation wecan hide the missing wedge artifacts by viewing theobject close to the incident beam direction as shown inFigure 2(d) which illustrates some nearly perfect recon-structed spheres Currently some advanced reconstruction
Table I Elongation factor for different maximum tilt angles
Tilt angle () Elongation factor
plusmn90 100plusmn85 106plusmn80 113plusmn75 121plusmn70 131plusmn65 142plusmn60 155plusmn55 171plusmn50 189plusmn45 212plusmn40 241plusmn35 277
software also can compensate and reduce the missingwedge artifacts dramatically3032
32 Study of Supported PtSnSBA-15 CatalystUsing BF-TEM Tomography
Supported PtSn catalysts are widely used in dehydro-genation reactions by industry35 The quality of the cat-alyst is affected by the composition shape size of theactive metallic particles the type of support the interactionbetween the metals and the support as well as the distribu-tion of the metals on the support1435 Mesoporous supportsare more attractive in catalysis research due to its ther-mal stability high surface area and defined pore volumewhich may act as nanoreactors resulting in the formationof catalysts with high selectivity Figures 3(a and b) showtwo TEM images of typical PtSn supported on mesoporousSBA-15 which is used as an efficient catalyst for the dehy-drogenation of paraffin and propane35 Nanosized PtSnparticles and some nanorods are observed in the imagesThe diameter of the PtSn nanorods is around 5 nm andthey are oriented along the pores in agreement with thepore size of the SBA-15 (495 nm)35 This indicates thatrod like particles are oriented inside the pores Howeverfrom the 2D images it is difficult to determine the posi-tions of the small particles and how the mesoporoussupport affects the growth and nucleation of the PtSnnanoparticles especially when the support is not sitting ata major zone axis and the pores are invisible (Fig 3(b))Compared with 2D images more detailed information canbe revealed from the 3D reconstructed tomogram A seriesof 2D BF TEM images was acquired from minus60 to +60
for the samples in Figure 2(b) After alignment the 121recorded images already provide abundant useful informa-tion on the structure of the catalyst Close examinationof individual images from the tilt series reveals that allthe particles are none-spherical in shape but are elongatedwith a length to diameter ratio of 13 to 29A 3D tomogram with a reconstructed volume of
359times149times318 nm is displayed in Figures 3(c to f) fromdifferent viewing angles It is found that all the PtSn par-ticles anchor inside the mesopores rather than on the
260 J Nanoeng Nanomanuf 1 257ndash264 2011
Delivered by Ingenta toKent Ridge Digital Labs
IP 19212213120Mon 30 Apr 2012 074608
Lin et al Electron Tomography of Nanostructured MaterialsARTIC
LE
Fig 3 PtSn particles in mesoporous SBA-15 (a b) BF-TEM images showing PtSn nanoparticles supported on SBA-15 (c) corresponding tomographicreconstruction which shows all the particles anchored inside the mesopores (d e) reconstructed volume viewed at the yndashz and xndashz planes (f) a xndashyslice showing three PtSn particles inside the mesopores and white arrows indicating the presence of defects in the SBA-15
external surface of support Due to the limited tilt anglemissing wedge artifacts can be seen along z directionwhere the outline of the SBA-15 in Figure 3(d) (indi-cated by the arrow) is not as clear as that viewed alongxndashy plane The tips of the PtSn particles in Figure 3(e)also appear sharp due to artifacts However by subtractingthe artifacts the PtSn particles still demonstrate elongatedshapes in good agreement with the observation from thetilt series images It is interesting to note that all the metalparticles in one SBA-15 support are aligned along onedirection indicating that the elongation follows the orien-tation of the poresThe positions of the PtSn particles can be further con-
firmed by slicing information from the 3D volume NormalTEM images are the projection of 3D objects which onlydemonstrate the stacking information throughout the vol-ume Using tomography we can slice the 3D volume intoa series of 2D slabs throughout the tomogram along anydirection18 Since each slice extracts a thin layer of infor-mation from the 3D volume without interference fromother layers the contrast in the reconstructed slice is muchbetter than that in a normal TEM image An xndashy slicewith a thickness of 1 nm along the z direction is shownin Figure 3(f) Two PtSn particles are observed insidethe pores and one particle is anchored close to the poreentrance Some defects existing as nanosized holes are alsoobserved inside the SBA-15 mesoporous structures fromthe slicing image which cannot be revealed from normalTEM imagesThe tomography results clearly show that all the PtSn
metallic particles are dispersed inside the SBA-15 meso-pores with the elongated shape along the pore directionMesoporous structures confine the diameter of the particlesand the length of the metallic particles varies from each
other The morphology determined here may explain thediffusion and nucleation process of the PtSn nanoparticlesThe diffusion and nucleation of active metals on meso-porous supports is quite complex and it is controlled bythe interaction between particles and supports kineticsand confinement of the pores Generally minimizing totalenergy of the supported catalyst particles is the drivingforce to reach an equivalent configuration with a particularmorphology and crystal form for the metal particles Metalparticles are found to prefer nucleating at the kinks stepsor the concave areas such as cup or saddle like regionson the surface support materials16 The high temperatureannealing process used to make the catalyst will gener-ate global diffusion and nucleation of PtSn on the supportin regions with high surface curvature The nucleation ofmetals inside pores is a more sable configuration than onthe external surfaces as internal concave pores possess thehighest surface curvature of mesoporous structures Thisagrees well with the observations of TEM tomographywhich indicates the preferred locations of PtSn inside ofthe pores
33 Study of Clay-Epoxy Nanocomposites byHAADF-STEM Tomography
Epoxy nanocomposites with exfoliated clay layers showproperty enhancement in terms of modulus strength andtoughness36ndash39 Many reports have attempted to explain thefracture behavior of such materials Two proposed typicalfracture mechanisms for clay-polymer nanocomposites aremicrocracks generated at the clay-polymer interface anddebonding of the clay layers37 Since the size of the claynanofillers dispersed in epoxy can be a few nanometersthick and a few microns long electron tomography is a
J Nanoeng Nanomanuf 1 257ndash264 2011 261
Delivered by Ingenta toKent Ridge Digital Labs
IP 19212213120Mon 30 Apr 2012 074608
Electron Tomography of Nanostructured Materials Lin et alARTIC
LEuseful technique to study the internal structures of clay-epoxy nanocomposites With electron tomography a 3Dstructure can be generated with nanometer scale resolu-tion and thicker specimens can also be examined afterreconstruction as superimposed slicesstructures that canbe resolved from the reconstructed 3D structureAs discussed in Section 32 BF-TEM images have been
successfully applied to reconstruct amorphous materialsor nanocrystals smaller than 10 nm with weak diffractioncontrast They are not suitable for the reconstruction ofhighly crystalline materials due to the presence of strongdiffraction contrast at the zone axes1718 The diffractioncontrast together with other non-projection phase contrastin BF images will complicate tomographic reconstructionand lead to a distortion in the shape of the reconstructedstructure26 HAADF-STEM images are formed by collect-ing high-angle (gt50 mrad) scattered electrons4041 Theintensity of the images is approximately proportional to thesquare of the atomic number (Z) and varies linearly withthe sample thickness (for relatively small sample thick-nesses) All non-projection contrast can be minimized inthe images Thus HAADF STEM imaging is applicablefor electron tomography of both amorphous and crystallinematerialsBF-TEM and HAADF-STEM images of the clay filled
epoxy nanocomposite are depicted in Figures 4(andashd)HAADF-STEM images show sharper clay edges than thatin BF images It is noteworthy that the non-projectioninduced contrast shown in BF TEM images such as Fres-nel fringes seen at the edge of the particles and the arti-facts due to defocus and varying specimen height arenot observed in the STEM images Moreover due tothe counts of HAADF-STEM images being approximatelyproportional to the square of the atomic number theydemonstrate higher contrast between the epoxy matrix andthe clay layers which contain Si with higher atomic num-ber than carbon Since the quality of the tomographicreconstruction is determined by the quality of the orig-inal tilt images the higher contrast and sharper STEMimages give rise to better and more interpretable tomo-graphic reconstruction results as shown in Figures 4(eand f) In comparison to the HAADF-STEM reconstructedobject the clay layers are less clear in the polymer matrixin the BF TEM tomogram and some blurry shadows arepresent close to the clay layers which originate from thenon-projection contrast in the 2D images The resolutionof the HAADF-STEM images is similar to that of theBF-TEM images but HAADF-STEM tomography pro-vides higher sensitivity to samples with large differencesin atomic numbersBesides sharper images HAADF-STEM also reduces
beam damage to polymer samples17ndash19 Damage of thenanomaterials by the electron beam is one of the majorconcerns during image acquisition The full acquisitiontime for BF-TEM tomography is around 30 min to 1 h
Fig 4 A comparison between BF-TEM and HAADF-STEM imagesand their corresponding tomographic reconstructions (a c e) BF-TEMimages and corresponding tomographic reconstruction and (b d f)HAADF-STEM images and corresponding tomographic reconstruction ofclay-epoxy nanocomposite material
which is shorter than the 2 h to 4 h for HAADF-STEMtomography However polymers (also including SiO2
spheres) are found to be more susceptible to damage by thecontinuous electron beam illumination in BF-TEM imag-ing mode than that under the intermittent scanning beamseven though the unit area intensity of the scanned probe isstronger than the parallel beam in TEM Based on the con-cerns discussed above HAADF-STEM tomography wasselected for the tomographic reconstruction of the polymermaterials in this paperA typical HAADF-STEM image of the clay-epoxy
nanocomposite is shown in Figure 5(a) The clay is exfoli-ated uniformly into layers of approximately 1ndash2 m longand a few tens of nanometers thick which are dispersedrandomly in an epoxy matrix The clay-epoxy matrix isthinned to sections a few hundred nanometers thick bythe diamond cutter of the microtome The diamond cutterscratches the surface of the clay-epoxy sections and thuscauses the straight lines seen in the image Since the stressconcentration point is located at the clay-epoxy interfaceclay layers tend to split to form voids when the strain isreleased during the sample preparation processThe randomly distributed clay layers in polymer matrix
produce various 2D projections The sharp lines markedby number 1 in Figure 5(a) with the highest contrast arethe projection of the silica layers lying parallel to the
262 J Nanoeng Nanomanuf 1 257ndash264 2011
Delivered by Ingenta toKent Ridge Digital Labs
IP 19212213120Mon 30 Apr 2012 074608
Lin et al Electron Tomography of Nanostructured MaterialsARTIC
LE
Fig 5 (a) HAADF-STEM image of clay-epoxy nanocomposite arrowsindicate the presence of clay layers in different orientations (b) corre-sponding 3D reconstruction of the nanocomposite with dimensions of6978times7560times447 nm
viewing direction or the incident electron beam Silica lay-ers oriented perpendicular to the incident electron beamexhibit the lowest contrast due to a planar morphologyof clay layers in the epoxy matrix which are marked byarrows number 3 The others marked by arrow number 2are tilted from the beam direction The random orienta-tions of the clay layers in the epoxy complicate the inter-pretation of 2D STEM images and it is difficult to clearlyreveal the interface between the clay and the epoxy as wellas the real orientation and thickness of the silica layersElectron tomography allows us to reveal the whole struc-ture unambiguously The corresponding voxel rendering ofthe reconstructed 3D volume is displayed in Figure 5(b)with the reconstructed volume at 6978times 7560times 447 nmIt is noteworthy that the clay layers lying perpendicular tothe viewing angle in the 2D image can be visualized as a
Fig 6 (a) A HAADF-STEM image of the clay-epoxy nanocomposite (b) corresponding 3D reconstructed volume (cndashe) three slices in the xndashyplane from the reconstructed volume show a split extending from clayndashclay to clay-epoxy and to epoxyndashepoxy Three slices are taken from differentlevels located at the 12th (942 nm from the top surface) 27th (212 nm from the top surface) and 43rd slices (3376 nm from the top surface)
thin slab at certain tilt angles in the reconstructed volumeas indicated by the arrow in Figure 5(b)The reconstructed 3D structure can also show the loca-
tion of voids and the nature of delamination of the claylayers36 Clay layers in the polymer matrix are better visu-alized by a series of images sliced perpendicular to theviewing angle Figure 6 shows three xndashy slices at differentlevels in the reconstruction with a thickness of 785 nmfor each slice The red arrows indicate three regions wherea split changes from inside the clay layers to the clay-epoxy interface at different thickness Clay has a layeredand planar structure with strong covalent bonds in layersand weak forces between layers Without treatment withthe coupling agent the clay layers cannot be fully exfo-liated and the dispersed layers can have thickness of upto tens of layers When the polymer matrix is cut into400 nm thin slabs micro-deformation occurs at the area ofclay layers due to stress release of the epoxy around theclay region From the 3D reconstructed images and slicesindicated in Figure 6 the micro cracks could have initi-ated inside the thick clay layers due to its weak interlayerbonding Since the thickness of the clay is not uniformthe crack will propagate to the clay-epoxy interface andextend into the polymer matrix3D electron tomographic reconstruction has proven
itself to be an important technique as it is the onlytechnique that can reveal the delamination of clayndashclayclay-epoxy matrix and polymer-polymer matrix at differ-ent positions of a single particle The analysis of micro-deformation can also be used to explain the macro-scale
J Nanoeng Nanomanuf 1 257ndash264 2011 263
Delivered by Ingenta toKent Ridge Digital Labs
IP 19212213120Mon 30 Apr 2012 074608
Electron Tomography of Nanostructured Materials Lin et alARTIC
LEcracking mechanism when an external force is appliedSince the clay layers act as stress concentrators and crackinitiators we propose that thinner and more uniform claylayers such as silane treated clay particles will help toimprove the mechanical properties of this clay polymermatrix37
4 CONCLUSION
Unlike 2D TEM images electron tomography is apowerful technique for obtaining 3D information fromnanostructured materials and devices in all directionsMore detailed information such as the location and dis-tribution of the particles in the support the shape of thenanocrystals the interaction of filler and matrix etc canbe revealed by a 3D reconstructed volume even beingaccompanied by missing wedge artifacts Using electrontomography we have explained the growth and nucleationof the metallic particles in mesoporous SBA-15 and theexfoliation of clay in epoxy matrix The insightful analysisfrom 3D reconstruction is significantly meaningful for themeasurement of their corresponding chemical and physicalproperties and the establishment of their structure-propertyrelations
Acknowledgments This work is supported by IMREcore funding The authors would like to thank Dr LiuYe from IMRE (Singapore) for providing the hollow SiO2
samples and Professor Fan Yining from Nanjing Univer-sity (China) for providing the ptSnSBA-15 catalyst
References and Notes
1 Z L Wang J Phys Chem B 104 1153 (2000)2 Z L Wang Adv Mater 15 1497 (2003)3 D Williams and C B Carter Transmission Electron Microscopy
Plenum Press New York (1996)4 J Frank Electron Tomography Three-Dimensional Imaging with
the Transmission Electron Microscope Plenum Press New York(1992)
5 D J De Rosier and A Klug Nature 217 130 (1968)6 W Hoppe R Langer G Knesch and C Poppe Naturwis-
senschaften 55 333 (1968)7 R G Hart Science 159 1464 (1968)8 A J Koster U Ziese A J Verkleij A H Janssen and K P de
Jong J Phys Chem B 104 9368 (2000)9 P A Midgley M Weyland J M Thomas and B F G Johnson
Chem Commun 10 907 (2001)10 M Weyland and P A Midgley Microsc Microanal 9 542 (2003)11 O Kwon and A H Zewail Science 328 1668 (2010)12 A H Zewail Science 328 187 (2010)13 K P de Jong and A J Koster Chem Phys Chem 3 776
(2002)
14 O Ersen J Parmentier L A Solovyov M Drillon C Pham-HuuJ Werckmann and P Schultz J Am Chem Soc 130 16800 (2008)
15 A H Janssen C M Yang Y Wang F Schuth A J Koster andK P de Jong J Phys Chem B 107 10552 (2003)
16 E P W Ward T J V Yates J Fernandez D E W Vaughan andP A Midgley J Phys Chem C 111 11501 (2007)
17 M Weyland and P A Midgley Mater Today 7 32 (2004)18 C Kubel A Voigt R Schoenmakers M Otten D Su T C Lee
A Calsson and J Bradley Microsc Microanal 11 378 (2005)19 P A Midgley and R E Dunin-Borkowski Nature Mater 8 271
(2009)20 H Wei Z Wang J Zhang S House Y Gao L Yang H Robinson
L H Tan H Xing C Hou I M Robertson J Zuo and Y LuNature Nanotechnol 6 93 (2011)
21 H Jinnai R J Spontak and T Nishi Macromolecules 43 1675(2010)
22 V Andersson A Herland S Masich and O Inganas Nano Lett9 853 (2009)
23 S S van Bavel E Sourty G de With and J Loos Nano Lett9 507 (2009)
24 K Kaneko K Inoke B Freitag A B Hungria P A MidgleyT W Hansen J Zhang S Ohara and T Adschiri Nano Lett 7 421(2007)
25 M A Verheijen R E Algra M T Borgstroumlm G ImminkE Sourty W J P van Enckevort E Vlieg and E P A M BakkersNano Lett 7 351 (2007)
26 X J Xu Z Saghi R Gay and G Mobus Nanotechnol 18 225501(2007)
27 O Ersen S Beacutegin M Houlleacute J Amadou I Janowska J GrenegravecheC Crucifix and C Pham-Huu Nano Lett 8 1033 (2008)
28 H Katz-Boon C J Rossouw M Weyland A M FunstonP Mulvaney and J Etheridge Nano Lett 11 273 (2011)
29 J P Y Tan H R Tan C Boothroyd Y L Foo C B He andM Lin J Phys Chem C 115 3544 (2011)
30 E Biermans L Molina K J Batenburg S Bals and G VTenderloo Nano Lett 10 5014 (2010)
31 I Arslan J R Tong and P A Midgley Ultramicroscopy 106 994(2006)
32 S Bals K J Batenburg J Verbeeck J Sijbers and G V TendelooNano Lett 7 3669 (2007)
33 H Y Li H L Xin D A Muller and L A Estroff Science326 1244 (2009)
34 J Loos E Sourty K Lu B Freitag D Tang and D Wall NanoLett 9 1904 (2009)
35 L Huang B Xu L Yang and Y Fan Catal Commun 9 2593(2008)
36 K Wang L Chen J Wu M L Toh C B He and A F YeeMacromolecules 38 788 (2005)
37 K Wang L Wang J Wu L Chen and C B He Langmuir 21 3613(2005)
38 F Drummy Y C Wang R Schoenmakers K May M JacksonH Koerner B L Farmer B Mauryama and R A Vaia Macro-molecules 41 2135 (2008)
39 L Chen S C Wong and S Pisharash J Appl Polym Sci 88 3298(2003)
40 J Loos E Sourty K Lu G de With and S V Bavel Macro-molecules 42 2581 (2009)
41 F Krumeich E Muller R A Wepf and R Nesper J Phys Chem C115 1080 (2011)
264 J Nanoeng Nanomanuf 1 257ndash264 2011

Delivered by Ingenta toKent Ridge Digital Labs
IP 19212213120Mon 30 Apr 2012 074608
Electron Tomography of Nanostructured Materials Lin et alARTIC
LEof energy-filtered TEM (EFTEM) images10 Recently 4Delectron tomography where time resolution is integratedwith 3D reconstructions was reported by Zewail to dis-play the mechanical motions and morphological dynamicsof a multiwalled carbon nanotube1112 Meanwhile variousmaterials systems13ndash34 such as porous structures1314 sup-ported catalysts15ndash20 polymer nanocomposites21 organicsolar cells2223 nanocrystals24ndash30 and transistor devices18
have been studied extensively by electron tomography inorder to correlate the structures to their chemical and phys-ical propertiesIn theory a 3D volume can be reconstructed from a
series of 2D TEM images which have been acquiredby tilting the sample to different angles As depicted inFigure 1 each 2D TEM image in real space correspondsto a central slice in 3D Fourier space31 We can thereforeobtain the corresponding 3D structure by assembling allthe slices in Fourier space The real 3D structure can thenbe restored by taking the inverse Fourier transform of thisassembly In practice typically four steps are required forelectron tomography1719
(1) acquisition of a tilt series of projections(2) alignment of the images obtained(3) reconstruction from the aligned series and(4) visualization of the 3D volume
Tilt series of images are usually recorded from minus70
to +70 with 05ndash5 tilt increments in the TEM Imageacquisition including the tilting of the sample the correct-ing of the sample shift and image focus and the takingof pictures can be done manually or automatically usingsoftware programs According to the theory of tomogra-phy all acquired images should fulfill the projection cri-terion which means that the signal from each pixel in 2Dimage should vary monotonically with mass thickness ofthe sample Therefore it should satisfy1826
I prop tZx
where I is the intensity of the image t is the sample thick-ness is the density and Z is the atomic number of atomswith exponential growth of xThree imaging modes BF-TEM HAADF-STEM and
EFTEM are used for samples with various structures in
Fig 1 Schematic illustration of the theory of tomography
electron tomography BF-TEM imaging is usually appliedto amorphous materials or nanocrystals with weak diffrac-tion contrast (lt10 nm) in which the image intensityincreases exponentially with the sample mass thick-ness HAADF-STEM imaging is applied to all kinds ofmaterials ranging from amorphous to highly crystallinestructures17ndash19 EFTEM images are formed by selectingthe electrons with characteristic energy loss correspond-ing to the atomic inner-shell ionization edges of the ele-ment of interest The contrast observed in backgroundsubtracted EFTEM images is then proportional to theamount of atomic species in the sample However elemen-tal maps only show a monotonic signal-thickness behaviorfor thin specimens usually less than 30 nm The signaldecreases dramatically with increasing sample thicknessthus limiting the usage of this type of imaging mode fortomography18 The duration for tomographic image acqui-sition is approximately 05sim4 hours Once the data hasbeen acquired the series of images has to be aligned accu-rately in order to bring all images to one rotation axis Thealignment is a key step to obtain accurate reconstructionresults In this paper the alignment is carried out usingcross-correlation method which calculates and compen-sates the shift of the images by comparing adjacent pairsof images in the seriesThe aligned 2D images are then reconstructed using
either a back-projection method or the SimultaneousIterative Reconstruction Technique (SIRT) In the back-projection process each 2D image is projected back into3D space along its original tilt angle The superpositionof all back-projected images from different directions willresult in a reconstructed 3D volume The original resultsfrom back-projection method usually present a blurredreconstruction due to non-uniform sampling in whichlow frequencies are enhanced and higher frequencies arereduced during the reconstruction process By applyinga weighting filter the sampling balance can be com-plemented by enhancing the information from high spa-tial frequencies and reducing that from the low spatialfrequencies1731 However the weighted back-projectionmethod is seriously affected by artifacts In comparisonwith weighted back projection technique SIRT gives betterreconstructed result In the SIRT process the reconstructedvolume is re-projected back into 2D images along the orig-inal projection angle and the re-projections are comparedwith the original 2D images The reconstructed volumeis then corrected iteratively until the best fit between there-projections and original images is obtainedThe reconstructed 3D object can be visualized through
three approaches slicing surface rendering and voxel ren-dering In some cases a segmentation process is appliedto better interpret the tomographic results and identify thesurface structures27ndash29 The segmentation process is a pre-requisite for the surface model generation of an object as awhole and visualization of individual parts of a multiphase
258 J Nanoeng Nanomanuf 1 257ndash264 2011
Delivered by Ingenta toKent Ridge Digital Labs
IP 19212213120Mon 30 Apr 2012 074608
Lin et al Electron Tomography of Nanostructured MaterialsARTIC
LEobject separately The resolution of the tomogram aftersegmentation is typically lower than that of the originalreconstruction due to the application of a surface smooth-ing function Although resolution has to be compromisedthe structures after segmentation are found to be almost thesame as the original results29 In this paper followed by theintroduction of the theory of electron tomography we willdiscuss the limitations and subsequent artefacts of electrontomography Two examples Pt catalyst particles supportedon SBA-15 and clay-epoxy nanocomposites reconstructedby BF TEM and HAADF-STEM images respectively arediscussed to present tomographic reconstruction of differ-ent nanostructured samples and to reveal the influence ofthe support on the structures of the supported metallic cat-alysts and the exfoliation mechanism of the clay layers inepoxy
2 EXPERIMENTAL DETAILS
21 PtSnSBA-15 Catalysts
04 wt Pt and 06 wt Sn (SnPt atomic ratio = 24)loaded on a mesoporous SBA-15 substrate was preparedby impregnation method35 The SBA-15 support wasimpregnated with a H2PtCl6 and SnCl4 aqueous solutiondried at 120 C and then calcined in air at 500 C for 4 hThe powders obtained were de-chlorinated in air contain-ing water vapor at 500 C for 4 h to remove any remainingchlorine on the sample surfaceThe prepared catalysts were dispersed in ethanol and
dropped onto a 100 mesh copper grid coated with a layerof carbon film (SPI) Electron tomography was carried outon a JEOL 2100 TEM operated at 200 kV A total of121 BF TEM images were recorded automatically overa tilt range of minus60 to +60 with a tilt step of 1 usingthe JEOL TEMograhy program The magnification was25000 times corresponding to 0512 nm per pixel Thefinal tilt series data was aligned and reconstructed byweighted-back projection using the reconstruction programComposer The 3D volume was then visualized by voxelrendering using the software Visulizer
22 Clay-Epoxy Nanocomposites
The preparation of clay-epoxy was modified from ref39 and 40 Epoxy DER 332 with an epoxide equivalentweight of 171ndash175 gequiv and Ethacure 100-LC was usedas the polymer matrix and curing agent 4 g clay was dis-persed in 120 ml water and stirred at room temperature for24 h The suspension was mixed and washed with acetonethree times The white precipitate was then mixed withepoxy resin and acetone was evaporated in a vacuum ovenat 50 C The resulting mixture was stirred with a curingagent and dried at 75 C for 60 min Finally the clay-epoxy nanocomposite was prepared by curing the sampleat 100 C for 2 h and post-cured at 180 C for 5 h
TEM specimens were prepared using an ultramicro-tome Typically polymer sections of thickness from 300to 500 nm are prepared in order to ensure that the inor-ganic fillers remain intact in the epoxy and to minimizethe cutting damage to the clay-epoxy interface 3D elec-tron tomography of the nanocomposites was performedon a FEI Titan STEM operated at an accelerating voltageof 300 kV A total of 141 HAADF-STEM images wereacquired automatically using the FEI Xplore 3D tomog-raphy software with a tilt range of minus70 to +70 and atilt step of 1 The magnification was 20000 times cor-responding to 785 nm per pixel The acquisition time forone 1024times1024 sized image was 20 s The final tilt seriesdata was aligned and reconstructed using SIRT (30 itera-tions) with FEI Inspect3D The 3D volume was then visu-alized and analyzed by voxel rendering and orthogonalslices using Amira 41
3 RESULTS AND DISCUSSION
31 Limitations of TEM TomographymdashMissingWedge Artifacts
In theory a high-resolution and perfect 3D tomogram canbe achieved when the sample is tilted over the full rangewith a tilt increment as small as possible1726 Howeverin practice the tilt steps chosen are usually between 05
to 5 in order to shorten the total acquisition time mini-mize beam damage to the samples and reduce the build-upof contaminants on the specimen surface under prolongedbeam irradiation The perfect tomography reconstructionalso requires the full range of tilt images recorded fromminus90 to 90 In electron microscopes the geometry of thepolepiece limits the tilt range of the sample holder andelectrons are also blocked by the sample holder and thecopper grid bars when the specimen is tilted to high anglesSome research groups have employed a specially designed360 on-axis tomography holder to obtain the full range oftilt images30 However only micro-pillar shaped samplesprepared by focused ion beam milling can be used in theseholders which limits their applications on certain mate-rials only The lack of projections from high angles (ieminus90 to minus70 and 70 to 90 results in ldquomissing wedgerdquoartifacts which can lead to erroneous estimation of sizeshape and volume of the reconstructed tomogramThe missing wedge artifact can be clearly demonstrated
by a spherical sample such as SiO2 hollow spheres TheSiO2 particles are perfectly spherical with a diameter of200 nm and 20 nm thick walls as seen in conventionalTEM image in Figure 2(a) Figures 2(bndashd) show the recon-structed 3D volume of SiO2 spheres using STEM tomog-raphy A total of 141 HAADF-STEM images were col-lected for reconstruction with a tilt range of minus70 to 70
and a 1 tilt step On one hand the missing wedge arti-fact can result in the elongation of the object along theincident electron beam direction (z direction) as shown
J Nanoeng Nanomanuf 1 257ndash264 2011 259
Delivered by Ingenta toKent Ridge Digital Labs
IP 19212213120Mon 30 Apr 2012 074608
Electron Tomography of Nanostructured Materials Lin et alARTIC
LE
Fig 2 An example of missing wedge artifacts in electron tomographicreconstruction is demonstrated by SiO2 hollow spheres The original tiltseries was from 70 to minus70 (a) BF TEM image of SiO2 hollow spheres(b) elongation observed along the incident beam direction due to missingwedge effects (c) volume artifacts indicated by the arrows (d) a 3Dtomogram showing nearly perfect SiO2 spheres
in Figure 2(b) It is interesting to note that the elongationonly occurs in the missing wedge area (indicated by twolines within 2times 90minus angle area) and the other partsare still present as a perfectly spherical shape The miss-ing frequencies from those angles lead to the distortion inthose directions The elongation factor () depends on themaximum tilt angle 18
=radic
+SintimesCosminusSintimesCos
Table I lists the elongation factors for commonly used tiltranges Considering that the typical tilt range of the sam-ple in TEM is from 70 to minus70 the elongation factoris 13 for the part of the SiO2 sphere along the z direc-tion On the other hand the missing wedge effect can giverise to some volume artifacts because the missing informa-tion at the high tilt angles makes part of the reconstructedobject to be missing For example the lack of projectionsfrom high angle ranges leads to an invisible part alongthe z direction as indicated by arrows in Figure 2(c) Thelarger the missing wedge the more severe these artifactsThe distortion (elongation or missing part) caused by
missing wedge artifacts indicates that we need to bevery cautious when taking analysis in the z-directionof the 3D volume For better visual presentation wecan hide the missing wedge artifacts by viewing theobject close to the incident beam direction as shown inFigure 2(d) which illustrates some nearly perfect recon-structed spheres Currently some advanced reconstruction
Table I Elongation factor for different maximum tilt angles
Tilt angle () Elongation factor
plusmn90 100plusmn85 106plusmn80 113plusmn75 121plusmn70 131plusmn65 142plusmn60 155plusmn55 171plusmn50 189plusmn45 212plusmn40 241plusmn35 277
software also can compensate and reduce the missingwedge artifacts dramatically3032
32 Study of Supported PtSnSBA-15 CatalystUsing BF-TEM Tomography
Supported PtSn catalysts are widely used in dehydro-genation reactions by industry35 The quality of the cat-alyst is affected by the composition shape size of theactive metallic particles the type of support the interactionbetween the metals and the support as well as the distribu-tion of the metals on the support1435 Mesoporous supportsare more attractive in catalysis research due to its ther-mal stability high surface area and defined pore volumewhich may act as nanoreactors resulting in the formationof catalysts with high selectivity Figures 3(a and b) showtwo TEM images of typical PtSn supported on mesoporousSBA-15 which is used as an efficient catalyst for the dehy-drogenation of paraffin and propane35 Nanosized PtSnparticles and some nanorods are observed in the imagesThe diameter of the PtSn nanorods is around 5 nm andthey are oriented along the pores in agreement with thepore size of the SBA-15 (495 nm)35 This indicates thatrod like particles are oriented inside the pores Howeverfrom the 2D images it is difficult to determine the posi-tions of the small particles and how the mesoporoussupport affects the growth and nucleation of the PtSnnanoparticles especially when the support is not sitting ata major zone axis and the pores are invisible (Fig 3(b))Compared with 2D images more detailed information canbe revealed from the 3D reconstructed tomogram A seriesof 2D BF TEM images was acquired from minus60 to +60
for the samples in Figure 2(b) After alignment the 121recorded images already provide abundant useful informa-tion on the structure of the catalyst Close examinationof individual images from the tilt series reveals that allthe particles are none-spherical in shape but are elongatedwith a length to diameter ratio of 13 to 29A 3D tomogram with a reconstructed volume of
359times149times318 nm is displayed in Figures 3(c to f) fromdifferent viewing angles It is found that all the PtSn par-ticles anchor inside the mesopores rather than on the
260 J Nanoeng Nanomanuf 1 257ndash264 2011
Delivered by Ingenta toKent Ridge Digital Labs
IP 19212213120Mon 30 Apr 2012 074608
Lin et al Electron Tomography of Nanostructured MaterialsARTIC
LE
Fig 3 PtSn particles in mesoporous SBA-15 (a b) BF-TEM images showing PtSn nanoparticles supported on SBA-15 (c) corresponding tomographicreconstruction which shows all the particles anchored inside the mesopores (d e) reconstructed volume viewed at the yndashz and xndashz planes (f) a xndashyslice showing three PtSn particles inside the mesopores and white arrows indicating the presence of defects in the SBA-15
external surface of support Due to the limited tilt anglemissing wedge artifacts can be seen along z directionwhere the outline of the SBA-15 in Figure 3(d) (indi-cated by the arrow) is not as clear as that viewed alongxndashy plane The tips of the PtSn particles in Figure 3(e)also appear sharp due to artifacts However by subtractingthe artifacts the PtSn particles still demonstrate elongatedshapes in good agreement with the observation from thetilt series images It is interesting to note that all the metalparticles in one SBA-15 support are aligned along onedirection indicating that the elongation follows the orien-tation of the poresThe positions of the PtSn particles can be further con-
firmed by slicing information from the 3D volume NormalTEM images are the projection of 3D objects which onlydemonstrate the stacking information throughout the vol-ume Using tomography we can slice the 3D volume intoa series of 2D slabs throughout the tomogram along anydirection18 Since each slice extracts a thin layer of infor-mation from the 3D volume without interference fromother layers the contrast in the reconstructed slice is muchbetter than that in a normal TEM image An xndashy slicewith a thickness of 1 nm along the z direction is shownin Figure 3(f) Two PtSn particles are observed insidethe pores and one particle is anchored close to the poreentrance Some defects existing as nanosized holes are alsoobserved inside the SBA-15 mesoporous structures fromthe slicing image which cannot be revealed from normalTEM imagesThe tomography results clearly show that all the PtSn
metallic particles are dispersed inside the SBA-15 meso-pores with the elongated shape along the pore directionMesoporous structures confine the diameter of the particlesand the length of the metallic particles varies from each
other The morphology determined here may explain thediffusion and nucleation process of the PtSn nanoparticlesThe diffusion and nucleation of active metals on meso-porous supports is quite complex and it is controlled bythe interaction between particles and supports kineticsand confinement of the pores Generally minimizing totalenergy of the supported catalyst particles is the drivingforce to reach an equivalent configuration with a particularmorphology and crystal form for the metal particles Metalparticles are found to prefer nucleating at the kinks stepsor the concave areas such as cup or saddle like regionson the surface support materials16 The high temperatureannealing process used to make the catalyst will gener-ate global diffusion and nucleation of PtSn on the supportin regions with high surface curvature The nucleation ofmetals inside pores is a more sable configuration than onthe external surfaces as internal concave pores possess thehighest surface curvature of mesoporous structures Thisagrees well with the observations of TEM tomographywhich indicates the preferred locations of PtSn inside ofthe pores
33 Study of Clay-Epoxy Nanocomposites byHAADF-STEM Tomography
Epoxy nanocomposites with exfoliated clay layers showproperty enhancement in terms of modulus strength andtoughness36ndash39 Many reports have attempted to explain thefracture behavior of such materials Two proposed typicalfracture mechanisms for clay-polymer nanocomposites aremicrocracks generated at the clay-polymer interface anddebonding of the clay layers37 Since the size of the claynanofillers dispersed in epoxy can be a few nanometersthick and a few microns long electron tomography is a
J Nanoeng Nanomanuf 1 257ndash264 2011 261
Delivered by Ingenta toKent Ridge Digital Labs
IP 19212213120Mon 30 Apr 2012 074608
Electron Tomography of Nanostructured Materials Lin et alARTIC
LEuseful technique to study the internal structures of clay-epoxy nanocomposites With electron tomography a 3Dstructure can be generated with nanometer scale resolu-tion and thicker specimens can also be examined afterreconstruction as superimposed slicesstructures that canbe resolved from the reconstructed 3D structureAs discussed in Section 32 BF-TEM images have been
successfully applied to reconstruct amorphous materialsor nanocrystals smaller than 10 nm with weak diffractioncontrast They are not suitable for the reconstruction ofhighly crystalline materials due to the presence of strongdiffraction contrast at the zone axes1718 The diffractioncontrast together with other non-projection phase contrastin BF images will complicate tomographic reconstructionand lead to a distortion in the shape of the reconstructedstructure26 HAADF-STEM images are formed by collect-ing high-angle (gt50 mrad) scattered electrons4041 Theintensity of the images is approximately proportional to thesquare of the atomic number (Z) and varies linearly withthe sample thickness (for relatively small sample thick-nesses) All non-projection contrast can be minimized inthe images Thus HAADF STEM imaging is applicablefor electron tomography of both amorphous and crystallinematerialsBF-TEM and HAADF-STEM images of the clay filled
epoxy nanocomposite are depicted in Figures 4(andashd)HAADF-STEM images show sharper clay edges than thatin BF images It is noteworthy that the non-projectioninduced contrast shown in BF TEM images such as Fres-nel fringes seen at the edge of the particles and the arti-facts due to defocus and varying specimen height arenot observed in the STEM images Moreover due tothe counts of HAADF-STEM images being approximatelyproportional to the square of the atomic number theydemonstrate higher contrast between the epoxy matrix andthe clay layers which contain Si with higher atomic num-ber than carbon Since the quality of the tomographicreconstruction is determined by the quality of the orig-inal tilt images the higher contrast and sharper STEMimages give rise to better and more interpretable tomo-graphic reconstruction results as shown in Figures 4(eand f) In comparison to the HAADF-STEM reconstructedobject the clay layers are less clear in the polymer matrixin the BF TEM tomogram and some blurry shadows arepresent close to the clay layers which originate from thenon-projection contrast in the 2D images The resolutionof the HAADF-STEM images is similar to that of theBF-TEM images but HAADF-STEM tomography pro-vides higher sensitivity to samples with large differencesin atomic numbersBesides sharper images HAADF-STEM also reduces
beam damage to polymer samples17ndash19 Damage of thenanomaterials by the electron beam is one of the majorconcerns during image acquisition The full acquisitiontime for BF-TEM tomography is around 30 min to 1 h
Fig 4 A comparison between BF-TEM and HAADF-STEM imagesand their corresponding tomographic reconstructions (a c e) BF-TEMimages and corresponding tomographic reconstruction and (b d f)HAADF-STEM images and corresponding tomographic reconstruction ofclay-epoxy nanocomposite material
which is shorter than the 2 h to 4 h for HAADF-STEMtomography However polymers (also including SiO2
spheres) are found to be more susceptible to damage by thecontinuous electron beam illumination in BF-TEM imag-ing mode than that under the intermittent scanning beamseven though the unit area intensity of the scanned probe isstronger than the parallel beam in TEM Based on the con-cerns discussed above HAADF-STEM tomography wasselected for the tomographic reconstruction of the polymermaterials in this paperA typical HAADF-STEM image of the clay-epoxy
nanocomposite is shown in Figure 5(a) The clay is exfoli-ated uniformly into layers of approximately 1ndash2 m longand a few tens of nanometers thick which are dispersedrandomly in an epoxy matrix The clay-epoxy matrix isthinned to sections a few hundred nanometers thick bythe diamond cutter of the microtome The diamond cutterscratches the surface of the clay-epoxy sections and thuscauses the straight lines seen in the image Since the stressconcentration point is located at the clay-epoxy interfaceclay layers tend to split to form voids when the strain isreleased during the sample preparation processThe randomly distributed clay layers in polymer matrix
produce various 2D projections The sharp lines markedby number 1 in Figure 5(a) with the highest contrast arethe projection of the silica layers lying parallel to the
262 J Nanoeng Nanomanuf 1 257ndash264 2011
Delivered by Ingenta toKent Ridge Digital Labs
IP 19212213120Mon 30 Apr 2012 074608
Lin et al Electron Tomography of Nanostructured MaterialsARTIC
LE
Fig 5 (a) HAADF-STEM image of clay-epoxy nanocomposite arrowsindicate the presence of clay layers in different orientations (b) corre-sponding 3D reconstruction of the nanocomposite with dimensions of6978times7560times447 nm
viewing direction or the incident electron beam Silica lay-ers oriented perpendicular to the incident electron beamexhibit the lowest contrast due to a planar morphologyof clay layers in the epoxy matrix which are marked byarrows number 3 The others marked by arrow number 2are tilted from the beam direction The random orienta-tions of the clay layers in the epoxy complicate the inter-pretation of 2D STEM images and it is difficult to clearlyreveal the interface between the clay and the epoxy as wellas the real orientation and thickness of the silica layersElectron tomography allows us to reveal the whole struc-ture unambiguously The corresponding voxel rendering ofthe reconstructed 3D volume is displayed in Figure 5(b)with the reconstructed volume at 6978times 7560times 447 nmIt is noteworthy that the clay layers lying perpendicular tothe viewing angle in the 2D image can be visualized as a
Fig 6 (a) A HAADF-STEM image of the clay-epoxy nanocomposite (b) corresponding 3D reconstructed volume (cndashe) three slices in the xndashyplane from the reconstructed volume show a split extending from clayndashclay to clay-epoxy and to epoxyndashepoxy Three slices are taken from differentlevels located at the 12th (942 nm from the top surface) 27th (212 nm from the top surface) and 43rd slices (3376 nm from the top surface)
thin slab at certain tilt angles in the reconstructed volumeas indicated by the arrow in Figure 5(b)The reconstructed 3D structure can also show the loca-
tion of voids and the nature of delamination of the claylayers36 Clay layers in the polymer matrix are better visu-alized by a series of images sliced perpendicular to theviewing angle Figure 6 shows three xndashy slices at differentlevels in the reconstruction with a thickness of 785 nmfor each slice The red arrows indicate three regions wherea split changes from inside the clay layers to the clay-epoxy interface at different thickness Clay has a layeredand planar structure with strong covalent bonds in layersand weak forces between layers Without treatment withthe coupling agent the clay layers cannot be fully exfo-liated and the dispersed layers can have thickness of upto tens of layers When the polymer matrix is cut into400 nm thin slabs micro-deformation occurs at the area ofclay layers due to stress release of the epoxy around theclay region From the 3D reconstructed images and slicesindicated in Figure 6 the micro cracks could have initi-ated inside the thick clay layers due to its weak interlayerbonding Since the thickness of the clay is not uniformthe crack will propagate to the clay-epoxy interface andextend into the polymer matrix3D electron tomographic reconstruction has proven
itself to be an important technique as it is the onlytechnique that can reveal the delamination of clayndashclayclay-epoxy matrix and polymer-polymer matrix at differ-ent positions of a single particle The analysis of micro-deformation can also be used to explain the macro-scale
J Nanoeng Nanomanuf 1 257ndash264 2011 263
Delivered by Ingenta toKent Ridge Digital Labs
IP 19212213120Mon 30 Apr 2012 074608
Electron Tomography of Nanostructured Materials Lin et alARTIC
LEcracking mechanism when an external force is appliedSince the clay layers act as stress concentrators and crackinitiators we propose that thinner and more uniform claylayers such as silane treated clay particles will help toimprove the mechanical properties of this clay polymermatrix37
4 CONCLUSION
Unlike 2D TEM images electron tomography is apowerful technique for obtaining 3D information fromnanostructured materials and devices in all directionsMore detailed information such as the location and dis-tribution of the particles in the support the shape of thenanocrystals the interaction of filler and matrix etc canbe revealed by a 3D reconstructed volume even beingaccompanied by missing wedge artifacts Using electrontomography we have explained the growth and nucleationof the metallic particles in mesoporous SBA-15 and theexfoliation of clay in epoxy matrix The insightful analysisfrom 3D reconstruction is significantly meaningful for themeasurement of their corresponding chemical and physicalproperties and the establishment of their structure-propertyrelations
Acknowledgments This work is supported by IMREcore funding The authors would like to thank Dr LiuYe from IMRE (Singapore) for providing the hollow SiO2
samples and Professor Fan Yining from Nanjing Univer-sity (China) for providing the ptSnSBA-15 catalyst
References and Notes
1 Z L Wang J Phys Chem B 104 1153 (2000)2 Z L Wang Adv Mater 15 1497 (2003)3 D Williams and C B Carter Transmission Electron Microscopy
Plenum Press New York (1996)4 J Frank Electron Tomography Three-Dimensional Imaging with
the Transmission Electron Microscope Plenum Press New York(1992)
5 D J De Rosier and A Klug Nature 217 130 (1968)6 W Hoppe R Langer G Knesch and C Poppe Naturwis-
senschaften 55 333 (1968)7 R G Hart Science 159 1464 (1968)8 A J Koster U Ziese A J Verkleij A H Janssen and K P de
Jong J Phys Chem B 104 9368 (2000)9 P A Midgley M Weyland J M Thomas and B F G Johnson
Chem Commun 10 907 (2001)10 M Weyland and P A Midgley Microsc Microanal 9 542 (2003)11 O Kwon and A H Zewail Science 328 1668 (2010)12 A H Zewail Science 328 187 (2010)13 K P de Jong and A J Koster Chem Phys Chem 3 776
(2002)
14 O Ersen J Parmentier L A Solovyov M Drillon C Pham-HuuJ Werckmann and P Schultz J Am Chem Soc 130 16800 (2008)
15 A H Janssen C M Yang Y Wang F Schuth A J Koster andK P de Jong J Phys Chem B 107 10552 (2003)
16 E P W Ward T J V Yates J Fernandez D E W Vaughan andP A Midgley J Phys Chem C 111 11501 (2007)
17 M Weyland and P A Midgley Mater Today 7 32 (2004)18 C Kubel A Voigt R Schoenmakers M Otten D Su T C Lee
A Calsson and J Bradley Microsc Microanal 11 378 (2005)19 P A Midgley and R E Dunin-Borkowski Nature Mater 8 271
(2009)20 H Wei Z Wang J Zhang S House Y Gao L Yang H Robinson
L H Tan H Xing C Hou I M Robertson J Zuo and Y LuNature Nanotechnol 6 93 (2011)
21 H Jinnai R J Spontak and T Nishi Macromolecules 43 1675(2010)
22 V Andersson A Herland S Masich and O Inganas Nano Lett9 853 (2009)
23 S S van Bavel E Sourty G de With and J Loos Nano Lett9 507 (2009)
24 K Kaneko K Inoke B Freitag A B Hungria P A MidgleyT W Hansen J Zhang S Ohara and T Adschiri Nano Lett 7 421(2007)
25 M A Verheijen R E Algra M T Borgstroumlm G ImminkE Sourty W J P van Enckevort E Vlieg and E P A M BakkersNano Lett 7 351 (2007)
26 X J Xu Z Saghi R Gay and G Mobus Nanotechnol 18 225501(2007)
27 O Ersen S Beacutegin M Houlleacute J Amadou I Janowska J GrenegravecheC Crucifix and C Pham-Huu Nano Lett 8 1033 (2008)
28 H Katz-Boon C J Rossouw M Weyland A M FunstonP Mulvaney and J Etheridge Nano Lett 11 273 (2011)
29 J P Y Tan H R Tan C Boothroyd Y L Foo C B He andM Lin J Phys Chem C 115 3544 (2011)
30 E Biermans L Molina K J Batenburg S Bals and G VTenderloo Nano Lett 10 5014 (2010)
31 I Arslan J R Tong and P A Midgley Ultramicroscopy 106 994(2006)
32 S Bals K J Batenburg J Verbeeck J Sijbers and G V TendelooNano Lett 7 3669 (2007)
33 H Y Li H L Xin D A Muller and L A Estroff Science326 1244 (2009)
34 J Loos E Sourty K Lu B Freitag D Tang and D Wall NanoLett 9 1904 (2009)
35 L Huang B Xu L Yang and Y Fan Catal Commun 9 2593(2008)
36 K Wang L Chen J Wu M L Toh C B He and A F YeeMacromolecules 38 788 (2005)
37 K Wang L Wang J Wu L Chen and C B He Langmuir 21 3613(2005)
38 F Drummy Y C Wang R Schoenmakers K May M JacksonH Koerner B L Farmer B Mauryama and R A Vaia Macro-molecules 41 2135 (2008)
39 L Chen S C Wong and S Pisharash J Appl Polym Sci 88 3298(2003)
40 J Loos E Sourty K Lu G de With and S V Bavel Macro-molecules 42 2581 (2009)
41 F Krumeich E Muller R A Wepf and R Nesper J Phys Chem C115 1080 (2011)
264 J Nanoeng Nanomanuf 1 257ndash264 2011

Delivered by Ingenta toKent Ridge Digital Labs
IP 19212213120Mon 30 Apr 2012 074608
Lin et al Electron Tomography of Nanostructured MaterialsARTIC
LEobject separately The resolution of the tomogram aftersegmentation is typically lower than that of the originalreconstruction due to the application of a surface smooth-ing function Although resolution has to be compromisedthe structures after segmentation are found to be almost thesame as the original results29 In this paper followed by theintroduction of the theory of electron tomography we willdiscuss the limitations and subsequent artefacts of electrontomography Two examples Pt catalyst particles supportedon SBA-15 and clay-epoxy nanocomposites reconstructedby BF TEM and HAADF-STEM images respectively arediscussed to present tomographic reconstruction of differ-ent nanostructured samples and to reveal the influence ofthe support on the structures of the supported metallic cat-alysts and the exfoliation mechanism of the clay layers inepoxy
2 EXPERIMENTAL DETAILS
21 PtSnSBA-15 Catalysts
04 wt Pt and 06 wt Sn (SnPt atomic ratio = 24)loaded on a mesoporous SBA-15 substrate was preparedby impregnation method35 The SBA-15 support wasimpregnated with a H2PtCl6 and SnCl4 aqueous solutiondried at 120 C and then calcined in air at 500 C for 4 hThe powders obtained were de-chlorinated in air contain-ing water vapor at 500 C for 4 h to remove any remainingchlorine on the sample surfaceThe prepared catalysts were dispersed in ethanol and
dropped onto a 100 mesh copper grid coated with a layerof carbon film (SPI) Electron tomography was carried outon a JEOL 2100 TEM operated at 200 kV A total of121 BF TEM images were recorded automatically overa tilt range of minus60 to +60 with a tilt step of 1 usingthe JEOL TEMograhy program The magnification was25000 times corresponding to 0512 nm per pixel Thefinal tilt series data was aligned and reconstructed byweighted-back projection using the reconstruction programComposer The 3D volume was then visualized by voxelrendering using the software Visulizer
22 Clay-Epoxy Nanocomposites
The preparation of clay-epoxy was modified from ref39 and 40 Epoxy DER 332 with an epoxide equivalentweight of 171ndash175 gequiv and Ethacure 100-LC was usedas the polymer matrix and curing agent 4 g clay was dis-persed in 120 ml water and stirred at room temperature for24 h The suspension was mixed and washed with acetonethree times The white precipitate was then mixed withepoxy resin and acetone was evaporated in a vacuum ovenat 50 C The resulting mixture was stirred with a curingagent and dried at 75 C for 60 min Finally the clay-epoxy nanocomposite was prepared by curing the sampleat 100 C for 2 h and post-cured at 180 C for 5 h
TEM specimens were prepared using an ultramicro-tome Typically polymer sections of thickness from 300to 500 nm are prepared in order to ensure that the inor-ganic fillers remain intact in the epoxy and to minimizethe cutting damage to the clay-epoxy interface 3D elec-tron tomography of the nanocomposites was performedon a FEI Titan STEM operated at an accelerating voltageof 300 kV A total of 141 HAADF-STEM images wereacquired automatically using the FEI Xplore 3D tomog-raphy software with a tilt range of minus70 to +70 and atilt step of 1 The magnification was 20000 times cor-responding to 785 nm per pixel The acquisition time forone 1024times1024 sized image was 20 s The final tilt seriesdata was aligned and reconstructed using SIRT (30 itera-tions) with FEI Inspect3D The 3D volume was then visu-alized and analyzed by voxel rendering and orthogonalslices using Amira 41
3 RESULTS AND DISCUSSION
31 Limitations of TEM TomographymdashMissingWedge Artifacts
In theory a high-resolution and perfect 3D tomogram canbe achieved when the sample is tilted over the full rangewith a tilt increment as small as possible1726 Howeverin practice the tilt steps chosen are usually between 05
to 5 in order to shorten the total acquisition time mini-mize beam damage to the samples and reduce the build-upof contaminants on the specimen surface under prolongedbeam irradiation The perfect tomography reconstructionalso requires the full range of tilt images recorded fromminus90 to 90 In electron microscopes the geometry of thepolepiece limits the tilt range of the sample holder andelectrons are also blocked by the sample holder and thecopper grid bars when the specimen is tilted to high anglesSome research groups have employed a specially designed360 on-axis tomography holder to obtain the full range oftilt images30 However only micro-pillar shaped samplesprepared by focused ion beam milling can be used in theseholders which limits their applications on certain mate-rials only The lack of projections from high angles (ieminus90 to minus70 and 70 to 90 results in ldquomissing wedgerdquoartifacts which can lead to erroneous estimation of sizeshape and volume of the reconstructed tomogramThe missing wedge artifact can be clearly demonstrated
by a spherical sample such as SiO2 hollow spheres TheSiO2 particles are perfectly spherical with a diameter of200 nm and 20 nm thick walls as seen in conventionalTEM image in Figure 2(a) Figures 2(bndashd) show the recon-structed 3D volume of SiO2 spheres using STEM tomog-raphy A total of 141 HAADF-STEM images were col-lected for reconstruction with a tilt range of minus70 to 70
and a 1 tilt step On one hand the missing wedge arti-fact can result in the elongation of the object along theincident electron beam direction (z direction) as shown
J Nanoeng Nanomanuf 1 257ndash264 2011 259
Delivered by Ingenta toKent Ridge Digital Labs
IP 19212213120Mon 30 Apr 2012 074608
Electron Tomography of Nanostructured Materials Lin et alARTIC
LE
Fig 2 An example of missing wedge artifacts in electron tomographicreconstruction is demonstrated by SiO2 hollow spheres The original tiltseries was from 70 to minus70 (a) BF TEM image of SiO2 hollow spheres(b) elongation observed along the incident beam direction due to missingwedge effects (c) volume artifacts indicated by the arrows (d) a 3Dtomogram showing nearly perfect SiO2 spheres
in Figure 2(b) It is interesting to note that the elongationonly occurs in the missing wedge area (indicated by twolines within 2times 90minus angle area) and the other partsare still present as a perfectly spherical shape The miss-ing frequencies from those angles lead to the distortion inthose directions The elongation factor () depends on themaximum tilt angle 18
=radic
+SintimesCosminusSintimesCos
Table I lists the elongation factors for commonly used tiltranges Considering that the typical tilt range of the sam-ple in TEM is from 70 to minus70 the elongation factoris 13 for the part of the SiO2 sphere along the z direc-tion On the other hand the missing wedge effect can giverise to some volume artifacts because the missing informa-tion at the high tilt angles makes part of the reconstructedobject to be missing For example the lack of projectionsfrom high angle ranges leads to an invisible part alongthe z direction as indicated by arrows in Figure 2(c) Thelarger the missing wedge the more severe these artifactsThe distortion (elongation or missing part) caused by
missing wedge artifacts indicates that we need to bevery cautious when taking analysis in the z-directionof the 3D volume For better visual presentation wecan hide the missing wedge artifacts by viewing theobject close to the incident beam direction as shown inFigure 2(d) which illustrates some nearly perfect recon-structed spheres Currently some advanced reconstruction
Table I Elongation factor for different maximum tilt angles
Tilt angle () Elongation factor
plusmn90 100plusmn85 106plusmn80 113plusmn75 121plusmn70 131plusmn65 142plusmn60 155plusmn55 171plusmn50 189plusmn45 212plusmn40 241plusmn35 277
software also can compensate and reduce the missingwedge artifacts dramatically3032
32 Study of Supported PtSnSBA-15 CatalystUsing BF-TEM Tomography
Supported PtSn catalysts are widely used in dehydro-genation reactions by industry35 The quality of the cat-alyst is affected by the composition shape size of theactive metallic particles the type of support the interactionbetween the metals and the support as well as the distribu-tion of the metals on the support1435 Mesoporous supportsare more attractive in catalysis research due to its ther-mal stability high surface area and defined pore volumewhich may act as nanoreactors resulting in the formationof catalysts with high selectivity Figures 3(a and b) showtwo TEM images of typical PtSn supported on mesoporousSBA-15 which is used as an efficient catalyst for the dehy-drogenation of paraffin and propane35 Nanosized PtSnparticles and some nanorods are observed in the imagesThe diameter of the PtSn nanorods is around 5 nm andthey are oriented along the pores in agreement with thepore size of the SBA-15 (495 nm)35 This indicates thatrod like particles are oriented inside the pores Howeverfrom the 2D images it is difficult to determine the posi-tions of the small particles and how the mesoporoussupport affects the growth and nucleation of the PtSnnanoparticles especially when the support is not sitting ata major zone axis and the pores are invisible (Fig 3(b))Compared with 2D images more detailed information canbe revealed from the 3D reconstructed tomogram A seriesof 2D BF TEM images was acquired from minus60 to +60
for the samples in Figure 2(b) After alignment the 121recorded images already provide abundant useful informa-tion on the structure of the catalyst Close examinationof individual images from the tilt series reveals that allthe particles are none-spherical in shape but are elongatedwith a length to diameter ratio of 13 to 29A 3D tomogram with a reconstructed volume of
359times149times318 nm is displayed in Figures 3(c to f) fromdifferent viewing angles It is found that all the PtSn par-ticles anchor inside the mesopores rather than on the
260 J Nanoeng Nanomanuf 1 257ndash264 2011
Delivered by Ingenta toKent Ridge Digital Labs
IP 19212213120Mon 30 Apr 2012 074608
Lin et al Electron Tomography of Nanostructured MaterialsARTIC
LE
Fig 3 PtSn particles in mesoporous SBA-15 (a b) BF-TEM images showing PtSn nanoparticles supported on SBA-15 (c) corresponding tomographicreconstruction which shows all the particles anchored inside the mesopores (d e) reconstructed volume viewed at the yndashz and xndashz planes (f) a xndashyslice showing three PtSn particles inside the mesopores and white arrows indicating the presence of defects in the SBA-15
external surface of support Due to the limited tilt anglemissing wedge artifacts can be seen along z directionwhere the outline of the SBA-15 in Figure 3(d) (indi-cated by the arrow) is not as clear as that viewed alongxndashy plane The tips of the PtSn particles in Figure 3(e)also appear sharp due to artifacts However by subtractingthe artifacts the PtSn particles still demonstrate elongatedshapes in good agreement with the observation from thetilt series images It is interesting to note that all the metalparticles in one SBA-15 support are aligned along onedirection indicating that the elongation follows the orien-tation of the poresThe positions of the PtSn particles can be further con-
firmed by slicing information from the 3D volume NormalTEM images are the projection of 3D objects which onlydemonstrate the stacking information throughout the vol-ume Using tomography we can slice the 3D volume intoa series of 2D slabs throughout the tomogram along anydirection18 Since each slice extracts a thin layer of infor-mation from the 3D volume without interference fromother layers the contrast in the reconstructed slice is muchbetter than that in a normal TEM image An xndashy slicewith a thickness of 1 nm along the z direction is shownin Figure 3(f) Two PtSn particles are observed insidethe pores and one particle is anchored close to the poreentrance Some defects existing as nanosized holes are alsoobserved inside the SBA-15 mesoporous structures fromthe slicing image which cannot be revealed from normalTEM imagesThe tomography results clearly show that all the PtSn
metallic particles are dispersed inside the SBA-15 meso-pores with the elongated shape along the pore directionMesoporous structures confine the diameter of the particlesand the length of the metallic particles varies from each
other The morphology determined here may explain thediffusion and nucleation process of the PtSn nanoparticlesThe diffusion and nucleation of active metals on meso-porous supports is quite complex and it is controlled bythe interaction between particles and supports kineticsand confinement of the pores Generally minimizing totalenergy of the supported catalyst particles is the drivingforce to reach an equivalent configuration with a particularmorphology and crystal form for the metal particles Metalparticles are found to prefer nucleating at the kinks stepsor the concave areas such as cup or saddle like regionson the surface support materials16 The high temperatureannealing process used to make the catalyst will gener-ate global diffusion and nucleation of PtSn on the supportin regions with high surface curvature The nucleation ofmetals inside pores is a more sable configuration than onthe external surfaces as internal concave pores possess thehighest surface curvature of mesoporous structures Thisagrees well with the observations of TEM tomographywhich indicates the preferred locations of PtSn inside ofthe pores
33 Study of Clay-Epoxy Nanocomposites byHAADF-STEM Tomography
Epoxy nanocomposites with exfoliated clay layers showproperty enhancement in terms of modulus strength andtoughness36ndash39 Many reports have attempted to explain thefracture behavior of such materials Two proposed typicalfracture mechanisms for clay-polymer nanocomposites aremicrocracks generated at the clay-polymer interface anddebonding of the clay layers37 Since the size of the claynanofillers dispersed in epoxy can be a few nanometersthick and a few microns long electron tomography is a
J Nanoeng Nanomanuf 1 257ndash264 2011 261
Delivered by Ingenta toKent Ridge Digital Labs
IP 19212213120Mon 30 Apr 2012 074608
Electron Tomography of Nanostructured Materials Lin et alARTIC
LEuseful technique to study the internal structures of clay-epoxy nanocomposites With electron tomography a 3Dstructure can be generated with nanometer scale resolu-tion and thicker specimens can also be examined afterreconstruction as superimposed slicesstructures that canbe resolved from the reconstructed 3D structureAs discussed in Section 32 BF-TEM images have been
successfully applied to reconstruct amorphous materialsor nanocrystals smaller than 10 nm with weak diffractioncontrast They are not suitable for the reconstruction ofhighly crystalline materials due to the presence of strongdiffraction contrast at the zone axes1718 The diffractioncontrast together with other non-projection phase contrastin BF images will complicate tomographic reconstructionand lead to a distortion in the shape of the reconstructedstructure26 HAADF-STEM images are formed by collect-ing high-angle (gt50 mrad) scattered electrons4041 Theintensity of the images is approximately proportional to thesquare of the atomic number (Z) and varies linearly withthe sample thickness (for relatively small sample thick-nesses) All non-projection contrast can be minimized inthe images Thus HAADF STEM imaging is applicablefor electron tomography of both amorphous and crystallinematerialsBF-TEM and HAADF-STEM images of the clay filled
epoxy nanocomposite are depicted in Figures 4(andashd)HAADF-STEM images show sharper clay edges than thatin BF images It is noteworthy that the non-projectioninduced contrast shown in BF TEM images such as Fres-nel fringes seen at the edge of the particles and the arti-facts due to defocus and varying specimen height arenot observed in the STEM images Moreover due tothe counts of HAADF-STEM images being approximatelyproportional to the square of the atomic number theydemonstrate higher contrast between the epoxy matrix andthe clay layers which contain Si with higher atomic num-ber than carbon Since the quality of the tomographicreconstruction is determined by the quality of the orig-inal tilt images the higher contrast and sharper STEMimages give rise to better and more interpretable tomo-graphic reconstruction results as shown in Figures 4(eand f) In comparison to the HAADF-STEM reconstructedobject the clay layers are less clear in the polymer matrixin the BF TEM tomogram and some blurry shadows arepresent close to the clay layers which originate from thenon-projection contrast in the 2D images The resolutionof the HAADF-STEM images is similar to that of theBF-TEM images but HAADF-STEM tomography pro-vides higher sensitivity to samples with large differencesin atomic numbersBesides sharper images HAADF-STEM also reduces
beam damage to polymer samples17ndash19 Damage of thenanomaterials by the electron beam is one of the majorconcerns during image acquisition The full acquisitiontime for BF-TEM tomography is around 30 min to 1 h
Fig 4 A comparison between BF-TEM and HAADF-STEM imagesand their corresponding tomographic reconstructions (a c e) BF-TEMimages and corresponding tomographic reconstruction and (b d f)HAADF-STEM images and corresponding tomographic reconstruction ofclay-epoxy nanocomposite material
which is shorter than the 2 h to 4 h for HAADF-STEMtomography However polymers (also including SiO2
spheres) are found to be more susceptible to damage by thecontinuous electron beam illumination in BF-TEM imag-ing mode than that under the intermittent scanning beamseven though the unit area intensity of the scanned probe isstronger than the parallel beam in TEM Based on the con-cerns discussed above HAADF-STEM tomography wasselected for the tomographic reconstruction of the polymermaterials in this paperA typical HAADF-STEM image of the clay-epoxy
nanocomposite is shown in Figure 5(a) The clay is exfoli-ated uniformly into layers of approximately 1ndash2 m longand a few tens of nanometers thick which are dispersedrandomly in an epoxy matrix The clay-epoxy matrix isthinned to sections a few hundred nanometers thick bythe diamond cutter of the microtome The diamond cutterscratches the surface of the clay-epoxy sections and thuscauses the straight lines seen in the image Since the stressconcentration point is located at the clay-epoxy interfaceclay layers tend to split to form voids when the strain isreleased during the sample preparation processThe randomly distributed clay layers in polymer matrix
produce various 2D projections The sharp lines markedby number 1 in Figure 5(a) with the highest contrast arethe projection of the silica layers lying parallel to the
262 J Nanoeng Nanomanuf 1 257ndash264 2011
Delivered by Ingenta toKent Ridge Digital Labs
IP 19212213120Mon 30 Apr 2012 074608
Lin et al Electron Tomography of Nanostructured MaterialsARTIC
LE
Fig 5 (a) HAADF-STEM image of clay-epoxy nanocomposite arrowsindicate the presence of clay layers in different orientations (b) corre-sponding 3D reconstruction of the nanocomposite with dimensions of6978times7560times447 nm
viewing direction or the incident electron beam Silica lay-ers oriented perpendicular to the incident electron beamexhibit the lowest contrast due to a planar morphologyof clay layers in the epoxy matrix which are marked byarrows number 3 The others marked by arrow number 2are tilted from the beam direction The random orienta-tions of the clay layers in the epoxy complicate the inter-pretation of 2D STEM images and it is difficult to clearlyreveal the interface between the clay and the epoxy as wellas the real orientation and thickness of the silica layersElectron tomography allows us to reveal the whole struc-ture unambiguously The corresponding voxel rendering ofthe reconstructed 3D volume is displayed in Figure 5(b)with the reconstructed volume at 6978times 7560times 447 nmIt is noteworthy that the clay layers lying perpendicular tothe viewing angle in the 2D image can be visualized as a
Fig 6 (a) A HAADF-STEM image of the clay-epoxy nanocomposite (b) corresponding 3D reconstructed volume (cndashe) three slices in the xndashyplane from the reconstructed volume show a split extending from clayndashclay to clay-epoxy and to epoxyndashepoxy Three slices are taken from differentlevels located at the 12th (942 nm from the top surface) 27th (212 nm from the top surface) and 43rd slices (3376 nm from the top surface)
thin slab at certain tilt angles in the reconstructed volumeas indicated by the arrow in Figure 5(b)The reconstructed 3D structure can also show the loca-
tion of voids and the nature of delamination of the claylayers36 Clay layers in the polymer matrix are better visu-alized by a series of images sliced perpendicular to theviewing angle Figure 6 shows three xndashy slices at differentlevels in the reconstruction with a thickness of 785 nmfor each slice The red arrows indicate three regions wherea split changes from inside the clay layers to the clay-epoxy interface at different thickness Clay has a layeredand planar structure with strong covalent bonds in layersand weak forces between layers Without treatment withthe coupling agent the clay layers cannot be fully exfo-liated and the dispersed layers can have thickness of upto tens of layers When the polymer matrix is cut into400 nm thin slabs micro-deformation occurs at the area ofclay layers due to stress release of the epoxy around theclay region From the 3D reconstructed images and slicesindicated in Figure 6 the micro cracks could have initi-ated inside the thick clay layers due to its weak interlayerbonding Since the thickness of the clay is not uniformthe crack will propagate to the clay-epoxy interface andextend into the polymer matrix3D electron tomographic reconstruction has proven
itself to be an important technique as it is the onlytechnique that can reveal the delamination of clayndashclayclay-epoxy matrix and polymer-polymer matrix at differ-ent positions of a single particle The analysis of micro-deformation can also be used to explain the macro-scale
J Nanoeng Nanomanuf 1 257ndash264 2011 263
Delivered by Ingenta toKent Ridge Digital Labs
IP 19212213120Mon 30 Apr 2012 074608
Electron Tomography of Nanostructured Materials Lin et alARTIC
LEcracking mechanism when an external force is appliedSince the clay layers act as stress concentrators and crackinitiators we propose that thinner and more uniform claylayers such as silane treated clay particles will help toimprove the mechanical properties of this clay polymermatrix37
4 CONCLUSION
Unlike 2D TEM images electron tomography is apowerful technique for obtaining 3D information fromnanostructured materials and devices in all directionsMore detailed information such as the location and dis-tribution of the particles in the support the shape of thenanocrystals the interaction of filler and matrix etc canbe revealed by a 3D reconstructed volume even beingaccompanied by missing wedge artifacts Using electrontomography we have explained the growth and nucleationof the metallic particles in mesoporous SBA-15 and theexfoliation of clay in epoxy matrix The insightful analysisfrom 3D reconstruction is significantly meaningful for themeasurement of their corresponding chemical and physicalproperties and the establishment of their structure-propertyrelations
Acknowledgments This work is supported by IMREcore funding The authors would like to thank Dr LiuYe from IMRE (Singapore) for providing the hollow SiO2
samples and Professor Fan Yining from Nanjing Univer-sity (China) for providing the ptSnSBA-15 catalyst
References and Notes
1 Z L Wang J Phys Chem B 104 1153 (2000)2 Z L Wang Adv Mater 15 1497 (2003)3 D Williams and C B Carter Transmission Electron Microscopy
Plenum Press New York (1996)4 J Frank Electron Tomography Three-Dimensional Imaging with
the Transmission Electron Microscope Plenum Press New York(1992)
5 D J De Rosier and A Klug Nature 217 130 (1968)6 W Hoppe R Langer G Knesch and C Poppe Naturwis-
senschaften 55 333 (1968)7 R G Hart Science 159 1464 (1968)8 A J Koster U Ziese A J Verkleij A H Janssen and K P de
Jong J Phys Chem B 104 9368 (2000)9 P A Midgley M Weyland J M Thomas and B F G Johnson
Chem Commun 10 907 (2001)10 M Weyland and P A Midgley Microsc Microanal 9 542 (2003)11 O Kwon and A H Zewail Science 328 1668 (2010)12 A H Zewail Science 328 187 (2010)13 K P de Jong and A J Koster Chem Phys Chem 3 776
(2002)
14 O Ersen J Parmentier L A Solovyov M Drillon C Pham-HuuJ Werckmann and P Schultz J Am Chem Soc 130 16800 (2008)
15 A H Janssen C M Yang Y Wang F Schuth A J Koster andK P de Jong J Phys Chem B 107 10552 (2003)
16 E P W Ward T J V Yates J Fernandez D E W Vaughan andP A Midgley J Phys Chem C 111 11501 (2007)
17 M Weyland and P A Midgley Mater Today 7 32 (2004)18 C Kubel A Voigt R Schoenmakers M Otten D Su T C Lee
A Calsson and J Bradley Microsc Microanal 11 378 (2005)19 P A Midgley and R E Dunin-Borkowski Nature Mater 8 271
(2009)20 H Wei Z Wang J Zhang S House Y Gao L Yang H Robinson
L H Tan H Xing C Hou I M Robertson J Zuo and Y LuNature Nanotechnol 6 93 (2011)
21 H Jinnai R J Spontak and T Nishi Macromolecules 43 1675(2010)
22 V Andersson A Herland S Masich and O Inganas Nano Lett9 853 (2009)
23 S S van Bavel E Sourty G de With and J Loos Nano Lett9 507 (2009)
24 K Kaneko K Inoke B Freitag A B Hungria P A MidgleyT W Hansen J Zhang S Ohara and T Adschiri Nano Lett 7 421(2007)
25 M A Verheijen R E Algra M T Borgstroumlm G ImminkE Sourty W J P van Enckevort E Vlieg and E P A M BakkersNano Lett 7 351 (2007)
26 X J Xu Z Saghi R Gay and G Mobus Nanotechnol 18 225501(2007)
27 O Ersen S Beacutegin M Houlleacute J Amadou I Janowska J GrenegravecheC Crucifix and C Pham-Huu Nano Lett 8 1033 (2008)
28 H Katz-Boon C J Rossouw M Weyland A M FunstonP Mulvaney and J Etheridge Nano Lett 11 273 (2011)
29 J P Y Tan H R Tan C Boothroyd Y L Foo C B He andM Lin J Phys Chem C 115 3544 (2011)
30 E Biermans L Molina K J Batenburg S Bals and G VTenderloo Nano Lett 10 5014 (2010)
31 I Arslan J R Tong and P A Midgley Ultramicroscopy 106 994(2006)
32 S Bals K J Batenburg J Verbeeck J Sijbers and G V TendelooNano Lett 7 3669 (2007)
33 H Y Li H L Xin D A Muller and L A Estroff Science326 1244 (2009)
34 J Loos E Sourty K Lu B Freitag D Tang and D Wall NanoLett 9 1904 (2009)
35 L Huang B Xu L Yang and Y Fan Catal Commun 9 2593(2008)
36 K Wang L Chen J Wu M L Toh C B He and A F YeeMacromolecules 38 788 (2005)
37 K Wang L Wang J Wu L Chen and C B He Langmuir 21 3613(2005)
38 F Drummy Y C Wang R Schoenmakers K May M JacksonH Koerner B L Farmer B Mauryama and R A Vaia Macro-molecules 41 2135 (2008)
39 L Chen S C Wong and S Pisharash J Appl Polym Sci 88 3298(2003)
40 J Loos E Sourty K Lu G de With and S V Bavel Macro-molecules 42 2581 (2009)
41 F Krumeich E Muller R A Wepf and R Nesper J Phys Chem C115 1080 (2011)
264 J Nanoeng Nanomanuf 1 257ndash264 2011

Delivered by Ingenta toKent Ridge Digital Labs
IP 19212213120Mon 30 Apr 2012 074608
Electron Tomography of Nanostructured Materials Lin et alARTIC
LE
Fig 2 An example of missing wedge artifacts in electron tomographicreconstruction is demonstrated by SiO2 hollow spheres The original tiltseries was from 70 to minus70 (a) BF TEM image of SiO2 hollow spheres(b) elongation observed along the incident beam direction due to missingwedge effects (c) volume artifacts indicated by the arrows (d) a 3Dtomogram showing nearly perfect SiO2 spheres
in Figure 2(b) It is interesting to note that the elongationonly occurs in the missing wedge area (indicated by twolines within 2times 90minus angle area) and the other partsare still present as a perfectly spherical shape The miss-ing frequencies from those angles lead to the distortion inthose directions The elongation factor () depends on themaximum tilt angle 18
=radic
+SintimesCosminusSintimesCos
Table I lists the elongation factors for commonly used tiltranges Considering that the typical tilt range of the sam-ple in TEM is from 70 to minus70 the elongation factoris 13 for the part of the SiO2 sphere along the z direc-tion On the other hand the missing wedge effect can giverise to some volume artifacts because the missing informa-tion at the high tilt angles makes part of the reconstructedobject to be missing For example the lack of projectionsfrom high angle ranges leads to an invisible part alongthe z direction as indicated by arrows in Figure 2(c) Thelarger the missing wedge the more severe these artifactsThe distortion (elongation or missing part) caused by
missing wedge artifacts indicates that we need to bevery cautious when taking analysis in the z-directionof the 3D volume For better visual presentation wecan hide the missing wedge artifacts by viewing theobject close to the incident beam direction as shown inFigure 2(d) which illustrates some nearly perfect recon-structed spheres Currently some advanced reconstruction
Table I Elongation factor for different maximum tilt angles
Tilt angle () Elongation factor
plusmn90 100plusmn85 106plusmn80 113plusmn75 121plusmn70 131plusmn65 142plusmn60 155plusmn55 171plusmn50 189plusmn45 212plusmn40 241plusmn35 277
software also can compensate and reduce the missingwedge artifacts dramatically3032
32 Study of Supported PtSnSBA-15 CatalystUsing BF-TEM Tomography
Supported PtSn catalysts are widely used in dehydro-genation reactions by industry35 The quality of the cat-alyst is affected by the composition shape size of theactive metallic particles the type of support the interactionbetween the metals and the support as well as the distribu-tion of the metals on the support1435 Mesoporous supportsare more attractive in catalysis research due to its ther-mal stability high surface area and defined pore volumewhich may act as nanoreactors resulting in the formationof catalysts with high selectivity Figures 3(a and b) showtwo TEM images of typical PtSn supported on mesoporousSBA-15 which is used as an efficient catalyst for the dehy-drogenation of paraffin and propane35 Nanosized PtSnparticles and some nanorods are observed in the imagesThe diameter of the PtSn nanorods is around 5 nm andthey are oriented along the pores in agreement with thepore size of the SBA-15 (495 nm)35 This indicates thatrod like particles are oriented inside the pores Howeverfrom the 2D images it is difficult to determine the posi-tions of the small particles and how the mesoporoussupport affects the growth and nucleation of the PtSnnanoparticles especially when the support is not sitting ata major zone axis and the pores are invisible (Fig 3(b))Compared with 2D images more detailed information canbe revealed from the 3D reconstructed tomogram A seriesof 2D BF TEM images was acquired from minus60 to +60
for the samples in Figure 2(b) After alignment the 121recorded images already provide abundant useful informa-tion on the structure of the catalyst Close examinationof individual images from the tilt series reveals that allthe particles are none-spherical in shape but are elongatedwith a length to diameter ratio of 13 to 29A 3D tomogram with a reconstructed volume of
359times149times318 nm is displayed in Figures 3(c to f) fromdifferent viewing angles It is found that all the PtSn par-ticles anchor inside the mesopores rather than on the
260 J Nanoeng Nanomanuf 1 257ndash264 2011
Delivered by Ingenta toKent Ridge Digital Labs
IP 19212213120Mon 30 Apr 2012 074608
Lin et al Electron Tomography of Nanostructured MaterialsARTIC
LE
Fig 3 PtSn particles in mesoporous SBA-15 (a b) BF-TEM images showing PtSn nanoparticles supported on SBA-15 (c) corresponding tomographicreconstruction which shows all the particles anchored inside the mesopores (d e) reconstructed volume viewed at the yndashz and xndashz planes (f) a xndashyslice showing three PtSn particles inside the mesopores and white arrows indicating the presence of defects in the SBA-15
external surface of support Due to the limited tilt anglemissing wedge artifacts can be seen along z directionwhere the outline of the SBA-15 in Figure 3(d) (indi-cated by the arrow) is not as clear as that viewed alongxndashy plane The tips of the PtSn particles in Figure 3(e)also appear sharp due to artifacts However by subtractingthe artifacts the PtSn particles still demonstrate elongatedshapes in good agreement with the observation from thetilt series images It is interesting to note that all the metalparticles in one SBA-15 support are aligned along onedirection indicating that the elongation follows the orien-tation of the poresThe positions of the PtSn particles can be further con-
firmed by slicing information from the 3D volume NormalTEM images are the projection of 3D objects which onlydemonstrate the stacking information throughout the vol-ume Using tomography we can slice the 3D volume intoa series of 2D slabs throughout the tomogram along anydirection18 Since each slice extracts a thin layer of infor-mation from the 3D volume without interference fromother layers the contrast in the reconstructed slice is muchbetter than that in a normal TEM image An xndashy slicewith a thickness of 1 nm along the z direction is shownin Figure 3(f) Two PtSn particles are observed insidethe pores and one particle is anchored close to the poreentrance Some defects existing as nanosized holes are alsoobserved inside the SBA-15 mesoporous structures fromthe slicing image which cannot be revealed from normalTEM imagesThe tomography results clearly show that all the PtSn
metallic particles are dispersed inside the SBA-15 meso-pores with the elongated shape along the pore directionMesoporous structures confine the diameter of the particlesand the length of the metallic particles varies from each
other The morphology determined here may explain thediffusion and nucleation process of the PtSn nanoparticlesThe diffusion and nucleation of active metals on meso-porous supports is quite complex and it is controlled bythe interaction between particles and supports kineticsand confinement of the pores Generally minimizing totalenergy of the supported catalyst particles is the drivingforce to reach an equivalent configuration with a particularmorphology and crystal form for the metal particles Metalparticles are found to prefer nucleating at the kinks stepsor the concave areas such as cup or saddle like regionson the surface support materials16 The high temperatureannealing process used to make the catalyst will gener-ate global diffusion and nucleation of PtSn on the supportin regions with high surface curvature The nucleation ofmetals inside pores is a more sable configuration than onthe external surfaces as internal concave pores possess thehighest surface curvature of mesoporous structures Thisagrees well with the observations of TEM tomographywhich indicates the preferred locations of PtSn inside ofthe pores
33 Study of Clay-Epoxy Nanocomposites byHAADF-STEM Tomography
Epoxy nanocomposites with exfoliated clay layers showproperty enhancement in terms of modulus strength andtoughness36ndash39 Many reports have attempted to explain thefracture behavior of such materials Two proposed typicalfracture mechanisms for clay-polymer nanocomposites aremicrocracks generated at the clay-polymer interface anddebonding of the clay layers37 Since the size of the claynanofillers dispersed in epoxy can be a few nanometersthick and a few microns long electron tomography is a
J Nanoeng Nanomanuf 1 257ndash264 2011 261
Delivered by Ingenta toKent Ridge Digital Labs
IP 19212213120Mon 30 Apr 2012 074608
Electron Tomography of Nanostructured Materials Lin et alARTIC
LEuseful technique to study the internal structures of clay-epoxy nanocomposites With electron tomography a 3Dstructure can be generated with nanometer scale resolu-tion and thicker specimens can also be examined afterreconstruction as superimposed slicesstructures that canbe resolved from the reconstructed 3D structureAs discussed in Section 32 BF-TEM images have been
successfully applied to reconstruct amorphous materialsor nanocrystals smaller than 10 nm with weak diffractioncontrast They are not suitable for the reconstruction ofhighly crystalline materials due to the presence of strongdiffraction contrast at the zone axes1718 The diffractioncontrast together with other non-projection phase contrastin BF images will complicate tomographic reconstructionand lead to a distortion in the shape of the reconstructedstructure26 HAADF-STEM images are formed by collect-ing high-angle (gt50 mrad) scattered electrons4041 Theintensity of the images is approximately proportional to thesquare of the atomic number (Z) and varies linearly withthe sample thickness (for relatively small sample thick-nesses) All non-projection contrast can be minimized inthe images Thus HAADF STEM imaging is applicablefor electron tomography of both amorphous and crystallinematerialsBF-TEM and HAADF-STEM images of the clay filled
epoxy nanocomposite are depicted in Figures 4(andashd)HAADF-STEM images show sharper clay edges than thatin BF images It is noteworthy that the non-projectioninduced contrast shown in BF TEM images such as Fres-nel fringes seen at the edge of the particles and the arti-facts due to defocus and varying specimen height arenot observed in the STEM images Moreover due tothe counts of HAADF-STEM images being approximatelyproportional to the square of the atomic number theydemonstrate higher contrast between the epoxy matrix andthe clay layers which contain Si with higher atomic num-ber than carbon Since the quality of the tomographicreconstruction is determined by the quality of the orig-inal tilt images the higher contrast and sharper STEMimages give rise to better and more interpretable tomo-graphic reconstruction results as shown in Figures 4(eand f) In comparison to the HAADF-STEM reconstructedobject the clay layers are less clear in the polymer matrixin the BF TEM tomogram and some blurry shadows arepresent close to the clay layers which originate from thenon-projection contrast in the 2D images The resolutionof the HAADF-STEM images is similar to that of theBF-TEM images but HAADF-STEM tomography pro-vides higher sensitivity to samples with large differencesin atomic numbersBesides sharper images HAADF-STEM also reduces
beam damage to polymer samples17ndash19 Damage of thenanomaterials by the electron beam is one of the majorconcerns during image acquisition The full acquisitiontime for BF-TEM tomography is around 30 min to 1 h
Fig 4 A comparison between BF-TEM and HAADF-STEM imagesand their corresponding tomographic reconstructions (a c e) BF-TEMimages and corresponding tomographic reconstruction and (b d f)HAADF-STEM images and corresponding tomographic reconstruction ofclay-epoxy nanocomposite material
which is shorter than the 2 h to 4 h for HAADF-STEMtomography However polymers (also including SiO2
spheres) are found to be more susceptible to damage by thecontinuous electron beam illumination in BF-TEM imag-ing mode than that under the intermittent scanning beamseven though the unit area intensity of the scanned probe isstronger than the parallel beam in TEM Based on the con-cerns discussed above HAADF-STEM tomography wasselected for the tomographic reconstruction of the polymermaterials in this paperA typical HAADF-STEM image of the clay-epoxy
nanocomposite is shown in Figure 5(a) The clay is exfoli-ated uniformly into layers of approximately 1ndash2 m longand a few tens of nanometers thick which are dispersedrandomly in an epoxy matrix The clay-epoxy matrix isthinned to sections a few hundred nanometers thick bythe diamond cutter of the microtome The diamond cutterscratches the surface of the clay-epoxy sections and thuscauses the straight lines seen in the image Since the stressconcentration point is located at the clay-epoxy interfaceclay layers tend to split to form voids when the strain isreleased during the sample preparation processThe randomly distributed clay layers in polymer matrix
produce various 2D projections The sharp lines markedby number 1 in Figure 5(a) with the highest contrast arethe projection of the silica layers lying parallel to the
262 J Nanoeng Nanomanuf 1 257ndash264 2011
Delivered by Ingenta toKent Ridge Digital Labs
IP 19212213120Mon 30 Apr 2012 074608
Lin et al Electron Tomography of Nanostructured MaterialsARTIC
LE
Fig 5 (a) HAADF-STEM image of clay-epoxy nanocomposite arrowsindicate the presence of clay layers in different orientations (b) corre-sponding 3D reconstruction of the nanocomposite with dimensions of6978times7560times447 nm
viewing direction or the incident electron beam Silica lay-ers oriented perpendicular to the incident electron beamexhibit the lowest contrast due to a planar morphologyof clay layers in the epoxy matrix which are marked byarrows number 3 The others marked by arrow number 2are tilted from the beam direction The random orienta-tions of the clay layers in the epoxy complicate the inter-pretation of 2D STEM images and it is difficult to clearlyreveal the interface between the clay and the epoxy as wellas the real orientation and thickness of the silica layersElectron tomography allows us to reveal the whole struc-ture unambiguously The corresponding voxel rendering ofthe reconstructed 3D volume is displayed in Figure 5(b)with the reconstructed volume at 6978times 7560times 447 nmIt is noteworthy that the clay layers lying perpendicular tothe viewing angle in the 2D image can be visualized as a
Fig 6 (a) A HAADF-STEM image of the clay-epoxy nanocomposite (b) corresponding 3D reconstructed volume (cndashe) three slices in the xndashyplane from the reconstructed volume show a split extending from clayndashclay to clay-epoxy and to epoxyndashepoxy Three slices are taken from differentlevels located at the 12th (942 nm from the top surface) 27th (212 nm from the top surface) and 43rd slices (3376 nm from the top surface)
thin slab at certain tilt angles in the reconstructed volumeas indicated by the arrow in Figure 5(b)The reconstructed 3D structure can also show the loca-
tion of voids and the nature of delamination of the claylayers36 Clay layers in the polymer matrix are better visu-alized by a series of images sliced perpendicular to theviewing angle Figure 6 shows three xndashy slices at differentlevels in the reconstruction with a thickness of 785 nmfor each slice The red arrows indicate three regions wherea split changes from inside the clay layers to the clay-epoxy interface at different thickness Clay has a layeredand planar structure with strong covalent bonds in layersand weak forces between layers Without treatment withthe coupling agent the clay layers cannot be fully exfo-liated and the dispersed layers can have thickness of upto tens of layers When the polymer matrix is cut into400 nm thin slabs micro-deformation occurs at the area ofclay layers due to stress release of the epoxy around theclay region From the 3D reconstructed images and slicesindicated in Figure 6 the micro cracks could have initi-ated inside the thick clay layers due to its weak interlayerbonding Since the thickness of the clay is not uniformthe crack will propagate to the clay-epoxy interface andextend into the polymer matrix3D electron tomographic reconstruction has proven
itself to be an important technique as it is the onlytechnique that can reveal the delamination of clayndashclayclay-epoxy matrix and polymer-polymer matrix at differ-ent positions of a single particle The analysis of micro-deformation can also be used to explain the macro-scale
J Nanoeng Nanomanuf 1 257ndash264 2011 263
Delivered by Ingenta toKent Ridge Digital Labs
IP 19212213120Mon 30 Apr 2012 074608
Electron Tomography of Nanostructured Materials Lin et alARTIC
LEcracking mechanism when an external force is appliedSince the clay layers act as stress concentrators and crackinitiators we propose that thinner and more uniform claylayers such as silane treated clay particles will help toimprove the mechanical properties of this clay polymermatrix37
4 CONCLUSION
Unlike 2D TEM images electron tomography is apowerful technique for obtaining 3D information fromnanostructured materials and devices in all directionsMore detailed information such as the location and dis-tribution of the particles in the support the shape of thenanocrystals the interaction of filler and matrix etc canbe revealed by a 3D reconstructed volume even beingaccompanied by missing wedge artifacts Using electrontomography we have explained the growth and nucleationof the metallic particles in mesoporous SBA-15 and theexfoliation of clay in epoxy matrix The insightful analysisfrom 3D reconstruction is significantly meaningful for themeasurement of their corresponding chemical and physicalproperties and the establishment of their structure-propertyrelations
Acknowledgments This work is supported by IMREcore funding The authors would like to thank Dr LiuYe from IMRE (Singapore) for providing the hollow SiO2
samples and Professor Fan Yining from Nanjing Univer-sity (China) for providing the ptSnSBA-15 catalyst
References and Notes
1 Z L Wang J Phys Chem B 104 1153 (2000)2 Z L Wang Adv Mater 15 1497 (2003)3 D Williams and C B Carter Transmission Electron Microscopy
Plenum Press New York (1996)4 J Frank Electron Tomography Three-Dimensional Imaging with
the Transmission Electron Microscope Plenum Press New York(1992)
5 D J De Rosier and A Klug Nature 217 130 (1968)6 W Hoppe R Langer G Knesch and C Poppe Naturwis-
senschaften 55 333 (1968)7 R G Hart Science 159 1464 (1968)8 A J Koster U Ziese A J Verkleij A H Janssen and K P de
Jong J Phys Chem B 104 9368 (2000)9 P A Midgley M Weyland J M Thomas and B F G Johnson
Chem Commun 10 907 (2001)10 M Weyland and P A Midgley Microsc Microanal 9 542 (2003)11 O Kwon and A H Zewail Science 328 1668 (2010)12 A H Zewail Science 328 187 (2010)13 K P de Jong and A J Koster Chem Phys Chem 3 776
(2002)
14 O Ersen J Parmentier L A Solovyov M Drillon C Pham-HuuJ Werckmann and P Schultz J Am Chem Soc 130 16800 (2008)
15 A H Janssen C M Yang Y Wang F Schuth A J Koster andK P de Jong J Phys Chem B 107 10552 (2003)
16 E P W Ward T J V Yates J Fernandez D E W Vaughan andP A Midgley J Phys Chem C 111 11501 (2007)
17 M Weyland and P A Midgley Mater Today 7 32 (2004)18 C Kubel A Voigt R Schoenmakers M Otten D Su T C Lee
A Calsson and J Bradley Microsc Microanal 11 378 (2005)19 P A Midgley and R E Dunin-Borkowski Nature Mater 8 271
(2009)20 H Wei Z Wang J Zhang S House Y Gao L Yang H Robinson
L H Tan H Xing C Hou I M Robertson J Zuo and Y LuNature Nanotechnol 6 93 (2011)
21 H Jinnai R J Spontak and T Nishi Macromolecules 43 1675(2010)
22 V Andersson A Herland S Masich and O Inganas Nano Lett9 853 (2009)
23 S S van Bavel E Sourty G de With and J Loos Nano Lett9 507 (2009)
24 K Kaneko K Inoke B Freitag A B Hungria P A MidgleyT W Hansen J Zhang S Ohara and T Adschiri Nano Lett 7 421(2007)
25 M A Verheijen R E Algra M T Borgstroumlm G ImminkE Sourty W J P van Enckevort E Vlieg and E P A M BakkersNano Lett 7 351 (2007)
26 X J Xu Z Saghi R Gay and G Mobus Nanotechnol 18 225501(2007)
27 O Ersen S Beacutegin M Houlleacute J Amadou I Janowska J GrenegravecheC Crucifix and C Pham-Huu Nano Lett 8 1033 (2008)
28 H Katz-Boon C J Rossouw M Weyland A M FunstonP Mulvaney and J Etheridge Nano Lett 11 273 (2011)
29 J P Y Tan H R Tan C Boothroyd Y L Foo C B He andM Lin J Phys Chem C 115 3544 (2011)
30 E Biermans L Molina K J Batenburg S Bals and G VTenderloo Nano Lett 10 5014 (2010)
31 I Arslan J R Tong and P A Midgley Ultramicroscopy 106 994(2006)
32 S Bals K J Batenburg J Verbeeck J Sijbers and G V TendelooNano Lett 7 3669 (2007)
33 H Y Li H L Xin D A Muller and L A Estroff Science326 1244 (2009)
34 J Loos E Sourty K Lu B Freitag D Tang and D Wall NanoLett 9 1904 (2009)
35 L Huang B Xu L Yang and Y Fan Catal Commun 9 2593(2008)
36 K Wang L Chen J Wu M L Toh C B He and A F YeeMacromolecules 38 788 (2005)
37 K Wang L Wang J Wu L Chen and C B He Langmuir 21 3613(2005)
38 F Drummy Y C Wang R Schoenmakers K May M JacksonH Koerner B L Farmer B Mauryama and R A Vaia Macro-molecules 41 2135 (2008)
39 L Chen S C Wong and S Pisharash J Appl Polym Sci 88 3298(2003)
40 J Loos E Sourty K Lu G de With and S V Bavel Macro-molecules 42 2581 (2009)
41 F Krumeich E Muller R A Wepf and R Nesper J Phys Chem C115 1080 (2011)
264 J Nanoeng Nanomanuf 1 257ndash264 2011

Delivered by Ingenta toKent Ridge Digital Labs
IP 19212213120Mon 30 Apr 2012 074608
Lin et al Electron Tomography of Nanostructured MaterialsARTIC
LE
Fig 3 PtSn particles in mesoporous SBA-15 (a b) BF-TEM images showing PtSn nanoparticles supported on SBA-15 (c) corresponding tomographicreconstruction which shows all the particles anchored inside the mesopores (d e) reconstructed volume viewed at the yndashz and xndashz planes (f) a xndashyslice showing three PtSn particles inside the mesopores and white arrows indicating the presence of defects in the SBA-15
external surface of support Due to the limited tilt anglemissing wedge artifacts can be seen along z directionwhere the outline of the SBA-15 in Figure 3(d) (indi-cated by the arrow) is not as clear as that viewed alongxndashy plane The tips of the PtSn particles in Figure 3(e)also appear sharp due to artifacts However by subtractingthe artifacts the PtSn particles still demonstrate elongatedshapes in good agreement with the observation from thetilt series images It is interesting to note that all the metalparticles in one SBA-15 support are aligned along onedirection indicating that the elongation follows the orien-tation of the poresThe positions of the PtSn particles can be further con-
firmed by slicing information from the 3D volume NormalTEM images are the projection of 3D objects which onlydemonstrate the stacking information throughout the vol-ume Using tomography we can slice the 3D volume intoa series of 2D slabs throughout the tomogram along anydirection18 Since each slice extracts a thin layer of infor-mation from the 3D volume without interference fromother layers the contrast in the reconstructed slice is muchbetter than that in a normal TEM image An xndashy slicewith a thickness of 1 nm along the z direction is shownin Figure 3(f) Two PtSn particles are observed insidethe pores and one particle is anchored close to the poreentrance Some defects existing as nanosized holes are alsoobserved inside the SBA-15 mesoporous structures fromthe slicing image which cannot be revealed from normalTEM imagesThe tomography results clearly show that all the PtSn
metallic particles are dispersed inside the SBA-15 meso-pores with the elongated shape along the pore directionMesoporous structures confine the diameter of the particlesand the length of the metallic particles varies from each
other The morphology determined here may explain thediffusion and nucleation process of the PtSn nanoparticlesThe diffusion and nucleation of active metals on meso-porous supports is quite complex and it is controlled bythe interaction between particles and supports kineticsand confinement of the pores Generally minimizing totalenergy of the supported catalyst particles is the drivingforce to reach an equivalent configuration with a particularmorphology and crystal form for the metal particles Metalparticles are found to prefer nucleating at the kinks stepsor the concave areas such as cup or saddle like regionson the surface support materials16 The high temperatureannealing process used to make the catalyst will gener-ate global diffusion and nucleation of PtSn on the supportin regions with high surface curvature The nucleation ofmetals inside pores is a more sable configuration than onthe external surfaces as internal concave pores possess thehighest surface curvature of mesoporous structures Thisagrees well with the observations of TEM tomographywhich indicates the preferred locations of PtSn inside ofthe pores
33 Study of Clay-Epoxy Nanocomposites byHAADF-STEM Tomography
Epoxy nanocomposites with exfoliated clay layers showproperty enhancement in terms of modulus strength andtoughness36ndash39 Many reports have attempted to explain thefracture behavior of such materials Two proposed typicalfracture mechanisms for clay-polymer nanocomposites aremicrocracks generated at the clay-polymer interface anddebonding of the clay layers37 Since the size of the claynanofillers dispersed in epoxy can be a few nanometersthick and a few microns long electron tomography is a
J Nanoeng Nanomanuf 1 257ndash264 2011 261
Delivered by Ingenta toKent Ridge Digital Labs
IP 19212213120Mon 30 Apr 2012 074608
Electron Tomography of Nanostructured Materials Lin et alARTIC
LEuseful technique to study the internal structures of clay-epoxy nanocomposites With electron tomography a 3Dstructure can be generated with nanometer scale resolu-tion and thicker specimens can also be examined afterreconstruction as superimposed slicesstructures that canbe resolved from the reconstructed 3D structureAs discussed in Section 32 BF-TEM images have been
successfully applied to reconstruct amorphous materialsor nanocrystals smaller than 10 nm with weak diffractioncontrast They are not suitable for the reconstruction ofhighly crystalline materials due to the presence of strongdiffraction contrast at the zone axes1718 The diffractioncontrast together with other non-projection phase contrastin BF images will complicate tomographic reconstructionand lead to a distortion in the shape of the reconstructedstructure26 HAADF-STEM images are formed by collect-ing high-angle (gt50 mrad) scattered electrons4041 Theintensity of the images is approximately proportional to thesquare of the atomic number (Z) and varies linearly withthe sample thickness (for relatively small sample thick-nesses) All non-projection contrast can be minimized inthe images Thus HAADF STEM imaging is applicablefor electron tomography of both amorphous and crystallinematerialsBF-TEM and HAADF-STEM images of the clay filled
epoxy nanocomposite are depicted in Figures 4(andashd)HAADF-STEM images show sharper clay edges than thatin BF images It is noteworthy that the non-projectioninduced contrast shown in BF TEM images such as Fres-nel fringes seen at the edge of the particles and the arti-facts due to defocus and varying specimen height arenot observed in the STEM images Moreover due tothe counts of HAADF-STEM images being approximatelyproportional to the square of the atomic number theydemonstrate higher contrast between the epoxy matrix andthe clay layers which contain Si with higher atomic num-ber than carbon Since the quality of the tomographicreconstruction is determined by the quality of the orig-inal tilt images the higher contrast and sharper STEMimages give rise to better and more interpretable tomo-graphic reconstruction results as shown in Figures 4(eand f) In comparison to the HAADF-STEM reconstructedobject the clay layers are less clear in the polymer matrixin the BF TEM tomogram and some blurry shadows arepresent close to the clay layers which originate from thenon-projection contrast in the 2D images The resolutionof the HAADF-STEM images is similar to that of theBF-TEM images but HAADF-STEM tomography pro-vides higher sensitivity to samples with large differencesin atomic numbersBesides sharper images HAADF-STEM also reduces
beam damage to polymer samples17ndash19 Damage of thenanomaterials by the electron beam is one of the majorconcerns during image acquisition The full acquisitiontime for BF-TEM tomography is around 30 min to 1 h
Fig 4 A comparison between BF-TEM and HAADF-STEM imagesand their corresponding tomographic reconstructions (a c e) BF-TEMimages and corresponding tomographic reconstruction and (b d f)HAADF-STEM images and corresponding tomographic reconstruction ofclay-epoxy nanocomposite material
which is shorter than the 2 h to 4 h for HAADF-STEMtomography However polymers (also including SiO2
spheres) are found to be more susceptible to damage by thecontinuous electron beam illumination in BF-TEM imag-ing mode than that under the intermittent scanning beamseven though the unit area intensity of the scanned probe isstronger than the parallel beam in TEM Based on the con-cerns discussed above HAADF-STEM tomography wasselected for the tomographic reconstruction of the polymermaterials in this paperA typical HAADF-STEM image of the clay-epoxy
nanocomposite is shown in Figure 5(a) The clay is exfoli-ated uniformly into layers of approximately 1ndash2 m longand a few tens of nanometers thick which are dispersedrandomly in an epoxy matrix The clay-epoxy matrix isthinned to sections a few hundred nanometers thick bythe diamond cutter of the microtome The diamond cutterscratches the surface of the clay-epoxy sections and thuscauses the straight lines seen in the image Since the stressconcentration point is located at the clay-epoxy interfaceclay layers tend to split to form voids when the strain isreleased during the sample preparation processThe randomly distributed clay layers in polymer matrix
produce various 2D projections The sharp lines markedby number 1 in Figure 5(a) with the highest contrast arethe projection of the silica layers lying parallel to the
262 J Nanoeng Nanomanuf 1 257ndash264 2011
Delivered by Ingenta toKent Ridge Digital Labs
IP 19212213120Mon 30 Apr 2012 074608
Lin et al Electron Tomography of Nanostructured MaterialsARTIC
LE
Fig 5 (a) HAADF-STEM image of clay-epoxy nanocomposite arrowsindicate the presence of clay layers in different orientations (b) corre-sponding 3D reconstruction of the nanocomposite with dimensions of6978times7560times447 nm
viewing direction or the incident electron beam Silica lay-ers oriented perpendicular to the incident electron beamexhibit the lowest contrast due to a planar morphologyof clay layers in the epoxy matrix which are marked byarrows number 3 The others marked by arrow number 2are tilted from the beam direction The random orienta-tions of the clay layers in the epoxy complicate the inter-pretation of 2D STEM images and it is difficult to clearlyreveal the interface between the clay and the epoxy as wellas the real orientation and thickness of the silica layersElectron tomography allows us to reveal the whole struc-ture unambiguously The corresponding voxel rendering ofthe reconstructed 3D volume is displayed in Figure 5(b)with the reconstructed volume at 6978times 7560times 447 nmIt is noteworthy that the clay layers lying perpendicular tothe viewing angle in the 2D image can be visualized as a
Fig 6 (a) A HAADF-STEM image of the clay-epoxy nanocomposite (b) corresponding 3D reconstructed volume (cndashe) three slices in the xndashyplane from the reconstructed volume show a split extending from clayndashclay to clay-epoxy and to epoxyndashepoxy Three slices are taken from differentlevels located at the 12th (942 nm from the top surface) 27th (212 nm from the top surface) and 43rd slices (3376 nm from the top surface)
thin slab at certain tilt angles in the reconstructed volumeas indicated by the arrow in Figure 5(b)The reconstructed 3D structure can also show the loca-
tion of voids and the nature of delamination of the claylayers36 Clay layers in the polymer matrix are better visu-alized by a series of images sliced perpendicular to theviewing angle Figure 6 shows three xndashy slices at differentlevels in the reconstruction with a thickness of 785 nmfor each slice The red arrows indicate three regions wherea split changes from inside the clay layers to the clay-epoxy interface at different thickness Clay has a layeredand planar structure with strong covalent bonds in layersand weak forces between layers Without treatment withthe coupling agent the clay layers cannot be fully exfo-liated and the dispersed layers can have thickness of upto tens of layers When the polymer matrix is cut into400 nm thin slabs micro-deformation occurs at the area ofclay layers due to stress release of the epoxy around theclay region From the 3D reconstructed images and slicesindicated in Figure 6 the micro cracks could have initi-ated inside the thick clay layers due to its weak interlayerbonding Since the thickness of the clay is not uniformthe crack will propagate to the clay-epoxy interface andextend into the polymer matrix3D electron tomographic reconstruction has proven
itself to be an important technique as it is the onlytechnique that can reveal the delamination of clayndashclayclay-epoxy matrix and polymer-polymer matrix at differ-ent positions of a single particle The analysis of micro-deformation can also be used to explain the macro-scale
J Nanoeng Nanomanuf 1 257ndash264 2011 263
Delivered by Ingenta toKent Ridge Digital Labs
IP 19212213120Mon 30 Apr 2012 074608
Electron Tomography of Nanostructured Materials Lin et alARTIC
LEcracking mechanism when an external force is appliedSince the clay layers act as stress concentrators and crackinitiators we propose that thinner and more uniform claylayers such as silane treated clay particles will help toimprove the mechanical properties of this clay polymermatrix37
4 CONCLUSION
Unlike 2D TEM images electron tomography is apowerful technique for obtaining 3D information fromnanostructured materials and devices in all directionsMore detailed information such as the location and dis-tribution of the particles in the support the shape of thenanocrystals the interaction of filler and matrix etc canbe revealed by a 3D reconstructed volume even beingaccompanied by missing wedge artifacts Using electrontomography we have explained the growth and nucleationof the metallic particles in mesoporous SBA-15 and theexfoliation of clay in epoxy matrix The insightful analysisfrom 3D reconstruction is significantly meaningful for themeasurement of their corresponding chemical and physicalproperties and the establishment of their structure-propertyrelations
Acknowledgments This work is supported by IMREcore funding The authors would like to thank Dr LiuYe from IMRE (Singapore) for providing the hollow SiO2
samples and Professor Fan Yining from Nanjing Univer-sity (China) for providing the ptSnSBA-15 catalyst
References and Notes
1 Z L Wang J Phys Chem B 104 1153 (2000)2 Z L Wang Adv Mater 15 1497 (2003)3 D Williams and C B Carter Transmission Electron Microscopy
Plenum Press New York (1996)4 J Frank Electron Tomography Three-Dimensional Imaging with
the Transmission Electron Microscope Plenum Press New York(1992)
5 D J De Rosier and A Klug Nature 217 130 (1968)6 W Hoppe R Langer G Knesch and C Poppe Naturwis-
senschaften 55 333 (1968)7 R G Hart Science 159 1464 (1968)8 A J Koster U Ziese A J Verkleij A H Janssen and K P de
Jong J Phys Chem B 104 9368 (2000)9 P A Midgley M Weyland J M Thomas and B F G Johnson
Chem Commun 10 907 (2001)10 M Weyland and P A Midgley Microsc Microanal 9 542 (2003)11 O Kwon and A H Zewail Science 328 1668 (2010)12 A H Zewail Science 328 187 (2010)13 K P de Jong and A J Koster Chem Phys Chem 3 776
(2002)
14 O Ersen J Parmentier L A Solovyov M Drillon C Pham-HuuJ Werckmann and P Schultz J Am Chem Soc 130 16800 (2008)
15 A H Janssen C M Yang Y Wang F Schuth A J Koster andK P de Jong J Phys Chem B 107 10552 (2003)
16 E P W Ward T J V Yates J Fernandez D E W Vaughan andP A Midgley J Phys Chem C 111 11501 (2007)
17 M Weyland and P A Midgley Mater Today 7 32 (2004)18 C Kubel A Voigt R Schoenmakers M Otten D Su T C Lee
A Calsson and J Bradley Microsc Microanal 11 378 (2005)19 P A Midgley and R E Dunin-Borkowski Nature Mater 8 271
(2009)20 H Wei Z Wang J Zhang S House Y Gao L Yang H Robinson
L H Tan H Xing C Hou I M Robertson J Zuo and Y LuNature Nanotechnol 6 93 (2011)
21 H Jinnai R J Spontak and T Nishi Macromolecules 43 1675(2010)
22 V Andersson A Herland S Masich and O Inganas Nano Lett9 853 (2009)
23 S S van Bavel E Sourty G de With and J Loos Nano Lett9 507 (2009)
24 K Kaneko K Inoke B Freitag A B Hungria P A MidgleyT W Hansen J Zhang S Ohara and T Adschiri Nano Lett 7 421(2007)
25 M A Verheijen R E Algra M T Borgstroumlm G ImminkE Sourty W J P van Enckevort E Vlieg and E P A M BakkersNano Lett 7 351 (2007)
26 X J Xu Z Saghi R Gay and G Mobus Nanotechnol 18 225501(2007)
27 O Ersen S Beacutegin M Houlleacute J Amadou I Janowska J GrenegravecheC Crucifix and C Pham-Huu Nano Lett 8 1033 (2008)
28 H Katz-Boon C J Rossouw M Weyland A M FunstonP Mulvaney and J Etheridge Nano Lett 11 273 (2011)
29 J P Y Tan H R Tan C Boothroyd Y L Foo C B He andM Lin J Phys Chem C 115 3544 (2011)
30 E Biermans L Molina K J Batenburg S Bals and G VTenderloo Nano Lett 10 5014 (2010)
31 I Arslan J R Tong and P A Midgley Ultramicroscopy 106 994(2006)
32 S Bals K J Batenburg J Verbeeck J Sijbers and G V TendelooNano Lett 7 3669 (2007)
33 H Y Li H L Xin D A Muller and L A Estroff Science326 1244 (2009)
34 J Loos E Sourty K Lu B Freitag D Tang and D Wall NanoLett 9 1904 (2009)
35 L Huang B Xu L Yang and Y Fan Catal Commun 9 2593(2008)
36 K Wang L Chen J Wu M L Toh C B He and A F YeeMacromolecules 38 788 (2005)
37 K Wang L Wang J Wu L Chen and C B He Langmuir 21 3613(2005)
38 F Drummy Y C Wang R Schoenmakers K May M JacksonH Koerner B L Farmer B Mauryama and R A Vaia Macro-molecules 41 2135 (2008)
39 L Chen S C Wong and S Pisharash J Appl Polym Sci 88 3298(2003)
40 J Loos E Sourty K Lu G de With and S V Bavel Macro-molecules 42 2581 (2009)
41 F Krumeich E Muller R A Wepf and R Nesper J Phys Chem C115 1080 (2011)
264 J Nanoeng Nanomanuf 1 257ndash264 2011
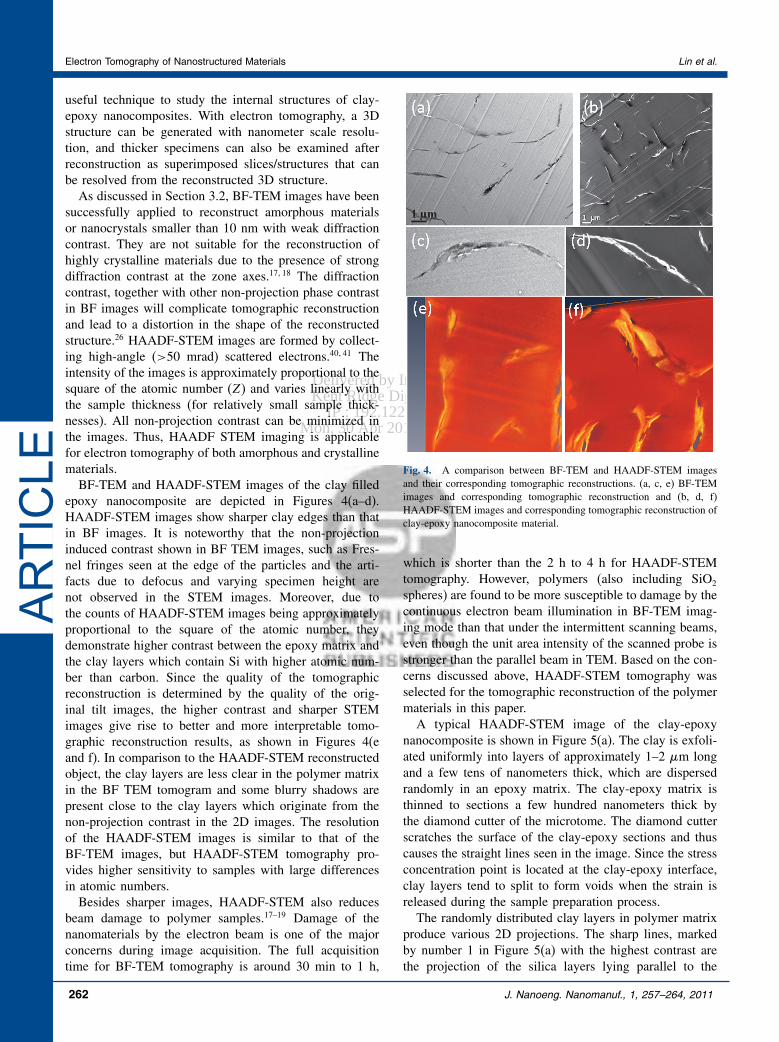
Delivered by Ingenta toKent Ridge Digital Labs
IP 19212213120Mon 30 Apr 2012 074608
Electron Tomography of Nanostructured Materials Lin et alARTIC
LEuseful technique to study the internal structures of clay-epoxy nanocomposites With electron tomography a 3Dstructure can be generated with nanometer scale resolu-tion and thicker specimens can also be examined afterreconstruction as superimposed slicesstructures that canbe resolved from the reconstructed 3D structureAs discussed in Section 32 BF-TEM images have been
successfully applied to reconstruct amorphous materialsor nanocrystals smaller than 10 nm with weak diffractioncontrast They are not suitable for the reconstruction ofhighly crystalline materials due to the presence of strongdiffraction contrast at the zone axes1718 The diffractioncontrast together with other non-projection phase contrastin BF images will complicate tomographic reconstructionand lead to a distortion in the shape of the reconstructedstructure26 HAADF-STEM images are formed by collect-ing high-angle (gt50 mrad) scattered electrons4041 Theintensity of the images is approximately proportional to thesquare of the atomic number (Z) and varies linearly withthe sample thickness (for relatively small sample thick-nesses) All non-projection contrast can be minimized inthe images Thus HAADF STEM imaging is applicablefor electron tomography of both amorphous and crystallinematerialsBF-TEM and HAADF-STEM images of the clay filled
epoxy nanocomposite are depicted in Figures 4(andashd)HAADF-STEM images show sharper clay edges than thatin BF images It is noteworthy that the non-projectioninduced contrast shown in BF TEM images such as Fres-nel fringes seen at the edge of the particles and the arti-facts due to defocus and varying specimen height arenot observed in the STEM images Moreover due tothe counts of HAADF-STEM images being approximatelyproportional to the square of the atomic number theydemonstrate higher contrast between the epoxy matrix andthe clay layers which contain Si with higher atomic num-ber than carbon Since the quality of the tomographicreconstruction is determined by the quality of the orig-inal tilt images the higher contrast and sharper STEMimages give rise to better and more interpretable tomo-graphic reconstruction results as shown in Figures 4(eand f) In comparison to the HAADF-STEM reconstructedobject the clay layers are less clear in the polymer matrixin the BF TEM tomogram and some blurry shadows arepresent close to the clay layers which originate from thenon-projection contrast in the 2D images The resolutionof the HAADF-STEM images is similar to that of theBF-TEM images but HAADF-STEM tomography pro-vides higher sensitivity to samples with large differencesin atomic numbersBesides sharper images HAADF-STEM also reduces
beam damage to polymer samples17ndash19 Damage of thenanomaterials by the electron beam is one of the majorconcerns during image acquisition The full acquisitiontime for BF-TEM tomography is around 30 min to 1 h
Fig 4 A comparison between BF-TEM and HAADF-STEM imagesand their corresponding tomographic reconstructions (a c e) BF-TEMimages and corresponding tomographic reconstruction and (b d f)HAADF-STEM images and corresponding tomographic reconstruction ofclay-epoxy nanocomposite material
which is shorter than the 2 h to 4 h for HAADF-STEMtomography However polymers (also including SiO2
spheres) are found to be more susceptible to damage by thecontinuous electron beam illumination in BF-TEM imag-ing mode than that under the intermittent scanning beamseven though the unit area intensity of the scanned probe isstronger than the parallel beam in TEM Based on the con-cerns discussed above HAADF-STEM tomography wasselected for the tomographic reconstruction of the polymermaterials in this paperA typical HAADF-STEM image of the clay-epoxy
nanocomposite is shown in Figure 5(a) The clay is exfoli-ated uniformly into layers of approximately 1ndash2 m longand a few tens of nanometers thick which are dispersedrandomly in an epoxy matrix The clay-epoxy matrix isthinned to sections a few hundred nanometers thick bythe diamond cutter of the microtome The diamond cutterscratches the surface of the clay-epoxy sections and thuscauses the straight lines seen in the image Since the stressconcentration point is located at the clay-epoxy interfaceclay layers tend to split to form voids when the strain isreleased during the sample preparation processThe randomly distributed clay layers in polymer matrix
produce various 2D projections The sharp lines markedby number 1 in Figure 5(a) with the highest contrast arethe projection of the silica layers lying parallel to the
262 J Nanoeng Nanomanuf 1 257ndash264 2011
Delivered by Ingenta toKent Ridge Digital Labs
IP 19212213120Mon 30 Apr 2012 074608
Lin et al Electron Tomography of Nanostructured MaterialsARTIC
LE
Fig 5 (a) HAADF-STEM image of clay-epoxy nanocomposite arrowsindicate the presence of clay layers in different orientations (b) corre-sponding 3D reconstruction of the nanocomposite with dimensions of6978times7560times447 nm
viewing direction or the incident electron beam Silica lay-ers oriented perpendicular to the incident electron beamexhibit the lowest contrast due to a planar morphologyof clay layers in the epoxy matrix which are marked byarrows number 3 The others marked by arrow number 2are tilted from the beam direction The random orienta-tions of the clay layers in the epoxy complicate the inter-pretation of 2D STEM images and it is difficult to clearlyreveal the interface between the clay and the epoxy as wellas the real orientation and thickness of the silica layersElectron tomography allows us to reveal the whole struc-ture unambiguously The corresponding voxel rendering ofthe reconstructed 3D volume is displayed in Figure 5(b)with the reconstructed volume at 6978times 7560times 447 nmIt is noteworthy that the clay layers lying perpendicular tothe viewing angle in the 2D image can be visualized as a
Fig 6 (a) A HAADF-STEM image of the clay-epoxy nanocomposite (b) corresponding 3D reconstructed volume (cndashe) three slices in the xndashyplane from the reconstructed volume show a split extending from clayndashclay to clay-epoxy and to epoxyndashepoxy Three slices are taken from differentlevels located at the 12th (942 nm from the top surface) 27th (212 nm from the top surface) and 43rd slices (3376 nm from the top surface)
thin slab at certain tilt angles in the reconstructed volumeas indicated by the arrow in Figure 5(b)The reconstructed 3D structure can also show the loca-
tion of voids and the nature of delamination of the claylayers36 Clay layers in the polymer matrix are better visu-alized by a series of images sliced perpendicular to theviewing angle Figure 6 shows three xndashy slices at differentlevels in the reconstruction with a thickness of 785 nmfor each slice The red arrows indicate three regions wherea split changes from inside the clay layers to the clay-epoxy interface at different thickness Clay has a layeredand planar structure with strong covalent bonds in layersand weak forces between layers Without treatment withthe coupling agent the clay layers cannot be fully exfo-liated and the dispersed layers can have thickness of upto tens of layers When the polymer matrix is cut into400 nm thin slabs micro-deformation occurs at the area ofclay layers due to stress release of the epoxy around theclay region From the 3D reconstructed images and slicesindicated in Figure 6 the micro cracks could have initi-ated inside the thick clay layers due to its weak interlayerbonding Since the thickness of the clay is not uniformthe crack will propagate to the clay-epoxy interface andextend into the polymer matrix3D electron tomographic reconstruction has proven
itself to be an important technique as it is the onlytechnique that can reveal the delamination of clayndashclayclay-epoxy matrix and polymer-polymer matrix at differ-ent positions of a single particle The analysis of micro-deformation can also be used to explain the macro-scale
J Nanoeng Nanomanuf 1 257ndash264 2011 263
Delivered by Ingenta toKent Ridge Digital Labs
IP 19212213120Mon 30 Apr 2012 074608
Electron Tomography of Nanostructured Materials Lin et alARTIC
LEcracking mechanism when an external force is appliedSince the clay layers act as stress concentrators and crackinitiators we propose that thinner and more uniform claylayers such as silane treated clay particles will help toimprove the mechanical properties of this clay polymermatrix37
4 CONCLUSION
Unlike 2D TEM images electron tomography is apowerful technique for obtaining 3D information fromnanostructured materials and devices in all directionsMore detailed information such as the location and dis-tribution of the particles in the support the shape of thenanocrystals the interaction of filler and matrix etc canbe revealed by a 3D reconstructed volume even beingaccompanied by missing wedge artifacts Using electrontomography we have explained the growth and nucleationof the metallic particles in mesoporous SBA-15 and theexfoliation of clay in epoxy matrix The insightful analysisfrom 3D reconstruction is significantly meaningful for themeasurement of their corresponding chemical and physicalproperties and the establishment of their structure-propertyrelations
Acknowledgments This work is supported by IMREcore funding The authors would like to thank Dr LiuYe from IMRE (Singapore) for providing the hollow SiO2
samples and Professor Fan Yining from Nanjing Univer-sity (China) for providing the ptSnSBA-15 catalyst
References and Notes
1 Z L Wang J Phys Chem B 104 1153 (2000)2 Z L Wang Adv Mater 15 1497 (2003)3 D Williams and C B Carter Transmission Electron Microscopy
Plenum Press New York (1996)4 J Frank Electron Tomography Three-Dimensional Imaging with
the Transmission Electron Microscope Plenum Press New York(1992)
5 D J De Rosier and A Klug Nature 217 130 (1968)6 W Hoppe R Langer G Knesch and C Poppe Naturwis-
senschaften 55 333 (1968)7 R G Hart Science 159 1464 (1968)8 A J Koster U Ziese A J Verkleij A H Janssen and K P de
Jong J Phys Chem B 104 9368 (2000)9 P A Midgley M Weyland J M Thomas and B F G Johnson
Chem Commun 10 907 (2001)10 M Weyland and P A Midgley Microsc Microanal 9 542 (2003)11 O Kwon and A H Zewail Science 328 1668 (2010)12 A H Zewail Science 328 187 (2010)13 K P de Jong and A J Koster Chem Phys Chem 3 776
(2002)
14 O Ersen J Parmentier L A Solovyov M Drillon C Pham-HuuJ Werckmann and P Schultz J Am Chem Soc 130 16800 (2008)
15 A H Janssen C M Yang Y Wang F Schuth A J Koster andK P de Jong J Phys Chem B 107 10552 (2003)
16 E P W Ward T J V Yates J Fernandez D E W Vaughan andP A Midgley J Phys Chem C 111 11501 (2007)
17 M Weyland and P A Midgley Mater Today 7 32 (2004)18 C Kubel A Voigt R Schoenmakers M Otten D Su T C Lee
A Calsson and J Bradley Microsc Microanal 11 378 (2005)19 P A Midgley and R E Dunin-Borkowski Nature Mater 8 271
(2009)20 H Wei Z Wang J Zhang S House Y Gao L Yang H Robinson
L H Tan H Xing C Hou I M Robertson J Zuo and Y LuNature Nanotechnol 6 93 (2011)
21 H Jinnai R J Spontak and T Nishi Macromolecules 43 1675(2010)
22 V Andersson A Herland S Masich and O Inganas Nano Lett9 853 (2009)
23 S S van Bavel E Sourty G de With and J Loos Nano Lett9 507 (2009)
24 K Kaneko K Inoke B Freitag A B Hungria P A MidgleyT W Hansen J Zhang S Ohara and T Adschiri Nano Lett 7 421(2007)
25 M A Verheijen R E Algra M T Borgstroumlm G ImminkE Sourty W J P van Enckevort E Vlieg and E P A M BakkersNano Lett 7 351 (2007)
26 X J Xu Z Saghi R Gay and G Mobus Nanotechnol 18 225501(2007)
27 O Ersen S Beacutegin M Houlleacute J Amadou I Janowska J GrenegravecheC Crucifix and C Pham-Huu Nano Lett 8 1033 (2008)
28 H Katz-Boon C J Rossouw M Weyland A M FunstonP Mulvaney and J Etheridge Nano Lett 11 273 (2011)
29 J P Y Tan H R Tan C Boothroyd Y L Foo C B He andM Lin J Phys Chem C 115 3544 (2011)
30 E Biermans L Molina K J Batenburg S Bals and G VTenderloo Nano Lett 10 5014 (2010)
31 I Arslan J R Tong and P A Midgley Ultramicroscopy 106 994(2006)
32 S Bals K J Batenburg J Verbeeck J Sijbers and G V TendelooNano Lett 7 3669 (2007)
33 H Y Li H L Xin D A Muller and L A Estroff Science326 1244 (2009)
34 J Loos E Sourty K Lu B Freitag D Tang and D Wall NanoLett 9 1904 (2009)
35 L Huang B Xu L Yang and Y Fan Catal Commun 9 2593(2008)
36 K Wang L Chen J Wu M L Toh C B He and A F YeeMacromolecules 38 788 (2005)
37 K Wang L Wang J Wu L Chen and C B He Langmuir 21 3613(2005)
38 F Drummy Y C Wang R Schoenmakers K May M JacksonH Koerner B L Farmer B Mauryama and R A Vaia Macro-molecules 41 2135 (2008)
39 L Chen S C Wong and S Pisharash J Appl Polym Sci 88 3298(2003)
40 J Loos E Sourty K Lu G de With and S V Bavel Macro-molecules 42 2581 (2009)
41 F Krumeich E Muller R A Wepf and R Nesper J Phys Chem C115 1080 (2011)
264 J Nanoeng Nanomanuf 1 257ndash264 2011

Delivered by Ingenta toKent Ridge Digital Labs
IP 19212213120Mon 30 Apr 2012 074608
Electron Tomography of Nanostructured Materials Lin et alARTIC
LEcracking mechanism when an external force is appliedSince the clay layers act as stress concentrators and crackinitiators we propose that thinner and more uniform claylayers such as silane treated clay particles will help toimprove the mechanical properties of this clay polymermatrix37
4 CONCLUSION
Unlike 2D TEM images electron tomography is apowerful technique for obtaining 3D information fromnanostructured materials and devices in all directionsMore detailed information such as the location and dis-tribution of the particles in the support the shape of thenanocrystals the interaction of filler and matrix etc canbe revealed by a 3D reconstructed volume even beingaccompanied by missing wedge artifacts Using electrontomography we have explained the growth and nucleationof the metallic particles in mesoporous SBA-15 and theexfoliation of clay in epoxy matrix The insightful analysisfrom 3D reconstruction is significantly meaningful for themeasurement of their corresponding chemical and physicalproperties and the establishment of their structure-propertyrelations
Acknowledgments This work is supported by IMREcore funding The authors would like to thank Dr LiuYe from IMRE (Singapore) for providing the hollow SiO2
samples and Professor Fan Yining from Nanjing Univer-sity (China) for providing the ptSnSBA-15 catalyst
References and Notes
1 Z L Wang J Phys Chem B 104 1153 (2000)2 Z L Wang Adv Mater 15 1497 (2003)3 D Williams and C B Carter Transmission Electron Microscopy
Plenum Press New York (1996)4 J Frank Electron Tomography Three-Dimensional Imaging with
the Transmission Electron Microscope Plenum Press New York(1992)
5 D J De Rosier and A Klug Nature 217 130 (1968)6 W Hoppe R Langer G Knesch and C Poppe Naturwis-
senschaften 55 333 (1968)7 R G Hart Science 159 1464 (1968)8 A J Koster U Ziese A J Verkleij A H Janssen and K P de
Jong J Phys Chem B 104 9368 (2000)9 P A Midgley M Weyland J M Thomas and B F G Johnson
Chem Commun 10 907 (2001)10 M Weyland and P A Midgley Microsc Microanal 9 542 (2003)11 O Kwon and A H Zewail Science 328 1668 (2010)12 A H Zewail Science 328 187 (2010)13 K P de Jong and A J Koster Chem Phys Chem 3 776
(2002)
14 O Ersen J Parmentier L A Solovyov M Drillon C Pham-HuuJ Werckmann and P Schultz J Am Chem Soc 130 16800 (2008)
15 A H Janssen C M Yang Y Wang F Schuth A J Koster andK P de Jong J Phys Chem B 107 10552 (2003)
16 E P W Ward T J V Yates J Fernandez D E W Vaughan andP A Midgley J Phys Chem C 111 11501 (2007)
17 M Weyland and P A Midgley Mater Today 7 32 (2004)18 C Kubel A Voigt R Schoenmakers M Otten D Su T C Lee
A Calsson and J Bradley Microsc Microanal 11 378 (2005)19 P A Midgley and R E Dunin-Borkowski Nature Mater 8 271
(2009)20 H Wei Z Wang J Zhang S House Y Gao L Yang H Robinson
L H Tan H Xing C Hou I M Robertson J Zuo and Y LuNature Nanotechnol 6 93 (2011)
21 H Jinnai R J Spontak and T Nishi Macromolecules 43 1675(2010)
22 V Andersson A Herland S Masich and O Inganas Nano Lett9 853 (2009)
23 S S van Bavel E Sourty G de With and J Loos Nano Lett9 507 (2009)
24 K Kaneko K Inoke B Freitag A B Hungria P A MidgleyT W Hansen J Zhang S Ohara and T Adschiri Nano Lett 7 421(2007)
25 M A Verheijen R E Algra M T Borgstroumlm G ImminkE Sourty W J P van Enckevort E Vlieg and E P A M BakkersNano Lett 7 351 (2007)
26 X J Xu Z Saghi R Gay and G Mobus Nanotechnol 18 225501(2007)
27 O Ersen S Beacutegin M Houlleacute J Amadou I Janowska J GrenegravecheC Crucifix and C Pham-Huu Nano Lett 8 1033 (2008)
28 H Katz-Boon C J Rossouw M Weyland A M FunstonP Mulvaney and J Etheridge Nano Lett 11 273 (2011)
29 J P Y Tan H R Tan C Boothroyd Y L Foo C B He andM Lin J Phys Chem C 115 3544 (2011)
30 E Biermans L Molina K J Batenburg S Bals and G VTenderloo Nano Lett 10 5014 (2010)
31 I Arslan J R Tong and P A Midgley Ultramicroscopy 106 994(2006)
32 S Bals K J Batenburg J Verbeeck J Sijbers and G V TendelooNano Lett 7 3669 (2007)
33 H Y Li H L Xin D A Muller and L A Estroff Science326 1244 (2009)
34 J Loos E Sourty K Lu B Freitag D Tang and D Wall NanoLett 9 1904 (2009)
35 L Huang B Xu L Yang and Y Fan Catal Commun 9 2593(2008)
36 K Wang L Chen J Wu M L Toh C B He and A F YeeMacromolecules 38 788 (2005)
37 K Wang L Wang J Wu L Chen and C B He Langmuir 21 3613(2005)
38 F Drummy Y C Wang R Schoenmakers K May M JacksonH Koerner B L Farmer B Mauryama and R A Vaia Macro-molecules 41 2135 (2008)
39 L Chen S C Wong and S Pisharash J Appl Polym Sci 88 3298(2003)
40 J Loos E Sourty K Lu G de With and S V Bavel Macro-molecules 42 2581 (2009)
41 F Krumeich E Muller R A Wepf and R Nesper J Phys Chem C115 1080 (2011)
264 J Nanoeng Nanomanuf 1 257ndash264 2011